HO 05 18 2015 Top 100 Issue
44
TOP 100 ISSUE MONTCLAIR STATE UNIVERSITY Ranked #2 in New Jersey MAY 18, 2015 www.HispanicOutlook.com VOLUME 25 • NUMBER 15
-
Upload
hispanic-outlook-magazine -
Category
Documents
-
view
215 -
download
2
description
Top 100 Issue 2015 Visit our webpage for daily updates on the Hispanic in Higher Education World and to find jobs in Higher Education. You can also post your own web ad. Our magazine is a top Hispanic information & news source and the sole Hispanic educational magazine for higher education. www.hispanicoutlook.com https://www.facebook.com/hispanicoutlook https://twitter.com/hispanicoutlook https://www.linkedin.com/company/the-hispanic-outlook-in-higher-education-magazine https://www.pinterest.com/hispanicoutlook/
Transcript of HO 05 18 2015 Top 100 Issue

TOP 100 ISSUE
MONTCLAIR
STATE UNIVERSITY Ranked #2 in New Jersey
MAY 18, 2015 www.HispanicOutlook.com VOLUME 25 • NUMBER 15

BECAUSE YOU WANT TO
KNOWSubscribe for FREE to our Digital Magazine!
P h o n e : ( 2 0 1 ) 5 8 7 - 8 8 0 0 w w w . h i s p a n i c o u t l o o k . c o m E m a i l : i n f o @ h i s p a n i c o u t l o o k . c o m
Visit our website, click on the digital magazine to view our current issue, including all archived issues.Download it to your PC, Mac, iPhone, iPad, tablet, smartphone or Android to have Hispanic Outlook how you want it when you want it.

Mangos! Jeb Bush Thinks He’s LatinoBy Carlos D. Conde
So Jeb Bush thinks he’s Latino or wants to be Latino. I suppose there are many people who at times also wish they were Latinos because that’s not a bad
thing to be nowadays, socially and politically. Hispanismo in the U.S. has a much better image
now and is getting better. Many can still remember when Hispanics, and their
culture, were a disparaged, discriminated ethnic group; a U.S. minority seemingly destined to the social and economic backlots.
John Ellis Bush, aka Jeb Bush, finds it amusing that recently a clerk in the Florida election bureau unwit-tingly discovered that in the 2009 voter registration application form he had marked himself as “Hispanic.”
“My mistake! I don’t think I fooled anyone,” Jeb Bush said.
Some people, mostly the non-Bushes, non-Repub-lican crowd tried to cast this as not being particularly funny and socioculturally perplexing —maybe politically driven—while wondering what Jeb was trying to pull off with this gambit.
The Florida Democratic Party said the former gov-ernor may have committed a felony with his imperson-ation.
It’s a bit incredulous that some people would think the “yo-soy-Hispano” by Jeb Bush was an attempt to in-crease his political currency or other motives and won’t accept it as an inadvertent Freudian slip.
I don’t know if there’s a penalty—probably not—for this civil infraction except for the potential of creating some political mischief later on when Jeb Bush takes his politics nationally.
You can’t deny it’s amusing. Still it makes some peo-ple wonder if those sentiments for Latinos make those feelings palatable.
Jeb Bush has never talked about this inexplicable “Latino thing” he has had with his DNA and he never bothered to explore it other than the circumstances that led him to feel the Latino chromosomes whirling in him.
He comes from New England peerage but was born in Midland, Texas, the son of former president, George H.W. Bush, who then was getting richer in the West Tex-as oil business.
Midland, Texas is cowboy, oil roustabouts’ coun-try and the Latinos who live in that part of West Texas would be mostly Mexicans toiling in agricultural work but the environment in those days wasn’t right for Jeb Bush’s Latino thing.
Like most sons of New England peerage and follow-ing his dad’s footsteps, Jeb went away to school at Phil-lips Academy in Andover, Mass.
His Latino epiphany apparently came forth and blos-somed while on a student sabbatical to Mexico. Sitting in a town’s plaza one day, as in the “West Side Story” movie, he saw “the most beautiful girl in the world,” Columba Garnica de Gallo, a local lass, strolling by.
The rest, like they say in the movies and politics, is history. Jeb passionately romanced Columba and married her in 1974 in Austin where young Bush had forsaken the Ivy League school tradition of his family for the University of Texas. The story goes this brought him closer to Columba. Being in Texas away from the WASP community also reinforced his affinity for the Latino cul-ture and its lifestyle.
Looking at it politically and professionally, Jeb Bush seems to have gravitated toward Latinos and the Latino world by choice. His transformation seems genuine and who knows, perhaps preordained.
Many of his political and business associates and so-cial circle in Florida are Latinos, mostly Cubans, Ask him and he’d probably say he has a preference for Mariachi music, enchiladas, and maybe a Cuban mojito.
It’s also telling that his wife is a Mexican who has stuck to her culture, raising the family in the Mexican way and they have three “little brown ones” as Grandad Bush once referred to them.
It also helps that Jeb Bush’s happy marriage experi-ence and his cultural preference was further enhanced living in South Florida’s Latino-dominant environment with a Latino family and friends and serving as governor.
A Northwestern University psychologist, Eli Finkel, citing research on the topic said in a New York Times op-ed piece that cognitively, there may be something about Jeb Bush feeling heart and soul Latino that may be attributable to his happy marriage and relationship with Columba.
In a happy union, one tends to fuse one’s identify to that of the spouse with “we” or “us.”
So if that makes Jeb Bush feel Latino, let him be Latino. •
Carlos D. Conde, award-winning journalist, former Wash-ington and foreign correspondent, was a communications aide in the Nixon White House. Write to him at [email protected]

Contents6
18
22
25
Top 100 Colleges for HispanicsAs Budgets and State Funding Shrink, Tuition Continues to Climbby Mary Ann Cooper
Summer Institute Cultivates Emerging Minority Business Leaders by Michelle Adam
New College Guide Offers Roadmap for First-Generation Students by Frank DiMaria
Community College Initiative Could Have Major Impact on Latinos by Gary M. Stern
4 | MAY 18, 2015
MAY 18, 2015
Cover Image by Montclair State University

Departments2
28
30
31
32
BackCover
Latino Kaleidoscopeby Carlos D. Conde
Targeting Higher EducationUnique College Opportunity for Hispanics by Gustavo A. Mellander
Uncensoredby Peggy Sands Orchowski
Scholars’ Cornerby Marla Andrea Ramírez
Book Review:Immigrants and Boomers: Forging a New Social Contract for the Future of America Reviewed by Mary Ann Cooper
Interesting Readsby Mary Ann Cooper
Priming the PumpWhy Helicopter Parents Should Be Groundedby Miquela Rivera
MAY 18, 2015 | 5
MAY 18, 2015
Published by “The Hispanic Outlook in HigherEducation Publishing Company, Inc.”
Article ContributorsFrank DiMaria, Marla Andrea Ramírez, Miquela
Rivera, Gary M. Stern
Advertising SalesTEL (201) 587-8800FAX (201) 587-9105
email: [email protected]
Letters to the EditorThe Hispanic Outlook in Higher Education Magazine ®
email: [email protected]
“‘The Hispanic Outlook in Higher Education’ and’Hispanic Outlook are registered trademarks.’”
Editorial Office299 Market St, Ste. 145, Saddle Brook, N.J. 07663
TEL (201) 587-8800 or (800) 549-8280
Editorial PolicyThe Hispanic Outlook in Higher Education Magazine® is
a national magazine. Dedicated to exploring issues related to Hispanics in higher education, The Hispanic Outlook in High-er Education Magazine®is published for the members of the higher education community. Editorial decisions are based on the editors’ judgment of the quality of the writing, the time-liness of the article, and the potential interest to the readers of The Hispanic Outlook Magazine®. From time to time, The Hispanic Outlook in Higher Education Magazine® will publish articles dealing with controversial issues. The views expressed herein are those of the authors and/or those interviewed and might not reflect the official policy of the magazine. The Hispan-ic Outlook in Higher Education Magazine® neither agrees nor disagrees with those ideas expressed, and no endorsement of those views should be inferred unless specifically identified as officially endorsed by The Hispanic Outlook in Higher Education Magazine®.
PublisherJosé López-Isa
Executive EditorMarilyn GilroySenior Editor
Mary Ann CooperWashington DC Bureau Chief
Peggy Sands OrchowskiContributing Editors
Carlos D. Conde, Michelle AdamContributing WritersGustavo A. Mellander
Chief of Human Resources & AdministrationTomás Castellanos Núñez
Chief of Advertising, Marketing & ProductionMeredith Cooper
Research & Development DirectorMarilyn Roca Enríquez
Art & Production DirectorRicardo Castillo
Director of Accounting & FinanceJavier Salazar Carrión

By Mary Ann Cooper
6 | MAY 18, 2015
Budgets and State Funding Shrink, Tuition Continues to Climb
Every year HO reviews the past year in student enrollment and degree completions to determine which institutions are training the most His-panic scholars. Also this year we singled out a school that has showed
great improvement in granting degrees to and enrolling Hispanic students. To that end, this year’s Top 100 issue cover features Montclair State University in New Jersey. Our high regard for this university dates back to 1997 when our publisher José Lopez Isa selected it as one of his Publisher’s Picks. In 2002 MSU was a Publisher’s Pick for the 6th consecutive year, labeling MSU as one of the schools “that we believe enable so many of our Hispanic youth to succeed.” In the 13 years that have followed MSU has continued to build on its diversity success. In just the past two years they have increased their graduate enrollment among Hispanics by almost 15 percent, while consistently improv-ing their undergraduate Hispanic degrees granted and total enrollment. As we predicted in 2002, MSU’s achievements in diversity “will doubtless ripple down through succeeding generations.”
MSU is just one of the outstanding schools with a great reputation for Hispanic enrollment and degree earners. In recent years we have coupled our findings with the College Board’s (CB) annual survey titled, “Trends in Col-lege Pricing (2014 edition),” which is one of the best predictors of trends in higher education. In these uncertain economic times, the price of a college education remains a key determining factor in recruiting and retaining His-panic students.
Between 2013-14 and 2014-15, average published tuition and fee prices increased by 2.9 percent for in-state students in the public four-year sector, by 3.3 percent for out-of-state students in the public four-year sector and for in-district students at public two-year colleges, and by 3.7 percent at private nonprofit four-year institutions.
These increases are higher than the 2.0 percent increase in the Consumer Price Index between July 2013 and July 2014, but in all sectors these price in-
Colleges for Hispanics
Ilustration by © Depositphotos.com/kikkerdirk
MAY 18, 2015 | 7
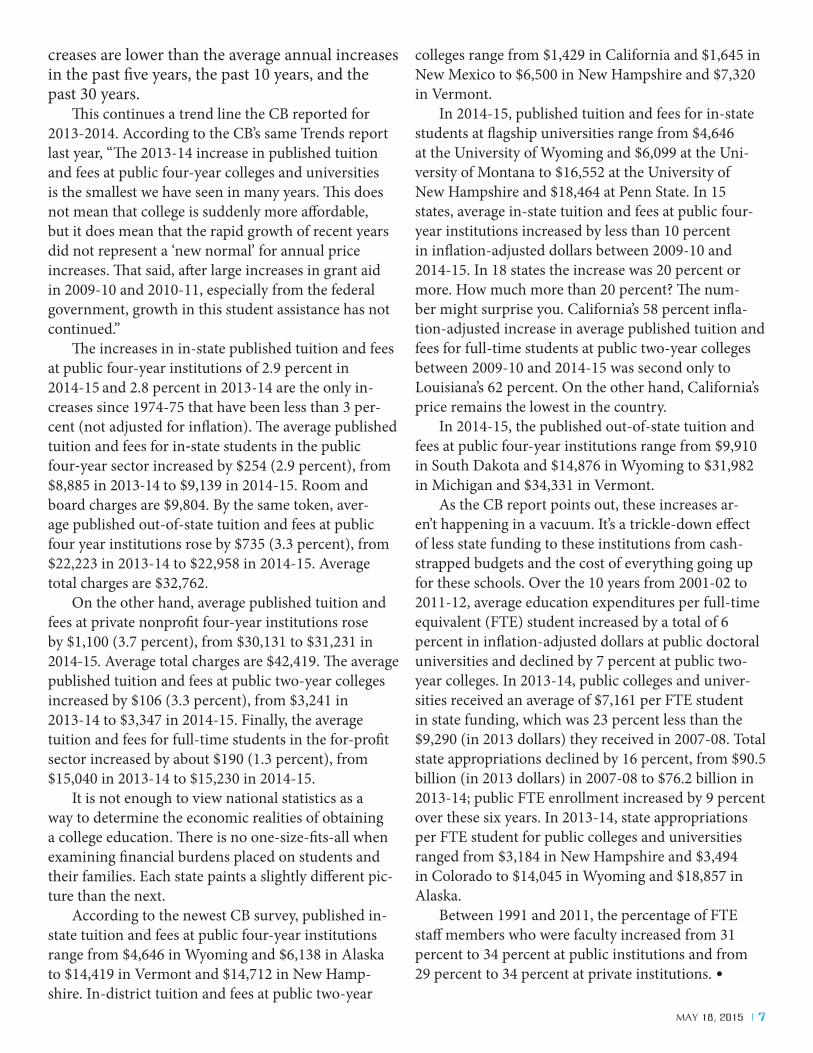
creases are lower than the average annual increases in the past five years, the past 10 years, and the past 30 years.
This continues a trend line the CB reported for 2013-2014. According to the CB’s same Trends report last year, “The 2013-14 increase in published tuition and fees at public four-year colleges and universities is the smallest we have seen in many years. This does not mean that college is suddenly more affordable, but it does mean that the rapid growth of recent years did not represent a ‘new normal’ for annual price increases. That said, after large increases in grant aid in 2009-10 and 2010-11, especially from the federal government, growth in this student assistance has not continued.”
The increases in in-state published tuition and fees at public four-year institutions of 2.9 percent in 2014-15 and 2.8 percent in 2013-14 are the only in-creases since 1974-75 that have been less than 3 per-cent (not adjusted for inflation). The average published tuition and fees for in‐state students in the public four‐year sector increased by $254 (2.9 percent), from $8,885 in 2013-14 to $9,139 in 2014-15. Room and board charges are $9,804. By the same token, aver-age published out-of-state tuition and fees at public four year institutions rose by $735 (3.3 percent), from $22,223 in 2013-14 to $22,958 in 2014-15. Average total charges are $32,762.
On the other hand, average published tuition and fees at private nonprofit four-year institutions rose by $1,100 (3.7 percent), from $30,131 to $31,231 in 2014-15. Average total charges are $42,419. The average published tuition and fees at public two-year colleges increased by $106 (3.3 percent), from $3,241 in 2013-14 to $3,347 in 2014-15. Finally, the average tuition and fees for full-time students in the for-profit sector increased by about $190 (1.3 percent), from $15,040 in 2013-14 to $15,230 in 2014-15.
It is not enough to view national statistics as a way to determine the economic realities of obtaining a college education. There is no one-size-fits-all when examining financial burdens placed on students and their families. Each state paints a slightly different pic-ture than the next.
According to the newest CB survey, published in-state tuition and fees at public four-year institutions range from $4,646 in Wyoming and $6,138 in Alaska to $14,419 in Vermont and $14,712 in New Hamp-shire. In-district tuition and fees at public two-year
colleges range from $1,429 in California and $1,645 in New Mexico to $6,500 in New Hampshire and $7,320 in Vermont.
In 2014-15, published tuition and fees for in-state students at flagship universities range from $4,646 at the University of Wyoming and $6,099 at the Uni-versity of Montana to $16,552 at the University of New Hampshire and $18,464 at Penn State. In 15 states, average in-state tuition and fees at public four-year institutions increased by less than 10 percent in inflation-adjusted dollars between 2009-10 and 2014-15. In 18 states the increase was 20 percent or more. How much more than 20 percent? The num-ber might surprise you. California’s 58 percent infla-tion-adjusted increase in average published tuition and fees for full-time students at public two-year colleges between 2009-10 and 2014-15 was second only to Louisiana’s 62 percent. On the other hand, California’s price remains the lowest in the country.
In 2014-15, the published out-of-state tuition and fees at public four-year institutions range from $9,910 in South Dakota and $14,876 in Wyoming to $31,982 in Michigan and $34,331 in Vermont.
As the CB report points out, these increases ar-en’t happening in a vacuum. It’s a trickle-down effect of less state funding to these institutions from cash-strapped budgets and the cost of everything going up for these schools. Over the 10 years from 2001-02 to 2011-12, average education expenditures per full-time equivalent (FTE) student increased by a total of 6 percent in inflation-adjusted dollars at public doctoral universities and declined by 7 percent at public two-year colleges. In 2013-14, public colleges and univer-sities received an average of $7,161 per FTE student in state funding, which was 23 percent less than the $9,290 (in 2013 dollars) they received in 2007-08. Total state appropriations declined by 16 percent, from $90.5 billion (in 2013 dollars) in 2007-08 to $76.2 billion in 2013-14; public FTE enrollment increased by 9 percent over these six years. In 2013-14, state appropriations per FTE student for public colleges and universities ranged from $3,184 in New Hampshire and $3,494 in Colorado to $14,045 in Wyoming and $18,857 in Alaska.
Between 1991 and 2011, the percentage of FTE staff members who were faculty increased from 31 percent to 34 percent at public institutions and from 29 percent to 34 percent at private institutions. •
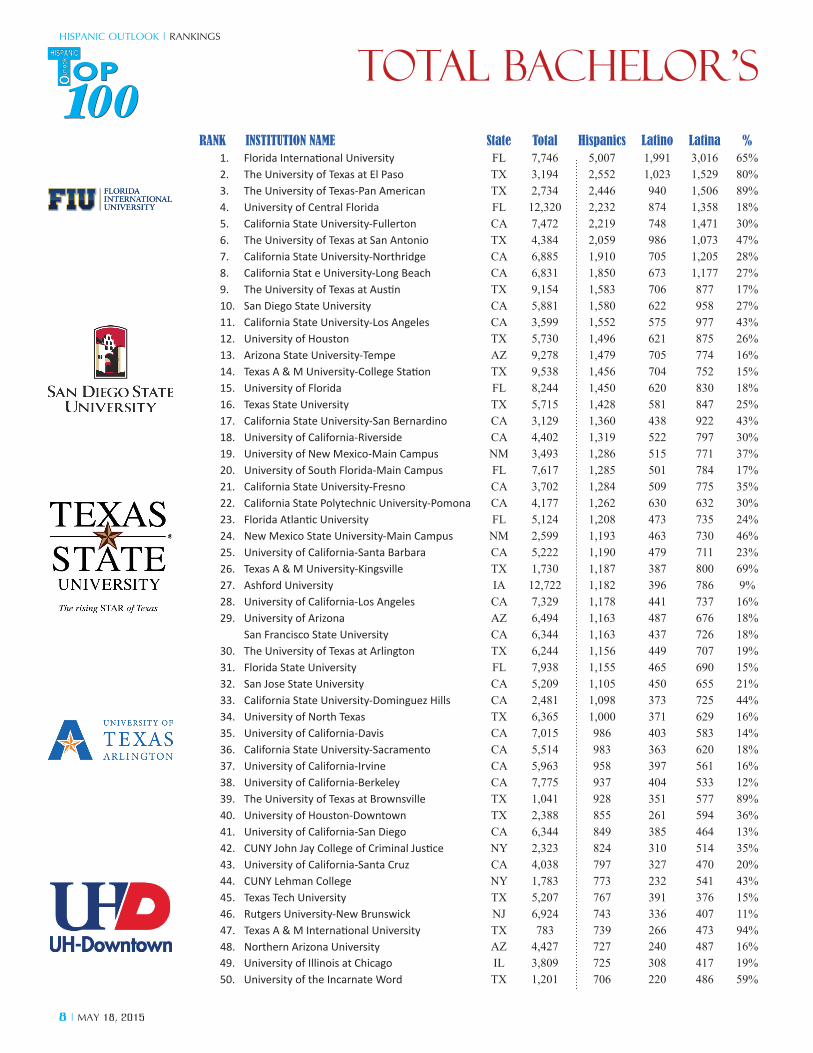
Total Bachelor’s Degrees Granted
RANK INSTITUTION NAME State Total Hispanics Latino
Latina %
1. Florida International University FL 7,746 5,007 1,991 3,016 65%2. The University of Texas at El Paso TX 3,194 2,552 1,023 1,529 80%3. The University of Texas-Pan American TX 2,734 2,446 940 1,506 89%4. University of Central Florida FL 12,320 2,232 874 1,358 18%5. California State University-Fullerton CA 7,472 2,219 748 1,471 30%6. The University of Texas at San Antonio TX 4,384 2,059 986 1,073 47%7. California State University-Northridge CA 6,885 1,910 705 1,205 28%8. California Stat e University-Long Beach CA 6,831 1,850 673 1,177 27%9. The University of Texas at Austin TX 9,154 1,583 706 877 17%10. San Diego State University CA 5,881 1,580 622 958 27%11. California State University-Los Angeles CA 3,599 1,552 575 977 43%12. University of Houston TX 5,730 1,496 621 875 26%13. Arizona State University-Tempe AZ 9,278 1,479 705 774 16%14. Texas A & M University-College Station TX 9,538 1,456 704 752 15%15. University of Florida FL 8,244 1,450 620 830 18%16. Texas State University TX 5,715 1,428 581 847 25%17. California State University-San Bernardino CA 3,129 1,360 438 922 43%18. University of California-Riverside CA 4,402 1,319 522 797 30%19. University of New Mexico-Main Campus NM 3,493 1,286 515 771 37%20. University of South Florida-Main Campus FL 7,617 1,285 501 784 17%21. California State University-Fresno CA 3,702 1,284 509 775 35%22. California State Polytechnic University-Pomona CA 4,177 1,262 630 632 30%23. Florida Atlantic University FL 5,124 1,208 473 735 24%24. New Mexico State University-Main Campus NM 2,599 1,193 463 730 46%25. University of California-Santa Barbara CA 5,222 1,190 479 711 23%26. Texas A & M University-Kingsville TX 1,730 1,187 387 800 69%27. Ashford University IA 12,722 1,182 396 786 9%28. University of California-Los Angeles CA 7,329 1,178 441 737 16%29. University of Arizona AZ 6,494 1,163 487 676 18%
San Francisco State University CA 6,344 1,163 437 726 18%30. The University of Texas at Arlington TX 6,244 1,156 449 707 19%31. Florida State University FL 7,938 1,155 465 690 15%32. San Jose State University CA 5,209 1,105 450 655 21%33. California State University-Dominguez Hills CA 2,481 1,098 373 725 44%34. University of North Texas TX 6,365 1,000 371 629 16%35. University of California-Davis CA 7,015 986 403 583 14%36. California State University-Sacramento CA 5,514 983 363 620 18%37. University of California-Irvine CA 5,963 958 397 561 16%38. University of California-Berkeley CA 7,775 937 404 533 12%39. The University of Texas at Brownsville TX 1,041 928 351 577 89%40. University of Houston-Downtown TX 2,388 855 261 594 36%41. University of California-San Diego CA 6,344 849 385 464 13%42. CUNY John Jay College of Criminal Justice NY 2,323 824 310 514 35%43. University of California-Santa Cruz CA 4,038 797 327 470 20%44. CUNY Lehman College NY 1,783 773 232 541 43%45. Texas Tech University TX 5,207 767 391 376 15%46. Rutgers University-New Brunswick NJ 6,924 743 336 407 11%47. Texas A & M International University TX 783 739 266 473 94%48. Northern Arizona University AZ 4,427 727 240 487 16%49. University of Illinois at Chicago IL 3,809 725 308 417 19%50. University of the Incarnate Word TX 1,201 706 220 486 59%
8 | MAY 18, 2015
HISPANIC OUTLOOK | RANKINGS
Colleges for Hispanics

Total Bachelor’s Degrees Granted
51. Montclair State University NJ 3,201 656 197 459 20%CUNY City College NY 2,026 656 229 427 32%
52. University of Miami FL 2,451 621 264 357 25%53. University of Southern California CA 4,740 603 271 332 13%54. California State University-Bakersfield CA 1,480 596 197 399 40%55. University of Nevada-Las Vegas NV 3,857 595 209 386 15%56. Texas A & M University-Corpus Christi TX 1,464 592 181 411 40%57. DePaul University IL 3,802 583 222 361 15%58. CUNY Hunter College NY 2,876 562 163 399 20%59. Kean University NJ 2,704 545 192 353 20%60. George Mason University VA 4,920 538 207 331 11%61. California State University-Stanislaus CA 1,621 532 162 370 33%
University of North Carolina at Chapel Hill NC 4,627 532 224 308 11%62. CUNY Queens College NY 3,207 529 160 369 16%63. Sam Houston State University TX 3,256 514 200 314 16%64. Pennsylvania State University-Main Campus PA 10,573 502 213 289 5%65. University of Illinois at Urbana-Champaign IL 7,645 497 231 266 7%66. Miami Dade College FL 829 495 168 327 60%67. University of Maryland-College Park MD 7,214 484 211 273 7%68. California State University-San Marcos CA 1,964 482 1 63 319 25%
Nova Southeastern University FL 1,538 482 110 372 31%69. California State University-Chico CA 3,495 479 203 276 14%70. University of La Verne CA 1,075 478 149 329 44%71. University of Washington-Seattle Campus WA 7,651 467 195 272 6%72. California State University-East Bay CA 2,808 461 150 311 16%73. New York University NY 5,333 441 155 286 8%74. Metropolitan State University of Denver CO 2,962 424 156 268 14%75. William Paterson University of New Jersey NJ 1,996 413 162 251 21%76. Grand Canyon University AZ 5,371 405 92 313 8%77. Northeastern Illinois University IL 1,639 404 140 264 25%
CUNY Bernard M Baruch College NY 3,042 404 164 240 13%78. New Jersey City University NJ 1,211 397 146 251 33%79. DeVry University-California CA 1,376 384 214 170 28%80. Northern Illinois University IL 3,848 378 180 198 10%81. Monroe College NY 1,026 377 107 270 37%82. California State University-Monterey Bay CA 1,048 373 120 253 36%83. California State University-Channel Islands CA 1,231 372 119 253 30%
University of Utah UT 5,139 372 172 200 7%84. University of Colorado Boulder CO 5,752 370 167 203 6%
St John’s University-New York NY 2,252 370 148 222 16%Washington State University WA 5,275 370 144 226 7%
85. Rutgers University-Newark NJ 1,609 368 147 221 23%86. Baylor University TX 2,709 363 131 232 13%87. American Public University System WV 4,020 362 238 124 9%88. The University of Texas at Dallas TX 2,761 360 165 195 13%89. Boston University MA 4,071 359 124 235 9%90. University of Houston-Clear Lake TX 1,203 351 92 259 29%91. Georgia State University GA 4,608 348 136 212 8%92. University of Maryland-University College MD 4,159 343 167 176 8%93. St Mary’s University TX 513 340 123 217 66%94. California Polytechnic State U-San Luis Obispo CA 3,300 338 198 140 10%95. Stony Brook University NY 3,799 330 139 191 9%96. DeVry University-Illinois IL 2,595 327 162 165 13%97. Colorado State University-Fort Collins CO 4,736 326 146 180 7%98. University of Connecticut CT 5,122 325 135 190 6%99. Loyola Marymount University CA 1,524 324 140 184 21%
Texas Woman’s University TX 1,926 324 27 297 17% 100. National University CA 1,611 320 115 205 20%
Portland State University OR 4,321 320 129 191 7%
SOURCE: NCES, IPEDS Database 2013 total BA degrees granted.
RANK INSTITUTION NAME State Total Hispanics Latino
Latina %
MAY 18, 2015 | 9
RANKINGS | HISPANIC OUTLOOK

RANK INSTITUTION NAME State Total Hispanics Latino Latina %1. Nova Southeastern University FL 20,514 4,496 1,360 3,136 22%2. Florida International University FL 8,521 3,575 1,430 2,145 42%3. University of Southern California CA 22,923 2,648 935 1,713 12%4. The University of Texas-Pan American TX 2,823 2,196 837 1,359 78%5. Grand Canyon University AZ 20,292 2,030 507 1,523 10%6. The University of Texas at El Paso TX 3,307 2,008 834 1,174 61%7. CUNY Graduate School and University Center NY 5,389 1,874 738 1,136 35%8. National University CA 8,133 1,758 617 1,141 22%9. University of New Mexico-Main Campus NM 6,176 1,652 657 995 27%10. University of Florida FL 16,710 1,551 670 881 9%11. The University of Texas at San Antonio TX 4,281 1,538 584 954 36%12. California State University-Los Angeles CA 3,669 1,339 443 896 36%13. Texas A & M University-Kingsville TX 2,799 1,317 416 901 47%14. New York University NY 21,984 1,245 432 813 6%15. The University of Texas at Austin TX 12,080 1,241 575 666 10%16. California State University-Long Beach CA 4,993 1,227 401 826 25%17. University of California-Los Angeles CA 12,121 1,195 524 671 10%18. California State University-Fullerton CA 5,209 1,148 402 746 22%19. University of South Florida-Main Campus FL 10,328 1,122 416 706 11%20. Rutgers University-New Brunswick NJ 14,135 1,118 351 767 8%21. Columbia University in the City of New York NY 18,987 1,103 466 637 6%22. New Mexico State University-Main Campus NM 3,183 1,089 368 721 34%23. University of Miami FL 5,555 1,055 452 603 19%24. Harvard University MA 17,763 1,054 523 531 6%25. CUNY Hunter College NY 6,330 1,049 239 810 17%26. University of Illinois at Chicago IL 11,367 1,041 390 651 9%27. Texas A & M University-College Station TX 11,625 1,036 521 515 9%28. Barry University FL 4,689 1,032 278 754 22%29. Webster University MO 14,376 1,030 455 575 7%30. University of La Verne CA 3,580 1,007 334 673 28%31. University of Central Florida FL 8,256 995 413 582 12%32. California State University-Northridge CA 4,539 991 270 721 22%33. University of Arizona AZ 8,951 962 396 566 11%34. San Diego State University CA 4,800 930 326 604 19%35. Texas State University TX 4,541 930 331 599 20%36. Azusa Pacific University CA 4,212 899 246 653 21%37. American Public University System WV 11,458 876 527 349 8%38. California State University-Fresno CA 2,765 873 249 624 32%39. Loyola Marymount University CA 3,456 850 256 594 25%40. The University of Texas at Arlington TX 7,639 847 293 554 11%41. University of Houston TX 7,834 829 361 468 11%42. University of the Incarnate Word TX 2,194 818 290 528 37%43. Arizona State University-Tempe AZ 9,972 794 435 359 8%44. University of North Texas TX 7,072 793 298 495 11%45. The University of Texas at Brownsville TX 1,065 792 253 539 74%46. University of California-Berkeley CA 10,247 779 361 418 8%47. Florida Atlantic University FL 4,969 775 305 470 16%48. University of Washington-Seattle Campus WA 14,006 765 340 425 5%49. University of Maryland-University College MD 12,817 760 397 363 6%50. CUNY Lehman College NY 2,199 758 158 600 34%
Graduate Student Enrollment
10 | MAY 18, 2015
HISPANIC OUTLOOK | RANKINGS
Colleges for Hispanics
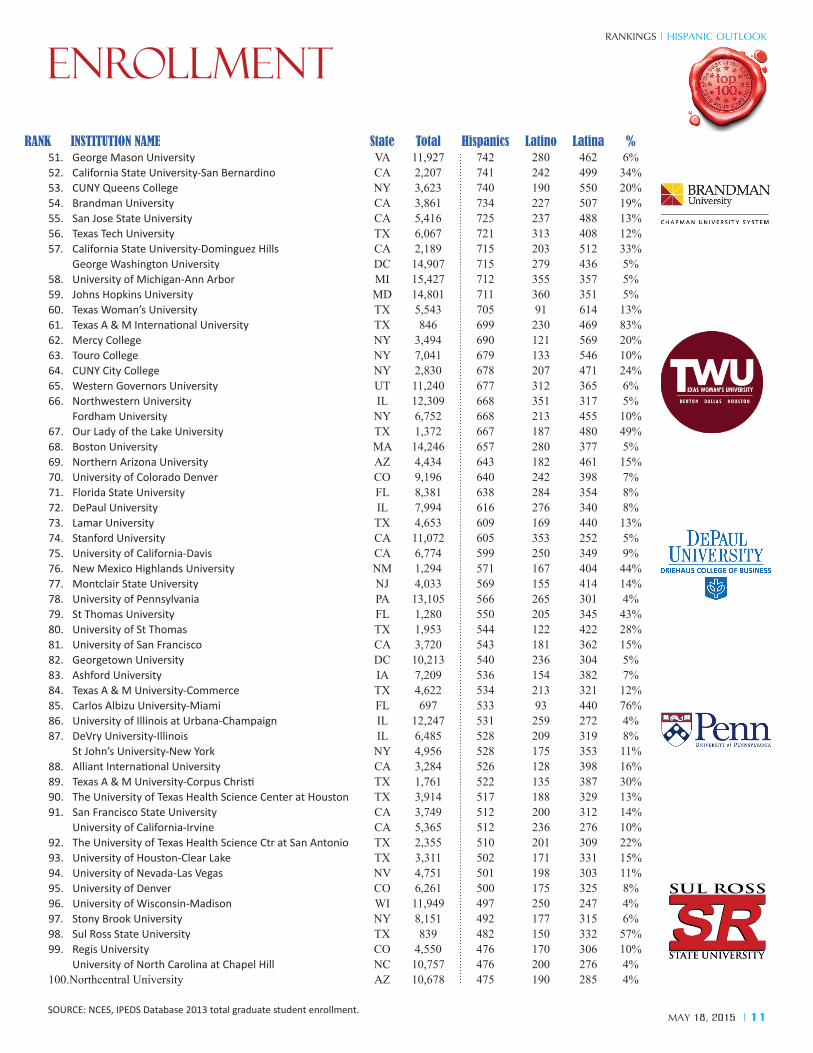
Graduate Student Enrollment
RANK INSTITUTION NAME State Total Hispanics Latino Latina %51. George Mason University VA 11,927 742 280 462 6%52. California State University-San Bernardino CA 2,207 741 242 499 34%53. CUNY Queens College NY 3,623 740 190 550 20%54. Brandman University CA 3,861 734 227 507 19%55. San Jose State University CA 5,416 725 237 488 13%56. Texas Tech University TX 6,067 721 313 408 12%57. California State University-Dominguez Hills CA 2,189 715 203 512 33%
George Washington University DC 14,907 715 279 436 5%58. University of Michigan-Ann Arbor MI 15,427 712 355 357 5%59. Johns Hopkins University MD 14,801 711 360 351 5%60. Texas Woman’s University TX 5,543 705 91 614 13%61. Texas A & M International University TX 846 699 230 469 83%62. Mercy College NY 3,494 690 121 569 20%63. Touro College NY 7,041 679 133 546 10%64. CUNY City College NY 2,830 678 207 471 24%65. Western Governors University UT 11,240 677 312 365 6%66. Northwestern University IL 12,309 668 351 317 5%
Fordham University NY 6,752 668 213 455 10%67. Our Lady of the Lake University TX 1,372 667 187 480 49%68. Boston University MA 14,246 657 280 377 5%69. Northern Arizona University AZ 4,434 643 182 461 15%70. University of Colorado Denver CO 9,196 640 242 398 7%71. Florida State University FL 8,381 638 284 354 8%72. DePaul University IL 7,994 616 276 340 8%73. Lamar University TX 4,653 609 169 440 13%74. Stanford University CA 11,072 605 353 252 5%75. University of California-Davis CA 6,774 599 250 349 9%76. New Mexico Highlands University NM 1,294 571 167 404 44%77. Montclair State University NJ 4,033 569 155 414 14%78. University of Pennsylvania PA 13,105 566 265 301 4%79. St Thomas University FL 1,280 550 205 345 43%80. University of St Thomas TX 1,953 544 122 422 28%81. University of San Francisco CA 3,720 543 181 362 15%82. Georgetown University DC 10,213 540 236 304 5%83. Ashford University IA 7,209 536 154 382 7%84. Texas A & M University-Commerce TX 4,622 534 213 321 12%85. Carlos Albizu University-Miami FL 697 533 93 440 76%86. University of Illinois at Urbana-Champaign IL 12,247 531 259 272 4%87. DeVry University-Illinois IL 6,485 528 209 319 8%
St John’s University-New York NY 4,956 528 175 353 11%88. Alliant International University CA 3,284 526 128 398 16%89. Texas A & M University-Corpus Christi TX 1,761 522 135 387 30%90. The University of Texas Health Science Center at Houston TX 3,914 517 188 329 13%91. San Francisco State University CA 3,749 512 200 312 14%
University of California-Irvine CA 5,365 512 236 276 10%92. The University of Texas Health Science Ctr at San Antonio TX 2,355 510 201 309 22%93. University of Houston-Clear Lake TX 3,311 502 171 331 15%94. University of Nevada-Las Vegas NV 4,751 501 198 303 11%95. University of Denver CO 6,261 500 175 325 8%96. University of Wisconsin-Madison WI 11,949 497 250 247 4%97. Stony Brook University NY 8,151 492 177 315 6%98. Sul Ross State University TX 839 482 150 332 57%99. Regis University CO 4,550 476 170 306 10%
University of North Carolina at Chapel Hill NC 10,757 476 200 276 4% 100.Northcentral University AZ 10,678 475 190 285 4%
SOURCE: NCES, IPEDS Database 2013 total graduate student enrollment.MAY 18, 2015 | 11
RANKINGS | HISPANIC OUTLOOK
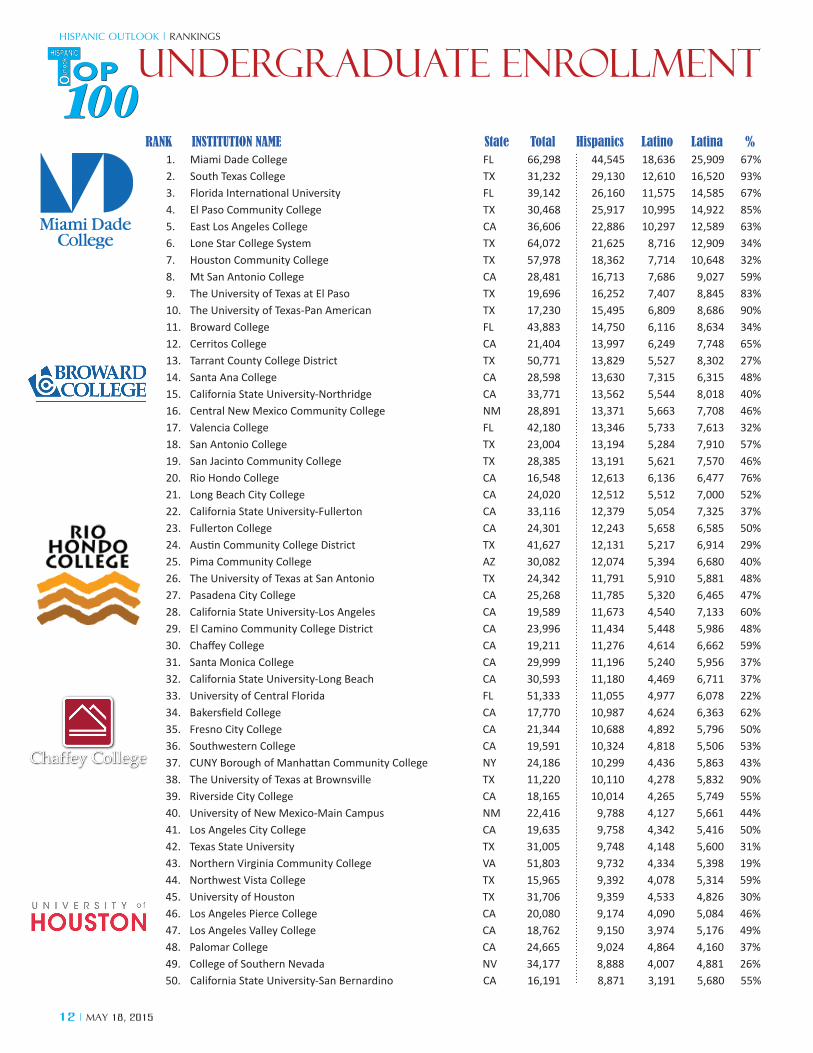
RANK INSTITUTION NAME State Total Hispanics Latino Latina %1. Miami Dade College FL 66,298 44,545 18,636 25,909 67%2. South Texas College TX 31,232 29,130 12,610 16,520 93%3. Florida International University FL 39,142 26,160 11,575 14,585 67%4. El Paso Community College TX 30,468 25,917 10,995 14,922 85%5. East Los Angeles College CA 36,606 22,886 10,297 12,589 63%6. Lone Star College System TX 64,072 21,625 8,716 12,909 34%7. Houston Community College TX 57,978 18,362 7,714 10,648 32%8. Mt San Antonio College CA 28,481 16,713 7,686 9,027 59%9. The University of Texas at El Paso TX 19,696 16,252 7,407 8,845 83%10. The University of Texas-Pan American TX 17,230 15,495 6,809 8,686 90%11. Broward College FL 43,883 14,750 6,116 8,634 34%12. Cerritos College CA 21,404 13,997 6,249 7,748 65%13. Tarrant County College District TX 50,771 13,829 5,527 8,302 27%14. Santa Ana College CA 28,598 13,630 7,315 6,315 48%15. California State University-Northridge CA 33,771 13,562 5,544 8,018 40%16. Central New Mexico Community College NM 28,891 13,371 5,663 7,708 46%17. Valencia College FL 42,180 13,346 5,733 7,613 32%18. San Antonio College TX 23,004 13,194 5,284 7,910 57%19. San Jacinto Community College TX 28,385 13,191 5,621 7,570 46%20. Rio Hondo College CA 16,548 12,613 6,136 6,477 76%21. Long Beach City College CA 24,020 12,512 5,512 7,000 52%22. California State University-Fullerton CA 33,116 12,379 5,054 7,325 37%23. Fullerton College CA 24,301 12,243 5,658 6,585 50%24. Austin Community College District TX 41,627 12,131 5,217 6,914 29%25. Pima Community College AZ 30,082 12,074 5,394 6,680 40%26. The University of Texas at San Antonio TX 24,342 11,791 5,910 5,881 48%27. Pasadena City College CA 25,268 11,785 5,320 6,465 47%28. California State University-Los Angeles CA 19,589 11,673 4,540 7,133 60%29. El Camino Community College District CA 23,996 11,434 5,448 5,986 48%30. Chaffey College CA 19,211 11,276 4,614 6,662 59%31. Santa Monica College CA 29,999 11,196 5,240 5,956 37%32. California State University-Long Beach CA 30,593 11,180 4,469 6,711 37%33. University of Central Florida FL 51,333 11,055 4,977 6,078 22%34. Bakersfield College CA 17,770 10,987 4,624 6,363 62%35. Fresno City College CA 21,344 10,688 4,892 5,796 50%36. Southwestern College CA 19,591 10,324 4,818 5,506 53%37. CUNY Borough of Manhattan Community College NY 24,186 10,299 4,436 5,863 43%38. The University of Texas at Brownsville TX 11,220 10,110 4,278 5,832 90%39. Riverside City College CA 18,165 10,014 4,265 5,749 55%40. University of New Mexico-Main Campus NM 22,416 9,788 4,127 5,661 44%41. Los Angeles City College CA 19,635 9,758 4,342 5,416 50%42. Texas State University TX 31,005 9,748 4,148 5,600 31%43. Northern Virginia Community College VA 51,803 9,732 4,334 5,398 19%44. Northwest Vista College TX 15,965 9,392 4,078 5,314 59%45. University of Houston TX 31,706 9,359 4,533 4,826 30%46. Los Angeles Pierce College CA 20,080 9,174 4,090 5,084 46%47. Los Angeles Valley College CA 18,762 9,150 3,974 5,176 49%48. Palomar College CA 24,665 9,024 4,864 4,160 37%49. College of Southern Nevada NV 34,177 8,888 4,007 4,881 26%50. California State University-San Bernardino CA 16,191 8,871 3,191 5,680 55%
Undergraduate Enrollment (2- and 4- year schools)
12 | MAY 18, 2015
HISPANIC OUTLOOK | RANKINGS
Colleges for Hispanics

RANK INSTITUTION NAME State Total Hispanics Latino Latina %51. The University of Texas at Austin TX 39,979 8,679 4,044 4,635 22%52. CUNY LaGuardia Community College NY 19,564 8,675 3,600 5,075 44%53. Texas A & M University-College Station TX 44,072 8,634 4,304 4,330 20%54. California State University-Fresno CA 20,295 8,494 3,340 5,154 42%55. Laredo Community College TX 8,726 8,480 3,710 4,770 97%56. Los Angeles Trade Technical College CA 13,879 8,113 4,368 3,745 58%57. San Diego State University CA 27,099 7,901 3,377 4,524 29%58. College of the Canyons CA 18,508 7,893 4,001 3,892 43%59. San Diego Mesa College CA 24,251 7,878 3,615 4,263 32%60. San Bernardino Valley College CA 12,329 7,769 3,393 4,376 63%61. California State Polytechnic University-Pomona CA 20,952 7,767 4,043 3,724 37%62. Reedley College CA 13,807 7,747 3,208 4,539 56%63. University of Arizona AZ 31,670 7,714 3,375 4,339 24%64. Citrus College CA 12,920 7,675 3,459 4,216 59%65. Palm Beach State College FL 29,763 7,596 3,196 4,400 26%66. San Diego City College CA 16,310 7,545 3,363 4,182 46%67. Modesto Junior College CA 17,084 7,258 3,171 4,087 42%68. CUNY Bronx Community College NY 11,368 7,221 2,990 4,231 64%69. San Joaquin Delta College CA 17,629 7,216 2,990 4,226 41%70. Arizona State University-Tempe AZ 38,730 7,145 3,727 3,418 18%71. Ventura College CA 12,908 7,116 3,137 3,979 55%72. Orange Coast College CA 21,886 7,052 3,551 3,501 32%73. New Mexico State University-Main Campus NM 13,582 7,043 3,072 3,971 52%74. City Colleges of Chicago-Wilbur Wright College IL 12,640 7,019 2,838 4,181 56%75. Imperial Valley College CA 7,701 6,987 2,891 4,096 91%76. Cypress College CA 15,881 6,850 2,914 3,936 43%77. Los Angeles Mission College CA 8,990 6,744 2,654 4,090 75%78. Hillsborough Community College FL 26,590 6,685 2,741 3,944 25%79. University of California-Riverside CA 18,621 6,683 2,757 3,926 36%80. California State University-Sacramento CA 26,094 6,671 2,643 4,028 26%81. City Colleges of Chicago-Richard J Daley College IL 9,384 6,633 2,570 4,063 71%82. California State University-Dominguez Hills CA 12,481 6,619 2,313 4,306 53%83. Del Mar College TX 10,502 6,612 2,838 3,774 63%84. The University of Texas at Arlington TX 25,690 6,536 2,813 3,723 25%85. Sacramento City College CA 23,509 6,522 2,748 3,774 28%86. University of North Texas TX 31,243 6,435 2,896 3,539 21%87. College of the Sequoias CA 10,720 6,395 2,796 3,599 60%88. Glendale Community College AZ 20,872 6,385 2,828 3,557 31%89. Florida Atlantic University FL 25,790 6,367 2,676 3,691 25%90. Santa Rosa Junior College CA 22,094 6,366 2,842 3,524 29%91. Texas A & M University-Kingsville TX 9,430 6,357 2,712 3,645 67%92. San Francisco State University CA 26,156 6,341 2,459 3,882 24%93. Antelope Valley College CA 14,262 6,327 2,544 3,783 44%94. University of Florida FL 33,168 6,273 2,721 3,552 19%95. Texas A & M International University TX 6,585 6,217 2,571 3,646 94%96. New Mexico State University-Dona Ana NM 8,837 6,177 2,540 3,637 70%97. San Jose State University CA 25,862 6,133 2,741 3,392 24%98. College of the Desert CA 9,259 6,118 2,668 3,450 66%99. Mt San Jacinto Community College District CA 14,170 6,080 2,553 3,527 43%
100. Hartnell College CA 9,439 6,067 2,766 3,301 64%
SOURCE: NCES, IPEDS database. All undergraduate students (part time and full time) – degree seeking and non-degree seeking as of fall 2013. (2- and 4-year schools)
Undergraduate Enrollment (2- and 4- year schools)
MAY 18, 2015 | 13
RANKINGS | HISPANIC OUTLOOK

Agriculture/ Agriculture Operations State Total Hispanics Latino Latina %
1. Texas A & M University-College Station TX 1,057 133 71 62 13%
2. University of Florida FL 498 83 32 51 17%
3. University of California-Davis CA 336 58 21 37 17%
4. California State University-Fresno CA 238 54 26 28 23%
5. California State Polytechnic University-Pomona CA 199 52 12 40 26%
6. Cornell University NY 432 41 23 18 9%
7. California Polytechnic State University-San Luis Obispo CA 361 32 13 19 9%
8. University of Illinois at Urbana-Champaign IL 445 30 10 20 7%
9. New Mexico State University-Main Campus NM 97 29 17 12 30%
10. Texas A & M University-Kingsville TX 52 26 18 8 50%
Architecture State Total Hispanics Latino Latina % 1. The University of Texas at San Antonio TX 145 90 48 42 62%
2. California State Polytechnic University-Pomona CA 211 67 45 22 32%
3. Texas Tech University TX 165 54 38 16 33%
4. University of Houston TX 112 43 34 9 38%
5. Florida Atlantic University FL 93 35 20 15 38%
Texas A & M University-College Station TX 133 35 13 22 26%
6. Arizona State University-Tempe AZ 171 34 22 12 20%
Woodbury University CA 98 34 21 13 35%
7. California Polytechnic State University-San Luis Obispo CA 219 32 19 13 15%
8. University of California-Berkeley CA 158 29 21 8 18%
9. University of California-Davis CA 109 26 11 15 24%
10. CUNY City College NY 59 22 10 12 37%
University of New Mexico-Main Campus NM 56 22 13 9 39%
Homeland Security Law Enforcement Firefighting State Total Hispanics Latino Latina %
1. CUNY John Jay College of Criminal Justice NY 1,272 440 213 227 35%
2. Florida International University FL 496 323 145 178 65%
3. The University of Texas-Pan American TX 220 211 109 102 96%
4. California State University-Los Angeles CA 283 189 92 97 67%
5. The University of Texas at El Paso TX 179 164 76 88 92%
6. California State University-Fullerton CA 304 152 74 78 50%
7. The University of Texas at San Antonio TX 249 151 74 77 61%
8. California State University-San Bernardino CA 241 145 64 81 60%
9. San Diego State University CA 342 139 53 86 41%
10. Sam Houston State University TX 583 135 59 76 23%
Bachelor’s Degrees Awarded to Hispanics by Academic Programs
14 | MAY 18, 2015
HISPANIC OUTLOOK | RANKINGS
Colleges for Hispanics

Ethnic Cultural Gender Studies State Total Hispanics Latino Latina %
1. University of California-Los Angeles CA 292 97 19 78 33%
2. University of California-Santa Cruz CA 176 94 25 69 53%
3. University of California-Santa Barbara CA 128 69 18 51 54%
4. University of California-Berkeley CA 258 65 16 49 25%
5. University of California-Davis CA 104 44 13 31 42%
6. California State University-Long Beach CA 101 38 9 29 38%
7. University of North Carolina at Chapel Hill NC 244 36 7 29 15%
8. University of Washington-Seattle Campus WA 319 34 10 24 11%
9. California State University-Fullerton CA 57 27 8 19 47%
10. Florida International University FL 51 26 11 15 51%
Education State Total Hispanics Latino Latina %
1. The University of Texas at El Paso TX 390 346 47 299 89%
2. Florida International University FL 405 303 26 277 75%
3. University of New Mexico-Main Campus NM 385 159 33 126 41%
4. California State University-Fullerton CA 415 153 6 147 37%
5. Ashford University IA 1,713 147 9 138 9%
6. University of Central Florida FL 932 133 40 93 14%
7. New Mexico State University-Main Campus NM 199 118 29 89 59%
8. Northern Arizona University AZ 610 111 13 98 18%
9. Arizona State University-Tempe AZ 491 93 23 70 19%
10. Florida Atlantic University FL 441 90 8 82 20%
Communication Journalism State Total Hispanics Latino Latina %
1. California State University-Fullerton CA 995 285 88 197 29%
2. The University of Texas at Austin TX 1,121 227 80 147 20%
3. Florida International University FL 271 195 42 153 72%
4. California State University-Northridge CA 560 153 75 78 27%
5. University of Florida FL 691 143 38 105 21%
6. University of Houston TX 340 135 44 91 40%
7. San Francisco State University CA 586 127 50 77 22%
8. The University of Texas at San Antonio TX 244 122 39 83 50%
9. The University of Texas at El Paso TX 142 118 40 78 83%
10. The University of Texas-Pan American TX 118 109 29 80 92%
Bachelor’s Degrees Awarded to Hispanics by Academic Programs
MAY 18, 2015 | 15
RANKINGS | HISPANIC OUTLOOK

Liberal Arts and Sciences General Studies and Humanities State Total Hispanics Latino Latina %
1. Excelsior College NY 1565 144 109 35 9%2. California State University-Northridge CA 432 143 26 117 33%3. California State University-San Bernardino CA 258 133 7 126 52%4. California State University-Long Beach CA 335 132 18 114 39%5. Northern Arizona University AZ 519 131 46 85 25%6. Florida International University FL 212 130 48 82 61%7. California State University-Fresno CA 286 119 16 103 42%8. California State University-Dominguez Hills CA 202 117 17 100 58%9. Fairleigh Dickinson University-Metropolitan Campus NJ 411 107 48 59 26%10. Wayland Baptist University TX 453 92 57 35 20%
Mathematics and Statistics State Total Hispanics Latino Latina % 1. The University of Texas at El Paso TX 48 41 22 19 85%2. University of California-Los Angeles CA 305 37 21 16 12%3. The University of Texas at San Antonio TX 70 36 23 13 51%4. The University of Texas-Pan American TX 38 34 20 14 89%5. California State University-San Bernardino CA 68 32 17 15 47%6. University of California-Riverside CA 91 29 12 17 32%7. University of California-Santa Barbara CA 133 26 16 10 20%8. The University of Texas at Austin TX 234 24 14 10 10%9. University of California-Berkeley CA 298 20 16 4 7%10. San Diego State University CA 56 18 9 9 32%
University of California-San Diego CA 140 18 12 6 13%The University of Texas at Brownsville TX 21 18 10 8 86%University of New Mexico-Main Campus NM 56 22 13 9 39%
Psychology State Total Hispanics Latino Latina %
1. Florida International University FL 843 602 133 469 71%
2. University of Central Florida FL 1,250 297 67 230 24%
3. California State University-Northridge CA 686 221 62 159 32%
4. California State University-San Bernardino CA 415 204 40 164 49%
5. The University of Texas-Pan American TX 194 184 42 142 95%
6. California State University-Fullerton CA 506 183 47 136 36%
7. CUNY John Jay College of Criminal Justice NY 401 171 37 134 43%
8. San Diego State University CA 474 165 39 126 35%
9. CUNY Hunter College NY 686 151 28 123 22%
10. The University of Texas at San Antonio TX 321 147 40 107 46%
Bachelor’s Degrees Awarded to Hispanics by Academic Programs
16 | MAY 18, 2015
HISPANIC OUTLOOK | RANKINGS
Colleges for Hispanics

Social Sciences State Total Hispanics Latino Latina %
1. Florida International University FL 708 479 232 247 68%2. University of California-Riverside CA 970 387 140 247 40%3. University of California-Los Angeles CA 1,727 371 132 239 21%4. University of California-Santa Barbara CA 1,347 368 143 225 27%5. California State University-Northridge CA 840 335 98 237 40%6. University of California-Irvine CA 1,228 300 115 185 24%7. California State University-Long Beach CA 658 240 89 151 36%8. University of California-Berkeley CA 1,609 238 93 145 15%9. San Diego State University CA 759 231 114 117 30%10. University of California-Davis CA 1,264 225 93 132 18%
Engineering State Total Hispanics Latino Latina %
1. Florida International University FL 352 231 188 43 66%
2. California State Polytechnic University-Pomona CA 740 202 169 33 27%
3. The University of Texas at El Paso TX 256 201 156 45 79%
4. Texas A & M University-College Station TX 1369 187 144 43 14%
5. University of Florida FL 1038 182 140 42 18%
6. University of Central Florida FL 786 167 133 34 21%
7. The University of Texas at Austin TX 1093 147 118 29 13%
8. The University of Texas-Pan American TX 155 130 117 13 84%
9. California Polytechnic State University-San Luis Obispo CA 1118 124 99 25 11%
10. The University of Texas at San Antonio TX 256 121 107 14 47%
Visual and Performing Arts State Total Hispanics Latino Latina %
1. California State University-Long Beach CA 857 165 69 96 19%2. Columbia College-Chicago IL 1315 118 57 61 9%3. Arizona State University-Tempe AZ 739 117 58 59 16%4. Texas State University TX 426 114 42 72 27%5. California State University-Northridge CA 406 110 58 52 27%6. San Francisco State University CA 590 106 52 54 18%7. The University of Texas-Pan American TX 123 103 44 59 84%8. California State University-Fullerton CA 465 94 45 49 20%9. Florida International University FL 134 89 31 58 66%
New York University NY 1103 89 46 43 8%10. The University of Texas at El Paso TX 119 88 44 44 74%
Bachelor’s Degrees Awarded to Hispanics by Academic Programs
SOURCE: NCES, IPEDS Database 2013 total Bachelor’s Degrees Awarded to Hispanics by Academic ProgramsMAY 18, 2015 | 17
RANKINGS | HISPANIC OUTLOOK

Fifty-four Latino and African-American uni-versity sophomores and juniors gathered last summer at the University of California (UC)
at Davis School of Management to become future leaders for MBA programs nationwide. They participated in University of California’s Summer Institute for Emerging Managers and Leaders (SIEML), a program designed to help increase the number of minority students considering MBA programs. The UC Davis Graduate School of Management was home to the third year of this program, which was established by six University of California schools in 2012 to attract more mi-norities to master’s programs in business.
University of California schools have made this effort in response to the low number of minority students currently applying to, let alone attending, MBA programs nationwide. Based on the number of these students taking the GMAT, the exam required for entrance into MBA pro-grams, Hispanics currently make up 6.2 percent of potential MBA applicants, and at UC Davis alone, only one to two students out of 40 to 50 students in its full-time program are underrepresented stu-dents. (According to GMAC research, as of 2011 there were 101,436 GMAT test takers that were U.S. citizens. Of this number, 15,456 were under-represented minorities. Of all GMAT test takers,
Summer Institute
Cultivates Emerging Minority Business LeadersBy Michelle Adam
Students from the SIEML program at University of California, Davis, Graduate School of Management
18 | MAY 18, 2015
HISPANIC OUTLOOK | INNOVATIONS / PROGRAMS

only 6.2 percent are Hispanic, and 8.6 percent are African-American).
“Business schools are looking to increase the diversity of their pools,” said Kathy Gleed, orga-nizer of UC Davis SIEML and senior director of admissions and chief diversity officer for the UC Davis School of Management. “Since students look for others that look like them when they decide to apply to schools, it is important that we build the pipeline now.”
Building that pipeline is what UC Davis and the five other University of California MBA pro-grams at UC Berkeley, UC Irvine, UC Los Ange-les, UC Riverside, and UC San Diego have been doing. Their first two-week, all-expenses-paid, ca-reer-building fellowship was held at UC Berkeley in 2012, followed by UC Los Angeles, and, most recently, UC Davis. Mostly sophomores and ju-niors attend two summer intensives for two years in a row. Those students who completed their first year of the program at UC Davis this past summer will now participate in the 2015 summer program at UC San Diego.
“This is the first time that University of Cal-ifornia Schools have collaborated to expose students to the UC education, and to start them thinking of the MBA as an education that is much broader than they think,” said Gleed. “A number of business schools have programs that are similar to SIEML. We are trying to help clarify misinfor-mation and assumptions out there. We are trying to get the message across that the MBA prepares you for management and leadership in almost any industry and that you can do almost anything with an MBA.”
Last August, UC Davis hosted 24 returning students (ones who had completed the two-week UC Los Angeles program), and 30 new students. These students were selected from a pool of applicants from Hispanic-Serving Institutions (HSIs) that were primarily in California and HBCUs (Historically Black Colleges) that were mainly outside of the state. Of the 27 institutions represented last summer at UC Davis, 30 percent of students were from HSIs and the rest from HBCUs. Although only 11 the total participants were from HSIs, this was an increase from seven
the year before. The goal for SIEML is to increase Hispanic participation every year.
“The majority of the team that came to us was very professional, high-performing, and very en-gaged in the program. Some had done leadership programs and had work experience, but there was a wide range with students,” said Gleed. “We were very pleased with the majority of them.”
During the UC Davis program, students spent every other morning learning from MBA pro-fessors in mini-classes, followed by lunch with different business school deans. In the afternoon, professors provided students with case studies on ethics or similar subjects that required they work interactively. Here they focused on leadership competencies, organizational behavior, approach-es to negotiation, and marketing projects where students had to build products with rubber bands and duct tape, and propose their ideas. During dinner hours, alumni from the consulting indus-tries or other fields spoke with students about their work in the real world.
Kathy Gleed→
MAY 18, 2015 | 19
INNOVATIONS / PROGRAMS | HISPANIC OUTLOOK

On alternative days of the program, fellows went on field trips: to Silicon Valley and its Tech Museum of Innovation and Google Campus; to San Francisco and Well Fargo’s headquarters; to the California health giant, Kaiser Permanente; and other places. During these days, students met with and became inspired by top CEOS and lead-ers of prominent companies.
“When we took these students on site vis-its, they met with the president of Kaiser,” said Gleed. “Many executives like the president were impressed with the students we brought, by the questions they asked, and how they interacted with the executives.”
Toward the end of the program, students were also invited to participate in a case-study competi-tion, hosted by the financial-consulting firm, De-loitte. They were asked to work with teammates to provide solutions to business problems, which they shared on Power Point presentations shown to Deloitte executives for small cash prizes.
Meeting with companies and their leaders was an important aspect of the summer fellow-ship, especially for Luis González, a junior at the University of California at Merced. As one of 11 Hispanic students in the program, his meeting with the CEO of Kaiser Permanente left an indeli-ble impression.
“His whole story inspired most of the group to focus on our goals and live a well-balanced life,” said González, who is currently studying manage-ment and economics with an emphasis on finance and strategy. “As a CEO, he has put in as much effort and work into what he does as professional athletes do.”
González, who came to the U.S. from Mexico in the 5th grade, had attended his first year of the SIEML program at UC Los Angeles prior to going to UC Davis. He was well prepared, given that he had graduated as valedictorian from high school despite the fact that his parents had no schooling whatsoever. Their drive kept him going, and in-spired him to not only attend UC Merced and be-come president of the community council there, but to also one day build a business of his own.
Going through the SIEML program taught González the importance of working effectively with others in order to achieve his goals. “I went in thinking that the business world was really competitive and that if I wanted to get a compet-itive edge I needed to compete and do everything on my own,” he said. “The program expanded my perspective on what it takes to launch your career. You are depending on many different people to make sure your business plan goes as planned. It was important for me to understand why I need to rely on other people, and that the network you build now will help you expand your network as a business person.”
When González returned to his campus this year as community council president, he began to delegate more and build partnerships to further his plans, and became president of the Entrepre-neurship Society there.
“It was a great program. I met some bright minds and it is something I would definitely recommend to other minority students to attend. It was great to work with people from the capi-tol and politicians and alumni who are making a name for themselves and owning international businesses. I saw how even minorities can do well as long as they keep on working,” he said. “Every-one does struggle at some point, and opportuni-ties don’t come as often to minority students as they do for others who may have the help from
“ …opportunities don’t come as often to
minority students as they do for others who
may have the help from their parents to go to
college. This gave us a way to be there and network and
pursue opportunities.” Luis González, participant, UC’s Summer
Institute for Emerging Managers and Leaders
20 | MAY 18, 2015
HISPANIC OUTLOOK | INNOVATIONS / PROGRAMS
their parents to go to college. This gave us a way to be there and network and pursue opportunities.”
Ileana González, a junior at the University of Texas, San Antonio, was, like Luis González (not related to him, though), able to receive the benefits of SIEML at UC Davis this past summer. For her, though, it was the first year of the pro-gram, and because of that she didn’t know what to expect.
“I went in scared of how it would all go,” said González, who came to the U.S. from Mexico at 14 years old. “I didn’t know who I would encoun-ter and what I was going to learn, but now I can’t wait to go again this year to learn more.”
For González, the program empowered her to pursue a business major more fully (after this experience, she changed her major from interna-tional business to management and entrepreneur-ship), and showed her how she can accomplish a lot with different kinds of people.
“I learned a lot about black institutions, and how these people came to empower themselves in this nation. It empowered me to make an impact in the Hispanic community and pull through like they have,” she said. “From the MBA perspec-tive, I didn’t know much about management and focusing on different aspects of business, such as
finance. Learning this put me a step ahead of my classmates here.”
González also switched her major after re-turning from the program because she saw “so many strong and powerful people wanting to go from nothing and then creating businesses. It gave me an insight into doing my own thing and being successful at it if I am passionate about what I do,” she said. “I learned so much, and especially from being around people I’m not used to and learning about California and businesses there. This pro-gram gave me more of an incentive to go through an MBA.”
Inspiring students to pursue an MBA is a large part of why SIEML began offering these students fellowships, and why Gleed hosted this past summer’s program at UC Davis. But she also hoped to expand minority students’ views of what’s possible with an MBA.
“I don’t think they understood before that all kinds of places—nonprofits, sustainability com-panies, and many other jobs—need the expertise that MBA’s can bring,” she said. “These students have learned this, while also bonding as a group, and broadening their networks. It helped them think about things in different ways, and give an MBA some thought.” •
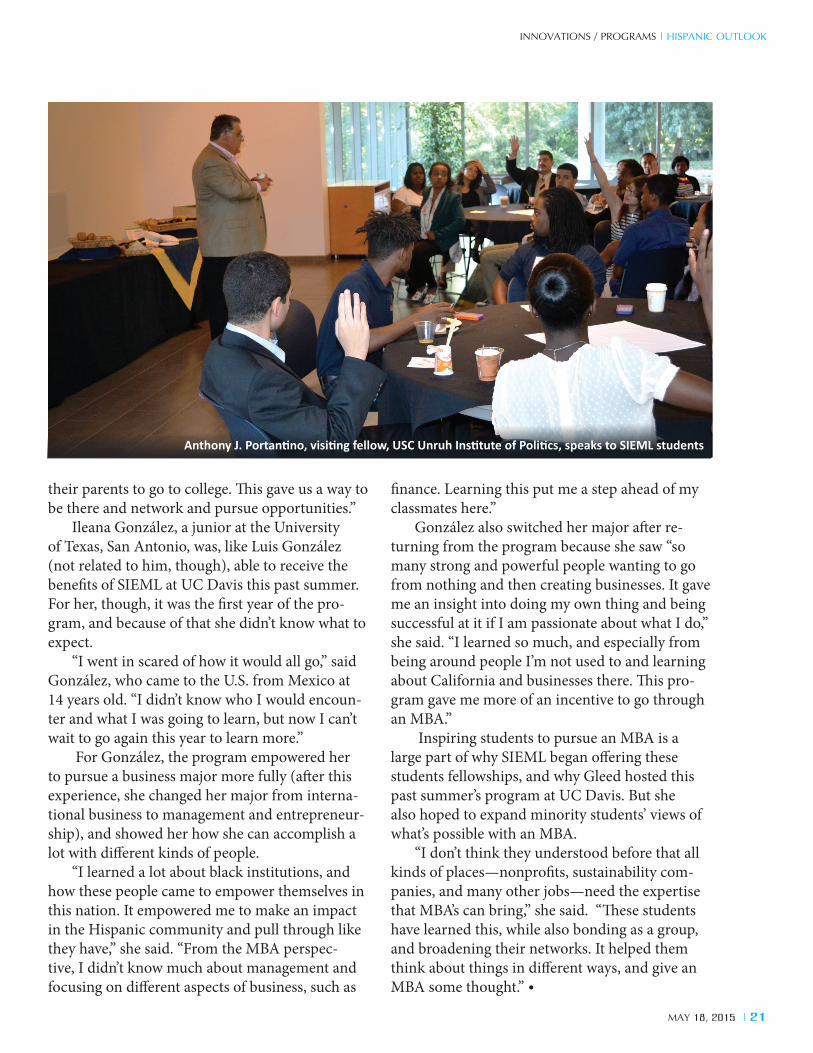
Anthony J. Portantino, visiting fellow, USC Unruh Institute of Politics, speaks to SIEML students
MAY 18, 2015 | 21
INNOVATIONS / PROGRAMS | HISPANIC OUTLOOK

22 | MAY 18, 2015
HISPANIC OUTLOOK | RANKINGS
New College GuideOffers Roadmap for
First-Generation Students
Horatio Alger peppered his novels with char-acters that pulled themselves up by their bootstraps and succeeded despite being
born into poverty. Alger’s characters embody the American Dream, yet few ascend to the highest rungs of the social later without some help from others. Like characters in an Alger novel, high school students need help, especially when choos-ing a college. Some students, however, just don’t have the support networks that others take for granted.
Jane Sweetland, EdD, a former dean at Cali-fornia State University, Channel Islands, has writ-ten The Other College Guide, a new college guide-book that walks high school students and their parents through the college selection process.
Most college guides, says Sweetland, are nothing more than prestige meters featuring col-leges that seldom take into account who they are serving and what they are teaching. U.S. News and World Report and other guides like it rank schools based on the number of students they reject and how much money they raise rather than which schools charge a fair price for an education. Her guide is different.
Sweetland and her co-author Paul Glastris of the Washington Monthly, did not specifically write The Other College Guide for first-generation, low-income students. But it seems perfectly suited for those students who do not have social support networks, encouraging them to seek help and to ask the important questions that will lead to choosing the best college for them.
Many college guidebooks, says Sweetland, as-sume a level of knowledge that most underserved students don’t have. “What we wanted was a guide that is different than that. One that doesn’t assume that the students or the parents know the rules of the game already,” says Sweetland. The difference between students who have parents or a network of people who they could ask questions of or who could support them is very different from those who don’t, she says.
Sweetland is confident that low-income His-panic high school students who have not gotten guidance from a role model or who cannot lean on a parent who has navigated the college ap-plication process can use this book to make an informed decision on where he or she should go to college. But like the characters in Alger’s nov-
By Frank DiMaria
“ What we wanted was a guide that
is different than that. One that
doesn’t assume that the students or the
parents know the rules of the game
already.” Jane Sweetland, EdD, co-author,
The Other College Guide
MAY 18, 2015 | 23
RANKINGS | HISPANIC OUTLOOK
els, no one can do it alone, she says. Everyone, no matter his or her financial situation, needs guidance and she encourages all to ask for help. “Will the book help? Yes. We wrote it in a way to give students, their families and their counselor the questions to ask. And then they need to find somebody to answer those questions,” says Sweet-land.
First-generation college students have access to higher education but they are not graduating at the same rate as their white peers. This poor graduation rate can be improved if first-genera-tion students had the resources to make a more informed decision. Sweetland’s book is one of those resources.
No matter a student’s socioeconomic status or race, a school must “fit” him or her in four ways: academically, financially, socially, and physically. Sweetland calls this the Four-Way Fit. Since the primary goal of attending a college is to earn a degree, the first “fit” a student must consider is ac-ademics. Surprisingly many fail to consider some of the most crucial aspects of academic life, like
class size. Others waste time and money applying to schools they have no chance of getting into. Right upfront a student has to know what a school requires academically, says Sweetland.
A school’s graduation rate is another key aspect the student should consider. Sweetland implores students to take a really hard look at a school’s graduation rate. Underserved students should dig especially deep into graduation rates. “Sometimes there is a differential between the graduation rate of the population at large and the graduation rate of black students, the graduation rate of Hispanic students, and the graduation of Asian students,” says Sweetland.
To allow students to dig deeper into gradua-tion rates, The Other College Guide lists a school’s graduation rate along with its graduation rate per-formance. This number considers the prepared-ness of the students the school admits based on ACT and SAT scores. The higher their test scores the better the students should perform. When students at a particular college don’t perform up to expectations set by their test scores, the school’s graduation rate performance suffers.
If a school is a good fit academically the next question a student must ask is, “Can I afford this school?” There’s little doubt that the biggest ob-stacle to a degree for underserved students is cost. Sweetland spilled a great deal of ink to ensure that those who use her book get a quality education without burying themselves in debt. Society in general, says Sweetland, is conditioned to equate cost with quality. People assume that if they are paying more for the education it must be better. However, there are a lot of great schools out there that are affordable. The Other College Guide helps students find them. It’s imperative that students consider the cost of a school along with the other criteria.
She suggests students explore available feder-al aid early in the process to avoid sticker shock when it’s time to enroll. However, since financial aid packages are not dispersed until spring, it’s hard for students to make a fully informed deci-sion on a school’s affordability until then. That’s where The Other College Guide’s “Best Bang for the Buck” section is invaluable. Students can see

Underrepresented students, Hispanics especially, should explore the support structures on campus.
Jane Sweetland, EdD→
24 | MAY 18, 2015
HISPANIC OUTLOOK | RANKINGS
the cost at each school based on their families’ income. For example the average net price for all students attending Eastern Carolina University in North Carolina - which tops the list of southeast-ern schools - is $9609. However when one factors in financial aid, students whose families earn $0 to $30K pay only $6601. Astonishingly Harvard, which Sweetland calls “an affordable elite” school in her book, charges a net price of $1,533 to stu-dents whose families earn $30,000 per year or less.
Once students find a school that is a good fit academically and financially, they must evaluate the social and physical fits. Underrepresented students, Hispanics especially, should explore the support structures on campus. “The social fit of a school is not just about what parties are going on. Social is about comfort level and belonging,” says Sweetland.
Students must also consider the school’s size and its location. Most students, says Sweetland, go no further than 100 miles from their home to attend college and over half stay in the region in which they attended high school. For many stu-dents family obligations determine how far they will travel to get their education.
To help students digest the information they gather during their search, The Other College Guide provides the Four-Way Fit Worksheet, which allows students to consider 32 factors with-in the four categories. Students write the names of the seven schools they are most interested in across the top of the worksheet and rate them in a number of categories. After totaling each section the student should have a clearer picture of the schools that fit them best.
The most popular college guides on the mar-ket today rank schools by who they don’t admit. Sweetland and Glastris see things differently. Students should not look for the schools that turn people away; they should look for those that are the best fit for their career interests, financial situation and aspirations. A student should not choose a school based on how its name looks on a hoodie but rather whether it meets his or her overall needs. “Employers are less impressed with where people go and more impressed with what people know,” says Sweetland. •

Kevin Christian→
MAY 18, 2015 | 25
FINANCE / TUITION | HISPANIC OUTLOOK
In his 2015 State of the Union speech, Pres-ident Obama proposed introducing free community college tuition for all interested and qualified students nationwide. A recent
report from the Pew Research Center noted that this plan could exert major impact on Latino stu-dents and could spark increased enrollment.
Latinos comprise 22 percent of the 7 million community college students in the U.S., exceeding the 16 percent Hispanic population in the U.S. Many Latinos opt for two-year colleges because they are cost effective, and the report noted that half of the Latinos enrolled in colleges have family incomes below $40,000.
Another incentive for Latinos has been the open enrollment policy of most two-year colleges. Approximately 46 percent of Latinos attending community college are in California and Texas, which have larger community college systems.
If passed, free community college legislation could “give more students the drive and fortitude to pursue postsecondary education. Many look at the financial aspects as a barrier,” said Kevin Christian, a senior program associate for diversity, inclusion and equity at the American Association of Community Colleges (AACC). The plan pro-vides “access and affordability,” two of the driving forces that entice students into pursuing college, he added.
This effort would serve as a stimulus for more first-generation Latino and African-American
Community College InitiativeCould Have Major Impact on LatinosBy Gary M. Stern

Cheryl Hyman →
26 | MAY 18, 2015
HISPANIC OUTLOOK | FINANCE / TUITION
students to test out higher education, Christian says. Many juggle taking care of families with handling part-time jobs and academic responsi-bilities and can feel overwhelmed. Many minority students are reluctant to amass heavy debt so this plan counteracts that fear. “Hearing that they can get their first two years at a relatively low price, virtually nothing, will raise their level of expecta-tion,” he says.
The New York Times reported that the average community college tuition for full-time students costs $3,800 a year, and 45 percent of all under-graduates attend two-year schools. It said Presi-dent Obama’s plan would increase enrollment by 1.6 million students by 2026, but it also noted that only 35 percent of full-time community college students graduate within six years.
Even if tuition is covered, there are additional costs that students face. Students must pay for transportation, books, supplies and other fees, which can quickly add up.
Under Obama’s America’s College Promise, enrolled students would receive two years free tuition at community colleges as long as they maintain a 2.5 GPA. Christian noted that the de-tails of the $60 billion education plan haven’t been determined, so it’s unclear if it covers students pursuing a certificate, not just associate’s degrees.
If the plan is authorized, community col-leges must strengthen their resources to make it successful. The colleges would need to “offer high-quality academics and make sure they help students navigate the process,” Christian noted. They would need to hire additional staff, add technology, strengthen counseling and establish a clear pathway for students to achieve a degree. In addition, many first-year minority students will need strong developmental courses to improve their reading, writing and math skills.
Moreover, helping students who graduate transfer into four-year colleges to earn a bachelor’s degree will be a critical component of the pro-gram. But Christian noted that many minority students who earn an associate’s degree “will have the drive and determination to keep going.”
The first statewide initiative that offered free community college education to high school grad-uates, Tennessee Promise, attracted over 35,000 applicants of the 60,000 graduating seniors. Tennessee Promise students must complete their FAFSA applications, attend mandatory training sessions, and performer eight hours of commu-nity service. The program is also trying to train mentors, and so far, has attracted 4,500 people and intends to add 1,500 more mentors. The pro-gram will start in the fall 2015, and students can attend any of the state’s 13 community colleges and 27 colleges of applied technology.
In Tennessee, there are no income or academ-ic restrictions; it’s open to all students. Over 1,000 high school guidance counselors were trained to help students complete the elaborate financial aid forms.
Officials in Tennessee expect that 6,000 to 12,000 additional participants will enroll in com-munity college due to the program.
Prior to President Obama’s proposal, Mayor Rahm Emanuel had already announced a plan,

MAY 18, 2015 | 27
FINANCE / TUITION | HISPANIC OUTLOOK
“the Chicago Star Scholarship, in which every Chi-cago high school student who graduates with a 3.0 GPA and possesses sufficient English and math skills will receive free community college tuition at any of the city’s seven community colleges. In addition, books are paid for and fees are waived. To prove their proficiency, students must take the ACT and obtain a score of 21 in math and En-glish.
Starting in fall 2015, the Chicago Star Schol-arship covers the difference between the ap-proximate $11,000 cost of a community college education and what a student’s federal and state financial aid pays for. Students who don’t initial-ly meet the criteria can be retested during their first year and, if they pass, can start tapping funds during the fall semester or upon completion of an associate’s degree, whichever comes first.
Mayor Emanuel has stated that the Chicago Star Scholarships enable every student “who is willing to work hard to have access to a quality education, regardless of whether they can afford it or not.” This scholarship “removes a financial bar-rier to college and gives many more students in Chicago a ticket to the middle class that a college education provides.”
The seven Chicago community colleges involved are: 1) Harold Washington College, 2) Harry S. Truman College, 3) Kennedy-King College, 4) Malcolm X College, 5) Olive-Harvey College, 6) Richard J. Daley College, and 7) Wil-bur Wright College. In 2014, over 10,000 students completed certificate programs and 4,000 were awarded associate degrees. Though the gradua-tion rate doubled, it was only a modest 13 percent in 2014.
The students attending the City Colleges of Chicago are extremely diverse. In fact, of the entire 115,000 student population, the ethnic breakdown is: 37 percent Latino students, 37 percent African- American, 16 percent white and 7 percent Asian.
City Colleges of Chicago expect to attract an additional 800 to 2,000 students during the initial year of this scholarship. It estimates that the entire program will cost about $2 million annually. City Colleges saved about $61 million
from eliminating administrative overhead and is transferring those funds to cover the cost of the Star Scholarships.
Chancellor Cheryl Hyman said in a written response, “The Chicago Star Scholarship is a mer-it-based award that rewards and aims to inspire student achievement, college-going behavior and college persistence.” It removes cost as a “barri-er” to higher education. She added that students who earn associate degrees earn “nearly $500,000 more in additional lifetime earnings than a high school diploma.” And those who earn bachelor’s degrees generate nearly a million dollars more than high school graduates.
Ultimately, America’s College Promise could transform community colleges in the U.S. and spike Latino and African-Americans enrollment. This initiative provides an “excellent way to serve historically underrepresented populations and provide support to colleges that may not have had success in working with these populations in the past. All in all, it will be a way to provide open access for education at community colleges,” AACC’s Christian said. •
If passed, free
community college
legislation could give
more students the drive
and fortitude to pursue
postsecondary education.
Many look at the financial
aspects as a barrier,” Kevin Christian, senior program associate for diversity, inclusion and equity at the American Association of Community Colleges

28 | MAY 18, 2015
Unique College Opportunity for HispanicsBy Gustavo A. Mellander
This issue of Hispanic Outlook highlights 100 colleges and universities that have a proven record of assisting Hispanics – students, faculty and other professionals. Most of those institutions have been accurately characterized as Hispanic -Serving Institutions, HSIs. That says it all. They are worthy and logical choices for Hispanic students seeking an education or for Hispanic professionals exploring career opportunities.
A Look Backward Today many Hispanic students are able to consider a variety of different colleges and thus may not fully fathom the quantum changes that have transpired. Most of those changes have been for the better. I won’t dwell on the fact that some colleges at one time did not recruit Hispanic students. A few were accepted but little was done to help them succeed once enrolled. But let’s not drift into a victim mindset. Hispanics aren’t the only group to face discrimination. Virtually every immigrant group found established colleges less than inviting. Sound research has documented that reality for such diverse groups as Italians, Irish, Swedish, Chinese and others. There was some religious marginalization as well. Catholics and other religious groups established several colleges because their students were clearly not welcomed at some old line institutions. The black college experience was different. There were a few colleges open to blacks even before the Civil War in the North. But most black colleges and universities were established after the Civil War, with significant assistance of numerous white northern religious missionary organizations. Today there are 106 historically black college and universities, HBCUs. They include public and private institutions, two-year and four-year colleges as well as medical and law schools. But establishing HBCU institutions was not enough to ensure blacks the equality they deserved. It took the 1960s Civil Rights Movement to forge state and federal legislation to secure far more open access to higher education. HBCU sustainability was significantly strengthened in 1965 with the adoption of the 1965 Higher Education Act which provided direct federal aid to “any historically black college or university that was established prior to 1964, whose principal mission was, and is, the education of black Americans.” The 1965 Act also uniquely established direct federal funding to match private endowment contributions to black institutions. Chicano Leadership Another not very well-known fact, even among scholars, is that Hispanics, specifically Chicanos, began their civil rights struggle for justice years earlier. Their successes through the courts paved the way for blacks to achieve theirs. In 1948 six years before the landmark 1954 Supreme Court
decision, a group of Chicano lawyers brought a school-discrimination case against the Texas Bastrop Independent School District to the United States Supreme Court. They prevailed. The high court ruled educational segregation of Mexican-American children was discriminatory and declared it illegal. The decision overturned past practices that had discriminated against Mexican-Americans for decades. All agree 1954 was a defining year because of the Brown v. Board of Education decision. It was a shattering judgment which passed 9-0 thanks to the determined lobbying of Chief Justice Earl Warren. He met with each justice in their chambers and pressed for a unanimous decision. Ironically, Warren had been appointed Chief Justice by President Dwight Eisenhower because of his conservative record as governor of California. He was considered safe; he would not rock the boat. But he did. The unanimous decision rejected the “separate but equal” doctrine that had guaranteed educational inequality to thousands of blacks and other children for decades on end. Two weeks earlier the same Supreme Court had decided the Hernandez v. Texas case which created a clear pathway for the evolving Chicano Civil Rights movement. That seminal decision was cited by black attorneys in their struggle through many subsequent court cases. Briefly, the facts are: a Chicano, Pete Hernandez, had been tried and found guilty of capital murder in Jackson County, Texas. His Chicano lawyers challenged the conviction on the grounds that the trial was unfair since Hernandez had been convicted by an all-white jury. Further and to the point Jackson County had long denied Mexican-Americans the right to sit on juries. Hernandez’s lawyers presented evidence showing that in the previous 25 years not a solitary Mexican- American had ever served on a single jury even though the county was nearly 16 percent Mexican-American. In contrast during that period over 6,000 white jurors had been selected. Chief Justice Earl Warren and the rest of the Supreme Court unanimously ruled in favor of Hernandez. Specifically, the court held that the 14th Amendment protects all racial classes not just blacks and whites. The rights and protection enjoyed by those was extended to all other racial groups. Hernandez was ordered retried with a jury reflecting ethnic realities. The ruling was yet another important step forward in the Civil Rights movement and a blow to racial inequality under the law. This time, a racial minority, other than blacks, benefited from such a decision. The ultimate impact of this ruling was that henceforth all racial groups would be protected under the 14th Amendment.(For more detail see: Colored Men And Hombres Aquí: Hernandez v. Texas and the Emergence of Mexican American Lawyering. Edited by Michael Olivas.) Hispanic- Serving Institutions In the 1965 Higher Education Act, no specific funding was granted institutions that served Hispanics. And that

MAY 18, 2015 | 29
is surprising for President Lyndon B. Johnson, who was determined to have that bill pass Congress, had been influenced as a young teacher by the inferior education offered Mexican-Americans. Recently released Oval Office recordings attest Johnson lobbied furiously for the bill. Two snippets provide insight into his thinking. He is recorded telling his staff that as a young man he taught in a grade school that only had Mexican- American students. He said he loved it because the children were so enthusiastic, so desirous of learning. Yet, he said, with the passage of time their enthusiasm waned. Johnson said he “saw their eyes grow dim” as they realized they would never be afforded the quality of education white folks had. Johnson said it broke his heart. At another meeting while discussing all the problems they were having while trying to get Congress to agree on the bill, Johnson asked rhetorically, “Why do we work so hard to become president?” He responded “to accomplish great things” and this education bill “can do that for poor people.”Thus it is surprising that although blacks received significant additional targeted funds in the 1965 Act, others in need as well did not. Hispanics would have to wait several decades more for equal funding.
HACU Although many groups were involved, the Hispanic Association of Colleges and Universities (HACU), led a successful effort in 1992 to secure congressional approval to formally support campuses with significant Hispanic enrollments. Federally designated HSIs began to receive specific federal appropriations. How is a college designated a Hispanic- Serving Institution? Interestingly it is not predicated on an institution’s mission. It is granted to any college or university whose student body is 25 percent (full-time equivalent) or more Hispanic. That is the only criteria. The number of Hispanic- Serving Institutions increases every year as more and more Hispanics pursue higher education. Today there are 409 HSIs, up from 189 in 2004, more than a doubling in 10 years. They receive significant grants which can be used for many academic purposes serving all ethnicities at the institution. They include funds for faculty development, creation and improvement of academic programs, curriculum development, scientific and laboratory equipment, academic tutoring, counseling and other student support services. Excelencia in Education - a Washington, D.C. research and advocacy organization compiles and publishes accurate data about many facets of Hispanics and higher education. In a recent fact-laden report predicated on 2013-14 academic year data Excelencia reported the existing 409 HSIs serve 1.6 million undergraduates. That’s 60 percent of all Hispanic undergraduate students. This latest compilation, available on Excelencia’s homepage, also notes that HSIs represent 12 percent of higher education institutions. Of the 409 HSIs, 203 are two-year colleges and 206 are four- year institutions. In the past decade there has been a significant increase of four-year colleges. Where are HSIs? They are located in 21 states and Puerto Rico. Surprisingly some are located in states such as Washington, Kansas and Indiana which are not known for their Hispanic populations. But the vast majorities are in California, Texas, Puerto Rico, New Mexico, Florida and New York. The top eight states house 80 percent of the nation’s HSIs. Some HSIs offer graduate programs as well and enroll 38 percent of all Hispanics graduate students.
HSIs and HBCUs Institutions In a desire to present accurate data about HSIs and HBCUs institutions to policymakers and others, Excelencia in Education and the United Negro College Fund analyzed both cohorts. Studying and publishing the commonalities between these two groups can be helpful, it is hoped, in raising general awareness about Hispanic and black students and the institutions that serve them. Although HBCUs and HSIs only represent 20 percent of all higher education institutions in the nation, they educate nearly half of all black and Hispanic students, many of whom are low-income and first-generation college attendees. Both HSIs and HBCUs are positioned to help increase the country’s overall college completion rate. In 2012-13, half of HBCUs (50 percent) and most HSIs (68 percent) were public institutions. In terms of gender distribution, more women than men attend each group of colleges. Most recent statistics show HBCUs institutions had 60 percent female vs. 39 percent male. For HSIs, the distribution was 58 percent female vs. 40 percent male.
Should Hispanics Be Encouraged To Attend HSIs? Seems like a no-brainer, but as is true in many situations, there are two camps. A minority, including some Hispanics, answers “no.” They argue that since Hispanic students upon graduation will probably enter an Anglo- dominated world, in the private or public sector, it behooves them to study in a non-Hispanic environment so as to better make the transition upon graduation. In short, they contend it is best to mainstream Hispanics as early as possible. That’s really a weak argument since Hispanics are in a minority at HSIs colleges. They interact of necessity with non-Hispanics every day. Further, classes and research are conducted in English. Others voices cool on HSIs feel that HSIs are not as academically rigorous as mainline colleges, that the education experience offered is not of the highest quality and thus Hispanics will be at a disadvantage when they graduate. But the successes of thousands of HSIs graduates belie that assertion. I have studied and reflected on these criticisms. My research and personal experiences show clearly they are without foundation.
Bottom Line The truth is that Hispanic students attending HSIs can receive a solid education. An additional benefit is that some of their classes will be taught by successful Hispanics who were in their shoes just a few short years before. Hispanic counselors and other professionals help create a hospitable supportive environment. Similar backgrounds, shared experiences and a desire to have students succeed make HSIs a particularly logical choice for Hispanic students to consider. Attending college is an adventure. It is also stressful for most students, particularly for those who are the first in their families to attempt college. Therefore, to be able to attend a college with a student body that is at least 25 percent Hispanic and with a good sprinkling of Hispanic faculty is an opportunity not to be underestimated. Seize it! •
Dr. Mellander was a university dean for 15 years and a college president for 20.

30 | MAY 18 2015
ADJUNCTS ORGANIZINGFeb. 25 marked the first “National College Adjunct Walkout Day.” In California, Arizona and some other states, non-tenured part-time college faculty marched and demonstrated to “call attention to their low pay and tenuous working conditions.” As the nation’s middle class increasingly depends on community and state colleges for their children’s post-secondary education, the plight of the majority of professors at these institutions is being noticed. Part-time adjuncts teach the courses all students depend on, but often have to work out of their cars and meet their students in the cafeteria because they have no offices. Most adjuncts get no benefits. Many teach in multiple institutions but still earn far less than tenured faculty who teach only two or three classes a semester on one campus with full benefits. Adjuncts have to pay for their own training on new equipment and substitute for the full-time faculty at far less pay when the FTers take off for paid sabbaticals and conferences. When an adjunct develops a popular course, it is almost always grabbed by the full-time faculty the next year. Public service unions are conflicted about representing adjuncts along with the full- time faculty. There is no equality. But the Service Employees International Union has begun a campaign demanding adjuncts be paid $15,000 per course - up from just a few thousand dollars on most campuses.
TITLE IX PROHIBITS SEX DISCRIMINATION; THAT INCLUDES LOVEYou never know how these discrimination laws are going to evolve, but this one is making news. Title IX is the landmark ruling that allowed women’s sports to flourish, since schools and colleges were no longer allowed to offer more athletic opportunities to boys than to girls (with the exception of the football industry of course) on the basis of sex discrimination. But now Harvard University has used Title IX to make explicit, in writing regulations that no romantic relationship between a faculty member and a student is allowed because it is deemed to be “sex discrimination” in an unequal relationship.
CIS ACCUSED OF FAVORING DREAMers OVER LEGAL IMMIGRANTSThe Republicans took over the Senate this year and little differences are apparent already. Some subcommittees have been renamed. For example: the Senate Judiciary subcommittee that deals with immigration legislation used to be called by Democrats the “Immigration, Refugees and Border Security” committee. Now it’s been renamed the “Immigration and the National Interest” committee. On March 3, its new chairman, Jeff Sessions of Alabama, put the Citizenship and Immigration Services (CIS) bureau of the Department of Homeland Security (DHS) on the hot seat. The CIS is the most benign of all the immigration departments in that it doesn’t do enforcement. Its mission, unlike the rest of the DHS, is service. Its priority is the naturalization of permanent legal resident (PLRs - better known as green card) holders. It also manages numerous integration services for naturalized citizens and immigrants in the country. Most of its operating revenue comes from fees charged for its “services.” But it has too small a staff to handle the huge backlog of applications for citizenship. On top of that, President Obama charged CIS with vetting all applications for his DACA (Deferred Acton for Childhood Arrivals - better known as DREAMers) and DAPA (Deferred Action for Parents of Americans) programs. Those are the infamous executive action programs that would grant some 7 million immigrants living in the U.S. illegally not only temporary waivers from prosecution and deportation, but also give them work permits as well. But the applications have to be reviewed on a case-by-case basis. Sessions and Sen. Chuck Grassley, R-Iowa, accused (CIS) of changing their priorities away from legal immigrants to illegal immigrants. During questioning, CIS officials admitted that because of the heavy caseload, DACA requirements had been loosened to exclude high school and GED documents. “Even members of gangs will be admitted,” Grassley said. CIS witnesses acknowledged that a million dollar rented facility in Chrystal City to house hundreds of new DACA employees stood empty; only one person has been employed by March.
BE GLAD YOU’RE NOT A TEACHER IN FRANCENew rules in France, a country already struggling with immigrant integration, will require teachers to “talk with parents and possibly take disciplinary action if students are seen as disrespecting French values.” How’d you like to have to do that? •
Margaret (Peggy Sands) Orchowski was a reporter for AP South America and for the United Nations in Geneva, Switzerland. She earned a doctorate in international educational administration from the University of California-Santa Barbara. She lives in Washington, D.C., where she was an editor at Congressional Quarterly and now is a freelance journalist and columnist covering Congress and higher education.
By Margaret Orchowski

My interest in the history of Mexican immi-gration from race, ethnic, class, gender, and legal perspectives developed from my early under-standing of immigration law through my own family’s complex legal status and my advocacy for immigrant rights. An interest furthered devel-oped through my current dissertation work on the Mexican repatriation and banishment of U.S. citizen children during the Great Depression era, early 1920s-1940s. Ultimately, I plan to work at a Research One institution to continue research-ing and teaching Chicana and Chicano Studies through a legal history lens.
I arrived from Zamora, Michoacán, Mexico to East Los Angeles, California, at the age of 14 with no English skills and no knowledge of the U.S. culture or its academic systems. A year later, my family moved to North Long Beach, California, where I attended Jordan High School. Unfortu-nately, my parents separated during my transition from Cerritos Community College to the Universi-ty of California, Los Angeles, making me the head of the household at an early age. I had to quickly learn to juggle academic and family responsibili-ties and excelled in both; largely thanks to men-tors and outreach programs such as the Scholars’ Honors Program at Cerritos Community College and the McNair Scholars Program at Claremont Graduate University.
In fact, the McNair Scholars Program first introduced me to the American Association of Hispanics in Higher Education in 2007 when they hosted me as a conference attendee. The same program provided the needed tools to transition into a PhD program. Now, as a doctoral candidate at the University of California, Santa Barbara, in the department of Chicana and Chicano Studies, I am finalizing my dissertation under the super-
vision of my co-chairs, professors Inés D. Casillas and Miroslava Chávez-García, and plan to defend and file the dissertation in June 2015.
As I prepare to transition into an assistant pro-fessorship, I am fortunate to have been part of yet another mentoring program as a 2014 AAHHE fellow. AAHHE creates a pipeline for first-gen-eration Latina/o students such as myself and facilitates our transition into different realms of academia. My participation in AAHHE reassured my passion for academia and opened new alter-natives I had never considered possible before. Latina women university presidents inspired me as I listened to their experiences in panels, Q&A sessions, and one-on-one conversations. Now I aspire to ascend into administrative positions later in my academic career. AAHHE created a network of friends, colleagues, mentors, and role models that is extremely crucial for underrepre-sented groups in higher education.
My personal experiences, supported by men-torship programs such as AAHHE, have motivated my research questions and long-term academic interests. My lived experiences, paired with my sense of social justice and love for the history of immigration law, engrained in me an intense ac-ademic interest. My doctoral degree has allowed me to pursue my immigration history research interests by examining the prolonged conse-quences of Mexican repatriation and U.S. citizen children’s banishment. I examine a historical event with current ramifications on three family generations. My archival research, oral histories, and legal analyses help us better understand the history of complex Mexico-U.S. migration rela-tions and its prolonged consequences, crucial to better understand current immigration debates today.•
From the Scholars’Corner
By Marla Andrea Ramírez, Doctoral Candidate, Department of Chicana and Chicano Studies University of California, Santa Barbara 2014 Graduate Fellow
MAY 18, 2015 | 31

Immigrants and Boomers: Forging a New Social Contract for the Future of America by Dowell Myers 2008. 362 pp. ISBN: 978-0871546241. $17.95 paper. Russell Sage Founda-tion, (212) 750-6000. New York, N.Y. 10065. www.russellsage.org/
On a recent visit to the nation’s capitol I visited the Newseum, a museum devot-ed to news events and media coverage throughout history. What struck me was the attention that was devoted to the Boomer generation. The news coverage of this demographic group began in the 1970s when news magazines forecast the dominance of this age group decades in the future. These forecasts were not wrong.
In the same 30-year span the other demographic attracting attention has been the massive influx of immigrants. While Boomers dominance was viewed with a collective shrug, massive immigration has been greeted with great anxiety, fearing new burdens and unwanted changes to the nation’s ethnic, social, and economic identity.
In the new book, Immigrants and Boomers, sure to stimulate discussion and debate demographer Dowell Myers proposes a new way of thinking about these issues and argues that each of these two powerful demographic shifts may hold the keys to resolving the problems presented by the other.
Using California as its bellwether state because it is representative of a place where whites are no longer a majority of the population and represent just a third of residents under age 20, Myers demonstrates how immigration will impact that population and become the blueprint for other states to follow. Drawing on de-tailed census data, Myers demonstrates that long-es-tablished immigrants have been far more successful than the public believes. Among the Hispanics who make up the bulk of California’s immigrant population, those who have lived in California for over a decade show high levels of social mobility and use of English, and 50 percent of Latino immigrants become home-owners after 20 years.
The progress made by immigrant families represents a reasonable argument suggesting that these families will be able to fill up the workforce as Boomers re-tire. Without an influx of younger workers the pool of middle-class taxpayers would shrink, endangering entitlement expenditures to Boomers. In addition, as retirees sell off their housing assets, the prospect of a generational collapse in housing prices looms. My-ers suggests that it is in the Boomers’ best interest to invest in the education and integration of immi-grants and their children in order to bolster the ranks of workers, taxpayers, and homeowners that America will depend on 10 and 20 years from now.
In short, Myers uses this book to call for a new social contract between the older and younger generations, based on their mutual interests and the moral respon-sibility of each generation to provide for children and the elderly.
Reviewed by Mary Ann Cooper
Diversity Explosion: How New Racial Demographics are Remaking America by William H. Frey America has been known as the world’s melting pot. Today it is on the cusp of be-coming a country with no racial majority. The concept of a “minority white” may instill fear among some Americans, but William H. Frey, the man behind the demographic re-search, points out that demography is des-tiny, and the fear of a more racially diverse nation will almost certainly dissipate over time.2014. 224 pp. ISBN: 978-0815726494. $24.00 paper. Brookings Institution Press, www.brookings.edu/about/press, Washington, D.C., (202) 536-3600.
Dog Whistle Politics: How Coded Racial Appeals Have Reinvented Racism and Wrecked the Middle Class by Ian Haney López In Dog Whistle Politics, Ian Haney López of-fers a sweeping account of how politicians and plutocrats deploy veiled racial appeals to persuade white voters to support policies that favor the extremely rich yet threaten their own interests. Haney López links as never before the central themes that dom-inate American politics today. Dog Whistle Politics will generate a lively and much-needed debate about how racial politics has destabilized the American middle class - white and nonwhite members alike.2014. 304 pp. ISBN: 978-0199964277. $24.95 cloth. Ox-ford University Press, New York, N.Y. (800) 445-9714. www.global.oup.com/
The American Dream and the Public Schools by Jennifer L. Hochschild and Nathan Scovronick The authors show how policies to promote individual success too often benefit only those already privileged by race or class, and often conflict with policies that are in-tended to benefit everyone. They propose a framework that builds on our nation’s rap-idly changing population in order to help Americans get past acrimonious debates about schooling. Their goal is to make pub-lic education work better so that all children can succeed.2004. 320 pp. ISBN: 978-0195176032. $19.95 paper. Oxford University Press, New York, N.Y. (800) 445-9714. www.global.oup.com/
32 | MAY 18, 2015
THE BEST PLACE IN
L.A. TO SEE STARS
RIS
E
This is where individuals rise
and through them we all do.
See how CSUN graduates impact
the region at CSUN.EDU/RISE
MAY 18, 2015 | 33

FAMILIA IT’S AT THEHEART OF EVERYTHING WE DO.txstate.edu
Texas State University, to the extent not in conflict with federal or state law, prohibits discrimination or harassment on the basis of race, color, national origin, age, sex, religion, disability, veterans’ status, sexual orientation, gender identity or expression. Texas State University is a tobacco-free campus.15-413 4/29
34 | MAY 18, 2015

Committed to student success and providing an exceptional educational experience, California State University, Fullerton is proud of its record supporting Hispanic student achievement in higher education.
· Ranked first in California and consistently among the top 10 in the nation for the number of bachelor’s degrees awarded to Hispanic students 1
· Among the top institutions graduating Latino students entering the health professions 2
· Recognized as a “Best Bang for the Buck” university 3
“Incredible things happen when we truly reach higher – to transform lives and help students graduate into a diverse world and reach their dreams.” – President Mildred García
Committed to StUdeNt SUCCeSS
1 Hispanic Outlook in Higher Education (May 2015) 2 Excelencia in Education “Finding Your Workforce: In Health” (May 2015)3 Washington Monthly (October 2014) TITANS REACH HIGHER
MAY 18, 2015 | 35

Annual Biomedical Research Conference for Minority Students (ABRCMS)
ABRCMS advances undergraduates and postbaccalaureates from underrepresented populations, including those with disabilities, in science, technology, engineering and mathematics (STEM) along the path toward graduate-level training. The conference features 1,700 poster and oral presentations, scientific sessions, professional development and networking sessions, and approximately 325 exhibit booths showcasing summer research and graduate school opportunities.
facebook.com/abrcms
Washington State Convention Center • Seattle, WA • November 11-14, 2015
2014 ABRCMS Attendees by Location
FL
NM
HI
PR Guam VirginIslands
AK
DEMD
TXOK
KS
NE
SD
ND
MT
WY
CO
UT
ID
AZ
NV
WA
CA
OR
KY
ME
NY
PA
MI
VT NH
MA
RICT
VA
WV
OHINIL
NC
TN
SCALMS
AR
LA
MO
IA
MN
WI
NJ
GA
DC
Attendees
300 +
200 – 299
100 – 199
50 – 99
25 – 49
1 - 24
Important DeadlinesAbstract Submission: ....................................September 11, 2015Travel Award Application: ...........................September 11, 2015Judges’ Travel Subsidy Application: ..........September 25, 2015Discount Registration: ..................................October 19, 2015
For more information, please visit: www.abrcms.org.
twitter.com/abrcms [email protected] Managed by:
2014 Distribution of Scientific Disciplines
Biochemical - 855 (11%)
Cell Biological - 885 (11%)
Chemical -487 (6%)
Molecular - 496 (6%)
Microbiological - 800 (10%)
Neuroscience - 669 (8%)Physiological - 389 (5%)
Physical Sciences & Mathematics - 362 (5%)
Social & Behavioral Sciences & Public Health - 463 (6%)
Developmental Biological - 588 (7%)
Immunology - 562 (7%)
Cancer Biology - 681 (9%)
Unspecified - 710 (9%)ABRCMS Registration
2001 2005 2010 20140
1000
2000
3000
4000
Undergrads/PostbacsGrads/Postdocs
Non-Students
2014 Abstract Submissions by Education Level
GraduatesUndergrads/Postbacs0
500
1000
1500
2000
Sophomore
Junior
Senior
Postbac
Masters
Doctoral
“It was a great opportunity to see the extraordinary research being conducted in the country and also to encourage and offer thoughtful advice to the future scientists.”
Faculty/Judge
“Attending and winning in my category was one of the best experiences in my scientific life. Coming from my background, I doubted myself in the past. I now feel confident because when I presented my poster I left like I belonged. This conference really made me believe that I can pursue a career in science.”
Student
36 | MAY 18, 2015
For more information visitWWW.TTU.EDU/DIVERSITY
From here, it’s possible. Desde aquí, es posible!
“...one of seven schools that empower women.”
– AMERICAN ASSOCIATION OF UNIVERSITY WOMEN (AAUW)
“…a national leader in recognizing and commemorating our nation’s veterans.”
– MILITARY ORDER OF THE PURPLE HEART
“...outstanding achievements in promoting diversity in the workforce.”
– CHAMPION OF DIVERSITY AWARD (AMERICAN ASSOCIATION OF AFFIRMATIVE ACTION)
“…demonstrated an outstanding commitment to diversity and inclusion.”
– INSIGHT INTO DIVERSITY HEED AWARD (2012-2014)
MAY 18, 2015 | 37
ANGELES / ALMASSpring 2015 NYC Season at BAM FisherMay 19 - 24, 2015Company's BAM Debut Features Two Programs, Three World Premieres
FLAMENCO VIVO CARLOTA SANTANA presents
Please Join Us:Program A
Tuesday, May 19, 2015 at 7:30pmWednesday, May 20, 2015 at 7:30pm
Thursday, May 21, 2015 at 7:30pmProgram B
Friday, May 22, 2015 at 7:30pmSaturday, May 23, 2015 at 2pm and 7:30pm
Sunday, May 24, 2015 at 2pm RSVP for press tickets to
Michelle Tabnick, [email protected]

HUNTER COLLEGE
FINANCE CONTROLLER Job Opening ID: 12735
Hunter College of the City University of New York seeks qualified applicants forFinance Controller for the Business Office. This position reports directly to theExecutive Director of Finance and Business Operations. The Controller is responsiblefor managing and directing the Accounting Office, Office Services and the RevenueAccountability Department of the College. In addition to the general duties, theController will be responsible for coordinating financial analysis of various specialactivities and programs of the College. The Controller will oversee the non-taxbudgets of various entities and manage the endowed and restricted accounts toensure that they are spent in accordance with the donors' restrictions. Under thedirection of the Executive Director of Finance and Business Operations, theController will work on special projects and handle day to day problem solvingand trouble shooting in support of school-wide initiatives. A Bachelor's degree inAccounting, Finance or a business discipline is required, a CPA is preferred.Knowledge of Oracle PeopleSoft is preferred.
Salary commensurate with qualifications and experience.
Applications must be submitted on-line by accessing the CUNY Portal on CityUniversity of New York job website (http://www.cuny.edu/employment.html) andfollowing the CUNYfirst Job System Instructions. Current users of the site should access their established accounts; new users should follow theinstructions to set up an account. To search for this vacancy, click on Search JobListings, select More Options To Search For CUNY Jobs and enter the Job OpeningID number 12735. The required material, as stated on the CUNYfirst vacancynotice, for the application package must be uploaded as ONE file in .doc, .docx,.pdf, .rtf, or text format. Incomplete applications will not be considered. Hunter College/CUNY is committed to enhancing our diverseacademic community by actively encouraging people withdisabilities, minorities, veterans, and women to apply. Wetake pride in our pluralistic community and continue to seekexcellence through diversity and inclusion. CUNY is anAA/EO/IRCA/ADA Employer.
56178 CUNYHispanic Outlook3.625” X 4.755.11.15P 2
HUNTER COLLEGE
STUDENT CAREER PROGRAM MANAGER Career Development Services, Division of Student Affairs
Job Opening ID: 12799GENERAL DUTIES • Develops and manages career development programs and services in a College of Unit and assumes a leadership role
in the design and delivery of creative approaches to career education and planning. • Assists in unit planning, such as setting goals and objectives, and monitors status of progress toward meeting goals• Designs and produces outcomes assessment reports; reviews outcomes and feedback and recommends strategies to
expand and improve services.• Directs a portfolio of targeted career programs, such as mentoring, internship, and alumni programs• Manages one or more aspects of career office operations, such as on-campus recruiting• Evaluates new technologies, assessment materials, and other career tools, makes recommendations, and
acquires/implements them• May counsel a limited number of students• Performs related duties as assigned.FLSA Exempt CAMPUS SPECIFIC INFORMATION • Reporting to the Director of Career Development Services, the responsibilities of the Student Career Program Manager
include, but is not limited to:• Managing career office operations such as the on campus Recruiting Program, Career Expos, Senior Programs.• Working with Associate Director to develop new employer relationships for the development of internship and job
opportunities for students and alumni. Maintaining strong employer relationships with both new and existing partners.• Assessing programs, writing reports, reporting outcomes, and making recommendations to the Director.• Collaborating with other academic and administrative units to promote the goals of the office.• Performing related duties as assigned. QUALIFICATIONS • Bachelor's Degree and six years' related experience required. • Master's degree in higher education, or related field preferred.• 5 or more years of proven work experience in field of higher education.• Knowledge of current labor trends and recruitment. SALARY commensurate with qualifications and experience.HOW TO APPLY: Applications must be submitted on-line by accessing the CUNY Portal on City University of New Yorkjob website (http://www.cuny.edu/employment.html) and following the CUNYfirst Job System Instructions. Current usersof the site should access their established accounts; new users should follow the instructions to set up an account. Tosearch for this vacancy, click on Search Job Listings, select More Options To Search For CUNY Jobs and enter the JobOpening ID number. The required material, as stated on the CUNYfirst vacancy notice, for the application package mustbe uploaded as ONE file in .doc, .docx, .pdf, .rtf, or text format. Incomplete applications will not be considered.
The search will remain open until the position is filled. Hunter College/CUNY is committed to enhancing our diverse academiccommunity by actively encouraging people with disabilities, minorities,veterans, and women to apply. We take pride in our pluralistic communityand continue to seek excellence through diversity and inclusion. CUNYis an AA/EO/IRCA/ADA Employer.
56179 CUNYHispanic Outlook3.625” X 4.755.11.15P 2
HUNTER COLLEGE
CLINICAL PROFESSORCHEMISTRY
Job Opening ID: 12596 The Chemistry and Biochemistry Department seeks an outstanding teacher with leadershippotential to fill a clinical professor position in General Chemistry or other areas of chemistry.Duties include teaching large and small lectures, especially in undergraduate GeneralChemistry. A dynamic leader of the department's educational initiatives, such ascoordinating the team of lecturers, improving teaching innovations and laboratories.Clinical Professors are experienced teachers and are appointed on a full-time, non-tenurebearing faculty titles. This is a one-year term appointment with the possibility of annualrenewals based on satisfactory performance but may not serve in the title for more thana total of seven years. Experience in teaching large classes and innovative use of technologyis preferred. Bachelor's degree and a record of achievement in a profession or field of expertise relatedto teaching assignments. Also required is the ability to cooperate with others for thegood of the institution. Ideal candidate will have a Ph.D. in Chemistry. A demonstratedinterest in chemical pedagogy at the college level. Ability to work with and instruct aculturally diverse student population.Salary commensurate with qualifications and experience ($40,844-$97,000). HOW TO APPLY: Applications must be submitted on-line by accessing the CUNY Portalon City University of New York job website (http://www.cuny.edu/employment.html)and following the CUNYfirst Job System Instructions. Current users of the site should access their established accounts; new users should follow the instructions to set up an account. To search for this vacancy, click on Search Job Listings, selectMore Options To Search For CUNY Jobs and enter the Job Opening ID number. Therequired material, as stated on the CUNYfirst vacancy notice, for the application package must be uploaded as ONE file in .doc, .docx, .pdf, .rtf, or text format. Incompleteapplications will not be considered.
The search will remain open until the position is filled. Hunter College/CUNY is committed to enhancing our diverse academiccommunity by actively encouraging people with disabilities, minorities,veterans, and women to apply. We take pride in our pluralisticcommunity and continue to seek excellence through diversity andinclusion. CUNY is an AA/EO/IRCA/ADA Employer.
56180 CUNYHispanic Outlook3.625” X 4.755.11.15P 2
HUNTER COLLEGE
LECTURER DOCTORAL SCHEDULE(GENERAL CHEMISTRY) - CHEMISTRY
Job Opening ID: 12557 The Chemistry and Biochemistry Department seeks an outstanding teacher withleadership potential to fill a lecturer position in General Chemistry or other areasof chemistry. This is a full-time nine-month position. Duties include teaching largeand small lectures, overseeing and assisting adjunct lecturers, and working withthe laboratory staff to co-ordinate the laboratory program, in undergraduate GeneralChemistry. This is a one-year term appointment with the possibility of annualrenewals based on satisfactory performance. Experience in teaching large classesand innovative use of technology is preferred.
QUALIFICATIONS: Ph.D. in Chemistry or related field. A demonstrated interest inchemical pedagogy at the college level. Ability to work with and instruct a culturallydiverse student population.
Salary commensurate with qualifications and experience.
HOW TO APPLY: Applications must be submitted on-line by accessing the CUNYPortal on City University of New York job website (http://www.cuny.edu/employment.html) and following the CUNYfirst Job System Instructions. Currentusers of the site should access their established accounts; new users should followthe instructions to set up an account. To search for this vacancy, click on SearchJob Listings, select More Options To Search For CUNY Jobs and enter the JobOpening ID number. The required material, as stated on the CUNYfirst vacancynotice, for the application package must be uploaded as ONE file in .doc, .docx,.pdf, .rtf, or text format. Incomplete applications will not be considered.
The search will remain open until the position is filled. Hunter College/CUNY is committed to enhancing our diverse academiccommunity by actively encouraging people with disabilities, minorities,veterans, and women to apply. We take pride in our pluralistic communityand continue to seek excellence through diversity and inclusion. CUNYis an AA/EO/IRCA/ADA Employer.
56181 CUNYHispanic Outlook3.625” X 4.755.11.15P 2
38 | MAY 18, 2015

UC Santa Barbara, a premier research university with an outstanding fac-ulty and talented and diverse student body, is distinguished by its world-class programs, and commitment to innovation. The University serves morethan 21,500 students, including approximately 3,000 graduate students.Academic units on campus include the College of Letters and Science—the largest with more than 17,000 undergraduates and 2000 graduate stu-dents, the College of Engineering, the College of Creative Studies, and twoprofessional schools: the Bren School of Environmental Science & Man-agement and the Gevirtz Graduate School of Education. Because teachingand research are integrated at UC Santa Barbara, students are full partici-pants in an educational journey of discovery that stimulates independentthought, critical reasoning, and creativity.
The Associate Vice Chancellor for Information Technology and Chief In-formation Officer (AVC/CIO) is a senior campus leadership position re-sponsible for developing an institutional focus on informationtechnologies that advance the mission and strategic goals of UC SantaBarbara. The AVC/CIO will have oversight for all IT activities that con-tribute to planning, creating, and implementing a campus-wide IT vision,and for integrating them into UCSB’s strategic plan. The campus is inthe process of augmenting the staff and budget for the newly created En-terprise Technology Services (ETS) unit, and related units, in order to im-plement UC-wide payroll systems and modernize campus financial,time-keeping, calendaring, and e-mail systems.
The AVC/CIO will be an innovative and collaborative visionary who willmanage the newly created Enterprise Technology Services (ETS) unit, as-suring effective organizational operations, practices, standards, planning,and development. He/she will also be responsible for the design, devel-opment, release, and maintenance of enterprise technology systems andenterprise services. This will be accomplished by collaborating and co-ordinating with IT units and organizations on campus; working and con-sulting with IT governance structures (IT Board and IT Council);executive and academic leaders as well as with faculty, staff and students;building strong relationships with senior university leadership and keystakeholders; driving innovation and differentiated IT strategy; and im-proving the business services associated with IT. Additionally, theAVC/CIO will represent the university externally and will work with Uni-versity of California system-wide IT, financial, and business offices to co-ordinate local implementations with UC-wide enterprise systems.
Qualifications & Experience: Significant leadership experience in IT, busi-ness, and/or related work ideally gained within a higher education envi-ronment. A track record of success in managing and working closely withmultiple, large, cross-functional teams or projects, and influencing andconsulting with senior-level management and key stakeholders. Capableof developing, communicating and obtaining broad support for a visionfor the present and future role of information technology in higher educa-tion and of understanding how advancements in information technologywill yield competitive advantages to the university. Demonstrated abilityto successfully conceptualize, launch, and deliver multiple IT projects thatmeet campus objectives on time and within budget, especially within adecentralized environment. Bachelor's degree in related field; or equiva-lent work experience. Advanced degree preferred.
Initial screening of applicants will begin immediately, and continue until theposition is filled. The University of California, Santa Barbara will be assistedby Michelle Bonoan, Matt Aiello and Tracie Smith of Heidrick & Struggles,Inc. Nominations and applications should be directed to:
University of California, Santa Barbara Search Committeec/o Heidrick & Struggles, Inc.
11100 Santa Monica Boulevard, Suite 200Los Angeles, CA 90025
(404) 682 [email protected]
The University of California is an Equal Opportunity/Affirmative Action Employer. All qualified applicants will receive consideration for employment
without regard to race, color, religion, sex, sexual orientation, gender identity, national origin, disability, or protected veteran status.
Associate Vice Chancellor for Information Technology and Chief Information Officer
Hispanic Outlook1/2 pageIssue 5-4-15Deadline 4-23-15
The State University of New York has initiated an international search for aninnovative and highly collaborative academic medical center leader to serve as thenext President, SUNY Upstate Medical University, located in Syracuse, NY.Upstate’s next President will be responsible for guiding the continued growth anddevelopment of SUNY Upstate Medical University’s highly respected clinical,education and research enterprises, taking full advantage of SUNY’s extraordinaryfaculty and resources. Upstate, the only AMC and the largest employer in CentralNew York, is composed of Upstate University Hospital and four colleges: GraduateStudies, Health Professions, Nursing, and the College of Medicine. UniversityHospital, the teaching hospital of the College of Medicine and a division of Upstate,has grown to 715 licensed beds on two campuses offering tertiary and quaternaryservices to patients of the 17 counties that comprise the Central New York region.The ideal candidate will have an M.D. and/or Ph.D. degree and have served in anexecutive role in a college of medicine or university or hospital.Korn Ferry is assisting Upstate Medical University with this important search. Pleaseforward your CV or nominations of highly qualified candidates to:
John Ferry, M.D.c/o Tricia Porter
([email protected])At SUNY Upstate Medical University we strive to promote a professional environment that
encourages varied perspectives from faculty members with diverse life experiences. A respect fordiversity is one of our core values. We are committed to recruiting and supporting a rich
community of outstanding faculty, staff and students. We actively seek applications from womenand members of underrepresented groups to contribute to the diversity of our university
community in support of our teaching, research and clinical missions.
PRESIDENTSyracuse, New York
Hispanic OutlookIssue 5-18-15Deadline 4-23-151/4 page
HispanicOutlook
VisionDeans
Language
Students Media
People
Higher EdCommitmentcollege
Affirmative Action
Campus
Businessethnicity
Academics
Admissionscommittees
Opportunity
WebsiteReports
Top 100
Enrollment
administrators
Digital
Leadership
Rankings
equality
Minorities
Multicultural
immigrationEducationalFaculty
Heritage
representation
Curriculum
BrandingInteresting Reads
OrganizationsLatino’s
advertising
students
Job Search
university
diversity
Community Colleges
Book Reviews
mentoring
health
Latina’s
tuition
Headlines
gender
Arts
recruitment
Difference
MAY 18, 2015 | 39

The University of Texas Health Science Center at San Antonio School of Medicine and the Regional Campus of the UT Houston School of Public Health
Associate Dean, MD/MPH ProgramThe University of Texas Health Science Center at San Antonio School of Medicine and the Regional Campus of the UT Houston School of Public Health seek a director for their San Antonio based MD/MPH Program. The successful candidate will provide vision, strategic planning, and oversight for the MD/MPH dual degree program, optimizing the integration of curricula and resources for the study of medicine with a special focus on population or community health via interdisciplinary training in specialty areas. These include but are not limited to, epidemiology, biostatistics, nutrition, environ-mental health, and health policy. Additionally, the Associate Dean, MD/MPH Program, represents the dual degree program in the health science center, local, regional, and national task forces and forums, engages in related scholarly activities, and ensures compliance with applicable accredita-tion standards. The Associate Dean of the MD/MPH program reports, with other education deans to the Vice Dean for Undergraduate Medical Education, and additionally to the educational leader-ship for the MPH program.
The University of Texas Health Science Center at San Antonio is an Equal Employment Opportuni-ty/Affirmative Action employer including protected veterans and persons with disabilities.
Candidate Qualifications• MD (or equivalent) and MPH (or equivalent)• Evidence of scholarly activities, including teaching and administrative experiences• Impeccable interpersonal and communication skills, across a broad range of stakeholder groups• Knowledgeable about the range of benefits of MD/MPH dual degree programs and career path ways for those with both degrees
Interested individuals should submit a letter of interest describing relevant experience and charac-teristics, and a current CV electronically addressed to Barbara J. Turner, M.D., Chair of Associate Dean, MD/MPH Program Search Committee c/o Jennifer Hernandez, Assistant to the Vice Dean of UME, at [email protected].
All faculty appointments are designated as security sensitive positions.
The University of Texas School of Medicine at San AntonioAssociate Dean for Admissions
The University of Texas School of Medicine at San Antonio is recruiting an Associate Dean for Admissions. The successful candidate will provide vision, leadership, and oversight for all School of Medicine outreach, recruitment, and admissions functions. The Associate Dean for Admissions leads the design, implementation and continuous evaluation of admissions-related policies and procedures, guided by medical education trends and evidence-based “best practices” as well as our specific responsibility to provide care for all Texans through education, research, and service. Along with other undergraduate medical education deans, the Associate Dean for Admissions rep-resents the medical education program in campus, community, state, and national task forces and forums, engages in related scholarly activities, and ensures compliance with applicable accredi-tation standards. The position reports to the Vice Dean for Undergraduate Medical Education.
The University of Texas Health Science Center at San Antonio is an Equal Employment Opportuni-ty/Affirmative Action employer including protected veterans and persons with disabilities.
Candidate Qualifications• Appropriate higher degree (M.D, PhD., Ed.D. or equivalent) evidence of scholarly activities, including teaching and administrative experience• Impeccable interpersonal and communication skills, across a broad range of stakeholder groups• Experience in medical school admissions and LCME accreditation standards
Interested individuals should submit a letter of interest describing relevant experience and char-acteristics, and a current CV electronically addressed to Michelle Arandes, M.D., Chair of Associ-ate Dean for Admissions Search Committee c/o Jennifer Hernandez, Assistant to the Vice Dean of UME, at [email protected].
All faculty appointments are designated as security sensitive positions.
Marketing Faculty Position
The Marketing Unit at Harvard Business School invites applications for a faculty position to start in July 2016. Harvard Business School recruits new faculty for positions entailing case method teaching at the graduate and executive program levels. Marketing encompasses understanding consumer behavior, international marketing, business-to-business marketing, product management, new product development and marketing organization and systems. Applicants for tenure track positions should have a doctorate or terminal degree in a field specified above, or related discipline, by the time the appointment begins, and strong demonstrated potential and interest to conduct research at the forefront of their fields.
Candidates should submit CV, copies of publications and working papers, and letters of recommendation at: http://www.hbs.edu/faculty/positions. Closing date for applications is June 30, 2015. Material that can only be sent in hard copy can be mailed to: Harvard Business School, Faculty Administration, Attn: Marketing Application, Morgan Hall T25, Soldiers Field Road, Boston, MA 02163.
We are an equal opportunity employer and all qualified applicants will receive consideration for
employment without regard to race, color, religion, sex, sexual orientation, gender identity, national origin, disability status, protected veteran status,
or any other characteristic protected by law.
Publication: Size: Notes: Job# IO#: Screen:Mechanical: Proofreader:
Hispanic Outlook in Higher Education b/w
mbb
2.375” x 4.75”
8181 8181-8181Continuing in the tradition of The Hispanic Outlook in Higher Education Magazine,
OutlooK-12 focuses on news, innovations and the latest trends that are impacting students
from kindergarten through high schoolwhile maintaining a unique Hispanic
perspective.
Contact Us atPhone: (201) 587-8800
E-mail: [email protected]
OutlooK-12 MAGAZINE
40 | MAY 18, 2015

MAY 18, 2015 | 41
To Apply: www.cuny.edu Go to Employment. These positions are anticipated vacancies.
The City University of New York is an Equal Opportunity Employer which complies with all applicable laws and regulations and encourages inclusive excellence in its employment practices.
SCHOOL OF ARTS & SCIENCESAfrican American StudiesAnatomy and PhysiologyAnthropology/GeographyArabic/FrenchBioinformaticsChemistryCommunicationsEconomicsEnglishMathematicsMedical InformaticsPhilosophyPhysicsProfessional & Technical WritingPsychologySpanishSCHOOL OF PROFESSIONAL STUDIESAccountingCulinary Arts/Pastry ArtsDental HygieneHealth Service AdministrationHospitality ManagementHotel ManagementHuman ServicesLaw & Paralegal Studies NursingRadiologic Technology/Medical ImagingRestorative Dentistry Vision Care TechnologyLIBRARYSystems & Information Technology Librarian
ADMINISTRATIONAcademic AdvisorAcademic Career Employment SpecialistAcademic Internship ManagerAcademic Internship CoordinatorAcademic SEEK Student Support SpecialistAcademic Transfer SpecialistBenefits ManagerCommunications & College Relations SpecialistDigital RecruiterFinance CoordinatorFinancial Aid Assistant Director Major Gifts Development Manager
EXECUTIVEDean - School of Arts & SciencesAssociate Dean - Student AffairsExecutive Director - Human Resources
SCHOOL OF TECHNOLOGY & DESIGNAdvertising DesignArchitectural TechnologyComputer Engineering TechnologyComputer Systems TechnologyConstruction ManagementDigital Publishing DesignElectrical & Telecommunications Engineering TechnologyFoundation & Graphic DesignGame DesignIllustrationMechanical Engineering TechnologyMechatronics Engineering Technology
NEW YORK CITY COLLEGE OF TECHNOLOGYOF THE CITY UNIVERSITY OF NEW YORK
TENURE TRACK FACULTY POSITIONS FALL 2015New York City College of Technology is a comprehensive college with over 16,000 students offeringboth Associate and Baccalaureate Programs. City Tech seeks candidates for tenure track facultypositions beginning fall 2015.
56176 CUNY City TechHispanic Outlook1/2 pg4.8” x 7.25”color5.8.15p 2

Effective Date: To ensure consideration, all application materials must be received by June 11, 2015
SUBMIT COVER LETTER AND RESUME ADDRESSING THE REQUIRED QUALIFICATIONS TO:www.bhcc.mass.edu/employment. Fax transcript files to (617)-228-3328.
Bunker Hill Community College is an Affirmative Action/Equal Opportunity Employer.
Publication:
Size: Notes:
Job#
IO#:
Screen:M
echanical:
Proofreader:
Hisp
anis Outlook
b/w
dg, d
g
4.875” x 9.75”
84238423-8440
Bunker Hill Community Collegewww.bhcc.mass.edu
250 New Rutherford Avenue, Boston, MA 02129-2925
Bunker Hill Community College is a multi-campus institution with vibrant, urban campuses in Boston, Massachusetts, in nearby Chelsea, Massachusetts, and at three satellite locations in the Greater Boston area. Recently re-certified as a Leader College by Achieving the Dream, BHCC is part of the Massachusetts public higher education system, which includes 15 community colleges. Founded in 1973, BHCC is the largest community college in Massachusetts, serving more than 14,000 students each semester across all modes of instruction. The College offers more than 100 certificate and degree programs that prepare students to enter four-year institutions or to enter the workforce prepared for better and more highly skilled jobs. Sixty-seven percent of students are people of color and more than 50 percent are women.
Bunker Hill Community College established a satellite site in the City of Chelsea in 1988, and a decade later, in 1998, permanently relocated the Chelsea Campus in the historic, former Post Office facility in Bellingham Square. The Campus provides educational services to the residents of Chelsea, Revere, Everett, East Boston, and surrounding communities. Four essential areas of programming for the Campus are: 1) Adult Basic Education - ABE, 2) English for Speakers of Other Languages - ESOL, 3) College Readiness programs such as TRIO and Ramp Up, and 4) College academic programs in Allied Health and associated courses in lab sciences and General Education. The City of Chelsea was recently awarded a Working Cities grant from the Federal Reserve Bank of Boston to further the effort of planning and renewal. The resulting project, Chelsea Works, is a broad initiative to revitalize the neighborhood of Bellingham/Sheffield, where the Chelsea Campus is located. The City was also chosen by the American Civic League as the recipient of the 2014 All-American City award. Chelsea’s population grew 6.7% from 2010 to 2013, with 62% of its 37,670 residents being Hispanic or Latino. 55% of the residents speak Spanish at home. Chelsea Campus enrollment (headcount) grew from 3,150 in 2009 to 3,821 in 2013, showing a 21% increase. There is a pressing need for college preparation programs and high quality career-technical education programs that will pave the way for high-wage, high-demand entry-level careers.
ASSOCIATE PROVOST-CHELSEA CAMPUSPosition Description: The Associate Provost, Chelsea Campus, is a mission-critical executive-level leadership position with academic portfolio to ensure vibrant core program and services development, responsive local decision-making, and sustained community engagement at a senior leadership level. Reporting to the Provost/Vice President of Academic and Student Affairs, the Associate Provost provides strategic leadership and direction for the College’s academic programs and student services.
• Initiates and maintains collaborative relationships with key leaders in the City of Chelsea to ensure that College programs and services are meeting the needs of the community. Represents the College at meeting with City officials and other stakeholders.
• Supervises the Dean of Nurse Education and Medical Imaging, the Dean of Science, Engineering and Health Programs, the Dean of Professional Studies and Workforce Development and the Administrator of the Chelsea Campus.
• Establishes collaborative strategies with the Associate Provost, Charlestown, to ensure the College achieves its stated mission, at multiple sites, with attention to the unique focus of each.
• Assumes a leadership role and works with the Provost/Vice President in the ongoing development and enhancement of learning outcomes for the College.
• Provides leadership in the assessment of academic programs.• Participates in the creation of new academic programs and student services in alignment with
the College’s mission and goals.• Oversees the academic affairs budget; monitors expenditures in assigned divisions.• Promotes excellence in teaching and learning and fosters an environment of continuous
improvement, innovation and positive and collegial relationships between faculty, staff and students.
• Responsible for the selection of new faculty and staff in assigned divisions.• Responsible for the integration of enrollment services and academic programming to improve
retention and graduation rates.• Provides leadership in the development of grant proposals.
Required Qualifications:• Earned doctorate and five years of senior-level management experience at the level of Dean or
higher in an institution of higher education or • Master’s degree with seven years of demonstrated leadership and accomplishments in the area of
academic programs at the level of Dean or higher in an institution of higher education• College-level teaching experience• Excellent oral and written communication skills• Record of successful implementation of academic programs and/or student services • Proven ability to work effectively with a diverse faculty, staff and student population• Community College administrative experience preferred
Salary Range: $130,000 – $140,000
GO
HISPANICUPDATED WITH US
FOR MORE INFORMATION CONTACT US
(201) 587 8800
©All Rights Reserved to OutlooK-12 Magazine Inc.
MAGAZINE
42 | MAY 18, 2015

UNIVERSITYSALISBURY
To learn more about Salisbury University visit
www.salisbury.edu
As Distinctive
AsYou
A Maryland University of National Distinction
I knew I made the right decision to cometo SU when one day I was walking toclass and one of my teachers called me bymy name and asked how I was doing. AtSU you really get to know each of yourteachers and they get to know you as well.
I love the friendly atmospherePROFILE: ISADORA
A GREAT VALUEU.S. News & World Report, The Princeton Review and Kiplinger’sPersonal Finance rank SU among thenation’s best at providing a notablyhigh quality, yet affordable education.
SETTING FOR SUCCESSSU offers 43 undergraduate majors and 15 graduateprograms. Innovative facilities, including the state-of-the-art Teacher Education and Technology Center anda new home for the Franklin P. Perdue School ofBusiness, place the University at the forefront ofnational education.
ACADEMIC EXCELLENCEOutstanding faculty are mentors for undergraduateresearch. Students gain real-world knowledge through internships and global experiences.
VISIT SUSU offers a small-town feel within an easy ride to cities likeBaltimore, Washington, D.C.,and Philadelphia.
Hispanic Outlook 03_15_Layout 1 3/12/15 1:46 PM Page 1
CNM - Central New Mexico Community CollegeSmith Brasher Hall Main Campus
717 University Blvd. SE • Albuquerque, NM
Attention JOB SEEKERS!CNM is recruiting for Nursing, Part-time Faculty, Casual Instructors, & IT Professionals
Join Us!April 10, 2015
2:00pm - 7:00pm
CNM - Central New Mexico Community CollegeSmith Brasher Hall Main Campus
717 University Blvd. SE • Albuquerque, NM
Attention JOB SEEKERS!CNM is recruiting for Nursing, Part-time Faculty, Casual Instructors, & IT Professionals
Join Us!April 10, 2015
2:00pm - 7:00pm
Attention JOB SEEKERS!CNM is recruiting for Nursing,
Part-time Faculty, Casual Instructors, & IT Professionals
MAY 18, 2015 | 43

By Miquela Rivera, PhD Do you hear the low, continuous sound over a child droning “swoosh-swoosh-swoosh”? That’s the child’s helicopter parent making sure that everything is just right. It is easy to focus on parents who don’t do enough for their children; time to focus on those who do too much. Concerned, overprotective, anxious and sometimes very competitive, these overinvolved parents lack personal limits in what they will do for their children. “We have to go do homework now,” said one father, leaving a party early. (He had an advanced college degree; his daughter needed to complete fifth grade). “We have to apply to our list of colleges this weekend,” said another helicopter mother. (Reminder: prospective students – NOT parents – apply to college). “Juanito wrecked his car last weekend. We need to get him another.” (We do? Mi’jito may need to earn it). Helicopter parents (including Latinos) – overinvolved in their children’s lives – sometimes think being a good parent means doing everything for their children. Other times they are overprotective, wanting the child to avoid failure, conflict or disappointment. And many try to live out their unfulfilled dreams through their children. Regardless of intent – conscious or not – parents who are overinvolved in their children’s lives often end up getting what they fear: helpless, unmotivated children who rely excessively on others to provide; entitled youngsters who are tough to coach or teach because they already know everything and are above the rules; children ill-prepared to solve their own problems; and those who are compliant when young and rebellious later. Where do overinvolved parents go wrong? Those who fear their children failing in school often judge too harshly the quality of their children’s work or do some of the child’s work, expecting performance beyond the child’s developmental capability. If a parent fears that her child may not be included in certain groups, she might launch a campaign to assure her child is chosen. The parents’ inappropriate meddling gives the child the message that nothing is good enough (including the child’s efforts), so many frustrated children quit trying. When assignments are done haphazardly, turned in late or not turned in at all and the helicopter parent inappropriately tries to “fix” the situation, he robs the child of chance to live with consequences.
Benevolent parents also worry about their children’s future. The economy, global warming, job prospects and the chaotic, violent state of the world are scary for helicopter parents to consider, so they shelter the child from conflict, challenges or the unknown outside world. What a shock when that child is forced to face reality. Some helicopter parents want to assure that their children never suffer neglect or discrimination as they may have experienced, so they overdo. They buy lots of toys or games, enroll their children in many sports and activities and indulge the whims of their children – all as compensation and protection. Pressure from other parents inflames the fears and anxiety of fellow helicopter parents. Competing to be a super-parent, to have a super-spouse or an exceptional child can push efforts and the need to hover over the top. Despite herculean efforts, helicopter parents often end up with children who have no confidence in their own abilities and low self-esteem because they really can’t do much without the parent. Such children are often devastated by criticism and have trouble dealing with disappointment, mainly because they haven’t faced it before. A child’s sense of entitlement will put off and alienate teachers and friends. And the child’s inability to do basic activities of daily living (like washing the dishes) will exclude them from social situations in which they have to function independently. The overinvolved parent hasn’t done the child any favors. What to do? Help parents learn what is developmentally appropriate for children. The best (and hardest) thing a helicopter parent can do is to let things evolve and allow children to develop naturally, with time and under their own efforts. Children need a parent’s support, but it should be based on the developmentally appropriate needs, skills and abilities of the child. And help parents learn that their child’s need for their help shifts with time. An independent, successful, happy child (regardless of age) is often a reflection of the best parenting. •
Miquela Rivera, PhD, is a licensed psychologist withyears of clinical, early childhood and consultative experience. She lives in Albuquerque, N.M.
MAY 18, 2015 |
Priming the Pump...Why Helicopter Parents Should Be Grounded