HMRC CGE Results From Oil Shock Scenario
8
Annex A 14th Sept 2010 CGE RESULTS FROM THE OIL SHOCK SCENARIO Summary The CGE simulation results are real percentage changes in the level of GDP as a consequence of the oil shock in comparison to baseline. The simulation results indicate a decline in the level of real GDP - of around 1.7% in each of the first two years (2011 & 2012) as a result of around 102% oil price increase in 2011. The impact of the shock, is concentrated in the first two periods, then slowly diminishes through time, as the economy returns to its long run steady state equilibrium. The magnitude of the im pact is consist ent with the empiri cal literature ± that GDP declines by around 0.15% to 0.3% (in the first few years) for a 10% increase in the world oil price. Furthermore, sensitivity analysis indicates that the CGE results can range from - 0.15% to -0.3% for a 10% increase - with varying assumptions for key parameters. This is still within the range of the existing empirical and simulations estimates. Introduction: CGE Modelling Over the past 25 years, computable general equilibrium (CGE) models have become a standard tool of empirical economic analysis. CGE analysis treats all commodities, sectors and production factors in the economy and assumes that demand and supply of each commodity and factor are balanced. A CGE model is a set of equations that numerically simulates the interactions of differing agents in the economy. In essence, CGE model captures the economic behaviours of all agents (consumers, producers, government, investors, etc...) in the economy using equations. All equations are simultaneous linked between markets, institutions and factor resources such that all-markets are in equilibrium and interlinked. CGE Modelling is built on the Walrasian General Equilibrium Structure which was developed and refined by inter alia, Arrow (1954), Debreu (1959) and Hahn (1971). The HMRC CGE model is a single-country dynamic model, based on UK data updated to a 2010 base year. The model has 19 industries, 19 product markets, 45 household types, 3 types of labour (sk illed, semi -skilled and unskilled), 3 types of the corporate sector (large, medium, size) and 3 factors of production (labour, capital
-
Upload
michaelsavage1 -
Category
Documents
-
view
217 -
download
0
Transcript of HMRC CGE Results From Oil Shock Scenario

8/6/2019 HMRC CGE Results From Oil Shock Scenario
http://slidepdf.com/reader/full/hmrc-cge-results-from-oil-shock-scenario 1/8
Annex A
14th Sept 2010
CGE RESULTS FROM THE OIL SHOCK SCENARIO
Summary
The CGE simulation results are real percentage changes in the level of GDP as a
consequence of the oil shock in comparison to baseline.
The simulation results indicate a decline in the level of real GDP - of around 1.7% in
each of the first two years (2011 & 2012) as a result of around 102% oil price
increase in 2011. The impact of the shock, is concentrated in the first two periods,then slowly diminishes through time, as the economy returns to its long run steady
state equilibrium.
The magnitude of the impact is consistent with the empirical literature ± that GDP
declines by around 0.15% to 0.3% (in the first few years) for a 10% increase in the
world oil price.
Furthermore, sensitivity analysis indicates that the CGE results can range from -
0.15% to -0.3% for a 10% increase - with varying assumptions for key parameters.
This is still within the range of the existing empirical and simulations estimates.
Introduction: CGE Modelling
Over the past 25 years, computable general equilibrium (CGE) models have become
a standard tool of empirical economic analysis. CGE analysis treats all commodities,
sectors and production factors in the economy and assumes that demand and
supply of each commodity and factor are balanced. A CGE model is a set of
equations that numerically simulates the interactions of differing agents in the
economy. In essence, CGE model captures the economic behaviours of all agents
(consumers, producers, government, investors, etc...) in the economy using
equations. All equations are simultaneous linked between markets, institutions and
factor resources such that all-markets are in equilibrium and interlinked. CGEModelling is built on the Walrasian General Equilibrium Structure which was
developed and refined by inter alia, Arrow (1954), Debreu (1959) and Hahn (1971).
The HMRC CGE model is a single-country dynamic model, based on UK data
updated to a 2010 base year. The model has 19 industries, 19 product markets, 45
household types, 3 types of labour (skilled, semi -skilled and unskilled), 3 types of the
corporate sector (large, medium, size) and 3 factors of production (labour, capital
8/6/2019 HMRC CGE Results From Oil Shock Scenario
http://slidepdf.com/reader/full/hmrc-cge-results-from-oil-shock-scenario 2/8
and mixed income, which is largely self employment). Since the model i s dynamic, it
tracks the evolution of the economy over time as it reacts to changes. There are
also a number of assumptions, grounded in economic theory, about various other
interactions in the economy, such as how the government behaves when it receives
additional, or reduced, income.
Public finance is represented extensively in the model, both on public spending and
taxation sides. Public spending includes government expenditure on education,
health, public administration & defence (PAD), government inv estment, government
wages and benefits. The latter is divided into benefits that affect employment (for
example, unemployment benefit) and that are unrelated to employment (for example,
disability benefit). In addition to corporation tax, all major taxes are included in the
model, including, VAT, income tax, national insurance contribution (NICs),
production taxes, excise duties and environmental taxes. Budget deficit and the
associated interest payment are accumulated over years and added to government
debt.
CGE is a useful tool for assessing oil price shocks
The CGE model is a useful tool for oil price shocks as it captures cascading and
quality effects that are not included in partial equilibrium analysis. Most importantly,
CGE modelling provides a full macro economic impact of a price shock. The
cascading effect is captured through firms purchasing commodities from each other.
Hence an oil price rise will cascade through the different sectors: as firms pass part
of the cost onto their consumers (other firms) which then pass the cost on again -
this can lead to substantial increases in prices for final consumers. Also, quality
effects can occur where firms choose to use methods of production which are less oil
intensive, this could potentially mean that production process is of a lower quality.
Structure of the paper:
The paper is broken down into two main sections: the first covers the CGE analysis
of the oil shock and the second, a short literature review (in order to put the
simulation results in context).
The oil shock will be assessed in terms of its impact on:
1. GDP2. GDP broken down by its components (such as consumption and investment
etc)3. Industrial sectors

8/6/2019 HMRC CGE Results From Oil Shock Scenario
http://slidepdf.com/reader/full/hmrc-cge-results-from-oil-shock-scenario 3/8
OBR Oil price forecast (dollars) DECC oil price shock (dollars)
Impact on GDP (% reduction) in comparison to the baseline
y The Chart above displays the impact on GDP in comparison to the OBRforecast baseline. For example in 2011 GDP is around 1.7% lower than itwould have been.
y Please note that the chart shows the impact in terms of the level of GDP.
Hence economic growth will return several periods after the shock, but theeconomy will still be persistently lower ± in terms of the level of GDP.
y The timing of the results from the CGE model are consistent with the literature ± the exogenous oil supply disruption causes a temporary reduction in realGDP. Furthermore, that the impact of the shock slowly diminishes throughtime, as the economy returns to its long run steady state equilibrium.
Oil i $ wt
¡ ¢ ¡ £
8
¡ ¢ ¢ 8
¤
¥
¡ ¢
8¤ ¦
¥
¡ ¢
§
8£
¥
¡ ¢ ¦
88¢
¥
¡ ¢ ¤ ¨ ¡
¥
Oil i $ wt
¡ ¢ ¡ £
8
¡ ¢ ¢ ¢ ¤ £ © 86
¢ ¡
¥
¡ ¢
¢ 6
¦ © ¡ ¨ ¦
¥
¡ ¢
§
¢ ¦
§
© 8̈
¢
¥
¡ ¢ ¦ ¢
§
© ¤ ¦ ¢ ¦
¥
¡ ¢ ¤ ¢ ¡
6©
8¦ ¢ ¦
¥
ntag
ang
in D in pa is n t t
OBRbas
lin
-1.80%
-1.60%
-1.40%
-1.20%
-1.00%
-0.80%
-0.60%
-0.40%
-0.20%
0.00%
2010 2013 2016 2019 2022 2025 2028 2031 2034 2037 2040
GDP

8/6/2019 HMRC CGE Results From Oil Shock Scenario
http://slidepdf.com/reader/full/hmrc-cge-results-from-oil-shock-scenario 4/8
y The magnitude of the impact is consistent with the empirical and simulationsliterature (around -0.1 to -0.2 percent decline in GDP for a 10% increase inthe world oil price - see the brief literature overview at the end of thedocument).
DECC Oil Shock:
Impact on GDP (% reduction) in comparison to the baseline, broken do n by
components
Breakdo n of the impact on GDP from the oil price shock
y As can be seen from the chart, consumption is adversely affected due todirect affects ± this is a reflection of the inability of consumers to switch their bundle of goods away from oil intensive commodities (low elasticity of substitution).
y Similarly investment is adversely affected due to adjustment and direct affects ± again this is due to rising costs, and the inability of the firm to completely
switch away from oil intensive input s (low elasticity of substitution).
y Net trade is also affected as the UK is a net oil importing country. The shockresults in a transfer of income from oil importing to oil exporting countries ± asthe price of oil rises.
Theoretical context to the impacts
mpact o the ! il " rice shoc #
-1.80
-1.60
-1.40
-1.20
-1.00
-0.80
-0.60
-0.40
-0.20
0.00
0.20
2 0 1 0
2 0 1 2
2 0 1 4
2 0 1 6
2 0 1 8
2 0 2 0
2 0 2 2
2 0 2 4
2 0 2 6
2 0 2 8
2 0 3 0
2 0 3 2
2 0 3 4
2 0 3 6
2 0 3 8
2 0 4 0
% C
h a n g e i n c o m p a r i s o n t o t h e b a s e l i n e
Consumption Investment Net Trade GDP
8/6/2019 HMRC CGE Results From Oil Shock Scenario
http://slidepdf.com/reader/full/hmrc-cge-results-from-oil-shock-scenario 5/8
y The magnitude of the direct effect of a given oil price increase depends on theshare of the cost of oil in national income, the degree of dependence onimported oil and the ability of end -users to reduce their consumption andswitch away from oil.
y It also depends on the extent to which gas prices rise in response to an oil -
price increase, the gas-intensity of the economy and the impact of higher prices on other forms of energy that compete with or, in the case of electricity,are generated from oil and gas.
y Adjustment effects, which result from real wage, price and structural rigiditiesin the economy, add to the direct income effect. Higher oil prices lead toinflation, increased input costs, reduced non -oil demand and lower investmentin net oil importing countries.
y An oil price increase typically leads to upward pressure on nominal wagelevels. Wage pressures together with reduced demand tend to lead to higher unemployment, at least in the short term. These effects are greater the moresudden and the more pronounced the price increase and are magnified by theimpact of higher prices on consumer and business confidence.
y Naturally, the greater the oil -price increase and the longer higher prices aresustained, the greater the macroeconomic impact.
y There are also general equilibrium effects to consider from the oil price shock:1. The cascading effect is captured through firms purchasing commodities
from each other. Hence an oil price rise will cascade through thedifferent sectors: as firms pass part of the cost onto their consumers(other firms) which then pass the cost on again - this can lead to
substantial increases in prices for final consumers.2. Also, quality effects can occur where firms choose to use methods of
production which are less oil intens ive, this could potentially mean thatproduction process is of a lower quality.
3. Factor earnings effect, households receive diminished income as aresult lower real wages (as prices rise and bargaining effects), thisfeeds back into lower consumption.

8/6/2019 HMRC CGE Results From Oil Shock Scenario
http://slidepdf.com/reader/full/hmrc-cge-results-from-oil-shock-scenario 6/8
DECC Oil price shock: GDP components impact
Percenta$
e chan$
e in GDP components
Cons%
mption&
nvestment GDP Net'
ra(
e
2010 0 0 0 0
2011 -0.45 -0.47 -1.6)
-0.77
2012 -0.43 -0.45 -1.6 0 -0.81
2013 -0.35 -0.32 -1.21 -0.54
2014 -0.28 -0.22 -0.80 -0.31
2015 -0.21 -0.16 -0.51 -0.14
2016 -0.20 -0.15 -0.49 -0.14
2017 -0.20 -0.14 -0.48 -0.14
2018 -0.19 -0.14 -0.47 -0.14
2019 -0.18 -0.13 -0.45 -0.14
2020 -0.18 -0.12 -0.44 -0.14
2021 -0.17 -0.11 -0.43 -0.14
2022 -0.17 -0.11 -0.41 -0.14
2023 -0.16 -0.10 -0.40 -0.14
2024 -0.16 -0.09 -0.39 -0.13
2025 -0.15 -0.09 -0.37 -0.13
2026 -0.15 -0.08 -0.36 -0.13
2027 -0.14 -0.08 -0.35 -0.13
2028 -0.14 -0.07 -0.33 -0.13
2029 -0.13 -0.06 -0.32 -0.12
2030 -0.13 -0.05 -0.31 -0.12
2031 -0.13 -0.05 -0.29 -0.12
2032 -0.12 -0.04 -0.28 -0.11
2033 -0.12 -0.03 -0.26 -0.11
2034 -0.12 -0.03 -0.25 -0.11
2035 -0.11 -0.02 -0.23 -0.10
2036 -0.11 -0.01 -0.22 -0.10
2037 -0.11 0.00 -0.20 -0.09
2038 -0.10 0.01 -0.18 -0.09
2039 -0.10 0.02 -0.17 -0.08
2040 -0.10 0.03 -0.15 -0.07
8/6/2019 HMRC CGE Results From Oil Shock Scenario
http://slidepdf.com/reader/full/hmrc-cge-results-from-oil-shock-scenario 7/8
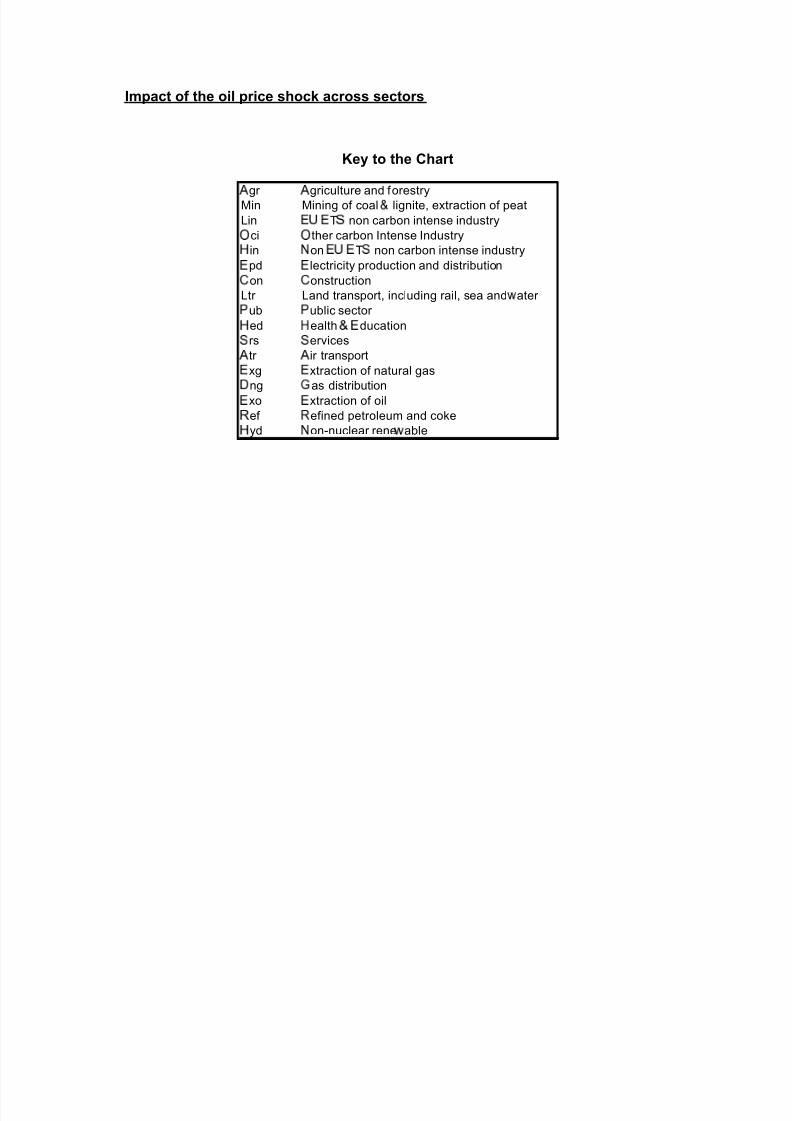
Impact of the oil price shock across sectors
Key to the Chart
1
gr 1
griculture and forestryMin Mining of coal2
lignite, extraction of peat
Lin3
4
3
T5
non carbon intense industry
6
ci6
ther carbon Intense Industry
7
in8
on3
4
3
T5
non carbon intense industry
3
pd3
lectricity production and distribution
9 on
9 onstruction
Ltr Land transport, including rail, sea and@
ater
A ub
A ublic sector
7 ed
7 ealth
2
3 ducation
5 rs
5 ervices
1 tr
1 ir transport
3 xg
3 xtraction of natural gas
B ng
C as distribution
3 xo
3 xtraction of oil
D ef
D efined petroleum and coke
7
yd8
on-nuclear rene@
able

8/6/2019 HMRC CGE Results From Oil Shock Scenario
http://slidepdf.com/reader/full/hmrc-cge-results-from-oil-shock-scenario 8/8
DECC Oil shock across sectors
y The shock negatively affects most sectors - as oil is a key input for mostsectors (both directly and indirectly).
y The gas sector benefits from the increase in oil prices, as it is a substitutefor oil.
y Also, the oil extraction sector benefits from the higher price, as it is notperfectly substitutable with other commodities, hence higher prices resultin higher gross operating surplus.
y The sectors that are impacted the most are those which consume largeamounts of oil intensive commodities as inputs ± such as µother carbonintense industry¶.
ImpE F
G
byH
eF
G
oI
P
nF
ompE I
P
H
onG
oG
he bE H
eQ
P
ne
- 1 0 0
- 5 0
0
5 0
10 0
15 0
I m p
R
S
T
o n o u
T
p u
T
(
U
)
AgV M W n LW n O X W H W n Epd Y on L ̀
V Pub
Hed SV a
A ̀
V Exg Dng Exo Ref Hyd