Hlp 2000 10 prsnttn cifnaturalchallengesinriparianzonesofabsfoothills
Upload
fri-researchCategory
view
216download
1description
Structure of Forest Stands Disturbed by
Wildfire and Logging
in the Rocky Mountain Foothills
Daniel R. Farr1, Christopher P. Spytz2, and E. George Mercer3
1 Foothills Model Forest, Box 6330, Hinton, Alberta, Canada, T7V 1X62 Weldwood of Canada Limited, Hinton Division, 760 Switzer Drive, Hinton, Alberta, Canada, T7V 1V7
3 Jasper National Park, Box 10, Jasper, Alberta, Canada, T0E 1E0
2000

2
Disclaimer
The views, statements and conclusions expressed and the recommendations made in this report
are entirely those of the author(s) and should not be construed as statements or conclusions of, or as
expressing the opinions of the Foothills Model Forest, or the sponsors of the Foothills Model Forest.
Foothills Model Forest is one of eleven Model Forests that make up the Canadian Model Forest
Network. As such, Foothills Model Forest is a non-profit organization representing a wide array of
industrial, academic, government and non-government partners, and is located in Hinton, Alberta. The
three principal partners representing the agencies with vested management authority for the lands that
comprise the Foothills Model Forest, include Weldwood of Canada (Hinton Division), the Alberta
Department of Environmental Protection and Jasper National Park. These lands encompass a combined
area of more than 2.75 million hectares under active resource management.
The Canadian Forest Service of Natural Resources Canada is also a principal partner in each of
the eleven Model Forest organizations and provides the primary funding and administrative support to
Canada’s Model Forest Program.
The Foothills Model Forest mission: We are a unique community of partners dedicated to
providing practical solutions for stewardship and sustainability of our forest lands.
3
Contents
Disclaimer ..................................................................................................................................................... 2
Abstract ......................................................................................................................................................... 4
Introduction................................................................................................................................................... 5
Methods ........................................................................................................................................................ 6
Results ....................................................................................................................................................... 11
Discussion................................................................................................................................................... 23
Management implications........................................................................................................................... 26
Acknowledgements..................................................................................................................................... 28
Literature cited ............................................................................................................................................ 29
Tables
Table 1. Summary of study site characteristics and species composition of live trees greater than2 m tall ........................................................................................................................................... 12
Table 2. Number of standing dead trees in burned and logged sites in the Rocky MountainFoothills of Alberta ........................................................................................................................ 16
Table 3. Density and volume of down deadwood in burned and logged sites in the RockyMountain Foothills of Alberta ....................................................................................................... 17
Table 4. Factor loadings of 3 principal components from a PCA of down deadwood attributes of195 plots in burned and logged sites in the Rocky Mountains and Foothills of Alberta ............... 21
Figures
Figure 1. Map showing locations of the four burns sampled in this study.................................................. 7
Figure 2. Sample plot locations for each study site .................................................................................... 8
Figure 3. Density and basal area of live trees greater than 2 m tall by diameter class in burnedand logged sites in the Rocky Mountain Foothills......................................................................... 13
Figure 4. Distribution of standing dead trees across a range of decay and diameter classes inburned and logged sites in the Rocky Mountain Foothills............................................................. 14
Figure 5. Volume of down deadwood greater than 7 cm diameter in recently burned or loggedsites in the Rocky Mountain Foothills ........................................................................................... 15
Figure 6. Volume of down deadwood in recently burned and logged sites in the Rocky MountainFoothills ......................................................................................................................................... 18
Figure 7. Distribution of down deadwood across a range of diameter, height, decay, texture, andepiphyte cover classes, in burned and logged sites in the Rocky Mountain Foothills................... 19
Figure 8. A. Site means for the first three principal components from a PCA of nine attributesrelated to down deadwood (Table 4). B. Plot values for the first two principalcomponents from the same PCA.................................................................................................... 22
4
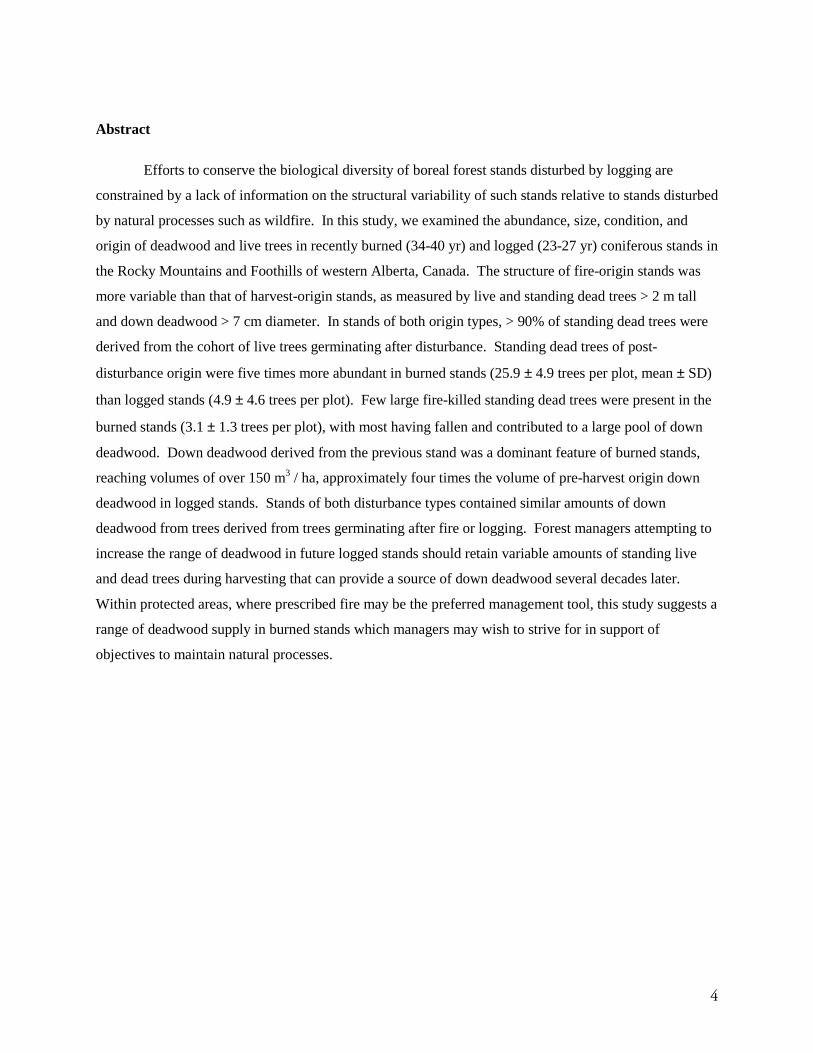
Abstract
Efforts to conserve the biological diversity of boreal forest stands disturbed by logging are
constrained by a lack of information on the structural variability of such stands relative to stands disturbed
by natural processes such as wildfire. In this study, we examined the abundance, size, condition, and
origin of deadwood and live trees in recently burned (34-40 yr) and logged (23-27 yr) coniferous stands in
the Rocky Mountains and Foothills of western Alberta, Canada. The structure of fire-origin stands was
more variable than that of harvest-origin stands, as measured by live and standing dead trees > 2 m tall
and down deadwood > 7 cm diameter. In stands of both origin types, > 90% of standing dead trees were
derived from the cohort of live trees germinating after disturbance. Standing dead trees of post-
disturbance origin were five times more abundant in burned stands (25.9 ± 4.9 trees per plot, mean ± SD)
than logged stands (4.9 ± 4.6 trees per plot). Few large fire-killed standing dead trees were present in the
burned stands (3.1 ± 1.3 trees per plot), with most having fallen and contributed to a large pool of down
deadwood. Down deadwood derived from the previous stand was a dominant feature of burned stands,
reaching volumes of over 150 m3 / ha, approximately four times the volume of pre-harvest origin down
deadwood in logged stands. Stands of both disturbance types contained similar amounts of down
deadwood from trees derived from trees germinating after fire or logging. Forest managers attempting to
increase the range of deadwood in future logged stands should retain variable amounts of standing live
and dead trees during harvesting that can provide a source of down deadwood several decades later.
Within protected areas, where prescribed fire may be the preferred management tool, this study suggests a
range of deadwood supply in burned stands which managers may wish to strive for in support of
objectives to maintain natural processes.
5
Introduction
Wood is a defining attribute of forest ecosystems (Hunter 1990), and in many forests, woody
tissue comprises over 90% of the total biomass (Packham and Harding 1982). Until recently, the
importance of dead wood to the biological diversity of forest stands has largely been overlooked.
Deadwood contributes to biodiversity and ecological function by modifying microclimate and providing
habitat for vertebrates (Maser and Trappe 1984; Hayes and Cross 1987; Bunnell et al. 1997; Lindenmayer
and Franklin 1997), invertebrates (Niemela 1997), plants (Andersson and Hytteborn 1991; McAlister
1995), fungi (Boddy and Watkinson 1994) and lichens (see review by Harmon et al. 1986). Decomposing
deadwood within upper soil horizons, which may persist for several decades or more (McFee and Stone
1966; Harvey et al. 1981), provides a suitable medium for non-symbiotic nitrogen-fixing bacteria
(Jurgensen et al. 1992), and ectomycorrizal associations with root tips that facilitate the transport of
nutrients and water in trees and other woody vegetation (Larson et al. 1978, Harvey et al. 1987. Vare
1989).
The abundance and condition of deadwood in forests is highly dynamic. The amount present in a
stand reflects the combined processes of accumulation through tree growth and mortality, and losses
through decomposition (Franklin et al. 1987). Pulses of tree mortality caused by sudden disturbances
such as wildfire can create a large pool of deadwood, consisting of both standing dead trees and down
deadwood that may persist for many decades (Harmon et al. 1986). Post-fire establishment of trees may
result in very high tree densities followed by mortality that contributes additional deadwood to the stand
(Lotan et al. 1985, Lee et al. 1997). Because periodic disturbance by wildfire is characteristic of many
boreal forest ecosystems (Rowe and Scotter 1973; Arno 1980; Mooney et al. 1981), standing and down
fire-killed trees are significant elements of boreal forest stand infrastructure (Jeske and Bevins 1979;
Brown and See 1981; Fahey 1983).
Two human activities, wildfire suppression and tree harvesting, have the potential to alter
ecological functions associated with deadwood over much of the boreal forest in Canada. Fire
suppression may reduce the frequency of pulses of high tree mortality, while tree harvesting removes
much of the wood biomass that would otherwise remain after fire (Lee et al. 1995, 1997, Spies et al.
1998). Repeated logging over successive rotations would maintain a relatively low supply of deadwood
in logged stands. In this way, harvesting may be similar to repeated burning, at short intervals. Practices
such as clear-cutting, thinning, and other silvicultural interventions that reduce the supply of deadwood in
forest stands have been suggested as a primary cause of decline in certain birds, arthropods, bryophytes
6
and fungi associated with deadwood in boreal regions (Haapanen 1965; Samuelsson et al. 1994; Siitonen
and Martikainen 1994; Atlegrim and Sjöberg 1995; Niemelä 1997; Rydin et al. 1997).
One strategy to conserve deadwood and its associated biota in boreal forest stands is to increase
the amount of residual woody material remaining after logging to more closely resemble the range
occurring in fire-origin stands (Hansen et al. 1991). This material would supplement that which occurs in
buffers, sub-merchantable stands and inaccessible stands. While increasing the amount of deadwood in
logged stands would likely reduce the risk of many undesirable ecological effects (Jurgensen et al. 1992;
Rydin et al. 1997), it is constrained by issues relating to safety, legislation, silviculture, cost,
infrastructure investments and wood supply commitments. In addition, a lack of baseline information on
the ranges of abundance and condition of deadwood in fire-origin stands make it difficult to judge the
merits of alternative deadwood retention strategies relative to the natural range of variability (Swanson et
al. 1993).
The Rocky Mountains and Foothills in Alberta offer opportunities for retrospective comparisons
of deadwood in fire-origin and logging-origin stands that could inform management strategies intended to
maintain future deadwood supply that better approximate a natural range of variability. Wildfire is
common in this region (DeLisle and Hall 1987; Government of Alberta 1998), and logging has occurred
in the Foothills on an industrial scale since the mid-1950's (Crossley 1978). In this study, we estimated
and compared ranges of variability in the structure of stands disturbed by wildfire and by clear-cut
harvesting, with structure defined as the abundance, size and condition of deadwood and live trees.
Methods
All study sites were located in western Alberta, between 52° to 54° N, and 115° to 119° W (Fig.
1), and ranged from 1300 to 1600 m asl. The region is topographically diverse, including the East Slope
Rockies, Upper Foothills, and Lower Foothills forest sections (Rowe 1972). Four sites burned 34 to 40
years prior to sampling, and three were logged 23 to 27 years prior to sampling. Forest cover in
undisturbed residual patches within each site and in the surrounding area was primarily coniferous stands
or coniferous-dominated mixedwood stands ranging in age from 20 to >150 years. Logging activities to
support local sawmills prior to 1956 probably affected forest cover in most sites, but detailed records
were not available.

7
8
Topographic and edaphic differences between burned and logged sites were reduced by selecting
logged stands adjacent to the three Foothills burns (Fig. 2). All logged stands were clear-cut between
1970 and 1974 by North Western Pulp and Power (see Crossley 1978 for a summary of the forest
management system used in this area at the time). The primary logging method was tree-length
harvesting, with de-limbing and topping done in the cutblock by power saw. Wheeled skidders moved
wood to roadside for de-limbing and loading. Most blocks were scarified 1 -10 years after harvesting,
and some were planted with nursery stock. In parts of each burned site, evidence of salvage logging and
firewood collection was observed (particularly in the Gregg River Burn), but the extent and timing of
such activities are not known. In some cutblocks, evidence of pre-commercial thinning occurring
between 1976 and 1986 was observed.
Sample plots were randomly selected for each of the seven study sites using a map grid overlay.
Plots remote from motorized ground access (over 2 hours travel from a road) were replaced. The
resulting distribution of sample plots was therefore not completely random, but achieved a broad spatial
distribution across each study area (Fig. 2). A total of 195 plots were sampled, 30 plots per site except for
the Chaba River Burn (14 plots), and the Gregg River Burn (31 plots).
Field sampling procedures were based on methods for estimating volume of down deadwood
described by McRae et al. (1979). Data were recorded along a triangular transect measuring 30 m on a
side (total length 90 m), and within the 390 m2 triangular plot enclosed by the transect. All pieces of
down deadwood crossing the transect that measured at least 7 cm in diameter at the point of intersection
were tallied, with the following information recorded: piece diameter at the point of intersection; decay
class of entire piece; wood texture class at the point of intersection; distance from the ground to the
underside of the piece at the point of intersection; and proportion of the piece directly under the transect
line that was covered by bark and attached plants, fungi, or lichens. Volume of down deadwood greater
than 7 cm diameter was estimated using the equation given by Van Wagner (1968) and Brown (1974),
converted to cubic metres per hectare:
ν = 10 000 ( π2 Σ ( di2 )) / (8l),
where ν = volume of down deadwood, in m3 / ha, d = diameter of each piece of deadwood crossing the
transect in metres, l = length of transect in metres.
All free-standing dead trees over 2 m tall within the plots were tallied. Diameter at breast height
(dbh) and decay class (see Results) were also recorded for each.

9
10
Standing dead trees and down deadwood were divided into two categories of origin: pre-
disturbance and post-disturbance. If the dbh of a standing dead tree or the diameter of a piece of down
deadwood at the transect line was greater than the dbh of the largest live tree in a plot, it was considered
pre-disturbance origin (see Lee et al. 1995). All other deadwood was considered post-disturbance origin.
Pre-disturbance deadwood smaller than post-disturbance live trees would be incorrectly classified as post-
disturbance in origin. Therefore our estimates of the structural components of the previous stand are
likely conservative. The amount of pre-disturbance material provided an estimate of the structural legacy
of the previous stand, while the amount of post-disturbance origin material provided an estimate of
deadwood recruitment through mortality of trees germinating after disturbance.
All live trees over 2 m tall were tallied within the 390 m2 plot, except when a preliminary
assessment indicated that density was very high, in which case only trees within the three 5x5x5 m corner
plots (combined sample area 32 m2) were tallied. For each tree, species and dbh were recorded.
The abundance, size and condition of down deadwood, standing dead trees and live trees in
burned and logged sites were compared using Student's t-test (Zar 1984). Since assumptions of the t-test
(normality and homogeneity of variance) were not met in all cases, we also performed the non-parametric
equivalent (Mann-Whitney U test) and reported any discrepancies with respect to significance. All
statistical comparisons included only the six sites in the Foothills in order to minimize the effects of
topographic and edaphic variability. For each t-test, the minimum power to correctly reject the null
hypothesis of no difference between means was estimated using a Type I error probability of 0.05. We
estimated the power to detect two magnitudes of differences between means, set at ±50% of the overall
mean and ±10% of the overall mean. For example, if the sample mean abundance of down deadwood in
burned and logged sites equaled 130 and 140 pieces respectively, we estimated power to detect a
difference between means of 135 pieces (±50% of the overall mean) and 27 pieces (±10% of the overall
mean). Power was estimated using the formula given by Nemec (1991:14) and accompanying SAS
functions (SAS 1989).
To more fully understand the pattern of differences in down deadwood among the seven study
sites, we also used principal components analysis (PCA) to construct a set of new, uncorrelated factors
which accounted for a known proportion of the variability within the correlation matrix of nine deadwood
attributes (Johnson and Wichern 1988). To improve the interpretability of the resulting factors, varimax
rotation was used to minimize the number of attributes that were strongly correlated with a single factor
(Norušis 1992). We interpreted factors by inspecting their correlations, or loadings, with the original nine
attributes, and differences among sites were illustrated using mean values of each factor. Although many

11
attributes were positively skewed (skewness values ranging -0.12 to 2.06), no transformations were
performed, permitting assessments of the influence of actual attribute values on the resulting factors.
Interpretations of the PCA results should therefore be made with caution.
Results
Inspection of annual growth rings of selected trees in each plot confirmed that mortality in almost
all plots was complete, and was followed by the establishment of a new cohort. In fire-origin sites, the
average size of the largest live tree in a plot ranged from 11.1 cm (range 5 - 30 cm) dbh at Smith Creek, to
20.4 cm (range 12 - 33 cm) dbh at Chaba River. In harvest-origin sites, the average size of the largest live
tree in a plot ranged from 12.9 cm (range 7 - 19 cm) dbh at Smith Creek to 14.1 cm (range 4 - 37 cm) dbh at
Gregg River.
The mean density of live trees > 2 m tall in the four burned sites was highly variable, ranging from
1 791 to 18 656 trees / ha (median 1 001 - 14 780 trees / ha, Table 1). All four burns were dominated (70-
91% of basal area) by lodgepole pine (Pinus contorta Dougl. ex Loud var latifolia Engelm., with smaller
proportions of black spruce (Picea mariana (Mill.) BSP), white spruce (P. glauca (Moench) Voss),
Engelmann spruce (P. Engelmannii), white x Engelmann spruce hybrids (P. glauca x Engelmannii) fir spp.
(Abies lasiocarpa (Hook.) Nutt, A. balsamifera (L.) Mill.) and deciduous tree species including Populus
tremuloides Michx., P. balsamifera L. and Betula papyrifera Marsh. (Table 1).
The mean density of live trees > 2 m tall in the three logged sites ranged from 3 719 to 5 979 trees /
ha (median 2 707 to 4 734 trees / ha, Table 1), and was not significantly different from burned sites (t =
2.60, df = 4, p = 0.060). The power of this test was low (46% probability of detecting a difference of ±50%
of the overall mean). However, the variability in tree density (estimated by SD) was significantly less in
logged sites (t = 3.31, df = 4, p = 0.030, Table 1). Two logged sites were dominated by lodgepole pine
(75% and 97% of basal area) but the third (Lynx Creek) contained 40% pine, with 35% deciduous trees and
18% subalpine fir (Table 1).
In the three Foothills burned sites, most live trees were relatively small. Trees less than 5 cm dbh
comprised almost 75% of the tree cohort (average 9 249 trees / ha), compared to 52% (average 2 360 trees /
ha) in the three logged sites (Fig. 3). These small trees represented relatively minor contributions to total
stand basal area in both burned sites (23%) and logged sites (12%, Fig. 3).

12
Table 1. Summary of study site characteristics and species composition of live trees greater than 2 m tall.
Chaba River Gregg River Lynx Creek Smith CreekBurned Burned Logged Burned Logged Burned Logged
Number of sample plots 14 31 30 30 30 30 30Years since disturbance 34 40 23-27 36 23-27 40 23-27Tree density (number per ha)
Mean 1 791 10 372 5 979 9 157 3 842 18 656 3 719Median 1 001 8 006 4 734 8 160 3 015 14 780 2 707SD 1 819 9 055 4 282 8 172 3 021 14 505 3 255Interquartile Range 2 066 10 469 7 448 9 526 4 804 23 248 2 245
Tree species compositionMean basal area (m2 / ha) 12.5 28.0 16.3 22.3 12.7 19.7 9.0Lodgepole pine (%) 82.9 91.3 75.2 70.2 40.2 89.8 96.5Black spruce (%) 7.7 3.9 4.3 1.0 0.5 8.7 0.8White/ Engelmann spruce (%) 9.0 3.0 4.3 6.5 6.3 1.4 0.2Subalpine/ Balsam fir (%) 0.4 0.9 7.6 0.9 18.1 0.0 2.4Poplar / Birch (%) 0.0 0.9 8.7 21.4 35.0 0.0 0.1
Most (> 90%) of the standing dead trees observed in the study sites were recruited from
the cohort of live trees that germinated after disturbance and subsequently died. Most of these post-
disturbance origin dead trees were relatively small and in relatively early stages of decay (Figure 4).
Abundance was particularly high in the three Foothills burned sites, with an average density of 664 post-
disturbance origin dead trees / ha (Table 2). Abundance in the three logged sites was significantly lower, at
126 post-disturbance origin dead trees / ha (Table 2). Standard deviation among sites was three times
greater in burned stands than logged stands (Table 2).
Very few standing dead trees in any site were classified as pre-disturbance origin (Table 2).
However, as with post-disturbance origin standing dead trees, abundance was significantly higher and more
variable in burned sites than in logged sites (Table 2); mean densities of 79 trees / ha and 3 trees / ha were
observed in burned and logged sites, respectively.
The total volume of down deadwood > 7 cm dbh observed in each study site was highly variable
(Fig. 5), with standard deviations considerably higher in burned sites (134.5 ± 17.0 m3 / ha), than in logged
sites (51.4 ± 19.2 m3 / ha; t=5.59, df=4, p=0.005). Mean volumes in the Foothills burned sites were
significantly greater (200.0 ± 10.9 m3 / ha) than in logged sites (69.0 ± 17.1 m3 / ha; t=11.18, df=4,
p<0.001).

13

14

15

16
Table 2. Number of standing dead trees in burned (n=3) and in logged (n=3) sites1 in the Rocky Mountain Foothillsof Alberta. Mean and SD are for all plots sampled in each site; see Table 1 for number of sample plots per site.Power = minimum probability of rejecting the null hypothesis of no difference between means if p=0.05 and thedifference between the two means was equal to the specified percentage (50% and 10%) above and below theaverage of the two means. (See text for further explanation.)
Burned Loggedmean + SD mean + SD t P Power
Number of standing dead trees +50% +10%
Post-disturbance originMean 25.9 + 4.9 4.9 + 4.6 5.39 0.006 56 7SD 30.5 + 6.6 9.4 + 7.3 3.71 0.021 47 7
Pre-disturbance originMean 3.1 + 1.3 0.1 + 0.2 3.93 0.017 21 6SD 4.7 + 2.5 0.3 + 0.5 3.03 0.039 15 5
1 Excluding Chaba River Burn
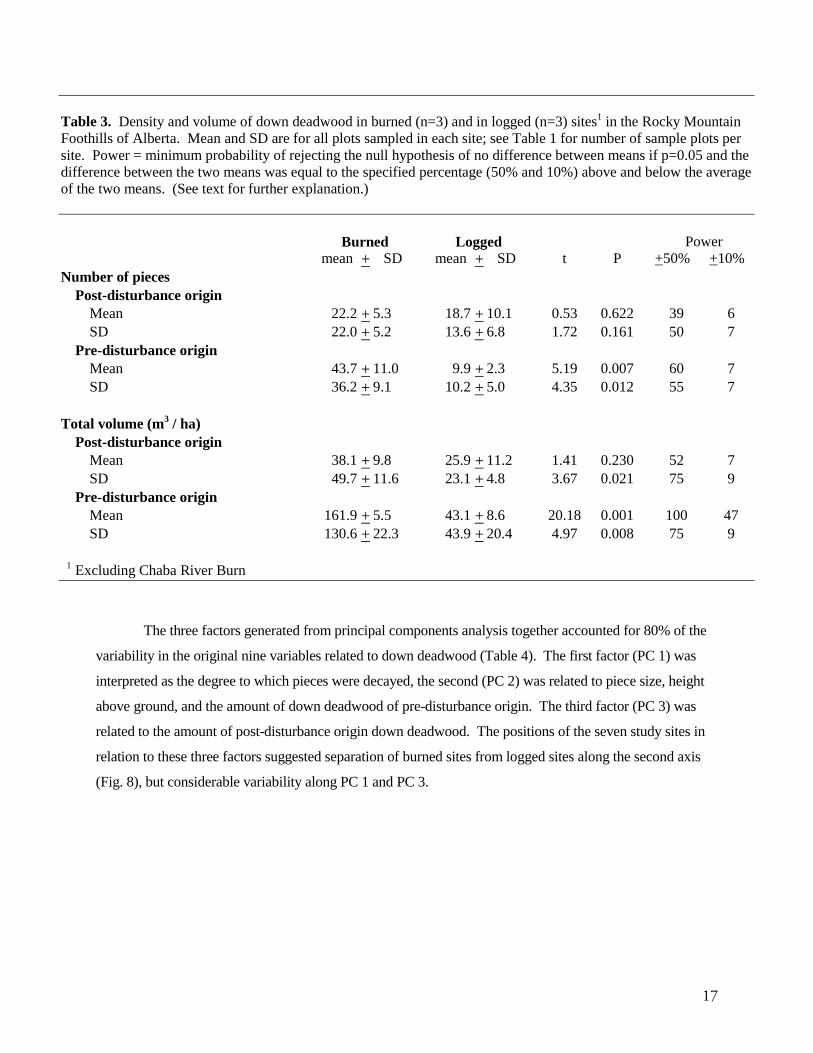
Most of the down deadwood in burned sites was carried over from the pre-disturbance stand (Table
3, Fig. 6). In the three Foothills burned sites, pre-disturbance origin down deadwood contributed an average
of 81% of the total down deadwood volume, and 66% of the total density (Table 3). In logged sites, 62% of
volume and 35% of density was of pre-disturbance origin (Table 3), but average volume and density were
much lower and less variable than in burned sites (Table 3). The average volume and density of post-
disturbance origin down deadwood did not differ significantly between burned and logged stands, although
variability was greater in burned stands (Table 3).
The size, height, and condition of down deadwood in all Foothills sites were highly variable, but the
following trends were evident (Fig. 7). Size distributions were similar, but in burned sites, 54% of the
pieces were elevated above the ground (average height of all pieces = 10 cm), compared to only 18% in
logged sites (average height of all pieces = 2 cm, Fig. 7). Relatively few down deadwood pieces were in an
early stage of decay, although burned sites contained a mean of 9.3 pieces per plot of pre-disturbance
material having a decay class of 1 or 2, compared to virtually no (mean = 0.3) such pieces in logged sites
(Fig. 7). Patterns of surface colonization by plants, fungi and lichens appeared to be similar, averaging 43%
cover in burned sites, and 53% cover in logged sites. Very little bark was present on any of the pieces of
down deadwood observed, with 98% of all pieces completely bark-free under the transect line in both
burned and logged sites.
17
Table 3. Density and volume of down deadwood in burned (n=3) and in logged (n=3) sites1 in the Rocky MountainFoothills of Alberta. Mean and SD are for all plots sampled in each site; see Table 1 for number of sample plots persite. Power = minimum probability of rejecting the null hypothesis of no difference between means if p=0.05 and thedifference between the two means was equal to the specified percentage (50% and 10%) above and below the averageof the two means. (See text for further explanation.)
Burned Logged Powermean + SD mean + SD t P +50% +10%
Number of piecesPost-disturbance origin
Mean 22.2 + 5.3 18.7 + 10.1 0.53 0.622 39 6SD 22.0 + 5.2 13.6 + 6.8 1.72 0.161 50 7
Pre-disturbance originMean 43.7 + 11.0 9.9 + 2.3 5.19 0.007 60 7SD 36.2 + 9.1 10.2 + 5.0 4.35 0.012 55 7
Total volume (m3 / ha)Post-disturbance origin
Mean 38.1 + 9.8 25.9 + 11.2 1.41 0.230 52 7SD 49.7 + 11.6 23.1 + 4.8 3.67 0.021 75 9
Pre-disturbance originMean 161.9 + 5.5 43.1 + 8.6 20.18 0.001 100 47SD 130.6 + 22.3 43.9 + 20.4 4.97 0.008 75 9
1 Excluding Chaba River Burn
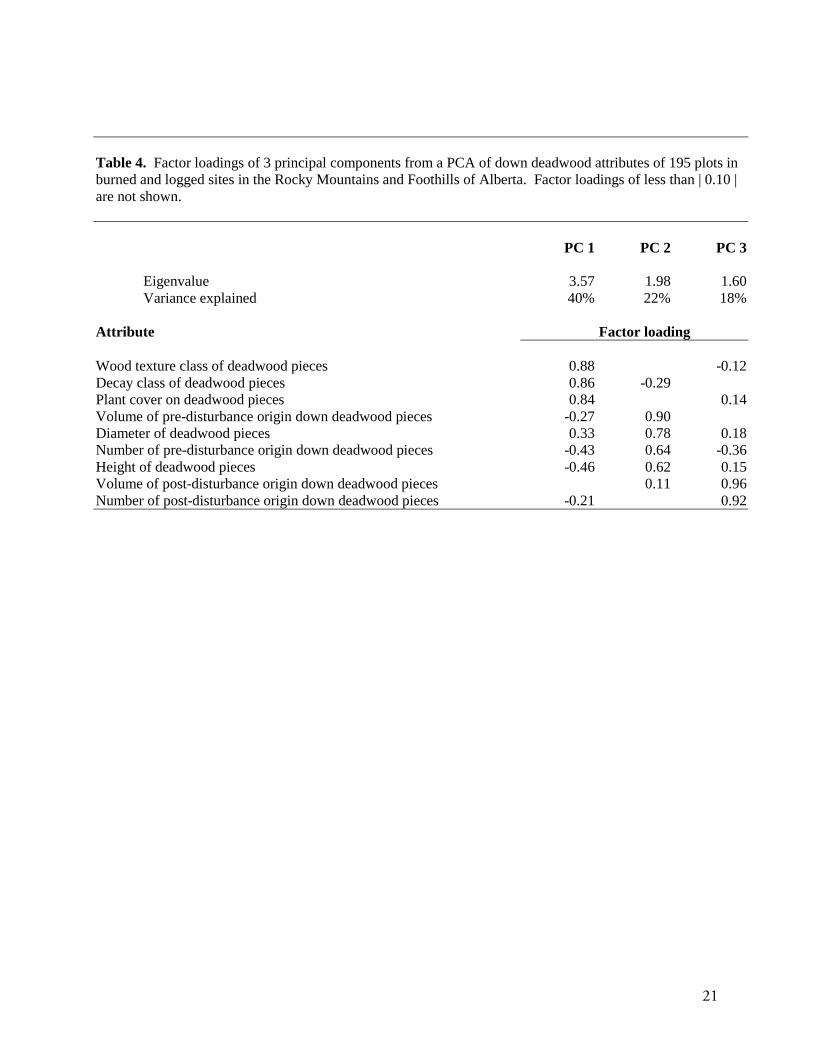
The three factors generated from principal components analysis together accounted for 80% of the
variability in the original nine variables related to down deadwood (Table 4). The first factor (PC 1) was
interpreted as the degree to which pieces were decayed, the second (PC 2) was related to piece size, height
above ground, and the amount of down deadwood of pre-disturbance origin. The third factor (PC 3) was
related to the amount of post-disturbance origin down deadwood. The positions of the seven study sites in
relation to these three factors suggested separation of burned sites from logged sites along the second axis
(Fig. 8), but considerable variability along PC 1 and PC 3.

18

19

20
21
Table 4. Factor loadings of 3 principal components from a PCA of down deadwood attributes of 195 plots inburned and logged sites in the Rocky Mountains and Foothills of Alberta. Factor loadings of less than | 0.10 |are not shown.
PC 1 PC 2 PC 3
Eigenvalue 3.57 1.98 1.60Variance explained 40% 22% 18%
Attribute Factor loading
Wood texture class of deadwood pieces 0.88 -0.12Decay class of deadwood pieces 0.86 -0.29Plant cover on deadwood pieces 0.84 0.14Volume of pre-disturbance origin down deadwood pieces -0.27 0.90Diameter of deadwood pieces 0.33 0.78 0.18Number of pre-disturbance origin down deadwood pieces -0.43 0.64 -0.36Height of deadwood pieces -0.46 0.62 0.15Volume of post-disturbance origin down deadwood pieces 0.11 0.96Number of post-disturbance origin down deadwood pieces -0.21 0.92

22
23
Discussion
The woody infrastructure of fire-origin stands sampled in this study was more variable than
harvest-origin stands. This variability was propagated largely by the presence of fire-killed trees, some of
which remained standing and relatively intact up to 40 years after fire. Once fallen, these trees from the
previous stand contributed to a large, but variable, pool of down deadwood that subsequently decayed.
Post-fire conditions for germination and establishment probably facilitated a high density of small live
trees, with subsequent mortality contributing additional deadwood to the stand. Unlike fire, logging
removed much of the source for recruitment of down deadwood in harvest-origin stands. In addition, the
lower density of live trees in such stands may be less likely to create conditions in which mortality during
succession contributes additional deadwood, although mortality in some stands was accelerated by
thinning operations.
This interpretation of stand dynamics in fire-origin stands is consistent with the results of
previous observations from chronosequences in northern Alberta (Lee et al. 1995, 1997), Glacier National
Park (Jeske and Bevins 1979), Olympic National Park (Agee and Huff 1987) and the Cascade Range in
Washington and Oregon (Spies et al. 1988). In each of these studies, fire-killed trees contributed to
initially high amounts of deadwood, which gradually decreased with time through decomposition, then
becoming higher in older stands through tree mortality. Deviations from this U-shaped pattern were
observed in stands in the Oregon Coast Range that were probably immature at the time of burning (Spies
et al. 1988).
The magnitude of the pulse of tree mortality in the four sampled burns is unknown without data
from immediately after the wildfire, but it is reasonable to assume that the density of pre-disturbance
origin standing dead trees at the time of sampling was much lower than immediately after the fire. This
assumption was supported by examination of photographs taken shortly after each fire, in which high
densities of standing dead trees were observed in each burn. Lyon (1977) estimated that fire-killed
lodgepole pine snags in a Montana burn fell at a rate of 8.9% per year during the first 15 years, which
extrapolates to 2.6% remaining after 40 years. Other studies indicate that standing dead trees frequently
decay very slowly (e.g., Johnson and Greene 1991), with some fire-killed lodgepole pine trees still
standing after 110 years (Fahey 1983). Small standing dead trees probably fall at higher rates than large
ones (Lyon 1977; Cline et al. 1980; Raphael and Morrison 1987; but see Johnson and Greene 1991,
Harrington 1996).

24
During the initial few decades following wildfire, the falling of standing dead trees in boreal
forest stands is accompanied by an increase in the volume of down deadwood (Harmon et al. 1986; Agee
and Huff 1987, Spies et al. 1988), unless the decomposition rate of down deadwood is high. For example,
Lee et al. (1995) found no differences in the volume of pre-fire origin down deadwood between young
(25 years) and mature (55 years) aspen dominated stands despite a significant decline in the density of
standing dead trees, suggesting that rates of removal through decomposition were similar to rates of input
from falling dead trees. The decomposition rate of wood in coniferous forests is frequently very slow
(McFee and Stone 1966; Harvey et al. 1981). Fahey (1983) found that pre-disturbance origin down
deadwood was abundant in lodgepole pine stands that burned between 80 and 110 years prior to
sampling. Elevation above the ground surface caused by fallen boles lying on top of one another (Fig. 7)
probably contributes to increased longevity, as such material decays more slowly than material in contact
with the ground (Fahey 1983; Barber and Van Lear 1984; Erickson et al. 1985; Edmonds et al. 1986; Wei
et al. 1997). Elevated coniferous logs in northern Sweden had few lichen or bryophyte species compared
to logs in contact with the ground (Söderström 1988). Coverage by lichen, fungi and bryophytes is
probably associated with accelerated decomposition rates (McCullough 1948; Mattson et al. 1987).
The abundance of deadwood of post-disturbance origin in the four burned sites (Tables 2, 3)
corresponds to natural thinning, which probably explains the presence of relatively intact post-disturbance
down deadwood (Fig. 7). Tree mortality is frequently very high in young fire-origin lodgepole pine
stands (Fahey 1983; Lotan et al. 1985). The high density of live trees in the burns sampled in this study
(Table 1) indicates that high mortality rates and input of deadwood are likely to continue, although
mortality rates may decrease as stands age (e.g., Douglas-fir, Cline et al. 1980).
While the above discussion suggests successional trends within fire-origin stands sampled in this
study, the wide variability in woody stand structure observed (Tables 2, 3, Figs. 5, 6) is also typical of
recently burned temperate forests (Fahenstock 1976; Alexander 1979; Brown and See 1981). The
primary source of this variability is probably pre-disturbance vegetation structure and composition,
although fire severity and other factors may also contribute (see below). In samples from a wide range of
stands, Lotan et al. (1985) found that stand age at the time of burn was considerably more important than
time since fire in predicting quantities of down deadwood. Burning of relatively young stands would
result in less carry-over of woody material to the next stand (Spies et al. 1988), with frequent repeated
disturbances probably reducing the overall supply of deadwood (Mattson et al. 1987). Smaller tree boles
may also decay more quickly than larger boles due to their proportionally higher surface area to provide
access for decay-causing organisms (Abbott and Crossley 1982; Edmonds et al. 1986; Wei et al. 1997),
25
although Barber and Van Lear (1984) and Erickson et al. (1985) suggested that small pieces of wood may
decay more slowly because of their lower moisture content relative to larger pieces.
Some additional variability among sites may have been associated with regional climatic
differences which in turn may influence decomposition rates. Decomposition of down deadwood may
have been slower in the higher elevation Chaba River Burn due to a shorter growing season (Fahey 1983).
Variable aspect exposure probably also affects decomposition rates, as suggested by Erickson et al.
(1985) and Mattson et al. (1987).
Tree species composition probably also influences deadwood abundance through variable decay
rates of different species (Harmon et al. 1986). For example, lodgepole pine logs (Fahey 1983) probably
decay more slowly than trembling aspen (Miller 1983; Gosz 1980), possibly due to their higher lignin
content (Harmon et al. 1986). Decomposition rates in general tend to be faster in deciduous forests
compared to coniferous forests (Arthur and Fahey 1990). Without data on fire severity in the burns
sampled in this study, it is difficult to assess the potential contribution of this factor to variability in stand
structures observed. Few sample plots contained survivors of the pre-disturbance stand, suggesting
almost complete tree mortality over much of each burn. Such a pattern is typical in many coniferous
forests (Rowe and Scotter 1973; Johnson 1992), as is the relatively small amount of wood biomass
combusted and exported during most forest fires (Arno 1980; Lotan et al. 1985; Wei et al. 1997).
Interpretation of differences between burned and logged stands would be assisted by information
on pre-disturbance forest structure and composition. The logged stands sampled in this study contained a
merchantable wood volume of at least 72 m3 / ha to be eligible for harvesting (Crossley 1978), although
most probably contained greater than 200 m3 / ha. Their pre-disturbance structure and composition was
probably more uniform than burned stands given that fires disturb a wide range of stand types (Rowe and
Scotter 1973). This, in addition to the removal of trees during logging, probably contributed to the lower
variability in the volume of pre-disturbance origin deadwood observed in logged stands compared to
burned stands (Table 3).
In logged sites, existing deadwood and logging debris in the form of small trees, large branches
and tops would have contributed some down deadwood to the subsequent stand after logging, as would
the thinned material from spacing operations. The decay rate of this down deadwood may be higher in
logged sites relative to burned sites because much of the deadwood is in contact with the ground (Fig. 7),
facilitating a higher moisture content favorable to decay-causing organisms (Fahey 1983; Mattson et al.
26
1987, Wei et al. 1997). Fragmentation of down deadwood during harvest operations and site preparation
may also accelerate decomposition rates (Sollins 1982; Spies et al. 1988).
Management implications
Overall, the results of this study suggest that the temporal dynamics of stand structure differ
considerably between the burned and logged stands sampled (Figs. 6, 8). Since the amount of deadwood
originating in the previous stand can only decline during succession through decomposition (Harmon et
al. 1986), and since standing dead trees of pre-disturbance origin were scarce in the logged stands
sampled (Table 2), the lower volume (Fig. 6A), lower position relative to the ground (Fig. 7) and possibly
more advanced decay (Fig. 7) of down deadwood suggest that pre-disturbance deadwood will be depleted
in logged stands earlier during succession than in burned stands. Because the density of live and recently
dead trees was lower in logged stands than burned stands (Tables 1, 2), mortality during succession is not
likely to reverse this trend.
Changes in biodiversity associated with deadwood may occur at a regional scale if efforts to limit
disturbance by suppressing wildfires are successful. Prescribed burning of non-merchantable stands
adjacent to logged stands would increase the regional supply of deadwood, although these would
represent a limited range of stand types relative to those burned by wildfire.
One proposed solution is to expand the range of structural conditions created through harvesting
to more closely approximate the range of variability produced by natural disturbance (Hansen et al. 1991,
Swanson et al. 1993). Although this model is appealing, our data suggest that the substantial differences
in deadwood structures propagated by current logging practices compared to fire offer a considerable
challenge to successful implementation in conifer-dominated forests. For example, while the distribution
and frequency of stand-replacing wildfires have been suggested as an appropriate spatial model for
harvesting (Hunter 1993), the within-stand structural legacy of clear-cutting appears to be dissimilar to
that of wildfire (Lee et al. 1997, Wei et al. 1997, this study). In Canada, over 85% of harvesting is done
by clear-cutting (Canadian Council of Forest Ministers 1996), a method that receives considerable support
for its economic and silvicultural benefits (Keenan and Kimmins 1993).
Application of the "natural disturbance model" (Swanson et al. 1993) to harvesting methods
within stands would require managers to expand the range of variability in the amount of deadwood in
logged stands to more closely resemble amounts present after natural disturbance such as wildfire.

27
Because economic and silvicultural considerations will tend to limit the total amount of wood left in
cutblocks, decisions on how to provide present and future deadwood need to be made carefully. Of
particular concern is the provision of an adequate range of deadwood supply in stands several decades
after disturbance, e.g., during the latter half of a planned rotation interval of approximately 80 years.
Though emulation of wildfire-origin stands immediately after harvest is unlikely, retention of
standing live and dead trees in some stands at the time of harvest supplies deadwood in future logged
stands (Lee et al. 1995; Alberta Forest Products Association 1996). Retention of standing stems in
clumps rather than single trees would increase the probability that fallen boles would decay slowly.
Fallen boles would have a greater probability of being propped above the ground on boles that fell
previously, as occurs in fire-origin stands (Fig. 7). If the recruitment of down deadwood through
mortality of live trees was insufficient, it could be accelerated by killing some live trees (e.g., Bull and
Partridge 1986; Siitonen and Martikainen 1994) later during succession.
Additional strategies for providing deadwood include the protection of down deadwood present
prior to harvest, and the retention of down deadwood created by harvest operations (Lee et al. 1995;
Greater Fundy Ecosystem Research Group 1997). Down deadwood in advanced stages of decay may be
easily fragmented by machinery used for harvesting and site preparation (Edmonds et al. 1986; Wei et al.
1997). Minimizing the impacts of this machinery in at least some stands would potentially slow
decomposition and increase future deadwood supply. The piling of down deadwood in the form of large
branches, small boles, and other unutilized material would also delay decomposition, although piling
would also contribute to lower deadwood abundance over the rest of the stand. The burning of residue
piles, believed to reduce the risk of fire and colonization by tree pathogens in the regenerating stand,
further reduces the supply of deadwood (Graham et al. 1994), and perhaps maintaining only large
diameter material in debris piles would alleviate these concerns. Graham et al. (1994) recommended
amounts of down deadwood to be retained after forest harvesting in a variety of Rocky Mountain cover
types, based on optimal levels of ectomycorrizal activity. Setting different targets for deadwood supply
among harvest units (e.g., low, medium, high) would assist in propagating a desired future range of
variability.
Finally, if these or other approaches intended to approximate the effects of natural disturbance
regimes were implemented, it would also be prudent to monitor structural dynamics and biological
response under a range of retention strategies, and identify thresholds for attributes such as down
deadwood volume for selected species or processes (e.g., Volney et al. 1999). In this way, ecological
benefits could be more accurately quantified against the potential economic costs of attempting to emulate
28
natural disturbance in harvested stands. Within protected areas, where prescribed fire may be the
preferred management tool, this study suggests a range of deadwood supply in burned stands which
managers may wish to strive for in support of objectives to maintain natural processes.
Acknowledgements
Kim MacLean, Carol Bot, Dean MacDonald, Lanny Shepherd, Jim Voss, Susan Cotterill and
Brian Logan collected most of the field data in this study. Reviews by R. Bonar, D. Gilmore, P. Lee, H.
Lougheed, A. Schenk and B. Udell greatly improved the final version of this paper. Financial support
was provided by the Canadian Forest Service through the Model Forest Program, and by Weldwood of
Canada Limited (Hinton Division). Logistical support was provided by the Environmental Training
Centre in Hinton, Weldwood of Canada, Jasper National Park, Alberta Environmental Protection, and
Foothills Model Forest.

29
Literature cited
Abbott, D.T. and Crossley, D.A. 1982. Woody litter decomposition following clearcutting. Ecology 63:
35-42.
Agee, J.K. and Huff, M.H. 1987. Fuel succession in a western hemlock/Douglas-fir forest. Can. J. For.
Res. 17: 697-704.
Alberta Forest Products Association. 1996. Residual trees in cut overs. Unpublished discussion paper. 13
pp.
Alexander, M.E. 1979. Fuels description in lodgepole pine stands of the Colorado Front Range. M.S.
Thesis, Colorado State University, Fort Collins, CO. 150 pp.
Andersson, L.I. and Hytteborn, H. 1991. Bryophytes and decaying wood - a comparison between
managed and natural forest. Holarc. Ecol. 14: 121-130.
Arno, S.F. 1980. Forest fire history in the northern Rockies. J. For. 78: 460-465.
Arthur, M.A. and Fahey, T.J. 1990. Mass and nutrient content of decaying boles in an Engelmann spruce
- subalpine fir forest, Rocky Mountain National Park, Colorado. Can. J. For. Res. 20: 730-737.
Atlegrim, O. and Sjoberg, K. 1995. Effects of clear-cutting and selective felling in Swedish boreal
coniferous forest: response of invertebrate taxa eaten by birds. Ent. Fennica 6: 79-90.
Barber, B.L. and Van Lear, D.H. 1984. Weight loss and nutrient dynamics in decomposing woody
loblolly pine logging slash. Soil Sci. Soc. Am. J. 48: 906-910.
Boddy, L. and Watkinson, S.C. 1995. Wood decomposition, higher fungi, and their role in nutrient
redistribution. Can. J. Bot. 73(1): S1377-S1383.
Brown, J. K. 1974. Handbook for inventorying downed woody material. Intermountain Forest and Range
Experiment Station, U.S. Department of Agriculture, Forest Service, General Technical Report
INT-16. 24 pp.
Brown, J.K. and See, T.E. 1981. Downed dead woody fuel and biomass in the northern Rocky Mountains.
U.S. Department of Agriculture, Forest Service, Gen. Tech. Rep. INT-117.
Bull, E.L. and Partridge, A.D. 1986. Methods of killing trees for use by cavity nesters. Wildl. Soc. Bull.
14: 142-146.
Bunnell, F.L. 1995. Forest-dwelling vertebrate faunas and natural fire regimes in British Columbia:
implications to conservation. Cons. Biol. 9: 636-644.
Canadian Council of Forest Ministers. 1992. Sustainable forests: a Canadian commitment. Canadian
Council of Forest Ministers, Hull, PQ.
Canadian Council of Forest Ministers. 1996. Compendium of Canadian Forestry Statistics. Natural
Resources Canada, Ottawa.
30
Cline, S.P., Berg, A.B. and Wight, H.M. 1980. Snag characteristics and dynamics in Douglas-fir forests,
western Oregon. J. Wildl. Manage. 44(4): 773-786.
Crossley, D.I. 1978. Forest management by North Western Pulp and Power Ltd. Case Study No. 3. Based
on lodgepole pine and spruce forest. Forest Management Institute Information Report FMR-X-
103.
DeLisle, G.P. and Hall, R.J. 1987. Forest fire history maps of Alberta, 1931 to 1983. Canadian Forest
Service, Northern Forestry Centre, Edmonton, Cat. No. Fo42-96/1987E.
Edmonds, R.L., Vogt, D.J., Sandberg, D.H. and Driver, C.H. 1986. Decomposition of Douglas-fir and red
alder wood in clear-cuttings. Can. J. For. Res. 16: 822-831.
Erickson, H.E., Edmonds, R.L., and Peterson, C.E. 1985. Decomposition of logging residues in Douglas-
fir, western hemlock, Pacific silver fir, and ponderosa pine ecosystems. Can. J. For. Res. 15: 914-
921.
Fahey, T.J. 1983. Nutrient dynamics of aboveground detritus in lodgepole pine (Pinus contorta ssp.
latifolia) ecosystems, southeastern Wyoming. Ecol. Monogr. 53(1): 51-72.
Fahnestock, G.R. 1976. Fires, fuels, and flora as factors in wilderness management: The Pasayten case.
Pp. 33-69 in Tall Timbers Fire Ecology Conference Proc. Tall Timbers Research Station,
Tallahassee, FL.
Franklin, J.F., Shugart, H.H. and Harmon, M.E. 1987. Tree death as an ecological process: the causes,
consequences, and variability of tree mortality. BioSci. 37(8): 550-556.
Gosz, J.R. 1980. Biomass distribution and production budget for a nonaggrading forest ecosystem.
Ecology 61: 507-514.
Government of Alberta. 1998. Alberta fire incidence data. Alberta Environmental Protection.
http://www.gov.ab.ca/~env/lfs/fpd/firedata/firedata.html. Accessed 5 January, 1998.
Graham, R.T., Harvey, A.E., Jurgensen. M.F., Jain, T.B., Tonn, J.R. and Page-Dumroese, D.S. 1994.
Managing coarse woody debris in forests of the Rocky Mountains. U.S. Department of
Agriculture, Forest Service, Res. Pap. INT-447.
Greater Fundy Ecosystem Research Group. 1997. Forest management guidelines to protect native
biodiversity in the Fundy Model Forest. New Brunswick Co-operative Fish and Wildlife
Research Unit, University of New Brunswick, Fredericton.
Haapanen, A. 1965. Bird fauna of the Finnish forests in relation to forest succession. 1. Ann. Zool. Fenn.
2: 153-196.
Hansen A.J., Spies, T.A., Swanson, F.J. and Ohman, J.L. 1991. Conserving biodiversity in managed
forests: lessons from natural forests. BioSci. 41(6): 382-392.

31
Harmon, M.E., Franklin, J.F., Swanson, F.J., Sollins, P., Gregory, S.V., Lattin, J.D., Anderson, N.H.,
Cline, S.P., Aumen, N.G., Sedell, J.R., Lienkaemper, G.W., Kromack, K. Jr. and Cummins, K.W.
1986. Ecology of coarse woody debris in temperate ecosystems. Adv. Ecol. Res. 15: 133-301.
Harrington, M.G. 1996. Fall rates of prescribed fire-killed ponderosa pine. U.S. Department of
Agriculture, Forest Service, Res. Pap. INT-489.
Harvey, A.E., Jurgensen, M.F., Larsen, M.J. and Graham, R.T. 1987. Decaying organic materials and soil
quality in the Inland Northwest: a management opportunity. U.S. Department of Agriculture,
Forest Service, Gen. Tech. Rep. INT-225.
Harvey, A.E. Larsen, M.J. and Jurgensen, M.F. 1981. Rate of woody residue incorporation into Northern
Rocky Mountain forest soil. U.S. Department of Agriculture, Forest Service, Res. Pap. INT-282.
Hayes, J.P. and Cross, S.P. 1987. Characteristics of logs used by western red-backed voles,
Clethrionomys californicus, and deer mice, Peromyscus maniculatus. Can Field-Nat. 101(4): 543-
546.
Hunter, M.L. Jr. 1990. Wildlife, forests and forestry: principles of managing forests for biological
diversity. Prentice-Hall Inc., Englewood Cliffs, NJ.
________. 1993. Natural fire regimes as spatial models for managing boreal forests. Biol. Cons. 65: 115-
120.
Jeske, B.W. and Bevins, C.W. 1979. Spatial and temporal distribution of natural fuels in Glacier Park.
U.S. Department of the Interior, National Park Service, Tran. and Proc. Ser. 5: 1219-1224.
Johnson, E.A. 1992. Fire and vegetation dynamics: studies from the North American boreal forest.
Cambridge University Press, Cambridge GB.
Johnson, E.A. and Greene, D.F. 1991. A method for studying dead bole dynamics in Pinus contorta var.
latifolia - Picea engelmannii forests. J. Veg. Sci. 2: 523-530.
Johnson, R.A. and Wichern, D.W. 1988. Applied multivariate statistical analysis. Prentice-Hall, Inc.,
Englewood Cliffs, NJ.
Jurgensen, M.F., Graham, R.T., Larsen, M.J. and Harvey, A.E. 1992. Clear-cutting, woody residue
removal, and nonsymbiotic nitrogen fixation in forest soils of the Inland Pacific Northwest. Can.
J. For. Res. 22: 1172-8.
Keenan, R.J. and Kimmins, J.P. 1993. The ecological effects of clearcutting. Environ. Rev. 1: 121-144.
Larson, M.J., Jurgensen, M.F. and Harvey, A.E. 1978. N2 fixation associated with wood decayed by some
common fungi in western Montana. Can. J. For. Res. 8: 341-345.
32
Lee, P.C., Crites, S., Nietfeld, M., Van Nguyen, H. and Stelfox, J.B. 1995. Changes in snags and down
woody material characteristics in a chronosequence of aspen mixedwood forests in Alberta. Pp.
49-61 in Stelfox, J.B. (ed.), Relationships between stand age, stand structure, and biodiversity in
aspen mixedwood forest in Alberta. Jointly published by Alberta Environmental Centre
(AECV95-R1) and Canadian Forest Service (Project No. 0001A), Edmonton, AB. 308 pp.
Lee, P.C., Crites, S., Neitfeld, M., Van Nguuyen, H. and Stelfox, J.B. 1997. Characteristics and origins of
deadwood material in aspen-dominated boreal forests. Ecological Applications 7(2): 691-701.
Lindenmayer, D.B. and Franklin, J.F. 1997. Managing stand structure as part of ecologically sustainable
forest management in Australian mountain ash forests. Cons. Biol. 11(5):1053-1068.
Lotan, J.E., Brown, J.K. and Neuenschwander, L.F. 1985. Role of fire in lodgepole pine forests. Pp. 133-
152 in Lodgepole pine: the species and its management. Washington State University, Seattle.
Lyon, J.L. 1977. Attrition of lodgepole pine snags of the Sleeping Child Burn, Montana. U.S. Department
of Agriculture, Forest Service, Res. Note INT-219.
Lyon, J.L. 1984. The Sleeping Child Burn - 21 years of postfire change. U.S. Department of Agriculture,
Forest Service, Res. Pap. INT-330.
Maser, C. and Trappe, J.M. 1984. The seen and unseen world of the fallen tree. U.S. Department of
Agriculture, Forest Service, Gen. Tech. Rep. PNW-164.
Mattson, K.G., Swank, W.T. and Waide, J.B. 1987. Decomposition of woody debris in a regenerating,
clear-cut forest in the Southern Appalachians. Can. J. For. Res. 17: 712-721.
McAlister, S. 1995. Species interactions and substrate specificity among log-inhabiting bryophyte
species. Ecology 76(7): 2184-2195.
McCollough, H.A. 1948. Plant succession on fallen logs in a virgin spruce-fir forest. Ecology 29(4): 508-
513.
McFee, W.W. and Stone, E.L. 1966. The persistence of decaying wood in the humus layers of northern
forests. Soil Sci. Soc. Amer. Proc. 30: 513-516.
McRae, D.J., Alexander, M.E. and Stocks, B.J. 1979. Measurement and description of fuels and fire
behavior on prescribed burns: a handbook. Canadian Forest Service Inf. Rep. O-X-287.
Miller, W.E. 1983. Decomposition rates of aspen bole and branch litter. For. Sci. 29: 351-356.
Mooney, H.A., Bonnicksen, T.M., Christensen, N.L, Lotan, J.E. and Reiners, W.A. 1981. Fire regimes
and ecosystem properties: U.S. Department of Agriculture Forest Service, Gen. Tech. Rep. WO-
26
Nemec, A.F.L. 1991. Power analysis handbook for the design and analysis of forestry trials. B.C.
Ministry of Forests, Forest Science Research Branch, Biometric information handbook series,
ISSN 1183-9759(2).
33
Niemela, J. 1997. Invertebrates and boreal forest management. Cons. Biol. 11(3): 601-610.
Norusis, M. J. 1992. SPSS/PC+ Professional statistics, Version 5. SPSS Inc., Chicago, IL.
Packham, J. R. and Harding, D.J.L. 1982. Ecology of woodland processes. Arnold, London.
Raphael, M.G. and Morrison, M.L. 1987. Decay and dynamics of snags in the Sierra Nevada. For. Sci.
33(3): 774-783.
Roskoski, J.P. 1981. Nitrogen fixation in hardwood forests of the northeastern United States. Plant Soil.
54: 33-44.
Rowe, J.S. 1972. Forest regions of Canada. Department of Fisheries and the Environment, Canadian
Forestry Service Publication No. 1300.
Rowe, J.S. and Scotter, G.W. 1973. Fire in the boreal forest. Quat. Res. 3: 444-464.
Rydin, H., Diekmann, M., and Hallingback, T. 1997. Biological characteristics, habitat associations, and
distribution of macrofungi in Sweden. Cons. Biol. 11(3): 628-640.
Samuelsson, Gustafsson, L, and Ingelog, T. 1994. Dying and dead trees - a review of their importance for
biodiversity. Swedish Threatened Species Unit, Uppsala.
SAS Institute Inc. 1989. SAS/STAT user's guide, Version 6, fourth edition, volume 2. SAS Institute Inc.,
Carey, NC.
Siitonen, J. and Martikainen, P. 1994. Occurrence of rare and threatened insects living on decaying
Populus tremula: a comparison between Finnish and Russian Karelia. Scand. J. For. Res. 9:185-
191.
Soderstrom, L. 1988. Sequence of bryophytes and lichens in relation to substrate variables of decaying
coniferous wood in Northern Sweden. Nord. J. Bot. 8(1): 89-97.
Sollins, P. 1982. Input and decay of coarse woody debris in coniferous stands in western Oregon and
Washington. Can. J. For. Res. 12: 18-28.
Spies, T.A., Franklin, J.F. and Thomas, T.B. 1988. Coarse woody debris in Douglas-fir forests of western
Oregon and Washington. Ecology 69(6): 1689-1702.
Swanson, F.J., Jones, J.A., Wallin, D.O. and Cissel, J.H. 1993. Natural variability - implications for
ecosystem management. Pp. 89-103 in Jensen, M.E. and P.S. Bourgeron (eds.), Forest ecosystem
health assessment - Volume II: Ecosystem management: principles and applications. U.S.
Department of Agriculture, Forest Service, Pacific Northwest Research Station, Portland, OR.
Van Wagner, C. E. 1968. The line intersect method in forest fuel sampling. Forest Science 14(1):20-26.
Vare, H. 1989. Influence of decaying birch logs to Scots pine mycorrhizae at clear-cutted ploughed sites
in northern Finland. Agric. Ecosys. Environ. 28: 539-545.

34
Volney, W.J.A., J.R. Spence, M.G. Weber, D.W. Langor, K.I. Mallett, J.D. Johnson, I.K. Edwards, G.R.
Hillman and B.E. Kishchuk. 1999. Assessing components of ecosystem integrity in the EMEND
experiment. Pp. 244-249 in T.S. Veeman, D.J. Smith, B.G. Purdy, F.J. Salkie and G.A. Larkin,
Science and Practice: Sustaining the Boreal Forest, Proceedings of the 1999 Sustainable Forest
Management Network Conference. Sustainable Forest Management Network, Edmonton,
Alberta. 816 pp.
Wei, X., Kimmins, J.P., Peel, K. and Steen, O. 1997. Mass and nutrients in woody debris in harvested and
wildfire-killed lodgepole pine forests in the central interior of British Columbia. Can. J. For. Res.
27:148-155.
Zar, J.H. 1984. Biostatistical analysis. Prentice-Hall, Inc., Englewood Cliffs, NJ


