HLN Guidance and Crash Risk 20121105
48
MANAGEMENT EARNINGS GUIDANCE AND STOCK PRICE CRASH RISK Sophia J.W. Hamm Fisher College of Business The Ohio State University Columbus, OH 43210 (614) 292-2529 [email protected] Edward X. Li Zicklin School of Business Baruch College New York, NY 10010 (646) 312-3235 [email protected] Jeffrey Ng School of Accountancy Singapore Management University Singapore, Singapore 178900 +65 6828 0543 [email protected] November 5, 2012 ____________________ We appreciate helpful comments from Darren Roulstone, Nemit Shroff, Andy Van Buskirk, and conference participants at the University of Minnesota Empirical Accounting Conference 2012.
Transcript of HLN Guidance and Crash Risk 20121105

MANAGEMENT EARNINGS GUIDANCE AND STOCK PRICE CRASH RISK
Sophia J.W. Hamm Fisher College of Business The Ohio State University
Columbus, OH 43210 (614) 292-2529
Edward X. Li Zicklin School of Business
Baruch College New York, NY 10010
(646) 312-3235 [email protected]
Jeffrey Ng
School of Accountancy Singapore Management University
Singapore, Singapore 178900 +65 6828 0543
November 5, 2012
____________________ We appreciate helpful comments from Darren Roulstone, Nemit Shroff, Andy Van Buskirk, and conference participants at the University of Minnesota Empirical Accounting Conference 2012.

MANAGEMENT EARNINGS GUIDANCE AND STOCK PRICE CRASH RISK
Abstract
Hutton, Marcus, and Tehranian (JFE 2009) show that more transparent financial reporting of earnings reduces the likelihood of a future stock price crash. We extend their work by examining how management earnings guidance is related to such crash risk. Accounting for endogeneity in guidance decisions, we find that higher annual guidance frequency is associated with higher crash risk, which contrasts with the notion that more guidance enhances transparency and reduces crash risk. Consistent with agency problems being an explanation, we find that the positive association is stronger for firms with higher executive stock ownership, weaker external monitoring, lower litigation risk, more upward-biased forecasts, and more opaque earnings. We also show that the association is weaker after the Sarbanes-Oxley Act, consistent with the act curbing agency problems. A key implication of our findings is that more guidance does not necessarily lead to better capital market outcomes. Keywords: crash risk, management earnings guidance, opacity JEL classification: G14, M41, M43 Data Availability: The data used in this study are available from the public sources identified in the paper.

1
MANAGEMENT EARNINGS GUIDANCE AND STOCK PRICE CRASH RISK
I. INTRODUCTION
A series of corporate scandals (e.g., Enron, WorldCom) and the recent financial crisis
have led regulators, practitioners, and researchers to investigate the cause of extreme price
declines. In her testimony before the Financial Crisis Inquiry Commission on January 14, 2010,
SEC chairman Mary Schapiro contended that “[a] central question ... is whether investors
received timely and accurate disclosure concerning deteriorating business conditions.” In an
important recent study, Hutton et al. (2009, hereafter HMT) show that opaque earnings are
associated with higher stock price crash risk; they conclude that transparent financial reporting is
important for stability in capital markets. Apart from mandatory earnings reports, many firms
also provide earnings guidance (Hirst et al. 2008). Beyer et al. (2010), in assessing the relative
importance of various corporate disclosures on stock return variance, estimate that guidance
accounts for 66% of the total variance explained by accounting-based disclosures, compared to
12% from mandatory disclosures (i.e., earnings releases and SEC filings). Hence, a natural
extension of HMT is to examine how earnings guidance is related to stock price crash risk.
The early literature typically regards guidance as a mechanism that allows managers to
convey their private information to outsiders. For example, a series of studies find that guidance
helps move investor expectations closer to management beliefs, especially when there is bad
news (Ajinkya and Gift 1984; Kasznik and Lev 1995; Matsumoto 2002; Skinner 1994). Issuing
guidance helps reduce information asymmetry and the cost of raising capital (Coller and Yohn
1997; Frankel et al. 1995), while discontinuing guidance results in a deteriorating information
environment (Chen et al. 2011). Besides the informational role, guidance allows for better
monitoring and reduces managers’ incentives to shirk or engage in value-destroying behaviors

2
(Bushman and Smith 2001; Healy and Palepu 2001; Nagar et al. 2003). Given that these studies
all support the idea that guidance-providing firms are more transparent, one might expect that
more guidance would reduce the likelihood of a stock price crash, as does more transparent
financial reporting (HMT).
The premise underlying this typical view is that managers truthfully reveal private
information through guidance. However, there are increasing concerns about the potential
agency problems associated with guidance, due to its voluntary and non-audited nature (Core
2001; Healy and Palepu 2001).1 A recent report by McKinsey & Company (2006) contends that
the practice of guidance has become “misguided” due to an excessive focus on short term
“number games” rather than long term business conditions. This myopic focus could induce
managers to sugarcoat poor business conditions with misleading guidance, which leads to further
opportunistic behaviors (e.g., earnings management to meet or beat the guidance) (Deloitte and
FERF 2009; Kasznik 1999; CFA Institute 2006; Lev 2011). Managers could rely on guidance to
create an illusion of stability and gamble on improvements in business conditions (Graham et al.
2005; Kothari et al. 2009). A number of studies echo this criticism by showing that managers use
earnings guidance to manipulate the beliefs of analysts and investors for opportunistic purposes
(Aboody and Kasznik 2000; Amel-Zadeh et al. 2012; Bergman and Roychowdhury 2008; Cheng
and Lo 2006; Cotter et al. 2006; Feng et al. 2012; Noe 1999; Rees et al. 2009; Shroff et al.
2012).2 Hermalin and Weisbach (2012) also present a model in which managers could exploit
1 Recent interviews and surveys of managers by Graham et al. (2005) and Dichev et al. (2012) indicate that a significant number of managers are willing to manage earnings (typically upwards) to misrepresent economic performance, even at the cost of destroying firm value. One reason is that managers strongly believe that such misrepresentation “will likely go undetected” (Dichev et al. 2012). Given the agency problems with reporting earnings, one might expect similar issues to be present with guidance, especially since guidance is voluntary and non-audited. 2 For example, Amel-Zadeh et al. (2012) find that acquiring firms issue upward biased guidance more frequently, and by doing so, they receive a better stock market reaction on the announcement, get higher bids and better contract terms, and have higher likelihoods of deal completion.

3
disclosures for career concerns. Finally, Libby and Rennekamp (2012) provide evidence that the
issuance of forecasts is associated with a self-serving attribution bias and overconfidence. In sum,
recent studies have highlighted the concerns of various stakeholders about guidance credibility,
especially since stakeholders cannot perfectly unravel biases in guidance (Hutton et al. 2003;
Rogers and Stocken 2005; Young 2006).
Taken together, the relation between management earnings guidance and stock price
crashes appears to be an empirical issue. On one hand, guidance could reduce crash risk because
it conveys useful information that forewarns the capital markets of firm-specific declining
business conditions. As noted in Leuz and Verrecchia (2000), the literature typically equates
more disclosure with higher quality disclosure. To the extent that more guidance is associated
with higher transparency, one might rely on HMT’s finding to conclude that more guidance
would lower the crash risk. On the other hand, to the extent that guidance is used
opportunistically to hoard bad news, it could increase the likelihood of a price crash (Benmelech
et al. 2010; Bleck and Liu 2007; Jin and Myers 2006).3 Both effects are likely to be present; the
purpose of our study is to examine empirically which effect, on average, dominates when it
comes to stock price crashes, significant economic events that are likely associated with serious
agency problems.
Our empirical analysis is based on a sample of 43,006 firm-years from 1997 to 2009. We
find a positive association between annual guidance and crash risk. An economic significance
analysis indicates that the effect of guidance on crash risk is comparable to that of financial
3 United States v. Nacchio (No. 07-1311, March 17, 2008) provides an illustration. In September 2000, Qwest’s CEO, Joseph Nacchio, issued an annual revenue forecast of $21.3 to $21.7 billion for fiscal year 2001 despite being aware of an internal memo hinting that the revenue would be a disappointing $20.4 billion or even worse. This guidance was reaffirmed several times between September 2000 and May 2001. When the bad news was finally revealed in June 2001, Qwest’s stock price plunged about 21% in two weeks. Nacchio was later convicted of insider trading because he exercised his stock options and sold shares at prices that were inflated by the guidance.

4
reporting opacity (HMT). We recognize that guidance decisions, similar to financial reporting
opacity, are endogenous. We use two common identification strategies to control for the
potential endogeneity and find that our result is not solely driven by endogeneity.
Our first strategy is to use Regulation Fair Disclosure (hereafter Reg FD) as an
instrumental variable in examining the effect of guidance frequency on stock price crash risk.
The SEC adopted Reg FD to ban selective disclosures and boost confidence in capital markets.
Prior research finds increased guidance frequency after Reg FD when managers substitute
selective disclosures with public guidance (Bailey et al. 2003; Heflin et al. 2003). We consider
Reg FD to be a good instrument to guidance because “leveling the playing field” among
investors is unlikely to directly increase the likelihood of future crashes (Larcker and Rusticus
2010).4 The results from our instrumental variable approach suggest that firms that provide more
guidance are more likely to suffer from subsequent stock price crashes.
Our second strategy is to exploit the cross-sectional or time-series variation in the
severity of agency problems. We hypothesize that more severe agency problems increase
managers’ incentive to opportunistically guide market expectations, leading to a stronger relation
between guidance frequency and crash risk. Consistent with this rationale, we find that guidance
frequency has a stronger positive association with crash risk in firms with higher CEO stock
ownership. The association is attenuated in firms with greater external monitoring from financial
analysts or with higher litigation risk. We also find a weaker association after the Sarbanes-
Oxley Act (SOX), consistent with SOX curtailing fraudulent reporting behaviors by imposing a
higher litigation risk on managers. As opaque financial reporting reflects potential agency
problems (HMT), we show that opacity in financial reporting reinforces the effect of guidance on
4 On the contrary, Kothari et al. (2009) provides evidence that firms have reduced the extent of bad news withholding relative to good news after Reg FD, which implies that Reg FD may have indirectly decreased crash risk. This speaks to the strength of Reg FD as our instrumental variable.
5
crash risk. We further show that the positive correlation between guidance frequency and crash
risk is stronger when management forecasts are more upward biased, consistent with managers
issuing biased forecasts to manipulate market expectations.
Finally, as a sensitivity test, we control for the contemporaneous stock price crash and
demonstrate that the positive association between guidance frequency and stock price crash risk
is not a manifestation of the continuation of crashes that occur as managers attempt to guide
investors’ expectations downwards via a series of earnings forecasts. To address the concern
about serial correlation in forecasting, we control for short term forecasts that are realized in the
current year. We find that only those forecasts that are to be realized in future years drive future
crashes. This evidence suggests that managers use mostly long-horizon forecasts for bad news
hoarding. We also control for preexisting analyst forecast optimism before guidance and
continue to find a significant positive association between guidance and crash risk. Finally, to
address the concern that guidance simply increases future return volatility, we show that there is
no significant correlation between guidance frequency and future stock price jumps. Hence, the
positive association between guidance and crash risk is more consistent with bad news hoarding
via guidance and subsequent price correction upon the revelation of the stockpiled bad news.
By providing in-depth analyses of the relation between guidance frequency and crash
risk, our paper fills a gap in the crash risk and earnings guidance literatures. In particular, while
there is evidence in HMT that more opaque mandatory disclosure is associated with higher crash
risk, it is unclear how a voluntary disclosure mechanism such as earnings guidance is associated
with such risk. A review of the prior management forecast literature reveals that, with a few
exceptions focusing on agency problems arising from earnings guidance, most studies find that
more guidance is associated with desirable capital market attributes such as improved stock

6
liquidity and a lower cost of capital. Our study, however, supports Hermalin and Weisbach’s
(2012) prediction that agency problems could lead managers to use more disclosure to distort
investors’ beliefs. Our findings of the managers’ opportunistic use of guidance and higher crash
risk are also in line with Kothari et al. (2009) who find that, on average, managers systematically
delay disclosing bad news to investors. On a broader note, a key implication of our study is that
it is important to recognize the agency problem in corporate disclosure, especially if the
disclosures are voluntary and/or non-audited.
Nevertheless, we caution that our findings should not be interpreted as suggesting that
management guidance is unconditionally opportunistic on average. Instead, our results indicate
that conditional on the existence of significant agency problems, guidance could be used more
opportunistically and could contribute to the extreme negative capital market consequences.
The rest of the paper is organized as follows. In the next section, we review the literature
and develop our hypothesis. In section 3, we describe the research design. We present our
empirical analysis in section 4. We then conclude in the last section.
II. LITERATURE REVIEW AND HYPOTHESIS DEVELOPMENT
Beginning with Jin and Myers (2006), researchers have been concerned about whether
the information asymmetry between managers and shareholders, coupled with managers’ self-
interest, could be related to stock price crash risk. As Taleb (2007) indicates, a good
understanding of these extreme outcomes can offer valuable insight into the true nature of the
phenomena. The recent literature on crash risk argues that a stock price crash occurs when
investors realize that stock prices have been (severely) inflated and that the occurrence of a crash

7
would be an indicator of prior agency problems.5
To explore the precise nature of the agency problems, recent studies have investigated
how crashes arise from managers’ bad news hoarding, which could be induced by equity-based
compensation (Kim et al. 2011a), facilitated by opaque financial reporting (HMT; Jin and Myers
2006) or corporate tax avoidance (Kim et al. 2011b), and left unconstrained from a lack of
auditor monitoring (Callen and Fang 2011). In particular, HMT demonstrate that poor accruals
quality in reported earnings allows managers to conceal bad news, which leads to future price
crashes. Despite these efforts, the bad news hoarding mechanisms examined to date have largely
been confined to opacity within the mandatory reporting system. It is unclear how other
corporate disclosures (e.g., management guidance) play a role in this process.
Traditional disclosure theory typically focuses on the information role of disclosure and
predicts that increased levels of disclosure will lead to better capital market outcomes (e.g.,
lower information asymmetry) (Verrecchia 2001). As noted by Leuz and Verrecchia (2000), the
theory is “sufficiently broad as to allow the notion of ‘increased levels of disclosure’ to be
interpreted as either an increase in the quantity of disclosure or an increase in the quality of
disclosure (or both).” In line with traditional disclosure theory, Ajinkya and Gift (1984) posit that
managers issue guidance to narrow the gap between managers’ and investors’ expectations about
future earnings. A series of studies have provided evidence in support of the expectations
adjustment hypothesis (e.g., Hassell and Jennings 1986; Kasznik and Lev 1995; Matsumoto
2002). Consistent with guidance reducing information asymmetry, Coller and Yohn (1997) find
that bid-ask spreads decrease after guidance is issued. Frankel et al. (1995) provide further
evidence that managers issue more guidance before accessing capital markets, to obtain better
5 While recent research has focused on the agency problems that lead to extreme price declines, the early literature has examined a few equity market-based explanations for price crashes (e.g., Chen et al. 2001; French et al. 1987; Hong and Stein 2003; Romer 1993).

8
terms (e.g., to lower the costs of raising capital). There is also evidence that once firms stop
providing guidance, their information environment deteriorates as analyst forecast dispersion
widens and analyst forecast error increases (Chen et al. 2011; Houston et al. 2010). Besides
adjusting investors’ expectations, the information contained within earnings guidance also allows
for better monitoring and reduces managers’ incentives to shirk or engage in value-destroying
behaviors (Bushman and Smith 2001; Healy and Palepu 2001; Nagar et al. 2003).
Healy and Palepu (2001), however, caution that “the extent to which voluntary disclosure
mitigates resource misallocation in the capital market depends on the degree of credibility of
information ... Because managers have incentives to make self-serving voluntary disclosures, it is
unclear whether management disclosures are credible.” Further, Core (2001) notes that, in
addition to the informational role of disclosure, it is important to jointly consider managers’
incentives and corporate governance structure to understand firms’ optimal disclosure policies
and their enforcement of them. More recently, theories have relaxed the assumption of truthful
disclosure and have assumed that (at least some) managers have incentives to provide biased
disclosure. For example, Fischer and Verrecchia (2000) demonstrate that managers have
incentives to bias reporting if there is sufficient uncertainty about their reporting objectives.
Hermalin and Weisbach (2012) also predict that career concerns (i.e., job security or
compensation) would induce managers to opportunistically distort disclosure if they are to be
evaluated against such disclosures.
A stream of empirical research has studied opportunism in guidance in two ways. First,
there is evidence that managers use guidance to distort investors’ beliefs. Rogers and Stocken
(2005) find that managers issue biased earnings forecasts when it is difficult for the market to
detect misrepresentation. Several other studies show that managers issue more pessimistic or bad

9
news guidance before executive stock option awards or insider purchases to maximize the payoff
(Aboody and Kasznik 2000; Cheng and Lo 2006; Rees et al. 2009). Bergman and Roychowdhury
(2008) provide evidence that managers use guidance to maintain optimistic earnings valuations,
especially in times of low investor sentiment. In addition, Shroff et al. (2012) find that managers
use guidance to artificially inflate stock prices before seasoned equity offerings. Feng et al.
(2012) further show that firms engaging in accounting manipulations use guidance to delay these
manipulations’ detection.
Second, prior studies demonstrate that investors have concerns about the credibility of
management forecasts. Hutton et al. (2003) find that bad news earnings forecasts are always
informative but that good news forecasts are informative only when supplemented by verifiable
forward-looking statements that bolster their credibility. Rogers and Stocken (2005) also find a
stronger investor response to good news relative to bad news forecasts, consistent with the notion
that investors tend to suspect an upward misrepresentation in guidance (Dichev et al. 2012;
Graham et al. 2005).
Taken together, prior research on management earnings guidance shows the two opposite
roles that guidance plays: an information/governance role and an opportunistic role. These two
roles create significant tension in how guidance is related to crash risk.
If the information and/or governance role of guidance prevails, we would expect a
negative association between the practice of issuing guidance and crash risk, for two reasons.
First, more guidance reduces managers’ information advantage regarding a declining business
condition, thereby making it difficult for managers to hide and stockpile bad news. Second, as
guidance provides more “snapshots” of a firm’s operational condition and allows for better
investor monitoring, it reduces managers’ incentives to engage in opportunistic behaviors. In
10
contrast, if the opportunistic role of guidance dominates under the circumstance of declining
business conditions, we would expect a positive association between guidance and crash risk for
several reasons.
First, career concerns could induce managers to issue biased forecasts to camouflage bad
news (Hermalin and Weisbach 2012). Kothari et al. (2009) argue that managers face asymmetric
payoffs in disclosure because good news increases compensation and extends their tenure,
whereas bad news could lead to reduced compensation, a quick termination of employment, and
a tarnished reputation in labor markets. Consequently, managers have incentives to issue
misleading guidance and to hoard bad news in the hope that their firm’s business condition will
improve enough to nullify the need to ever report the bad news (Graham et al. 2005). The
agency-based model in Jin and Myers (2006) predicts the following link between opacity and
crash risk. Self-interested managers have incentives to hide bad news about cash flow
innovations because their informational advantage allows them to exploit shareholders. Opacity
about firm operation helps managers conceal information. When the news is negative, managers
would personally absorb losses and conceal the bad news to keep their jobs. However, when the
accumulated losses become excessive, they exercise the abandonment option and reveal the
accumulated bad news all at once, leading to extreme price declines. While the related analytical
works (i.e., Benmelech et al. 2010; Bleck and Liu 2007) use different models and settings, the
underlying themes are largely similar: managers have incentives to conceal bad news out of
career concerns (i.e., job security or compensation); opacity allows managers to hoard bad news,
which subsequently leads to a price crash. Even though these models are silent on the precise
nature of the concealment, we conjecture that it could be accomplished in two ways: by
abstaining from making truthful disclosures and/or by releasing misleading information to

11
disguise the true conditions.
Second, declining business conditions make guidance an effective means of distorting
market expectations because the increased forecasting difficulty in a changing business condition
reduces investors’ ability to detect forecast biases (Rogers and Stocken 2005). Third, managers’
opportunistic guiding behaviors cannot be completely deterred by the subsequent verification
against realized values. Jensen and Meckling (1976) indicate that significant contracting costs
result in incomplete contracts and make it impossible to entirely eliminate agency problems. Due
to high management turnover after a price crash (Gilson 1989) and the limited “clawback”, even
if the guidance is bound to be later verified against realized values, it cannot completely
discourage managers’ opportunistic guidance.6
In summary, there is significant tension in the hypothesis about the relation between
guidance and stock price crash risk. The pure information and governance role of guidance
suggests a negative association between guidance and a stock price crash, because such guidance
moves investors’ expectations towards the “true” firm value and facilitates monitoring. In
contrast, if guidance is used opportunistically to inflate stock prices via the concealment of bad
news or by inflating investors’ earnings expectations, then there would be a positive association
between guidance and crash risk. Therefore, our first hypothesis, stated in the null form, is:
H1: More guidance is not associated with a stock price crash risk.
6 A general concern about assuming the existence of opportunistic disclosure is that managers should ex-ante engage in truthful disclosure because of rational beliefs that the truth will be revealed in the future, and an extensive literature support that managers are, on average, not manipulative. Besides career concerns, other likely reasons include the notion that the optimal disclosure choice for shareholders is not always to be perfectly truthful because eliminating all manipulation can be too costly (Watts and Zimmerman 1986; Lambert et al. 1991). Another possibility is that (some) managers are not completely rational (e.g., they are overconfident) and/or they believe that their misrepresentation will not be detected (Dichev et al. 2012; Libby and Rennekamp 2012). For example, Libby and Rennekamp (2012) find that managerial overconfidence contributes to the decision to issue earnings guidance; in particular, managers are likely to overestimate the extent to which they contribute to positive firm performance; both over-optimism about firm performance and overconfidence in their ability to predict future firm performance contribute to the issuance of earnings forecasts.
12
III. RESEARCH DESIGN
Main Model
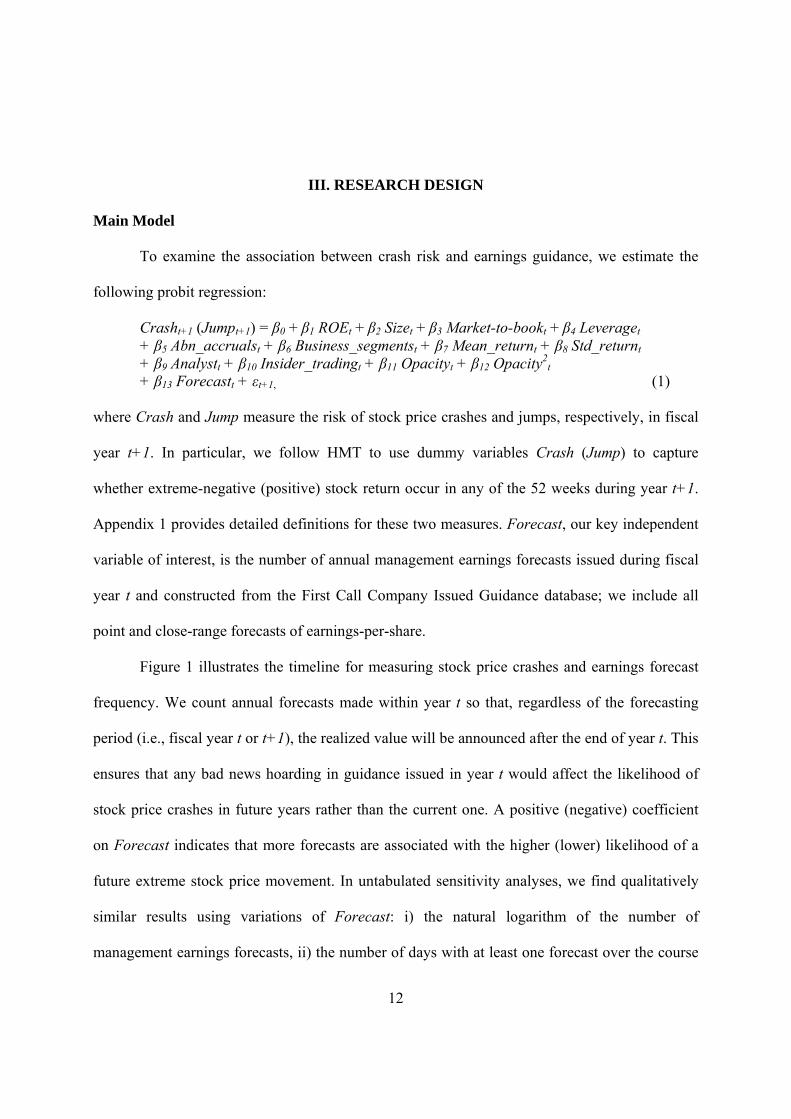
To examine the association between crash risk and earnings guidance, we estimate the
following probit regression:
Crasht+1 (Jumpt+1) = β0 + β1 ROEt + β2 Sizet + β3 Market-to-bookt + β4 Leveraget + β5 Abn_accrualst + β6 Business_segmentst + β7 Mean_returnt + β8 Std_returnt + β9 Analystt + β10 Insider_tradingt + β11 Opacityt + β12 Opacity2
t + β13 Forecastt + εt+1, (1)
where Crash and Jump measure the risk of stock price crashes and jumps, respectively, in fiscal
year t+1. In particular, we follow HMT to use dummy variables Crash (Jump) to capture
whether extreme-negative (positive) stock return occur in any of the 52 weeks during year t+1.
Appendix 1 provides detailed definitions for these two measures. Forecast, our key independent
variable of interest, is the number of annual management earnings forecasts issued during fiscal
year t and constructed from the First Call Company Issued Guidance database; we include all
point and close-range forecasts of earnings-per-share.
Figure 1 illustrates the timeline for measuring stock price crashes and earnings forecast
frequency. We count annual forecasts made within year t so that, regardless of the forecasting
period (i.e., fiscal year t or t+1), the realized value will be announced after the end of year t. This
ensures that any bad news hoarding in guidance issued in year t would affect the likelihood of
stock price crashes in future years rather than the current one. A positive (negative) coefficient
on Forecast indicates that more forecasts are associated with the higher (lower) likelihood of a
future extreme stock price movement. In untabulated sensitivity analyses, we find qualitatively
similar results using variations of Forecast: i) the natural logarithm of the number of
management earnings forecasts, ii) the number of days with at least one forecast over the course

13
of the year, iii) a dummy variable equaling one if the firm has issued at least one forecast over
the course of the year, and iv) the inclusion of open-range and qualitative forecasts. For purposes
of parsimony, we only present the results with Forecast.
We include two sets of control variables, all of which are measured as of fiscal year t.
The first set of variables is chosen based on HMT. ROE is the net income before extraordinary
items over the shareholders’ equity. Size is a log of the market value, and Market-to-Book is the
ratio of the market value and the shareholders’ equity. Leverage is the ratio of the total liability
over the total assets. Opacity, which is the key independent variable of interest in HMT, is the
sum of the absolute abnormal accruals from year t-2 to year t, where abnormal accruals are
estimated based on the cross-sectional modified Jones model (Jones 1991; Dechow et al. 1995).
As an alternative measure of opaque financial reporting, we use Accruals_quality, which is the
standard deviation of five firm-specific residuals from a cross-sectional regression of accruals on
the prior, current, and future cash flow from operations, as well as the changes in revenue and
PP&E (Dechow and Dichev 2002; Francis et al. 2005; McNichols 2002). Unlike Opacity, which
requires three years of data to compute, Accruals_quality requires seven years of data, and
therefore is available only for a subsample.
In addition, we control for another set of variables that could potentially lead to a bias in
the coefficient on Forecast.7 First, given that guidance can be related to the level of earnings
management (Kasznik 1999), we control for upwards earnings management with abnormal
accruals (Abn_Accruals), which is the residual of year t from the estimation of the cross-
sectional Jones (1991) accrual model.8 Next, to mitigate concerns about the endogenous nature
of guidance, we further include a number of determinants of the forecast frequency identified by
7 Our results are robust to limiting the set of control variables to those used in HMT. 8 This is a regression model of accruals on sales growth and plant, property, and equity by industry in each year; we impose a requirement of at least 20 firms within each industry-year.

14
Nagar et al. (2003). Business_segments is the number of business segments. We define
Mean_return and Std_return as the mean and standard deviation of the weekly returns in year t.
Mean_return is a proxy for firm performance that could affect both disclosures and changes in
stock crash risk. Std_return serves as a control for the increase in volatility upon guidance
documented by Rogers et al. (2009). Analyst is the number of analysts following a firm reported
in I/B/E/S. Insider_trading is the volume of insider trades divided by the number of shares
outstanding. We control for analyst following and insider trading because prior studies have
shown that such activities are associated with management forecasting behavior and capital
market outcomes (Beyer et al. 2010). Finally, we further include year dummies (not shown). To
deal with potentially inflated t-statistics due to the cross-sectional and time-series dependence of
the residuals in a panel dataset, we cluster the standard errors by both firm and year (Petersen
2009).
Endogeneity in Guidance and Identification Strategies
As noted earlier, guidance decisions, like financial reporting opacity, are endogenous and
control variables are unlikely to completely account for the potential endogeneity. To provide
further evidence of a causal link between guidance and stock price crash risk, we rely on two
different identification strategies commonly used in the literature: i) the use of Reg FD as the
instrumental variable for guidance frequency and ii) an examination of whether the positive
association between guidance and crash risk is stronger under conditions where agency problems
are more severe. We acknowledge that each identification strategy has its limitations, but hope
that generally consistent results across the different approaches will enhance causal inferences.
To implement the first strategy, we follow Newey (1987) and Foster (1997) to estimate a
probit model with a continuous endogenous regressor. With the two-step procedure, we consider
15
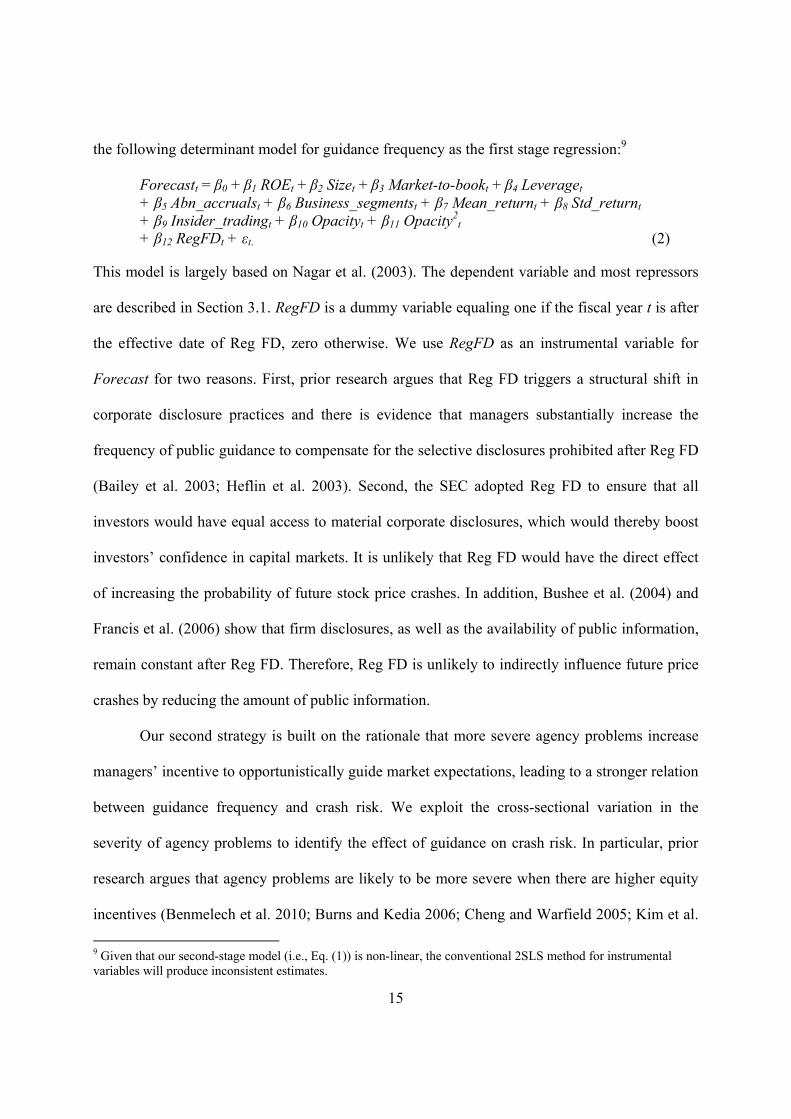
the following determinant model for guidance frequency as the first stage regression:9
Forecastt = β0 + β1 ROEt + β2 Sizet + β3 Market-to-bookt + β4 Leveraget + β5 Abn_accrualst + β6 Business_segmentst + β7 Mean_returnt + β8 Std_returnt + β9 Insider_tradingt + β10 Opacityt + β11 Opacity2
t + β12 RegFDt + εt. (2)
This model is largely based on Nagar et al. (2003). The dependent variable and most repressors
are described in Section 3.1. RegFD is a dummy variable equaling one if the fiscal year t is after
the effective date of Reg FD, zero otherwise. We use RegFD as an instrumental variable for
Forecast for two reasons. First, prior research argues that Reg FD triggers a structural shift in
corporate disclosure practices and there is evidence that managers substantially increase the
frequency of public guidance to compensate for the selective disclosures prohibited after Reg FD
(Bailey et al. 2003; Heflin et al. 2003). Second, the SEC adopted Reg FD to ensure that all
investors would have equal access to material corporate disclosures, which would thereby boost
investors’ confidence in capital markets. It is unlikely that Reg FD would have the direct effect
of increasing the probability of future stock price crashes. In addition, Bushee et al. (2004) and
Francis et al. (2006) show that firm disclosures, as well as the availability of public information,
remain constant after Reg FD. Therefore, Reg FD is unlikely to indirectly influence future price
crashes by reducing the amount of public information.
Our second strategy is built on the rationale that more severe agency problems increase
managers’ incentive to opportunistically guide market expectations, leading to a stronger relation
between guidance frequency and crash risk. We exploit the cross-sectional variation in the
severity of agency problems to identify the effect of guidance on crash risk. In particular, prior
research argues that agency problems are likely to be more severe when there are higher equity
incentives (Benmelech et al. 2010; Burns and Kedia 2006; Cheng and Warfield 2005; Kim et al.
9 Given that our second-stage model (i.e., Eq. (1)) is non-linear, the conventional 2SLS method for instrumental variables will produce inconsistent estimates.

16
2011b), when there is less external monitoring (Jensen and Meckling 1976; Moyer et al. 1989),
and when managers are less concerned about litigation risk (Skinner 1994, 1997). Following
Cheng and Warfield (2005), we use CEO stock ownership (CEO_own) as the proxy for equity-
based compensation. Jensen and Meckling (1976) argue that analysts play a monitoring role in
limiting managerial opportunism. We use the number of analysts (Analyst) and institutional
ownership % (Institution_own) to measure the intensity of external monitoring. To capture firms’
litigation risk, we use the probability of class action law suits (Lit_risk) estimated from Kim and
Skinner’s (2012) model. We also consider a dummy variable for the post-SOX period (SOX) as
an alternative measure for litigation risk because SOX has significantly increased the
management litigation costs associated with fraudulent reporting (Cohen et al. 2008). Finally,
given that opacity in financial reporting can reflect underlying agency problems (HMT), we use
Opacity as an ex post measure for the severity of agency problems. In the same vein, the upward
bias in forecasts (Up_bias) is considered management optimism and may be a sign of bad news
hoarding. By adding these variables and their respective interactions with guidance frequency
(Forecast) to Eq. (1), we expect positive coefficients on the interaction terms with CEO_own,
Opacity, and Up_bias, but negative coefficients on the interaction terms with Analyst,
Institution_own, Lit_risk, or SOX.
IV. EMPIRICAL ANALYSIS
Sample Construction and Description
To construct our sample, we start with all firms listed on NYSE, AMEX, or NASDAQ
and then calculate the frequency of the earnings guidance using data from the First Call
Company Issued Guidance database. Our sample begins in 1997, the first year for which the

17
database provides comprehensive guidance coverage. The sample period extends to 2009
because we have data through 2010 for computing the next year’s crash risk. To determine this,
we use the firms’ weekly stock return data and the weekly industry and market returns from the
CRSP database; more details of the crash risk measure can be found in Appendix 1. We obtain
various control variables from the Compustat, I/B/E/S, and Thomson Reuters Insiders and
Institutional (13f) Holdings databases. The final sample, constructed using firm-years with non-
missing variables, consists of 43,006 firm-year observations.
Table 1 provides information about forecasters in our sample of 43,006 firm-years. In
Panel A, we find that 6,726 of the firm-years have at least one annual earnings forecast during
the year, and there is an upward trend in the percentage of forecasters. This trend is consistent
with prior research findings (e.g., Rogers et al. 2009). Panel B provides preliminary evidence on
the relation between guidance frequency and crash risk. Within each year, firms that provide
guidance are categorized into two groups: low frequency and high frequency. While 18.51% of
non-guider firm-years are followed by at least one crash during next year, the likelihood of a
crash for guidance firm-years is significantly higher, at over 23%. Compared with those with no
guidance, the percentage of firm-years with at least one crash in the next year is higher for high
frequency guidance firm-years, by a statistically significant 7.09%.
Table 2 provides descriptive statistics for the variables used in our main analyses. The
definitions of the variables are found in Appendix 1. Approximately 20% of our firm-years
exhibit at least one crash in the next year. These percentages are largely consistent with HMT.
The average number of annual forecasts (Forecast) per year is 0.738; note that for firms without
any annual forecast over the course of the year, we set the number of forecasts to zero. The mean
value of Opacity is 0.237, which is similar to that reported in HMT. In addition to Opacity, we

18
include an alternative measure of reporting opacity, Accruals_quality, which is the accruals
quality measured following Francis et al. (2005). Accruals_quality is available only for a subset
of the sample because its computation requires a longer time-series of data.
Stock Price Crash and Earnings Guidance
Table 3 presents our main regression analyses on the relation between guidance and crash
risk. We first report the probit regression estimates on Eq. (1). We find a significantly positive
coefficient on Forecast (0.018), indicating that frequent forecasters are more likely to experience
stock price crashes in the future. This finding is consistent with the notion that managers use
guidance opportunistically to temporarily inflate stock prices, which leads to more crashes in the
future. With regard to the control variables, we observe that Opacity has a significant positive
coefficient (0.188), which confirms HMT’s finding of a positive association between financial
reporting opacity and crash risk. Similar to HMT, we find a higher crash risk for larger firms.
The finding that firms with more business segments (Business_segments) are associated with
lower crash risk suggests that business diversification introduces some stability to the firm on the
downside. The positive coefficient on Mean_return and the negative coefficient on Std_return
indicate that firms with better stock performance and lower volatility are more likely to
experience crashes in the future. These results indicate that crashes are unlikely to be a
manifestation of declining business conditions, a continuation of poor stock performance (i.e.,
negative stock momentum), and/or high stock volatility. Instead, the results are consistent with
the notion that crashes occur after a period of illusionary high prices and stability. In the second
column, we use an alternative measure of opacity (Accruals_quality) and continue to find that
more guidance is positively associated with Crash. Collectively, these findings indicate that there
is a positive association between stock price crash risk and guidance, and this association is

19
incremental to the findings of the positive association between stock price crash risk and
financial reporting opacity in HMT.
HMT estimate that a shift from the 25th to the 75th percentiles in the distribution of
Opacity increases the crash risk by 1.56% (HMT, p.79). Using similar calculations, we find that
the impact of a similar increase in Opacity is 0.63% in our sample period (untabulated).10 We
also calculate the marginal effects for the main regression in the first column to compare the
economic impacts of Opacity vs. Forecast. In the third column, we document the economic
effects of Opacity and Forecast to be 0.75% and 0.50%, respectively.11 In sum, in our sample,
the economic effect of management forecast frequency on crash risk is approximately two-thirds
of that of mandatory reporting opacity.
Table 4 presents the results of our two-step probit regressions with RegFD as the
instrumental variable for Forecast. The first column shows the results of the first stage
regression on Eq. (2). The positive coefficient on RegFD (0.663) indicates that firms increase
guidance frequency after the passage of Reg FD. Untabulated diagnostic tests provide some
justification for the above instrumental variables approach. The Wald test for exogeneity has a
Chi-square statistic of 86.19, thus rejecting the null hypothesis that guidance is exogenous. The
partial R2 is 0.034, suggesting that RegFD is a reasonable instrument. The F-statistic is
statistically significant (F-stat = 85.78) and is above the rule of thumb of 10 proposed by Staiger
and Stock (1997). It also satisfies the higher standard proposed by Stock et al. (2002):
specifically, it is above the critical value of 19.93 based on the size of the nominal 5% Wald test.
The second column presents the results of the second-stage regressions with Crash as the
10 The economic impact of opacity, 0.63%, is calculated as the difference between the likelihood of crash at the 75th percentile of Opacity and Opacity2 and the likelihood of crash at the 25th percentile of Opacity and Opacity2 at the averages of all other variables. 11 For Forecast, the economic effect is calculated based on a shift from a zero forecast to a one, which corresponds to a shift from the 25th to the 80th percentiles.

20
dependent variable. A comparison of the result for the second-stage regression (0.220) and that
of the plain probit regression (Table 3, 0.018) indicates that our result is not sensitive to the use
of the instrumental variable research design (Larcker and Rusticus 2010). The coefficient on
RegFD (0.063) is statistically significant at the 0.01 level. The result indicates that the positive
correlation between guidance frequency and crash risk is not purely driven by the endogeneity in
guidance decisions.
In sum, the results presented in Table 4 show that frequent forecasts are associated with a
higher likelihood of a future stock price crash. The findings in HMT suggest that delayed
revelation of bad news due to opaque financial reporting contributes to higher crash risk. While
more earnings guidance might be considered as a mechanism via which a firm can be more
transparent, which would result in lower crash risk, our results suggest otherwise. We find that
firms that provide more guidance are also more likely to experience a future stock price crash.
This evidence is consistent with the presence of agency problems in guidance practices that
induce managers to use guidance to actively camouflage declining business conditions.
An alternative explanation deserves further discussion. Namely, the effect of guidance on
crash is contemporaneous (i.e., occur in the same year) and our finding of the positive
association between guidance and the likelihood of a future crash is primarily due to a positive
time-series correlation in the frequency of guidance. In other words, managers act faithfully in
guidance practice and simply reveal bad news to the market in a future period in a timely manner
when the bad news become observable to them, which instantly triggers a crash. This
explanation is simply less convincing as there is no reason to believe that the odds of having
significant bad news arrive in a future period should be any higher for firms generally issuing
more guidance, unless we consider opportunism in the guidance practice.

21
Severity of Agency Problems
To further explore the notion that with the presence of agency problems guidance may be
used opportunistically, we rely on a series of cross-sectional and time-series analyses and
examine whether the positive association between frequent forecasts and crash risk varies
systematically with the severity of agency problems.
CEO Equity Ownership
While extant research argues that granting equity to managers mitigates agency problems
by aligning shareholders’ and managers’ interests (Jensen and Meckling 1976; Jensen and
Murphy 1990), more recent studies indicate that equity-based compensation could exacerbate
agency problems. Specifically, the high sensitivity of management wealth to stock price induces
managers to engage in short termist behavior to inflate the stock price at the cost of future firm
value (Bolton et al. 2006). Cheng and Warfield (2005) and Burns and Kedia (2006) find
evidence that higher CEO equity incentives are positively related to earnings management.
Benmelech et al. (2010) and Kim et al. (2011b), in particular, demonstrate that equity-based
compensation provides higher incentives for managers to engage in bad news hoarding, which
leads to higher crash risk. For this reason, it would be possible to expect managers with higher
equity-based compensation to be more likely to use guidance to disguise bad news. Therefore,
we predict that the association between frequent forecast and high crash risk would be stronger
when CEO stock ownership is high.
In the first column of Table 5, we report the results of regressions that examine how the
relation between a stock price crash and the management forecast frequency varies with CEO
stock ownership. We find a positive and significant coefficient of 0.038 on the interaction term
between Forecast and CEO_own. The untabulated marginal impact of the interaction term is

22
1.13% and significant, with a z-statistic of 4.08. This result suggests that managers with higher
equity-based compensation are more likely to use guidance to disguise bad news and inflate
stock prices.
External Monitoring
We use the number of analysts (Analyst) and institutional ownership % (Institution_own)
to measure the intensity of external monitoring. Jensen and Meckling (1976) argue that analysts
play a monitoring role in limiting managerial opportunism. Moreover, analysts can mitigate the
effect of managerial guidance bias on market expectations by issuing their own corrective
forecasts. Similarly, institutional investors have been identified as external monitors in various
studies (Ajinkya and Gift 1984; Bushee 1998, 2001) and also affect market expectations by their
own trading activities. We examine whether this external monitoring plays a role in curbing
managerial opportunism in guidance practice.
The second column of Table 5 shows how external monitoring by analysts or institutional
investors affects opportunistic guidance behavior. We find that firms with more analyst coverage
mitigate the opportunism in guidance with a coefficient of -0.036 on the interaction term
Forecast × Analyst. The untabulated marginal impact of the interaction term is -0.99% with a z-
statistic of -3.22. On the contrary, we find that institutional investors’ role is limited.
Litigation Risk
SEC Rule 10b-5 makes it unlawful for firms to either omit disclosure or to make an
untrue statement of material facts. Firms that experience large negative returns are likely to be
sued by investors if the investors believe that the managers knowingly withheld bad news.
Skinner (1994) indicates that firms have incentives to disclose bad news through guidance before
an earnings announcement to reduce future litigation risk. Providing guidance not only reduces
23
the likelihood of getting sued (Field et al. 2005) and the aggregate recoverable damage (Skinner
1997), it also limits managers’ personal liability in such suits. The Private Securities Litigation
Reform Act (PSLRA) of 1995 potentially reduces concerns about litigation risk by providing a
statutory safe harbor for forward-looking disclosures that are not realized later. As Young (2006)
states, “[i]f plaintiff attorneys look at the reasons for the stock drop and determine that it is a
result of missing guidance, they frequently won’t take the case.” Nevertheless, Rogers and
Stocken (2005) find that managers of firms that face higher litigation risk tend to be less
optimistic or more pessimistic, indicating that litigation risk can still attenuate managers’
incentives to engage in opportunistic earnings guidance. To the extent that firms are concerned
about litigation risk when they provide guidance, the opportunistic use of guidance is expected to
be mitigated. Hence, the positive association between the frequency of guidance and the crash
risk is expected to be weaker when the litigation risk is high. Amel-Zadeh et al. (2012) document
that acquirers issue upward biased guidance more frequently before merger & acquisition deals,
but this behavior is mitigated when the risk of bidder litigation is high, which suggests that
litigation risk plays an important role in curbing opportunism in guidance.
To examine the role of litigation risk in the association between stock price crash and
earnings guidance, we measure litigation risk (Lit_risk) as a firm-level class action litigation
probability estimate predicted according to the model developed by Kim and Skinner (2012).
The third column of Table 5 shows that the coefficient on the interaction term between Forecast
and Lit_risk is -0.045 and statistically significant, which suggests that litigation risk reduces the
opportunistic use of earnings guidance to inflate stock prices. The marginal impact of the
interaction term (untabulated) is -1.23% and significant, with a z-statistic of -4.56.
In untabulated analyses, we examine the associations between earnings guidance and

24
crash risk in cases of low or high litigation risk. In other words, we focus on the main effect (i.e.,
coefficient on Forecast) as opposed to the interaction effect. We find that a positive association
between earnings guidance and crash risk is present only when there is low litigation risk. Taken
together, these results provide strong evidence that litigation risk plays an important role in
reducing the agency problems associated with voluntary disclosure.
Sarbanes-Oxley Act
We also examine how the association between a stock price crash and guidance varies
with financial reporting. First, we focus on financial reporting opacity. Feng et al. (2012)
hypothesize and find that when managers expect earnings to be manipulated or when they have
already begun to misstate earnings, they are likely to adopt a coordinated earnings guidance
strategy that would help conceal the manipulation, as its revelation is likely to impose substantial
costs on both managers and their firms. To the extent that firms adopt a coordinated strategy of
concealing bad news, we expect that when there are more opaque earnings (due to earnings
manipulation), the positive association between guidance and crash risk is likely to be
exacerbated. Second, we investigate the effect of the Sarbanes-Oxley Act (SOX). SOX reduces
accruals manipulation via the imposition of higher litigation risk on managers for fraudulent
reporting (Cohen et al. 2008). In a further examination of the positive association between stock
price crash and financial reporting opacity, HMT finds that this association appears to have
dissipated since the passage of SOX. They conclude that either earnings management has
decreased or that firms can hide less information in the new regulatory environment. To the
extent that SOX constrains managers’ ability to manipulate earnings to meet or beat prior
earnings guidance, we expect the positive association between guidance and crash risk to be

25
attenuated post SOX. 12
In the fourth column in Table 6, the coefficient on the interaction term between Forecast
and SOX is -0.041 is statistically significant. The untabulated marginal impact of Forecast × SOX
is -1.13% and significant, with a z-statistic of -3.32. These results indicate that the positive
association between Forecast and Crash is smaller in the post-SOX period, and is consistent
with the notion that more regulatory constraints lead to less opportunistic use of earnings
guidance to distort investors’ beliefs.
Opacity in Financial Reporting
HMT identify opacity in financial reporting an important determinant of high crash risk.
Assuming that opaque financial reporting is a diagnostic of underlying managerial opportunism
and bad news hoarding, we consider Opacity as an ex post measure of severe agency problems.
In the fifth column of Table 5, we report that the coefficient on the interaction term between
Forecast and Opacity is 0.028 and statistically significant. The untabulated marginal impact of
this interaction term (0.75%) is also highly significant, with a z-statistic of 3.7. This suggests that
when there is more opaque financial reporting, the positive association between earnings
guidance and crash risk is exacerbated.
One alternative takeaway is that more transparent financial reporting is important for
investors to see through any opportunism in management forecasting. Financial reports provide
an important context for management forecasts, as they help investors determine whether such
forecasts are realistic. Another related interpretation is that opacity in financial reporting alone is
not enough for bad news hoarding. Only when opacity is accompanied by camouflaging
12 We acknowledge that one difficulty with examining the effect of SOX is the number of events in the time period before and after it (e.g., Regulation Fair Disclosure in 2001, Securities Offering Reform in 2005, and various accounting scandals). We examine the effect of SOX (as one of many different analyses) in our setting to facilitate comparison of our result and that in HMT, who examine the effect of SOX on the association between financial reporting opacity and crash risk.

26
guidance that helps sustain investors’ (unwarrantedly high) expectations are managers able to
accumulate more bad news, which leads to a price crash.
Forecast Bias
To further investigate our finding that frequent guidance can incur future crashes, we
examine the forecast biases of these frequent forecasters. In particular, for the sample of
forecasting firms, we construct an additional measure, Up_bias, which is a dummy variable
equaling one if, on average, the management forecasts are upward biased compared to actual
earnings.
The last column of Table 5 reports how the cross-sectional variation in Up_bias affects
the relation between forecast frequency and crash risk. Note that the sample size is significantly
smaller because Up_bias is only available for forecasting firms and requires the actual
corresponding earnings. We show that the positive association between Forecast and Crash is
even stronger when forecasts are upwardly biased. This finding offers valuable insights into the
underlying mechanism through which more guidance affects crash risk; the upwardly biased
forecasts play a significant role in this phenomenon, as they could be indicative of managers’
opportunistically misleading investors and hoarding more bad news. The untabulated marginal
impact is 0.83% and significant, with a z-statistic of 2.07.
In summary, the results presented in this section provide consistent evidence that the
positive correlation between guidance frequency and crash risk is more pronounced when agency
problems are more severe. They support the view that opportunistic bad news hoarding in
guidance practice are instrumental to the relation between guidance frequency and crash risk.
Sensitivity Tests
Contemporaneous Crash

27
As a sensitivity test, we control for the contemporaneous stock price crash
(Crash_currfyr). This test serves to examine a scenario in which managers guide investors
expectations downward via a series of forecasts both in the current year and the next and these
forecasts lead to a continuation of crashes over the two years. In this case, managers are
considered to truthfully reveal bad news. In the first column of Table 6, we show that the
positive relationship between Forecast and Crash is still significant after controlling for
contemporaneous crashes.
Forecasting Horizon
We further investigate whether forecasting horizons matter. When managers
opportunistically bias their forecasts upward, one would expect they are more likely to use
longer term annual guidance and postpone the crashes to the next year because any biases in
short term guidance are likely to be revealed shortly through earnings announcements. Long-
horizon annual forecasts, on the contrary, can be used to disguise bad news for a longer period
and provide further impetus for earnings management to meet prior guidance. Therefore, these
long term forecasts should be associated with greater agency problems and eventually lead to
higher crash risk.
In the second column of Table 6, we present the effects of the frequencies of long-
horizon and short-horizon annual earnings forecasts separately. We categorize forecasts as long-
horizon if they are for annual earnings that will be announced during the next fiscal year
(timeline depicted in Figure 1). Forecasts on fiscal year t-1 earnings are classified as short-
horizon forecasts, as they are issued and shortly realized between the beginning of fiscal year t
and the annual earnings announcement date for the fiscal year t-1 earnings. The frequency of the
long-horizon forecasts is our main variable (Forecast), and the frequency of the short-horizon

28
forecasts is additionally calculated as Forecast_currfyr. As predicted, we find no relationship
between Forecast_currfyr and a future crash, suggesting that longer term forecasts are more
plagued with agency problems and are therefore more likely to be used opportunistically.
Optimism in Analyst Forecasts
One valid alternative explanation of our findings is that forecasts are issued for the
purpose of managing inflated analyst expectations down, and they incur crashes as a result. In
the third column of Table 6, we show that analyst forecast bias (Analyst_optimism) is unrelated
to future crashes, which suggests that analyst forecast bias are not the main determinants of our
main findings.
Jump Risk
We repeat the earlier analyses using the stock price jump risk, Jump, as a dependent
variable. The last column of Table 6 shows that there is no significant association between stock
price jump and guidance. This finding has three implications. First, it suggests that managers’
guidance behaviors associated with extreme price movements in the future are directional;
opportunistic guidance is, on average, upward biased in order to inflate stock prices. Second, the
crashes that are associated with guidance are unlikely to be temporary plunges that will be soon
reversed with jumps. Instead, they are likely to be downward price corrections due to the
revelation that stock prices have been inflated. Finally, the evidence indicates that the higher
crash risk associated with more guidance is not a mere manifestation of the increased volatility
after guidance (Rogers et al. 2009). If volatility after guidance is the main determinants of
crashes, the same volatility should also result in jumps.
Taken together, our results support the notion that more guidance, unlike transparent
financial reporting, may not necessarily be indicative of a more transparent disclosure that lowers

29
crash risk. Instead, more guidance is associated with higher crash risk, especially with the
presence of severe agency problems.
V. CONCLUSION
The relation between transparency and financial stability is an important issue and has
attracted significant attention from academics and practitioners. The evidence in HMT indicates
that more transparent financial reporting of earnings is associated with lower stock price crash
risk. This mandatory reporting of earnings, however, is just one of the many disclosure
mechanisms. In this paper, we study the relation between management earnings guidance, an
important type of voluntary disclosure, and crash risk. The earlier literature on earnings guidance
typically considers firms that provide more guidance to be more transparent. Recent literature,
however, focuses on how managers use earnings guidance opportunistically (that is, in a self-
serving way) within an agency theory framework. Related literature has also highlighted
investors’ concerns about the credibility of earnings guidance because of the voluntary, non-
audited nature of such guidance. Hence, how earnings guidance is, on average, related to stock
price crash risk seems to be an empirical question.
We find that more earnings guidance is associated with a higher likelihood of future stock
price crash and the economic significance of the guidance effect is comparable to the effect of
financial reporting opacity documented by HMT. Our identification strategies to deal with
endogeneity indicate that the link between guidance and stock price crash risk is causal: that is,
more guidance increases the stock price crash risk. While the finding of a positive association
between more earnings guidance and the stock price crash risk might appear surprising, further
analyses point to one explanation: agency problems associated with earnings guidance. In
particular, we find that the positive association between guidance and crash risk is more

30
pronounced when firms have higher executive stock ownership, but it is attenuated when there is
higher analyst coverage or higher litigation risk. Earnings guidance that are associated with
crashes tend to be over-optimistic and accompanied by reporting opacity.
A key implication of our paper is that it is important to recognize the agency problems in
both mandatory and voluntary corporate disclosures; HMT provides evidence of the former,
whereas we provide evidence of the latter. In particular, when managers are given the
opportunity to distort a disclosure, it is obvious that especially when incentives are high and/or
monitoring is weak, some will do so in the hope that market participants will be unable to
completely unravel the distortions. Just like earnings management exists with mandatory and
audited financial reports, it might not be surprising that opportunistic use of voluntary and non-
audited guidance also exists. In fact, many studies in the management forecast literature have
documented credibility concerns with and opportunistic uses of management forecasts. To
address the potential financial instability arising from frequent earnings guidance, it might be
useful to reduce the pressure on managers to provide frequent management forecasts, to make it
more costly for managers to lie (e.g., by increasing the managers’ litigation exposure), and to
increase investor awareness of the existence and consequences of the distortions.
Finally, we would like to emphasize that our findings do not suggest that the effects of
guidance are always negative in any setting. Our results indicate that, on average, more frequent
earnings guidance is associated with higher crash risk, which, in itself, is only one of many
possible capital market consequences. However, we examine the relation between guidance and
crash risk because stock price crashes are significant economic events and, more importantly, are
likely associated with considerable agency problems. By further showing the significant cross-
sectional and time-series variations in the association between guidance frequency and crash risk,
31
our study highlights that agency issues in voluntary disclosure could lead to an increased
likelihood of stock market crashes. While the notion that agency problems can lead to voluntary
disclosure problems is not new, to the best of our knowledge, our paper is the first to document
the effects in terms of stock price crashes. We believe that such evidence is important given
HMT’s findings on financial reporting opacity, the significant tension in the hypothesis about the
relation between guidance and stock price crash, as well as the typical view that more disclosure
equates to higher quality disclosure. Our results could also be informative to regulators and
practitioners.

32
Appendix 1
Variable definitions
Outcomes (t+1) Crash A crash in stock price is measured following HMT. Specifically, for each
firm-year observation, if there are at least 26 weekly stock returns in the following fiscal year (i.e., year t+1), we estimate the following firm-specific regression: ri,w = β0 + β1 rmkt,w-1 + β2 rmkt,w + β3 rmkt,w+1 + β4 rind,w-1 + β5 rind,w + β6 rind,w+1
+ εi,w, where ri,w is the current weekly return for firm i; rmkt,w (rmkt,w-1,
rmkt,w+1) is the weekly market return in the current (prior, next) week; and rind,w (rind,w-1, rind,w+1) is the weekly industry return in the current (prior, next) week.13 We then compute Wi,w, the natural logarithm of one plus the residual return, εi,w, from the regression; Crash is a dummy variable equaling one if, in year t+1, there is at least one extremely low Wi,w, which is defined as a Wi,w smaller than [Mean (Wi,w) - 3.09 × Std Dev (Wi,w)], and zero otherwise.
Jump Jump in stock price is measured following HMT. Similar to the calculation of Crash, Jump is a dummy variable equaling one if, in year t+1, there is at least one extremely high Wi,w, which is defined as a Wi,w greater than [Mean (Wi,w) + 3.09 × Std Dev (Wi,w)], and zero otherwise.
Disclosure variables (t) Forecast Number of annual earnings forecasts issued over the course of the fiscal
year t.
Opacity Opacity measured following HMT. Opacity2 Square of Opacity. Accruals_quality Accruals quality measured following Francis et al. (2005). Accruals_quality2 Square of Accruals_quality. Control variables (t) ROE Return-on-assets. Size Natural logarithm of market value of equity at fiscal year end. Market-to-Book Ratio of the market value of equity to the book value of equity at fiscal year
end.
Leverage Ratio of total debt to total assets. Abn_Accruals Abnormal accruals measured using the cross-sectional Jones (1991) model
by industry.
Business_segments Number of business segments in which the firm operates.
13 The weekly stock (market) returns are computed using the daily stock (value-weighted market) returns from CRSP. The weekly value-weighted Fama-French industry returns are computed using the daily industry returns available from Kenneth French’s website: http://mba.tuck.dartmouth.edu/pages/faculty/ken.french/data_library.html.

33
Mean_return Average of weekly returns. Std_return Standard deviation of weekly returns. Analyst Number of analysts issuing one-year-ahead EPS forecasts at the end of fiscal
year t. Insider_trading Shares traded by insiders as a percentage of the total shares outstanding. Crash_currfyr Dummy variables equaling one if firms had at least one crash in fiscal year t. Instrumental variable (t) RegFD Dummy variable equaling one if fiscal year t is after the effective date of
Regulation Fair Disclosure (i.e., October 2000), zero otherwise.
Other forecast characteristics (t) Up_bias Dummy variable equaling one if on average, the management forecasts are
upward biased; management forecast bias is measured as management forecast minus actual earnings, scaled by stock price on the day before the forecast.
Forecast_currfyr Number of annual year t-1 earnings forecasts issued and realized in fiscal year t.
Analyst_optimism The analyst forecast consensus mean EPS at the end of the fiscal year minus the actual EPS for fiscal year t, scaled by price.
Forecaster Dummy variable equaling one if a firm issued at least one annual earnings forecast in fiscal year t.
Partitioning variables (t) CEO_own Dummy variable equaling one if the beginning-of-the-year percentage of
shares owned by the CEO is above the median for the year, zero otherwise.
Lit_risk Lit_Risk is a measure of litigation risk estimated from the probit model by Kim and Skinner (2011): Suedt =β0 + β1 Lit_industryt + β2 Lnasetst-1 + β3 SalesGrowtht-1 + β4 Returnt-
1+β5 ReturnSkewnesst-1+β6 ReturnStdt-1+β7 Turnovert-1+ ε t, where Sued is a dummy variable indicating whether a class action lawsuit was filed against the firm during the fiscal year. Lawsuits are retrieved from the Stanford Litigation Database; any IPO, mutual fund, or analyst-related cases are excluded. Lit_Industry is a dummy variable indicating whether the firm is in the biotech, computer, electronics, or retail industry. LnAssets is the natural logarithm of total assets. SalesGrowth is the change in annual sales deflated by lagged total assets. Return is the market-adjusted annual return. ReturnSkewness is the skewness of the firms’ 12-month returns. ReturnStd is the standard deviation of the firm’s 12-month returns. Turnover is the annual trading volume deflated by the beginning-of-the-year outstanding shares. Lit_Risk is the predicted value from the probit regression.
SOX Dummy variable equaling one if the year is 2002 or later, zero otherwise.

34
References Aboody, D., and R. Kasznik. 2000. CEO stock option awards and the timing of corporate
voluntary disclosures. Journal of Accounting and Economics 29: 73-100. Ajinkya, B. B., and M. J. Gift. 1984. Corporate managers’ earnings forecasts and symmetrical
adjustments of market expectations. Journal of Accounting Research 22: 425-444. Amel-Zadeh, A., B. Lev, and G. Meeks. 2012. Great expectations: Managerial earnings forecasts
in mergers and acquisitions. Working paper, University of Cambridge and New York University.
Bailey, W., H. T. Li, C. X. Mao, and R. Zhong. 2003. Regulation fair disclosure and earnings
information: Market, analyst, and corporate responses. Journal of Finance 58: 2487-2514. Benmelech, E., E. Kandel, and P. Veronesi. 2010. Stock-based compensation and CEO
(dis)incentives. Quarterly Journal of Economics 125: 1769-1820. Bergman, N.K., and S. Roychowdhury. 2008. Investor sentiment and corporate disclosure.
Journal of Accounting Research 46: 1057-1083. Beyer, A., D. A Cohen, T. Z. Lys, and B. R. Walther. 2010. The financial reporting environment:
Review of the recent literature. Journal of Accounting and Economics 50: 296-343. Bleck, A., and X. Liu. 2007. Market transparency and the accounting regime. Journal of
Accounting Research 45: 229-256. Bolton, P., J. Scheinkman, and W. Xiong. 2006. Executive compensation and short-termist
behavior in speculative markets. Review of Economic Studies 73: 577-610. Burns, N., and S. Kedia. 2006. The impact of performance-based compensation on misreporting.
Journal of Financial Economics 79: 35-67. Bushee, B. J. 1998. The influence of institutional investors on myopic R&D investment behavior.
The Accounting Review 73: 305-333. ______, 2001. Do institutional investors prefer near-term earnings over long-run value?
Contemporary Accounting Research 18: 207-246. ______, D. Matsumoto, and G. Miller. 2004. Managerial and investor responses to disclosure
regulation: The case of Reg FD and conference calls. The Accounting Review 79: 617–643. Bushman, R. M., and A. J. Smith. 2001. Financial accounting information and corporate
governance. Journal of Accounting and Economics 32: 237-333. Callen, J. L., and X. Fang. 2011. Institutional investors and crash risk: Monitoring or
35
expropriation? Working paper, University of Toronto and Georgia State University. CFA Institute (Krehmeyer, D., and M. Orsagh.) 2006. Breaking the short-term cycle. CFA
Institute Codes, Standards, and Position Papers. (July). Chen, J., H. Hong, and J. C. Stein. 2001. Forecasting crashes: Trading volume, past returns, and
conditional skewness in stock prices. Journal of Financial Economics 61: 345-381. Chen, S., D. Matsumoto, and S. Rajgopal. 2011. Is silence golden? An empirical analysis of
firms that stop giving quarterly guidance. Journal of Accounting and Economics 51: 134-150. Cheng, Q., and K. Lo. 2006. Insider trading and voluntary disclosures. Journal of Accounting
Research 44: 815-848. ______, and T. D. Warfield. 2005. Equity incentives and earnings management. The Accounting
Review 80: 441-476. Cohen, D., A. Dey, and T. Lys. 2008. Real and accrual based earnings management in the pre
and post Sarbanes Oxley periods. The Accounting Review 83: 757-787. Coller, M., and T. L. Yohn. 1997. Management forecasts and information asymmetry: An
examination of bid-ask spreads. Journal of Accounting Research 35: 181-191. Core, J. 2001. A review of the empirical disclosure literature: Discussion. Journal of Accounting
and Economics 31: 441-456. Cotter, J., İ. Tuna, and P. Wysocki. 2006. Expectations management and beatable targets: How
do analysts react to explicit earnings guidance? Contemporary Accounting Research 23: 593-624.
Dechow, P. M., and I. D. Dichev. 2002. The quality of accruals and earnings: The role of accrual
estimation errors. The Accounting Review 77: 35-59. ______, R. G. Sloan, and A. P. Sweeney. 1995. Detecting earnings management. The Accounting
Review 70: 193-225. Deloitte and FERF. 2009. Earnings guidance: The current state of play. Deloitte Development
LLC and Financial Executives Research Foundation Inc. (June). Dichev, I., H. Graham, C. R. Harvey, and S. Rajgopal. 2012. Earnings quality: Evidence from
the field. Working paper, Emory University and Duke University. Feng, M., W. Ge, C. Li, and N. J. Nagarajan. 2012. How do earnings manipulators guide
investors? Working paper, University of Pittsburgh and University of Washington. Field, L., M. Lowry, and S. Shu. 2005. Does disclosure deter or trigger litigation? Journal of

36
Accounting and Economics, 39: 487-507. Fischer, P. E., and R. E. Verrecchia. 2000. Reporting bias. The Accounting Review 75: 229-245. Foster, E. M. 1997. Instrumental variables for logistic regression: An illustration. Social Science
Research 26: 487–504. Francis, J., R. LaFond, P. Olsson, and K. Schipper. 2005. The market pricing of accruals quality.
Journal of Accounting and Economics 39: 295-327. ______, D. Nanda, and X. Wang. 2006. Re-examining the effects of regulation fair disclosure
using foreign listed firms to control for concurrent shocks. Journal of Accounting and Economics 41: 271–292.
Frankel, R., M. McNichols, and G. P. Wilson. 1995. Discretionary disclosure and external
financing. The Accounting Review 70: 135-150. French, K., G. W. Schwert, and R. F. Stambaugh. 1987. Expected stock returns and volatility.
Journal of Financial Economics 19: 3-29. Gilson, S. 1989. Management turnover and financial distress. Journal of Financial Economics 25:
241–62. Graham, J. R., C. R. Harvey, and S. Rajgopal. 2005. The economic implications of corporate
financial reporting. Journal of Accounting and Economics 40: 3-73. Hassell, J. M., and R. H. Jennings. 1986. Relative forecast accuracy and the timing of earnings
forecast announcements. The Accounting Review 61: 58-76. Healy, P. M., and K. G. Palepu. 2001. Information asymmetry, corporate disclosure, and the
capital markets: A review of the empirical disclosure literature. Journal of Accounting and Economics 31: 405-440.
Heflin, F., K. R. Subramanyam, and Y. A. Zhang. 2003. Regulation FD and the financial
information environment: Early evidence. The Accounting Review 78: 1-37. Hermalin, B. E., and M. S. Weisbach. 2012. Information disclosure and corporate governance.
The Journal of Finance 67: 195-234. Hirst, D. E., L. Koonce, and S. Venkataraman. 2008. Management earnings forecasts: A review
and framework. Accounting Horizons 22: 315-338. Hong, H., and J. C. Stein. 2003. Differences of opinion, short-sales constraints, and market
crashes. Review of Financial Studies 16: 487-525. Houston, J. F., L. Baruch, and J. W. Tucker. 2010. To guide or not to guide? Causes and

37
consequences of stopping quarterly earnings guidance. Contemporary Accounting Research 27: 143-185.
Hutton, A. P., A. J. Marcus, and H. Tehranian. 2009. Opaque financial reports, R2, and crash risk.
Journal of Financial Economics 94: 67-86. ______, G. S. Miller, and D. J. Skinner. 2003. The role of supplementary statements with
management earnings forecasts. Journal of Accounting Research 41: 867-890. Jensen, M., and W. Meckling. 1976. Theory of the firm: Managerial behavior, agency costs and
ownership structure. Journal of Financial Economics 3: 305-360. ______, and K. Murphy. 1990. CEO incentives—it’s not how much you pay, but how. Harvard
Business Review 3: 138-153. Jin, L., and S. C. Myers. 2006. R2 around the world: New theory and new tests. Journal of
Financial Economics 79: 257-292. Jones, J. 1991. Earnings management during import relief investigations. Journal of Accounting
Research 29: 193-228. Kasznik, R. 1999. On the association between voluntary disclosure and earnings management.
Journal of Accounting Research 37: 57-81. ______, and B. Lev. 1995. To warn or not to warn: Management disclosures in the face of an
earnings surprise. The Accounting Review 70: 113-134. Kim, I., and D. J. Skinner. 2012. Measuring securities litigation risk. Journal of Accounting and
Economics 53: 290-310. Kim, J., Y. Li, and L. Zhang. 2011a. CFOs Versus CEOs: Equity incentives and crashes. Journal
of Financial Economics 101: 713-730. ______, ______, and ______. 2011b. Corporate tax avoidance and stock price crash risk: Firm-
level analysis. Journal of Financial Economics 100: 639-662. Kothari, S. P., S. Shu, and P. D. Wysocki. 2009. Do managers withhold bad news? Journal of
Accounting Research 47: 241-276. Lambert, R., D. F. Larcker, and R. E. Verrecchia. 1991. Portfolio considerations in valuing
executive compensation. Journal of Accounting Research 29: 129–149. Larcker, D. F., and T. Rusticus. 2010. On the use of instrumental variables in accounting
research. Journal of Accounting and Economics 49: 186-205.
Leuz, C., and R. E. Verrecchia. 2000. The economic consequences of increased disclosure.

38
Journal of Accounting Research 38: 91-124. Lev, B. 2011. Winning Investors Over: Surprising Truths About Honesty, Earnings Guidance,
And Other Ways To Boost Your Stock Price. Cambridge MA: Harvard Business Review Press.
Libby, R., and K. Rennekamp. 2012. Self-serving attribution bias, overconfidence, and the
issuance of management forecasts. Journal of Accounting Research 50: 197-231. Matsumoto, D. A. 2002. Management’s incentives to avoid negative earnings surprises. The
Accounting Review 77: 483-514. McKinsey & Company (Hsieh, P., T. Koller, and D. R. Rajan.) 2006. The misguided practice of
earnings guidance. The McKinsey Quarterly (March). McNichols, M. F. 2002. The quality of accruals and earnings: The role of accrual estimation
errors: discussion. The Accounting Review 77: 61-69. Moyer, R. C., R. E. Chatfield, and P. M. Sisneros. 1989. Security analyst monitoring activity:
Agency costs and information demands. The Journal of Financial and Quantitative Analysis 24: 503–512.
Nagar, V., D. Nanda, and P. Wysocki. 2003. Discretionary disclosure and stock-based incentives.
Journal of Accounting and Economics 34: 283-309. Newey, W. K. 1987. Efficient estimation of limited dependent variable models with endogenous
explanatory variables. Journal of Econometrics 36: 231-250. Noe, C. 1999. Voluntary disclosures and insider transactions. Journal of Accounting and
Economics 27: 305-326. Petersen, M. 2009. Estimating standard errors in finance panel data sets: Comparing approaches.
Review of Financial Studies 22: 435-480. Rees, L. L., A. Srivastava, and S. Y. Tse. 2009. An examination of the accuracy and usefulness
of management earnings guidance around stock option grants. Working paper, Texas A&M University and Northwestern University.
Rogers, J. L., and P. C. Stocken. 2005. Credibility of management forecasts. The Accounting
Review 80: 1233-1260. ______, D. J. Skinner, and A. Van Buskirk. 2009. Earnings guidance and market uncertainty.
Journal of Accounting and Economics 48: 90-109. Romer, D., 1993. Rational asset-price movements without news. American Economic Review 83,
1112–1130.

39
Shroff, N., A. X. Sun, H. D. White, and W. Zhang. 2012. Market conditioning before seasoned
equity offerings: A reexamination of management forecasts and the impact of the Sarbanes-Oxley Act. Working paper, MIT, Pennsylvania State University, University of Michigan, and Cheung Kong Graduate School of Business.
Skinner, D.J. 1994. Why firms voluntarily disclose bad news. Journal of Accounting Research
32: 38-60. ______, 1997. Earnings disclosures and stockholder lawsuits. Journal of Accounting and
Economics 23: 249-282. Staiger, D., and J. H. Stock. 1997. Instrumental variables regression with weak instruments.
Econometrica 65: 557-586. Stock, J. H., J. H. Wright, and M. Yogo. 2002. A survey of weak instruments and weak
identification in generalized method of moments. Journal of Business & Economics Statistics 20: 518-529.
Taleb, N. 2007. The Black Swan: The Impact of the Highly Improbable. New York, NY: Random
House Inc. Verrecchia, R. E. 2001. Essays on disclosure. Journal of Accounting and Economics 32: 97-180. Watts, R., and J. Zimmerman. 1986. Positive Accounting Theory. Englewood Cliffs, NJ:
Prentice-Hall. Young, M. R. 2006. Accounting Irregularities and Financial Fraud: A Corporate Governance
Guide. Chicago, IL: CCH Inc.

40
Figure 1 Timeline for measuring guidance frequency, opacity, and stock price crashes
Forecastt: the number of annual earnings forecasts made in fiscal year t, for
fiscal year t, t+1, t+2, …..
Crasht+1: a dummy variable equaling one if a firm
experiences at least one crash in fiscal year t+1.
Opacityt: HMT’s opacity measure as of the end of
fiscal year t
fiscal year t fiscal year t+1

41
Table 1 Sample description This table presents descriptive information about the sample. Panel A presents the distribution of firms across the years for the sample period from 1997 to 2009. Panel B presents information about the weeks with extremely negative stock returns. These weekly returns are used to construct the key variable in our analysis, Crash, which is a dummy variable equaling one if a firm has at least one extremely negative weekly stock return in the year. Panel C presents a univariate analysis of the relation between a stock price crash and guidance. Panel A: Distribution of firms
Year Number of firms Number of firms with Percentage of firms with
at least one forecast at least one forecast 1997 3,943 56 1.42% 1998 3,863 129 3.34% 1999 3,811 187 4.91% 2000 3,651 228 6.24% 2001 3,466 456 13.16% 2002 3,412 632 18.52% 2003 3,408 706 20.72% 2004 3,288 783 23.81% 2005 3,079 714 23.19% 2006 2,930 751 25.63% 2007 2,804 744 26.53% 2008 2,705 732 27.06% 2009 2,646 608 22.98%
43,006 6,726
Panel B: Guidance and stock price crash risk
Type of guidance in year t Percentage of firm-years with at least one weekly stock
price crash in year t + 1 (i.e., firms with Crash = 1)
No guidance 18.51% Low frequency 23.19% High frequency 25.60% Difference between High frequency and No guidance 7.09%
t-stat 10.12

42
Table 2 Descriptive statistics This table presents the descriptive statistics of the variables in the study. The definitions of the variables are provided in the appendix.
Variable N Mean Std Dev P25 Median P75 Crash 43,006 0.197 0.398 0.000 0.000 0.000 Disclosure variables Forecast 43,006 0.738 1.806 0.000 0.000 0.000Opacity 43,006 0.237 0.317 0.100 0.172 0.294 Accruals_quality 24,890 0.047 0.038 0.021 0.036 0.061
Control variables ROE 43,006 -0.284 44.855 -0.063 0.077 0.153 Size 43,006 5.599 2.178 3.986 5.553 7.076 Market-to-book 43,006 3.371 59.813 1.119 1.882 3.290 Leverage 43,006 0.225 0.312 0.021 0.177 0.348 Abn_accruals 43,006 0.005 0.184 -0.030 0.016 0.060 Business_segments 43,006 5.260 4.363 3.000 3.000 9.000 Mean_return 43,006 0.003 0.012 -0.003 0.003 0.009 Std_return 43,006 0.081 0.051 0.048 0.069 0.100 Insider_trading 43,006 0.778 3.842 0.000 0.021 0.442

43
Table 3 Stock price crash and management forecast frequency This table presents the relation between stock price crash and management forecast frequency. The definitions of the variables are provided in Appendix 1. Year dummies are included in all the regressions but their coefficients are not tabulated. The standard errors are clustered by firm and by year. The t-statistic for each coefficient is provided in parentheses below the coefficient. Significance levels are based on two-tailed tests. ***, **, and * denote significance at the 1%, 5%, and 10% levels, respectively. The economic effect is the expected change in the crash risk resulting from an increase in each independent variable from the 25th to the 75th percentiles in the sample distribution.
Crash Economic
Effect
Intercept -1.188*** -1.280*** (-19.81) (-20.86)
ROE 0.000 0.001 0.00% (0.85) (1.21)
Size 0.037*** 0.042*** 3.08% (4.53) (4.98)
Market-to-book 0.000 0.001*** 0.01%
(1.23) (3.00)
Leverage 0.010 -0.002 0.09%
(0.35) (-0.04)
Abn_accruals 0.070 0.101 0.17%
(0.97) (1.05) Business_segments -0.007*** -0.007*** -1.14%
(-3.93) (-2.74) Mean_return 2.987*** 3.940*** 0.96%
(3.11) (3.49)
Std_return -0.741*** -1.073*** -1.08%
(-3.05) (-3.37)
Insider_trading 0.003* 0.007** 0.03%
(1.70) (2.15)
Opacity 0.188** 0.79%
(2.51)
Opacity2 -0.101**
(-2.12) Accruals_quality 2.804***
(3.69) Accruals_quality2 -10.920**
(-2.45) Forecast 0.018*** 0.019*** 0.50%
(4.24) (4.05)
Observations 43,006 24,890 43,006

44
Table 4 Stock price crash and management forecast frequency – instrumental variable approach
This table presents the relation between a stock price crash and management forecast frequency estimated using a probit model with a continuous endogenous regressor (Newey 1987; Foster 1997). We employ RegFd as an instrumental variable for Forecast. The definitions of the variables are provided in Appendix 1. Year dummies are included in all the regressions but their coefficients are not tabulated. The standard errors are clustered by firm and by year. The t-statistic for each coefficient is provided in parentheses below the coefficient. Significance levels are based on two-tailed tests. ***, **, and * denote significance at the 1%, 5%, and 10% levels, respectively.
1st stage 2nd stage
Intercept -1.078*** -0.831***
(-16.53) (-18.56) ROE 0.000 0.000
(0.90) (0.92) Size 0.250*** -0.017**
(23.18) (-2.38)
Market-to-book -0.000 0.000
(-1.37) (1.49)
Leverage 0.083** -0.010
(2.22) (-0.34)
Abn_accruals -0.013 0.068
(-0.40) (1.19) Business_segments 0.022*** -0.010***
(4.16) (-4.56) Mean_return -6.841*** 4.120***
(-12.15) (6.78)
Std_return -0.568*** -0.714***
(-2.95) (-3.98)
Insider_trading 0.002 0.003
(0.84) (1.52)
Opacity -0.328*** 0.230***
(-7.26) (3.24)
Opacity2 0.011*** -0.088*
(7.07) (-1.69)
RegFD 0.663***
(28.37)
Forecast 0.220***
(10.89)
Observations 43,006 43,006
R-square (%) 16.72%

45
Table 5 Stock price crash and management forecast frequency – agency problems
This table examines how the relation between a stock price crash and management forecast frequency varies cross-sectionally with various proxies of agency problems CEO ownership, external monitoring, litigation risk, SOX, opaque reporting, and forecast biases. The definitions of the variables are provided in the appendix. All the control variables in Table 3, intercepts, and year dummies are used in all the regressions but not tabulated for parsimony. The standard errors are clustered by firm and by year. The t-statistic for each coefficient is provided in parentheses below the coefficient. Significance levels are based on two-tailed tests. ***, **, and * denote significance at the 1%, 5%, and 10% levels, respectively.
Crash
Forecast 0.006 0.046*** 0.054*** 0.057*** 0.009* 0.000
(0.78) (3.20) (5.41) (3.99) (1.80) (0.03) CEO_own -0.068**
(-2.20) Forecast x CEO_own 0.038***
(3.19) Analyst 0.144***
(6.13) Institution_own 0.148***
(8.92) Forecast × Analyst -0.036**
(-2.40) Forecast × Institution_own 0.000
(0.00) Lit_risk 0.133***
(6.60) Forecast × Lit_risk -0.045***
(-3.59) SOX 0.120**
(2.27) Opacity × SOX -0.078 (-1.08) Forecast × SOX -0.041*** (-2.70) Forecast × Opacity 0.028***
(3.01)
Up_bias 0.032 (0.52)
Forecast × Up_bias 0.026* (1.66)
Observations 15,652 43,006 37,671 43,006 43,006 8,152

46
Table 6 Sensitivity tests
This table examines how current period crashes, forecast horizons, analyst forecast bias, and the use of an alternative measure of forecast affect our main finings. The definitions of the variables are provided in Appendix 1. Year dummies are included in all the regressions but their coefficients are not tabulated. The standard errors are clustered by firm and by year. The t-statistic for each coefficient is provided in parentheses below the coefficient. Significance levels are based on two-tailed tests. ***, **, and * denote significance at the 1%, 5%, and 10% levels, respectively. Crash Jump
Intercept -1.194*** -1.188*** -1.104*** -1.187*** -0.116** (-15.81) (-20.10) (-17.14) (-19.82) (-1.96)
ROE 0.000 0.000 0.000 0.000 -0.000 (0.79) (0.85) (0.98) (0.85) (-0.62)
Size 0.034*** 0.036*** 0.022** 0.036*** -0.107*** (3.32) (4.56) (2.46) (4.45) (-13.04)
Market-to-book 0.000 0.000 0.000 0.000 -0.000 (1.18) (1.23) (1.19) (1.23) (-0.88)
Leverage 0.012 0.010 -0.070** 0.010 0.030 (0.38) (0.35) (-2.27) (0.36) (1.05)
Abn_accruals 0.135* 0.070 0.197** 0.068 -0.018 (1.87) (0.97) (2.37) (0.95) (-0.56)
Business_segments -0.007*** -0.007*** -0.005*** -0.007*** -0.001 (-3.36) (-3.90) (-2.72) (-3.96) (-0.51)
Mean_return 3.105*** 2.986*** 4.082*** 3.017*** -4.803*** (3.04) (3.10) (4.28) (3.14) (-5.42)
Std_return -0.834*** -0.741*** -0.431 -0.735*** 0.544*** (-2.61) (-3.05) (-1.23) (-2.99) (2.59)
Insider_trading 0.005** 0.003* 0.005*** 0.003* -0.001 (2.08) (1.70) (3.09) (1.69) (-0.26)
Opacity 0.224** 0.188** 0.261** 0.190*** 0.008 (2.25) (2.52) (2.17) (2.58) (0.18)
Opacity2 -0.127* -0.101** -0.128 -0.101** 0.001 (-1.82) (-2.11) (-1.38) (-2.13) (1.04)
Forecast 0.017*** 0.018*** 0.018*** 0.009 (3.44) (4.03) (4.05) (1.51)
Crash_currfyr 0.127*** (5.55)
Forecast_currfyr -0.006 (-0.12)
Analyst_optimism -0.010 (-0.62)
Forecaster 0.107*** (4.62)
Observations 33,128 43,006 30,780 43,006 43,006