HIV/AIDS - Monitoring the Future · MONITORING the FUTURE Sponsored by The National Institute on...
136
MONITORING the FUTURE Sponsored by The National Institute on Drug Abuse at The National Institutes of Health HIV/AIDS Risk & Protective Behaviors among American Young Adults 2004-2012 Lloyd D. Johnston Patrick M. O’Malley Jerald G. Bachman John E. Schulenberg Megan E. Patrick Richard A. Miech
Transcript of HIV/AIDS - Monitoring the Future · MONITORING the FUTURE Sponsored by The National Institute on...

MONITORING the FUTURE
Sponsored by The National Institute on Drug Abuse at The National Institutes of Health
HIV/AIDSRisk & Protective Behaviors
among American Young Adults
2004-2012
Lloyd D. Johnston
Patrick M. O’Malley
Jerald G. Bachman
John E. Schulenberg
Megan E. Patrick
Richard A. Miech
HIV/AIDS: RISK & PROTECTIVE BEHAVIORS AMONG
AMERICAN YOUNG ADULTS, 2004–2012
Lloyd D. Johnston, Ph.D. Patrick M. O’Malley, Ph.D. Jerald G. Bachman, Ph.D.
John E. Schulenberg, Ph.D. Megan E. Patrick, Ph.D. Richard A. Miech, Ph.D.
Institute for Social Research The University of Michigan
Sponsored by: The National Institute on Drug Abuse
National Institutes of Health
This publication was written by the principal investigators and staff of the Monitoring the Future project, at the Institute for Social Research, the University of Michigan, under Research Grants No. R01 DA 001411 and R01 DA 016575 from the National Institute on Drug Abuse. The findings and conclusions in this report are those of the authors and do not necessarily represent the views of the NIH.
Public Domain Notice
All material appearing in this volume is in the public domain and may be reproduced or copied without permission from the Institute or the authors. Citation of the source is appreciated.
Recommended Citation Johnston, L. D., O’Malley, P. M., Bachman, J. G., Schulenberg, J. E., Patrick, M. E.. & Miech, R. A. (2013). HIV/AIDS: Risk & Protective Behaviors among American Young Adults, 2004–2012. Ann Arbor: Institute for Social Research, The University of Michigan.
Institute for Social Research The University of Michigan
Ann Arbor, Michigan Published October 2013
TABLE OF CONTENTS
Click on any item below (in blue) to go directly to that page.
Chapter 1 Introduction .................................................................................................................1
Chapter 2 Background .................................................................................................................3
Other Relevant Studies of the General Population ....................................................................4
Chapter 3 Research Design..........................................................................................................6
Samples .....................................................................................................................................6
Measures ....................................................................................................................................7
Field Procedures.........................................................................................................................8
Panel Retention ..........................................................................................................................8
Limitations ...............................................................................................................................10
Sample Sizes and Trend Estimation for Young Adults (Ages 21–30) ....................................11
Sample Sizes for Respondents Ages 35 and 40 .......................................................................12
Adjusting for the Effects of Panel Attrition .............................................................................12
Significance Testing Protocol ..................................................................................................13
Chapter 4 Prevalence/Frequency of Risk Behaviors .................................................................17
Injection Drug Use ...................................................................................................................17
Needle Sharing .........................................................................................................................18
Sex with Multiple Partners.......................................................................................................19
Men Having Sex with Men and Other Sexual Behaviors ........................................................20
Chapter 5 Intersection of Risk Behaviors ..................................................................................29
Needle Sharing by Gender of Sex Partners..............................................................................29
Injection Drug Use and Needle Sharing by Number of Sex Partners ......................................30
Number of Sex Partners by Gender of Sex Partners ................................................................30
Chapter 6 Prevalence of Protective Behaviors ..........................................................................42
Condom Use.............................................................................................................................42
Getting Tested for HIV ............................................................................................................43
Chapter 7 Intersection of Protective Behaviors .........................................................................55
Frequency of Condom Use by Getting Tested for HIV ...........................................................55
Chapter 8 Intersection of Risk and Protective Behaviors ..........................................................62
Frequency of Condom Use by Number of Partners .................................................................62
Frequency of Condom Use by Gender of Partners ..................................................................63
Frequency of Condom Use by Needle Sharing........................................................................63
Getting Tested for HIV by Number of Partners.......................................................................63
Getting Tested for HIV by Gender of Partners ........................................................................64
Getting Tested for HIV by Needle Sharing .............................................................................64
TABLE OF CONTENTS (continued)
Chapter 9 Trends in the Prevalence and Frequency of Risk Behaviors ....................................79
Chapter 10 Trends in the Prevalence and Frequency of Protective Behaviors ...........................90
Condom Use.............................................................................................................................90
Getting Tested for HIV/AIDS ..................................................................................................90
Chapter 11 Blood Donation .........................................................................................................97
Donating Blood ........................................................................................................................97
Donating Blood by Gender of Sex Partners .............................................................................97
Donating Blood by Number of Sex Partners ...........................................................................98
Donating Blood by Injection Drug Use ...................................................................................98
Trends in Donating Blood ........................................................................................................98
Chapter 12 Conclusions .............................................................................................................113
Appendix Other Relevant Studies of the General Population .................................................117
Key Distinctions among the Studies ......................................................................................120
LIST OF TABLES
Click on any item below (in blue) to go directly to that page.
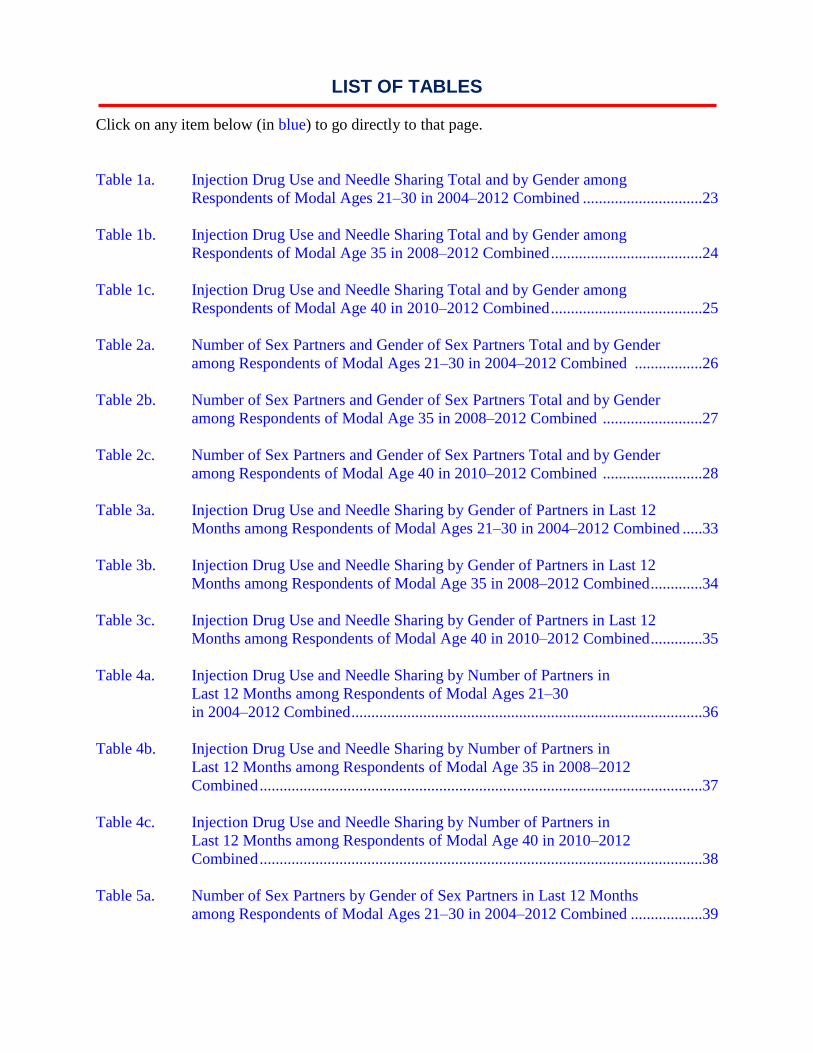
Table 1a. Injection Drug Use and Needle Sharing Total and by Gender among
Respondents of Modal Ages 21–30 in 2004–2012 Combined ..............................23
Table 1b. Injection Drug Use and Needle Sharing Total and by Gender among
Respondents of Modal Age 35 in 2008–2012 Combined ......................................24
Table 1c. Injection Drug Use and Needle Sharing Total and by Gender among
Respondents of Modal Age 40 in 2010–2012 Combined ......................................25
Table 2a. Number of Sex Partners and Gender of Sex Partners Total and by Gender
among Respondents of Modal Ages 21–30 in 2004–2012 Combined .................26
Table 2b. Number of Sex Partners and Gender of Sex Partners Total and by Gender
among Respondents of Modal Age 35 in 2008–2012 Combined .........................27
Table 2c. Number of Sex Partners and Gender of Sex Partners Total and by Gender
among Respondents of Modal Age 40 in 2010–2012 Combined .........................28
Table 3a. Injection Drug Use and Needle Sharing by Gender of Partners in Last 12
Months among Respondents of Modal Ages 21–30 in 2004–2012 Combined .....33
Table 3b. Injection Drug Use and Needle Sharing by Gender of Partners in Last 12
Months among Respondents of Modal Age 35 in 2008–2012 Combined .............34
Table 3c. Injection Drug Use and Needle Sharing by Gender of Partners in Last 12
Months among Respondents of Modal Age 40 in 2010–2012 Combined .............35
Table 4a. Injection Drug Use and Needle Sharing by Number of Partners in
Last 12 Months among Respondents of Modal Ages 21–30
in 2004–2012 Combined ........................................................................................36
Table 4b. Injection Drug Use and Needle Sharing by Number of Partners in
Last 12 Months among Respondents of Modal Age 35 in 2008–2012
Combined ...............................................................................................................37
Table 4c. Injection Drug Use and Needle Sharing by Number of Partners in
Last 12 Months among Respondents of Modal Age 40 in 2010–2012
Combined ...............................................................................................................38
Table 5a. Number of Sex Partners by Gender of Sex Partners in Last 12 Months
among Respondents of Modal Ages 21–30 in 2004–2012 Combined ..................39

LIST OF TABLES (Continued)
Table 5b. Number of Sex Partners by Gender of Sex Partners in Last 12 Months
among Respondents of Modal Age 35 in 2008–2012 Combined ..........................40
Table 5c. Number of Sex Partners by Gender of Sex Partners in Last 12 Months
among Respondents of Modal Age 40 in 2010–2012 Combined ..........................41
Table 6a. Frequency of Condom Use Total and by Gender among
Respondents of Modal Ages 21–30 in 2004–2012 Combined ..............................45
Table 6b. Frequency of Condom Use Total and by Gender among
Respondents of Modal Age 35 in 2008–2012 Combined ......................................46
Table 6c. Frequency of Condom Use Total and by Gender among
Respondents of Modal Age 40 in 2010–2012 Combined ......................................47
Table 6d. Use of Condoms in Past Year by 2-Year Age Groups among Young
Adults in 2004–2012 Combined……………………………………………….....48
Table 6e. Use of Condoms in Past Year by 2-Year Age Groups among
Respondents who Report NOT being Married among
Young Adults in 2004–2012 Combined…………………………………………..49
Table 6f. Use of Condoms in Past Year by 2-Year Age Groups among
Respondents who Report Being Married among
Young Adults 2004–2012 Combined…………………………………………..…50
Table 7a. Test for HIV, Lifetime and Last 12 Months Total and by Gender among
Respondents of Modal Ages 21–30 in 2004–2012 Combined ..............................51
Table 7b. Test for HIV, Lifetime and Last 12 Months Total and by Gender among
Respondents of Modal Age 35 in 2008–2012 Combined ......................................52
Table 7c. Test for HIV, Lifetime and Last 12 Months Total and by Gender among
Respondents of Modal Age 40 in 2010–2012 Combined ......................................53
Table 7d. Percentage of Respondents Who Have Had an HIV Test
in Their Lifetime by 2-Year Age Groups ..............................................................54
Table 8a. Test for HIV, Lifetime and Last 12 Months by Frequency of Condom
Use among Respondents of Modal Ages 21–30 in 2004–2012 Combined ...........57
Table 8b. Test for HIV, Lifetime and Last 12 Months by Frequency of Condom
Use among Respondents of Modal Age 35 in 2008–2012 Combined ...................58
Table 8c. Test for HIV, Lifetime and Last 12 Months by Frequency of Condom
Use among Respondents of Modal Age 40 in 2010–2012 Combined ...................59
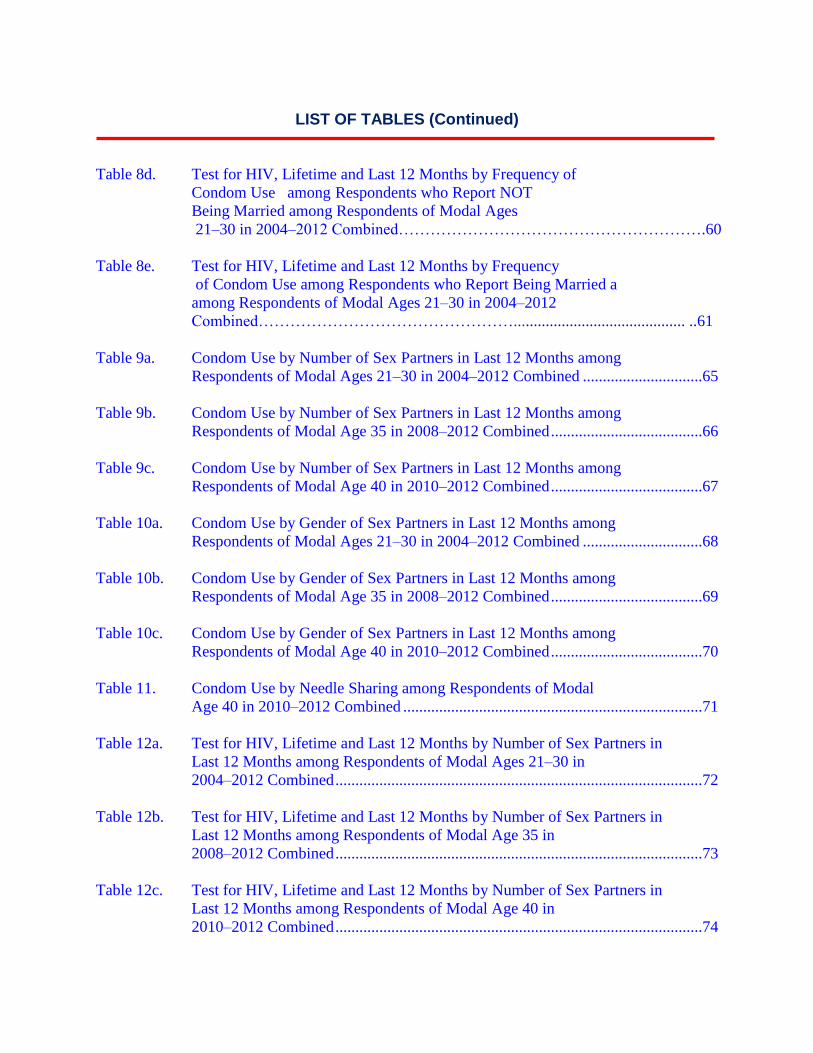
LIST OF TABLES (Continued)
Table 8d. Test for HIV, Lifetime and Last 12 Months by Frequency of
Condom Use among Respondents who Report NOT
Being Married among Respondents of Modal Ages
21–30 in 2004–2012 Combined………………………………………………….60
Table 8e. Test for HIV, Lifetime and Last 12 Months by Frequency
of Condom Use among Respondents who Report Being Married a
among Respondents of Modal Ages 21–30 in 2004–2012
Combined…………………………………………........................................... ..61
Table 9a. Condom Use by Number of Sex Partners in Last 12 Months among
Respondents of Modal Ages 21–30 in 2004–2012 Combined ..............................65
Table 9b. Condom Use by Number of Sex Partners in Last 12 Months among
Respondents of Modal Age 35 in 2008–2012 Combined ......................................66
Table 9c. Condom Use by Number of Sex Partners in Last 12 Months among Respondents of Modal Age 40 in 2010–2012 Combined ......................................67
Table 10a. Condom Use by Gender of Sex Partners in Last 12 Months among
Respondents of Modal Ages 21–30 in 2004–2012 Combined ..............................68
Table 10b. Condom Use by Gender of Sex Partners in Last 12 Months among
Respondents of Modal Age 35 in 2008–2012 Combined ......................................69
Table 10c. Condom Use by Gender of Sex Partners in Last 12 Months among
Respondents of Modal Age 40 in 2010–2012 Combined ......................................70
Table 11. Condom Use by Needle Sharing among Respondents of Modal
Age 40 in 2010–2012 Combined ...........................................................................71
Table 12a. Test for HIV, Lifetime and Last 12 Months by Number of Sex Partners in
Last 12 Months among Respondents of Modal Ages 21–30 in
2004–2012 Combined ............................................................................................72
Table 12b. Test for HIV, Lifetime and Last 12 Months by Number of Sex Partners in
Last 12 Months among Respondents of Modal Age 35 in
2008–2012 Combined ............................................................................................73
Table 12c. Test for HIV, Lifetime and Last 12 Months by Number of Sex Partners in
Last 12 Months among Respondents of Modal Age 40 in
2010–2012 Combined ............................................................................................74

LIST OF TABLES (Continued)
Table 13a. Test for HIV, Lifetime and Last 12 Months by Gender of Sex Partners in
Last 12 Months among Respondents of Modal Ages 21–30 in
2004–2012 Combined ............................................................................................75
Table 13b. Test for HIV, Lifetime and Last 12 Months by Gender of Sex Partners in
Last 12 Months among Respondents of Modal Age 35 in
2008–2012 Combined ............................................................................................76
Table 13c. Test for HIV, Lifetime and Last 12 Months by Gender of Sex Partners in
Last 12 Months among Respondents of Modal Age 40 in
2010–2012 Combined ............................................................................................77
Table 14. Testing for HIV by Needle Sharing among Respondents of Modal
Age 40 in 2010–2012 Combined ...........................................................................78
Table 15a. Trends in Injection Drug Use and Needle Sharing Total and by Gender
among Respondents of Modal Ages 21–30 ...........................................................81
Table 15b. Trends in Injection Drug Use and Needle Sharing Total and by Gender
among Respondents of Modal Age 35 ...................................................................82
Table 16a. Trends in Number of Sex Partners and Gender of Sex Partners
Total and by Gender among Respondents of Modal Ages 21–30 .........................83
Table 16b. Trends in Number of Sex Partners and Gender of Sex Partners
Total and by Gender among Respondents of Modal Age 35 .................................84
Table 17a. Trends in Frequency of Condom Use and Testing for HIV: Total and by
Gender among Respondents of Modal Ages 21–30 ..............................................91
Table 17b. Trends in Frequency of Condom Use and Testing for HIV: Total and by
Gender among Respondents of Modal Age 35 ......................................................92
Table 17c. Use of Condoms in Past Year by 2-Year Age Groups among Young
Adults .....................................................................................................................93
Table 18a. Blood Donation, Lifetime and Last 12 Months Total and by Gender
among Respondents of Modal Ages 21–30 in 2004–2012 Combined ...............100
Table 18b. Blood Donation, Lifetime and Last 12 Months Total and by Gender
among Respondents of Modal Age 35 in 2008–2012 Combined .......................101
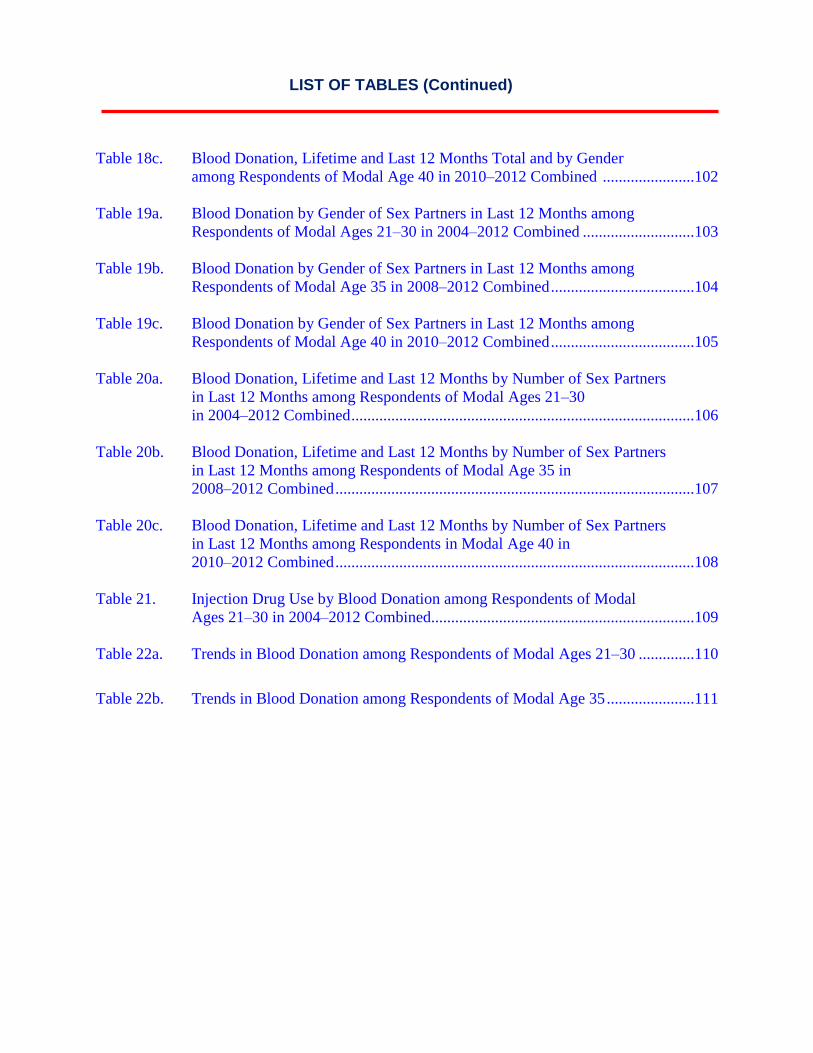
LIST OF TABLES (Continued)
Table 18c. Blood Donation, Lifetime and Last 12 Months Total and by Gender
among Respondents of Modal Age 40 in 2010–2012 Combined .......................102
Table 19a. Blood Donation by Gender of Sex Partners in Last 12 Months among
Respondents of Modal Ages 21–30 in 2004–2012 Combined ............................103
Table 19b. Blood Donation by Gender of Sex Partners in Last 12 Months among
Respondents of Modal Age 35 in 2008–2012 Combined ....................................104
Table 19c. Blood Donation by Gender of Sex Partners in Last 12 Months among
Respondents of Modal Age 40 in 2010–2012 Combined ....................................105
Table 20a. Blood Donation, Lifetime and Last 12 Months by Number of Sex Partners
in Last 12 Months among Respondents of Modal Ages 21–30
in 2004–2012 Combined ......................................................................................106
Table 20b. Blood Donation, Lifetime and Last 12 Months by Number of Sex Partners
in Last 12 Months among Respondents of Modal Age 35 in
2008–2012 Combined ..........................................................................................107
Table 20c. Blood Donation, Lifetime and Last 12 Months by Number of Sex Partners
in Last 12 Months among Respondents in Modal Age 40 in
2010–2012 Combined ..........................................................................................108
Table 21. Injection Drug Use by Blood Donation among Respondents of Modal
Ages 21–30 in 2004–2012 Combined..................................................................109
Table 22a. Trends in Blood Donation among Respondents of Modal Ages 21–30 ..............110
Table 22b. Trends in Blood Donation among Respondents of Modal Age 35 ......................111

LIST OF FIGURES
Click on any item below (in blue) to go directly to that page.
Figure 1. Trends (2-year average) in Lifetime Injection Drug Use by Gender
among Respondents of Modal Ages 21–30 and Modal Age 35 .........................85
Figure 2. Trends (2-year average) in Annual Injection Drug Use by Gender
among Respondents of Modal Ages 21–30 and Modal Age 35 .........................86
Figure 3. Trends (2-year average) in Lifetime Needle Sharing by Gender
among Respondents of Modal Ages 21–30 and Modal Age 35 .........................87
Figure 4. Trends (2-year average) in Having More than One Sex Partner in the Last
Year by Gender among Respondents of Modal Ages 21–30 and Modal
Age 35 .................................................................................................................88
Figure 5. Trends (2-year average) in Having a Sex Partner of the Same/Both
Genders by Gender among Respondents of Modal Ages 21–30 and
Modal Age 35 .....................................................................................................89
Figure 6. Trends (2-year average) in Annual Condom Use by Gender among
Respondents of Modal Ages 21–30 and Modal Age 35 .....................................94
Figure 7. Trends (2-year average) in Having an HIV/AIDS Test in the Past Year
by Gender among Respondents of Modal Ages 21–30 and Modal Age 35........95
Figure 8. Trends (2-year average) in Receiving HIV/AIDS Test Results by
Gender among Respondents of Modal Ages 21–30 and Modal Age 35.............96
Figure 9. Trends (2-year average) in Annual Blood Donation by Gender
Among Respondents of Modal Ages 21–30 and Modal Age 35 ......................112

Chapter 1: Introduction
Chapter 1
INTRODUCTION
Monitoring the Future (MTF) is a long-term study of American adolescents, college students, and adults through age 50. The study is supported under a series of investigator-initiated, competing research grants from the National Institute on Drug Abuse and has been conducted annually by the University of Michigan’s Institute for Social Research since 1975. The present monograph focuses on a broad range of behaviors, including certain forms of substance abuse, related to the spread of the human immunodeficiency virus (HIV) responsible for the acquired immunodeficiency syndrome (AIDS). The population under study includes high school graduates ages 21–30 in the general population, surveyed since 2004; 35-year-olds surveyed since 2008;,and 40-year-olds surveyed since 2010. HIV infection is a serious public health concern. Worldwide, more people live with HIV than ever before (Steinbrook, 2012). In the United States, about 1.2 million people are living with HIV, with 1 in 5 unaware of the infection (CDC, 2011). The 1990s saw decreases in HIV infection but from 2002 to 2009 the trend in number of new HIV/AIDS cases and deaths has remained largely unchanged (CDC, 2011). Each year, about 50,000 individuals become newly infected in the United States (Hall et al., 2008; CDC, 2011). MTF surveys assess both sexual risk behaviors and injection drug use, which are two main sources of HIV infection. In addition to the particular risk of HIV, young adults are also at high risk of contracting other sexually transmitted diseases and infections (STDs/STIs). About half of the 19 million STDs occurring annually in the United States affect individuals aged 15 to 24 (Weinstock et al., 2004). In this monograph we track some of the key behaviors related to the spread of HIV/AIDS in the United States. The present volume is the fourth monograph in the MTF series of annual reports, all available online from the MTF website. The first monograph, Overview of Key Findings, is published near the beginning of each year and provides early findings on the levels and trends in use of various substances by the nation’s 8th-, 10th-, and 12th-grade students surveyed in the previous year (Johnston et al., 2013a). Volume I, available at the beginning of June, provides more detailed and complete findings on the same population (Johnston et al., 2013b). Volume II, available at the beginning of August, provides similar prevalence and trend information on the substance-using behaviors of adult high school graduates through age 50, based on a series of follow-up mailed surveys of representative samples of students from each high school graduating class (Johnston et al., 2013c). One important subgroup of the adults surveyed annually in these follow-up surveys is college students, and Volume II has provided findings specific to that population since 1980. Prior to 2009, Volume II also contained findings based on measures of HIV/AIDS risk and protective behaviors that were introduced into the MTF follow-up surveys in 2004.
1

Monitoring the Future
References
Centers for Disease Control and Prevention. (November 2011). CDC Fact Sheet: HIV in the United States. Retrieved from http://www.cdc.gov/hiv/resources/factsheets/PDF/us.pdf. Hall, H.E., Song, R., Rhodes, P., Prejean, J., An, Q., Lee, L. M., & Janssen, R.S. (2008). Estimation of HIV incidence in the United States. JAMA, 300, 520-529. Johnston, L.D., O’Malley, P.M., Bachman, J.G., & Schulenberg, J.E. (2013a). Monitoring the Future national results on adolescent drug use: Overview of key findings, 2012. Ann Arbor, MI: Institute for Social Research, The University of Michigan, 83 pp. http://monitoringthefuture.org/pubs/monographs/mtf-overview2012.pdf Johnston, L.D., O’Malley, P.M., Bachman, J.G., & Schulenberg, J.E. (2013b). Monitoring the Future national survey results on drug use, 1975–2012. Volume I: Secondary school students. Ann Arbor, MI: Institute for Social Research, The University of Michigan, 604 pp. http://monitoringthefuture.org/pubs/monographs/mtf-vol1_2012.pdf Johnston, L.D., O’Malley, P.M., Bachman, J.G., & Schulenberg, J.E. (2013c). Monitoring the Future national survey results on drug use, 1975–2012. Volume II: College students and adults ages 19–50. Ann Arbor, MI: Institute for Social Research, The University of Michigan, 400 pp. http://monitoringthefuture.org/pubs/monographs/mtf-vol2_2012.pdf Steinbrook, R.S. (2012, online first). Controlling HIV/AIDS: The obstacles and opportunities ahead. Archives of Internal Medicine. Retrieved from http://archinte.jamanetwork.com/article.aspx?articleid=1355863 Weinstock, H., Berman, S., & Cates, W. (2004). Sexually transmitted diseases among American youth: Incidence and prevalence estimates, 2000. Perspectives on Sexual and Reproductive Health 36(1), 6-10.
2

Chapter 2: Background
Chapter 2
BACKGROUND Since the early 1980s, the spread of HIV/AIDS has been a serious public health concern. Some of the behaviors that put people at heightened risk of contracting and spreading HIV are connected to drug abuse—in particular, drug use by injection when it involves needle sharing. Other behaviors related to heightened risk involve sexual practices, in particular having multiple sex partners, which itself is a behavior correlated with drug use. Further, both drug use and having multiple sex partners tend to be more prevalent among young adults than other age groups (Lefkowitz & Gillen, 2006; Anderson & Dahlberg, 1992; Gavin et al., 2009). In addition, men having sex with men is a long-recognized major risk behavior, particularly in the absence of condom use.
Using MTF data, Patrick et al. (2012) documented that the number of sexual partners is positively correlated with binge drinking, marijuana use, and other illicit drug use, and that these relationships vary across age. In addition, more frequent use of marijuana and other illicit drugs was is associated with less frequent condom use. There was a moderation effect, indicating that the link between binge drinking and more sexual partners was stronger for younger individuals (i.e., aged 21–24) than older individuals (i.e., aged 25–30). An important protective behavior is getting tested for HIV/AIDS, particularly given the advent of effective retroviral treatments for the disease (Fauci & Folkers, 2012; Steinbrook, 2012). Early detection can alert the infected individual to the potential of infecting others, particularly others with whom he or she has sexual relations or shares needles. Early and sustained treatment can not only protect the treated individual but also reduce the odds of transmission to others. In order to stem the tide of HIV infections, infected individuals need to be identified and then effective care must be initiated (Gardner et al., 2011). A second main protective behavior is condom use. According to the CDC, “latex condoms, when used consistently and correctly, are highly effective in preventing the sexual transmission of HIV” and other sexually transmitted diseases (CDC, 2011). However, consistent condom use is not widespread. According to the CDC (2010), only 23% of women aged 15–44 who have never been married (and are not cohabiting with a partner) choose condoms as their method of contraception. Rates of dual-method contraceptive use (i.e., using the male condom plus an oral or other contraceptive method) to prevent both STDs and unintended pregnancy is very low in the United States, about 7% for women who report using the pill and even lower for women who report using other female contraceptive methods (Eisenberg et al., 2012). Condom use is the only way to prevent HIV and other STDs among sexually active individuals, and is a clear focus of HIV prevention efforts.
3

Monitoring the Future
Blood donation is not a risk behavior for contracting HIV but carries a very small risk for transmission, estimated to be 1 in 2,000,000 (Stramer, 2007). This risk has been dramatically reduced in recent years by the routine screening of donated blood for HIV. According to the Red Cross, an HIV infection in donated blood may go undetected if the donor becomes infected during the "window period," four to seven days before donating blood (American Red Cross, n.d.). While our focus is on examining individual risk and protective factors associated with contracting HIV, we also examine blood donation prevalence, including among adults at risk for HIV transmission. Other Relevant Studies of the General Population
A considerable literature has evolved based on studies of particular high-risk populations, such as injection drug users and men who have sex with men, but there are fewer studies of these behaviors as they occur in the general population. To our knowledge, there are currently six data collection efforts in addition to the present one that provide some information on HIV/AIDS risk behaviors based on nationally representative surveys of the general population. These studies are described and compared to MTF in the Appendix to this volume. Each of these surveys provides some key HIV/AIDS risk behavior data; however, as discussed in the Appendix, none fully duplicates the type of HIV/AIDS-related information produced by the MTF study.
4

Chapter 2: Background
References
American Red Cross. (n.d.). Blood Testing. Retrieved from http://www.redcrossblood.org/learn-about-blood/what-happens-donated-blood/blood-testing. Anderson, J.E., & Dahlberg, L.L. (1992). High-risk sexual behavior in the general population: Results from a national survey, 1988–1990. Sexually Transmitted Diseases,19(6), 320–325. Centers for Disease Control and Prevention (CDC). (2010). Use of contraception in the United States: 1982–2008. Data from the National Survey of Family Growth. Vital and Health Statistics, Series 23, #29. Retrieved from http://www.cdc.gov/NCHS/data/series/sr_23/sr23_029.pdf Centers for Disease Control and Prevention (CDC). (2011). Male latex condoms and sexually transmitted diseases. Retrieved from http://www.cdc.gov/condomeffectiveness/latex.htm Eisenberg, D.L., Allsworth, J.E., Zhao, Q., & Peipert, J.F. (2012). Correlates of dual-method contraceptive use: An analysis of the National Survey of Family Growth (2006–2008). Infections Diseases in Obstetrics and Gynecology, Article ID 717163. doi:10.1155/2012/717163 Fauci, A.S., & Folkers, G.K. (2012). Toward an AIDS-free generation. JAMA, 308, 343–344. Gardner, E.M., McLees, M.P., Steiner, J.F., del Rio, C., & Burman, W.J. (2011). The spectrum of engagement in HIV care and its relevance to test-and-treat strategies for prevention and HIV infection. Clinical Infectious Diseases, 52, 793–800. Gavin, L., MacKay, A.P., Brown, K., Harrier, S., Ventura, S.J., Kann, L., et al. (2009). Sexual and reproductive health of persons aged 10–24 years—United States, 2002–2007. Morbidity and Mortality Weekly Report, 58(SS-6), 1–60. Lefkowitz, E.S., & Gillen, M.M. (2006). Sex is just a normal part of life: Sexuality in emerging adulthood. In J. J. Arnett & J. L. Tanner (Eds.), Emerging adults in America: Coming of age in the 21st century (pp. 235–255). Washington, DC: American Psychological Association. National Opinion Research Center. (2008). Notes on the 2008 GSS cross-section and panel combined. Retrieved from http://www.norc.org/NR/rdonlyres/ 21C53AAC-1267-43B6-A915-A38857DC9D63/1220/Notesonthe2008GSS.pdf Patrick, M.E., O’Malley, P.M., Johnston, L.D., Terry-McElrath, Y.T., & Schulenberg, J.E. (2012). HIV/AIDS Risk Behaviors and Substance Use by Young Adults in the United States. Prevention Science, 13, 532 –538. Steinbrook, R.S. (2012, online first). Controlling HIV/AIDS: The obstacles and opportunities ahead. Archives of Internal Medicine. Retrieved from http://archinte.jamanetwork.com/article.aspx?articleid=1355863 Stramer, S. (2007). Current risks of transfusion-transmitted agents–A Review. Archives of Pathology & Laboratory Medicine, 131, 702–707.
5

Chapter 3: Research Design
Chapter 3
RESEARCH DESIGN
MTF is uniquely suited to address key gaps in the literature concerning HIV/AIDS-related risk and protective behaviors. Most of the features that make MTF an important epidemiologic and etiologic study of drug use also apply to tracking and studying HIV/AIDS-related behaviors. MTF is population-based, prospective, cohort-sequential, and has especially rich measures of drug use with which to study how drug use relates directly (through injection drug use) and indirectly (through engaging in risky sexual and other behaviors) to HIV transmission. The MTF research design is described in detail in both Volume I and Volume II (Johnston et al., 2013a, 2013b), so we limit the description here to a brief overview. Samples
The MTF design has included a representative subsample of each 12th-grade class sample since 1976, with 2,400 participants from each class selected in a stratified random procedure for follow-up. The 2,400 are randomly split into two half samples of 1,200, one surveyed on even numbered years and the other surveyed on odd numbered years up to six times, through modal age 29 or 30. After that, they are followed at five-year intervals, starting at age 35, currently up to age 50. With this design, it is possible to present data for each class every year while surveying each respondent only every other year through age 30; this schedule was judged to be less demanding and, therefore, more conducive to retention in the panels than an annual administration. In order to increase the numbers of drug users in these panels, certain groups are selected for follow-up with a higher probability (by a factor of 3.0) than the remaining 12th graders. This includes those who report 20 or more occasions of marijuana use in the prior 30 days (i.e., “daily or near-daily users”) in 12th grade or any use of other illicit drugs in the prior 30 days. Differential weighting is then used in all subsequent analyses to adjust for these differential sampling probabilities. Because those in the drug-using stratum receive a weight of 0.33 in the calculation of all statistics to correct for their overrepresentation in the selection stage, the actual numbers of follow-up respondents are larger than the weighted Ns given in the tables. The respondents included in these analyses were drawn from participants in the MTF follow-up surveys of 21- to 30-year-olds in 2004–2012 (representing graduates from the classes of 1992–2009); 35-year-olds in 2008–2012 (representing graduates from the classes of 1991–1995); and 40-year-olds in 2010–2012 (representing graduates from the classes of 1988–1990). The present monograph reports findings from respondents of modal ages 21 to 30, 35, and 40. For those ages 21 to 30, there are nine years of data (collected in 2004 through 2012; weighted N = 19,462 observations), but fewer individuals, most of whom provided two or more observations (N=8,429 individuals, as is discussed below). For those age 35 there are five years of data (collected in 2008 through 2012; weighted N = 4,629 observations and individuals). For those
6
Monitoring the Future
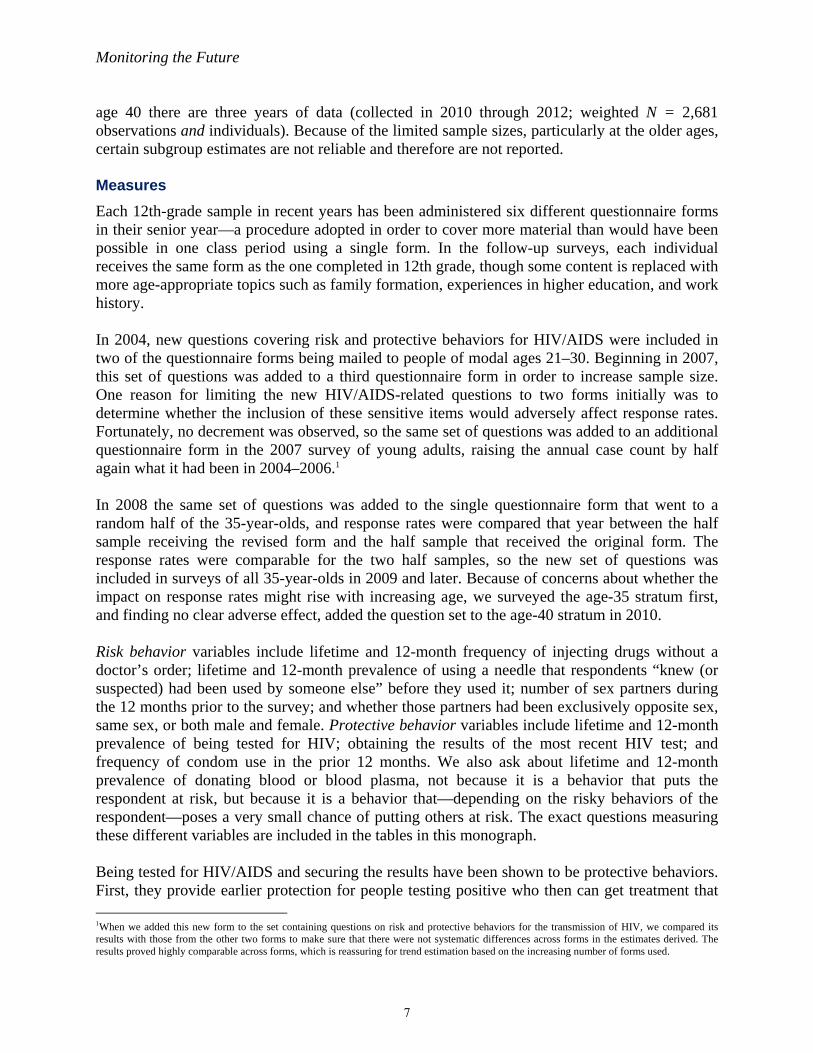
age 40 there are three years of data (collected in 2010 through 2012; weighted N = 2,681 observations and individuals). Because of the limited sample sizes, particularly at the older ages, certain subgroup estimates are not reliable and therefore are not reported. Measures
Each 12th-grade sample in recent years has been administered six different questionnaire forms in their senior year—a procedure adopted in order to cover more material than would have been possible in one class period using a single form. In the follow-up surveys, each individual receives the same form as the one completed in 12th grade, though some content is replaced with more age-appropriate topics such as family formation, experiences in higher education, and work history. In 2004, new questions covering risk and protective behaviors for HIV/AIDS were included in two of the questionnaire forms being mailed to people of modal ages 21–30. Beginning in 2007, this set of questions was added to a third questionnaire form in order to increase sample size. One reason for limiting the new HIV/AIDS-related questions to two forms initially was to determine whether the inclusion of these sensitive items would adversely affect response rates. Fortunately, no decrement was observed, so the same set of questions was added to an additional questionnaire form in the 2007 survey of young adults, raising the annual case count by half again what it had been in 2004–2006.1 In 2008 the same set of questions was added to the single questionnaire form that went to a random half of the 35-year-olds, and response rates were compared that year between the half sample receiving the revised form and the half sample that received the original form. The response rates were comparable for the two half samples, so the new set of questions was included in surveys of all 35-year-olds in 2009 and later. Because of concerns about whether the impact on response rates might rise with increasing age, we surveyed the age-35 stratum first, and finding no clear adverse effect, added the question set to the age-40 stratum in 2010. Risk behavior variables include lifetime and 12-month frequency of injecting drugs without a doctor’s order; lifetime and 12-month prevalence of using a needle that respondents “knew (or suspected) had been used by someone else” before they used it; number of sex partners during the 12 months prior to the survey; and whether those partners had been exclusively opposite sex, same sex, or both male and female. Protective behavior variables include lifetime and 12-month prevalence of being tested for HIV; obtaining the results of the most recent HIV test; and frequency of condom use in the prior 12 months. We also ask about lifetime and 12-month prevalence of donating blood or blood plasma, not because it is a behavior that puts the respondent at risk, but because it is a behavior that—depending on the risky behaviors of the respondent—poses a very small chance of putting others at risk. The exact questions measuring these different variables are included in the tables in this monograph. Being tested for HIV/AIDS and securing the results have been shown to be protective behaviors. First, they provide earlier protection for people testing positive who then can get treatment that 1When we added this new form to the set containing questions on risk and protective behaviors for the transmission of HIV, we compared its results with those from the other two forms to make sure that there were not systematic differences across forms in the estimates derived. The results proved highly comparable across forms, which is reassuring for trend estimation based on the increasing number of forms used.
7

Chapter 3: Research Design
should reduce the progression of the disease and the likelihood of dying from it (Cohen et al., 2011). Second, on average people who have tested positive can expose fewer partners to the disease by abstaining from sexual contact and/or by using condoms. Field Procedures
The initial data collection from panel members occurs at 12th grade; they complete a self-administered questionnaire in a group setting, usually their normal classroom but sometimes in larger groups. They are asked to complete the questionnaires during a usual class period (about 45 minutes) and to complete a tear-off card providing contact information, which permits subsequent communication with the subsample selected for panel study follow-up. After the card is separated from the questionnaire, the identifying information on it can only be matched to the questionnaire using a computer file at the University of Michigan, because the numbers printed on the back of the questionnaire and the card are randomly matched numbers. This, plus the facts that the questionnaires are machine-readable and that they are administered (and the cards are collected) separately by a field representative from the University of Michigan, helps to assure respondents that their confidentiality has been protected. The respondents subsequently selected into the panels are followed by mail—a highly cost-effective method of data collection that helps make large sample sizes possible. Annually, each respondent receives an MTF newsletter with an address correction card enclosed; each respondent up to age 29/30 also receives an invitation letter sent prior to the questionnaire. A subsequent letter is printed on the front of the questionnaire. The questionnaire is sent with a check made out to the subject, currently in the amount of $20 in the case of the older panels (age 35 or over); the payment was raised to $25 per occasion for half of the class of 2006 and for all high school graduating classes thereafter to help offset the effects of inflation. Extensive efforts are made to secure location information on previous participants whom we are unable to locate by mail. Reminder postcards are sent about two weeks after the questionnaires, and telephone calls are made to attempt to contact those who have not responded after a reasonable interval and to request their participation. No answers to the questionnaire are obtained by telephone; responses are obtained only by mail. Panel Retention
We discuss next the nature of the panel attrition problem generally, the response rates for MTF panel surveys in recent years, and evidence relevant to assessing the impact of attrition on the study’s research results. Response Rates. Virtually all longitudinal studies—including MTF—experience attrition, which is often differential with respect to health risks including substance use (McGuigan et al., 1997). In addition, survey response rates in general have been declining over the past few decades (Dillman et al., 2009; Groves, 2006; Groves et al., 2002; Wechsler et al., 2002), highlighting an important challenge in the conduct of all population-based research. A vital feature of the MTF panel studies is the very low cost per respondent. There are many advantages to collecting panel data through low-cost mail surveys. Indeed, given the number of MTF questionnaires sent each year (roughly 18,000) across the entire coterminous U.S., we have viewed low-cost mail surveys as our best (and really only) cost-effective option, although we are
8
Monitoring the Future
now evaluating the use of web-based data collection as an alternative, using an experimental design. One disadvantage of data collection by mail is that attrition rates tend to be higher than those that might be obtained with much more expensive methods, such as intensive personal tracking and interviewing. There exist a few large epidemiological/etiological surveys that have better retention rates, but their procedures are extremely expensive and not realistic for an ongoing effort like MTF. Our retention rates compare favorably with those of most longitudinal studies reported in the field, including interview studies. In the coming years, in an effort to increase response rates (or at least stem the general response rate erosion mentioned below) we plan to experiment with offering respondents the option of responding online to determine the extent to which web-based data collection affects response rates, data quality, and cost per respondent. Retention rates in the biennial follow-ups of respondents modal ages 19–30 (corresponding to the first six follow-ups) decline with the length of the follow-up interval. For the five surveys from 2008 to 2012, the response rate in the first follow-up (corresponding to one to two years past high school) averaged 52%, and for the second through sixth follow-ups (corresponding to 3–12 years past high school) response rates averaged 47% of the originally selected panel. (Among long-term respondents—the 35-, 40-, 45-, and 50-year-olds—retention rates are quite good, apparently because some of the decline over time in retention rates reflects cohort differences.) In sum, the response rates attained under the current design range from respectable to quite good, especially when the low-cost nature of the procedure, the long time intervals, the modest payment, and the substantial length of the questionnaires are taken into account. More importantly, the evidence discussed next leaves us confident that the data resulting from these follow-up panels are reasonably accurate, which brings us to our adjustments for panel attrition and the comparison of our results with those from other sources. The Impact of Panel Attrition on Research Results. An important purpose of the MTF panel study is to allow estimation of drug prevalence rates among American high school graduates at various age levels. Thus, we have always been concerned about making the appropriate adjustments to account for panel attrition. In essence, our standard adjustment process is a poststratification procedure in which we reweight the data obtained from the follow-up samples in such a way that, when reweighted, the distribution of their 12th-grade answers on a given drug matches the original distribution of use observed for that drug based on all participating high school seniors in their graduating class. This procedure is carried out separately for cigarettes, alcohol, and marijuana, as well as other illicit drugs (combined). As expected, it produces prevalence estimates in the follow-up data that are somewhat higher than those uncorrected for attrition, indicating a positive association between drug use and panel attrition. However, the adjustments are relatively modest. Attrition rates by levels of 12th grade substance use differ some, but less than one might expect. For example, among all respondents who had never used marijuana by 12th grade, an average of 79% of the classes of 1976–1998 participated in the first follow-up. The proportion responding was somewhat lower among those who had used marijuana once or twice in the last 12 months (75%). This proportion decreased gradually with increasing levels of marijuana use; but even among those who used marijuana on 20 or more occasions in the last 30 days in 12th grade, 67% participated in the first follow-up. The corresponding participation rates for the same drug use
9

Chapter 3: Research Design
strata at the fourth follow-up (i.e., at modal ages 25/26) were 66%, 63%, and 56%, respectively. Thus, even among those who were active heavy users of marijuana in high school, response rates at the fourth follow-up were only 10 percentage points lower than among those who had never used marijuana by 12th grade. That is not to say that we assume all types of drug users remain in the panels at comparably high rates. We believe that people who become dependent on or addicted to illicit drugs such as heroin, cocaine, or methamphetamine are less likely to be retained in reasonable proportions. That is why we are careful not to quantify or characterize these special segments of the population; but we note that they constitute very low proportions of the adult population. As a validation of our panel data on drug use, we compared MTF prevalence rates with those from the National Survey on Drug Use and Health (NSDUH) which provides the best available comparison data because it is also based on national samples and uses cross-sectional surveys that do not have panel attrition. Using the 2009 NSDUH data, we compared the prevalence rates on a set of drugs—cigarettes, alcohol, marijuana, and cocaine—for which there was reasonable similarity in question wording across the two studies. These comparisons showed a high degree of comparability in the prevalence estimates of the two studies, particularly with the post-stratification procedure applied to the MTF data (Johnston et al., 2013b). In addition, attrition in the MTF panel is not necessarily as great a problem as nonresponse is in a cross-sectional study. In the MTF panel we know a great deal about each of the follow-up nonrespondents, including their prior substance use, based on a lengthy questionnaire administered in 12th grade (and, for many, in subsequent years as well). Thus, adjustments can be made utilizing data that are highly informative about the missing individuals. Effects on Relational Analyses. While differential attrition (uncorrected) may contribute to some bias in point estimates and other univariate statistics, a considerable amount of empirical research has shown that such attrition tends to have less influence on associations among variables (Cordray & Polk, 1983; Goudy, 1976; Groves, 2006; Groves & Peytcheva, 2008; Martikainen et al., 2007; Nohr & Olsen, 2013; Peytchev, 2013; Van Loon et al., 2003) ; and we also have found this to be true in our MTF panel analyses (Jager et al., in press; Schulenberg et al., 1994; Schulenberg et al., 2005; Staff et al., 2010).
Limitations
Sample Coverage. There are certain limitations to the present study for attempting to quantify HIV/AIDS-related risk and protective behaviors in the general population. Perhaps the major limitation derives from the sample under study, because MTF does not include the 11% to 15% or so of each high school class cohort that leave high school without graduating (i.e., drop out). Although our coverage includes the great majority of the population of interest (young adults who recently entered their 20s), an important and on average somewhat more deviant segment of the population—high school dropouts—is not covered. In addition, panel attrition is a limitation, but techniques have been used here to help compensate for the effects; they are described below. These limitations likely lower the estimates of risk behaviors from what their values would be if the entire population of 21- through 30-year-olds in the United States could be surveyed, but it is difficult to quantify by how much. (We believe that we do a better job of characterizing the original target population, which is high school graduates.) However, because the school dropout
10
Monitoring the Future
rates have changed rather little since MTF began, and panel retention rates tend to change very slowly, we believe that the trend estimates—which ultimately will be among the most important results for policy purposes—will be little affected by these omissions from the sample. This is particularly true given our procedures for compensating for panel loss.2 Validity. The sensitive nature of questions about certain risk behaviors may affect the validity of the data reported. Recognizing this, we provide an introduction to the section of the questionnaire dealing with HIV/AIDS risk and protective factors explaining why these questions are important in helping us to increase our understanding of the HIV/AIDS epidemic. The protections of confidentiality are re-emphasized by reminding respondents that their answers are never connected with their names and inviting respondents to leave blank any questions that they “do not wish to answer.” The decrement in response rates between the preceding nonsensitive questions and those in this section is very small—on the order of about one percentage point for five questions, and about 2 percentage points for two other questions—suggesting that the great majority of respondents feel willing and able to answer the potentially sensitive questions. The question with the highest decrement (3.4 percentage points) concerns the use of condoms. We believe that the slightly higher nonresponse rate may be due to high variability in use of condoms, making the question difficult to answer. In addition, the missing data rate regarding condom use is particularly high for females having only female sex partners, for whom this question may not be applicable. The question on needle sharing shows the second highest increment in nonresponse (2.6 percentage points); however, a portion of the increment (1.0 percentage points) is attributable to respondents who indicate no history of drug injection in the previous question and likely thus skip the question on needle sharing. The corrected increment in nonresponse for this question is also around 1.6 percentage points. Sample Sizes and Trend Estimation for Young Adults (Ages 21–30)
The prevalence and, when available, the frequency of HIV/AIDS-related behaviors in the general population can now be established for the years of 2004 through 2012 combined. Having multiple years of data is valuable because of the low prevalence rate for some of the behaviors (in particular, for the intersection of some behaviors); the use of multiple years of data increases estimate precision. Because the intersection of some of the behaviors is of particular importance, we report the bivariate associations among them, though the low numbers of cases still limit to some degree the conclusions that can be reached. Over time the case counts will continue to grow and allow more detailed analyses. For estimates based on one or two years of data, the number of cases or observations is equivalent to the number of different or distinct individuals surveyed. However, for estimates based on all years combined, the number of different individuals is lower than the number of cases or observations. Since individuals are surveyed every two years, some individuals contribute more than one questionnaire over time. Thus, for estimates using data from 2004 through 2012, a single individual can contribute to up to five waves of data. The total number of weighted observations of young adults for 2004 through 2012 is 19,462, but the total number of
2According to U.S. Census data, high school completion rates had been quite constant at 85% between 1972 and 2002 for persons 20–-24 years old. (Younger age brackets are less appropriate to use because they include some young people who are still enrolled in high school.) However, since 2002 there has been a very gradual increase in completion rates, reaching 89.0% by 2010. U.S. Census (various years). Current population reports, Series P-20, various numbers. Washington, DC: U.S. Government Printing Office.
11

Chapter 3: Research Design
unique individuals is 8,429. The weighted Ns reported in each table refer to observations and, in the case of the young adults, that is not the same as individuals. It should be noted that we also examine the data for each of the nine years (2004–2012) separately to look for signs of change in prevalence levels, and do not find much evidence of systematic trending in any of the risk or protective behaviors under study during this interval. It is encouraging, though, that the univariate distributions replicate quite well across years, which provides powerful evidence of estimate reliability. Sample Sizes for Respondents Ages 35 and 40
For those of modal age 35, five years of data have been collected—2008 through 2012 (weighted N = 4,629), and for those of modal age 40 there are three years of data (2010–2012; weighted N = 2,681). Because an individual respondent can only contribute one observation at each of these ages, the number of weighted observations and the number of cases are the same. The shorter intervals and lower case counts at these ages make some prevalence estimation, and particularly trend estimation, difficult. Adjusting for the Effects of Panel Attrition
In chapter 3 of Volume II (Johnston et al., 2013b) we described the procedures used to adjust the substance use estimates to eliminate (insofar as possible) the effects of panel attrition. In the case of substance use estimates, we have data on the prevalence and frequency of the same behaviors among all respondents at 12th grade. This permits a poststratification procedure in which we reweight the obtained follow-up samples such that the reweighted distribution of their senior-year responses reproduces the original distribution obtained from the entire 12th-grade sample for the behavior under consideration. However, measures of non-drug-using variables under consideration in this monograph were not included in the 12th-grade surveys, so this form of poststratification is unworkable. Instead, we have implemented a different poststratification reweighting procedure for the follow-up respondents, one in which we attempt to correct for their differential retention in the panels as a function of demographic and other characteristics that were measured in 12th grade. For example, males have a somewhat lower retention rate than females, which means that their proportion in the attained follow-up sample is lower than it was in the original 12th-grade in-school survey. We are able to correct for that difference by up-weighting the data from all males who did continue in the panel study, so that males will remain in the same proportion in the reweighted panel as they were when the panel was first selected. Using this strategy, we simultaneously correct for differential attrition using multiple variables identified as being related to attrition. To do so, we calculate the retention rate for the various cells defined by the intersection of these variables and then weight the respondents in each cell by the reciprocal of the retention rate found for the people who belong in that cell. These adjustments generate a newly weighted panel with frequency distributions on the variables used in this reweighting procedure (e.g., gender or grade point average in high school) that reproduce those of the original 12th-grade sample. As a practical matter, the number of variables used in this procedure must be limited to some extent by the total sample size, lest certain cells become too small to be reliably reweighted.
12

Monitoring the Future
The variables that we use for defining the cells are as follows: gender (male/female), ethnicity (White/non-White), grade point average in 12th grade (low/medium/high), and illicit drug use in 12th grade (none/marijuana only/any other illicit drug). The first two variables were prespecified, while the latter two were chosen from a larger set entered into a regression analysis in which they emerged as the strongest predictors of retention rate. These four variables generate 36 nonoverlapping categories (or cells) of individuals that can be reweighted to correct for differential rates of attrition. Retention rates in each of the 36 cells are then calculated based on the number of people in each cell in the original panel and the number who subsequently provided data at the follow-up; the participating members of each cell are assigned a new weight that is the reciprocal of the retention rate—that is, one divided by the retention rate. (For example, if White males with low grades and illegal drug use other than marijuana are represented in the retained panel at a 50% retention rate, each of the respondents in that cell would be given a weight of two.) This new weight is then multiplied by a separate individual weight that corrects for any differential probability in being selected into the panel originally. A particular advantage to using this procedure is that it takes into account any interactions among the predictor variables, such as an interaction between gender and race/ethnicity. With the resulting weight, we have a total weighted N (sample size) equal to the original panel size, not the actual retained panel, which means that we would be overstating the accuracy with which we are making prevalence estimates. Thus, in a final step, all individual weights are then multiplied by the overall sample retention rate to bring the weighted sum of cases down to the actual number of individually weighted cases still in the panel. This entire correction procedure is carried out separately for each year. We consider this correction procedure to be appropriate in this circumstance, but we caution the reader that it is not possible to correct entirely for the effects of panel attrition for two reasons. First, specific to our relatively small sample for these measures, we cannot adjust for all measured variables that might predict retention, because we are limited as to the number of cells that can reasonably be generated to which to assign weights. Second, and more generally, even with a prediction model that accounts for nearly all of the variance in retention, there still could be some unmeasured characteristics that differentiate the people in each cell who do and do not remain in the study. As we stated earlier, one of the most important uses of these data will be to track historical changes in the major HIV/AIDS risk and protective behaviors in the general population, a purpose for which these data are well suited, because these uncorrected factors are likely to be fairly constant across time. Significance Testing Protocol
All significance tests referred to in this monograph are based on standard testing procedures that do not take account of the complex sampling design used in the initial sampling of 12th-grade students. Because the follow-up samples represent only a small sub-sample of the original clustered samples, design effects are quite small and generally ignorable. Significance tests on trends do take account of multiple responses from individuals. Also, nominal significance levels are used with no correction for multiple tests. Thus, nominal levels may be somewhat overstated;
13

Chapter 3: Research Design
however, we take care to ascertain that any findings cited as statistically significant appear valid by examining multiple years, multiple cohorts, and general internal consistency.
14

Monitoring the Future
References
Cohen, M.S., Chen, Y.Q., McCauley, M., Gamble, T., Hosseinipour, M.C., Kumarasamy, N., et al.; HPTN 052 Study Team. (2011). Prevention of HIV-1 infection with early antiretroviral therapy. New England Journal of Medicine, 365(6), 493–505. Cordray, S., & Polk, K. (1983). The implications of respondent loss in panel studies of deviant behavior. Journal of Research in Crime and Delinquency, 20(2), 214–242. Dillman, D.A., Smyth, J.D., & Christian, L.M. (2009). Internet, mail, and mixed mode surveys: The tailored design method (3rd ed). Hoboken, NJ: John Wiley & Sons. Goudy, W.J. (1976). Nonresponse effects on relationships between variables. Public Opinion Quarterly, 40, 360–369. Groves, R. (2006). Nonresponse rates and nonresponse bias in household surveys. Public Opinion Quarterly, 70, 646–75. Groves, R. M., Dillman, D. A., Eltinge, J. L., & Little, R. J. A. (Eds.) (2002). Survey nonresponse. New York: Wiley. Groves, R., & Peytcheva, E. (2008). The impact of nonresponse rates on nonresponse bias: A meta-analysis. Public Opinion Quarterly, 72, 167–89. Jager, J., Schulenberg, J.E., O'Malley, P.M., & Bachman, J.G. (2013). Historical variation in drug use trajectories across the transition to adulthood: The trend towards lower intercepts and steeper, ascending slopes. Development and Psychopathology, 25(2), 527–543. Johnston, L.D., O’Malley, P.M., Bachman, J.G., & Schulenberg, J.E. (2013a). Monitoring the Future national survey results on drug use, 1975–2012. Volume I: Secondary school students. Ann Arbor, MI: Institute for Social Research, The University of Michigan, 604 pp. http://monitoringthefuture.org/pubs/monographs/mtf-vol1_2012.pdf Johnston, L.D., O'Malley, P.M., Bachman, J.G., & Schulenberg, J.E. (2013b). Monitoring the Future national survey results on drug use, 1975–2012. Volume II: College students and adults ages 19-50. Ann Arbor: Institute for Social Research, The University of Michigan, 400 pp. http://monitoringthefuture.org/pubs/monographs/mtf-vol2_2012.pdf Martikainen, P., Laaksonen, M., Piha, K., & Lallukka, T. (2007). Does survey non-response bias the association between occupational social class and health? Scandinavian Journal of Public Health, 35(2), 212–215. McGuigan, K.A., Ellickson, P.L., Hays, R.D., & Bell, R.M. (1997) Adjusting for attrition in school-based samples: Bias, precision, and cost trade-off of three methods. Evaluation Review, 21, 554–567.
15

Chapter 3: Research Design
Nohr, E.A., & Olsen, J. (2013). Commentary: Epidemiologists have debated representativeness for more than 40 years — Has the time come to move on? International Journal of Epidemiology, 42, 1016–1017. Peytchev, A. (2013). Consequences of survey nonresponse. Annals of the American Academy of Political and Social Science, 645(1), 88–111. Schulenberg, J.E., Bachman, J.G., O’Malley, P.M., & Johnston, L.D. (1994). High school educational success and subsequent substance use: A panel analysis following adolescents into young adulthood. Journal of Health and Social Behavior, 35, 45–62. Schulenberg, J.E., Merline, A.C., Johnston, L.D., O’Malley, P.M., Bachman, J.G., & Laetz, V.B. (2005). Trajectories of marijuana use during the transition to adulthood: The big picture based on national panel data. Journal of Drug Issues, 35, 255–279. Staff, J., Osgood, D.W., Schulenberg, J.E., Bachman, J.G., O‘Malley, P.M., & Messersmith, E.E. (2010). Explaining the relationship between employment and juvenile delinquency. Criminology, 48, 1101-1131. Van Loon, A.J.M., Tijhuis, M., Picavet, H.S.J., Surtees, P.G., & Ormel, J. (2003). Survey non-response in the Netherlands: Effects on prevalence estimates and associations. Annals of Epidemiology, 13(2), 105–110 Wechsler, H., Lee, J.E., Kuo, M., Seibring, M., Nelson, T.F., & Lee, H. (2002). Trends in college binge drinking during a period of increased prevention efforts: Findings from 4 Harvard School of Public Health College Alcohol Study surveys: 1993–2001. Journal of American College Health, 50, 203–217.
16
Chapter 4: Prevalence/Frequency of Risk Behaviors
Chapter 4
PREVALENCE/FREQUENCY OF RISK BEHAVIORS In this section we present and discuss the prevalence and frequency of three HIV/AIDS-related risk behaviors among respondents aged 21 to 30 in the MTF follow-up surveys combined across survey years.3 Results are presented in Tables 1 and 2. The 'a' tables (i.e., 1a, 2a) provide the data for young adults aged 21 to 30 based on data from the 2004–2012 period. The 'b' tables provide the data for 35-year-olds based on data from 2008–2012. The 'c' tables provide the data for 40-year-olds based on data from 2010-2012. We present the 'a,' 'b,' and 'c' versions of each table together to facilitate comparisons across age groups. In those comparisons, it is important to recognize that the data for the three age groups come from different ranges of years, and also from different class cohorts. We present data on the combined samples for each age group and for males and females separately within each age group. The young adult sample from 2004 through 2012 has a total weighted N of 19,462 observations. The sample of 35-year-old respondents from 2008 through 2012 has a total weighted N of 4,146, and for those of modal age 40 from 2010-2012, the total weighted N is 2,662. (As noted earlier, the number of observations in the young adult sample is larger than the number of different individuals because some participants were surveyed more than once and thus account for more than one observation. Because the 35-year old and 40-year-old samples each are based on only one year of age, individuals there were surveyed only once. For them the number of individuals and number of observations are the same.) Results are included for four behaviors related to HIV-risk to the respondent (and potentially to others4): needle sharing, injection drug use, men having sex with men (MSM), and having sex with multiple partners. Sharing needles for injection drug use as reported by the MTF panel samples ages 21 through 40 is described below. Injection Drug Use
While not itself a vector of HIV transmission, the amount of illicit injection drug use determines the pool of eligible persons from which the high-risk behavior of needle sharing is drawn. The question to respondents reads, “On how many occasions (if any) have you taken any drugs by injection with a needle (like heroin, cocaine, amphetamines, or steroids) in your lifetime? Do not include anything you took under a doctor’s orders.” A sequel question asks about such behavior
3This combining of all available years of data provides a much needed increase in total numbers of cases, compared with reporting just the most recent year or two. As will be seen in the later section on trends, the results are sufficiently stable to warrant this combining across years. 4According to the CDC (http://www.cdc.gov/hiv/topics/surveillance/basic.htm#hivaidsexposure), the estimated number of cases of HIV infection in the U.S. in 2010 by transmission category was as follows: 28,782 for MSM, 12,875 for heterosexual contact, 3,766 for injection drug use, 1,443 for both MSM and injection drug use, and 47 for other transmission routes including blood transfusion, hemophilia, and perinatal exposure.
17

Monitoring the Future
in the prior 12-month interval. Trends in the prevalence of these behaviors would be indicative of changes in the pool of persons at risk for sharing of needles.
In the nine-year (2004–2012) combined sample of young adults aged 21–30, 1.6% report
having ever used any drug by injection without medical supervision (Table 1a). There is a fair-sized gender difference—2.4% of males and 0.9% of females indicate such behavior. The percentage saying they injected on 40 or more occasions is 0.5% overall—0.6% for males and 0.4% for females. Therefore, a relatively limited segment of respondents has ever used an illicit drug by injection—about 1 in every 60; a smaller proportion. About 1 in every 200 respondents reports an extended pattern of use as indicated by use on 40 or more occasions.
The proportions of young adults who have injected drugs during the past 12 months
without medical supervision is considerably smaller: 0.5% overall—1 in every 200 respondents—including 0.8% of males and 0.3% of females (a highly significant gender difference). The proportions using 40 or more times in the past 12 months are 0.2% overall—0.2% for males, and 0.1% for females. It is interesting to note that the proportional difference between the genders is larger for having injected drugs in their lifetime (2.4% of males versus 0.9% of females) than it is for having ever shared needles (0.5% of males versus 0.4% of females), suggesting that females injectors are more at risk of needle sharing.
In the two older age strata included in this report—35- and 40-year-olds (shown in Tables 1b and 1c, respectively)—the lifetime prevalence rates for having ever injected drugs is fairly similar to that for the young adults (1.6% and 1.4%, compared to 1.6% for the young adults). Also, females report considerably lower prevalence rates than males. Compared to the young adults, annual prevalence of injection drug use is lower among 35-year-olds and lower still among the 40-year-olds. (The difference between the three age groups is confounded by the years of measurement and the class cohorts involved, suggesting that these differences across the three age groups may be more than just cohort or age differences.)
Needle Sharing
The risk of catching or transmitting a number of blood-borne diseases, including HIV, emerges when injection drug use is combined with the sharing of needles. Immediately following the MTF survey questions about injecting illicit drugs, discussed in the next section, the question about needle sharing is asked: “Have you ever taken such drugs using a needle that you knew (or suspected) had been used by someone else before you used it?” Response alternatives are “Yes, in the last 12 months” and “Yes, but not in the last 12 months.” The former provides an estimate of annual prevalence, and the sum of the two provides an estimate of lifetime prevalence.
The proportion of 21- to 30-year-olds who say they have ever shared needles in this way during their lifetime is 0.5% overall—0.5% of males and 0.4% of females (Table 1a). As noted in the next section, 1.6% of the full samples say they have ever injected a drug, so this indicates that a minority—but still nearly a third—of the people injecting any of the
18
Chapter 4: Prevalence/Frequency of Risk Behaviors
several drug classes mentioned in the question (heroin, cocaine, amphetamines, or steroids) shared a needle at some time.
The proportion of 21- to 30-year-olds who say that they have shared needles in the prior
12 months is 0.1%, with 0.2% of males and 0.1% of females reporting such behavior (a non-significant gender difference). This compares to 0.5% who said that they have injected a drug in the prior 12 months, so about one fifth of past year injectors shared a needle during that interval.
Males are more likely than females to report having injected drugs in their lifetime (2.4% versus 0.9%). Males are also more likely to report having shared needles, but the gender differences in needle sharing are not large. Among males, about one fifth of those injecting drugs (2.4%) report sharing needles (0.5%).
The lifetime prevalence rates for needle sharing are lower among the 35- and 40-year-olds than among the young adults. Lifetime prevalence is estimated to be 0.3% for each of the two older groups, compared to 0.5% among young adults (Tables 1b and 1c). This could be due to cohort-effects—lasting differences between class cohorts—or to attrition.
In sum, needle-sharing behavior appears to have a very low prevalence among high
school graduates ages 21 to 30, and even lower among 35- and 40-year-olds. It seems likely that the rates are an underestimate for the entire population in these age ranges due to the omission of high school dropouts, the likelihood that drug-addicted users would be more likely than average to leave the study, and the possibility of some underreporting of this behavior. But while the prevalence of needle sharing is low, it can still translate to sizable numbers of people engaging in shared needle use. According to the 2012 Census, there are about 44 million Americans ages 21 to 30; just 0.5% of this group would constitute some 220,000 people.
Sex with Multiple Partners
Having sex with multiple partners is another behavior that increases the risk of HIV transmission and infection. The question to respondents is, “During the last 12 months, how many sex partners have you had? (This includes vaginal, oral, or anal sex.)” Three types of sexual activity are specifically mentioned in this question because all can involve the transmission of HIV, though they vary in the degree of risk involved. Results are provided in Tables 2a, 2b, and 2c.
Roughly one quarter (24%) of the sample of young adults aged 21 to 30 report that they have had multiple (two or more) sex partners in the prior 12 months—28% of males and 22% of females (Table 2a).
About one seventh (15%) of 21- to 30-year-old respondents reported having no sex partners during the prior 12 months (i.e., sexual abstention)—16% of males and 13% of females.
19

Monitoring the Future
The most common answer by far to this question was having one partner during the year (61% overall), with a lower proportion of males (56%) than females (65%) giving this answer.
While having even one sex partner is not without risk, the risk rises with an increased
number of partners. About 10% of young adults report that they had a total of two partners during the past 12 months (9.4% of males and 10.0% of females); 5.6% report three partners (6.2% of males and 5.2% of females); and about one in eleven (9.1%) report having four or more partners (12% of males and 6.6% of females). Very few report having more than 20 partners in the prior year (0.7% of males and 0.1% of females).
The reported numbers of sex partners among 35- and 40-year-olds (Tables 2b and 2c) is substantially lower than it is among young adults. The proportion reporting having had more than one partner during the past 12 months is 24.4% among young adults, 11.8% among 35-year-olds, and 10.5% among 40 year olds. The proportions reporting four or more sex partners during the year falls from 9.1% among young adults to 4.0% among 35-year-olds, to 3.5% among 40-year-olds. These numbers strongly suggest that potential exposure to HIV infection through multiple sexual contacts declines sharply between ages 21 and 40—a finding that replicates a similar one from the National Survey of Family Growth (Chandra, et al., 2012, p.15. See also http://www.census.gov/compendia/statab/2012/tables/12s0096.pdf)
In these older age strata, males continue to be more likely than females to report multiple sex partners (13.4% vs. 10.4%, respectively at age 35, and 12.7% vs. 8.3% at age 40). They also remain more likely to report four or more partners in the prior year (5.8% vs. 2.4% at age 35, and 5.2% vs. 1.8% at age 40).
Men Having Sex with Men and Other Sexual Behaviors
Because males who have sexual contact with other males have been at particular risk of contracting and transmitting HIV, we also looked at subgroups by the different gender combinations. We distinguished six configurations: males with females exclusively, males with males exclusively, males with partners of both genders, females with males exclusively, females with females exclusively, and females with partners of both genders. For both male and female respondents the case counts turn out to be quite small in the two categories that involve sexual contact with partners of the same gender, so the reader is cautioned to pay particular attention to the numbers of observations for these groups. Only people reporting that they have had sexual contact with one or more partners in the prior 12 months were asked the question: “During the last 12 months, have your sex partner or partners been . . . .” The answer alternatives are: “exclusively male,” “both male and female,” and “exclusively female.” See Tables 2a, 2b, and 2c for the results.
Of the young adult respondents reporting one or more sex partners in the prior 12 months
(85% of the total sample; 84% of males, 87% of females), 95% of males reported that their partners were exclusively female, and almost exactly the same proportion (96%) of females indicated that their partners were exclusively male.
20
Chapter 4: Prevalence/Frequency of Risk Behaviors
About 1 in 20 (5.3%) males indicated some sexual contact with other males during the
last 12 months—4.4% saying that their partners were males exclusively and 0.9% saying that they had both male and female partners. (Note that because of the low prevalence rates for these behaviors, the weighted number of cases is limited: a total of 405 observations from male respondents who reported having any sexual contact with other males—336 observations of men having sex exclusively with other males, and 69 observations of men having sex with both genders. The corresponding weighted numbers of different individuals are 168, 133, and 35. For data on the numbers of sex partners each of these groups reported, see Table 2a.)
Among females, 4.0% reported having any female sex partners—2.1% of all female observations indicated female partners exclusively and 1.9% indicated that their partners were of both genders—almost an even split, unlike the case for males.
(Again, note that the numbers of reports available for study are limited: 356 reports of having any sexual contact with other females, 186 reports of having sex with other females exclusively, and 169 reports of having sex with both female and male partners. The corresponding weighted numbers of different individuals are 165, 82, and 83.)
Once more, males are at greater risk of acquiring or transmitting HIV than females because male-to-male sex almost certainly carries a greater likelihood of HIV transmission than female-to-female or heterosexual sex.
Among the 35- and 40-year-olds who reported sex with one or more partners, the proportions of males reporting sex exclusively with males in the past 12 months are similar to those observed among 21- to 30-year-olds (3.5% and 4.6% respectively for 35- and 40-year-olds, compared to 4.4% among the young adults). The proportion of 35-year-old males reporting sex with partners of both genders (0.8%) is similar to the young adults (0.9%), but slightly lower among 40-year-olds at 0.6%. These estimates are based on relatively small sample sizes.
Among females, the proportion reporting sex in the prior year exclusively with female partners was 2.0% among 35-year-olds and 1.6% among 40-year-olds, compared with 2.1% among the young adults. The proportion of females reporting having sex with partners of both genders was 0.9% and 0.9% in these two older age groups, compared to 1.9% among young adults. There appears to be some decline in the reporting of female-to-female and bisexual sex in the older groups; please note that the samples are much smaller in these groups—though still between 1,000 to 2,000 observations in each case—and therefore the estimates have a higher level of sampling error.
21
Monitoring the Future
References
Chandra, A., Billioux, V.G., & Copen, C.E. (Jan. 19, 2012). HIV risk-related behaviors in the United States household population aged 15–44 years: Data from the National Survey of Family Growth, 2002 and 2006–2010 (National Health Statistics Reports No.46). CDC. Retrieved from http://www.cdc.gov/nchs/data/nhsr/nhsr046.pdf.
22

Total Male Female
Lifetime Frequency of Injecting Drugs
0 Occasions 98.4 97.6 99.1
1–2 0.5 0.6 0.4
3–5 0.2 0.4 0.1
6–9 0.1 0.3 *
10–19 0.2 0.3 0.1
20–39 0.1 0.3 *
40+ Occasions 0.5 0.6 0.4
Weighted N = 19,462 9,149 10,313
Annual Frequency of Injecting Drugs
0 Occasions 99.5 99.2 99.7
1–2 0.1 0.1 0.1
3–5 0.1 0.1 *
6–9 0.1 0.1 *
10–19 * 0.1 *
20–39 0.1 0.1 *
40+ Occasions 0.2 0.2 0.1
Weighted N = 19,472 9,153 10,318
Lifetime and Annual Needle Sharing
Yes, in the last 12 months 0.1 0.2 0.1
Yes, but not in the last 12 months 0.3 0.4 0.3
No, never 99.5 99.5 99.6
Weighted N = 19,295 9,067 10,228
Source. The Monitoring the Future study, the University of Michigan.
Notes. ' * ' indicates a prevalence rate of less than 0.05%.aIn 2004–2006, the HIV questions were included in two questionnaire forms. In 2007, these questions were
added to a third questionnaire form.
On how many occasions (if any) have you taken any drugs by injection with a needle (like heroin, cocaine, amphetamines, or steroids) in your lifetime? Do not include anything you took under a doctor’s orders.
On how many occasions (if any) have you taken any drugs by injection with a needle (like heroin, cocaine, amphetamines, or steroids) during the last 12 months? Do not include anything you took under a doctor’s orders.
Have you ever taken such drugs using a needle that you knew (or suspected) had been used by someone else before you used it?
(Entries are percentages.)
TABLE 1aInjection Drug Use and Needle Sharing
Total and by Genderamong Respondents of Modal Ages 21–30
in 2004–2012 a Combined
23

Lifetime Frequency of Injecting Drugs Total Male Female
0 Occasions 98.4 97.7 99.1
1–2 0.7 1.0 0.5
3–5 0.2 0.2 0.1
6–9 0.1 0.1 *
10–19 0.2 0.3 0.1
20–39 0.1 0.1 *
40+ Occasions 0.3 0.5 0.2
Weighted N = 4,146 1,969 2,177
Annual Frequency of Injecting Drugs
0 Occasions 99.7 99.5 99.9
1–2 * 0.1 *
3–5 * * *
6–9 0.1 0.2 *
10–19 * * *
20–39 0.1 0.1 0.1
40+ Occasions 0.1 0.1 *
Weighted N = 4,150 1,971 2,178
Lifetime and Annual Needle Sharing
Yes, in the last 12 months * * 0.1
Yes, but not in the last 12 months 0.3 0.4 0.1
No, never 99.7 99.6 99.8
Weighted N = 4,141 1,969 2,173
Source. The Monitoring the Future study, the University of Michigan.
Notes. ' * ' indicates a prevalence rate of less than 0.05%.aIn 2008, the HIV questions were added to one half of the questionnaires administered to the 35-year-old
respondents. In 2009 and after, these questions were included in all questionnaires for this group.
On how many occasions (if any) have you taken any drugs by injection with a needle (like heroin, cocaine, amphetamines, or steroids) in your lifetime? Do not include anything you took under a doctor’s orders.
On how many occasions (if any) have you taken any drugs by injection with a needle (like heroin, cocaine, amphetamines, or steroids) during the last 12 months? Do not include anything you took under a doctor’s orders.
Have you ever taken such drugs using a needle that you knew (or suspected) had been used by someone else before you used it?
(Entries are percentages.)
TABLE 1bInjection Drug Use and Needle Sharing
Total and by Genderamong Respondents of Modal Age 35
in 2008–2012 a Combined
24

Lifetime Frequency of Injecting Drugs Total Male Female
0 Occasions 98.6 97.9 99.3
1–2 0.5 0.7 0.3
3–5 0.2 0.3 0.1
6–9 0.1 0.2 *
10–19 0.1 0.2 *
20–39 0.1 0.1 *
40+ Occasions 0.4 0.5 0.2
Weighted N = 2,662 1,304 1,358
Annual Frequency of Injecting Drugs
0 Occasions 99.8 99.6 100.0
1–2 * 0.1 *
3–5 * 0.1 *
6–9 * * *
10–19 * * *
20–39 0.1 0.1 *
40+ Occasions 0.1 0.1 *
Weighted N = 2,663 1,305 1,358
Lifetime and Annual Needle Sharing
Yes, in the last 12 months * * *
Yes, but not in the last 12 months 0.3 0.3 0.2
No, never 99.7 99.7 99.8
Weighted N = 2,660 1,305 1,355
Source. The Monitoring the Future study, the University of Michigan.
Notes. ' * ' indicates a prevalence rate of less than 0.05%.aThe HIV questions were added to the questionnaires for 40-year-olds beginning in 2010.
On how many occasions (if any) have you taken any drugs by injection with a needle (like heroin, cocaine, amphetamines, or steroids) in your lifetime? Do not include anything you took under a doctor’s orders.
On how many occasions (if any) have you taken any drugs by injection with a needle (like heroin, cocaine, amphetamines, or steroids) during the last 12 months? Do not include anything you took under a doctor’s orders.
Have you ever taken such drugs using a needle that you knew (or suspected) had been used by someone else before you used it?
(Entries are percentages.)
TABLE 1cInjection Drug Use and Needle Sharing
Total and by Genderamong Respondents of Modal Age 40
in 2010–2012 a Combined
25

Total Male Female
Number of Partners in Last 12 Months
None 14.8 16.3 13.4
One 60.8 56.2 64.8
Two 9.7 9.4 10.0
Three 5.6 6.2 5.2
Four 3.7 4.3 3.2
5–10 4.2 5.8 2.9
11–20 0.8 1.2 0.4
21–100 0.3 0.5 0.1
More than 100 0.1 0.2 *
Weighted N = 19,419 9,125 10,295
Gender of Partners in Last 12 Months b
Exclusively male? 53.6 4.4 96.0
Both male and female? 1.4 0.9 1.9
Exclusively female? 44.9 94.7 2.1
Weighted N = 16,535 7,639 8,895
Source. The Monitoring the Future study, the University of Michigan.
Notes. ' * ' indicates a prevalence rate of less than 0.05%.aIn 2004–2006, the HIV questions were included in two questionnaire forms. In 2007, these questions were added
to a third questionnaire form.bPercentages based on those reporting sex with one or more partners during the last 12 months. Those reporting
no partners are omitted.
During the LAST 12 MONTHS, how many sex partners have you had? (This includes vaginal, oral, or anal sex.)
During the LAST 12 MONTHS, have your sex partner or partners been …
(Entries are percentages.)
TABLE 2aNumber of Sex Partners and Gender of Sex Partners
Total and by Genderamong Respondents of Modal Ages 21–30
in 2004–2012 a Combined
26

Number of Partners in Last 12 Months Total Male Female
None 9.1 9.2 8.9
One 79.1 77.4 80.6
Two 4.7 4.1 5.1
Three 3.1 3.4 2.9
Four 1.8 2.6 1.1
5–10 1.5 2.1 1.0
11–20 0.4 0.6 0.2
21–100 0.3 0.5 0.1
More * 0.1 *
Weighted N = 4,129 1,960 2,169
Gender of Partners in Last 12 Months b
Exclusively male? 52.6 3.5 97.1
Both male and female? 0.8 0.8 0.9
Exclusively female? 46.6 95.8 2.0
Weighted N = 3,731 1,773 1,958
Source. The Monitoring the Future study, the University of Michigan.
Notes. ' * ' indicates a prevalence rate of less than 0.05%.aIn 2008, the HIV questions were added to one half of the questionnaires administered to the 35-year-old
respondents. In 2009 and after, these questions were included in all questionnaires for this group.bPercentages based on those reporting sex with one or more partners during the last 12 months. Those
reporting no partners are omitted.
During the LAST 12 MONTHS, how many sex partners have you had? (This includes vaginal, oral, or anal sex.)
During the LAST 12 MONTHS, have your sex partner or partners been …
(Entries are percentages.)
TABLE 2bNumber of Sex Partners and Gender of Sex Partners
Total and by Genderamong Respondents of Modal Age 35
in 2008–2012 a Combined
27

Number of Partners in Last 12 Months Total Male Female
None 11.3 9.9 12.7
One 78.2 77.4 79.0
Two 4.9 4.7 5.0
Three 2.1 2.7 1.6
Four 1.1 1.4 0.9
5–10 1.5 2.5 0.6
11–20 0.5 0.6 0.3
21–100 0.2 0.5 *
More than 100 0.1 0.3 *
Weighted N = 2,665 1,305 1,359
Gender of Partners in Last 12 Months b
Exclusively male? 51.1 4.6 97.5
Both male and female? 0.7 0.6 0.9
Exclusively female? 48.1 94.9 1.6
Weighted N = 2,349 1,171 1,177
Source. The Monitoring the Future study, the University of Michigan.
Notes. ' * ' indicates a prevalence rate of less than 0.05%.aThe HIV questions were added to the questionnaires for 40-year-olds beginning in 2010.bPercentages based on those reporting sex with one or more partners during the last 12 months.
Those reporting no partners are omitted.
During the LAST 12 MONTHS, how many sex partners have you had? (This includes vaginal, oral, or anal sex.)
During the LAST 12 MONTHS, have your sex partner or partners been …
(Entries are percentages.)
TABLE 2cNumber of Sex Partners and Gender of Sex Partners
Total and by Genderamong Respondents of Modal Age 40
in 2010–2012 a Combined
28
Chapter 5: Intersection of Risk Behaviors
Chapter 5
INTERSECTION OF RISK BEHAVIORS
One goal of MTF is to determine to what extent the various HIV-related risk behaviors overlap with one another, and to determine what proportion of the population is at heightened risk of HIV transmission as a result. In this chapter, we report several pairwise combinations of risk factors. Needle Sharing by Gender of Sex Partners
Needle sharing and male-to-male sex are known to be among the most important risk behaviors for the spread of HIV.
Table 3a provides information on young adult injection drug use and needle sharing by the six categories of gender of partners in the prior 12 months—men who had sex exclusively with women, exclusively with men, or with both men and women; and women who had sex exclusively with men, exclusively with women, or with both men and women. The very small numbers of cases in the groups reporting same-gender or both-gender contact again make any results tentative.
Keeping in mind the small sample sizes, it appears that among young adults the annual prevalence of injecting drugs and of needle sharing both tend to be highest among those who engage in sex with both genders. This holds true for both male and female respondents (Table 3a).
The number of cases of the 35- and 40-year-olds who report having had sex with both
genders is too low to allow accurate estimation (Tables 3b and 3c).
Young adult males who report having exclusively male partners have about the same lifetime and annual prevalence rates of injection as males having exclusively female partners (Table 3a). They have a significantly higher lifetime and annual prevalence of needle sharing, however (1.3% vs. 0.4% lifetime; 0.7% vs. 0.1% annual). So, there is some compounding of these two types of risk—needle sharing and men having sex with men—among young adult males.
Among young adult females, the lifetime, but not annual, prevalence of injecting drugs is significantly higher for those having exclusively female partners than for those with exclusively male partners (4.5% vs. 0.9%). More importantly, the lifetime prevalence of needle sharing is also significantly higher (3.2% vs. 0.4%). Interestingly, there is less difference between these two groups in the prevalence of injecting or needle sharing in the prior 12 months, so much of the heightened risk from needle sharing for women who have exclusively female partners appears to have occurred when they were younger.
29
Monitoring the Future
Injection Drug Use and Needle Sharing by Number of Sex Partners
Among young adults, the prevalence of having injected drugs either over a lifetime or in the prior 12 months rises considerably with the number of sex partners reported in the prior 12 months (Table 4a). For example, those who report zero, one, or two partners during the prior 12 months report a prevalence of injecting a drug in the prior 12 months of 0.2%, 0.2%, and 0.4%, respectively, whereas those reporting five or more partners have a prevalence of 3.0%. The association holds for both males and females.
At ages 35 and 40 (Tables 4b and 4c) a similar positive association holds between number of sex partners in the prior 12 months and both lifetime and annual injection drug use (except for 35-year-old and 40-year-old females, who report essentially zero injecting).
Among young adults, sharing needles relates positively to the number of partners; past 12 month sharing was 0.1% or less among those who had two or fewer partners in the past 12 months, and 0.9% among those reporting five or more partners in that period (Table 4a, bottom panel). This means that needle sharers, who are at particular risk of contracting HIV, are more likely than others to have been exposing somewhat larger numbers of partners to that risk through sexual contact.
There are very low rates of reported needle sharing at ages 35 and 40 (Tables 4b and 4c), but lifetime rates are positively associated with number of sex partners in the prior 12 months. Those reporting five or more partners in the prior 12 months are most likely to have ever shared needles. (No association is found for females at age 40.)
Number of Sex Partners by Gender of Sex Partners
We examined the number of sex partners reported by the genders of those partners (Table 5a). Among sexually active young adult males, of those who had sex exclusively with other males during the year (N = 332 observations), about half (48%) reported that they had only one sex partner, compared to 69% among those males who reported that they had sexual contact exclusively with females. About a fifth (19%) of males with exclusively male partners reported sexual contact with five or more partners, compared to 8% of males with exclusively female partners. The proportions having more than ten sex partners during the year are 8.4% vs. 1.8%, respectively. Thus, although their proportion of the total population is small, and these particular findings are thus based on a small subsample, it appears that appreciable numbers of young adult males are potentially placing themselves and others at greater risk by having multiple sex partners, and this is especially true for males who have had sex exclusively with other males during the year. These two risk behaviors—men having sex with men and having large numbers of sex partners—are positively correlated, as others have found (NCHHSTP Media Team, 2013).
30
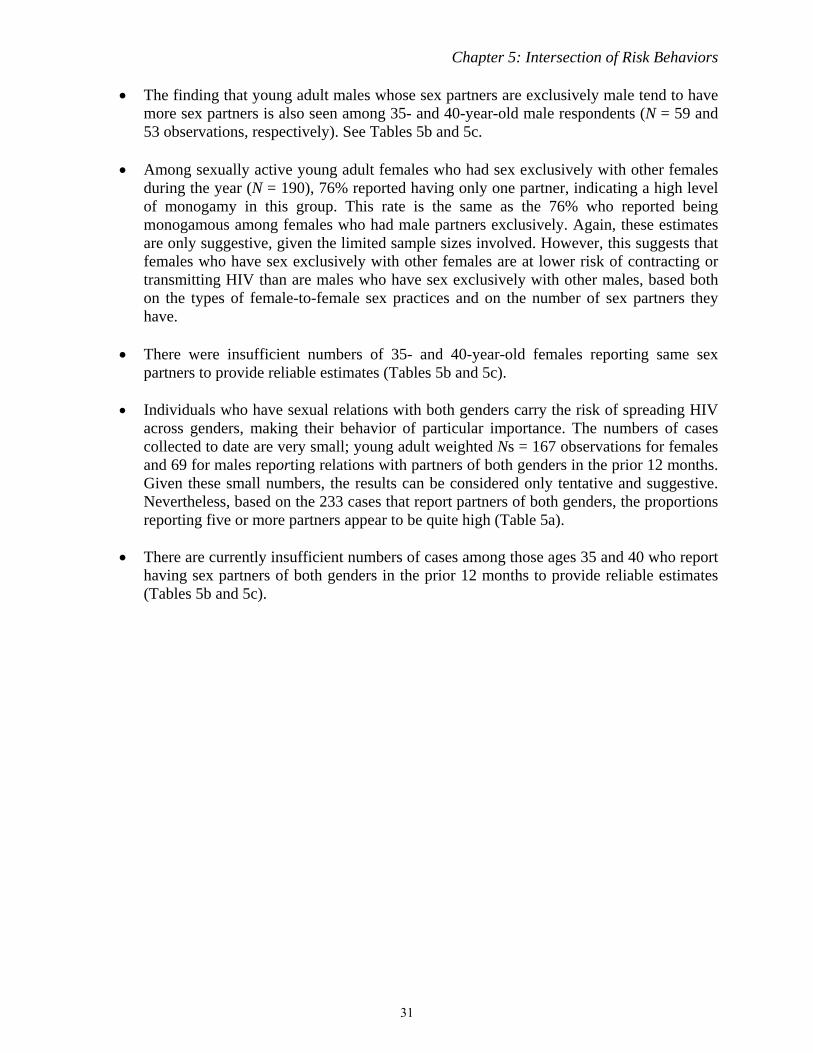
Chapter 5: Intersection of Risk Behaviors
The finding that young adult males whose sex partners are exclusively male tend to have more sex partners is also seen among 35- and 40-year-old male respondents (N = 59 and 53 observations, respectively). See Tables 5b and 5c.
Among sexually active young adult females who had sex exclusively with other females
during the year (N = 190), 76% reported having only one partner, indicating a high level of monogamy in this group. This rate is the same as the 76% who reported being monogamous among females who had male partners exclusively. Again, these estimates are only suggestive, given the limited sample sizes involved. However, this suggests that females who have sex exclusively with other females are at lower risk of contracting or transmitting HIV than are males who have sex exclusively with other males, based both on the types of female-to-female sex practices and on the number of sex partners they have.
There were insufficient numbers of 35- and 40-year-old females reporting same sex partners to provide reliable estimates (Tables 5b and 5c).
Individuals who have sexual relations with both genders carry the risk of spreading HIV
across genders, making their behavior of particular importance. The numbers of cases collected to date are very small; young adult weighted Ns = 167 observations for females and 69 for males reporting relations with partners of both genders in the prior 12 months. Given these small numbers, the results can be considered only tentative and suggestive. Nevertheless, based on the 233 cases that report partners of both genders, the proportions reporting five or more partners appear to be quite high (Table 5a).
There are currently insufficient numbers of cases among those ages 35 and 40 who report having sex partners of both genders in the prior 12 months to provide reliable estimates (Tables 5b and 5c).
31

Monitoring the Future
References
NCHHSTP Media Team. (2013). Estimated numbers and characteristics of men who have sex with men and use injection drugs — United States, 1999–2011. Morbidity and Mortality Weekly Report, September 19. Retrieved from http://www.cdc.gov/media/mmwrnews/2013/0919.html#A1
32
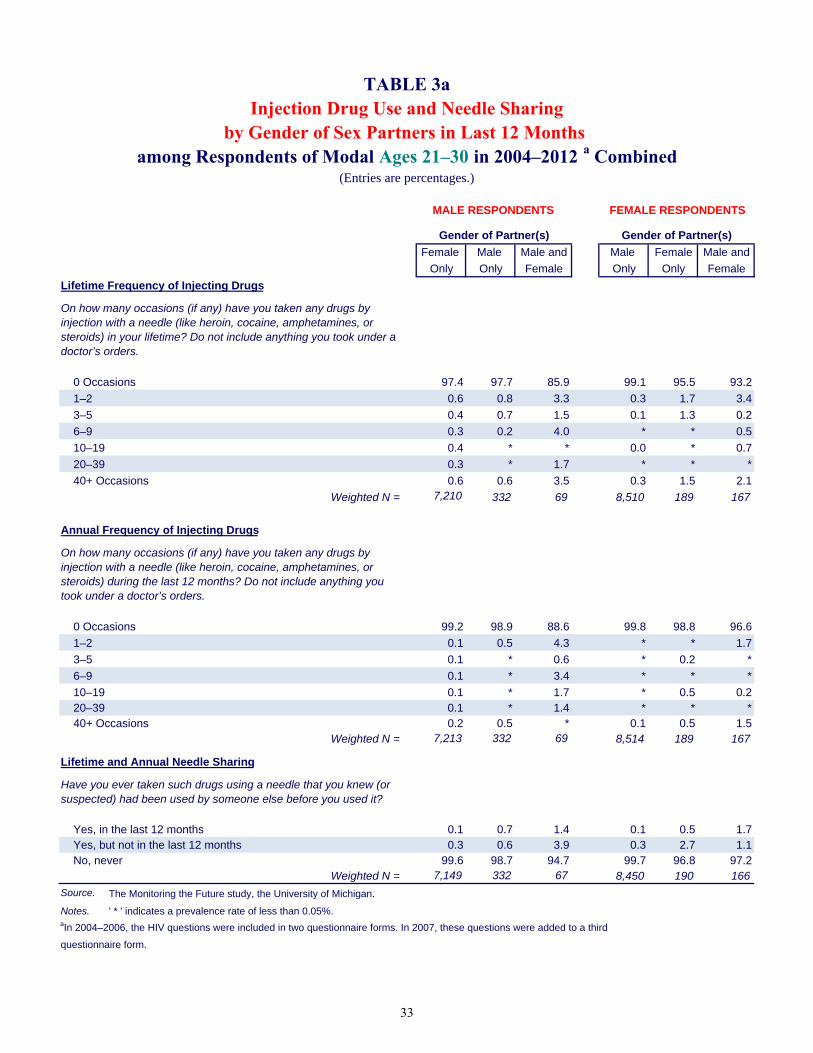
Female Male Male and Male Female Male and
Only Only Female Only Only Female
Lifetime Frequency of Injecting Drugs
0 Occasions 97.4 97.7 85.9 99.1 95.5 93.2
1–2 0.6 0.8 3.3 0.3 1.7 3.4
3–5 0.4 0.7 1.5 0.1 1.3 0.2
6–9 0.3 0.2 4.0 * * 0.5
10–19 0.4 * * 0.0 * 0.7
20–39 0.3 * 1.7 * * *
40+ Occasions 0.6 0.6 3.5 0.3 1.5 2.1
Weighted N = 7,210 332 69 8,510 189 167
Annual Frequency of Injecting Drugs
0 Occasions 99.2 98.9 88.6 99.8 98.8 96.6
1–2 0.1 0.5 4.3 * * 1.7
3–5 0.1 * 0.6 * 0.2 *
6–9 0.1 * 3.4 * * *
10–19 0.1 * 1.7 * 0.5 0.2 20–39 0.1 * 1.4 * * * 40+ Occasions 0.2 0.5 * 0.1 0.5 1.5
Weighted N = 7,213 332 69 8,514 189 167
Lifetime and Annual Needle Sharing
Yes, in the last 12 months 0.1 0.7 1.4 0.1 0.5 1.7 Yes, but not in the last 12 months 0.3 0.6 3.9 0.3 2.7 1.1 No, never 99.6 98.7 94.7 99.7 96.8 97.2
Weighted N = 7,149 332 67 8,450 190 166
Source. The Monitoring the Future study, the University of Michigan.
Notes. ' * ' indicates a prevalence rate of less than 0.05%.aIn 2004–2006, the HIV questions were included in two questionnaire forms. In 2007, these questions were added to a third
questionnaire form.
Injection Drug Use and Needle Sharing TABLE 3a
Gender of Partner(s)Gender of Partner(s)
(Entries are percentages.)
MALE RESPONDENTS FEMALE RESPONDENTS
On how many occasions (if any) have you taken any drugs by injection with a needle (like heroin, cocaine, amphetamines, or steroids) in your lifetime? Do not include anything you took under a doctor’s orders.
On how many occasions (if any) have you taken any drugs by injection with a needle (like heroin, cocaine, amphetamines, or steroids) during the last 12 months? Do not include anything you took under a doctor’s orders.
Have you ever taken such drugs using a needle that you knew (or suspected) had been used by someone else before you used it?
among Respondents of Modal Ages 21–30 in 2004–2012 a Combinedby Gender of Sex Partners in Last 12 Months
33
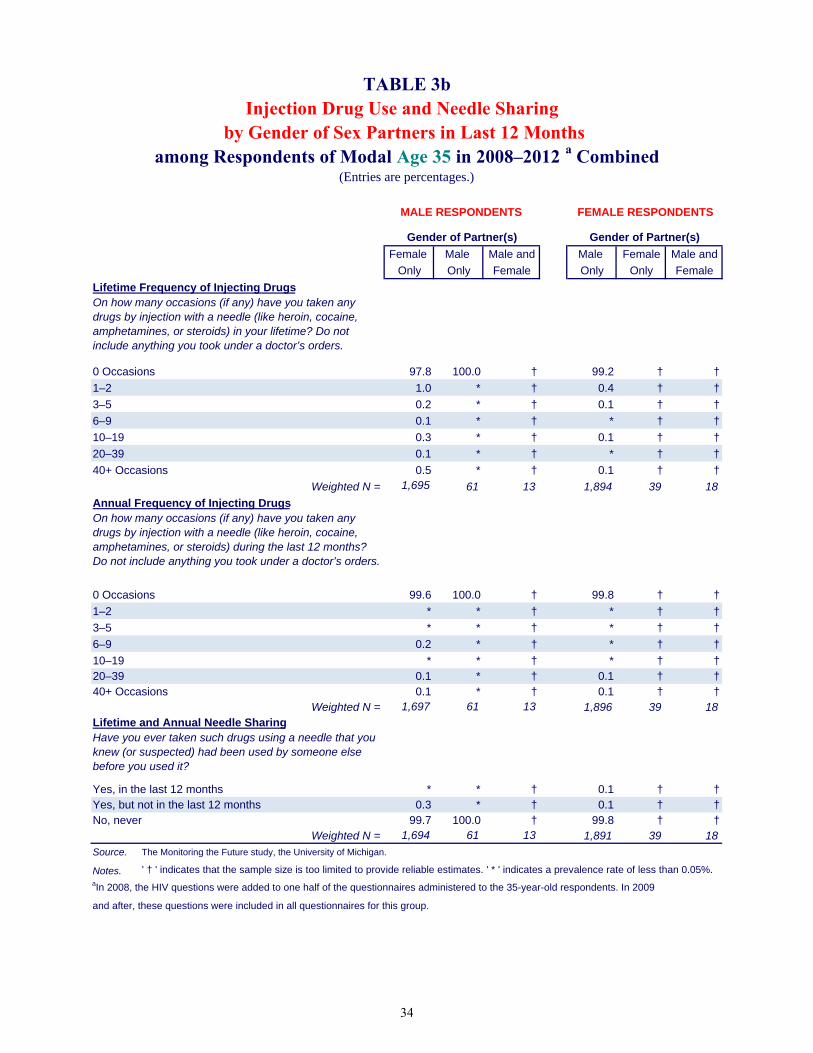
Female Male Male and Male Female Male and
Only Only Female Only Only Female
Lifetime Frequency of Injecting Drugs
0 Occasions 97.8 100.0 † 99.2 † †
1–2 1.0 * † 0.4 † †
3–5 0.2 * † 0.1 † †
6–9 0.1 * † * † †
10–19 0.3 * † 0.1 † †
20–39 0.1 * † * † †
40+ Occasions 0.5 * † 0.1 † †
Weighted N = 1,695 61 13 1,894 39 18
Annual Frequency of Injecting Drugs
0 Occasions 99.6 100.0 † 99.8 † †
1–2 * * † * † †
3–5 * * † * † †
6–9 0.2 * † * † †
10–19 * * † * † †20–39 0.1 * † 0.1 † †40+ Occasions 0.1 * † 0.1 † †
Weighted N = 1,697 61 13 1,896 39 18Lifetime and Annual Needle Sharing
Yes, in the last 12 months * * † 0.1 † †Yes, but not in the last 12 months 0.3 * † 0.1 † †No, never 99.7 100.0 † 99.8 † †
Weighted N = 1,694 61 13 1,891 39 18
Source. The Monitoring the Future study, the University of Michigan.
Notes. ' † ' indicates that the sample size is too limited to provide reliable estimates. ' * ' indicates a prevalence rate of less than 0.05%. aIn 2008, the HIV questions were added to one half of the questionnaires administered to the 35-year-old respondents. In 2009
and after, these questions were included in all questionnaires for this group.
On how many occasions (if any) have you taken any drugs by injection with a needle (like heroin, cocaine, amphetamines, or steroids) in your lifetime? Do not include anything you took under a doctor’s orders.
On how many occasions (if any) have you taken any drugs by injection with a needle (like heroin, cocaine, amphetamines, or steroids) during the last 12 months? Do not include anything you took under a doctor’s orders.
Have you ever taken such drugs using a needle that you knew (or suspected) had been used by someone else before you used it?
MALE RESPONDENTS FEMALE RESPONDENTS
among Respondents of Modal Age 35 in 2008–2012 a Combinedby Gender of Sex Partners in Last 12 Months
Injection Drug Use and Needle Sharing TABLE 3b
Gender of Partner(s)Gender of Partner(s)
(Entries are percentages.)
34

Female Male Male and Male Female Male and
Only Only Female Only Only Female
Lifetime Frequency of Injecting Drugs
0 Occasions 98.1 91.4 † 99.3 † †
1–2 0.5 6.4 † 0.4 † †
3–5 0.4 0.6 † 0.1 † †
6–9 0.1 1.7 † * † †
10–19 0.2 * † * † †
20–39 0.2 * † * † †
40+ Occasions 0.6 * † 0.2 † †
Weighted N = 1,102 53 7 1,144 19 11
Annual Frequency of Injecting Drugs
0 Occasions 99.7 97.8 † 100.0 † †
1–2 * 1.7 † * † †
3–5 * 0.6 † * † †
6–9 * * † * † †
10–19 * * † * † †20–39 0.1 * † * † †40+ Occasions 0.2 * † * † †
Weighted N = 1,103 53 7 1,144 19 11
Lifetime and Annual Needle Sharing
Yes, in the last 12 months * * † * † †
Yes, but not in the last 12 months 0.3 1.7 † 0.1 † †
No, never 99.7 98.3 † 99.9 † †
Weighted N = 1,104 53 7 1,143 19 10
Source. The Monitoring the Future study, the University of Michigan.
Notes. ' † ' indicates that the sample size is too limited to provide reliable estimates. ' * ' indicates a prevalence rate of less
than 0.05%.aThe HIV questions were added to the questionnaires for 40-year-olds beginning in 2010.
Injection Drug Use and Needle Sharing TABLE 3c
Gender of Partner(s)Gender of Partner(s)
(Entries are percentages.)
FEMALE RESPONDENTSMALE RESPONDENTS
On how many occasions (if any) have you taken any drugs by injection with a needle (like heroin, cocaine, amphetamines, or steroids) in your lifetime? Do not include anything you took under a doctor’s orders.
On how many occasions (if any) have you taken any drugs by injection with a needle (like heroin, cocaine, amphetamines, or steroids) during the last 12 months? Do not include anything you took under a doctor’s orders.
Have you ever taken such drugs using a needle that you knew (or suspected) had been used by someone else before you used it?
among Respondents of Modal Age 40 in 2010–2012 a Combinedby Gender of Sex Partners in Last 12 Months
35

Three Five
Lifetime Frequency of Injecting Drugs None One Two or Four or More
Total
0 Occasions 99.4 98.7 98.1 96.7 95.2
1+ Occasions 0.6 1.3 1.9 3.3 4.8
Weighted N = 2,851 11,772 1,884 1,806 1,035
Male
0 Occasions 99.0 98.2 97.3 95.4 93.9
1+ Occasions 1.0 1.8 2.7 4.6 6.1
Weighted N = 1,475 5,117 853 950 691
Female
0 Occasions 99.7 99.1 98.7 98.2 97.7
1+ Occasions 0.3 0.9 1.3 1.8 2.3
Weighted N = 1,375 6,655 1,031 856 344
Annual Frequency of Injecting Drugs
Total
0 Occasions 99.8 99.8 99.6 98.7 97.0
1+ Occasions 0.2 0.2 0.4 1.3 3.0
Weighted N = 2,854 11,776 1,885 1,807 1,036
Male
0 Occasions 99.8 99.7 99.7 98.1 96.2
1+ Occasions 0.2 0.3 0.3 1.9 3.8
Weighted N = 1,476 5,119 853 951 692
Female
0 Occasions 99.8 99.9 99.5 99.4 98.6
1+ Occasions 0.2 0.1 0.5 0.6 1.4
Weighted N = 1,377 6,657 1,032 856 344
Lifetime and Annual Needle Sharing
Total
Yes, in the last 12 months 0.1 * 0.1 0.4 0.9
Yes, but not in the last 12 months 0.3 0.2 0.5 0.7 0.4
No, never 99.6 99.7 99.4 98.9 98.8
Weighted N = 2,814 11,691 1,863 1,794 1,024
Male
Yes, in the last 12 months 0.2 0.0 0.1 0.4 0.8
Yes, but not in the last 12 months 0.5 0.2 0.4 1.0 0.2
No, never 99.4 99.7 99.5 98.6 98.9
Weighted N = 1,457 5,083 839 945 681
Female
Yes, in the last 12 months 0.1 * 0.1 0.5 1.0
Yes, but not in the last 12 months * 0.3 0.5 0.3 0.6
No, never 99.9 99.7 99.3 99.2 98.4
Weighted N = 1,358 6,608 1,024 849 343Source. The Monitoring the Future study, the University of Michigan.
Notes. ' * ' indicates a prevalence rate of less than 0.05%.aIn 2004–2006, the HIV questions were included in two questionnaire forms. In 2007, these questions were added
to a third questionnaire form.
On how many occasions (if any) have you taken any drugs by injection with a needle (like heroin, cocaine, amphetamines, or steroids) in your lifetime? Do not include anything you took under a doctor’s orders.
On how many occasions (if any) have you taken any drugs by injection with a needle (like heroin, cocaine, amphetamines, or steroids) during the last 12 months? Do not include anything you took under a doctor’s orders.
Have you ever taken such drugs using a needle that you knew (or suspected) had been used by someone else before you used it?
Number of Partners in Last 12 Months
TABLE 4aInjection Drug Use and Needle Sharing
by Number of Sex Partners in Last 12 Monthsamong Respondents of Modal Ages 21–30 in 2004–2012 a Combined
(Entries are percentages.)
36

Three Five
Lifetime Frequency of Injecting Drugs None One Two or Four or More
Total
0 Occasions 98.4 98.8 97.9 95.3 94.8
1+ Occasions 1.6 1.2 2.1 4.7 5.2
Weighted N = 374 3,255 192 205 91
Males
0 Occasions 97.4 98.4 95.4 92.9 93.1
1+ Occasions 2.6 1.6 4.6 7.1 6.9
Weighted N = 180 1,513 81 117 64
Females
0 Occasions 99.3 99.1 99.8 98.5 98.8
1+ Occasions 0.7 0.9 0.2 1.5 1.2
Weighted N = 194 1,742 111 88 27
Annual Frequency of Injecting Drugs
Total
0 Occasions 99.7 99.8 98.7 99.1 98.9
1+ Occasions 0.3 0.2 1.3 0.9 1.1
Weighted N = 374 3,259 192 205 91
Males
0 Occasions 99.4 99.8 96.9 98.4 98.4
1+ Occasions 0.6 0.2 3.1 1.6 1.6
Weighted N = 180 1,515 81 117 64
Females
0 Occasions 100.0 99.8 100.0 100.0 100.0
1+ Occasions * 0.2 * * *
Weighted N = 194 1,744 111 88 27
Lifetime and Annual Needle Sharing
Total
Yes, in the last 12 months * * * * *
Yes, but not in the last 12 months 0.2 0.2 0.1 1.4 1.5
No, never 99.8 99.8 99.9 98.6 98.5
Weighted N = 374 3,250 193 204 91
Males
Yes, in the last 12 months * * * * *
Yes, but not in the last 12 months 0.3 0.3 * 2.5 1.6
No, never 99.7 99.7 100.0 97.5 98.4
Weighted N = 181 1,512 81 117 64
Females
Yes, in the last 12 months * 0.1 * * *
Yes, but not in the last 12 months 0.2 0.1 0.2 * 1.2
No, never 99.8 99.8 99.8 100.0 98.8
Weighted N = 193 1,739 112 87 27
Source. The Monitoring the Future study, the University of Michigan.
Notes. ' * ' indicates a prevalence rate of less than 0.05%.aIn 2008, the HIV questions were added to one half of the questionnaires administered to the 35-year-old respondents.
In 2009 and after, these questions were included in all questionnaires for this group.
On how many occasions (if any) have you taken any drugs by injection with a needle (like heroin, cocaine, amphetamines, or steroids) in your lifetime? Do not include anything you took under a doctor’s orders.
On how many occasions (if any) have you taken any drugs by injection with a needle (like heroin, cocaine, amphetamines, or steroids) during the last 12 months? Do not include anything you took under a doctor’s orders.
Have you ever taken such drugs using a needle that you knew (or suspected) had been used by someone else before you used it?
Number of Partners in Last 12 Months
TABLE 4bInjection Drug Use and Needle Sharing
by Number of Sex Partners in Last 12 Monthsamong Respondents of Modal Age 35 in 2008–2012 a Combined
(Entries are percentages.)
37

Three Five
Lifetime Frequency of Injecting Drugs None One Two or Four or More
Total
0 Occasions 98.9 98.9 98.5 95.0 93.5
1+ Occasions 1.1 1.1 1.5 5.0 6.5
Weighted N = 301 2,073 130 87 62
Males
0 Occasions 98.5 98.4 96.9 92.0 92.0
1+ Occasions 1.5 1.6 3.1 8.0 8.0
Weighted N = 129 1,002 62 54 50
Females
0 Occasions 99.2 99.3 100.0 100.0 100.0
1+ Occasions 0.8 0.7 * * *
Weighted N = 172 1,070 68 33 12
Annual Frequency of Injecting Drugs
Total
0 Occasions 100.0 99.9 98.9 99.6 98.1
1+ Occasions * 0.1 1.1 0.4 1.9
Weighted N = 301 2,073 130 87 62
Males
0 Occasions 100.0 99.8 97.7 99.4 97.6
1+ Occasions * 0.2 2.3 0.6 2.4
Weighted N = 129 1,003 62 54 50
Females
0 Occasions 100.0 100.0 100.0 100.0 100.0
1+ Occasions * * * * *
Weighted N = 172 1,070 68 33 12
Lifetime and Annual Needle Sharing
Total
Yes, in the last 12 months * * * * *
Yes, but not in the last 12 months 0.6 0.1 0.4 1.7 2.2
No, never 99.4 99.9 99.6 98.3 97.8
Weighted N = 299 2,077 127 87 60
Males
Yes, in the last 12 months * * * * *
Yes, but not in the last 12 months 0.3 0.0 0.8 2.7 2.8
No, never 99.7 100.0 99.2 97.3 97.2
Weighted N = 129 1,009 60 54 48
Females
Yes, in the last 12 months * * * * *
Yes, but not in the last 12 months 0.9 0.1 * * *
No, never 99.1 99.9 100.0 100.0 100.0
Weighted N = 169 1,069 68 33 12
Source. The Monitoring the Future study, the University of Michigan.
Notes. ' * ' indicates a prevalence rate of less than 0.05%.aThe HIV questions were added to the questionnaires for 40-year-olds beginning in 2010.
Have you ever taken such drugs using a needle that you knew (or suspected) had been used by someone else before you used it?
On how many occasions (if any) have you taken any drugs by injection with a needle (like heroin, cocaine, amphetamines, or steroids) during the last 12 months? Do not include anything you took under a doctor’s orders.
On how many occasions (if any) have you taken any drugs by injection with a needle (like heroin, cocaine, amphetamines, or steroids) in your lifetime? Do not include anything you took under a doctor’s orders.
Number of Partners in Last 12 Months
TABLE 4cInjection Drug Use and Needle Sharing
by Number of Sex Partners in Last 12 Monthsamong Respondents of Modal Age 40 in 2010–2012 a Combined
(Entries are percentages.)
38

Female Male Male and Male Female Male and
Only Only Female Only Only Female
Number of Partners in Last 12 Months
None — — — — — —
One 68.6 48.2 9.9 76.2 76.1 6.6
Two 11.2 11.3 17.1 11.4 11.2 23.2
Three 7.1 11.6 10.0 5.6 7.8 21.7
Four 4.8 9.6 20.0 3.5 2.3 15.5
5–10 6.5 10.9 29.5 2.9 2.6 25.2
11–20 1.2 4.2 8.2 0.3 * 6.1
21 or more partners 0.6 4.2 5.2 0.1 * 1.7
Weighted N = 7,204 332 69 8,521 190 167
Source. The Monitoring the Future study, the University of Michigan.
Notes ' — ' indicates not applicable. ' * ' indicates a prevalence rate of less than 0.05%.aIn 2004–2006, the HIV questions were included in two questionnaire forms. In 2007, these questions were added to a third
questionnaire form.
During the LAST 12 MONTHS, how many sex partners have you had? (This includes vaginal, oral, or anal sex.)
Gender of Partner(s) Gender of Partner(s)
TABLE 5aNumber of Sex Partners by Gender of Sex Partners in Last 12 Months
among Respondents of Modal Ages 21–30 in 2004–2012 a Combined(Entries are percentages.)
MALE RESPONDENTS FEMALE RESPONDENTS
39

Female Male Male and Male Female Male and
Only Only Female Only Only Female
Number of Partners in Last 12 Months
None — — † — † †
One 87.1 53.5 † 89.6 † †
Two 4.4 3.5 † 5.4 † †
Three 3.1 12.0 † 2.6 † †
Four 2.6 6.8 † 1.1 † †
5–10 1.8 18.6 † 1.0 † †
11–20 0.6 3.6 † 0.2 † †
21 or more partners 0.5 2.0 † 0.1 † †
Weighted N = 1,691 59 13 1,900 39 18
Source. The Monitoring the Future study, the University of Michigan.
Notes. ' † ' indicates that the sample size is too limited to provide reliable estimates. ' — ' indicates not applicable.
' * ' indicates a prevalence rate of less than 0.05%.aIn 2008, the HIV questions were added to one half of the questionnaires administered to the 35-year-old respondents.
In 2009 and after, these questions were included in all questionnaires for this group.
During the LAST 12 MONTHS, how many sex partners have you had? (This includes vaginal, oral, or anal sex.)
Gender of Partner(s) Gender of Partner(s)
TABLE 5bNumber of Sex Partners by Gender of Sex Partners in Last 12 Months
among Respondents of Modal Age 35 in 2008–2012 a Combined(Entries are percentages.)
MALE RESPONDENTS FEMALE RESPONDENTS
40

Female Male Male and Male Female Male and
Only Only Female Only Only Female
Number of Partners in Last 12 Months
None — — † — † †
One 88.0 52.1 † 91.1 † †
Two 4.6 18.9 † 5.5 † †
Three 3.0 3.7 † 1.8 † †
Four 1.2 9.3 † 0.8 † †
5–10 2.4 11.1 † 0.5 † †
11–20 0.6 1.8 † 0.3 † †
21 or more partners 0.3 3.2 † * † †
Weighted N = 1,109 53 7 1,147 19 11
Source. The Monitoring the Future study, the University of Michigan.
Notes. ' † ' indicates that the sample size is too limited to provide reliable estimates. ' — ' indicates not applicable.
' * ' indicates a prevalence rate of less than 0.05%.aThe HIV questions were added to the questionnaires for 40-year-olds beginning in 2010.
During the LAST 12 MONTHS, how many sex partners have you had? (This includes vaginal, oral, or anal sex.)
Gender of Partner(s) Gender of Partner(s)
TABLE 5cNumber of Sex Partners by Gender of Sex Partners in Last 12 Months
among Respondents of Modal Age 40 in 2010–2012 a Combined(Entries are percentages.)
MALE RESPONDENTS FEMALE RESPONDENTS
41

Chapter 6: Prevalence of Protective Behaviors
Chapter 6
PREVALENCE OF PROTECTIVE BEHAVIORS
Various precautions can diminish the likelihood of contracting and/or transmitting HIV. One, of course, is simply to avoid the high-risk behaviors already discussed. Another is to use protection against viral transmission in the form of condom use during intercourse. A third approach—getting tested for HIV—increases the likelihood that an infected individual will receive appropriate treatment that may save his or her life, and also, if the diagnosis is positive, refrain from behaviors that put others at risk of contracting the virus.
Condom Use
Respondents who indicate that they have had one or more sexual partners during the prior 12 months are asked, “When you had sexual intercourse during the last 12 months, how often were condoms used? (This includes vaginal and anal sex, but not oral sex.)” The answer alternatives are: never, seldom, sometimes, most times, and always. Both genders respond to this question. (Respondents who report no sex partners in the prior 12 months are not included in the data presented here.)
Just over half (54%) of sexually active young adult respondents report that they “seldom” or “never” used condoms during the past 12 months—with 50% of males and 58% of females giving one of these answers (Table 6a). Indeed, a large proportion (40%) indicate that they did not use condoms at all during the prior 12 months—36% of the sexually active males and 44% of the sexually active females. Higher rates of monogamy among females may help to explain their lower rate of condom use; however, their partners may or may not be monogamous, and if not, the risk to the woman increases, quite possibly without her awareness. In addition, women having sex with other women are less likely to report condom use, because use of the female condom is not very popular.
Only about one third (33%) of sexually active young adults say that they used a condom
“most times” or “always”—37% of males and 29% of females.
An examination of two-year age-groups among the 21- to 30-year-olds shows that the prevalence of condom use declines steadily with age (Table 6d). Some 76% of the 21- to 22-year-olds report some condom use in the last 12 months, compared to 46% of the 29- to 30-year-olds. And while 46% of the 21- to 22-year olds group report using condoms “most times” or “always,” only 23% of the 29- to 30-year olds say that. One plausible explanation for these age-related declines in condom use is an increase in proportions becoming married and/or monogamous; however, Table 6e shows that even among young adults not married at the times of the surveys, proportions reporting any condom use decline with age by 18 percentage points (from 79% of 21- to 22-year olds to 61% of 29- to 30-year olds). Among those who report being married, the prevalence of condom use is indeed lower at each age, but there is also a 16 percentage point decline with age
42

Monitoring the Future
(from 51% of the married 21- to 22-year-olds reporting any condom use to 35% among married 29- to 30-year-olds). Thus, the decline with age is only partially explainable by an increased proportion being married.
Condom use is lower among sexually active 35-year-olds than among young adults, with 71% of the older males and 76% of the females saying that they seldom or never used condoms in the prior 12 months (Table 6b). And condom use is lower still among the sexually active 40-year-olds, with 78% of the males and 81% of the females saying that they seldom or never used condoms in the prior 12 months.
Getting Tested for HIV
Respondents were asked if they had ever been tested for HIV/AIDS; the question instructed them not to include any testing that may have occurred when they were donating blood. The results for young adults may be found in Tables 7a, 7b, and 7c.
Less than half (44%) of all young adults ages 21 to 30 indicate that they have ever been
tested for HIV outside of blood donation screening. Despite the fact that males are at considerably higher risk of contracting HIV (CDC, 2012), females are more likely to report having been tested than are males (50% versus 36%). The higher rate of being tested among females may be partly due to being tested during pregnancy. Lifetime prevalence of HIV testing rises with age within the young adult interval: Summing across the surveys from 2004 to 2012, 30% of 21- to 22-year-olds report some testing compared to 54% of 29- to 30-year-olds (Table 7d).
About one fifth (21%) of young adults say they have been tested in the last 12 months,
and as with lifetime prevalence, a higher percentage of females than males report being tested (25% versus 16%, Table 7a).
The great majority (93%) of those who have been tested receive the results of their most recent test. A slightly higher percentage of females than males report receiving the results, 94% versus 92%.
Among 35-year-olds, the lifetime prevalence of being tested for HIV is higher than among young adults (48% for males and 62% for females); and among 40-year-olds the lifetime rates are higher still for males (50%) but not for females (59%). However, the rate of testing in the past 12 months declines some with age across these three age strata (from 21% to 15% to 11%) (Tables 7a, b, and c).
43

Chapter 6: Prevalence of Protective Behaviors
References Centers for Disease Control and Prevention (CDC). (2012). CDC Fact Sheet: New HIV infections in the United States. Retrieved from http://www.cdc.gov/nchhstp/newsroom/docs/2012/hiv-infections-2007-2010.pdf
44

Frequency of Condom Use in Last 12 Monthsb Total Male Female
Never 40.4 35.8 44.4
Seldom 13.9 13.7 14.0
Sometimes 12.8 13.2 12.5
Most times 15.0 16.6 13.5
Always 18.0 20.7 15.6
Weighted N = 16,397 7,595 8,802
Source. The Monitoring the Future study, the University of Michigan.aIn 2004–2006, the HIV questions were included in two questionnaire forms. In 2007, these questions were added
to a third questionnaire form.bPercentages based on those reporting sex with one or more partners during the last 12 months. Those reporting
no partners are omitted.
When you had sexual intercourse during the LAST 12 MONTHS, how often were condoms used? (This includes vaginal and anal sex, but not oral sex.)
TABLE 6aFrequency of Condom Use
among Respondents of Modal Ages 21–30
(Entries are percentages.)
in 2004–2012 a Combined
Total and by Gender
45

Frequency of Condom Use in Last 12 Months b Total Male Female
Never 65.2 61.0 69.0
Seldom 8.7 10.1 7.4
Sometimes 8.6 9.6 7.6
Most times 8.3 9.8 6.9
Always 9.3 9.4 9.2
Weighted N = 3,722 1,769 1,953
Source. The Monitoring the Future study, the University of Michigan.
aIn 2008, the HIV questions were added to one half of the questionnaires administered to the 35-year-old respondents.
In 2009 and after, these questions were included in all questionnaires for this group.bPercentages based on those reporting sex with one or more partners during the last 12 months. Those reporting
no partners are omitted.
TABLE 6bFrequency of Condom Use
among Respondents of Modal Age 35 in 2008–2012 a Combined(Entries are percentages.)
When you had sexual intercourse during the LAST 12 MONTHS, how often were condoms used? (This includes vaginal and anal sex, but not oral sex.)
Total and by Gender
46

Frequency of Condom Use in Last 12 Months b Total Male Female
Never 74.7 72.4 77.0
Seldom 4.8 5.3 4.2
Sometimes 6.5 7.4 5.7
Most times 6.1 6.7 5.4
Always 7.9 8.2 7.6
Weighted N = 2,340 1,170 1,170
Source. The Monitoring the Future study, the University of Michigan.aThe HIV questions were added to the questionnaires for 40-year-olds beginning in 2010.bPercentages based on those reporting sex with one or more partners during the last 12 months. Those reporting
no partners are omitted.
TABLE 6cFrequency of Condom Use
among Respondents of Modal Age 40 in 2010–2012 a Combined(Entries are percentages.)
When you had sexual intercourse during the LAST 12 MONTHS, how often were condoms used? (This includes vaginal and anal sex, but not oral sex.)
Total and by Gender
47

Frequency of Condom Use in Last 12 Months 21–22 23–24 25–26 27–28 29–30
Never 24.0 32.7 40.4 50.2 53.7
Seldom 14.9 15.6 14.1 13.0 11.8
Sometimes 14.9 13.1 13.1 11.9 11.2
Most times 19.7 17.7 15.3 11.3 11.1
Always 26.5 20.8 17.2 13.6 12.2
Weighted N = 3,168 3,333 3,222 3,285 3,388
Source. The Monitoring the Future study, the University of Michigan.aIn 2004–2006, the HIV questions were included in two questionnaire forms. In 2007, these questions were added to a third questionnaire form.
Age of Respondent
TABLE 6dUse of Condoms in Past Year by 2-Year Age Groups
(Entries are percentages.)
among Young Adults 2004–2012 a Combined
48
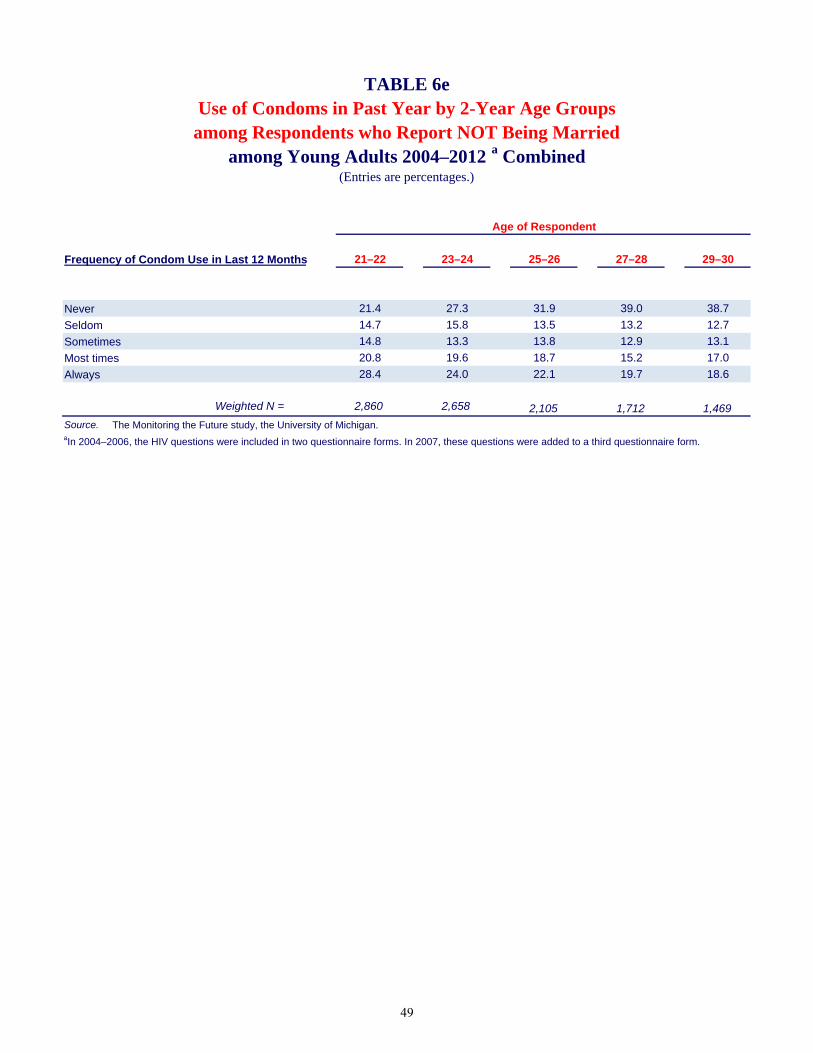
Frequency of Condom Use in Last 12 Months 21–22 23–24 25–26 27–28 29–30
Never 21.4 27.3 31.9 39.0 38.7
Seldom 14.7 15.8 13.5 13.2 12.7
Sometimes 14.8 13.3 13.8 12.9 13.1
Most times 20.8 19.6 18.7 15.2 17.0
Always 28.4 24.0 22.1 19.7 18.6
Weighted N = 2,860 2,658 2,105 1,712 1,469
Source. The Monitoring the Future study, the University of Michigan.aIn 2004–2006, the HIV questions were included in two questionnaire forms. In 2007, these questions were added to a third questionnaire form.
TABLE 6e
among Respondents who Report NOT Being Married among Young Adults 2004–2012 a Combined
(Entries are percentages.)
Age of Respondent
Use of Condoms in Past Year by 2-Year Age Groups
49

Frequency of Condom Use in Last 12 Months 21–22 23–24 25–26 27–28 29–30
Never 48.8 54.1 56.8 62.7 65.1
Seldom 17.5 15.7 14.9 12.7 10.9
Sometimes 17.0 12.5 11.6 10.8 9.8
Most times 8.6 10.0 8.8 7.1 6.7
Always 8.1 7.7 7.9 6.8 7.4
Weighted N = 292 653 1,097 1,561 1,911
Source. The Monitoring the Future study, the University of Michigan.aIn 2004–2006, the HIV questions were included in two questionnaire forms. In 2007, these questions were added to a third questionnaire form.
TABLE 6f
among Respondents who Report Being Married among Young Adults 2004–2012 a Combined
(Entries are percentages.)
Age of Respondent
Use of Condoms in Past Year by 2-Year Age Groups
50

Test for HIV: Lifetime and Last 12 Months Total Male Female
Yes, in the last 12 months 20.8 16.1 24.9
Yes, but not in the last 12 months 22.8 20.1 25.1
No, never 56.5 63.8 50.0
Weighted N = 19,551 9,193 10,358
Received HIV Test Results b
Yes 93.1 91.7 94.1
No 6.9 8.3 5.9
Weighted N = 8,412 3,284 5,128
Source. The Monitoring the Future study, the University of Michigan.aIn 2004–2006, the HIV questions were included in two questionnaire forms. In 2007, these questions were added
to a third questionnaire form.bThose respondents who report never having been tested for HIV are excluded from these percentages.
Have you ever been tested for HIV/AIDS? (Do not include tests that you may have had when donating blood or blood plasma.)
Did you receive the results of your most recent HIV/AIDS test? (We don’t want to know your test results.)
TABLE 7aTest for HIV, Lifetime and Last 12 Months
Total and by Genderamong Respondents of Modal Ages 21–30
(Entries are percentages.)
in 2004–2012 a Combined
51

Test for HIV: Lifetime and Last 12 Months Total Male Female
Yes, in the last 12 months 15.2 12.1 17.9
Yes, but not in the last 12 months 40.2 35.7 44.4
No, never 44.6 52.2 37.7
Weighted N = 4,137 1,965 2,172
Received HIV Test Results b
Yes 93.8 90.2 96.2
No 6.2 9.8 3.8
Weighted N = 2,259 925 1,334
Source. The Monitoring the Future study, the University of Michigan.
aIn 2008, the HIV questions were added to one half of the questionnaires administered to the 35-year-old respondents.
In 2009 and after, these questions were included in all questionnaires for this group.bThose respondents who report never having been tested for HIV are excluded from these percentages.
Have you ever been tested for HIV/AIDS? (Do not include tests that you may have had when donating blood or blood plasma.)
Did you receive the results of your most recent HIV/AIDS test? (We don’t want to know your test results.)
TABLE 7bTest for HIV, Lifetime and Last 12 Months
Total and by Genderamong Respondents of Modal Age 35
(Entries are percentages.)
in 2008–2012 a Combined
52

Test for Total Male Female
Yes, in the last 12 months 11.3 12.0 10.6
Yes, but not in the last 12 months 43.4 37.8 48.7
No, never 45.3 50.1 40.7
Weighted N = 2,654 1,301 1,353
Received HIV Test Results b
Yes 93.5 92.2 94.7
No 6.5 7.8 5.3
Weighted N = 1,412 634 778
Source. The Monitoring the Future study, the University of Michigan.aThe HIV questions were added to the questionnaires for 40-year-olds beginning in 2010.bThose respondents who report never having been tested for HIV are excluded from these percentages.
Have you ever been tested for HIV/AIDS? (Do not include tests that you may have had when donating blood or blood plasma.)
Did you receive the results of your most recent HIV/AIDS test? (We don’t want to know your test results.)
TABLE 7cTest for HIV, Lifetime and Last 12 Months
Total and by Genderamong Respondents of Modal Age 40
(Entries are percentages.)
in 2010–2012 a Combined
53
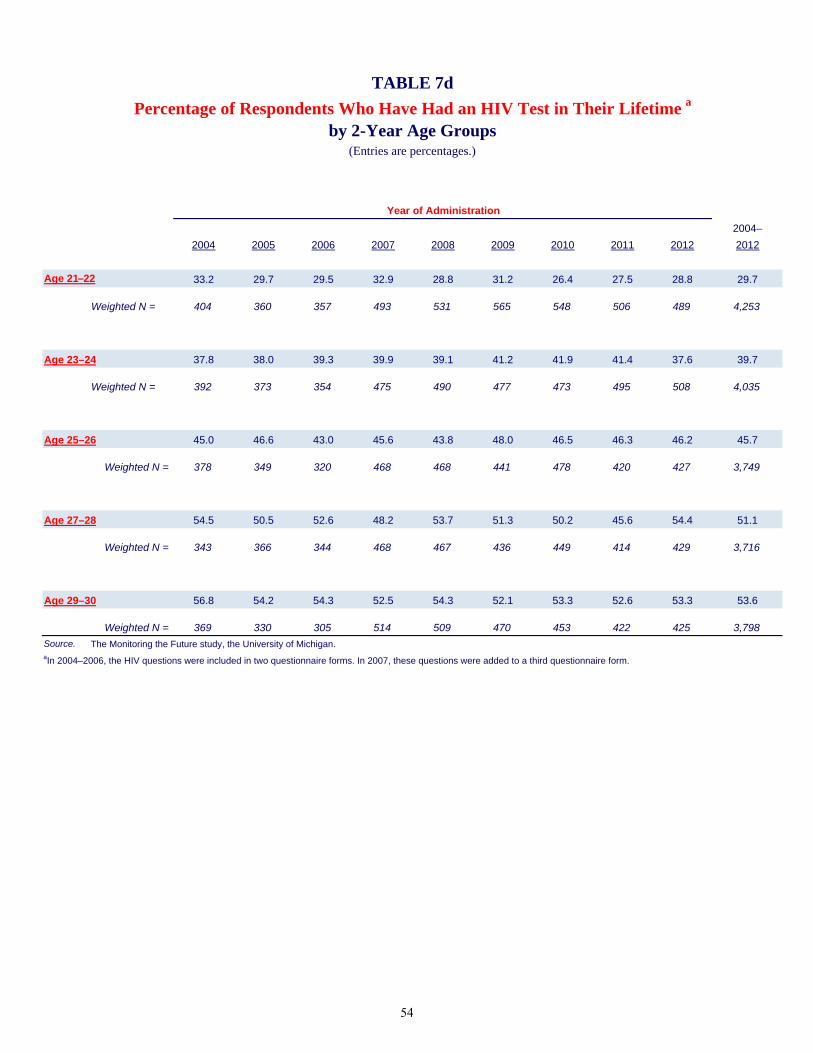
2004–
2004 2005 2006 2007 2008 2009 2010 2011 2012 2012
Age 21–22 33.2 29.7 29.5 32.9 28.8 31.2 26.4 27.5 28.8 29.7
Weighted N = 404 360 357 493 531 565 548 506 489 4,253
Age 23–24 37.8 38.0 39.3 39.9 39.1 41.2 41.9 41.4 37.6 39.7
Weighted N = 392 373 354 475 490 477 473 495 508 4,035
Age 25–26 45.0 46.6 43.0 45.6 43.8 48.0 46.5 46.3 46.2 45.7
Weighted N = 378 349 320 468 468 441 478 420 427 3,749
Age 27–28 54.5 50.5 52.6 48.2 53.7 51.3 50.2 45.6 54.4 51.1
Weighted N = 343 366 344 468 467 436 449 414 429 3,716
Age 29–30 56.8 54.2 54.3 52.5 54.3 52.1 53.3 52.6 53.3 53.6
Weighted N = 369 330 305 514 509 470 453 422 425 3,798
Source. The Monitoring the Future study, the University of Michigan.aIn 2004–2006, the HIV questions were included in two questionnaire forms. In 2007, these questions were added to a third questionnaire form.
TABLE 7d
Percentage of Respondents Who Have Had an HIV Test in Their Lifetime a
by 2-Year Age Groups (Entries are percentages.)
Year of Administration
54

Chapter 7: Intersection of Protective Behaviors
Chapter 7
INTERSECTION OF PROTECTIVE BEHAVIORS
To the extent that people who use one type of protection against HIV transmission are more likely to use another, we may have an indication of individual differences in protection against HIV/AIDS in general. We look here at the degree of association between getting tested and using condoms.
Frequency of Condom Use by Getting Tested for HIV
Are people who take the precaution of using condoms also the ones who are getting tested for HIV? The answer appears to be somewhat complicated (Table 8a), with the association being slightly curvilinear among both male and female young adults. Of those who say they “always” used condoms in the last 12 months, 19% indicate getting tested for HIV in that period, compared to the 26%–29% who say they seldom, sometimes, or most times use condoms. Perhaps those who always use condoms consider themselves to be at less risk of contracting HIV. Sexually active respondents who say they never use condoms are also slightly less likely to have been tested in the prior 12 months (22%) than the middle groups. The chart below shows the curvilinear association.
Among the 35- and 40-year-olds the same curvilinear relationship between HIV testing and condom use appears to hold (Tables 8b and 8c). The differences in testing as a function of how often sexually active respondents use condoms are not large, but some of those differences are fairly consistent. For example, among 35-year-olds, those not using condoms at all in the past 12 months, 14% were tested in the past 12 months. That proportion rises to 19% among those who seldom use condoms and to 24% among those
0.000
0.050
0.100
0.150
0.200
0.250
0.300
0.350
Never Seldom Sometimes Most Times Always
Condom Use Last 12 Months
Tested in last 12 months
55

Chapter 7: Intersection of Protective Behaviors
who sometimes use condoms; it then declines to 20% among those who use condoms most times, and falls further to 16% among those who always use condoms. There appears to be little association between condom use and the proportion (of those getting tested for HIV) who actually secure the results of their tests. As Tables 8a, 8b, and 8c illustrate, nearly all respondents (92%–98%) secure their test results, regardless of how often they have used condoms in the prior year.
As noted in the previous chapter, marital status is related to the likelihood of using condoms, and it seems possible that it might be related to the prevalence of testing in the prior 12 months. A comparison of Tables 8d and 8e shows that young adults who are married are somewhat less likely to be tested for HIV in the last 12 months than those who are not married, especially among females.
56

Test for HIV: Lifetime and Last 12 Months Never Seldom Sometimes Most Times Always
Total
Yes, in the last 12 months 21.6 26.1 28.7 26.7 18.8
Yes, but not in the last 12 months 29.5 24.3 23.7 23.2 17.9
No, never 48.9 49.6 47.6 50.1 63.2
Weighted N = 6,614 2,268 2,096 2,451 2,938Male
Yes, in the last 12 months 15.8 18.1 22.3 21.8 16.9
Yes, but not in the last 12 months 25.8 23.1 22.1 22.3 15.9
No, never 58.4 58.8 55.5 55.9 67.2
Weighted N = 2,710 1,037 1,001 1,263 1,569
Female
Yes, in the last 12 months 25.7 32.8 34.5 32.0 21.0
Yes, but not in the last 12 months 32.1 25.4 25.1 24.2 20.3
No, never 42.2 41.9 40.4 43.8 58.7
Weighted N = 3,904 1,230 1,095 1,188 1,369
Received HIV Test Resultsc
Total
Yes 93.4 92.3 93.8 94.4 93.2
No 6.6 7.7 6.2 5.6 6.8
Weighted N = 3,343 1,122 1,090 1,212 1,073Male
Yes 92.0 90.8 91.8 92.5 93.3
No 8.0 9.2 8.2 7.5 6.7
Weighted N = 1,118 415 439 549 511Female
Yes 94.1 93.2 95.2 96.0 93.1
No 5.9 6.8 4.8 4.0 6.9
Weighted N = 2,225 707 651 664 562
Source. The Monitoring the Future study, the University of Michigan.aIn 2004–2006, the HIV questions were included in two questionnaire forms. In 2007, these questions were added to a third
questionnaire form.bPercentages based on those reporting sex with one or more partners during the last 12 months. Those reporting no partners
are omitted.cThose respondents who report never having been tested for HIV are excluded from these percentages.
Have you ever been tested for HIV/AIDS? (Do not include tests that you may have had when donating blood or blood plasma.)
Did you receive the results of your most recent HIV/AIDS test? (We don’t want to know your test results.)
Condom Use in Last 12 Monthsb
TABLE 8aTest for HIV, Lifetime and Last 12 Months
by Frequency of Condom Useamong Respondents of Modal Ages 21–30 in 2004–2012 a Combined
(Entries are percentages.)
57
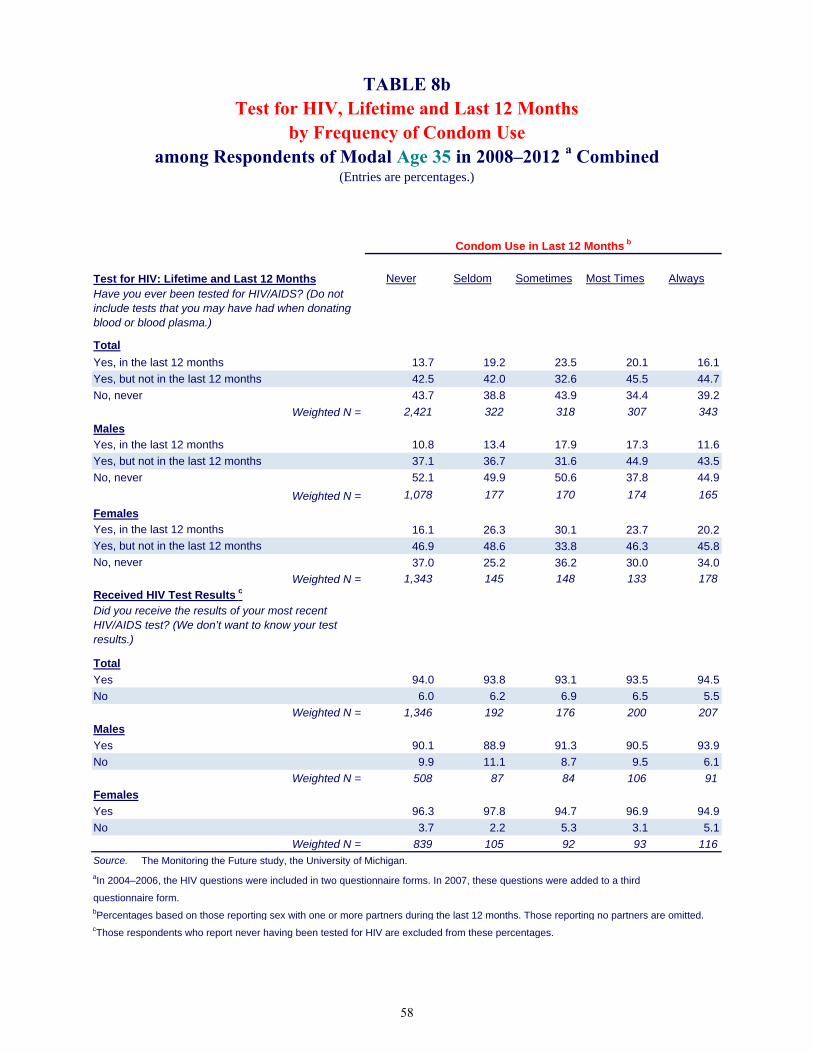
Test for HIV: Lifetime and Last 12 Months Never Seldom Sometimes Most Times Always
Total
Yes, in the last 12 months 13.7 19.2 23.5 20.1 16.1
Yes, but not in the last 12 months 42.5 42.0 32.6 45.5 44.7
No, never 43.7 38.8 43.9 34.4 39.2
Weighted N = 2,421 322 318 307 343
Males
Yes, in the last 12 months 10.8 13.4 17.9 17.3 11.6
Yes, but not in the last 12 months 37.1 36.7 31.6 44.9 43.5
No, never 52.1 49.9 50.6 37.8 44.9
Weighted N = 1,078 177 170 174 165
Females
Yes, in the last 12 months 16.1 26.3 30.1 23.7 20.2
Yes, but not in the last 12 months 46.9 48.6 33.8 46.3 45.8
No, never 37.0 25.2 36.2 30.0 34.0
Weighted N = 1,343 145 148 133 178
Received HIV Test Results c
Total
Yes 94.0 93.8 93.1 93.5 94.5
No 6.0 6.2 6.9 6.5 5.5
Weighted N = 1,346 192 176 200 207
Males
Yes 90.1 88.9 91.3 90.5 93.9
No 9.9 11.1 8.7 9.5 6.1
Weighted N = 508 87 84 106 91
Females
Yes 96.3 97.8 94.7 96.9 94.9
No 3.7 2.2 5.3 3.1 5.1
Weighted N = 839 105 92 93 116
Source. The Monitoring the Future study, the University of Michigan.
aIn 2004–2006, the HIV questions were included in two questionnaire forms. In 2007, these questions were added to a third
questionnaire form.bPercentages based on those reporting sex with one or more partners during the last 12 months. Those reporting no partners are omitted.cThose respondents who report never having been tested for HIV are excluded from these percentages.
Have you ever been tested for HIV/AIDS? (Do not include tests that you may have had when donating blood or blood plasma.)
Did you receive the results of your most recent HIV/AIDS test? (We don’t want to know your test results.)
Condom Use in Last 12 Months b
TABLE 8bTest for HIV, Lifetime and Last 12 Months
by Frequency of Condom Use
(Entries are percentages.)
among Respondents of Modal Age 35 in 2008–2012 a Combined
58
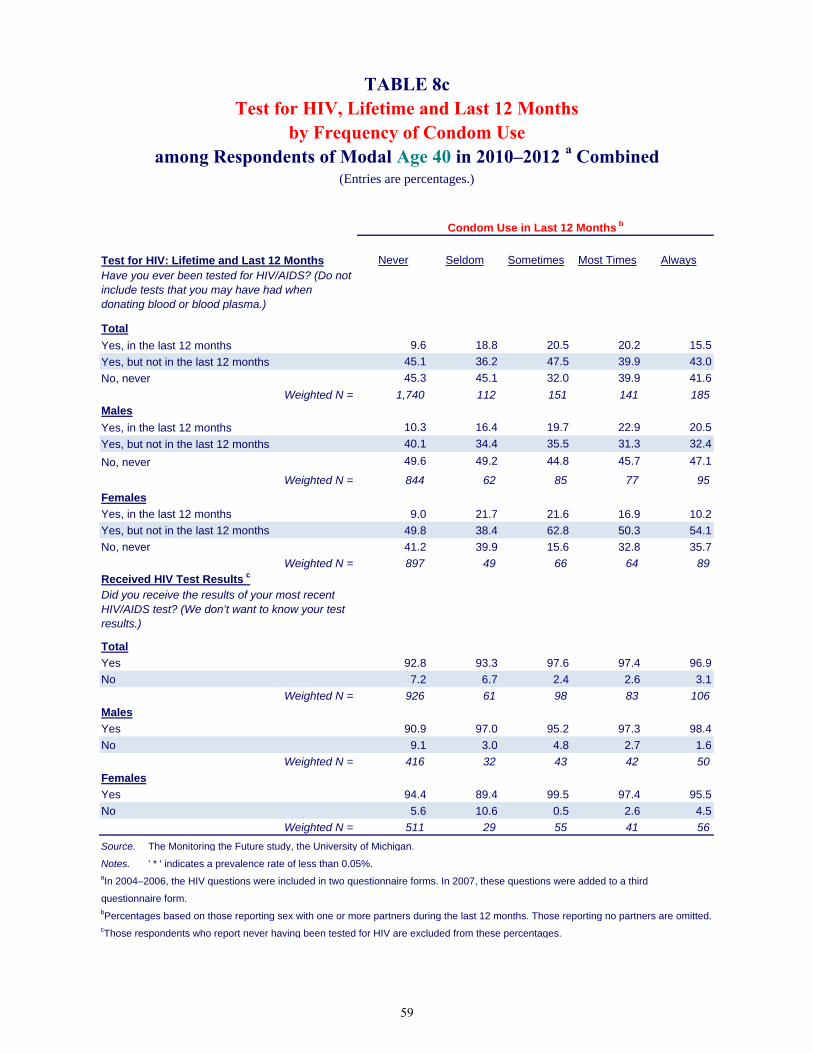
Test for HIV: Lifetime and Last 12 Months Never Seldom Sometimes Most Times Always
Total
Yes, in the last 12 months 9.6 18.8 20.5 20.2 15.5
Yes, but not in the last 12 months 45.1 36.2 47.5 39.9 43.0
No, never 45.3 45.1 32.0 39.9 41.6
Weighted N = 1,740 112 151 141 185Males
Yes, in the last 12 months 10.3 16.4 19.7 22.9 20.5
Yes, but not in the last 12 months 40.1 34.4 35.5 31.3 32.4
No, never 49.6 49.2 44.8 45.7 47.1
Weighted N = 844 62 85 77 95
Females
Yes, in the last 12 months 9.0 21.7 21.6 16.9 10.2
Yes, but not in the last 12 months 49.8 38.4 62.8 50.3 54.1
No, never 41.2 39.9 15.6 32.8 35.7
Weighted N = 897 49 66 64 89Received HIV Test Results c
Total
Yes 92.8 93.3 97.6 97.4 96.9
No 7.2 6.7 2.4 2.6 3.1
Weighted N = 926 61 98 83 106
Males
Yes 90.9 97.0 95.2 97.3 98.4
No 9.1 3.0 4.8 2.7 1.6
Weighted N = 416 32 43 42 50
Females
Yes 94.4 89.4 99.5 97.4 95.5
No 5.6 10.6 0.5 2.6 4.5
Weighted N = 511 29 55 41 56
Source. The Monitoring the Future study, the University of Michigan.
Notes. ' * ' indicates a prevalence rate of less than 0.05%.aIn 2004–2006, the HIV questions were included in two questionnaire forms. In 2007, these questions were added to a third
questionnaire form.bPercentages based on those reporting sex with one or more partners during the last 12 months. Those reporting no partners are omitted.cThose respondents who report never having been tested for HIV are excluded from these percentages.
Have you ever been tested for HIV/AIDS? (Do not include tests that you may have had when donating blood or blood plasma.)
Did you receive the results of your most recent HIV/AIDS test? (We don’t want to know your test results.)
Condom Use in Last 12 Months b
TABLE 8cTest for HIV, Lifetime and Last 12 Months
by Frequency of Condom Use
(Entries are percentages.)
among Respondents of Modal Age 40 in 2010–2012 a Combined
59

Test for HIV: Lifetime and Last 12 Months Never Seldom Sometimes Most Times Always
Total
Yes, in the last 12 months 23.7 29.3 30.4 29.2 20.0
Yes, but not in the last 12 months 27.5 23.3 22.7 21.9 16.5
No, never 48.8 47.4 46.9 49.0 63.5
Weighted N = 3,237 1,532 1,475 2,015 2,521Male
Yes, in the last 12 months 16.7 21.2 23.2 23.3 17.6
Yes, but not in the last 12 months 25.2 22.5 21.8 21.8 15.0
No, never 58.1 56.3 54.9 54.9 67.4
Weighted N = 1,321 677 712 1,050 1,386
Female
Yes, in the last 12 months 28.5 35.7 37.0 35.5 23.1
Yes, but not in the last 12 months 29.1 23.9 23.6 22.0 18.2
No, never 42.5 40.4 39.4 42.6 58.7Weighted N = 1,917 856 763 965 1,135
Source. The Monitoring the Future study, the University of Michigan.aIn 2004–2006, the HIV questions were included in two questionnaire forms. In 2007, these questions were added to a third
questionnaire form.
TABLE 8d
Have you ever been tested for HIV/AIDS? (Do not include tests that you may have had when donating blood or blood plasma.)
Test for HIV, Lifetime and Last 12 Monthsby Frequency of Condom Use
among Respondents who Report NOT Being Married among Respondents of Modal Ages 21–30 in 2004–2012 a Combined
(Entries are percentages.)
Condom Use in Last 12 Months b
60

Test for HIV: Lifetime and Last 12 MonthsNever Seldom Sometimes Most Times Always
Total
Yes, in the last 12 months 19.4 19.0 24.4 15.3 11.3
Yes, but not in the last 12 months 31.6 26.2 25.9 30.0 27.0
No, never 49.1 54.8 49.8 54.7 61.7
Weighted N = 3,338 723 613 426 406Male
Yes, in the last 12 months 14.8 12.0 19.3 13.3 11.3
Yes, but not in the last 12 months 26.4 23.2 23.1 25.5 23.1
No, never 58.9 64.8 57.5 61.2 65.6
Weighted N = 1,376 353 287 206 177
Female
Yes, in the last 12 months 22.6 25.7 28.8 17.1 11.3
Yes, but not in the last 12 months 35.2 29.1 28.3 34.2 30.0No, never 42.2 45.2 42.9 48.8 58.7
Weighted N = 1,962 371 326 221 229
Source. The Monitoring the Future study, the University of Michigan.aIn 2004–2006, the HIV questions were included in two questionnaire forms. In 2007, these questions were added to a third
questionnaire form.
TABLE 8e
by Frequency of Condom Use
Have you ever been tested for HIV/AIDS? (Do not
Test for HIV, Lifetime and Last 12 Months
among Respondents who Report Being Married among Respondents of Modal Ages 21–30 in 2004–2012 a Combined
(Entries are percentages.)
Condom Use in Last 12 Months b
61

Chapter 8: Intersection of Risk and Protective Behaviors
Chapter 8
INTERSECTION OF RISK AND PROTECTIVE BEHAVIORS
It is useful to know whether people who are at higher risk of contracting or transmitting HIV are more likely to undertake protective behaviors than those at lower risk. In this chapter we examine the frequency of condom use as a function of the number of partners the respondent reported having in the prior 12 months, the gender of those partners, and the history of sharing needles. We also look at the prevalence of getting tested as a function of the number of partners reported, the gender of those partners, and the history of sharing needles.
Frequency of Condom Use by Number of Partners
Among young adults, both the prevalence and frequency of condom use rise with the number of sexual partners the respondent had in the last 12 months; this holds true for both genders (Table 9a).
Only about one third (33%) of sexually active young adults said that they used a condom “most times” or “always”—37% of males and 29% of females (Table 6a). This statistic rises considerably with the number of partners reported (Table 9a).
As might be expected, many of the young adults not using condoms are respondents who had only one partner during the year (Table 9a). Among those reporting only one partner (the majority of all respondents), 51% said they did not use condoms at all in the last 12 months. That statistic fell by more than half among those reporting two partners (to 20%); it fell further among those reporting three or four partners (to 13%), and still further among those reporting five or more partners (11%).
In sum, use of condoms, which help prevent exposure to and transmission of HIV (and
many other sexually transmitted diseases), is considerably more prevalent among young adults who are at heightened risk due to the number of sexual partners they have. That is the encouraging part of this finding. However, only 54% of those reporting five or more sexual partners in the last 12 months also report using condoms “most times” or “always,” leaving a considerable portion of this population at risk.
Among 35- and 40-year-olds there is a similar increase in the prevalence and frequency of condom use as a function of the number of sexual partners reported (Tables 9b and 9c).
The prevalence of condom use declines sharply with increasing age, very likely a result of more respondents being married or in another committed relationship at these later ages. Among 35- and 40-year-olds, the case counts become quite low for people reporting a relatively high number of partners.
62

Monitoring the Future Frequency of Condom Use by Gender of Partners
Considerable efforts have been made in past years to encourage the use of condoms by men who have sex with men (MSM), as one attempt to stem the spread of HIV/AIDS in this high-risk population. While the numbers of such cases available for analysis so far are quite limited (among the 21- to 30-year olds, the weighted N is 329 who report having sex with men exclusively), results suggest that the use of condoms in this population (39% reporting “most times” or “always”) is only a little higher than in the population of men reporting sex exclusively with women (37% reporting “most times” or “always”) in the last 12 months. Similar proportions of both groups (40% and 36%, respectively) report never using condoms (Table 10a). The rate of condom use among men having sex only with women is likely suppressed some by the proportion seeking to conceive a child.
Among 35- and 40-year-olds, similar rates of condom use among MSM and men who have sex only with women hold, although the case counts for men who have sex with men exclusively are still quite low among the 40-year-olds (Tables 10b and 10c).
As would be expected, the great majority of young adult women who had sex exclusively with women in the last 12 months report not using condoms during the prior year (82%) vs. 44% of those having sex exclusively with men. (Condoms are seldom used with oral sex.) Among women reporting having sex with both genders during the year, only 27% report no use of condoms.
The case counts are still too small for 35- and 40-year-olds to make these comparisons (Tables 10b and 10c).
Frequency of Condom Use by Needle Sharing
The association between needle sharing and condom use is not very clear; there is a suggestion that those who reported some sharing in their lifetime may be less likely to have used condoms most times or always when they had sexual intercourse in the last 12 months. Given that condom use is dependent on a variety of factors such as gender, gender of partners, number of partners, marital status, etc., it is difficult to draw clear inferences from the association with needle sharing, particularly given the small numbers of cases (Table 11).
There are too few cases for needle-sharing among 35- and 40-year-olds to report on differences in condom use, so no tables are provided.
Getting Tested for HIV by Number of Partners
Among young adults, the prevalence of getting tested for HIV rises with the number of partners reported in the last 12 months (Table 12a). While only 6.2% of those reporting no partners in the last 12 months say that they have been tested in the last 12 months, the rate rises to 20% of those reporting one partner, 30% for those reporting two partners, and up to 38% for those reporting five or more partners.
63

Chapter 8: Intersection of Risk and Protective Behaviors
The proportion of young adults getting the results of their tests is very high in all groups (Table 12a).
It thus appears that those young adults at increased risk because of the number of sexual partners they have had are more likely to exhibit the protective behaviors of getting tested and securing the results of the test. However, about two thirds of those reporting multiple partners did not have an HIV test in the last 12 months (Table 12a).
Among the 35-year-olds and 40-year-olds, the proportion getting tested also rises with the number of partners in the last 12 months; the prevalence rates are about the same as among the young adults (Tables 12b and 12c).
Getting Tested for HIV by Gender of Partners
Because men who have sex with men are at particular risk for contracting and transmitting HIV, we examined if HIV testing was more prevalent among this group (Table 13a). While the number of young adult cases of men who have sex exclusively with men is small (330 weighted cases), the results are suggestive of increased vigilance in this population. Two thirds (68%) of males having exclusively male partners in the last 12 months indicated being tested for HIV at some time, and about four in every ten (41%) said that they had been tested in the past year. These rates compare to 39% and 17%, respectively, among men who had female partners exclusively during the past year. Hardly any (2%) of the males reporting relations exclusively with other men in the past year said that they failed to get the results of their most recent test, versus 8% of those who had only female partners.
Similar differences appear among 35-year-old men (Table 13b), though the case counts are very limited and thus the results are only suggestive at this point.
Getting Tested for HIV by Needle Sharing
Young adults who have shared needles in their lifetime are considerably more likely to report having been tested for HIV both in their lifetime and in the last 12 months than those who have never shared needles. Those who have shared needles in the past year are also significantly more likely to report getting tested for HIV during the last 12 months than those who did not share needles during the last 12 months (Table 14).
Thus, one of the highest risk groups for HIV infection—those who have shared needles—are among the most likely to exhibit the protective behavior of getting tested for HIV; they may also be less likely to use condoms. Another very high risk group—men having sex with men—use condoms at about the same rate as men having sex exclusively with women; but they do get tested more frequently. Fortunately, those at higher than average risk due to their number of sex partners, are more likely to engage in both protective behaviors. This has been a summary of the prevalence of risk and protective behaviors associated with the spread of HIV among young adults in the general population, and of the intersection of these various risk and protective behaviors. Starting in the next chapter, we consider the extent to which there has been change in these risk and protective behaviors since 2004.
64

Three Five
Frequency of Condom Use in Last 12 Months b None One Two or Four or More
Total
Never — 50.5 20.2 13.3 10.9
Seldom — 13.0 16.7 16.5 13.6
Sometimes — 10.5 17.3 18.2 21.6
Most times — 9.3 21.5 32.3 36.4
Always — 16.7 24.3 19.7 17.6
Weighted N = — 11,638 1,870 1,802 1,038Male
Never — 46.5 17.9 13.0 10.9 Seldom — 13.3 14.3 16.0 12.2 Sometimes — 11.0 15.5 17.6 20.7 Most times — 10.5 21.8 30.2 36.3 Always — 18.6 30.6 23.2 19.9
Weighted N = — 5,067 852 951 693Female
Never — 53.6 22.2 13.6 10.7 Seldom — 12.8 18.6 17.1 16.5 Sometimes — 10.1 18.9 18.9 23.4 Most times — 8.4 21.2 34.7 36.5 Always — 15.2 19.0 15.8 12.9
Weighted N = — 6,571 1,018 850 344
Source. The Monitoring the Future study, the University of Michigan.
Notes. ' — ' indicates not applicable.aIn 2004–2006, the HIV questions were included in two questionnaire forms. In 2007, these questions were added to a
third questionnaire form.
partners are omitted.
bPercentages based on those reporting sex with one or more partners during the last 12 months. Those reporting no
TABLE 9aCondom Use by Number of Sex Partners in Last 12 Months
among Respondents of Modal Ages 21–30 in 2004–2012 a Combined(Entries are percentages.)
Number of Partners in Last 12 Months
When you had sexual intercourse during the LAST 12 MONTHS, how often were condoms used? (This includes vaginal and anal sex, but not oral sex.)
65

Three Five
Frequency of Condom Use in Last 12 Months b None One Two or Four or More
Total
Never — 71.3 33.5 23.5 11.2
Seldom — 7.8 14.6 11.4 20.3
Sometimes — 7.3 16.3 17.5 18.6
Most times — 5.6 17.1 27.6 38.4
Always — 8.0 18.5 20.0 11.5
Weighted N = — 3,230 191 204 91
Males
Never — 68.1 36.2 17.9 6.4Seldom — 9.0 15.4 12.3 23.2Sometimes — 8.2 18.4 18.3 18.0Most times — 6.8 12.5 29.8 38.4Always — 7.9 17.5 21.7 14.1
Weighted N = — 1,504 79 117 64
FemalesNever — 74.0 31.6 31.1 22.8Seldom — 6.7 14.0 10.2 13.3Sometimes — 6.5 14.8 16.4 19.9Most times — 4.6 20.4 24.6 38.6Always — 8.2 19.2 17.7 5.5
Weighted N = — 1,726 112 87 27
Source. The Monitoring the Future study, the University of Michigan.
Notes. ' — ' indicates not applicable.aIn 2008, the HIV questions were added to one half of the questionnaires administered to the 35-year-old respondents.
In 2009 and after, these questions were included in all questionnaires for this group.
are omitted.
bPercentages based on those reporting sex with one or more partners during the last 12 months. Those reporting no partners
TABLE 9bCondom Use by Number of Sex Partners in Last 12 Months
(Entries are percentages.)
Number of Partners in Last 12 Months
among Respondents of Modal Age 35 in 2008–2012 a Combined
When you had sexual intercourse during the LAST 12 MONTHS, how often were condoms used? (This includes vaginal and anal sex, but not oral sex.)
66

Three Five
Frequency of Condom Use in Last 12 Months b None One Two or Four or More
Total
Never — 79.4 48.3 40.2 23.4
Seldom — 3.9 11.2 14.3 8.6
Sometimes — 5.1 15.0 21.9 15.0
Most times — 4.1 13.5 14.3 39.8
Always — 7.5 12.0 9.3 13.2
Weighted N = — 2,059 130 86 62
MalesNever — 78.4 47.8 39.5 19.7Seldom — 3.8 18.7 17.0 8.0Sometimes — 6.3 8.7 18.4 14.9Most times — 4.0 14.1 12.1 40.9Always — 7.4 10.7 13.0 16.4
Weighted N = — 1,003 62 53 50
FemalesNever — 80.4 48.7 41.3 38.5Seldom — 3.9 4.4 10.2 11.1Sometimes — 3.9 20.8 27.3 15.1Most times — 4.2 12.9 17.7 35.3Always — 7.5 13.2 3.5 *
Weighted N = — 1,056 68 33 12
Source. The Monitoring the Future study, the University of Michigan.
Notes. ' — ' indicates not applicable. ' * ' indicates a prevalence rate of less than 0.05%.aThe HIV questions were added to the questionnaires for 40-year-olds beginning in 2010.
are omitted.
bPercentages based on those reporting sex with one or more partners during the last 12 months. Those reporting no partners
TABLE 9cCondom Use by Number of Sex Partners in Last 12 Months
(Entries are percentages.)
Number of Partners in Last 12 Months
among Respondents of Modal Age 40 in 2010–2012 a Combined
When you had sexual intercourse during the LAST 12 MONTHS, how often were condoms used? (This includes vaginal and anal sex, but not oral sex.)
67

Female Male Male and Male Female Male and
Only Only Female Only Only Female
Frequency of Condom Use in Last 12 Months b
Never 35.8 39.6 17.6 44.0 81.5 27.1
Seldom 13.8 9.9 16.6 14.2 5.5 10.7
Sometimes 13.3 11.3 14.1 12.6 4.2 16.7
Most times 16.3 19.5 33.8 13.5 4.1 25.5
Always 20.8 19.7 17.9 15.7 4.8 19.9
Weighted N = 7,179 329 69 8,449 176 164
Source. The Monitoring the Future study, the University of Michigan.aIn 2004–2006, the HIV questions were included in two questionnaire forms. In 2007, these questions were added to a third
questionnaire form.bPercentages based on those reporting sex with one or more partners during the last 12 months. Those reporting no
partners are omitted.
When you had sexual intercourse during the LAST 12 MONTHS, how often were condoms used? (This includes vaginal and anal sex, but not oral sex.)
Gender of Partner(s) Gender of Partner(s)
TABLE 10aCondom Use by Gender of Sex Partners in Last 12 Months
among Respondents of Modal Ages 21–30 in 2004–2012 a Combined(Entries are percentages.)
MALE RESPONDENTS FEMALE RESPONDENTS
68

Female Male Male and Male Female Male and
Only Only Female Only Only Female
Frequency of Condom Use in Last 12 Months b
Never 61.8 45.1 † 69.1 † †
Seldom 10.1 7.3 † 7.5 † †
Sometimes 9.5 5.2 † 7.6 † †
Most times 9.4 21.6 † 6.8 † †
Always 9.1 20.8 † 9.0 † †
Weighted N = 1,688 59 13 1,897 35 18
Source. The Monitoring the Future study, the University of Michigan.
Notes. ' † ' indicates that the sample size is too limited to provide reliable estimates.aIn 2008, the HIV questions were added to one half of the questionnaires administered to the 35-year-old respondents. In 2009
and after, these questions were included in all questionnaires for this group.bPercentages based on those reporting sex with one or more partners during the last 12 months. Those reporting no partners are
omitted.
When you had sexual intercourse during the LAST 12 MONTHS, how often were condoms used? (This includes vaginal and anal sex, but not oral sex.)
Gender of Partner(s) Gender of Partner(s)
TABLE 10bCondom Use by Gender of Sex Partners in Last 12 Months
among Respondents of Modal Age 35 in 2008–2012 a Combined(Entries are percentages.)
MALE RESPONDENTS FEMALE RESPONDENTS
69
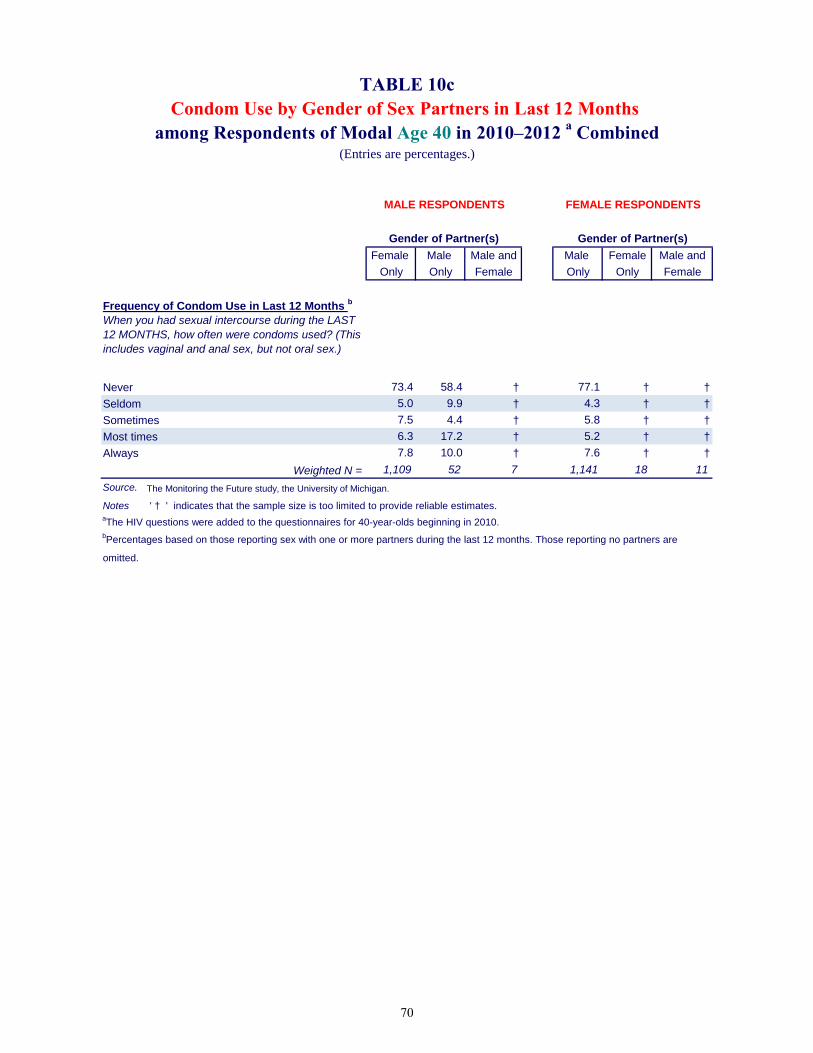
Female Male Male and Male Female Male and
Only Only Female Only Only Female
Frequency of Condom Use in Last 12 Months b
Never 73.4 58.4 † 77.1 † †
Seldom 5.0 9.9 † 4.3 † †
Sometimes 7.5 4.4 † 5.8 † †
Most times 6.3 17.2 † 5.2 † †
Always 7.8 10.0 † 7.6 † †
Weighted N = 1,109 52 7 1,141 18 11
Source. The Monitoring the Future study, the University of Michigan.
Notes ' † ' indicates that the sample size is too limited to provide reliable estimates.aThe HIV questions were added to the questionnaires for 40-year-olds beginning in 2010.bPercentages based on those reporting sex with one or more partners during the last 12 months. Those reporting no partners are
omitted.
When you had sexual intercourse during the LAST 12 MONTHS, how often were condoms used? (This includes vaginal and anal sex, but not oral sex.)
Gender of Partner(s) Gender of Partner(s)
TABLE 10cCondom Use by Gender of Sex Partners in Last 12 Months
among Respondents of Modal Age 40 in 2010–2012 a Combined(Entries are percentages.)
MALE RESPONDENTS FEMALE RESPONDENTS
70
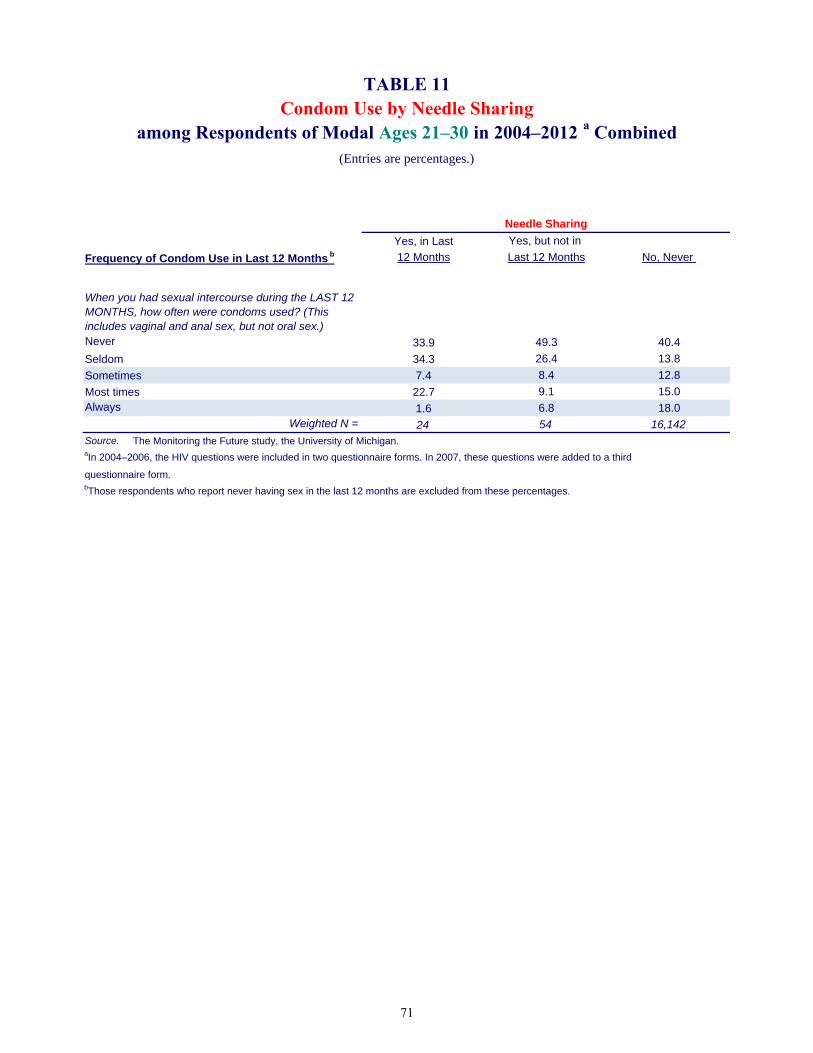
Yes, in Last Yes, but not in
Frequency of Condom Use in Last 12 Months b 12 Months Last 12 Months No, Never
Never 33.9 49.3 40.4
Seldom 34.3 26.4 13.8
Sometimes 7.4 8.4 12.8
Most times 22.7 9.1 15.0Always 1.6 6.8 18.0
Weighted N = 24 54 16,142
Source. The Monitoring the Future study, the University of Michigan.aIn 2004–2006, the HIV questions were included in two questionnaire forms. In 2007, these questions were added to a third
questionnaire form.bThose respondents who report never having sex in the last 12 months are excluded from these percentages.
Needle Sharing
When you had sexual intercourse during the LAST 12 MONTHS, how often were condoms used? (This includes vaginal and anal sex, but not oral sex.)
TABLE 11Condom Use by Needle Sharing
among Respondents of Modal Ages 21–30 in 2004–2012 a Combined(Entries are percentages.)
71

Three Five
Test for HIV: Lifetime and Last 12 Months None One Two or Four or More
Yes, in the last 12 months 6.2 19.6 29.8 33.0 37.9
Yes, but not in the last 12 months 10.6 26.4 22.0 20.8 20.0
No, never 83.2 54.0 48.3 46.2 42.0
Weighted N = 2,843 11,781 1,884 1,810 1,040
Received HIV Test Results b
Yes 89.4 93.4 91.6 93.2 96.2
No 10.6 6.6 8.4 6.8 3.8
Weighted N = 465 5,359 962 969 591
Source. The Monitoring the Future study, the University of Michigan.aIn 2004–2006, the HIV questions were included in two questionnaire forms. In 2007, these questions were added to a
third questionnaire form.bThose respondents who report never having been tested for HIV are excluded from these percentages.
Have you ever been tested for HIV/AIDS? (Do not include tests that you may have had when donating blood or blood plasma.)
Did you receive the results of your most recent HIV/AIDS test? (We don’t want to know your test results.)
Number of Partners in Last 12 Months
TABLE 12aTest for HIV, Lifetime and Last 12 Months
by Number of Sex Partners in Last 12 Monthsamong Respondents of Modal Ages 21–30 in 2004–2012 a Combined
(Entries are percentages.)
72

Three Five
Test for HIV: Lifetime and Last 12 Months None One Two or Four or More
Yes, in the last 12 months 8.9 13.7 23.9 32.1 39.4
Yes, but not in the last 12 months 22.2 42.2 42.9 38.0 43.0
No, never 68.9 44.1 33.2 29.9 17.6
Weighted N = 373 3,253 193 204 89
Received HIV Test Results b
Yes 92.3 93.9 93.0 96.8 89.9
No 7.7 6.1 7.0 3.2 10.1
Weighted N = 110 1,791 128 142 74
Source. The Monitoring the Future study, the University of Michigan.
aIn 2008, the HIV questions were added to one half of the questionnaires administered to the 35-year-old respondents.
In 2009 and after, these questions were included in all questionnaires for this group.bThose respondents who report never having been tested for HIV are excluded from these percentages.
Have you ever been tested for HIV/AIDS? (Do not include tests that you may have had when donating blood or blood plasma.)
Did you receive the results of your most recent HIV/AIDS test? (We don’t want to know your test results.)
Number of Partners in Last 12 Months
TABLE 12bTest for HIV, Lifetime and Last 12 Months
by Number of Sex Partners in Last 12 Monthsamong Respondents of Modal Age 35 in 2008–2012 a Combined
(Entries are percentages.)
73
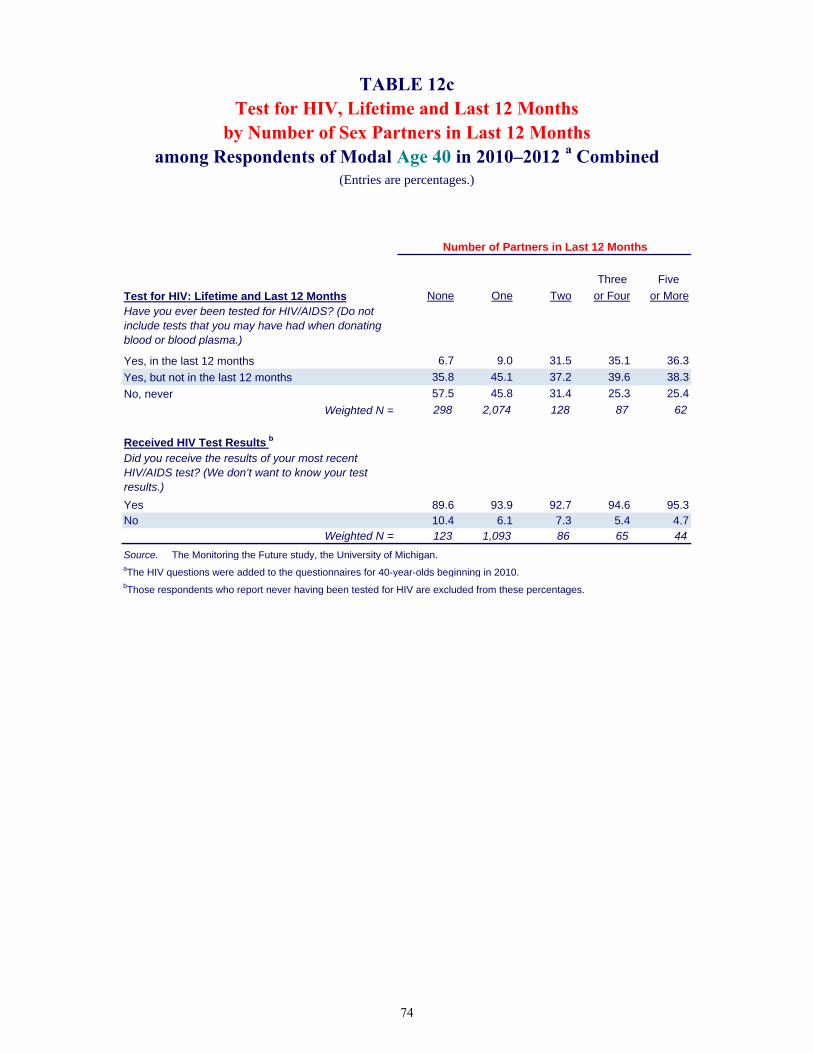
Three Five
Test for HIV: Lifetime and Last 12 Months None One Two or Four or More
Yes, in the last 12 months 6.7 9.0 31.5 35.1 36.3
Yes, but not in the last 12 months 35.8 45.1 37.2 39.6 38.3
No, never 57.5 45.8 31.4 25.3 25.4
Weighted N = 298 2,074 128 87 62
Received HIV Test Results b
Yes 89.6 93.9 92.7 94.6 95.3No 10.4 6.1 7.3 5.4 4.7
Weighted N = 123 1,093 86 65 44
Source. The Monitoring the Future study, the University of Michigan.aThe HIV questions were added to the questionnaires for 40-year-olds beginning in 2010.bThose respondents who report never having been tested for HIV are excluded from these percentages.
Have you ever been tested for HIV/AIDS? (Do not include tests that you may have had when donating blood or blood plasma.)
Did you receive the results of your most recent HIV/AIDS test? (We don’t want to know your test results.)
Number of Partners in Last 12 Months
TABLE 12cTest for HIV, Lifetime and Last 12 Months
by Number of Sex Partners in Last 12 Monthsamong Respondents of Modal Age 40 in 2010–2012 a Combined
(Entries are percentages.)
74
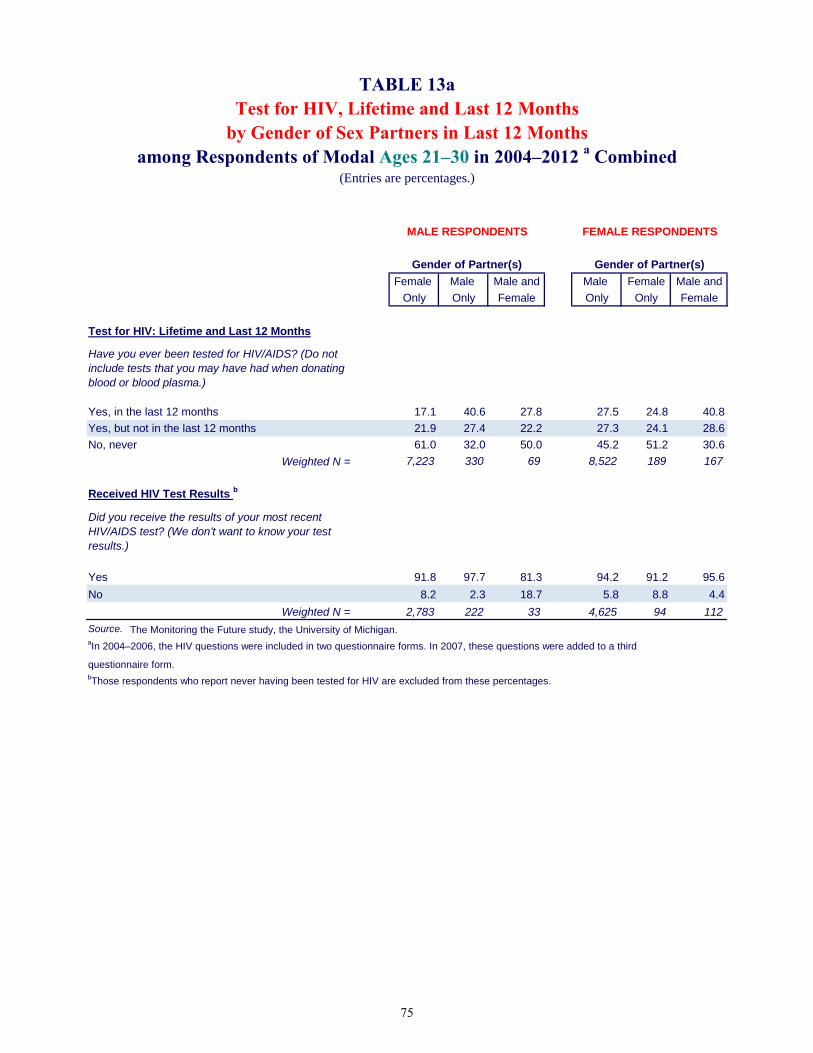
Female Male Male and Male Female Male and
Only Only Female Only Only Female
Test for HIV: Lifetime and Last 12 Months
Yes, in the last 12 months 17.1 40.6 27.8 27.5 24.8 40.8
Yes, but not in the last 12 months 21.9 27.4 22.2 27.3 24.1 28.6
No, never 61.0 32.0 50.0 45.2 51.2 30.6
Weighted N = 7,223 330 69 8,522 189 167
Received HIV Test Results b
Yes 91.8 97.7 81.3 94.2 91.2 95.6
No 8.2 2.3 18.7 5.8 8.8 4.4
Weighted N = 2,783 222 33 4,625 94 112
Source. The Monitoring the Future study, the University of Michigan.aIn 2004–2006, the HIV questions were included in two questionnaire forms. In 2007, these questions were added to a third
questionnaire form.bThose respondents who report never having been tested for HIV are excluded from these percentages.
Have you ever been tested for HIV/AIDS? (Do not include tests that you may have had when donating blood or blood plasma.)
Did you receive the results of your most recent HIV/AIDS test? (We don’t want to know your test results.)
Gender of Partner(s) Gender of Partner(s)
TABLE 13aTest for HIV, Lifetime and Last 12 Months
by Gender of Sex Partners in Last 12 Monthsamong Respondents of Modal Ages 21–30 in 2004–2012 a Combined
(Entries are percentages.)
MALE RESPONDENTS FEMALE RESPONDENTS
75
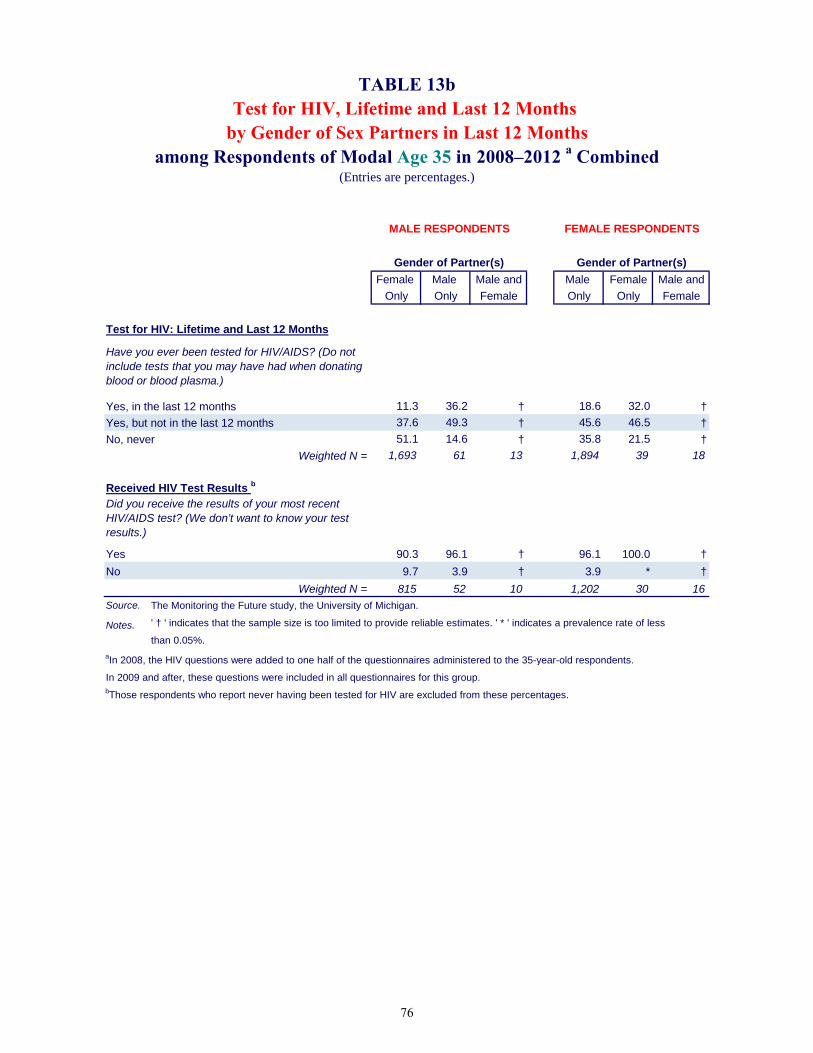
Female Male Male and Male Female Male and
Only Only Female Only Only Female
Test for HIV: Lifetime and Last 12 Months
Yes, in the last 12 months 11.3 36.2 † 18.6 32.0 †
Yes, but not in the last 12 months 37.6 49.3 † 45.6 46.5 †
No, never 51.1 14.6 † 35.8 21.5 †
Weighted N = 1,693 61 13 1,894 39 18
Received HIV Test Results b
Yes 90.3 96.1 † 96.1 100.0 †
No 9.7 3.9 † 3.9 * †
Weighted N = 815 52 10 1,202 30 16
Source. The Monitoring the Future study, the University of Michigan.
Notes. ' † ' indicates that the sample size is too limited to provide reliable estimates. ' * ' indicates a prevalence rate of less
than 0.05%.
aIn 2008, the HIV questions were added to one half of the questionnaires administered to the 35-year-old respondents.
In 2009 and after, these questions were included in all questionnaires for this group.bThose respondents who report never having been tested for HIV are excluded from these percentages.
Have you ever been tested for HIV/AIDS? (Do not include tests that you may have had when donating blood or blood plasma.)
Did you receive the results of your most recent HIV/AIDS test? (We don’t want to know your test results.)
Gender of Partner(s) Gender of Partner(s)
TABLE 13bTest for HIV, Lifetime and Last 12 Months
by Gender of Sex Partners in Last 12 Monthsamong Respondents of Modal Age 35 in 2008–2012 a Combined
(Entries are percentages.)
MALE RESPONDENTS FEMALE RESPONDENTS
76

Female Male Male and Male Female Male and
Only Only Female Only Only Female
Test for HIV: Lifetime and Last 12 Months
Yes, in the last 12 months 10.9 49.7 † 10.5 † †
Yes, but not in the last 12 months 38.7 29.2 † 50.8 † †
No, never 50.4 21.2 † 38.7 † †
Weighted N = 1,105 53 7 1,142 19 11
Received HIV Test Results b
Yes 92.4 96.2 † 94.8 † †
No 7.6 3.8 † 5.2 † †
Weighted N = 536 42 6 678 11 5
Source. The Monitoring the Future study, the University of Michigan.
Notes. ' † ' indicates that the sample size is too limited to provide reliable estimates. aThe HIV questions were added to the questionnaires for 40-year-olds beginning in 2010.bThose respondents who report never having been tested for HIV are excluded from these percentages.
Have you ever been tested for HIV/AIDS? (Do not include tests that you may have had when donating blood or blood plasma.)
Did you receive the results of your most recent HIV/AIDS test? (We don’t want to know your test results.)
Gender of Partner(s) Gender of Partner(s)
TABLE 13cTest for HIV, Lifetime and Last 12 Months
by Gender of Sex Partners in Last 12 Monthsamong Respondents of Modal Age 40 in 2010–2012 a Combined
(Entries are percentages.)
MALE RESPONDENTS FEMALE RESPONDENTS
77

Test for HIV: Lifetime and Last 12 Months
Yes, in the last 12 months
Yes, but not in the last 12 months No, never
Yes, in the last 12 months 43.3 40.8 20.7
Yes, but not in the last 12 months 16.1 37.8 22.8
No, never 40.6 21.4 56.5
Weighted N = 27 63 19,126
Source. The Monitoring the Future study, the University of Michigan.aIn 2004–2006, the HIV questions were included in two questionnaire forms. In 2007, these questions were added to a third
questionnaire form.
Have you ever been tested for HIV/AIDS? (Do not include tests that you may have had when donating blood or blood plasma.)
TABLE 14Testing for HIV by Needle Sharing
among Respondents of Modal Ages 21–30 in 2004–2012 a Combined(Entries are percentages.)
Needle Sharing
78

Chapter 9: Trends in the Prevalence and Frequency of Risk Behaviors
Chapter 9
TRENDS IN THE PREVALENCE AND FREQUENCY OF RISK BEHAVIORS
We believe there is considerable value in tracking change in the prevalence of the various risk and protective behaviors related to the spread of HIV. While the numbers of cases available are still limited, especially for estimating the intersection of some of the rarer behaviors like needle sharing and men having sex with men, ongoing data collections should allow us to provide more in-depth consideration of important subgroups and correlates, and most importantly, to monitor the behaviors over time. Adding the relevant questions to additional questionnaire forms in the surveys of young adults has facilitated those efforts. This is not possible for respondents ages 35 and 40, however, because only a single questionnaire form is used at these ages. The 2012 MTF data collection is the ninth to include the set of questions on HIV risk and protective behaviors among young adults ages 21 to 30. We present the trend data in this chapter and the next using two-year moving averages in order to smooth the trend estimates and reduce fluctuations due primarily to sampling error. This is done by taking an arithmetic average of (a) the results for the year labeled at the top of each column in Tables 15 and 16, and (b) the results from the prior year.5 In Tables 15a, 16a, and in the top panels of Figures 1 through 5, very little change can be seen among young adults ages 21–30 in any of the risk behaviors under study from 2005 to 2012. Indeed, the level of replication of the results is very high, which serves as evidence of the reliability of these estimates. These points are elaborated below. Table 15a and Figures 1–5 show no systematic change over the interval 2005–2012 among 21- to 30-year-olds in the prevalence of frequency of past-year injection drug use and particularly in needle sharing. The prevalence of both of these behaviors has consistently been very low. Among 35-year-olds the trend lines are less smooth, most likely because they are based on considerably fewer cases than the estimates for young adults (Table 15b and the lower panels in Figures 1–3).6 Nonetheless, some evidence suggests there may have been changes in some of the rates. Females appear to show a rising trend in lifetime prevalence of injection drug use, and males appear to show a rising trend in annual prevalence of injection drug use and in needle sharing between 2009 and 2011. These behaviors remained at quite low rates, however. Lifetime
5The annual sample size increased in 2007 due to the inclusion of this set of questions in an additional questionnaire form; but the 2006 and 2007 data are weighted equally in calculating the two-year moving average for 2007. 6The numbers of cases that underlie the annual estimates for both age groups may be found in the trend tables—for example, in Tables 15a and 15b. They show that the estimates for young adults are based on between 3,400 and 4,900 cases each year, whereas the estimates for 35-year-olds are based on between 1,400 and 1,900 cases.
79

Monitoring the Future
injection drug use was up among some among females from 0.4% in 2009 to 1.1% in 2011, whereas annual injection drug use was up among males from 0.3% in 2009 to 0.9% in 2011, as was lifetime prevalence of needle sharing among males (from 0.1% in 2009 to 0.7% in 2011). All the trends and differences are nonsignificant, however, and did not continue into 2012. We will feel more confident that these could be real trends after we have additional years of data In Table 16a and Figure 4 young adults show no systematic change over the same interval (2005–2012) in the prevalence of having more than one sex partner in the prior year. Among 35-year-olds (Table 16b and Figure 4, lower panel) there is also little evidence of systematic change. Each year, over 75% of 35-year-olds of both genders report having only one partner in the year—a higher proportion than among young adults. And in the four years shown, only 11%–12% indicated that they had multiple partners, compared with about 24% among the young adults. Thus, this risk factor clearly declines with age. The proportions of young adult respondents reporting sex with partners of the same gender during the prior year also showed no systematic change (Table 16a and Figure 5). Each year between 3.9% to 5.0% of the men indicated having sex exclusively with other men. (Among women, between 1.8% to 2.4% indicated having sex exclusively with other women; this is not generally viewed as a risk behavior for HIV transmission.) Among 35-year-olds, compared to the young adults, the rates of exclusively same-gender sex are lower for males (between 3.3% and 3.8%) but about the same for females (between 1.3% and 2.3%). Figure 5 suggests that there has been little systematic change over the three-year interval studied. To summarize, in the young adult population (ages 21–30 and 35) there has been considerable stability in recent years in the major risk behaviors under study here—drug injecting, sharing needles, having multiple sex partners, and men having sex with men.
80

Lifetime Frequency of Injecting Drugs 2004 2005 2006 2007 2008 2009 2010 2011 2012 2004 2005 2006 2007 2008 2009 2010 2011 2012 2004 2005 2006 2007 2008 2009 2010 2011 2012
0 Occasions — 98.5 98.5 98.3 98.2 98.4 98.5 98.4 98.4 — 97.9 97.7 97.4 97.3 97.5 97.9 97.6 97.7 — 99.1 99.2 99.0 99.1 99.1 99.0 99.0 99.1
1–2 — 0.5 0.5 0.6 0.5 0.5 0.5 0.4 0.4 — 0.6 0.6 0.7 0.7 0.8 0.5 0.4 0.4 — 0.3 0.5 0.5 0.3 0.3 0.4 0.4 0.3
3–5 — 0.2 0.2 0.3 0.3 0.2 0.2 0.2 0.2 — 0.2 0.3 0.5 0.5 0.4 0.3 0.3 0.4 — 0.2 0.1 0.1 0.1 0.1 0.1 0.1 *
6–9 — 0.1 0.2 0.2 0.2 0.1 0.2 0.2 0.1 — 0.1 0.3 0.4 0.3 0.2 0.3 0.4 0.1 — * * * * * 0.1 0.1 *
10–19 — 0.3 0.2 0.2 0.2 0.2 0.1 0.1 0.1 — 0.5 0.4 0.4 0.4 0.3 0.2 0.2 0.2 — * * 0.1 0.1 0.1 * * *
20–39 — 0.1 0.1 0.1 0.2 0.2 0.1 0.1 0.2 — 0.2 0.2 0.3 0.4 0.3 0.1 0.3 0.3 — * * * 0.1 0.1 * * *
40+ Occasions — 0.4 0.3 0.3 0.4 0.5 0.5 0.6 0.6 — 0.5 0.5 0.4 0.4 0.6 0.6 0.8 0.9 — 0.3 0.2 0.2 0.4 0.4 0.4 0.4 0.5
Weighted N = — 3,643 3,441 4,076 4,856 4,838 4,765 4,634 4,523 — 1,727 1,615 1,904 2,282 2,296 2,255 2,160 2,109 — 1,916 1,826 2,172 2,574 2,542 2,511 2,474 2,414
Annual Frequency of Injecting Drugs
0 Occasions — 99.5 99.6 99.6 99.5 99.5 99.5 99.5 99.5 — 99.2 99.3 99.2 99.3 99.3 99.3 99.2 99.2 — 99.7 99.9 99.8 99.7 99.7 99.7 99.7 99.7
1–2 — 0.1 0.1 0.1 0.1 0.1 0.1 0.1 0.1 — 0.2 0.2 0.2 0.1 0.1 0.1 0.1 0.2 — 0.1 * 0.1 0.1 0.1 0.1 0.1 0.1
3–5 — * 0.1 * * 0.1 0.1 0.1 0.1 — * 0.1 0.1 * 0.1 0.2 0.2 0.1 — * * * * * * * *
6–9 — * 0.1 0.1 0.2 0.1 * * 0.1 — * 0.1 0.2 0.3 0.2 * * 0.1 — * * * * * * * *
10–19 — 0.1 0.1 0.1 0.1 * * * * — 0.2 0.2 0.1 0.1 * * 0.1 0.1 — * * * * * * * *
20–39 — * * * 0.1 0.1 0.1 0.1 * — 0.1 * * 0.1 0.2 0.2 0.1 0.1 — * * * 0.1 0.1 * * *
40+ Occasions — 0.2 0.1 0.1 0.1 0.2 0.1 0.2 0.2 — 0.2 0.1 0.1 0.1 0.2 0.2 0.3 0.3 — 0.2 0.1 * 0.1 0.1 0.1 0.1 0.1
Weighted N = — 3,644 3,441 4,077 4,857 4,839 4,767 4,639 4,528 — 1,727 1,615 1,905 2,282 2,296 2,256 2,163 2,111 — 1,917 1,826 2,172 2,575 2,543 2,511 2,476 2,417
Lifetime and Annual Needle Sharing
Yes, in the last 12 months — 0.1 0.1 0.1 0.1 0.2 0.2 0.1 0.2 — 0.1 0.2 0.2 0.1 0.3 0.1 0.1 0.2 — 0.1 0.1 0.1 0.2 0.2 0.2 0.2 0.2
Yes, but not in the last 12 months — 0.3 0.4 0.4 0.4 0.3 0.3 0.4 0.4 — 0.3 0.4 0.3 0.4 0.3 0.3 0.5 0.4 — 0.3 0.3 0.4 0.3 0.3 0.2 0.3 0.3
No, never — 99.7 99.5 99.5 99.5 99.5 99.6 99.4 99.5 — 99.6 99.4 99.4 99.5 99.5 99.5 99.4 99.4 — 99.7 99.6 99.6 99.5 99.6 99.6 99.5 99.5
Weighted N = — 3,610 3,387 4,032 4,823 4,802 4,731 4,597 4,488 — 1,708 1,582 1,888 2,271 2,275 2,238 2,141 2,088 — 1,902 1,805 2,144 2,552 2,527 2,492 2,456 2,399
Source. The Monitoring the Future study, the University of Michigan.
Notes. ' — ' indicates not applicable. ' * ' indicates a prevalence rate of less than 0.05%. aData presented in this table are two-year moving averages. The 2005 data is 2004 and 2005 combined and so forth. The questions were contained in two questionnaire forms in 2004 through 2006 and three forms beginning in 2007.
On how many occasions (if any) have you taken any drugs by injection with a needle (like heroin, cocaine, amphetamines, or steroids) in your lifetime? Do not include anything you took under a doctor ’s orders.
On how many occasions (if any) have you taken any drugs by injection with a needle (like heroin, cocaine, amphetamines, or steroids) during the last 12 months? Do not include anything you took under a doctor ’s orders.
Have you ever taken such drugs using a needle that you knew (or suspected) had been used by someone else before you used it?
TABLE 15aTrends a in Injection Drug Use and Needle Sharing
Total and by Gender among Respondents of Modal Ages 21–30(Entries are percentages.)
Total Male Female
81

Lifetime Frequency of Injecting Drugs 2008 2009 2010 2011 2012 2008 2009 2010 2011 2012 2008 2009 2010 2011 2012
0 Occasions — 98.7 98.4 98.5 98.4 — 97.9 97.6 97.9 97.7 — 99.6 99.2 98.9 99.0
1–2 — 0.8 0.8 0.5 0.6 — 1.4 1.1 0.3 0.9 — 0.3 0.6 0.7 0.3
3–5 — 0.1 0.1 0.2 0.2 — 0.2 0.2 0.3 0.2 — * * 0.2 0.3
6–9 — * 0.1 0.1 0.1 — 0.1 0.2 0.1 * — * * * 0.1
10–19 — * 0.1 0.3 0.3 — * 0.1 0.5 0.7 — * 0.1 0.1 *
20–39 — 0.1 0.1 0.1 * — 0.2 0.2 0.1 * — * * * 0.1
40+ Occasions — 0.2 0.4 0.4 0.4 — 0.3 0.7 0.7 0.5 — 0.1 0.1 0.1 0.3
Weighted N = — 1,453 1,908 1,796 1,770 — 711 923 843 824 — 742 985 954 946
Annual Frequency of Injecting Drugs
0 Occasions — 99.8 99.6 99.6 99.7 — 99.7 99.4 99.1 99.6 — 99.9 99.8 99.9 99.9
1–2 — 0.1 0.1 0.1 * — 0.1 0.1 0.1 * — * * * *
3–5 — * * * * — * * * * — * 0.1 0.1 *
6–9 — * 0.1 0.2 0.2 — * 0.2 0.5 0.4 — * * * *
10–19 — * * * * — * * * * — * * * *
20–39 — * 0.1 0.1 0.1 — * 0.1 0.1 * — * * * 0.1
40+ Occasions — 0.1 0.1 * * — 0.1 0.2 0.1 * — 0.1 0.1 * *
Weighted N = — 1,453 1,909 1,797 1,772 — 711 923 843 825 — 743 986 954 947
Lifetime and Annual Needle Sharing
Yes, in the last 12 months — * 0.1 * * — * * * * — 0.1 0.1 0.1 *
Yes, but not in the last 12 months — 0.1 0.2 0.4 0.4 — 0.1 0.3 0.7 0.7 — * 0.1 0.1 0.1
No, never — 99.9 99.7 99.6 99.6 — 99.9 99.7 99.3 99.3 — 99.9 99.8 99.8 99.9
Weighted N = — 1,455 1,911 1,790 1,763 — 711 924 841 822 — 744 987 949 941
Source. The Monitoring the Future study, the University of Michigan.
Notes. ' — ' indicates not applicable. ' * ' indicates a prevalence rate of less than 0.05%.
TABLE 15bTrends a in Injection Drug Use and Needle Sharing
Total and by Gender among Respondents of Modal Age 35 (Entries are percentages.)
Total Male Female
On how many occasions (if any) have you taken any drugs by injection with a needle (like heroin, cocaine, amphetamines, or steroids) in your lifetime? Do not include anything you took under a doctor ’s orders.
On how many occasions (if any) have you taken any drugs by injection with a needle (like heroin, cocaine, amphetamines, or steroids) during the last 12 months? Do not include anything you took under a doctor ’s orders.
Have you ever taken such drugs using a needle that you knew (or suspected) had been used by someone else before you used it?
aData presented in this table are two-year moving averages. The 2009 data is 2008 and 2009 combined and so forth. The questions were contained in three of the six questionnaire forms.
82

Number of Partners in Last 12 Months 2004 2005 2006 2007 2008 2009 2010 2011 2012 2004 2005 2006 2007 2008 2009 2010 2011 2012 2004 2005 2006 2007 2008 2009 2010 2011 2012
None — 14.5 14.6 13.7 13.5 14.1 14.8 16.0 16.6 — 16.9 16.6 14.7 14.3 14.6 15.6 17.6 19.1 — 12.3 12.8 12.7 12.8 13.6 14.0 14.7 14.5
One — 61.2 61.5 61.9 62.2 61.2 60.6 59.9 59.1 — 56.3 56.2 57.0 58.6 57.6 55.8 54.7 54.6 — 65.6 66.1 66.2 65.3 64.5 64.9 64.4 62.9
Two — 10.1 9.3 9.5 9.4 9.2 9.9 10.0 9.7 — 10.1 8.7 8.9 8.8 9.3 10.3 9.6 8.6 — 10.2 9.8 10.1 10.0 9.2 9.5 10.4 10.8
Three — 5.9 6.2 5.8 5.9 5.9 5.9 5.2 4.9 — 6.1 7.5 7.2 6.4 6.1 6.4 5.9 5.2 — 5.6 5.1 4.5 5.4 5.8 5.5 4.6 4.7
Four — 3.2 3.4 4.0 4.1 4.1 3.3 3.5 4.0 — 3.5 4.3 4.8 4.4 4.7 3.8 4.4 5.0 — 2.9 2.6 3.3 3.7 3.5 2.9 2.8 3.2
5–10 — 3.9 4.1 4.2 4.0 4.3 4.5 4.2 4.4 — 5.2 5.3 5.8 5.5 5.8 6.4 6.0 5.6 — 2.7 3.0 2.8 2.6 3.0 2.7 2.6 3.4
11–20 — 0.9 0.7 0.6 0.7 0.8 0.6 0.7 0.9 — 1.5 0.9 0.9 1.3 1.3 0.8 0.9 1.3 — 0.4 0.5 0.4 0.2 0.3 0.3 0.5 0.5
21–100 — 0.2 0.2 0.2 0.3 0.3 0.3 0.3 0.3 — 0.4 0.4 0.5 0.5 0.4 0.5 0.6 0.6 — 0.1 * * 0.1 0.2 0.2 0.1 0.1
More than 100 — 0.1 0.2 0.1 0.1 0.2 0.2 0.1 * — 0.1 0.2 0.1 0.2 0.4 0.4 0.2 * — 0.1 0.1 * * * * * *
Weighted N = — 3,628 3,432 4,066 4,844 4,829 4,758 4,630 4,519 — 1,720 1,611 1,902 2,276 2,289 2,248 2,156 2,104 — 1,908 1,821 2,163 2,568 2,540 2,510 2,474 2,415
Gender of Partners in Last 12 Months b
Exclusively male? — 53.4 54.0 54.0 53.4 52.7 52.9 54.0 54.5 — 3.9 4.3 4.6 4.1 4.2 3.9 4.6 5.0 — 95.8 96.0 96.3 96.4 96.3 96.0 95.6 95.4
Both male and female? — 1.5 1.4 1.4 1.3 1.4 1.4 1.4 1.6 — 1.0 0.8 1.0 0.9 0.9 0.8 0.7 0.9 — 1.9 1.9 1.7 1.7 1.9 1.8 2.0 2.2
Exclusively female? — 45.1 44.6 44.6 45.3 45.8 45.7 44.6 43.8 — 95.0 94.9 94.4 95.0 94.9 95.3 94.7 94.1 — 2.3 2.1 2.0 1.9 1.8 2.2 2.4 2.4
Weighted N = — 3,103 2,935 3,504 4,180 4,142 4,051 3,886 3,763 — 1,432 1,344 1,616 1,950 1,959 1,896 1,777 1,702 — 1,672 1,590 1,888 2,230 2,184 2,155 2,108 2,061
Source. The Monitoring the Future study, the University of Michigan.
Notes. ' — ' indicates not applicable. ' * ' indicates a prevalence rate of less than 0.05%.
bBased on those reporting sex with one or more partners during the past year. Those reporting no partners are omitted.
aData presented in this table are two-year moving averages. The 2005 data is 2004 and 2005 combined and so forth. The 2007 data is a simple average of 2006 and 2007, because these questions were included
in two questionnaire forms in 2006 and three forms beginning in 2007.
During the LAST 12 MONTHS, how many sex partners have you had? (This includes vaginal, oral, or anal sex.)
During the LAST 12 MONTHS, have your sex partner or partners been …
TABLE 16aTrends a in Number of Sex Partners and Gender of Sex Partners Total and by Gender among Respondents of Modal Ages 21–30
(Entries are percentages.)
Total Male Female
83

Number of Partners in Last 12 Months 2008 2009 2010 2011 2012 2008 2009 2010 2011 2012 2008 2009 2010 2011 2012
None — 9.5 9.7 8.8 8.7 — 9.9 9.8 9.6 8.5 — 9.1 9.5 8.1 8.8
One — 78.5 78.2 79.1 80.3 — 76.4 77.0 76.0 78.9 — 80.5 79.4 81.8 81.4
Two — 4.9 5.1 4.4 4.3 — 4.9 4.3 4.1 3.8 — 4.9 5.8 4.8 4.8
Three — 3.1 3.4 3.5 2.7 — 2.9 4.0 4.0 2.9 — 3.2 2.8 3.0 2.4
Four — 1.6 1.6 2.0 2.1 — 1.9 2.0 3.3 3.2 — 1.3 1.3 0.8 1.1
5–10 — 1.6 1.3 1.5 1.4 — 2.5 1.8 2.0 1.6 — 0.8 0.9 1.0 1.1
11–20 — 0.5 0.3 0.3 0.3 — 1.0 0.6 0.3 0.3 — 0.1 0.1 0.2 0.2
21–100 — 0.2 0.3 0.3 0.4 — 0.3 0.4 0.5 0.7 — * 0.2 0.2 0.1
More than 100 — 0.1 0.1 * * — 0.2 0.1 0.1 0.1 — * * * *
Weighted N = — 1,449 1,902 1,784 1,763 — 707 918 837 821 — 742 984 947 942
Gender of Partners in Last 12 Monthsb
Exclusively male? — 51.7 52.2 53.8 53.3 — 3.5 3.3 3.7 3.8 — 97.0 97.6 97.7 97.1
Both male and female? — 0.6 1.0 1.1 0.7 — 0.5 1.0 1.3 0.5 — 0.6 1.0 1.0 0.8
Exclusively female? — 47.7 46.8 45.1 46.0 — 95.9 95.6 95.0 95.7 — 2.3 1.5 1.3 2.1
Weighted N = — 1,307 1,701 1,611 1,605 — 634 818 753 754 — 673 882 858 851
Source. The Monitoring the Future study, the University of Michigan.
Notes. ' — ' indicates not applicable. ' * ' indicates a prevalence rate of less than 0.05%. aData presented in this table are two-year moving averages. The 2009 data is 2008 and 2009 combined and so forth. The questions were contained in three of the six
questionnaire forms.bBased on those reporting sex with one or more partners during the past year. Those reporting no partners are omitted.
During the LAST 12 MONTHS, how many sex partners have you had? (This includes vaginal, oral, or anal sex.)
During the LAST 12 MONTHS, have your sex partner or partners been …
TABLE 16bTrendsa in Number of Sex Partners and Gender of Sex Partners
Total and by Gender among Respondents of Modal Age 35(Entries are percentages.)
Total Male Female
84

Source. The Monitoring the Future study, the University of Michigan.
FIGURE 1Trends (2-year average) in Lifetime Injection Drug Use
by Gender among Respondents of Modal Ages 21-30
Trends (2-year average) in Lifetime Injection Drug Use by Gender among Respondents of Modal Age 35
0
2
4
6
8
10
2005 2006 2007 2008 2009 2010 2011 2012
PE
RC
EN
T
YEAR OF ADMINISTRATION
Male
Female
0
2
4
6
8
10
2005 2006 2007 2008 2009 2010 2011 2012
PE
RC
EN
T
YEAR OF ADMINISTRATION
Male
Female
85
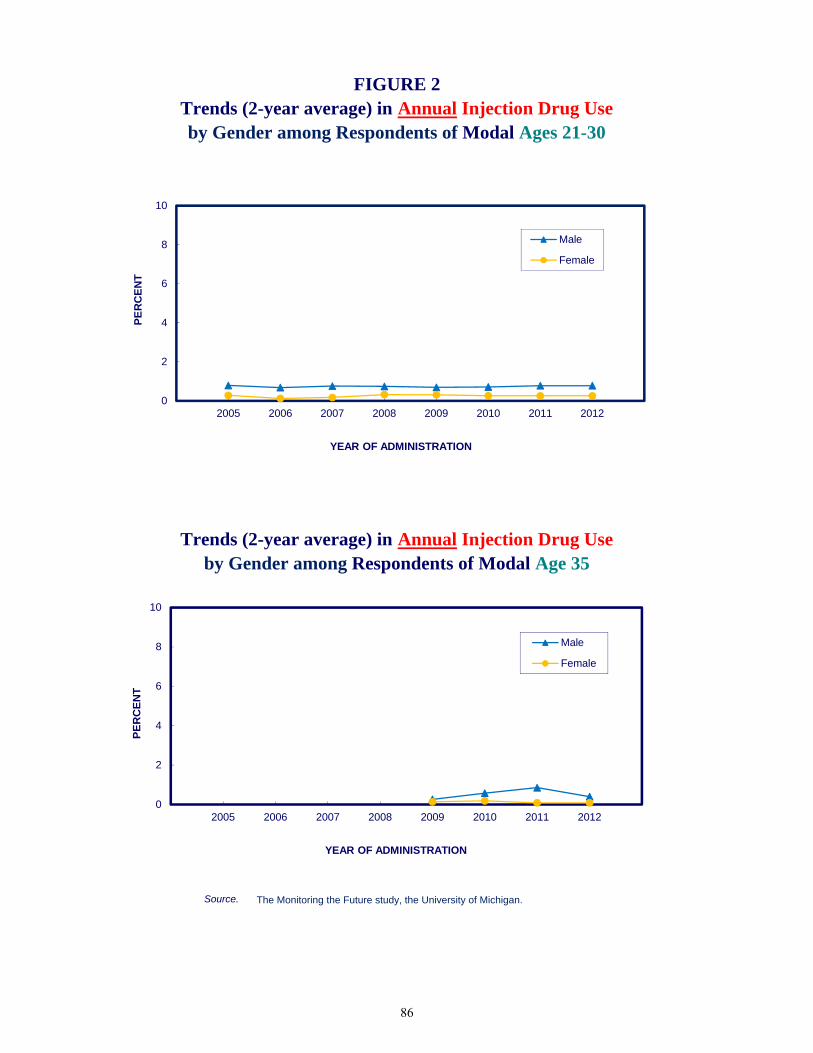
Source. The Monitoring the Future study, the University of Michigan.
Trends (2-year average) in Annual Injection Drug Use by Gender among Respondents of Modal Age 35
FIGURE 2Trends (2-year average) in Annual Injection Drug Use by Gender among Respondents of Modal Ages 21-30
0
2
4
6
8
10
2005 2006 2007 2008 2009 2010 2011 2012
PE
RC
EN
T
YEAR OF ADMINISTRATION
Male
Female
0
2
4
6
8
10
2005 2006 2007 2008 2009 2010 2011 2012
PE
RC
EN
T
YEAR OF ADMINISTRATION
Male
Female
86

Source. The Monitoring the Future study, the University of Michigan.
by Gender among Respondents of Modal Age 35
FIGURE 3Trends (2-year average) in Lifetime Needle Sharing by Gender among Respondents of Modal Ages 21-30
Trends (2-year average) in Lifetime Needle Sharing
0
2
4
6
8
10
2005 2006 2007 2008 2009 2010 2011 2012
PE
RC
EN
T
YEAR OF ADMINISTRATION
Male
Female
0
2
4
6
8
10
2005 2006 2007 2008 2009 2010 2011 2012
PE
RC
EN
T
YEAR OF ADMINISTRATION
Male
Female
87

Source. The Monitoring the Future study, the University of Michigan.aBased on those reporting having had an HIV/AIDS test in the last 12 months. Those respondents who have
not been tested are omitted.
FIGURE 4Trends (2-year average) in Having
by Gender a among Respondents of Modal Ages 21-30More than One Sex Partner in the Last Year
Trends (2-year average) in Having More than One Sex Partner in the Last Year
by Gender a among Respondents of Modal Age 35
0
10
20
30
40
2005 2006 2007 2008 2009 2010 2011 2012
PE
RC
EN
T
YEAR OF ADMINISTRATION
Male
Female
0
10
20
30
40
2005 2006 2007 2008 2009 2010 2011 2012
PE
RC
EN
T
YEAR OF ADMINISTRATION
Male
Female
88

Source. The Monitoring the Future study, the University of Michigan.aBased on those reporting sexual activity with one or more partners during the past year. Those
reporting no partners are omitted.
Sex Partner of the Same/Both Genders by Gender a among Respondents of Modal Age 35
Trends (2-year average) in Having aSex Partner of the Same/Both Genders
FIGURE 5
by Gender a among Respondents of Modal Ages 21-30
Trends (2-year average) in Having a
0
10
20
30
40
2005 2006 2007 2008 2009 2010 2011 2012
PE
RC
EN
T
YEAR OF ADMINISTRATION
Male
Female
0
10
20
30
40
2005 2006 2007 2008 2009 2010 2011 2012
PE
RC
EN
T
YEAR OF ADMINISTRATION
Male
Female
89

Chapter 10: Trends in the Prevalence and Frequency of Protective Behaviors
Chapter 10
TRENDS IN THE PREVALENCE AND
FREQUENCY OF PROTECTIVE BEHAVIORS Like the risk behaviors, the behaviors that can help to protect against the spread of HIV have not shown much change in the 2005–2012 interval among young adults. Condom Use
Past-year prevalence of condom use among young adults did not change much from 2005 to 2012 (Table 17a and Figure 6). Among 35-year-olds, the prevalence and frequency of condom use increased somewhat among males, with the proportion saying that they have used them in the past 12 months rising from 35% to 42% over the 2009–2011 interval (p < .05) though the increase did not continue into 2012. . Among their female counterparts there does not appear to be an increase with annual prevalence staying steady at 29%–33% until 2012, when it declined a bit to 29% (Table 17b and Figure 6). Getting Tested for HIV/AIDS
Young adult males showed a slight falloff around 2010 in both the annual and lifetime prevalence of getting tested for HIV/AIDS but a very slight increase in securing the results (Table 17a and Figure 7). Their annual prevalence for getting tested fell from 16.7% in 2005 to 14.9% in 2011. However the trend lines show some slight increases in 2011 and 2012 which offset the previous declines. At the same time, among young adult females the prevalence of getting tested in the past year rose from 23.7% in 2005 to 25.9% in 2012. This increase occurred from 2006–2010 among young women, though it also appears not to have continued after 2010. Among 35-year-old males, the lifetime prevalence of HIV testing has shown some increase (though not significant), but testing in past 12-months has been relatively stable (Figure 7). No change is observed among females the same age, though they consistently have had higher rates of getting tested than their male counterparts. Both genders have shown a very slight decline in the proportions who do not secure the results—a positive development (Table 17b). It appears that movement in both the risk and protective behaviors related to the spread of HIV in the young adult population is gradual. Over the seven-year interval covered so far, we note very little movement in these factors. While the public health community no doubt would wish for the data to show greater change toward lowering the risk of HIV among young adults, the high degree of replication of findings across sequential national surveys at least provides evidence of the reliability of these measures when applied to a national population.
90

Frequency of Condom Use in Last 12 Months b 2004 2005 2006 2007 2008 2009 2010 2011 2012 2004 2005 2006 2007 2008 2009 2010 2011 2012 2004 2005 2006 2007 2008 2009 2010 2011 2012
Never — 42.1 41.6 40.5 40.7 39.9 39.2 40.1 39.9 — 37.0 36.4 35.8 36.0 35.0 35.9 36.1 34.8 — 46.5 46.1 44.4 44.8 44.2 42.1 43.4 44.2
Seldom — 13.7 13.2 13.6 13.2 13.3 14.1 14.4 14.5 — 13.7 12.8 13.3 13.8 13.3 13.0 13.7 14.4 — 13.7 13.5 13.7 12.6 13.3 15.1 15.0 14.6
Sometimes — 12.4 13.3 13.5 13.0 13.1 13.0 12.2 12.6 — 12.8 13.0 13.3 13.2 13.4 13.2 12.7 13.6 — 12.0 13.5 13.7 12.8 12.9 12.8 11.8 11.7
Most times — 15.5 15.2 15.2 14.9 14.5 14.2 14.7 15.3 — 17.8 18.0 16.8 15.7 15.8 16.0 16.8 16.9 — 13.5 12.9 13.9 14.3 13.4 12.6 12.9 13.9
Always — 16.4 16.7 17.2 18.3 19.2 19.6 18.6 17.7 — 18.8 19.9 20.7 21.3 22.6 21.9 20.6 20.3 — 14.3 14.0 14.3 15.6 16.2 17.5 16.9 15.5
Weighted N = — 3,076 2,905 3,476 4,160 4,108 4,011 3,851 3,734 — 1,423 1,330 1,607 1,946 1,946 1,878 1,765 1,697 — 1,653 1,574 1,869 2,214 2,162 2,132 2,087 2,036
Testing for HIV: Lifetime and Last 12 Months
Yes, in the last 12 months — 20.4 19.6 20.1 20.9 21.3 20.6 20.5 21.6 — 16.7 16.0 16.0 16.4 16.2 14.5 14.9 16.7 — 23.7 22.9 23.8 24.9 25.9 26.1 25.3 25.9
Yes, but not in the last 12 months — 24.0 23.9 23.5 22.9 22.6 22.9 22.1 21.1 — 21.2 20.8 21.2 20.7 20.1 19.8 18.7 18.7 — 26.5 26.6 25.5 24.8 24.9 25.7 25.0 23.3
No, never — 55.7 56.5 56.4 56.2 56.1 56.5 57.5 57.3 — 62.2 63.2 62.8 62.9 63.8 65.7 66.3 64.6 — 49.8 50.6 50.7 50.3 49.2 48.2 49.7 50.9
Weighted N = — 3,664 3,459 4,098 4,882 4,853 4,790 4,658 4,534 — 1,738 1,629 1,919 2,293 2,301 2,265 2,174 2,113 — 1,927 1,830 2,179 2,589 2,553 2,524 2,485 2,422
Received HIV Test Results c
Yes — 92.2 92.8 92.5 92.7 93.1 93.7 94.2 94.0 — 89.8 91.2 92.2 92.0 91.4 91.3 92.5 93.3 — 93.9 93.8 92.7 93.2 94.2 95.1 95.2 94.4
No — 7.8 7.2 7.5 7.3 6.9 6.3 5.8 6.0 — 10.2 8.8 7.8 8.0 8.6 8.7 7.5 6.7 — 6.1 6.2 7.3 6.8 5.8 4.9 4.8 5.6
Weighted N = — 1,610 1,486 1,764 2,113 2,110 2,059 1,953 1,909 — 655 591 701 842 823 760 715 735 — 955 895 1,063 1,271 1,287 1,299 1,238 1,174
Source. The Monitoring the Future study, the University of Michigan.
Notes. ' — ' indicates not applicable.
cThose respondents who report never having been tested for HIV are excluded from these percentages.
aData presented in this table are two-year moving averages. The 2005 data is 2004 and 2005 combined and so forth. The questions were contained in two questionnaire forms in 2004–2006 and three forms beginning in 2007.bPercentages based on those reporting sex with one or more partners during the last 12 months. Those reporting no partners are omitted.
TABLE 17aTrends a in Frequency of Condom Use and Testing for HIV
Total and by Gender among Respondents of Modal Ages 21–30(Entries are percentages.)
Total Male Female
When you had sexual intercourse during the LAST 12 MONTHS, how often were condoms used? (This includes vaginal and anal sex, but not oral sex.)
Have you ever been tested for HIV/AIDS? (Do not include tests that you may have had when donating blood or blood plasma.)
Did you receive the results of your most recent HIV/AIDS test? (We don ’t want to know your test results.)
91
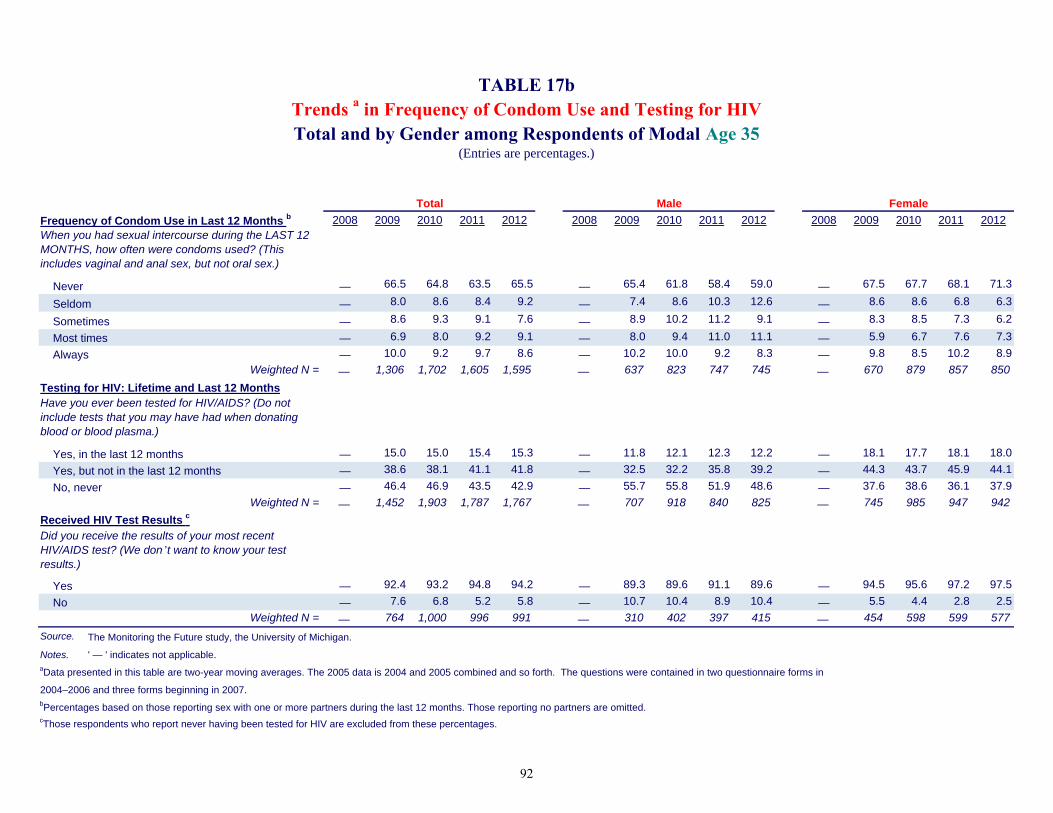
Frequency of Condom Use in Last 12 Months b 2008 2009 2010 2011 2012 2008 2009 2010 2011 2012 2008 2009 2010 2011 2012
Never — 66.5 64.8 63.5 65.5 — 65.4 61.8 58.4 59.0 — 67.5 67.7 68.1 71.3
Seldom — 8.0 8.6 8.4 9.2 — 7.4 8.6 10.3 12.6 — 8.6 8.6 6.8 6.3
Sometimes — 8.6 9.3 9.1 7.6 — 8.9 10.2 11.2 9.1 — 8.3 8.5 7.3 6.2
Most times — 6.9 8.0 9.2 9.1 — 8.0 9.4 11.0 11.1 — 5.9 6.7 7.6 7.3
Always — 10.0 9.2 9.7 8.6 — 10.2 10.0 9.2 8.3 — 9.8 8.5 10.2 8.9
Weighted N = — 1,306 1,702 1,605 1,595 — 637 823 747 745 — 670 879 857 850
Testing for HIV: Lifetime and Last 12 Months
Yes, in the last 12 months — 15.0 15.0 15.4 15.3 — 11.8 12.1 12.3 12.2 — 18.1 17.7 18.1 18.0
Yes, but not in the last 12 months — 38.6 38.1 41.1 41.8 — 32.5 32.2 35.8 39.2 — 44.3 43.7 45.9 44.1
No, never — 46.4 46.9 43.5 42.9 — 55.7 55.8 51.9 48.6 — 37.6 38.6 36.1 37.9
Weighted N = — 1,452 1,903 1,787 1,767 — 707 918 840 825 — 745 985 947 942
Received HIV Test Results c
Yes — 92.4 93.2 94.8 94.2 — 89.3 89.6 91.1 89.6 — 94.5 95.6 97.2 97.5
No — 7.6 6.8 5.2 5.8 — 10.7 10.4 8.9 10.4 — 5.5 4.4 2.8 2.5
Weighted N = — 764 1,000 996 991 — 310 402 397 415 — 454 598 599 577
Source. The Monitoring the Future study, the University of Michigan.
Notes. ' — ' indicates not applicable.
2004–2006 and three forms beginning in 2007.
cThose respondents who report never having been tested for HIV are excluded from these percentages.
bPercentages based on those reporting sex with one or more partners during the last 12 months. Those reporting no partners are omitted.
TABLE 17bTrends a in Frequency of Condom Use and Testing for HIVTotal and by Gender among Respondents of Modal Age 35
(Entries are percentages.)
Total Male Female
When you had sexual intercourse during the LAST 12 MONTHS, how often were condoms used? (This includes vaginal and anal sex, but not oral sex.)
Have you ever been tested for HIV/AIDS? (Do not include tests that you may have had when donating blood or blood plasma.)
Did you receive the results of your most recent HIV/AIDS test? (We don ’t want to know your test results.)
aData presented in this table are two-year moving averages. The 2005 data is 2004 and 2005 combined and so forth. The questions were contained in two questionnaire forms in
92
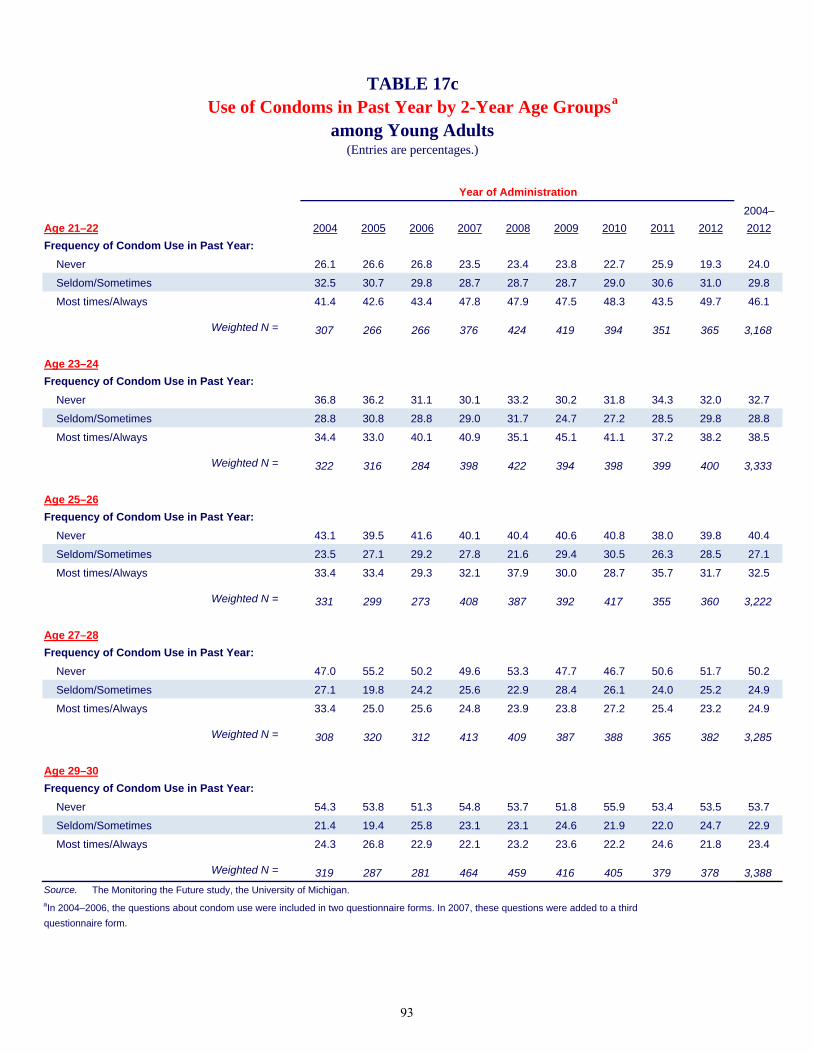
2004–
Age 21–22 2004 2005 2006 2007 2008 2009 2010 2011 2012 2012
Frequency of Condom Use in Past Year:
Never 26.1 26.6 26.8 23.5 23.4 23.8 22.7 25.9 19.3 24.0
Seldom/Sometimes 32.5 30.7 29.8 28.7 28.7 28.7 29.0 30.6 31.0 29.8
Most times/Always 41.4 42.6 43.4 47.8 47.9 47.5 48.3 43.5 49.7 46.1
Weighted N = 307 266 266 376 424 419 394 351 365 3,168
Age 23–24
Frequency of Condom Use in Past Year:
Never 36.8 36.2 31.1 30.1 33.2 30.2 31.8 34.3 32.0 32.7
Seldom/Sometimes 28.8 30.8 28.8 29.0 31.7 24.7 27.2 28.5 29.8 28.8
Most times/Always 34.4 33.0 40.1 40.9 35.1 45.1 41.1 37.2 38.2 38.5
Weighted N = 322 316 284 398 422 394 398 399 400 3,333
Age 25–26
Frequency of Condom Use in Past Year:
Never 43.1 39.5 41.6 40.1 40.4 40.6 40.8 38.0 39.8 40.4
Seldom/Sometimes 23.5 27.1 29.2 27.8 21.6 29.4 30.5 26.3 28.5 27.1
Most times/Always 33.4 33.4 29.3 32.1 37.9 30.0 28.7 35.7 31.7 32.5
Weighted N = 331 299 273 408 387 392 417 355 360 3,222
Age 27–28
Frequency of Condom Use in Past Year:
Never 47.0 55.2 50.2 49.6 53.3 47.7 46.7 50.6 51.7 50.2
Seldom/Sometimes 27.1 19.8 24.2 25.6 22.9 28.4 26.1 24.0 25.2 24.9
Most times/Always 33.4 25.0 25.6 24.8 23.9 23.8 27.2 25.4 23.2 24.9
Weighted N = 308 320 312 413 409 387 388 365 382 3,285
Age 29–30
Frequency of Condom Use in Past Year:
Never 54.3 53.8 51.3 54.8 53.7 51.8 55.9 53.4 53.5 53.7
Seldom/Sometimes 21.4 19.4 25.8 23.1 23.1 24.6 21.9 22.0 24.7 22.9
Most times/Always 24.3 26.8 22.9 22.1 23.2 23.6 22.2 24.6 21.8 23.4
Weighted N = 319 287 281 464 459 416 405 379 378 3,388
Source. The Monitoring the Future study, the University of Michigan.aIn 2004–2006, the questions about condom use were included in two questionnaire forms. In 2007, these questions were added to a third
questionnaire form.
Year of Administration
TABLE 17cUse of Condoms in Past Year by 2-Year Age Groupsa
(Entries are percentages.)among Young Adults
93

Source. The Monitoring the Future study, the University of Michigan.aBased on those reporting sexual activity with one or more partners during the past year. Those
reporting no partners are omitted.
(most times or always)
FIGURE 6
by Gender a among Respondents of Modal Ages 21-30
Trends (2-year average) in Annual Condom Use by Gender a among Respondents of Modal Age 35
(most times or always)
Trends (2-year average) in Annual Condom Use
0
10
20
30
40
50
2005 2006 2007 2008 2009 2010 2011 2012
PE
RC
EN
T
YEAR OF ADMINISTRATION
Male
Female
0
10
20
30
40
50
2005 2006 2007 2008 2009 2010 2011 2012
PE
RC
EN
T
YEAR OF ADMINISTRATION
Male
Female
94

Source. The Monitoring the Future study, the University of Michigan.
Trends (2-year average) in Having an HIV/AIDS Test in the Past Year
by Gender among Respondents of Modal Age 35
FIGURE 7Trends (2-year average) in Having an
HIV/AIDS Test in the Past Year by Gender among Respondents of Modal Ages 21-30
0
10
20
30
2005 2006 2007 2008 2009 2010 2011 2012
PE
RC
EN
T
YEAR OF ADMINISTRATION
Male
Female
0
10
20
30
2005 2006 2007 2008 2009 2010 2011 2012
PE
RC
EN
T
YEAR OF ADMINISTRATION
Male
Female
95
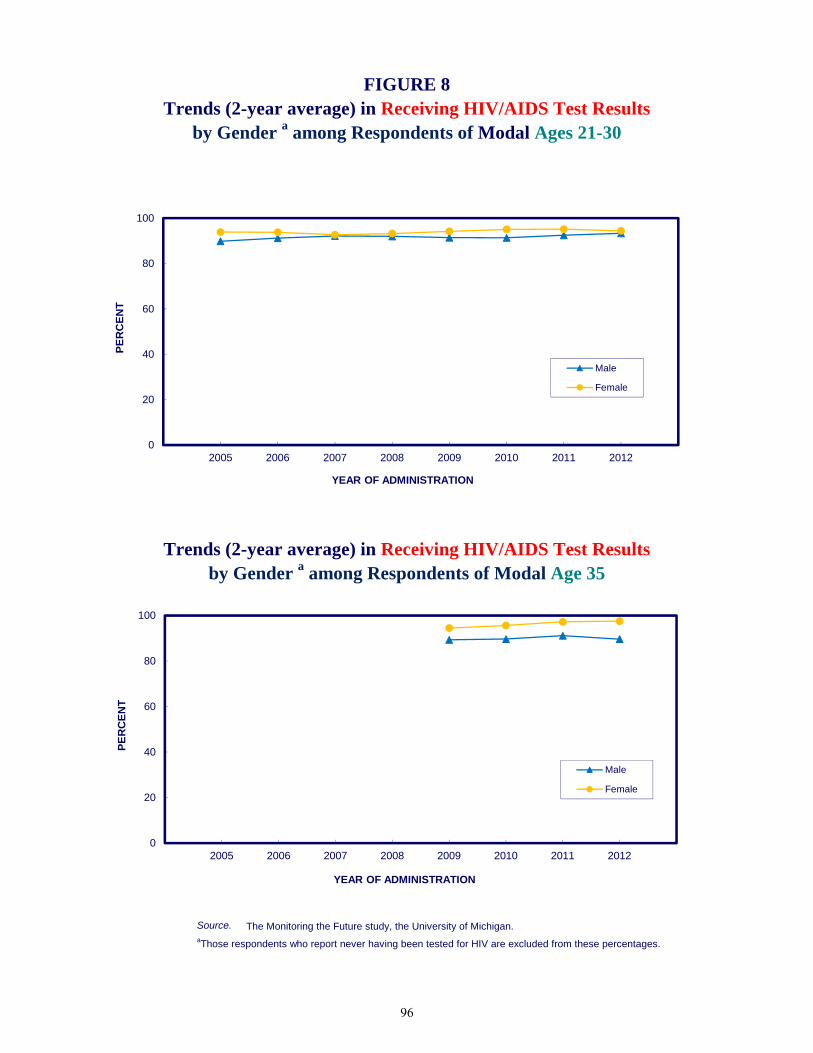
Source. The Monitoring the Future study, the University of Michigan.aThose respondents who report never having been tested for HIV are excluded from these percentages.
Trends (2-year average) in Receiving HIV/AIDS Test Results FIGURE 8
Trends (2-year average) in Receiving HIV/AIDS Test Results
by Gender a among Respondents of Modal Ages 21-30
by Gender a among Respondents of Modal Age 35
0
20
40
60
80
100
2005 2006 2007 2008 2009 2010 2011 2012
PE
RC
EN
T
YEAR OF ADMINISTRATION
Male
Female
0
20
40
60
80
100
2005 2006 2007 2008 2009 2010 2011 2012
PE
RC
EN
T
YEAR OF ADMINISTRATION
Male
Female
96

Chapter 11: Blood Donation
CHAPTER 11
BLOOD DONATION
In this chapter, we report the prevalence of blood donation. We also report the intersections of blood donation and HIV-risk behaviors such as men having sex with men, injection drug use, and having multiple sex partners. Donating Blood
While donating blood carries no risk of contracting an HIV infection, because only new and sterile needles are used to draw blood from donors, it carries a diminishingly slight possibility (about 1 out of 2,000,000 according to Stramer, 2007) of transmitting HIV if the donor is infected. This section covers the overall prevalence of blood donation shown in Tables 18a, 18b, and 18c.
The proportion of young adult respondents saying that they have donated blood or blood plasma during their lifetime is 45% overall, with similar proportions for males and females (Table 18a).
Blood donation in the previous 12 months was reported by 11% overall—11% of males
and 10% of females.
As might be expected given the longer opportunity time, a slightly higher proportion of age 35- and 40-year olds reported ever having donated blood (50% and 54%, respectively) than did the young adults (45%), but a slightly higher proportion of young adults (10.5%) donated blood in the last 12 months than did age 35- and 40-year olds (8.3% and 9.2%).
Donating Blood by Gender of Sex Partners
Approximately equal proportions of young adult males who reported any male sex partner(s) including those having sex with both genders during the previous 12 months (41% based on 400 weighted observations) and males who reported only female sex partners (48%) said they had ever donated blood (Table 19a). Slightly fewer of the men reporting any male sex partner(s) said they donated blood in the last 12 months (8% versus 12% among males reporting only female partners), a statistically significant difference. However, it is clear that by no means all individuals in this elevated risk group abstain from donating blood, as the Food and Drug Administration requires (FDA, 2013). Rather, their rate of blood donation, particularly in their lifetime, appears fairly similar to the rate for all males.
Among young adult females, all three groups (defined by the gender of their partners)
have fairly similar rates of blood donation (Table 19a).
97

Monitoring the Future
Among the 35- and 40-year-old respondents, the case counts for some of the same-sex and both-sex groups are too small to date to yield meaningful comparison across all groups (Tables 19b and 19c.).
Donating Blood by Number of Sex Partners
The results in Table 20a for young adults show little systematic association between the number of sex partners reported in the prior 12 months and the prevalence of donating blood in the prior 12 months. Lifetime prevalence of donating blood is lower in the group reporting no sex partners in the prior 12 months than in the other groups, but past year donating is the same.
Among the 35- and 40-year-olds the results are similar (Tables 20b and 20c).
Donating Blood by Injection Drug Use
As a group, young adult blood donors have rates of lifetime and annual injection drug use very similar to those not donating blood, although those who have ever injected a drug outside of medical supervision are supposed to be screened out based on their answers to the screening questionnaires (Table 21).
There is an inadequate sample size to examine the intersection between needle sharing and blood donation among those 35 and 40 years old. In the future, by concatenating across years, we may be able to examine this intersection.
Trends in Donating Blood
The prevalence of blood donation overall (Table 22a and Figure 9) shows no systematic change among young adults. Past year prevalence blood donation has generally been slightly higher among young adult males (around 11% to 12%) than among young adult females (around 9% to 10%; Table 20a), with neither gender showing much of a systematic trend from 2005 to 2012.
Neither is there any systematic change in the rates of blood donation observable among
the 35-year-olds; at least until 2012, when there was a crossover (Figure 9). Males showed a slightly higher rate of blood donation compared to females for the first three years of observation, but in 2012 females had slightly higher rates than males (Table 22b). All of the gender differences fell short of statistical significance, so it remains to be seen whether there is any differential trending. Whether this crossover is an anomaly or not should become clear with the next survey.
Three higher risk groups are men who have sex with men, people who have a high number of sex partners, and those who have shared needles. We do not yet have a sufficient numbers of cases for these important subgroups to make trend estimates dealing with their donating blood.
98

Chapter 11: Blood Donation
References Stramer, S. (2007). Current risks of transfusion-transmitted agents–A Review. Archives of Pathology & Laboratory Medicine, 131, 702–707. U.S.Food and Drug Administration (FDA). Blood donation from men who have sex with other men questions, and answers (Last updated 08/19/2013.) Retrieved from http://www.fda.gov/biologicsbloodvaccines/bloodbloodproducts/questionsaboutblood/ucm108186.htm.
99

Total Male Female
Blood Donation: Lifetime and Last 12 Months
Yes, in the last 12 months 10.5 11.4 9.8
Yes, but not in the last 12 months 34.6 34.5 34.7
No, never 54.9 54.1 55.5
Weighted N = 19,554 9,191 10,364
Source. The Monitoring the Future study, the University of Michigan.aIn 2004–2006, the HIV questions were included in two questionnaire forms. In 2007, these questions were added
to a third questionnaire form.
Have you ever donated blood or blood plasma?
(Entries are percentages.)
TABLE 18aBlood Donation, Lifetime and Last 12 Months
Total and by Genderamong Respondents of Modal Ages 21–30
in 2004–2012 a Combined
100
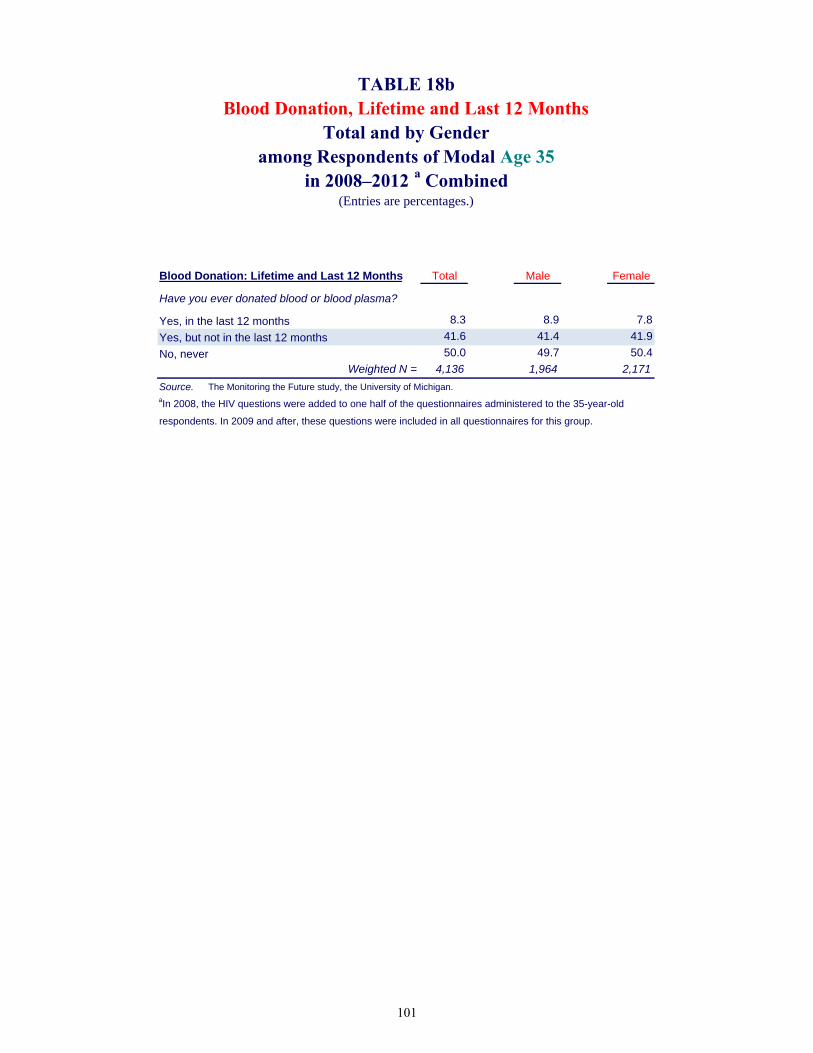
Blood Donation: Lifetime and Last 12 Months Total Male Female
Yes, in the last 12 months 8.3 8.9 7.8
Yes, but not in the last 12 months 41.6 41.4 41.9
No, never 50.0 49.7 50.4
Weighted N = 4,136 1,964 2,171
Source. The Monitoring the Future study, the University of Michigan.aIn 2008, the HIV questions were added to one half of the questionnaires administered to the 35-year-old
respondents. In 2009 and after, these questions were included in all questionnaires for this group.
(Entries are percentages.)
TABLE 18bBlood Donation, Lifetime and Last 12 Months
Total and by Genderamong Respondents of Modal Age 35
Have you ever donated blood or blood plasma?
in 2008–2012 a Combined
101

Blood Donation: Lifetime and Last 12 Months Total Male Female
Yes, in the last 12 months 9.2 9.2 9.2
Yes, but not in the last 12 months 45.2 48.7 41.8
No, never 45.6 42.1 49.0
Weighted N = 2,657 1,302 1,355
Source. The Monitoring the Future study, the University of Michigan.aThe HIV questions were added to the questionnaires for 40-year-olds beginning in 2010.
(Entries are percentages.)
TABLE 18cBlood Donation, Lifetime and Last 12 Months
Total and by Genderamong Respondents of Modal Age 40
Have you ever donated blood or blood plasma?
in 2010–2012 a Combined
102

Female Male Male and Male Female Male and
Only Only Female Only Only Female
Blood Donation: Lifetime and Last 12 Months
Yes, in the last 12 months 11.9 7.7 6.1 9.6 7.7 8.9
Yes, but not in the last 12 months 36.1 30.7 45.6 35.6 41.3 38.0
No, never 52.1 61.6 48.3 54.8 51.0 53.1
Weighted N = 7,218 331 69 8,518 191 167
Source. The Monitoring the Future study, the University of Michigan.aIn 2004–2006, the HIV questions were included in two questionnaire forms. In 2007, these questions were added to a third
questionnaire form.
Have you ever donated blood or blood plasma?
TABLE 19a
MALE RESPONDENTS FEMALE RESPONDENTS
Gender of Partner(s) Gender of Partner(s)
(Entries are percentages.)
among Respondents of Modal Ages 21–30 in 2004–2012 a CombinedBlood Donation by Gender of Sex Partners in Last 12 Months
103

Female Male Male and Male Female Male and
Only Only Female Only Only Female
Blood Donation: Lifetime and Last 12 Months
Yes, in the last 12 months 9.4 3.0 † 7.5 † †
Yes, but not in the last 12 months 42.7 37.8 † 41.8 † †
No, never 48.0 59.2 † 50.7 † †
Weighted N = 1,693 61 13 1,894 39 18
Source. The Monitoring the Future study, the University of Michigan.
Notes. ' † ' indicates that the sample size is too limited to provide reliable estimates.
aIn 2008, the HIV questions were added to one half of the questionnaires administered to the 35-year-old respondents. In 2009
and after, these questions were included in all questionnaires for this group.
Have you ever donated blood or blood plasma?
TABLE 19b
MALE RESPONDENTS FEMALE RESPONDENTS
Gender of Partner(s) Gender of Partner(s)
(Entries are percentages.)
among Respondents of Modal Age 35 in 2008–2012 a CombinedBlood Donation by Gender of Sex Partners in Last 12 Months
104
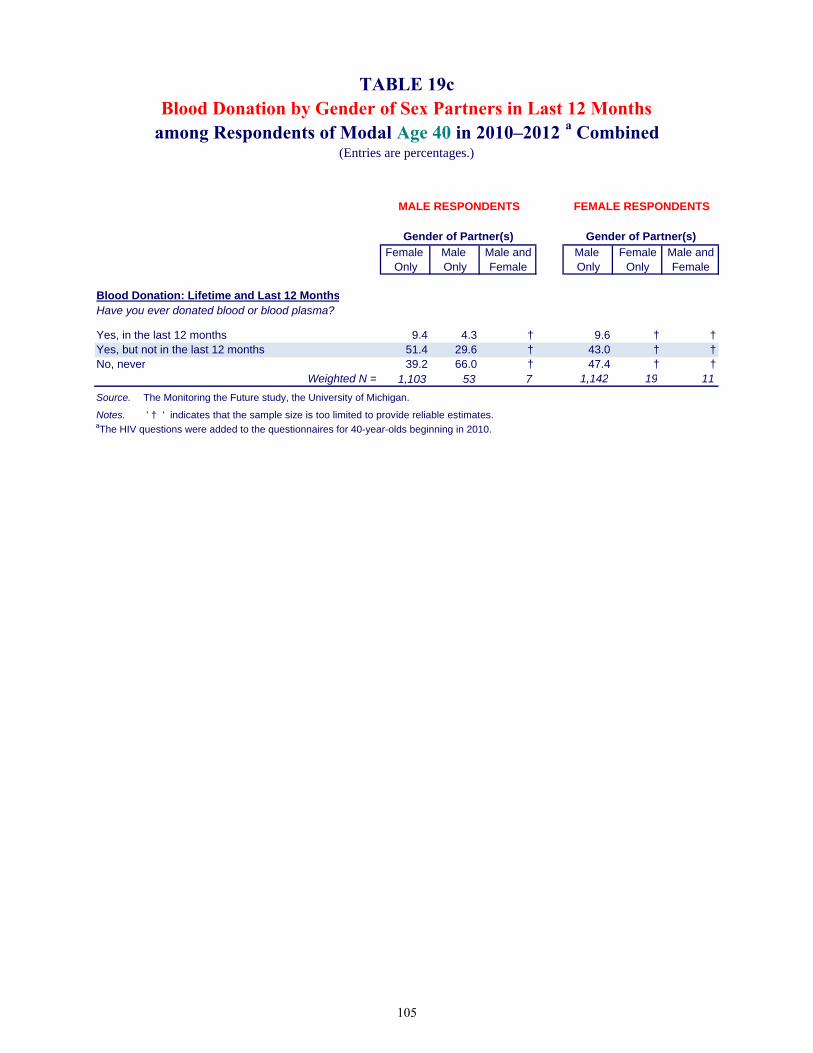
Female Male Male and Male Female Male andOnly Only Female Only Only Female
Blood Donation: Lifetime and Last 12 Months
Yes, in the last 12 months 9.4 4.3 † 9.6 † †Yes, but not in the last 12 months 51.4 29.6 † 43.0 † †No, never 39.2 66.0 † 47.4 † †
Weighted N = 1,103 53 7 1,142 19 11
Source. The Monitoring the Future study, the University of Michigan.
Notes. ' † ' indicates that the sample size is too limited to provide reliable estimates.aThe HIV questions were added to the questionnaires for 40-year-olds beginning in 2010.
Have you ever donated blood or blood plasma?
TABLE 19c
MALE RESPONDENTS FEMALE RESPONDENTS
Gender of Partner(s) Gender of Partner(s)
(Entries are percentages.)
among Respondents of Modal Age 40 in 2010–2012 a CombinedBlood Donation by Gender of Sex Partners in Last 12 Months
105

Three Five
Blood Donation: Lifetime and Last 12 Months None One Two or Four or More
Yes, in the last 12 months 11.0 10.3 11.4 10.3 11.3
Yes, but not in the last 12 months 27.7 36.7 31.3 36.6 33.6
No, never 61.3 53.0 57.2 53.0 55.1
Weighted N = 2,850 11,774 1,888 1,810 1,037
Source. The Monitoring the Future study, the University of Michigan.aIn 2004–2006, the HIV questions were included in two questionnaire forms. In 2007, these questions were added to a third
questionnaire form.
Have you ever donated blood or blood plasma?
Number of Partners in Last 12 Months
TABLE 20aBlood Donation, Lifetime and Last 12 Monthsby Number of Sex Partners in Last 12 Months
among Respondents of Modal Ages 21–30 in 2004–2012 a Combined(Entries are percentages.)
106

Three Five
Blood Donation: Lifetime and Last 12 Months None One Two or Four or More
Yes, in the last 12 months 8.0 8.5 5.7 9.2 8.1
Yes, but not in the last 12 months 33.7 42.3 39.3 49.9 39.2
No, never 58.4 49.2 55.0 40.9 52.7
Weighted N = 372 3,253 191 205 89
Source. The Monitoring the Future study, the University of Michigan.aIn 2008, the HIV questions were added to one half of the questionnaires administered to the 35-year-old respondents.
In 2009 and after, these questions were included in all questionnaires for this group.
Have you ever donated blood or blood plasma?
Number of Partners in Last 12 Months
TABLE 20bBlood Donation, Lifetime and Last 12 Monthsby Number of Sex Partners in Last 12 Months
among Respondents of Modal Age 35 in 2008–2012 a Combined(Entries are percentages.)
107

Three Five
Blood Donation: Lifetime and Last 12 Months None One Two or Four or More
Yes, in the last 12 months 6.9 9.8 10.3 2.7 8.1
Yes, but not in the last 12 months 35.4 46.9 42.1 45.6 41.6
No, never 57.7 43.3 47.5 51.7 50.3
Weighted N = 302 2,070 130 87 62
Source. The Monitoring the Future study, the University of Michigan.aThe HIV questions were added to the questionnaires for 40-year-olds beginning in 2010.
Have you ever donated blood or blood plasma?
Number of Partners in Last 12 Months
TABLE 20cBlood Donation, Lifetime and Last 12 Monthsby Number of Sex Partners in Last 12 Months
among Respondents of Modal Age 40 in 2010–2012 a Combined(Entries are percentages.)
108

Yes, in Yes, but not
Lifetime Frequency of Injecting Drugs last 12 months in last 12 months No, never
Total
0 Occasions 98.5 98.1 98.6
1+ Occasions 1.5 1.9 1.4
Weighted N = 2,053 6,708 10,623Male
0 Occasions 97.6 97.4 97.8
1+ Occasions 2.4 2.6 2.2
Weighted N = 1,046 3,144 4,916
Female
0 Occasions 99.5 98.7 99.2
1+ Occasions 0.5 1.3 0.8
Weighted N = 1,007 3,563 5,707
Annual Frequency of Injecting Drugs
Total
0 Occasions 99.5 99.3 99.6
1+ Occasions 0.5 0.7 0.4
Weighted N = 2,055 6,711 10,628Male
0 Occasions 99.2 98.9 99.5
1+ Occasions 0.8 1.1 0.5
Weighted N = 1,048 3,146 4,917Female
0 Occasions 99.9 99.7 99.8
1+ Occasions 0.1 0.3 0.2
Weighted N = 1,007 3,565 5,710
Source. The Monitoring the Future study, the University of Michigan.aIn 2004–2006, the HIV questions were included in two questionnaire forms. In 2007, these questions were added to a third questionnaire form.
or steroids) in your lifetime? Do not include anything you
took under a doctor's orders.
On how many occasions (if any) have you taken any drugs by
On how many occasions (if any) have you taken any drugs by injection with a needle (like heroin, cocaine, amphetamines, or steroids) during the last 12 months? Do not include anything you took under a doctor’s orders.
Blood Donation
TABLE 21Injection Drug Use by Blood Donation
among Respondents of Modal Ages 21–30 in 2004–2012 a Combined(Entries are percentages.)
injection with a needle (like heroin, cocaine, amphetamines,
109
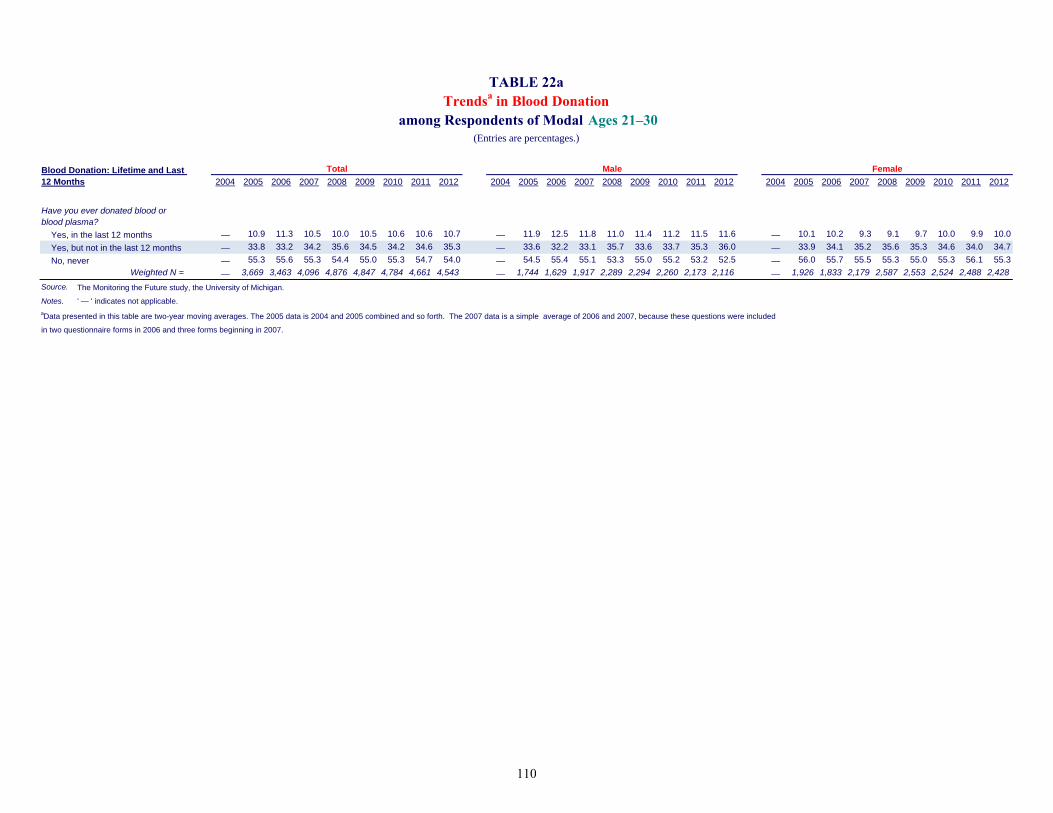
2004 2005 2006 2007 2008 2009 2010 2011 2012 2004 2005 2006 2007 2008 2009 2010 2011 2012 2004 2005 2006 2007 2008 2009 2010 2011 2012
Yes, in the last 12 months — 10.9 11.3 10.5 10.0 10.5 10.6 10.6 10.7 — 11.9 12.5 11.8 11.0 11.4 11.2 11.5 11.6 — 10.1 10.2 9.3 9.1 9.7 10.0 9.9 10.0
Yes, but not in the last 12 months — 33.8 33.2 34.2 35.6 34.5 34.2 34.6 35.3 — 33.6 32.2 33.1 35.7 33.6 33.7 35.3 36.0 — 33.9 34.1 35.2 35.6 35.3 34.6 34.0 34.7
No, never — 55.3 55.6 55.3 54.4 55.0 55.3 54.7 54.0 — 54.5 55.4 55.1 53.3 55.0 55.2 53.2 52.5 — 56.0 55.7 55.5 55.3 55.0 55.3 56.1 55.3
Weighted N = — 3,669 3,463 4,096 4,876 4,847 4,784 4,661 4,543 — 1,744 1,629 1,917 2,289 2,294 2,260 2,173 2,116 — 1,926 1,833 2,179 2,587 2,553 2,524 2,488 2,428
Source. The Monitoring the Future study, the University of Michigan.
Notes. ' — ' indicates not applicable.
aData presented in this table are two-year moving averages. The 2005 data is 2004 and 2005 combined and so forth. The 2007 data is a simple average of 2006 and 2007, because these questions were included
in two questionnaire forms in 2006 and three forms beginning in 2007.
TABLE 22aTrendsa in Blood Donation
among Respondents of Modal Ages 21–30(Entries are percentages.)
Total Male FemaleBlood Donation: Lifetime and Last 12 Months
Have you ever donated blood or blood plasma?
110

2008 2009 2010 2011 2012 2008 2009 2010 2011 2012 2008 2009 2010 2011 2012
Yes, in the last 12 months — 8.2 8.2 8.5 8.5 — 9.5 9.8 9.5 7.9 — 7.0 6.8 7.6 9.0
Yes, but not in the last 12 months — 41.3 40.9 41.5 42.1 — 40.2 40.2 42.1 42.1 — 42.3 41.6 41.0 42.1
No, never — 50.5 50.9 50.0 49.5 — 50.3 50.1 48.4 50.1 — 50.7 51.6 51.4 48.9
Weighted N = — 1,454 1,900 1,785 1,767 — 710 918 836 823 — 745 982 948 944
Source. The Monitoring the Future study, the University of Michigan.
Notes. ' — ' indicates not applicable. aData presented in this table are two-year moving averages. The 2009 data is 2008 and 2009 combined and so forth. The questions were contained in three of the six
questionnaire forms.
Have you ever donated blood or blood plasma?
TABLE 22bTrendsa in Blood Donation
among Respondents of Modal Age 35(Entries are percentages.)
Total Male Female
Blood Donation: Lifetime and Last 12 Months
111

Source. The Monitoring the Future study, the University of Michigan.
Trends (2-year average) in Annual Blood Donation FIGURE 9
by Gender among Respondents of Modal Ages 21-30
Trends (2-year average) in Annual Blood Donation by Gender among Respondents of Modal Age 35
0
5
10
15
20
2005 2006 2007 2008 2009 2010 2011 2012
PE
RC
EN
T
YEAR OF ADMINISTRATION
Male
Female
0
5
10
15
20
2005 2006 2007 2008 2009 2010 2011 2012
PE
RC
EN
T
YEAR OF ADMINISTRATION
Male
Female
112

Chapter 12: Conclusions
Chapter 12
CONCLUSIONS
Risk behaviors for the spread of HIV/AIDS are all too prevalent among today’s young adults. The number of young adults who engage in sex with multiple partners and the number of men who engage in the high-risk behavior of having unprotected sex with other men are perhaps the most important. About one quarter (24%) of young adults aged 21 to 30 indicated having more than one sex partner in the prior 12 months, 9% said they had more than three partners (12% of males and 7% of females), and 5% said they had five or more partners. Among sexually active male respondents, about one in twenty (5.3%) indicated having had any sex with a male partner in the prior 12 months, with the majority of them (constituting 4.4% of the total sample of males) reporting having had only male partners.
Men reporting sex exclusively with men are considerably more likely to have multiple partners than men reporting sex exclusively with women, thus compounding their risk. While men who have sex exclusively with men use condoms slightly more frequently than men who have sex exclusively with women, the differences are small and not statistically significant—39% of the former group say they use condoms “most times” or “always” versus 37% in the latter group.
The protective behavior of condom use rises considerably with the number of sex partners reported. The higher the number of partners reported, the higher the rate of condom use; this holds true for both genders.
Some 41% of men who report having sex exclusively with men in the prior 12 months indicate having been tested for HIV/AIDS in the same interval. This compares with only 17% of men who report having sex exclusively with women. (Men who have sex exclusively with men are also more likely to obtain the results of the test.) Among all respondents, the proportion getting tested for HIV/AIDS rises with the number of sex partners reported, though even among those with five or more partners during the year, only 38% indicate being tested in that interval. These data suggest that a number of people recognize that their sexual practices put them at greater risk and take action to determine whether they are already infected. That can be particularly important because it can allow a person testing positive to initiate treatment and protect against spreading the disease to others either by refraining from sexual contact or by using condoms. Interestingly, condom use and HIV testing—two risk reduction behaviors—do not seem to correlate with each other.
Donating blood is not a risk factor for contracting HIV. But those who are otherwise at high risk for contracting HIV who do give blood (against blood donation instructions) put the population at some minimal risk. For example, men who have had sex with men are not supposed to donate blood, based on the FDA (2013) and Red Cross (n.d.) regulations regarding eligibility. However, the evidence here is that relatively few are deterred from doing so. Some 41% of males who report having any sex with men in the prior year indicate having given blood at some time in their lifetime (vs. 48% for those not reporting sex with men), and 7.4% indicate donating in just the past year (vs. 12%). Further, those donating blood have a very similar rate of lifetime and
113
Monitoring the Future
annual injection drug use to those not donating blood, though people who have injected drugs are supposed to be deselected from donating based on their answers to the screening questionnaires. Finally, respondents reporting high numbers of sex partners donate blood in similar proportions as those reporting few partners (though they are not asked to screen themselves out of the pool of donors.) Thus it seems that blood donation centers have not been entirely successful at screening out these higher-risk donors, despite considerable attempts to do so.
“Only” about 0.4% of 21- to 30-year-old respondents surveyed in 2004–2012 (combined) admitted to ever sharing needles in their lifetime—0.1% in the prior 12 months. Importantly, nearly one-third of injection drug users report sharing needles. Although these respondents represent a small proportion of the population, they are at particularly high-risk for contracting HIV, and we believe it likely that our estimates of the size of this group are low.
Findings reported here for young adults are based on the nine years of data collection combined; and, as we have stated at various points in this monograph, even then the numbers of cases often are not sufficient to provide statistical confidence particularly with the relatively rare behaviors. But the prevalence data tend to replicate across years, giving us increased confidence in their validity.
The extent to which these HIV/AIDS risk and protective behaviors are changing over time is of great importance to the country, and the evidence here from the most recent seven-year interval suggests that rather little change is taking place in the general population of young adults who have completed high school. One of the few changes to achieve statistical significance was a gradual decline in the proportion of young adult males who reported ever getting tested for HIV/AIDS—a change in the wrong direction—but fortunately there has been an offsetting reversal of that trend since 2010. One positive development is that the proportion of all young adults who fail to secure their test results started out low in 2004—the beginning year for this study—and became still lower in 2011 by a statistically significant amount (but there was a slight nonsignificant increase in 2012). Overall, there is not much evidence of progress in HIV risk reduction being made during this period1.
As we have argued in the context of drug abuse, there is always a danger of generational forgetting—that through generational replacement combined with less attention to the topic in media and interventions, younger cohorts may not acquire the knowledge and concern about risks that earlier cohorts possessed and that led them to avoid risky behaviors. It seems likely that there has been a considerable shift over the past two decades in the perceived dangers of HIV/AIDS, leaving recent cohorts of young adults more vulnerable to taking risks. In particular, survival rates for those having AIDS have increased, starting around 1996 with the introduction of antiretroviral therapy (Crum et al., 2006); see also http://www.cdc.gov/media/pressrel/aids-d1.htm. This is certainly a very favorable development—but one that also carries its own risks for incoming cohorts of young adults.
1It should be noted that we have not been able to make estimates for some of the highest risk subgroups in the population as identified by the Centers for Disease Control & Prevention (March 14, 2012): these include (in order after White men who have sex with men [MSM]) Black MSM, Hispanic/Latino MSM, Black heterosexual women, Black heterosexual men, Hispanic/Latina heterosexual women, (followed by White heterosexual women), etc. To be able to make meaningful estimates for these subgroups would require much larger samples than we have.
114

Chapter 12: Conclusions
Although great progress has been made in HIV risk reduction in recent decades, the MTF results show that there is no room for complacency. There appears to be a substantial portion of the population that current HIV policies and interventions are not reaching. These MTF results suggest that efforts to reduce HIV risk beyond current levels will require further research and innovation in the HIV prevention field.
115

Monitoring the Future
References
American Red Cross. (n.d.). Eligibility requirements. Retrieved from http://www.redcrossblood.org/donating-blood/eligibility-requirements/ Centers for Disease Control and Prevention (March 14, 2012). HIV in the United States: At a glance. Retrieved from http://www.cdc.gov/hiv/resources/factsheets/us.htm Crum, N. F., Riffenburgh, R. H., Wegner, S., Agan, B. K., Tasker, S. A., Spooner, K. M., Armstrong, A. W., Fraser, S., & Wallace, M. R. (2006). Comparisons of causes of death and mortality rates among HIV-infected persons: Analysis of the pre-, early, and late HAART (highly active antiretroviral therapy) eras. Journal of Acquired Immune Deficiency Syndromes 41:2, 194-200. U.S. Food and Drug Administration (FDA). (2013). Questions about blood. Retrieved from http://www.fda.gov/biologicsbloodvaccines/bloodbloodproducts/questionsaboutblood/ucm108186.htm
116

Appendix: Other Relevant Studies
APPENDIX
OTHER RELEVANT STUDIES OF THE GENERAL POPULATION The six other studies that generate information on risk and protective behaviors on national samples of the U.S. population are described below. The degree of overlap with MTF is discussed for each. National Longitudinal Study of Adolescent Health (Add Health). The Add Health study is a nationally representative, longitudinal study of U.S. youth who were in grades 7–12 during the 1994–1995 school year. The original panel, surveyed in-home, initially comprised around 21,000 individuals, with about 15,000 interviewed at waves 2, 3, and 4. This set of class cohorts has been followed into adulthood, with additional data collection waves in 1996, 2001/2002, and 2007/2008 (Harris et al., 2008). Collected data include measures on perceived risk of HIV/AIDS, sexual behavior history, contraceptive use, sexually transmitted disease (STD) history, and substance use including injection drug use (IDU) and needle sharing. Not all of the HIV/AIDS risk behavior measures are asked at each wave of data collection. Analyses published with Add Health data have shown important racial/ethnic differences in contraceptive use (including condom use) and number of sexual partners (Bartlett et al., 2008), prevalence rates of STDs and HIV infections, as well as sexual behavior and substance use patterns (Hallfors et al., 2007; Kuo & Lawrence, 2006; Morris, et al., 2006). It has shown relationships between chronic depression and having multiple sexual partners (Khan et al., 2009). Important sociodemographic differences in self-reported HIV testing have also been found (Nguyen et al., 2006). The Add Health study, which uses in-home data collections, follows one set of six adjacent class cohorts, in contrast to MTF, which continually adds cohorts and can thus track historical trends for fixed age groups and for various cohorts over the years. For more information about Add Health, see http://www.cpc.unc.edu/projects/addhealth. General Social Survey (GSS). Conducted by the National Opinion Research Center at the University of Chicago, GSS began in 1972 as an annual survey (although no surveys were conducted in 1979, 1981, or 1992) and went to a biennial format beginning in 1994. Prior to 2008, the study used cross-sectional surveys of the U.S. adult household population (ages 18 and over). Starting in 2008, the design was changed to a rotating panel, with each entering cohort to be followed up for the next two consecutive surveys (e.g., the 2006 cohort was interviewed in 2008 and 2010; National Opinion Research Center, n.d.). However, the HIV/AIDS risk behaviors are not included in the panel re-interviews. The majority of GSS data is obtained using face-to-face interviewing; in 2002, it switched to computer-assisted personal interviewing (CAPI). As part of the CAPI format the respondent is handed the interviewer’s laptop computer to self-complete the more sensitive sections. Because MTF uses self-administered, mailed questionnaires, and thus does not have an interviewer present, a higher level of perceived privacy may exist for respondents when answering HIV/AIDS risk behavior–related items (Brener et al., 2006) resulting in more valid data. Items on sexual risk and protective factors were added to the GSS starting in 1988, and now include measures such as number and type of sex partners, ever
117

Monitoring the Future
paying for sex, heterosexual and homosexual sex, condom use, and HIV/AIDS testing. A limited number of substance use items are asked, including injection drug use (but not needle sharing) and crack cocaine use (both asking about lifetime and past 30 days). However, the only other item on substance use (use of any illegal drugs in the past 12 months) has not been asked since 2004 (Davis & Smith, 2007). The majority of HIV/AIDS publications from the GSS have reported on sexual risk behaviors (Anderson, 2003; Anderson et al., 2003; Choi et al., 1994; Johnen et al., 1995). Given that substance use behaviors are not consistently collected in the GSS and needle sharing is not measured, MTF provides an important additional source for data that look at the intersection of these behaviors with other HIV/AIDS risk and protective factors. MTF also includes the collection of longitudinal panel data, in addition to cross-sectional data, on both risk and protective behaviors. For more information about GSS, see http://www.norc.org/Research/Projects/Pages/general-social-survey.aspx. National Survey on Drug Use and Health (NSDUH). Begun in 1971, the NSDUH study is now an annual, cross-sectional survey of the civilian, non-institutionalized U.S. population ages 12 and older (SAMHSA, 2006). In 1999, NSDUH was redesigned to allow state-level estimates. As suggested by the study name, the focus is on measures related to substance use, including injection drug use (IDU) (SAMHSA, 2009; SAMHSA, 2008). Published findings utilizing NSDUH data related to IDU have reported national IDU prevalence levels, as well as important demographic and geographic variation in such use (SAMHSA, 2007). Data are also collected on lifetime and past-year HIV/AIDS diagnoses as well as related health conditions such as hepatitis and sexually transmitted diseases. However, data on participation in high-risk sexual behaviors and behaviors such as needle-sharing are not collected, which distinguishes NSDUH from MTF. In addition, MTF collects longitudinal data on individuals over time as part of its cohort-sequential design. For more information about NSDUH, see https://nsduhweb.rti.org. National Health and Nutrition Examination Survey (NHANES). NHANES began in the early 1960s as a series of surveys initiated by the National Center for Health Statistics, focusing on different population groups and health topics. In 1999, NHANES began to be conducted on a continuous basis with a nationally representative cross-sectional sample of approximately 5,000 individuals per year (CDC, 2009). Data on number and type of sexual partners, as well as condom use, are collected from respondents aged 14–69. Through 2004, only limited drug use data were collected. However, beginning in 2005, age at first use, lifetime, and past 30-day use of marijuana, cocaine, heroin, methamphetamine, and injection drug use were collected from individuals aged 12–69 (needle sharing is not included). NHANES data for these items are collected using audio computer-assisted self interviewing (A-CASI) at NHANES mobile examination centers. In an A-CASI, the interviewer is aware of neither the highly sensitive questions as they are asked nor the answers being given, thus providing respondents with a high level of privacy similar to self-administered questionnaires like those used in MTF (Brener, et al., 2006). NHANES is the only national survey that collects blood samples and tests blood samples from participants aged 18–49 for the HIV antibody (CDC, 2011). Longitudinal data are not collected on NHANES participants. MTF includes a broader range of substance use measures, including needle sharing, and is able to utilize panel data to examine individual change over time in HIV/AIDS risk and protective behaviors. For more information about NHANES, see http://www.cdc.gov/nchs/nhanes.htm.
118

Appendix: Other Relevant Studies
National Survey of Family Growth (NSFG). Sponsored by the National Center for Health Statistics, NSFG was begun in 1973 and was initially designed to be a national U.S. fertility study, with only female respondents. Beginning in 2002 (Cycle 6), the survey provided nationally representative cross-sectional samples of both males and females ages 15–44. In mid-2006, the NSFG began continuous interviewing utilizing a rolling, cumulating yearly nationally representative sample of U.S. households (Cycle 7, which ended in 2009) (Lepkowski et al., 2006). The latest cycle gathers detailed data on sexual risk behaviors of many kinds, including number of sex partners and condom use, differentiating by age and race/ethnicity (Gavin et al., 2009), other sociodemographic differences in heterosexual anal and oral sex (Leichliter et al., 2007), and sexual health risks and formal sex education (Kohler et al., 2008). Homosexual sex is also detailed in the interviews. The NSFG contains some items on substance use, including a lifetime measure of needle sharing; it also asks about diagnoses of sexually transmitted diseases related to HIV/AIDS risk behaviors. A-CASIs are used to gather data on these highly sensitive and detailed sexual behaviors, thus providing respondents with a high level of privacy. MTF uses self-administered, mailed questionnaires, which should also provide respondents with a high level of privacy similar to that in A-CASI and thus provide similarly valid data (Brener et al., 2006). Like NSDUH, longitudinal panel data are not collected on respondents in NSFG. MTF has relevant prior and subsequent data from the respondents in its panels, including HIV/AIDS risk and protective behaviors from age 21 into later time points. Further, MTF is capable of correcting for the recanting of earlier reported behaviors (Johnston & O’Malley, 1997; Johnston et al., 2013). MTF encompasses every cohort graduating from high school since 2004, gathering data annually on each, starting when they reach age 21. For more information about NSFG, see http://www.cdc.gov/nchs/nsfg.htm. National Youth Risk Behavior Survey (YRBS). YRBS is conducted every two years, and provides nationally representative, cross-sectional data on priority health risk behaviors for 9th- through 12th-grade students in public and private U.S. schools (Brener et al., 2004). The number of respondents averages around 16,000 cases per survey. Several HIV/AIDS-related risk behaviors have been measured since its inception in 1991, including substance use and sexual activity. Published YRBS data include national and sociodemographic group-specific prevalence measures of high school student licit and illicit substance use (including a measure of lifetime intravenous drug use), lifetime and current sexual activity (including number of partners), condom use, substance use before sexual behavior, and HIV/AIDs education and testing (Eaton et al., 2008; Voetsch et al., 2009). YRBS data have been used to examine trends over time in such behaviors (Gavin et al., 2009; Balaji et al., 2008), as well as how substance use and sexual risk behaviors interrelate (Santelli et al., 2009; Springer et al., 2007). The work of MTF complements that of the YRBS by covering respondents ages 21 to 30, a highly relevant age group for the spread of HIV/AIDS. It also contains a more complete set of drug use measures, including annual and 30-day injection drug use, and lifetime and past-year needle sharing. In addition, the longitudinal nature of MTF allows an examination of how HIV/AIDS risk behaviors change over time across age within different cohorts. For more information about YRBS, see http://www.cdc.gov/HealthyYouth/yrbs/index.htm. Key Distinctions among the Studies
A review of these six studies shows that, although key data are provided by each, none of the studies allows for the ongoing, cohort-sequential prospective examination of both substance use and other risk and protective behaviors for HIV/AIDS among the U.S. young adult population.
119

Monitoring the Future
YRBS does not cover age groups above age 18 or 19; GSS does not broadly examine substance use behaviors, nor does it include the HIV/AIDS risk and protective behaviors in its panels; NSDUH does not cover sexual behaviors; Add Health covers only six class-cohorts; NSFG has longer time cycles between surveys, and NSFG, YRBS and NSDUH do not gather longitudinal panel data on their respondents. Further, most of these studies do not duplicate all of the measures of risk and protective behaviors covered in MTF. Thus, along with these other national studies, MTF is an essential component of the nation's efforts to monitor and understand HIV/AIDS risk behaviors. Whatever changes occur in the proportions of American young adults choosing to engage in these risk and risk-reduction behaviors will, of course, have very important consequences for the course of the nation’s HIV/AIDS epidemic, which is why MTF findings stand to make important contributions to our understanding of this major health problem and our ability to deal with it effectively.
120
Appendix: Other Relevant Studies
References
Anderson, J.E. (2003). Condom use and HIV risk among US adults. American Journal of Public Health, 6, 912–914. Anderson, J.E., Santelli, J., & Mugalla, C. (2003). Changes in HIV-related preventive behavior in the U.S. population: Data from national surveys 1987–2002. Epidemiology and Social Science, 10, 195–202. Balaji, A., Lowry, R., Brener, N., Kann, L., Romero, L., & Wechsler, H. (2008). Trends in HIV- and STD-related risk behaviors among high school students—United States, 1991–2007. Morbidity and Mortality Weekly Report, 57(30), 817–822. Bartlett, R., Raymond, B., & Shattell, M.M. (2008). Risk and protection for HIV/AIDS in African-American, Hispanic, and White adolescents. Journal of National Black Nurses Association, 19(1), 19–25. Brener, N.D., Eaton, D.K., Kann, L., Grunbaum, J.A., Gross, L.A., Kyle, T.M., & Ross, J.G. (2006), The association of survey setting and mode with self-reported health risk behaviors among high school students. Public Opinion Quarterly, 70 (3), 354–374. Brener, N.D., Kann, L., Kinchen, S.A., Grunbaum, J.A., Whalen, L., Eaton, D., et al. (2004). Methodology of the Youth Risk Behavior Surveillance System. Morbidity and Mortality Weekly Report, 53(RR-12), 1–13. Centers for Disease control and Prevention (CDC). (2009). About the National Health and Nutrition Examination Survey. Retrieved from: http://www.cdc.gov/nchs/nhanes/about_nhanes.htm. Accessed 22 July 2011. Centers for Disease Control and Prevention (CDC). (2011). NHANES 2009-2010: Survey contents. Retrieved from: http://www.cdc.gov/nchs/data/nhanes/survey_content_99_10.pdf. Accessed 22 July 2011. Choi, K.-H., Catania, J.A., & Dolcini, M.M. (1994). Extramarital sex and HIV risk behavior among U.S. adults: Results from the National AIDS Behavioral Survey. American Journal of Public Health, 12, 2003–2007. Davis, J.A., & Smith, T.W. (2007). General social surveys, 1972–2008. Storrs, CT: The Roper Center for Public Opinion Research, University of Connecticut. Eaton, D.K., Kann, L., Kinchen, S., Shanklin, S., Ross, J., Hawkins, J., et al. (2008). Youth risk behavior surveillance—United States, 2007. Morbidity and Mortality Weekly Report, 57(SS-4), 1–131. Gavin, L., MacKay, A.P., Brown, K., Harrier, S., Ventura, S.J., Kann, L., et al. (2009). Sexual and reproductive health of persons aged 10–24 years—United States, 2002–2007. Morbidity and Mortality Weekly Report, 58(SS-6), 1–60.
121

Monitoring the Future
Hallfors, D.D., Iritani, B.J., Miller, W.C., & Bauer, D.J. (2007). Sexual and drug behavior patterns and HIV and STD racial disparities: The need for new directions. American Journal of Public Health, 97(1), 125–132. Harris, K.M., Halpern, C.T., Entzel, P., Tabor, J., Bearman, P.S., & Udry, J.R. (2008). The National Longitudinal Study of Adolescent Health: Research design. Retrieved from http://www.cpc.unc.edu/projects/addhealth/design. Johnen, E.C., Bernard, H.R., & Killworth, P.D. (1995). A social network approach to corroborating the number of AIDS/HIV+ victims in the U.S. Social Networks, 7, 167–187. Johnston, L.D., & O'Malley, P.M. (1997). The recanting of earlier reported drug use by young adults. In L. Harrison & A. Hughes (Eds.), The validity of self-reported drug use: Improving the accuracy of survey estimates (pp. 59-80). (NIDA Research Monograph 167.) Rockville, MD: National Institute on Drug Abuse. Retrieved from http://archives.drugabuse.gov/pdf/monographs/monograph167/059-080_Johnston.pdf Johnston, L.D., O’Malley, P.M., Bachman, J.G., & Schulenberg, J.E. (2013). Monitoring the Future national survey results on drug use, 1975–2012. Volume II: College students and adults ages 19–50. Ann Arbor, MI: Institute for Social Research, The University of Michigan. http://monitoringthefuture.org/pubs/monographs/mtf-vol2_2012.pdf.
Khan, M.R., Kaufman, J.S., Pence, B. W., Gaynes, B.N., Adimora, A.A., Weir, S.S., et al. (2009.) Depression, sexually transmitted infection, and sexual risk behavior among young adults in the United States. Archives of Pediatrics and Adolescent Medicine, 163(7), 644–652. Kohler, P.K., Manhart, L.E., & Lafferty, W.E. (2008). Abstinence-only and comprehensive sex education the initiation of sexual activity and teen pregnancy. Journal of Adolescent Health, 42(4), 344–351.
Kuo, W.H., & Lawrence, J.S.S. (2006). Sexual behavior and self-reported sexually transmitted diseases (STDs): Comparison between White and Chinese American young people. Culture and Sexuality, 8(4), 335–349. Leichliter, J.S., Chandra, A., Liddon, N., Fenton, K.A., & Aral, S.O. (2007). Prevalence and correlates of heterosexual anal and oral sex in adolescents and adults in the United States. Journal of Infectious Diseases, 196(12), 1852–1859.
Lepkowski, J.M., Mosher, W.D., Davis, K.E., Groves, R.M., van Hoewyk, J., & Willem, J. (2006). National Survey of Family Growth, Cycle 6: Sample design, weighting, imputation, and variance estimation. Vital and Health Statistics, 2(142), 1–82. Morris, M., Handcock, M.S., Miller, W.C., Ford, C.A., Schmitz, J.L., Hobbs, M.M., et al. (2006). Prevalence of HIV infection among young adults in the United States: Results From the Add Health study. American Journal of Public Health, 96, 1091–1097.
122
Appendix: Other Relevant Studies
Nguyen, T.Q., Ford, C.A., Kaufman, J.S., Leone, P.A., Suchindran, C., & Miller, W.C. (2006). HIV testing among young adults in the United States: Association with financial resources and geography. American Journal of Public Health, 96, 1031–1034. National Opinion Research Center. (n.d.). FAQs: How many people are interviewed for each GSS? Retrieved from http://www3.norc.org/gss+website/faqs/faqs.htm. Santelli, J., Carter, M., Orr, M., & Dittus, P. (2009). Trends in sexual risk behaviors, by nonsexual risk behavior involvement, U.S. high school students, 1991–2007. Journal of Adolescent Health, 44(4), 372–379. Springer, A.E., Peters, R.J., Shegog, R., White, D.L., & Kelder, S.H. (2007). Methamphetamine use and sexual risk behaviors in US high school students: Findings from a national risk behavior survey. Prevention Science, 8(2), 103–113. Substance Abuse and Mental Health Services Administration (SAMHSA). (2006). National Survey on Drug Use and Health: Summary of methodological studies, 1971–2005 (Office of Applied Studies, Methodology Series M-6, DHHS Publication No. SMA 06-4146). Rockville, MD. Substance Abuse and Mental Health Services Administration (SAMHSA). (2008). Results from the 2007 National Survey on Drug Use and Health: National findings (Office of Applied Studies, NSDUH Series H-34, DHHS Publication No. SMA 08-4343). Rockville, MD. Substance Abuse and Mental Health Services Administration (SAMHSA), Office of Applied Studies. (July 19, 2007). The NSDUH Report: Demographic and geographic variations in injection drug use. Rockville, MD. Substance Abuse and Mental Health Services Administration (SAMHSA), Office of Applied Studies. (March 19, 2009). The NSDUH report: Concurrent illicit drug and alcohol use. Rockville, MD. Voetsch, A., Balaji, A., Heffelfinger, J., Miller, K., Branson, B., Eaton, D., et al. (2009). HIV testing among high school students—United States, 2007. Morbidity and Mortality Weekly Report, 58(24), 665–668.
123

Monitoring the Future website: http://www.monitoringthefuture.org
124

Institute for Social Research
The University of Michigan
2013
MONITORINGFUTUREthe