HIV Care Continuum Persons Living With HIV, G eorgia, 2012
36
HIV Care Continuum Persons Living With HIV, Georgia, 2012
-
Upload
petra-nichols -
Category
Documents
-
view
33 -
download
0
description
HIV Care Continuum Persons Living With HIV, G eorgia, 2012. Persons with HIV Engaged in S elected S tages of the Continuum of Care, United States. 82. 66. Percent. 37. 33. 25. Hall et al . XIX International AIDS Conference, 2012 ART, antiretroviral therapy. - PowerPoint PPT Presentation
Transcript of HIV Care Continuum Persons Living With HIV, G eorgia, 2012

HIV Care ContinuumPersons Living With HIV,
Georgia, 2012

Diagnose
d
Linke
d to ca
re
Retained in
care
Prescribed ART
Viral S
uppression
0102030405060708090
100
Persons with HIV Engaged in Selected Stages of the Continuum of Care, United States
Perc
ent
82
66
37 3325
Hall et al. XIX International AIDS Conference, 2012ART, antiretroviral therapy
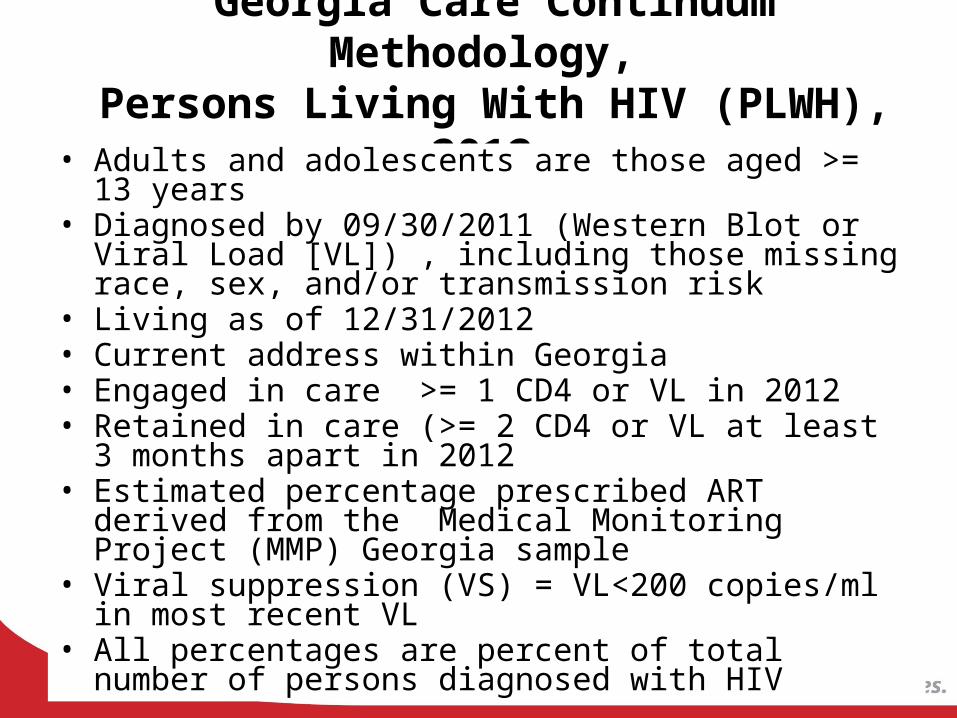
Georgia Care Continuum Methodology, Persons Living With HIV (PLWH), 2012
• Adults and adolescents are those aged >= 13 years• Diagnosed by 09/30/2011 (Western Blot or Viral Load [VL]) ,
including those missing race, sex, and/or transmission risk• Living as of 12/31/2012• Current address within Georgia• Engaged in care >= 1 CD4 or VL in 2012• Retained in care (>= 2 CD4 or VL at least 3 months apart in
2012• Estimated percentage prescribed ART derived from the
Medical Monitoring Project (MMP) Georgia sample • Viral suppression (VS) = VL<200 copies/ml in most recent VL• All percentages are percent of total number of persons
diagnosed with HIV

Special consideration: linkage to care within 3 months for prevalent population
• HIV reporting began in Georgia 2004; CD4 and viral load (VL) measurements are not available before this date
• Linkage to care proxy is CD4 or VL within 3 months of diagnosis date
• Linkage is missing for 54% of Georgia’s prevalent HIV population and therefore not represented here
• Linkage to care data are included in the New Diagnoses 2011 slide set for persons diagnosed in 2011

Special Consideration: people living with HIV, diagnosed in 2011
• Linkage to care = CD4 or VL within 3 months of diagnosis
• For persons diagnosed in 2011, the first CD4 or VL represents linkage to care
• CD4 or VL within the first 3 months of diagnosis is excluded from the engagement and retention in care measurements
• To allow 12 months for engagement and retention in care and viral suppression, only persons diagnosed by 09/30/2011 and followed through 12/31/12 are included

Adults and adolescents living with HIV, Georgia, 2012
Diagnosed only Including estimated undiagnosed0
20
40
60
80
100100
82
5444
383134
2839
32
Diagnosed Engaged Retained ART Viral suppression
Perc
en
t
N=46,495 N=56,701
Adults and adolescents >= age 13, diagnosed by 09/30/2011, living 12/31/2012, Georgia = 46,495Engaged in care >= 1 CD4 or VL in 2012Retained in care >= 2 CD4 or VL at least 3 months apart in 2012Prescribed ART derived from MMP sample Viral suppression (VS) = VL<200 copies/ml Estimated undiagnosed based on CDC projections for proportion undiagnosed nationally
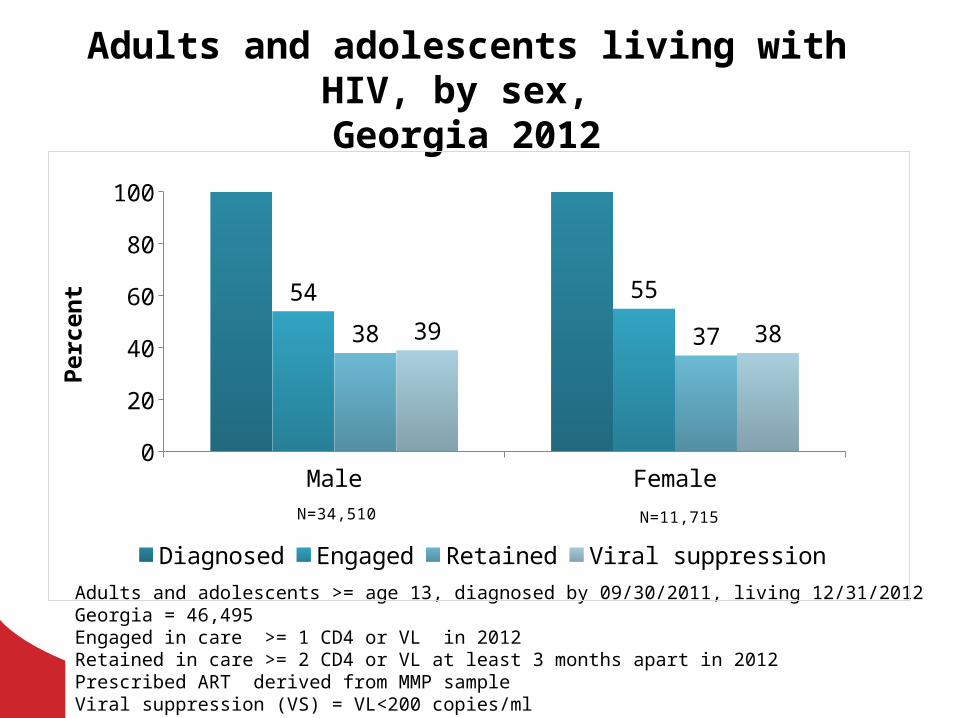
Adults and adolescents living with HIV, by sex,
Georgia 2012
Adults and adolescents >= age 13, diagnosed by 09/30/2011, living 12/31/2012 Georgia = 46,495Engaged in care >= 1 CD4 or VL in 2012Retained in care >= 2 CD4 or VL at least 3 months apart in 2012Prescribed ART derived from MMP sample Viral suppression (VS) = VL<200 copies/ml Excludes 270 cases for whom sex was not reported
Male Female0
20
40
60
80
100
54 55
38 3739 38
Diagnosed Engaged Retained Viral suppression
Perc
en
t
N=34,510 N=11,715

Adults and adolescents living with HIV, by race/ethnicity, Georgia, 2012
Black Hispanic/Latino White Other*/ Unknown
0
20
40
60
80
100
54 51 55 57
36 3542 4036 37
45 43
Diagnosed EngagedRetained Viral suppression
Perc
en
t
N= 30,150 N= 2,282 N= 9,382 N= 4,681
Adults and adolescents >= age 13, diagnosed by 09/30/2011, living 12/31/2012, Georgia = 46,495Engaged in care >= 1 CD4 or VL in 2012Retained in care >= 2 CD4 or VL at least 3 months apart in 2012Viral suppression (VS) = VL<200 copies/ml *American Indian/Alaska Native, Asian and Native Hawaiian/Pacific Islander groups together constitute <2% of adults living with HIV in Georgia and are grouped with those of mixed or unknown race/ethnicity

Adult and adolescent males living with HIV, by race/ethnicity, Georgia
2012
Black Hispanic/Latino White Other*/ Unknown
0
20
40
60
80
100
53 5056 60
36 3443 43
35 3746 46
Diagnosed Engaged Retained Viral suppression
Perc
en
t
N= 21,178 N= 8,071 N= 1,784 N= 3,477
Adult and adolescent males >= age 13, diagnosed by 09/30/2011, living 12/31/2012, Georgia = 34,510Engaged in care >= 1 CD4 or VL in 2012Retained in care >= 2 CD4 or VL at least 3 months apart in 2012Viral suppression (VS) = VL<200 copies/ml *American Indian/Alaska Native, Asian and Native Hawaiian/Pacific Islander groups together constitute <2% of males living with HIV in Georgia and are grouped with those of mixed or unknown race/ethnicity

Adult and adolescent females living with HIV, by race/ethnicity, Georgia
2012
Black Hispanic/Latino
White Other*/ Unknown
0
20
40
60
80
100
57 53 51 5138 38 33 3338 40 38 35
Diagnosed Engaged Retained Viral suppression
Perc
en
t
Adult and adolescent females >= age 13, diagnosed by 09/30/2011, living 12/31/2012, Georgia = 11,715Engaged in care >= 1 CD4 or VL in 2012Retained in care >= 2 CD4 or VL at least 3 months apart in 2012Viral suppression (VS) = VL<200 copies/ml American Indian/Alaska Native, Asian and Native Hawaiian/Pacific Islander groups together constitute <1% of adults living with HIV in Georgia and are grouped with those of mixed or unknown race/ethnicity
N= 8,926 N= 492 N= 1303 N= 994

Adults and adolescents living with HIV by current age (years),
Georgia 2012
13-24 25-34 35-44 45-54 55+0
102030405060708090
100
5853 56 56
50
35 3338 40 37
30 3139 42 40
Diagnosed EngagedRetained Viral suppression
Perc
en
t
N= 1,814 N= 7,789 N= 11,665 N= 15,915 N= 9,312
Adults and adolescents >= age 13, diagnosed by 09/30/2011, living 12/31/2012, Georgia = 46,495Engaged in care >= 1 CD4 or VL in 2012Retained in care >= 2 CD4 or VL at least 3 months apart in 2012Viral suppression (VS) = VL<200 copies/ml
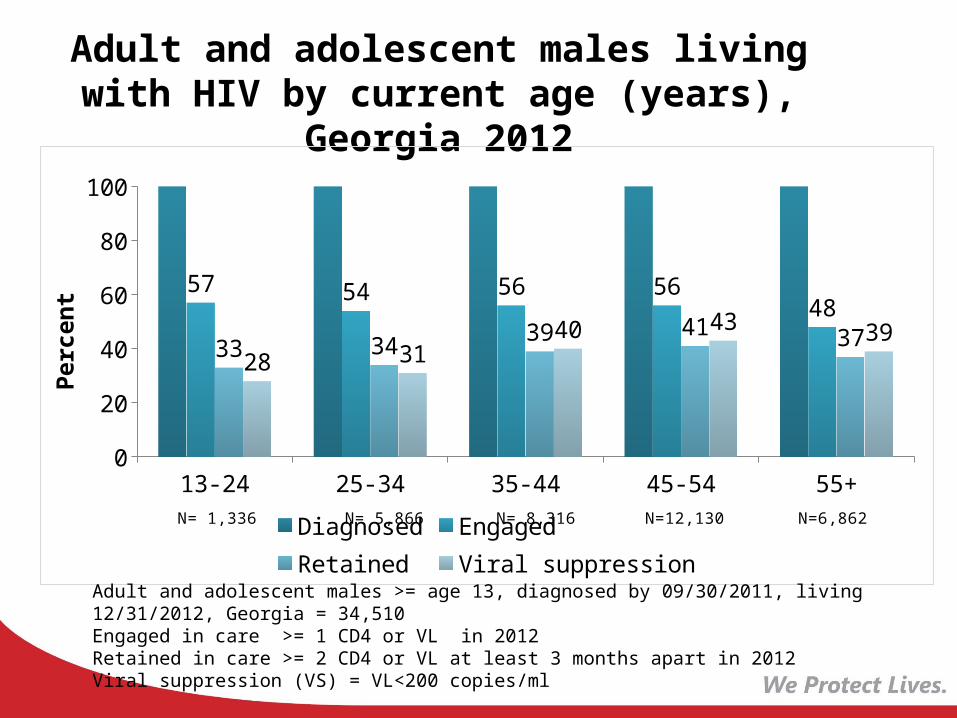
Adult and adolescent males living with HIV by current age (years),
Georgia 2012
13-24 25-34 35-44 45-54 55+0
20
40
60
80
100
57 54 56 5648
33 34 39 41 3728 31
40 43 39
Diagnosed EngagedRetained Viral suppression
Perc
en
t
N= 1,336 N= 5,866 N=12,130N= 8,316 N=6,862
Adult and adolescent males >= age 13, diagnosed by 09/30/2011, living 12/31/2012, Georgia = 34,510Engaged in care >= 1 CD4 or VL in 2012Retained in care >= 2 CD4 or VL at least 3 months apart in 2012Viral suppression (VS) = VL<200 copies/ml

Adult and adolescent females living with HIV by current age
(years),Georgia 2012
13-24 25-34 35-44 45-54 55+0
102030405060708090
100
6150
55 57 56
43
31 35 38 393528
3641 43
Diagnosed Engaged in careRetained Viral suppression
Perc
en
t
N= 468 N= 1,856 N= 3,265 N= 3,712 N= 2,414
Adult and adolescent females >= age 13, diagnosed by 09/30/2011, living 12/31/2012, Georgia = 11,715Engaged in care >= 1 CD4 or VL in 2012Retained in care >= 2 CD4 or VL at least 3 months apart in 2012Viral suppression (VS) = VL<200 copies/ml

Transmission category definitions
• Multiple imputation was used to re-distribute transmission category where missing
• MSM = Male to male sexual contact• IDU = Injection drug use• MSM/IDU = Male to male sexual contact and injection drug
use• HET = Heterosexual contact with a person known to have, or
to be at high risk for, HIV infection• Other = hemophilia, blood transfusion, perinatal exposure,
and risk factor not reported or not identified

Adult and adolescent males living with HIV, by transmission category,
Georgia 2012
MSM IDU MSM/IDU HET Other0
20
40
60
80
100
5643
52 53 55
3931
37 34 394031 36 37 42
Diagnosed Engaged Retained Viral suppression
Perc
en
t
N= 24,935 N= 2,583 N= 2,428N= 2,022 N= 2,541
Adult and adolescent males >= age 13, diagnosed by 09/30/2011, living 12/31/2012, Georgia = 34,510Engaged in care >= 1 CD4 or VL in 2012Retained in care >= 2 CD4 or VL at least 3 months apart in 2012Viral suppression (VS) = VL<200 copies/mlMultiple imputation is used to estimate number of persons in each transmission category. *MSM = Male to male sexual contact IDU = Injection drug useMSM/IDU = Male to male sexual contact and injection drug useHET = Heterosexual contact with a person known to have, or to be at high risk for, HIV infectionOther = hemophilia, blood transfusion, perinatal exposure, and risk factor not reported or not identified

Adult and adolescent females living with HIV, by transmission category,
Georgia 2012
HET IDU Other0
20
40
60
80
100
57 5445
37 3731
39 3731
Diagnosed EngagedRetained Viral suppression
Perc
en
t
N= 8,420 N= 2,452 N= 842
Adult and adolescent females >= age 13, diagnosed by 09/30/2011, living 12/31/2012, Georgia = 11,715Engaged in care >= 1 CD4 or VL in 2012 Retained in care >= 2 CD4 or VL at least 3 months apart in 2012Viral suppression (VS) = VL<200 copies/ml Multiple imputation is used to estimate number of persons in each transmission category. *IDU = Injection drug useHET = Heterosexual contact with a person known to have, or to be at high risk for, HIV infectionOther = hemophilia, blood transfusion, perinatal exposure, and risk factor not reported or not identified

Black MSM* living with HIV, by current age (years), Georgia
2012
13-24 25-34 35-44 45-54 55+0
20
40
60
80
100
55 54 57 5549
29 33 38 40 3725 30
38 40 39
Diagnosed Engaged Retained Viral suppression
Perc
en
t
N= 940 N= 3,968 N= 4,718N= 4,146 N= 1886
Adult and adolescent males >= age 13, diagnosed by 09/30/2011, living 12/31/2012, Georgia = 15,657Engaged in care >= 1 CD4 or VL in 2012Retained in care >= 2 CD4 or VL at least 3 months apart in 2012Viral suppression (VS) = VL<200 copies/mlMultiple imputation is used to estimate number of persons in each transmission category. *MSM = Male to male sexual contact IDU = Injection drug useMSM/IDU = Male to male sexual contact and injection drug useHET = Heterosexual contact with a person known to have, or to be at high risk for, HIV infectionOther = hemophilia, blood transfusion, perinatal exposure, and risk factor not reported or not identified

White MSM* living with HIV, by current age (years), Georgia 2012
13-24 25-34 35-44 45-54 55+0
20
40
60
80
100
60 56 60 56 5139 40 43 44 42
35 3947 47 45
Diagnosed Engaged Retained Viral suppression
Perc
en
t
N= 82 N= 592 N= 3,622N= 1,732 N= 2,043
Adult and adolescent males >= age 13, diagnosed by 09/30/2011, living 12/31/2012, Georgia = 8,071Engaged in care >= 1 CD4 or VL in 2012Retained in care >= 2 CD4 or VL at least 3 months apart in 2012Viral suppression (VS) = VL<200 copies/mlMultiple imputation is used to estimate number of persons in each transmission category. *MSM = Male to male sexual contact IDU = Injection drug useMSM/IDU = Male to male sexual contact and injection drug useHET = Heterosexual contact with a person known to have, or to be at high risk for, HIV infectionOther = hemophilia, blood transfusion, perinatal exposure, and risk factor not reported or not identified

Hispanic/Latino MSM* living with HIV, by current age (years), Georgia 2012
13-24 25-34 35-44 45-54 55+0
20
40
60
80
100
6353
47 524644
34 3038 33
4435 34
40 36
Diagnosed Engaged Retained Viral suppression
Perc
en
t
N= 52 N= 355 N= 559N= 607 N= 97
Adult and adolescent males >= age 13, diagnosed by 09/30/2011, living 12/31/2012, Georgia = 1,670Engaged in care >= 1 CD4 or VL in 2012Retained in care >= 2 CD4 or VL at least 3 months apart in 2012Viral suppression (VS) = VL<200 copies/mlMultiple imputation is used to estimate number of persons in each transmission category. *MSM = Male to male sexual contact IDU = Injection drug useMSM/IDU = Male to male sexual contact and injection drug useHET = Heterosexual contact with a person known to have, or to be at high risk for, HIV infectionOther = hemophilia, blood transfusion, perinatal exposure, and risk factor not reported or not identified

The HIV Care Continuum can help us…
• Focus our efforts for linkage, retention and viral suppression.• Identify groups at increased risk for dropping out of each
step in the continuum.• Monitor our progress in improvement of linkage, retention,
and viral suppression.• Identify disparities not only in prevalence but in care• Evaluate efforts addressing specific populations with low
viral suppression.• Monitor efforts in improving viral suppression in specific
counties, census tracts, zip codes and some specific facilities• Encourage improvement in surveillance data completeness
(race, sex, transmission category)

Viral suppression (VS) among adults and adolescents engaged
and retained in care, by sex, Georgia 2012
Male Female Unknown sex0
102030405060708090
100
72 687878 75
86
VS among engaged VS among retained
Perc
en
t
*N= number retained in careAdults and adolescents >= age 13, diagnosed by 09/30/2011, living 12/31/2012, Georgia Engaged in care >= 1 CD4 or VL in 2012Retained in care >= 2 CD4 or VL at least 3 months apart in 2012Viral suppression (VS) = VL<200 copies/ml
N* = 13,160 N* = 4,298 N* = 71

Viral suppression (VS) among adult and adolescent males engaged and retained in
care, by race/ethnicity, Georgia 2012
Black Hispanic/Latino
White Other*/Unknown
0102030405060708090
100
6673
837773
7987 83
VS among engaged VS among retained
Perc
en
t
*N= number retained in careAdult and adolescent males >= age 13, diagnosed by 09/30/2011, living 12/31/2012, Georgia Engaged in care >= 1 CD4 or VL in 2012Retained in care >= 2 CD4 or VL at least 3 months apart in 2012Viral suppression (VS) = VL<200 copies/ml*American Indian/Alaska Native, Asian and Native Hawaiian/Pacific Islander groups together constitute <2% of males living with HIV in Georgia and are grouped with those of mixed or unknown race/ethnicity
N* = 11,236 N* = 893 N* =4,490 N* =2,078

Viral suppression (VS) among adult and adolescent females engaged and retained
in care, by race/ethnicity, Georgia 2012
Black Hispanic/Latino
White Other*/Unknown
0
20
40
60
80
100
6776 73 7074
81 79 78
VS among engaged VS among retained
Perc
en
t
*N= number retained in careAdult and adolescent females >= age 13, diagnosed by 09/30/2011, living 12/31/2012, GeorgiaEngaged in care >= 1 CD4 or VL in 2012Retained in care >= 2 CD4 or VL at least 3 months apart in 2012Viral suppression (VS) = VL<200 copies/ml*American Indian/Alaska Native, Asian and Native Hawaiian/Pacific Islander groups together constitute <2% of males living with HIV in Georgia and are grouped with those of mixed or unknown race/ethnicity
N* = 186N* = 3,350 N* = 432 N* = 330

Viral suppression (VS) among adults and adolescents engaged and
retained in care, by current age (years), Georgia 2012
13-24 25-34 35-44 45-54 55+0
102030405060708090
100
5158
6976 80
5866
7681
86
VS among engaged VS among retained
Perc
en
t
*N= number retained in careAdult and adolescents >= age 13, diagnosed by 09/30/2011, living 12/31/2012, Georgia Engaged in care >= 1 CD4 or VL in 2012Retained in care >= 2 CD4 or VL at least 3 months apart in 2012Viral suppression (VS) = VL<200 copies/ml
N* = 639 N* = 2,568 N* = 7,265 N* = 3,486N* = 6,436

Viral suppression (VS) among adult and adolescent males engaged and retained
in care, by current age (years), Georgia 2012
13-24 25-34 35-44 45-54 55+0
102030405060708090
100
4958
7077 81
5766
7782
87
VS among engaged VS among retained
Perc
en
t
*N = number retained in careAdult and adolescent males >= age 13, diagnosed by 09/30/2011, living 12/31/2012, Georgia Engaged in care >= 1 CD4 or VL in 2012Retained in care >= 2 CD4 or VL at least 3 months apart in 2012Viral suppression (VS) = VL<200 copies/ml
N* = 436 N* = 1,987 N* = 3,223 N* 4,992 N* = 2,522

Viral suppression (VS) among adult and adolescent females engaged and retained
in care, by current age (years), Georgia 2012
13-24 25-34 35-44 45-54 55+0
102030405060708090
100
57 5666
7277
62 6473
7883
VS among engaged VS among retained
Perc
en
t
*N= number retained in careAdult and adolescent females >= age 13, diagnosed by 09/30/2011, living 12/31/2012, Georgia Engaged in care >= 1 CD4 or VL in 2012Retained in care >= 2 CD4 or VL at least 3 months apart in 2012Viral suppression (VS) = VL<200 copies/ml
N* = 200 N* = 570 N* = 1,157 N* = 1,149 N* = 952
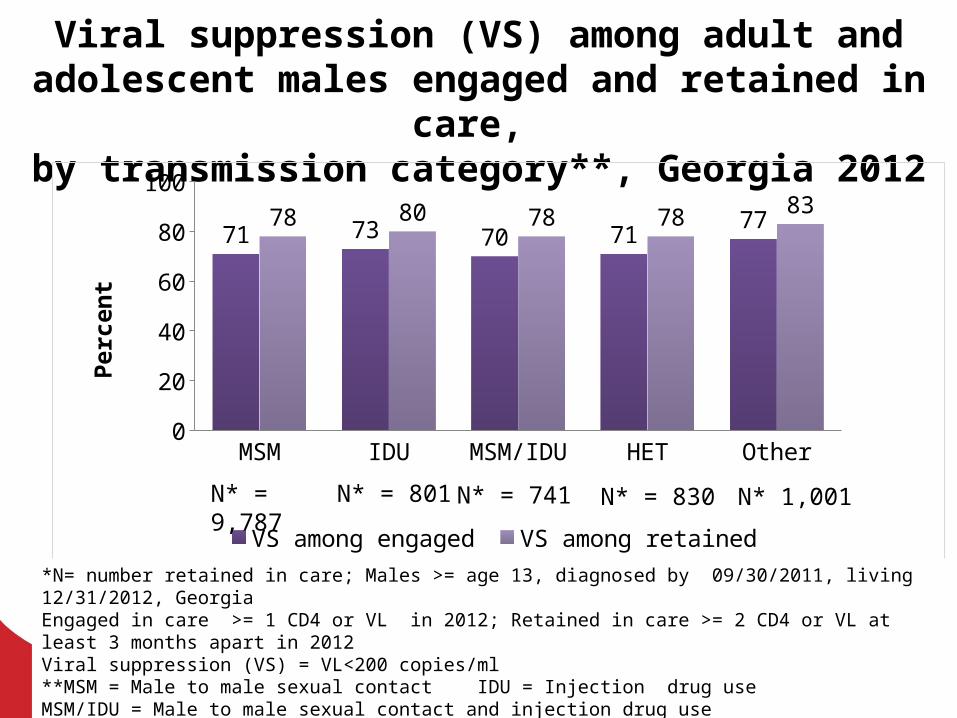
Viral suppression (VS) among adult and adolescent males engaged and retained in
care, by transmission category**, Georgia 2012
MSM IDU MSM/IDU HET Other0
20
40
60
80
100
71 73 70 717778 80 78 78 83
VS among engaged VS among retained
Perc
en
t
*N= number retained in care; Males >= age 13, diagnosed by 09/30/2011, living 12/31/2012, GeorgiaEngaged in care >= 1 CD4 or VL in 2012; Retained in care >= 2 CD4 or VL at least 3 months apart in 2012Viral suppression (VS) = VL<200 copies/ml**MSM = Male to male sexual contact IDU = Injection drug useMSM/IDU = Male to male sexual contact and injection drug useHET = Heterosexual contact with a person known to have, or to be at high risk for, HIV infectionOther = hemophilia, blood transfusion, perinatal exposure, and risk factor not reported or not identified
N* = 9,787 N* = 801 N* = 741 N* = 830 N* 1,001

Viral suppression (VS) among adult and adolescent females engaged and retained
in care, by transmission category**, Georgia 2012
HET IDU Other0
102030405060708090
100
68 68 7075 76 79
VS among engaged VS among retained
Perc
en
t
*N= number retained in care; Females >= age 13, diagnosed by 09/30/2011, living 12/31/2012, GeorgiaEngaged in care >= 1 CD4 or VL in 2012; Retained in care >= 2 CD4 or VL at least 3 months apart in 2012Viral suppression (VS) = VL<200 copies/ml**HET = Heterosexual contact with a person known to have, or to be at high risk for, HIV infectionIDU = Injection drug useOther = hemophilia, blood transfusion, perinatal exposure, and risk factor not reported or not identified
N* = 3,129 N* = 907 N*= 262
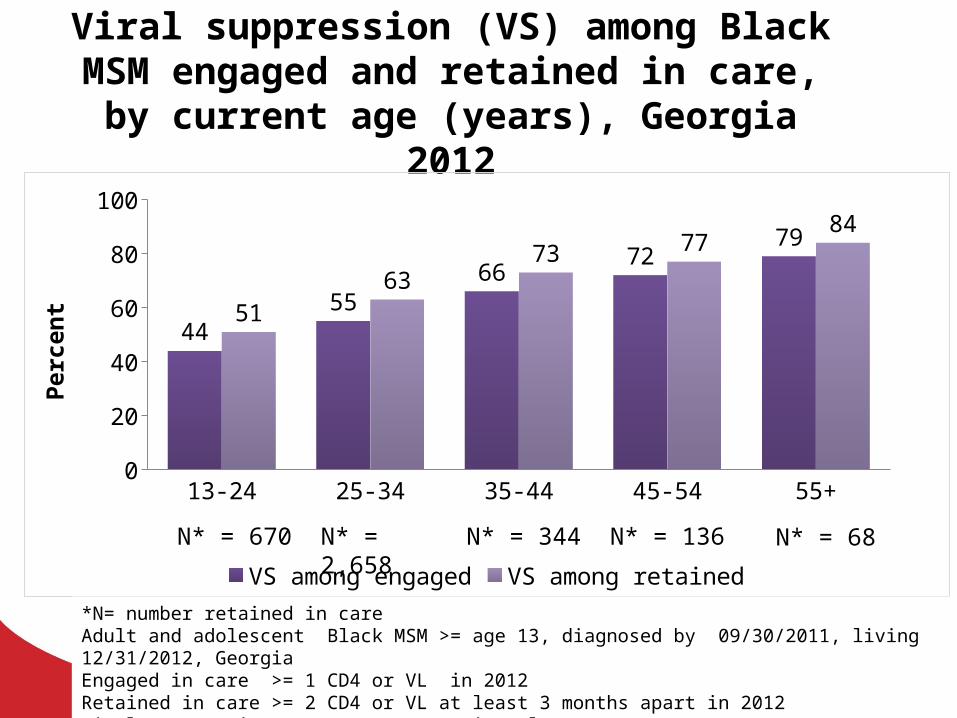
Viral suppression (VS) among Black MSM engaged and retained in care,
by current age (years), Georgia 2012
13-24 25-34 35-44 45-54 55+0
20
40
60
80
100
4455
6672
79
5163
73 7784
VS among engaged VS among retained
Perc
en
t
*N= number retained in careAdult and adolescent Black MSM >= age 13, diagnosed by 09/30/2011, living 12/31/2012, GeorgiaEngaged in care >= 1 CD4 or VL in 2012Retained in care >= 2 CD4 or VL at least 3 months apart in 2012Viral suppression (VS) = VL<200 copies/ml
N* = 670 N* = 2,658 N* = 344 N* = 136 N* = 68

Viral suppression (VS) among White MSM engaged and retained in care,
by current age (years), Georgia 2012
13-24 25-34 35-44 45-54 55+0
102030405060708090
100
58
7279
8590
6876
85 88 92
VS among engaged VS among retained
Perc
en
t
*N= number retained in care Adult and adolescent White MSM >= age 13, diagnosed by 09/30/2011, living 12/31/2012, GeorgiaEngaged in care >= 1 CD4 or VL in 2012Retained in care >= 2 CD4 or VL at least 3 months apart in 2012Viral suppression (VS) = VL<200 copies/ml
N* = 39 N* = 319 N* = 849 N* = 136 N* = 68

Viral suppression (VS) among Hispanic/Latino MSM engaged and
retained in care, by current age (years), Georgia 2012
13-24 25-34 35-44 45-54 55+0
102030405060708090
100
68 6572
77 807971
7682
91
VS among engaged VS among retained
Perc
en
t
*N= number retained in careAdult and adolescent H/L MSM >= age 13, diagnosed by 09/30/2011, living 12/31/2012, GeorgiaEngaged in care >= 1 CD4 or VL in 2012Retained in care >= 2 CD4 or VL at least 3 months apart in 2012Viral suppression (VS) = VL<200 copies/ml
N* = 23 N* = 200 N* = 344 N* = 253 N* = 74

Viral suppression (VS) among adults and adolescents engaged in care, Georgia, 2012, by diagnosis year
2000200120022003200420052006200720082009201020110
102030405060708090
100
81 79 81 79 78 74 75 76 74 73 74 72
VS among engaged
Year of diagnosis
Perc
en
t
Adults and adolescent s >= age 13, living 12/31/2012, current address Georgia = 46,495Engaged in care >= 1 CD4 or VL in 2012Viral suppression (VS) = VL<200 copies/ml

Limitations
• Incomplete reporting • Missing data for race/ethnicity, sex, and current
address • Lack of transmission category information• Multiple imputation use to redistribute risk when
missing• Definition of heterosexual transmission (sexual
contact with a known HIV infected partner or person with increased risk, i.e., MSM or IDU)
• Missing laboratory reports may lead to underestimation of engagement, retention and viral suppression
• Cannot distinguish lack of prescription of ART, failure of ART adherence, or inappropriate medication choice
• Laboratory measures may be a poor proxy for engagement and retention in HIV care

Future analyses
• Monitoring the Care Continuum for both the prevalent population and by new diagnoses by year
• Advantages of monitoring the Care Continuum for new diagnoses: – Can measure linkage to care for new diagnoses– Excludes older cases who may have moved out of
state– May be more sensitive for measuring
effectiveness of interventions to improve testing, linkage, engagement and retention in care
– Can measure time from diagnosis to viral suppression

Uncertainties
• Populations for which data are missing may be fundamentally different
• How to obtain data for transgender category• How to improve completeness of reporting• Data on ART use difficult to capture• Understanding barriers to ART adherence• Prioritizing further research

FOR MORE INFORMATION CONTACT:
Georgia Department of Public HealthHIV/AIDS Epidemiology Programhttp://health/state.ga.us/epi/hivaids