HIV and AIDS Data Hub for Asia-Pacific Review in slides Most-at-risk populations.
48
HIV and AIDS Data Hub for Asia-Pacific Review in slides Most-at-risk populations
-
Upload
avis-wilkerson -
Category
Documents
-
view
217 -
download
1
Transcript of HIV and AIDS Data Hub for Asia-Pacific Review in slides Most-at-risk populations.

HIV and AIDSData Hub for Asia-Pacific
Review in slides Most-at-risk populations

HIV and AIDS Data Hub for Asia-Pacific
Content
HIV prevalence and epidemiological status (1990-2009)Sex worker
IDU
MSM
Vulnerability and HIV knowledge (2004-2008)
Risk behaviors (2005-2009)
Resource needs and AIDS spending (2006-2008)
National Response (2005-2008)Coverage and prevention
HIV testing
Care and Treatment
Monitoring and evaluation
Archives2

HIV and AIDS Data Hub for Asia-Pacific
National response
HIV and AIDS Data Hub for Asia-Pacific
4
Coverage and prevention

HIV and AIDS Data Hub for Asia-Pacific
HIV prevention coverage among female sex workers, 2005-2009
Source: UNGASS country progress report_2006, 2008 & 2010
* Calculated median value
2009 data is provisional

HIV and AIDS Data Hub for Asia-Pacific
HIV prevention coverage among IDUs, 2005-2009
Source: UNGASS country progress report_2006, 2008 & 20102009 data is provisional
* Calculated median value

HIV and AIDS Data Hub for Asia-Pacific
HIV prevention coverage among MSM, 2005-2009
Source: UNGASS country progress report_2006, 2008 & 20102009 data is provisional
* Calculated median value
HIV and AIDS Data Hub for Asia-Pacific
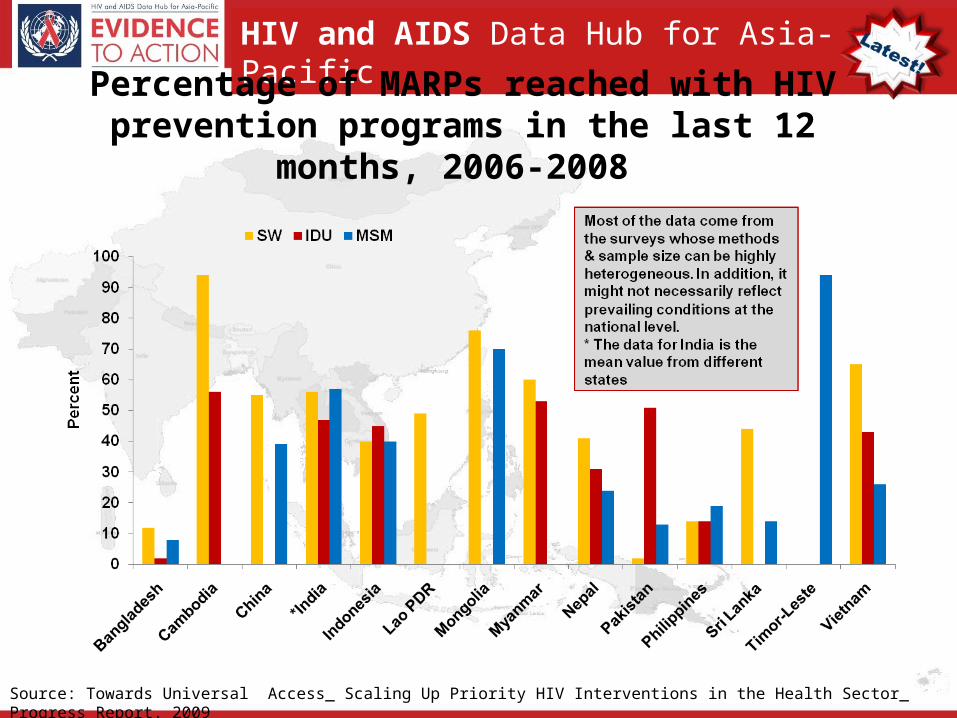
Percentage of MARPs reached with HIV prevention programs in the last 12 months, 2006-2008
Source: Towards Universal Access_ Scaling Up Priority HIV Interventions in the Health Sector_ Progress Report, 2009

HIV and AIDS Data Hub for Asia-Pacific
% of most-at-risk populations reached with prevention programs, 2005*
* Data collection between 2003-2005Source: UNAIDS, Report on the Global AIDS Epidemic, 2006
82
97
28
37
35
81
22
77
17
1
5
45
9
4 8
15
6911
52
60
7 2
0 10 20 30 40 50 60 70 80 90 100
Bangladesh
Cambodia
India
Indonesia
Nepal
Pakistan
Vietnam
(%)
Sex workers
IDUs
MSM

HIV and AIDS Data Hub for Asia-Pacific
Percentage of MARPs reached with HIV prevention programme - FSW
Source: UNGASS country progress reports, 2005 & 2008

HIV and AIDS Data Hub for Asia-Pacific
Percentage of MARPs reached with HIV prevention programme-IDU
Source: UNGASS country progress reports, 2005 & 2008
HIV and AIDS Data Hub for Asia-Pacific
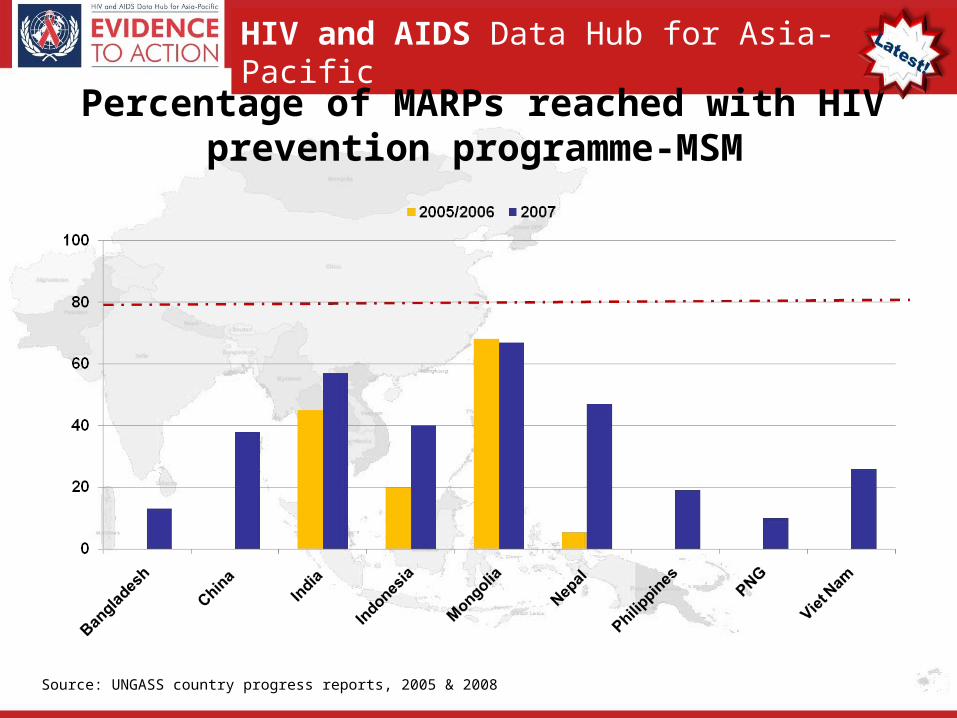
Percentage of MARPs reached with HIV prevention programme-MSM
Source: UNGASS country progress reports, 2005 & 2008

HIV and AIDS Data Hub for Asia-Pacific
Percentage of MARPs who received HIV test in the last 12 months and knew the results, 2006-2008
Source: Towards Universal Access_ Scaling Up Priority HIV Interventions in the Health Sector_ Progress Report, 2009

HIV and AIDS Data Hub for Asia-Pacific
115
29
53 54
12
100
4352
4
100
5452
100
25
15
68
34
52
8
0
25
50
75
100(%)
Female Male
% of female sex workers who received HIV testing in the past 12 months and who know
the results, 2007*
* Or the most recent dataSource: UNAIDS_Report on the global AIDS epidemic, July 2008 and UNAIDS_ UNGASS Country Reports 2008

HIV and AIDS Data Hub for Asia-Pacific
42
3
4036
21
4 411
100
45
15
100
0
20
40
60
80
100(%)Female Male
% of injecting drug users who received HIV testing in the past 12 months and who know the
results, 2007*
* Or the most recent dataSource: UNAIDS_Report on the global AIDS epidemic, July 2008 and UNAIDS_ UNGASS Country Reports 2008

HIV and AIDS Data Hub for Asia-Pacific
% of men who have sex with men who received HIV testing in the past 12 months and who
know their results, 2007*
6
58
33 32
5
100
60
30
16
100
14
35
16
0
20
40
60
80
100(%)
* Or the most recent dataSource: UNAIDS_Report on the global AIDS epidemic, July 2008 and UNAIDS_ UNGASS Country Reports 2008

HIV and AIDS Data Hub for Asia-Pacific
17
HIV testing

HIV and AIDS Data Hub for Asia-Pacific
Total population ≥ 15 years per testing and counseling facility, 2007-2008
Source: Towards Universal Access_ Scaling Up Priority HIV Interventions in the Health Sector_ Progress Report, 2009

HIV and AIDS Data Hub for Asia-Pacific
Number of HIV tests per 1000 people ≥ 15 years, 2007-2008
Source: Towards Universal Access_ Scaling Up Priority HIV Interventions in the Health Sector_ Progress Report, 2009

HIV and AIDS Data Hub for Asia-Pacific
Annual estimated new infections (in millions) in the region with current or scaled-up HIV
prevention, 2005-2010
Note: By effective prevention interventions, the region can cut one-third new infections by the year 2010 Source: UNAIDS, A scaled-up response to AIDS in Asia and the Pacific, June 2005

HIV and AIDS Data Hub for Asia-Pacific
21
Care and treatment

HIV and AIDS Data Hub for Asia-Pacific
ART coverage among adults and children, 2006-2009
Source: UNGASS country progress report_2006, 2008 & 2010
* Only for adults
2009 data is provisional

HIV and AIDS Data Hub for Asia-Pacific
Estimated number of AIDS related deaths with and without antiretroviral therapy in Asia, 1996-2008
Nu
mb
er
Source: UNAIDS_AIDS Epidemic Update, December 2009

HIV and AIDS Data Hub for Asia-Pacific
Percent distribution of PLHIV who are in need of ART in the Asia Pacific Region (21 countries), 2008
Source: Universal access health sector response, 2008

HIV and AIDS Data Hub for Asia-Pacific
Source: Universal access health sector response, 2008
Percent distribution of PLHIV who are in need of ART in the Asia Pacific Region (21 countries), 2008

HIV and AIDS Data Hub for Asia-Pacific
Percentage distribution of HIV positive males and females receiving ART, 2008
Source: Towards Universal Access_ Scaling Up Priority HIV Interventions in the Health Sector_ Progress Report, 2009
HIV and AIDS Data Hub for Asia-Pacific
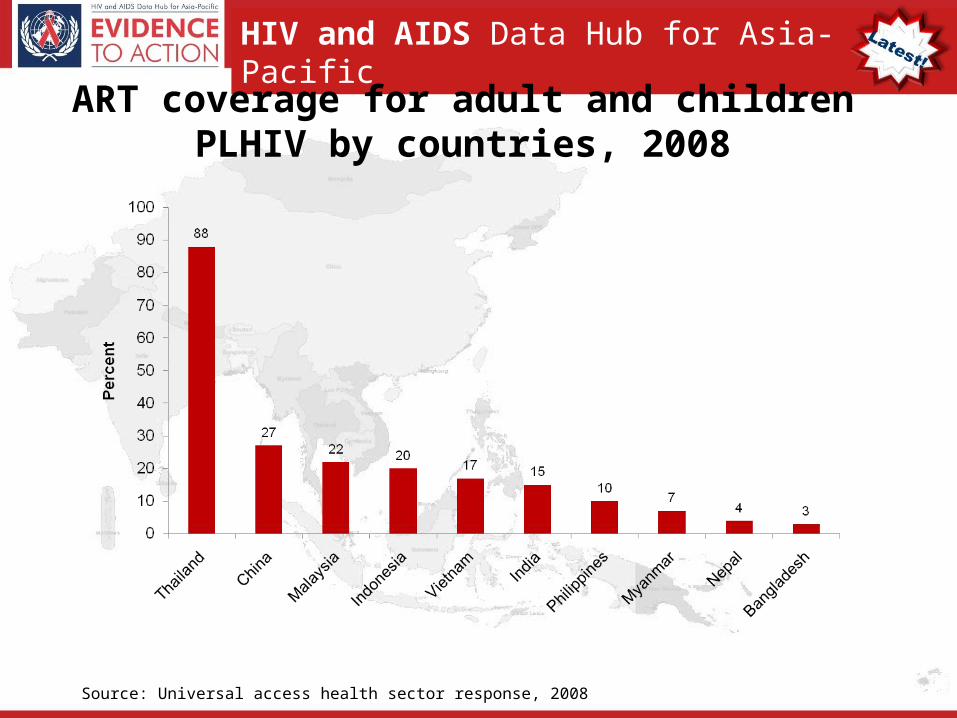
ART coverage for adult and children PLHIV by countries, 2008
Source: Universal access health sector response, 2008

HIV and AIDS Data Hub for Asia-Pacific
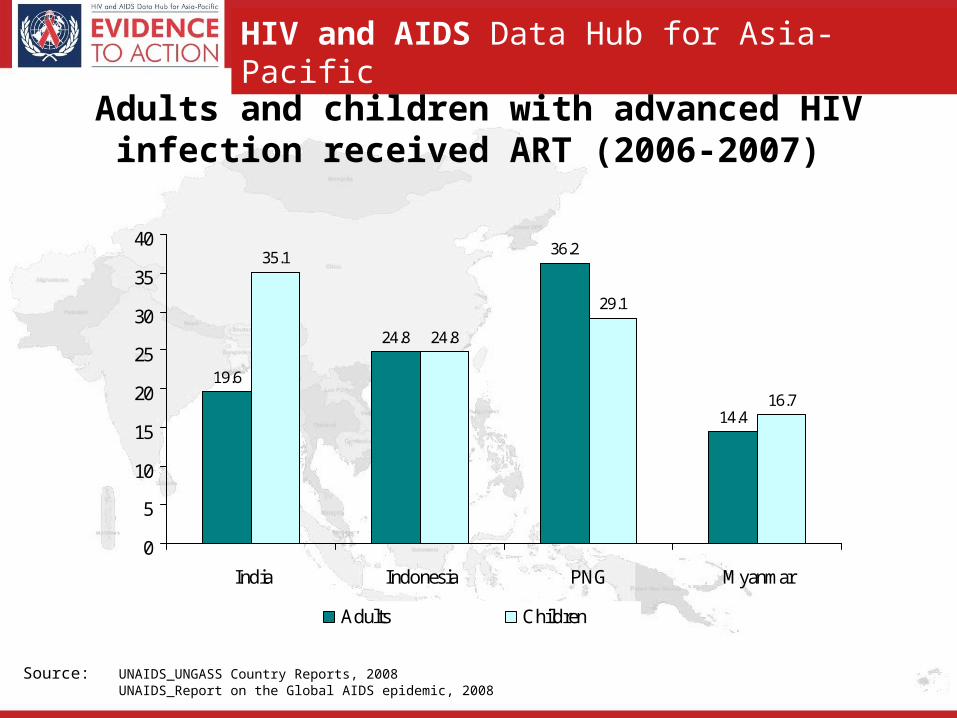
Adults and children with advanced HIV infection received ART (2006-2007)
Source: UNAIDS_UNGASS Country Reports, 2008UNAIDS_Report on the Global AIDS epidemic, 2008
54.0
78.6
59.2
50.0
7.0
13.8 13.319.0
51.0
7.4
31.0
52.9
28.4
0
10
20
30
40
50
60
70
80
90
Cambod
iaFiji
Lao
Mon
golia
Nepal
Srilan
ka
Bangla
desh
China
mal
aysia
Pakist
an
Phillip
pines
Thailan
d
Vietnam
HIV and AIDS Data Hub for Asia-Pacific
Adults and children with advanced HIV infection received ART (2006-2007)
Source: UNAIDS_UNGASS Country Reports, 2008UNAIDS_Report on the Global AIDS epidemic, 2008
19.6
24.8
36.2
14.4
24.8
29.1
16.7
35.1
0
5
10
15
20
25
30
35
40
India Indonesia PNG Myanmar
Adults Children

HIV and AIDS Data Hub for Asia-Pacific
30
Monitoring and Evaluation

HIV and AIDS Data Hub for Asia-Pacific
Civil society involvement in the HIV response in Asia Pacific
HIV and AIDS Data Hub for Asia-Pacific
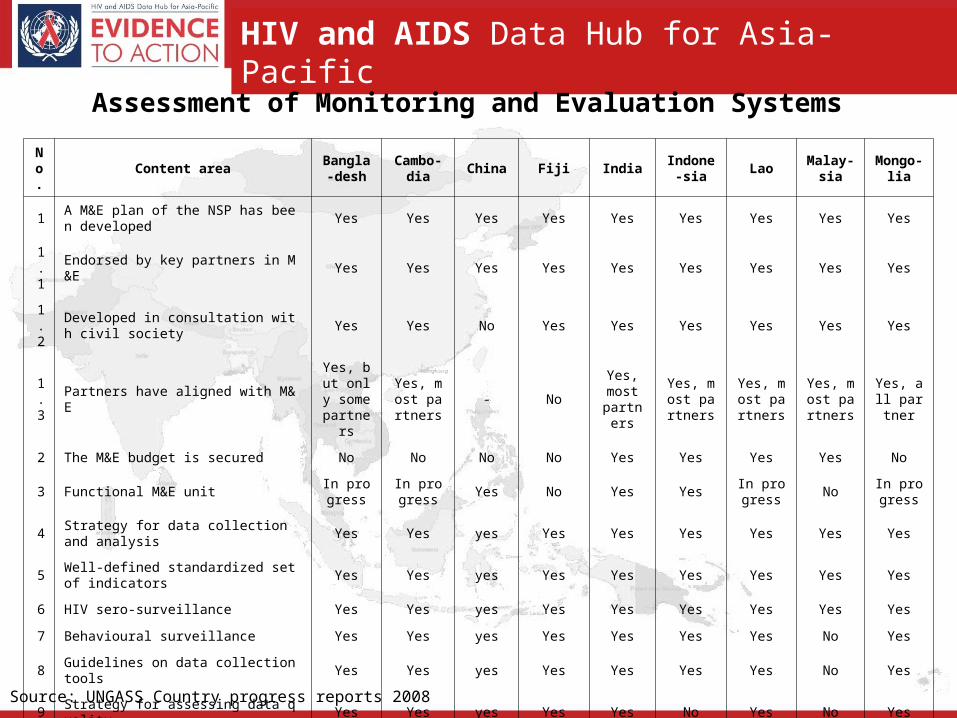
Source: UNGASS Country progress reports 2008
No.
Content areaBangla-
deshCambo-d
iaChina Fiji India
Indone-sia
LaoMalay-s
iaMongo-l
ia
1A M&E plan of the NSP has been developed
Yes Yes Yes Yes Yes Yes Yes Yes Yes
1.1
Endorsed by key partners in M&E Yes Yes Yes Yes Yes Yes Yes Yes Yes
1.2
Developed in consultation with civil society Yes Yes No Yes Yes Yes Yes Yes Yes
1.3
Partners have aligned with M&E
Yes, but only some partner
s
Yes, most partners
- NoYes, most partne
rs
Yes, most partners
Yes, most partners
Yes, most partne
rs
Yes, all partner
2 The M&E budget is secured No No No No Yes Yes Yes Yes No
3 Functional M&E unitIn progre
ssIn progre
ssYes No Yes Yes
In progress
NoIn progre
ss
4 Strategy for data collection and analysis Yes Yes yes Yes Yes Yes Yes Yes Yes
5 Well-defined standardized set of indicators Yes Yes yes Yes Yes Yes Yes Yes Yes
6 HIV sero-surveillance Yes Yes yes Yes Yes Yes Yes Yes Yes
7 Behavioural surveillance Yes Yes yes Yes Yes Yes Yes No Yes
8 Guidelines on data collection tools Yes Yes yes Yes Yes Yes Yes No Yes
9 Strategy for assessing data quality Yes Yes yes Yes Yes No Yes No Yes
10
Strategy for data dissemination and use, including yearly publication
Yes Yes yes Yes Yes Yes Yes Yes Yes
11
National and sub-national database No Yes yes No Yes Yes No N/A No
Assessment of Monitoring and Evaluation Systems

HIV and AIDS Data Hub for Asia-Pacific
Source: UNGASS Country progress reports, 2008
Assessment of Monitoring and Evaluation Systems
No.
Content areaMyan-ma
rNepal
Pakis-tan
PNG Phili-pp
ineSinga-po
reSri Lank
aThai-lan
dViet-na
m
1A M&E plan of the NSP has been developed
Yes Yes YesIn progre
ssYes
In progress
In progress
In progress
Yes
1.1
Endorsed by key partners in M&E Yes Yes Yes - Yes - NA - Yes
1.2
Developed in consultation with civil society Yes Yes Yes - Yes - Yes - Yes
1.3
Partners have aligned with M&EYes, all pa
rtnersYes, most
partner
Yes, but only some part
ners
-Yes, most partne
rs-
yes, most partners
-Yes, most partners
2 The M&E budget is secured NoYes (most
ly)No Yes Yes - No Yes Yes
3 Functional M&E unit YesIn progres
sIn progr
essYes
In progress
YesIn progre
ssYes Yes
4 Strategy for data collection and analysis Yes Yes Yes Yes Yes Yes Yes Yes Yes
5 Well-defined standardized set of indicators Yes Yes Yes Yes Yes Yes Yes Yes Yes
6 HIV sero-surveillance Yes Yes Yes Yes Yes Yes Yes Yes Yes
7 Behavioural surveillance Yes Yes Yes Yes Yes Yes Yes Yes Yes
8 Guidelines on data collection tools Yes Yes Yes Yes Yes Yes Yes Yes Yes
9 Strategy for assessing data quality Yes Yes Yes Yes Yes Yes Yes Yes Yes
10
Strategy for data dissemination and use, including yearly publication
YesYes (parti
ally)Yes Yes Yes No Yes Yes Yes
11
National and sub-national database YesYes (parti
ally)N/A No No Yes Yes Yes Yes
HIV and AIDS Data Hub for Asia-Pacific
Source: UNGASS Country progress reports, 2008
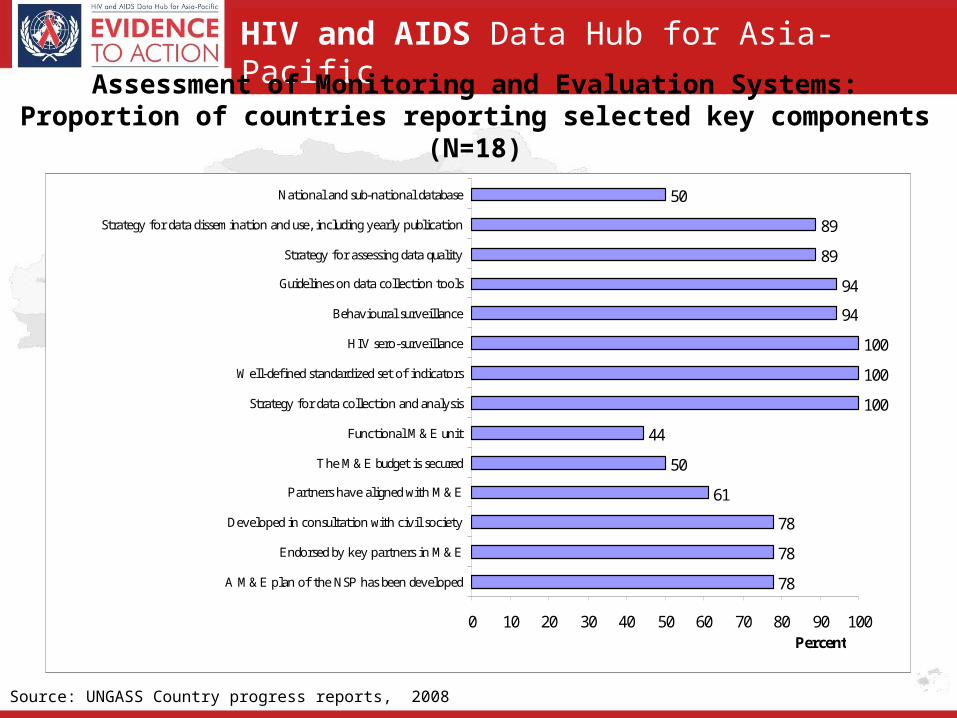
Assessment of Monitoring and Evaluation Systems: Proportion of countries reporting selected key components (N=18)
78
78
78
61
50
44
100
100
100
94
94
89
89
50
0 10 20 30 40 50 60 70 80 90 100
A M&E plan of the NSP has been developed
Endorsed by key partners in M&E
Developed in consultation with civil society
Partners have aligned with M&E
The M&E budget is secured
Functional M&E unit
Strategy for data collection and analysis
Well-defined standardized set of indicators
HIV sero-surveillance
Behavioural surveillance
Guidelines on data collection tools
Strategy for assessing data quality
Strategy for data dissemination and use, including yearly publication
National and sub-national database
Percent

HIV and AIDS Data Hub for Asia-Pacific
Number of countries with selective data available on MARPs, 2006-2008
Source: Towards Universal Access_ Scaling Up Priority HIV Interventions in the Health Sector_ Progress Report, 2009
HIV and AIDS Data Hub for Asia-Pacific
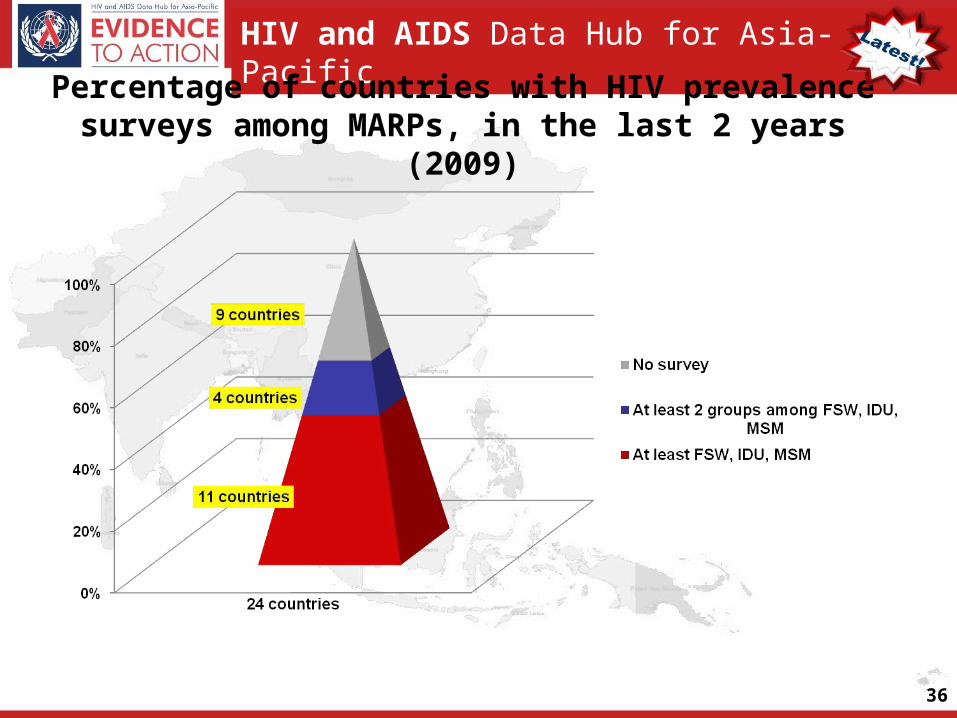
Percentage of countries with HIV prevalence surveys among MARPs, in the last 2 years (2009)
36

HIV and AIDS Data Hub for Asia-Pacific
Percentage of countries with behavior surveys among MARPs, in the last 2 years (2009)
37

HIV and AIDS Data Hub for Asia-Pacific
Percentage of high HIV burden countries with HIV prevalence surveys, in the last 2 years (2009)
38

HIV and AIDS Data Hub for Asia-Pacific
Percentage of countries with data on HIV testing among general population (15-49) in
2006-2008
Source: Towards Universal Access_ Scaling Up Priority HIV Interventions in the Health Sector_ Progress Report, 2009
HIV and AIDS Data Hub for Asia-Pacific
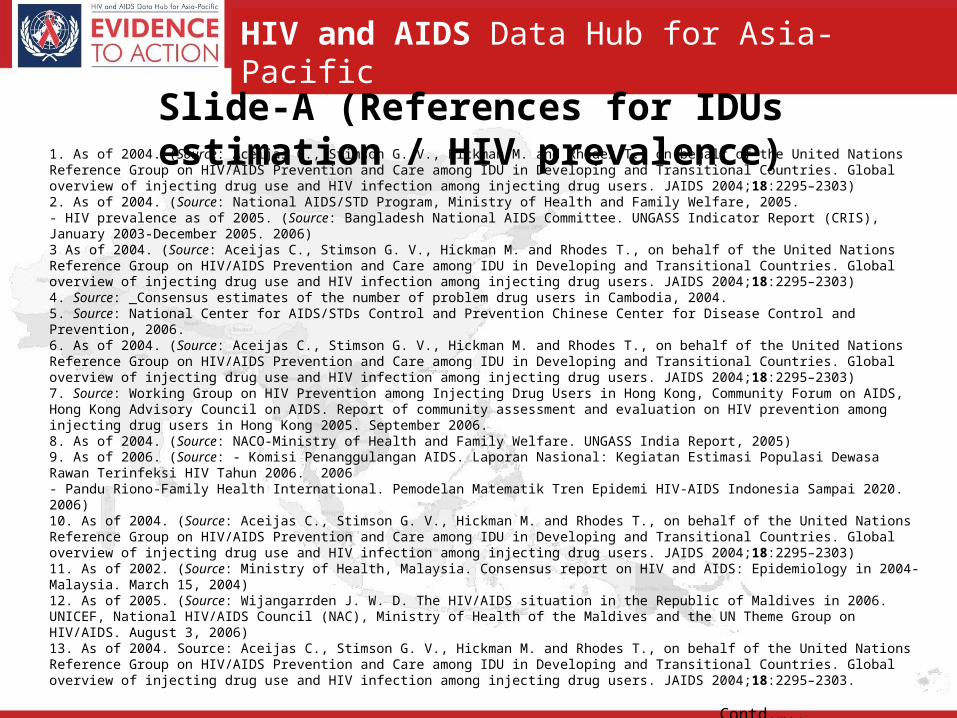
Slide-A (References for IDUs estimation / HIV prevalence)
1. As of 2004. (Source: Aceijas C., Stimson G. V., Hickman M. and Rhodes T., on behalf of the United Nations Reference Group on HIV/AIDS Prevention and Care among IDU in Developing and Transitional Countries. Global overview of injecting drug use and HIV infection among injecting drug users. JAIDS 2004;18:2295–2303)2. As of 2004. (Source: National AIDS/STD Program, Ministry of Health and Family Welfare, 2005.- HIV prevalence as of 2005. (Source: Bangladesh National AIDS Committee. UNGASS Indicator Report (CRIS), January 2003-December 2005. 2006)3 As of 2004. (Source: Aceijas C., Stimson G. V., Hickman M. and Rhodes T., on behalf of the United Nations Reference Group on HIV/AIDS Prevention and Care among IDU in Developing and Transitional Countries. Global overview of injecting drug use and HIV infection among injecting drug users. JAIDS 2004;18:2295–2303)4. Source: _Consensus estimates of the number of problem drug users in Cambodia, 2004.5. Source: National Center for AIDS/STDs Control and Prevention Chinese Center for Disease Control and Prevention, 2006.6. As of 2004. (Source: Aceijas C., Stimson G. V., Hickman M. and Rhodes T., on behalf of the United Nations Reference Group on HIV/AIDS Prevention and Care among IDU in Developing and Transitional Countries. Global overview of injecting drug use and HIV infection among injecting drug users. JAIDS 2004;18:2295–2303)7. Source: Working Group on HIV Prevention among Injecting Drug Users in Hong Kong, Community Forum on AIDS, Hong Kong Advisory Council on AIDS. Report of community assessment and evaluation on HIV prevention among injecting drug users in Hong Kong 2005. September 2006.8. As of 2004. (Source: NACO-Ministry of Health and Family Welfare. UNGASS India Report, 2005)9. As of 2006. (Source: - Komisi Penanggulangan AIDS. Laporan Nasional: Kegiatan Estimasi Populasi Dewasa Rawan Terinfeksi HIV Tahun 2006. 2006- Pandu Riono-Family Health International. Pemodelan Matematik Tren Epidemi HIV-AIDS Indonesia Sampai 2020. 2006)10. As of 2004. (Source: Aceijas C., Stimson G. V., Hickman M. and Rhodes T., on behalf of the United Nations Reference Group on HIV/AIDS Prevention and Care among IDU in Developing and Transitional Countries. Global overview of injecting drug use and HIV infection among injecting drug users. JAIDS 2004;18:2295–2303)11. As of 2002. (Source: Ministry of Health, Malaysia. Consensus report on HIV and AIDS: Epidemiology in 2004-Malaysia. March 15, 2004)12. As of 2005. (Source: Wijangarrden J. W. D. The HIV/AIDS situation in the Republic of Maldives in 2006. UNICEF, National HIV/AIDS Council (NAC), Ministry of Health of the Maldives and the UN Theme Group on HIV/AIDS. August 3, 2006)13. As of 2004. Source: Aceijas C., Stimson G. V., Hickman M. and Rhodes T., on behalf of the United Nations Reference Group on HIV/AIDS Prevention and Care among IDU in Developing and Transitional Countries. Global overview of injecting drug use and HIV infection among injecting drug users. JAIDS 2004;18:2295–2303.
Contd.…..
HIV and AIDS Data Hub for Asia-Pacific
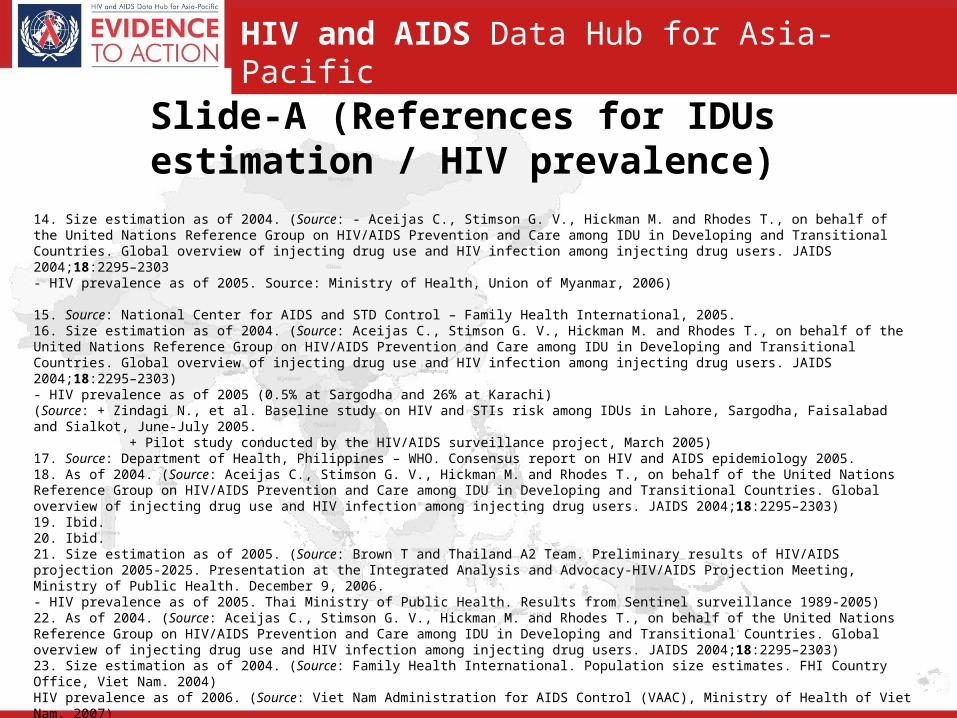
14. Size estimation as of 2004. (Source: - Aceijas C., Stimson G. V., Hickman M. and Rhodes T., on behalf of the United Nations Reference Group on HIV/AIDS Prevention and Care among IDU in Developing and Transitional Countries. Global overview of injecting drug use and HIV infection among injecting drug users. JAIDS 2004;18:2295–2303 - HIV prevalence as of 2005. Source: Ministry of Health, Union of Myanmar, 2006)
15. Source: National Center for AIDS and STD Control – Family Health International, 2005.16. Size estimation as of 2004. (Source: Aceijas C., Stimson G. V., Hickman M. and Rhodes T., on behalf of the United Nations Reference Group on HIV/AIDS Prevention and Care among IDU in Developing and Transitional Countries. Global overview of injecting drug use and HIV infection among injecting drug users. JAIDS 2004;18:2295–2303)- HIV prevalence as of 2005 (0.5% at Sargodha and 26% at Karachi)(Source: + Zindagi N., et al. Baseline study on HIV and STIs risk among IDUs in Lahore, Sargodha, Faisalabad and Sialkot, June-July 2005.
+ Pilot study conducted by the HIV/AIDS surveillance project, March 2005)17. Source: Department of Health, Philippines – WHO. Consensus report on HIV and AIDS epidemiology 2005.18. As of 2004. (Source: Aceijas C., Stimson G. V., Hickman M. and Rhodes T., on behalf of the United Nations Reference Group on HIV/AIDS Prevention and Care among IDU in Developing and Transitional Countries. Global overview of injecting drug use and HIV infection among injecting drug users. JAIDS 2004;18:2295–2303)19. Ibid.20. Ibid.21. Size estimation as of 2005. (Source: Brown T and Thailand A2 Team. Preliminary results of HIV/AIDS projection 2005-2025. Presentation at the Integrated Analysis and Advocacy-HIV/AIDS Projection Meeting, Ministry of Public Health. December 9, 2006.- HIV prevalence as of 2005. Thai Ministry of Public Health. Results from Sentinel surveillance 1989-2005)22. As of 2004. (Source: Aceijas C., Stimson G. V., Hickman M. and Rhodes T., on behalf of the United Nations Reference Group on HIV/AIDS Prevention and Care among IDU in Developing and Transitional Countries. Global overview of injecting drug use and HIV infection among injecting drug users. JAIDS 2004;18:2295–2303)23. Size estimation as of 2004. (Source: Family Health International. Population size estimates. FHI Country Office, Viet Nam. 2004)HIV prevalence as of 2006. (Source: Viet Nam Administration for AIDS Control (VAAC), Ministry of Health of Viet Nam. 2007)
Slide-A (References for IDUs estimation / HIV prevalence)
HIV and AIDS Data Hub for Asia-Pacific
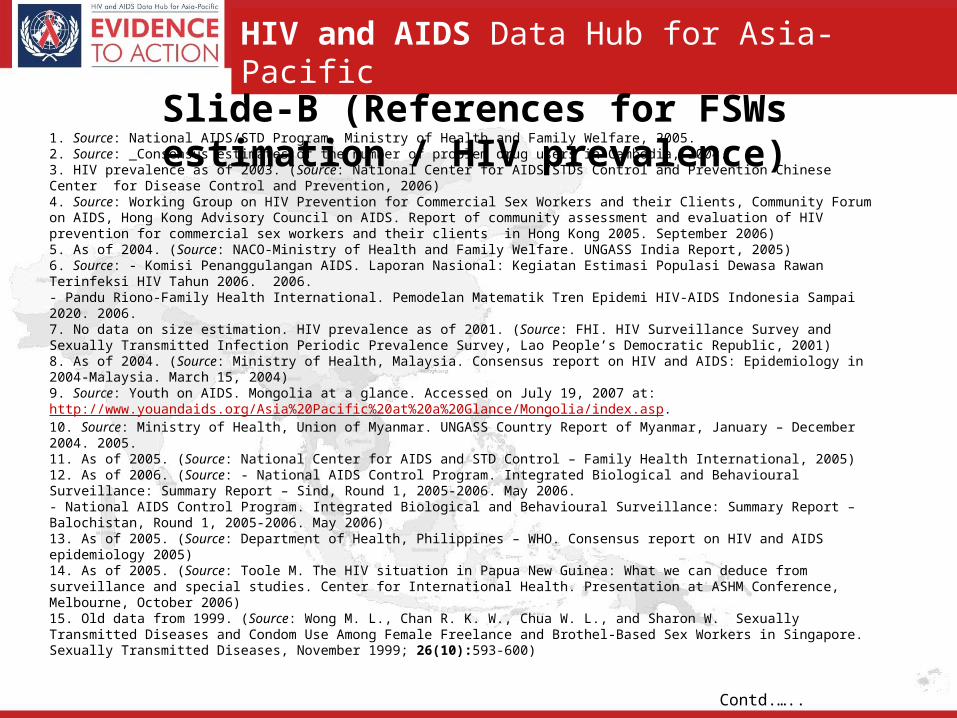
Slide-B (References for FSWs estimation / HIV prevalence)
1. Source: National AIDS/STD Program, Ministry of Health and Family Welfare, 2005.2. Source: _Consensus estimates of the number of problem drug users in Cambodia, 2004.3. HIV prevalence as of 2003. (Source: National Center for AIDS/STDs Control and Prevention Chinese Center for Disease Control and Prevention, 2006)4. Source: Working Group on HIV Prevention for Commercial Sex Workers and their Clients, Community Forum on AIDS, Hong Kong Advisory Council on AIDS. Report of community assessment and evaluation of HIV prevention for commercial sex workers and their clients in Hong Kong 2005. September 2006)5. As of 2004. (Source: NACO-Ministry of Health and Family Welfare. UNGASS India Report, 2005)6. Source: - Komisi Penanggulangan AIDS. Laporan Nasional: Kegiatan Estimasi Populasi Dewasa Rawan Terinfeksi HIV Tahun 2006. 2006.- Pandu Riono-Family Health International. Pemodelan Matematik Tren Epidemi HIV-AIDS Indonesia Sampai 2020. 2006.7. No data on size estimation. HIV prevalence as of 2001. (Source: FHI. HIV Surveillance Survey and Sexually Transmitted Infection Periodic Prevalence Survey, Lao People’s Democratic Republic, 2001)8. As of 2004. (Source: Ministry of Health, Malaysia. Consensus report on HIV and AIDS: Epidemiology in 2004-Malaysia. March 15, 2004)9. Source: Youth on AIDS. Mongolia at a glance. Accessed on July 19, 2007 at: http://www.youandaids.org/Asia%20Pacific%20at%20a%20Glance/Mongolia/index.asp.10. Source: Ministry of Health, Union of Myanmar. UNGASS Country Report of Myanmar, January – December 2004. 2005.11. As of 2005. (Source: National Center for AIDS and STD Control – Family Health International, 2005)12. As of 2006. (Source: - National AIDS Control Program. Integrated Biological and Behavioural Surveillance: Summary Report – Sind, Round 1, 2005-2006. May 2006.- National AIDS Control Program. Integrated Biological and Behavioural Surveillance: Summary Report – Balochistan, Round 1, 2005-2006. May 2006)13. As of 2005. (Source: Department of Health, Philippines – WHO. Consensus report on HIV and AIDS epidemiology 2005)14. As of 2005. (Source: Toole M. The HIV situation in Papua New Guinea: What we can deduce from surveillance and special studies. Center for International Health. Presentation at ASHM Conference, Melbourne, October 2006)15. Old data from 1999. (Source: Wong M. L., Chan R. K. W., Chua W. L., and Sharon W. Sexually Transmitted Diseases and Condom Use Among Female Freelance and Brothel-Based Sex Workers in Singapore. Sexually Transmitted Diseases, November 1999; 26(10):593-600)
Contd.…..

HIV and AIDS Data Hub for Asia-Pacific
16. Source: UNAIDS. Country Report-Sri Lanka on Follow up the Declaration on Commitment on HIV/AIDS (UNGASS), December 2005.17. Size estimation: Data in 1999 from estimated size in A2 project. Assumption from the AEM modeling in 2006. (Source: - Brown T and Thailand A2 Team. Preliminary results of HIV/AIDS projection 2005-2025. Presentation at the Integrated Analysis and Advocacy-HIV/AIDS Projection Meeting, Ministry of Public Health. December 9, 2006)- HIV prevalence: Sentinel surveillance data. HIV prevalence among Indirect sex worker is of 3.34% and among direct sex workers is of 9.00% by end of 2005. (Source: Thai Ministry of Public Health. Results from Sentinel surveillance 1989-2005)18. As of 2004. (Source: Pisani E., and Dili survey team. HIV, STIs and risk behaviour in East Timor: an historic opportunity for effective action. Family Health International, 2004) 19. Size estimation as of 2004. (Source: Family Health International. Population size estimates. FHI Country Office, Viet Nam. 2004)HIV prevalence as of 2006. Mid HIV prevalence is the national prevalence (4.2%) where as the lowest prevalence 8.4% in Hai Phong and the highest prevalence 33.9% in Can Tho. (Source: Ministry of Health, Viet Nam. National Sentinel Surveillance Report. 2007)
Slide-B (References for FSWs estimation / HIV prevalence)

HIV and AIDS Data Hub for Asia-Pacific
Slide-C (References for MSM estimation / HIV prevalence)
1. As of 2005. This includes male sex workers and Hijra. (Source: National AIDS/STD Program, Ministry of Health and Family Welfare, 2005)2. Data from Phnom Penh only, as of 2000. (Source: Family Health International. Sexual behaviour, STIs and HIV among men who have sex with men in Phnom Penh 2000. October 2002)3. Source: - National Center for AIDS/STDs Control and Prevention Chinese Center for Disease Control and Prevention, 2006- Xu H., Zhang B., Zeng Y. and Li X. HIV Epidemic Status and Behavioural Surveillance among MSM in China. Presentation at XVI International AIDS Conference, Toronto, Canada, August 12-18, 2006.4. As of 2005. (Source: Working Group on Men who have sex with Men in Hong Kong, Community forum on AIDS, Hong Kong Advisory Council on AIDS. Report of community assessment and evaluation of HIV prevention effort on men who have sex with men in Hong Kong 2005. September 2006)5. Size estimation as of 2005. (Source: - NACO-Ministry of Health and Family Welfare. UNGASS India Report, 2005.- HIV prevalence in Mumbai, India. Low value is among MSM and high value is among transgender. - Setia M. S., Lindan C., Jarajani H. R., Kumta S., Asktrand M., Mathur M., et al. Men who have sex with men and transgender in Mumbai, India: An emerging risk group for STIs and HIV. Indian J Dermatol Venereol Leprol 2006;72:425-431)6. Size estimation as of 2006 among whom 28,000 were transgender (Source: - Komisi Penanggulangan AIDS. Laporan Nasional: Kegiatan Estimasi Populasi Dewasa Rawan Terinfeksi HIV Tahun 2006. 2006- Pandu Riono-Family Health International. Pemodelan Matematik Tren Epidemi HIV-AIDS Indonesia Sampai 2020. 2006)HIV prevalence as of 2005 of which HIV prevalence among MSM was 1.2% and among transgender was 22%. The HIV prevalence among MSW was 6%. (Source: Ministry of Health, Indonesia. Results from the Behavioural Surveillance Survey (BSS) in Indonesia 2004-2005. 2005)7. Source: Ministry of Health, Malaysia. Consensus report on HIV and AIDS: Epidemiology in 2004-Malaysia. March 15, 2004.8. Source: National Center for AIDS and STD Control – Family Health International, 2005.9. Source: National AIDS Control Program, Ministry of Health, Government of Pakistan, FHI, DFID. National study of reproductive tract and sexually transmitted infections: Survey of high risk groups in Lahore and Karachi, 2005. 2006.10. Source: Department of Health, Philippines – WHO. Consensus report on HIV and AIDS epidemiology 2005.11. Size estimation includes 10,000 MSWs. - HIV prevalence: 6.67% among MSWs and 7.33% among MSM. (Source: Estimated size in A2 project. Assumption from the AEM modeling in 2006)12. As of 2004. (Source: Family Health International. Population size estimates. FHI Country Office, Viet Nam. 2004)
HIV and AIDS Data Hub for Asia-Pacific
45

HIV and AIDS Data Hub for Asia-Pacific
% of most-at-risk populations covered by targeted prevention programs
in South-east Asia, 2003
1%
MSM covered bypreventionprograms
8%
Risky acts protectedby publicallydistributing condoms
19%
Sex workers coveredby outreachprevention prorams
Source: WHO (2004), Coverage of selected service for HIV/AIDS Prevention, Care and Support in Low and Middle Income Countries in 2003
5.4%
IDUs reached byharm reductionprograms

HIV and AIDS Data Hub for Asia-Pacific
% of men who have sex with men reporting the use of a condom the last time they had sex in
India (2002) , Indonesia (2002-2003) and Vietnam (2006)
Source: - India National AIDS Control Organization (NACO) – Ministry of Health and Family Welfare. National Baseline High Risk and Bridge Population Behavioural Surveillance Survey, 2002. - Indonesia Ministry of Health and Central Bureau of Statistics. Behavioural Surveillance in 13 provinces, 2002-2003. 2004. - Ministry of Health, Vietnam. Results from the HIV/STI Integrated Biological and Behavioural Surveillance (IBBS) in Vietnam, 2006
39
5449
53
33
54
78
45 47
0
20
40
60
80
100
India 2002 (5 cities) Indonesia 2002-2003 (3 cities)
Vietnam 2006 (Ho Chi Minh City)
(%)
With MSWs With non-MSWs With FSWs

HIV and AIDS Data Hub for Asia-Pacific
THANK YOU
slides compiled by www.aidsdatahub.org
Data shown in this slide set are comprehensive to the extent they are available from country reports. Please inform us if you know of sources where more recent data can be used.
Please acknowledge www.aidsdatahub.org if slides are lifted directly from this site