HISTORY AND CURRENT STATUS OF THE NAHANNI WOOD BISON
44
HISTORY AND CURRENT STATUS OF THE NAHANNI WOOD BISON POPULATION NICHOLAS C. LARTER AND DANNY G. ALLAIRE Department of Environment and Natural Resources Government of the Northwest Territories 2007 File Report No. 136
Transcript of HISTORY AND CURRENT STATUS OF THE NAHANNI WOOD BISON

HISTORY AND CURRENT
STATUS OF THE NAHANNI WOOD BISON POPULATION
NICHOLAS C. LARTER AND DANNY G. ALLAIRE
Department of Environment and Natural Resources Government of the Northwest Territories
2007
File Report No. 136


i
ABSTRACT
Wood bison (Bison bison athabascae) that inhabit the boreal forests of Northern
Canada were nearly eliminated during the late 1800s. Only bison populations in
the area between the Great Slave Lake and the Peace-Athabasca Delta
persisted. Historically, wood bison range included the Southwestern portion of
the Northwest Territories. As part of a program to establish a minimum of three
free-ranging populations of wood bison in their historical range, the Nahanni
wood bison population in southwestern Northwest Territories was established in
1980. Twenty-eight wood bison from Elk Island National Park (EINP) were
released into the Nahanni Butte area. Supplemental releases in 1989 and 1998
of 12 and 61 individuals respectively, have bolstered the population. Since the
initial reintroduction in 1980 research and monitoring of the population has been
inconsistent and sporadic. This lack of population monitoring has been a
concern of local residents of Nahanni Butte and Fort Liard. In 2002, a more
formal research and monitoring program of the Nahanni wood bison population
was initiated. Annual sex and age classification surveys from 2002-2006 show
large yearly differences in indices of calf production (20-57 calves per 100 adult
females) but overwinter calf survival has been ≥50% regardless of calf production
during the previous year and has increased with every year of the survey. An
aerial census of the population in March 2004 estimated 399 bison (CV = 0.32).
Biological sampling has found no evidence of brucellosis (Brucella abortus),
tuberculosis (Mycobacterium bovis), or the causative agent of Johne’s disease
(Mycobacterium avium subspecies avium), nor has anthrax been detected on the
range of the population. It is suspected that the range does not provide suitable
conditions for spore persistence. Bison are susceptible to collisions with motor
vehicles on the Liard Highway (Hwy 77) during September-October when more
animals use the road as a travel corridor. In some years at spring break up
animals are swept away and drowned. Bison use both sides of the Liard River
Valley making swimming across the river an important component of the ecology
of this wood bison population. Although sedges, grasses, and willow (Salix spp.)

ii
generally predominate the diet of Nahanni wood bison, there is a relatively high
Equisetum component to the diet.

iii
TABLE OF CONTENTS
ABSTRACT..................................................................................................................... i
LIST OF FIGURES ....................................................................................................... v
LIST OF TABLES .......................................................................................................... v
HISTORICAL CONTEXT .............................................................................................. 1
INTRODUCTION .......................................................................................................... 7
METHODS .................................................................................................................... 8
Sex/age Classification Surveys ........................................................................... 8
Population Surveys ........................................................................................... 11
Biological Sampling........................................................................................... 12
Mortalities ............................................................................................... 12
Disease .................................................................................................. 13
Diet Composition .................................................................................... 13
RESULTS .................................................................................................................... 15
Sex/age Classification Surveys ......................................................................... 15
Population Surveys ........................................................................................... 16
Biological Samples............................................................................................ 17
Carcasses .............................................................................................. 18
Motor Vehicle Collisions ......................................................................... 19
Diet Composition .................................................................................... 20
DISCUSSION ................................................................…………………………………22
General ...............................................................…………………………………22
Sex/age Classification Surveys ...........................…………………………………24
Population Surveys .............................................…………………………………25
Biological Samples..............................................…………………………………26
Motor Vehicle Collisions ...........................…………………………………26
Disease ....................................................…………………………………27
Legal Harvest ...........................................…………………………………28
Nuisance Bison ...................................................…………………………………29
RECOMMENDATIONS................................................................................................ 30
ACKNOWLEDGMENTS .............................................................................................. 31

iv
PERSONAL COMMUNICATIONS............................................................................... 32
LITERATURE CITED................................................................................................... 33 APPENDIX 1................................................................................................................ 36 APPENDIX 2................................................................................................................ 37

v
LIST OF FIGURES
FIGURE 1. Historic and prehistoric distribution of wood bison.................................... 2
FIGURE 2. Current range of Nahanni bison population .............................................. 4
FIGURE 3. Distribution of management zones and free-roaming herds of bison ....... 6
FIGURE 4. 2005 discharge for the Liard River at Fort Liard ....................................... 9
FIGURE 5. Estimated calf production and overwinter survival of calves................... 16
FIGURE 6. Northwest Territories flight lines from March 2004 survey...................... 17
FIGURE 7. The incisor bar of a 16-year old male bison............................................ 18
FIGURE 8. Composition of bison diet by months...................................................... 21
LIST OF TABLES
TABLE 1. Results of bison sex and age classification surveys..............................15

1
HISTORICAL CONTEXT
Wood bison (Bison bison athabascae) that inhabit the boreal forests of
Northern Canada were nearly eliminated during the late 1800s; this has been
attributed to the encroaching fur trade and over harvesting that occurred in the
region during this time (Soper 1941; Gates et al. 1992). Bison populations did
manage to persist in the area between the Great Slave Lake and the Peace-
Athabasca Delta, but wood bison were extirpated in other parts of their range
(Ogilvie 1893). A trapper named Poolfield and/or an elder from Trout Lake shot
the last known bison around Trout Lake in 1890 (Daniel Allaire pers. comm.).
The last confirmed wood bison from the primordial population in northeastern
British Columbia was shot at near Fort St. John in 1906 (MacGregor 1952).
Oral narratives obtained from aboriginal people, as well as radiometric
data from bison remains indicate that the historical range of wood bison included
the Southwestern portion of the Northwest Territories, Northeastern British
Columbia, Northern Alberta, Northwestern Saskatchewan and southern portions
of the Alaska and Yukon, (Gates et al. 1992; Fig. 1). A well preserved portion of
a mature bison skull, including the horn cores, was found on the Liard River three
miles above the Blackstone River mouth on the opposite shore in 1967 by Albert
Thomas, an Indian friend of Jack Turner of Nahanni Butte, Northwest Territories
(Gordon 1970).
Early efforts to reestablish wood bison in the late 1800s were ineffective
because of lack of enforcement. It wasn’t until the early 1970s that wildlife
management agencies began to seriously consider reestablishing wood bison
into parts of their historic range. In 1975, representatives from Canadian Wildlife
Service (CWS), Parks Canada Agency, and territorial and provincial wildlife
management agencies in western Canada established a primary objective of
establishing at least three free-ranging herds within the wood bison historical
range (Gates et al. 2001). One region for the proposed establishment of a herd
of wood bison was in southwest Northwest Territories in the area of the Liard and
South Nahanni Rivers based upon a range assessment indicating suitable wood
bison habitat (Reynolds et al. 1980).

2
Figure 1. Original and late-Holocene range of wood bison in North America, based upon available zooarchaelogical,
paleontological, oral, and written historical documentation (Gates et al. 2001 adapted from Stephenson et al. 2001).

3
The Nahanni wood bison population was established as a free-ranging population in 1980, with an initial release of 28 wood bison (16 adult females and
12 adult males) from Elk Island National Park (EINP) into the Nahanni Butte area
near the Mackenzie Mountains in the southwestern Northwest Territories (Gates
et al. 2001; Fig. 2). Unfortunately, this introduced founder population fragmented
and by fall 1980, wood bison were found near Fort Nelson, British Columbia, 250
km south of the initial release site. By 1981, wood bison numbers in the Nahanni
area had declined to 14 individuals through accidental deaths and dispersal
(Gates et al. 2001). In 1985, caribou harvesters from Trout Lake noticed animal
tracks they were unfamiliar with at kilometre 45 of the Trout Lake winter road.
They followed the tracks southward (moving towards Alberta border) but bad
weather made them turn back. It is believed that they were following bison tracks
(D. Jumbo pers. comm.).
The Nahanni population persisted, and by 1989, bison numbers had
increased to ca. 40 individuals. A supplemental release of 12 wood bison (9
adult females and 3 adult males of EINP stock) in March 1989 was undertaken in
the vicinity of Nahanni Butte (Fig. 2). Three years later an aerial survey along the
Liard River valley observed 55 bison; one group of 18 was found near Nahanni
Butte and the remaining 37 occurred along the Liard River valley as far south as
La Jolle Butte in northeastern British Columbia. In the mid-1990s primary bison
survey areas were delineated that included meadow areas in the Nahanni Butte
and Netla and Kotaneelee River areas, the Liard River Valley and its islands from
Flett River to Fort Liard and the cutblocks in the La Biche River area of
northeastern British Columbia (C. Gates pers. comm.). Aerial surveys of these
areas were conducted in 1995, 1996, and 1997 and resulted in counts of 64, 78,
and 107 bison, respectively (Gates et al. 2001; GNWT unpubl. data). In March
1998, a second supplemental release of animals was undertaken near the
Muskeg River in the southern part of their range (Fig. 2). Fifty-nine wood bison
from EINP: 18 male and 20 female calves of the year (ca. 9 months old), 4 male
and 3 female yearlings (ca. 21 months old), and 7 male and 7 female adults were
released. Although it is often reported that 61 animals were released in 1998, 2
adult males that were to be included in the shipment were held back and only 59

4
Figure 2. The current range of the Nahanni bison population (hatched area). Release site locations for the Nahanni
population (3 north of 60o N latitude) and the Nordquist population (1 in British Columbia) are indicated by bison icons.

5
animals were shipped (W. Olson pers. comm.). The plan had been to hold the
bison in the enclosure for up to 25 days in order to habituate animals to the area.
Unfortunately, the animals escaped prematurely and a group of 17 bison
dispersed southward in the Fort Nelson area and have established themselves
along the Liard River north of the Beaver River in British Columbia (J. Nishi pers.
comm.).
An estimated 30 wood bison occur along the Liard River from the mouth of
the Beaver River, British Columbia, to the border with the NWT. Approximately
half of these are animals that at one point had dispersed as far south as Fort
Nelson after being released near Nahanni Butte in April of 1998, (J. Nishi pers.
comm.; Government of British Columbia 2002). Subsequently, the Nahanni wood
bison population established itself along both sides of the Liard River valley from
the Blackstone River southward to northern British Columbia. In 1998 it was
estimated to number ca. 160 individuals (Gates et al. 2001).
The Nahanni population is one of a number of free-ranging bison herds,
both wood and plains, that are found in the Northwest Territories and northern
British Columbia and Alberta (Fig. 3). Another separate population was
established further upriver on the Liard in 1995 when the Government of British
Columbia reintroduced 49 wood bison (from EINP) to Aline Lake in the Nodrquist
Flats area of the Liard River (Figs. 2 and 3) about 80 km SW of the Nahanni
bison that dispersed to the Beaver River area (Harper and Gates 2000). It is
anticipated that the Nordquist and Nahanni populations will coalesce in future
(Gates et al. 2001). Based upon screening of blood and lymph node samples,
the Nahanni population is currently designated as a herd that has not been
exposed to, or infected with brucellosis (Brucella arbortus) or tuberculosis
(Mycobacterium bovis) (Gates et al. 2001).

6
Figure 3. Distribution of management zones and free-ranging herds of bison in
NE British Columbia, NW Alberta and the southern Northwest Territories (from
Harper and Gates 2000).

7
INTRODUCTION
Since the initial reintroduction of the Nahanni bison herd in 1980 research
and monitoring of the herd has been inconsistent and sporadic. This lack of
population monitoring has been a concern of local residents of Nahanni Butte
and Fort Liard, especially since there was concern that an increasing bison
population may cause declines in moose numbers, the preferred country food
source in the region. Part of the limited work on the Nahanni bison population
can be attributed to the lack of an established biological program in the Dehcho
region of the Northwest Territories at that time, and that all bison work for 3
different populations in the Northwest Territories was covered by one program
based out of Fort Smith. A biological program for the Dehcho Region was
established in 2002, by the then Department of Resources, Wildlife & Economic
Development (DRWED). A regional wildlife workshop held in September 2002
co-hosted by Dehcho First Nations and DRWED brought together resident
harvesters, elders, and biologists to discuss regional wildlife issues and concerns
and to seek direction for DRWED wildlife programming and research. One of the
recommendations from the workshop was for DRWED to identify ways that the
Nahanni bison population could be monitored regularly. In response to this
recommendation DRWED, continuing as Environment and Natural Resources
(ENR), initiated a program which included annual sex and age classification
surveys, an aerial survey of the Nahanni population, monitoring bison harvest
and mortalities, monitoring bison-vehicle collisions, and collecting biological
samples from animals wherever and whenever possible.
In this report we present a brief historical description of the Nahanni wood
bison population since its reintroduction and present a compilation of the results
of the research initiated in 2002. Where possible we compare our findings with
other bison herds or of earlier work on the Nahanni population. The results of the
individual surveys have previously been presented in community meetings in
both Fort Liard and Nahanni Butte and at the 2004 and 2006 Dehcho Regional
Wildlife Workshops.

8
METHODS
Sex/age Classification Surveys Historical observations of bison from local residents traveling the rivers
and biologists indicated that during the summer animals frequented the riparian
areas and gravel/sand bars along the shoreline and on islands in the Liard River
(L. Konisenta pers. comm.; J. Nishi and T. Ellsworth pers. obs.). This was
presumably because these areas provided relief from heat and insects, and also
provided relatively easy access to high-quality forages of newly growing sedges
(Carex spp.) and willows (Salix spp.). The distribution of animals along the river
did not provide an ideal situation for either the standard aerial or ground based
classification surveys that had been and continue to be used for the Mackenzie
bison population (Larter et al. 2000). In summer 1999, DREWD conducted a 1-
day boat-based classification survey along the Liard River from Fort Liard to
Blackstone as a pilot project (J. Nishi pers. comm.). The survey had favourable
results. Not only were 88 animals classified, but it demonstrated that a boat-
based survey was cost-effective, repeatable and could provide quantitative data.
River water levels are critical to the success of boat-based surveys
because they dictate the amount of shoreline and sand/gravel bars available for
bison and also directly affect boat accessibility to river channels and islands. We
examined the historical daily discharge and water levels of the Liard River and
decided that the most opportune time to conduct surveys starting in 2002 would
be during the last half of July. This was when water levels tend to be at their
lowest in summer, yet provide adequate river channel accessibility, and when
river discharge was relatively low and constant prior to the early August increase
in discharge (Fig. 4). This turned out to be 7-10 days later than the 1999 survey.
Based on additional observations, we also decided to increase the area of survey
coverage in 1999. The survey area would be from at least as far south on the
Liard River as the NT/BC border (60o N latitude) and continue upriver to the
mouth of the Blackstone River. The survey would also cover the South Nahanni
River downriver from where it meets the Liard River to the boundary of the
Nahanni National Park Reserve (Fig. 2). Surveys were planned to be of 2-3
days in duration to provide enough time to thoroughly survey as many of the river

9
Figure 4. The 2005 daily discharge (m3/second) of the Liard River at Fort Liard.
channels and islands as possible. Surveys used a 7.5 m welded aluminum
riverboat with a 125 hp Mercury outboard motor. The crew consisted of one
driver/navigator and 2-5 observers. Driver/navigators were different for each
year but all were skilled boaters knowledgeable of the Liard River, its winding
channels and hidden gravel/sandbars. The number of observers in the crew
varied due to staffing and training opportunities. When bison groups were
observed along the shoreline we maneuvered the boat so that it would drift past
the group permitting bison to be classified from the boat with binoculars. For
small groups accurate classification could be made from the boat. In cases
where all bison in a group could not be classified from the boat we landed and
found an area where we could classify the animals with binoculars from the
shore. When bison were encountered swimming the river (Larter et al. 2003), we

10
allowed the boat to drift downstream from the animals, beached the craft and
waited for the animals to get to the shoreline where they were classified as they
came up on shore. All classifications were verified between observers before
continuing on with the survey. Digital photographs were taken of most large
mixed groups of animals in case there was a classification question. A waypoint
of the location of each group was made with a Garmin global positioning system
(GPS), either 12XL or 76mapS model. The survey route was documented with a
Garmin GPS using the tracking function. All track logs and waypoints were
compiled using OziExplorer software. Any bison encountered traveling the road
from Fort Simpson to Fort Liard at the start of the river survey, on the return drive
after the river survey, or observed in either community during thte course of the
river survey were classified and included as survey data.
Bison were classified into 7 different sex and age classes based upon
body size, pelage, horn shape and horn wear (following Fuller 1959; Komers et al
1992; Larter and Gates 1994; see Appendix 1):
1) Calves – Young of the year of both sexes, typically being born in April-
May with calving largely completed by July. Their reddish-tan coats
turn dark chocolate brown at about 3 months of age and by 4-6 months
horn nubs may be visible.
2) Yearlings – Animals 12 to 18 months old of both sexes with spike
shaped horns of 10-30 cm in length. Body size is smaller than adult
females.
3) Cows or adult females – Animals of 2 years and older. Their horns are
more slender than those of all males and have a pronounced recurve
toward the middle line of the skull resulting in a distinct S-shape in
older cows. The front of the skull is narrower than that of adult males.
4) B1 males or juvenile bulls – Animals 2-3 years of age. Body size is
similar to or slightly smaller than cows however the horn base is wider
than cows. The horns point upward or outwards and always point
away from each other.

11
5) B2 males or sub-adult bulls – Animals 4-6 years of age. Body size
ranges between that of cows and adult bulls. Horn base is wider than
cows and the horns point straight up or towards the middle line of the
skull (Fuller’s (1959) “spike-horn” males). The hair on the head and
shoulders is shorter than in adult bulls.
6) B3 males or young-mature adult bulls – Animals of 7-12 years of age.
Body size is much larger than cows. Horns are curved toward the
middle line of the skull and may show the start of wear on the tips.
Hair on the chest and head is fully developed leaving no open space
between the horns.
7) B4 males or old-mature adult bulls – Animals of at least 10 years of
age. The distinction between B3 males is the noticeable wear on the
horns, often resulting in wide blunt ends.
We used the ratio of calves per 100 adult females to estimate calf production.
We estimated overwinter survival of calves by dividing the ratio of yearlings per
100 adult females determined in a given year by the ratio of calves per 100 adult
females from the previous year. We calculated the ratios of male bison per 100
adult females breaking down males into subadult (B1 and B2) and mature (B3
and B4) classes.
Population Surveys In the mid-1990s the primary bison survey areas were delineated and
included meadow areas in the Nahanni Butte and Netla and Kotaneelee River
areas, the Liard River Valley and its islands from Flett River to Fort Liard and the
cutblocks in the La Biche River area of northeastern British Columbia (C. Gates
pers. comm.). Aerial surveys of these areas were made in 1995, 1996, and 1997
to monitor the Nahanni bison population and to generate a minimum population
count. However, these were not repeatable systematic aerial surveys of the
population.
Subsequent to the September 2002 Dehcho Regional Wildlife Workshop,
we compiled and mapped all historical observations of Nahanni bison. We held

12
community meetings in both Nahanni Butte and Fort Liard in 2003 where
harvesters provided additional information on the distribution of the bison
population. We also received information from the Governments of British
Columbia and Yukon Territory on bison distribution. All data were mapped and
circulated before a final map of the winter range of the Nahanni bison population
was produced.
In March 2004, an aerial survey was conducted over winter wood bison
range in the southwestern Northwest Territories, northeastern British Columbia,
and southeastern Yukon Territory, including the current winter range of the
Nahanni population (GNWT and YTG unpubl. data). The methods and results of
the entire survey are being published elsewhere; here we report the methods and
results of that portion of the survey that covered the 5082 km2 winter range of the
Nahanni bison population.
The survey used a Cessna 185 fixed-wing aircraft and a strip-transect
technique with the transect being the sample unit (Norton-Griffiths 1978). We
flew parallel line transects over the range at ca. 4 km intervals at an elevation of
122 m (400 feet) above ground level and attempted to maintain a flight speed of
ca. 160 km/h. The wing struts of the aircraft were marked so that a 500 m wide
strip on both sides of the aircraft could be used as the sample unit. The survey
crew consisted of a pilot, a navigator/recorder and two observers. Observers
from Nahanni Butte and Fort Simpson and a YTG biologist participated in the
survey. We recorded all bison, and any other wildlife, observed whether inside or
outside of the 500 m strips. We also recorded animal tracks and feeding sites in
order to better describe the winter distribution of wildlife, particularly bison. We
estimated population size of non-calf bison following Jolly’s (1969) method for
unequal sized sampling units (Norton-Griffiths 1978).
Biological Sampling Mortalities
When bison are harvested legally under quota for subsistence use,
sampling and information kits are provided. Hunter(s) are requested to provide
information on the age class and general animal condition. If a female is

13
mistakenly harvested, information on whether she was pregnant or lactating is
required. A blood sample and the two first incisor teeth are also collected and
provided to ENR. For animals that were euthanized, or after collisions with motor
vehicles or where there was a fresh carcass, we collected incisor teeth, whole
blood samples and lymph nodes if at all possible. Teeth were forwarded to
Matson’s Laboratory, Milltown, Montana, for aging, which is determined by
counting cementum annuli of the first incisor (Matson 1981). We also
investigated bison carcasses that have been reported whenever feasible. Most
of these carcasses were located along the riverbanks and were in various stages
of decomposition, which limited the type of biological samples available to collect
beside teeth.
Disease
Blood samples were spun in a centrifuge, the serum decanted and stored
frozen. Frozen serum was shipped to the Canadian Food Inspection Agency’s
Animal Diseases Research Institute in Lethbridge, Alberta and tested for
evidence of exposure to Brucella abortus. Lymph node samples were submitted
to the Canadian Food Inspection Agency’s national Mycobacterial Diseases
Centre of Expertise for culture or histological evidence of tuberculosis
(Mycobacterium bovis) and/or brucellosis (Brucella abortus).
Subsamples of fresh fecal samples were frozen and forwarded, with
samples from other bison herds in the Northwest Territories, to the Veterinary
College, University of Saskatchewan, to determine whether or not animals had
been exposed to Mycobacterium avium subspecies paratuberculosis, the
causative agent of Johne’s disease.
Diet Composition
Fresh fecal samples (ca. 30 g wet weight) were collected during every sex
and age classification survey and whenever the opportunity arose during field
work at other times of the year. Samples were stored frozen in labeled ziplock
bags before being subsampled. Fecal material was thawed and oven-dried at
60oC for 48 h and ground using a coffee grinder. Subsamples of the ground

14
material (ca. 1 g dry weight) were forwarded to the Micro Composition Lab, Fort
Collins, Colorado for analysis. Diet composition was determined by analyzing
fecal plant fragments (Sparkes and Malechek 1968) following Hansen et al.
(1976). Briefly, ground samples were washed with a clearing solution, mounted
on a microscope slide, and the cellular plant fragments were identified. Each
sample was analyzed at 100 views so it can be reported as percent diet
composition via percent relative density. The microhistological technique has
inherent limits, such as the inability to separate some species, and a limited
percent of identifiable fragments in the slides (Johnson et al. 1983; Barker 1986).
However, we deemed the method suitable for this study since we were interested
in the proportional dietary contribution of different forage categories not individual
plant species. Moreover this method has been used in previous work with the
Mackenzie wood bison population, thus permitting for direct comparisons (Larter
and Gates 1991; Larter et al. 2000). For the diet analysis we pooled samples of
2-4 individual pats per group. Monthly diet composition was estimated by a
weighted average of dietary components from all groups in any month. Group
size was used as the weighting factor. We grouped dietary components into the
following categories: grasses, sedges, willow, Equisetum, legumes, rosaceae,
and others. The others category included moss, lichen, and other forbs and
woody plants. There was no unidentified material.

15
RESULTS Sex/age Classification Surveys
Since 2002 we have successfully classified >130 animals annually. In
each survey we classified 3-7 mixed sex and age groups of 10 or more
individuals (including calves), with most mixed sex and age groups comprising 20
or more individuals. Generally the largest group classified in each survey was
ca. 40 individuals. Estimated calf production has been highly variable amongst
years ranging from 20-57 calves per 100 adult females. Similar annual variation
was seen in the number of subadult males per 100 adult females (range 33-57).
The number of mature males per 100 females remained relatively constant
(range 40-50) until 2006 (72) (see Table 1).
19991 2002 2003 2004 2005 2006
# bison classified 137 131 154 137 138 167
# groups ≥ 10 bison incl. calves 4 4 7 3 4 4
# groups ≥ 20 bison incl. calves 3 2 2 3 3 4
# bison in largest group 49 42 39 48 27 42
# calves/100 females 29.2 20.4 56.5 41.8 27.8 47.4
# yearlings/100 females 16.9 16.7 9.7 30.9 25.9 24.6
# mature males2/100 females 38.5 48.2 50.0 40.0 50.0 71.9
# subadult males3/100 females 26.2 57.4 32.6 36.4 51.9 49.1
# all males/100 females 64.6 105.6 82.3 76.4 101.9 121.1
Table 1. The number of bison classified, the number and sizes of mixed groups
classified and the number of different sex/age classes per 100 adult female
bison. 1 These data include a group of 49 bison classified along the Liard
Highway (Hwy 7) after the river survey. 2 Mature males = B3 and B4 classes
pooled. 3 Subadult males = B1 and B2 classes pooled.
Estimated overwinter survival of calves has shown a continual increase from
47.5% during the 2002-03 winter, to 88.5% for the 2005-06 winter (Fig. 5).

16
0
25
50
75
100
2002-03 2003-04 2004-05 2005-06
Year
Ove
rwin
ter S
urvi
val (
%)
0
25
50
75
Calves/100 A
dult Females
Figure 5. Estimated percent overwinter survival of calves (■) and the number of
calves per 100 adult female bison documented during the previous summer (♦)
from 2002-03 to 2005-06.
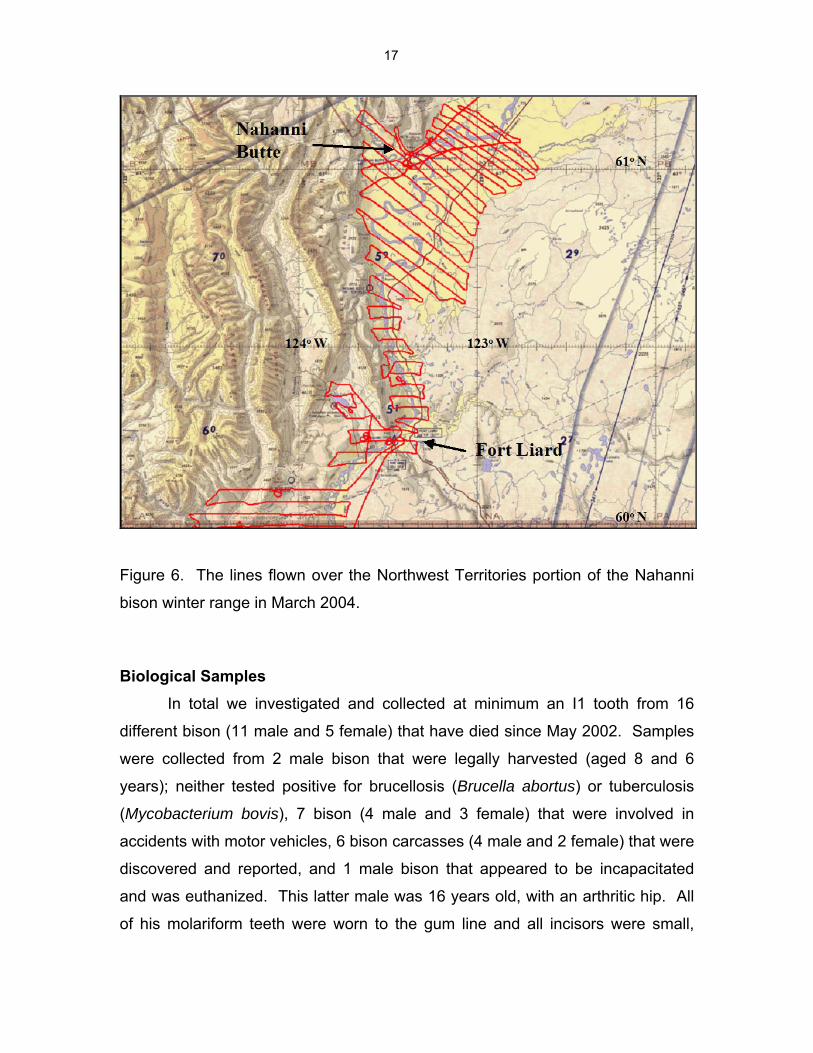
Population Surveys The winter range survey area mapped was 5082 km2 in total with 3350
km2 of the range falling within the Northwest Territories, 1253 km2 of the range
falling within British Columbia, and the remaining 479 km2 of the range falling
within Yukon (see Fig. 2). We flew 1288 km of transect lines over the Nahanni
bison winter range, 887 km of transect lines in the Northwest Territories (Fig. 6),
312 km of transect lines in British Columbia, and 89 km of transect lines in
Yukon. This translated into percent coverage of 26.5, 24.9 and 18.7 for each
area respectively. We counted 101 non-calf bison, all within the Northwest
Territories part of the winter range, resulting in a population estimate of 399 bison
(CV = 0.32).
17
Figure 6. The lines flown over the Northwest Territories portion of the Nahanni
bison winter range in March 2004.
Biological Samples In total we investigated and collected at minimum an I1 tooth from 16
different bison (11 male and 5 female) that have died since May 2002. Samples
were collected from 2 male bison that were legally harvested (aged 8 and 6
years); neither tested positive for brucellosis (Brucella abortus) or tuberculosis
(Mycobacterium bovis), 7 bison (4 male and 3 female) that were involved in
accidents with motor vehicles, 6 bison carcasses (4 male and 2 female) that were
discovered and reported, and 1 male bison that appeared to be incapacitated
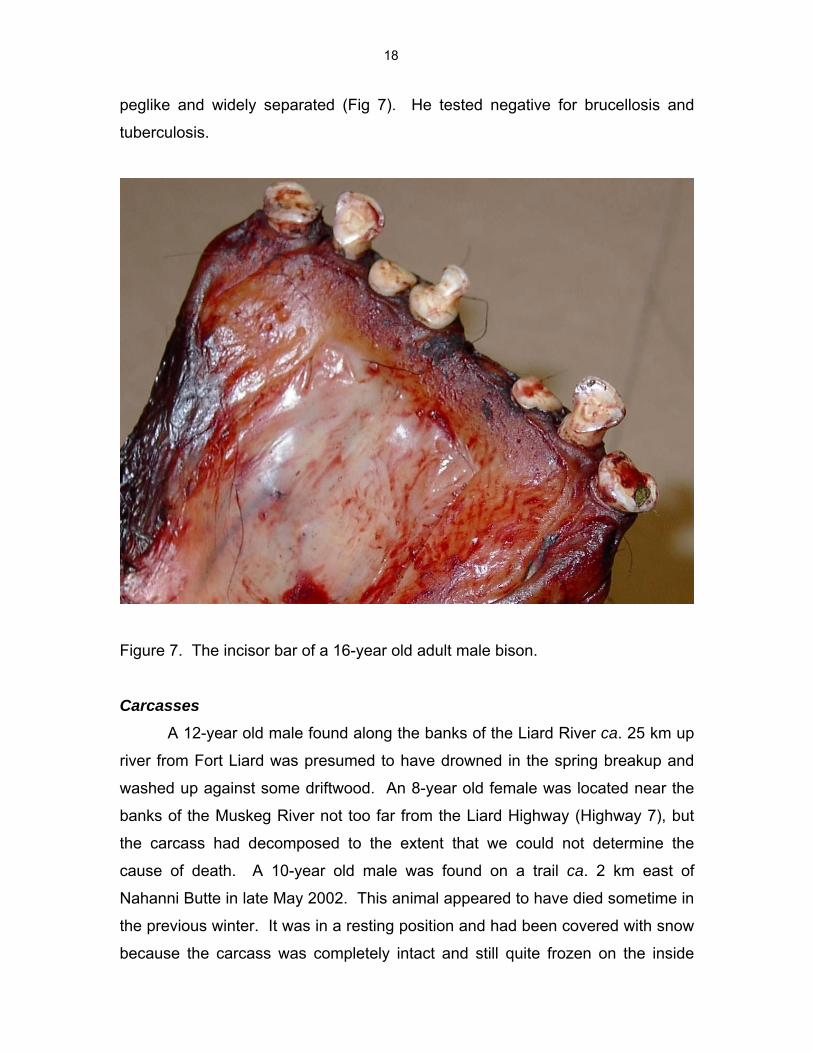
and was euthanized. This latter male was 16 years old, with an arthritic hip. All
of his molariform teeth were worn to the gum line and all incisors were small,
18
peglike and widely separated (Fig 7). He tested negative for brucellosis and
tuberculosis.
Figure 7. The incisor bar of a 16-year old adult male bison.
Carcasses
A 12-year old male found along the banks of the Liard River ca. 25 km up
river from Fort Liard was presumed to have drowned in the spring breakup and
washed up against some driftwood. An 8-year old female was located near the
banks of the Muskeg River not too far from the Liard Highway (Highway 7), but
the carcass had decomposed to the extent that we could not determine the
cause of death. A 10-year old male was found on a trail ca. 2 km east of
Nahanni Butte in late May 2002. This animal appeared to have died sometime in
the previous winter. It was in a resting position and had been covered with snow
because the carcass was completely intact and still quite frozen on the inside

19
when it was discovered. This bison was diagnosed as having emphysema and
we presume it died of associated breathing complications; it did not test positive
for diseases. A 14-year old female was discovered on a small island on the Liard
River ca. 10 km east of Nahanni Butte. Bone evidence at the site indicated she
had died from complications with a breach birth. A 5-year old male was found
near the Flett River crossing. It appeared to have died from complications
related to a puncture wound that had ruptured the rumen. A 2-year old male was
found partially submerged on the shores of the Liard River ca. 10 km upriver from
Fort Liard. This animal was suspected to have succumbed to internal injuries
possibly from a fall from the steep west side river bank. It was tested for anthrax
with a field ELISA test provided by the United States Navy. The results from the
ELISA field test and from lab analyses of nasal swabs were all negative.
Motor Vehicle Collisions
Prior to fall 2004 there had only been one reported collision involving
Nahanni bison on the Liard Highway; an impaired driver in a pickup truck killed 4
bison in May 2000. A territorial fire crew was in the vicinity at the time of the
accident and they salvaged as much of the meat as possible and distributed it to
residents in Fort Liard (D. Allaire pers. comm.). In fall 2004, 3 young animals (a
1-year old male, 2-year old male, and a 1-year old female) died as a result of
motor vehicle collisions on the Liard Highway. In January 2005 an adult female
died from a motor vehicle accident on the access road to Fort Liard and an adult
male died from a motor vehicle accident on the K-29 road. All 5 of these animals
tested negative for brucellosis and tuberculosis. In October 2005 an adult female
died from an accident on the Liard Highway. The ages are currently unavailable
for these 3 animals that died after 2004. A 7-year old male was accidentally
struck and killed by a vehicle in Nahanni Butte in September 2003. We are also
aware of an adult male bison being struck and killed by a motor vehicle in
January 2005 near or about km 120 Highway 77 (British Columbia section of the
Liard Highway) (Shawn Brinsky pers comm.), but we were unable to collect
samples from this animal.

20
Diet Composition
Diet composition was determined for the months of January (1 group
representing 12 animals), February (1 group representing 8 animals), July (4
groups representing 145 animals), September (2 groups representing 17
animals) and December (3 groups representing 25 animals). The diet in
January and February is sedge-dominated with sedge being ≥20% of the diet in
all months reported. Equisetum is a major component of the December diet and
comprises ≥10% of the diet in all months except February. Willow (Salix spp)
and grasses make up varying proportions of the diet (5-25%) in January, July
and September (Fig 8).
All fecal samples were collected within the Liard River valley, no more
than 7km away from the river with the majority collected either within the
community limits of Fort Liard and Nahanni Butte or adjacent to the river. The
only exception being the January samples which were collected from Fish Lake.

21
1 1 4 2 3
0%
20%
40%
60%
80%
100%
Jan Feb Jul Sep Dec
Rel
ativ
e D
ensi
ty o
f Fra
gmen
ts
Sedge Willow Grass Equisetum Rose Legume Other
Figure 8. The composition of the diet broken into major forage classes during
different months. Composition based up the analysis of fecal plant fragments.
Numbers above each histobar indicate the number of groups the analysis is
based upon.
Sedge

22
DISCUSSION General
The ability of bison to swim across the Liard River is important in the
ecology of the Nahanni population. Open water crossings allow bison to access
forage in riparian habitats throughout the river valley and may play a role in
insect and predator avoidance. Based upon our observations (at least one group
of animals observed swimming the river during each sex and age classification
survey) and reports from residents of Nahanni Butte and Fort Liard, who use the
river for travel during the ice-free period, swimming back and forth across the
river is a relatively common occurrence. Bison are frequently seen crossing the
river near Swan Point near Netla and near the confluences of the Muskeg and
Kotaneelee Rivers (see Larter et al. 2003). All sex and age classes appear to be
quite capable of swimming even in current speed of 14-16km/h, however calves
and mature males may be more vulnerable to wave action and disturbance from
river traffic. Both calves and mature males sit low in the water.
Drowning is a source of mortality for other bison populations like Wood
Buffalo National Park and Yellowstone National Park (Carbyn et al. 1993;
Meagher 1973) and can have a substantial impact on the population. Before the
damming of the Peace River 3000 animals were lost in one year when the
Peace/Athabasca delta flooded (Fuller 1966; Carbyn et al. 1993). Drowning
mortalities for the Nahanni population are generally reported during spring
breakup or after peak river discharge related to mountain snowmelt and early
summer rains (as in June 2006). Animals caught along the river banks or on the
riverine islands at this time are swept away and drowned. Unlike for other bison
populations, where mass “accidental deaths” occur when large groups of animals
are lost at once (Meagher 1973), there have only been reports of individual
animals being drowned and washed ashore; no drownings of groups have been
reported (Larter et al. 2003). Boat traffic, especially barge traffic, poses a
potential threat to crossing bison. Collisions, disturbances that change crossing
locations and increase the crossing time and distance, and increased wave and
wake action could all contribute to an increase in mortalities.

23
The Liard River has many channels and riverine islands which historically
have been transient in nature as evidenced by the abundance of oxbow lakes
and channels that are found throughout the valley. These riparian and oxbow
habitats provide a variety of forage and are frequented by bison. The limited
information we have on the diet of Nahanni bison shows similarities to the diet of
the Mackenzie wood bison population in that sedges dominate the winter diet
and during summer and fall there is a more diverse mix of sedges, grasses,
willow and forbs. However, noticeable differences were the lack of lichen and the
inclusion of Equisetum in the diet of Nahanni bison. There was a substantial
amount of Equisetum in the diet during early winter (December). These
differences in diet likely reflect differences in forage availability but there have
been no detailed habitat assessments done in the Nahanni area. Although
Equisetum plants are generally considered to be forages of limited nutritional
value, in cold temperate shrub wetlands they acquire and cycle nutrients more
efficiently than other members of the plant community (Marsh et al. 2000). In
December, before increased snow cover and snow hardness reduce the
availability of Equisetum, bison may seek this more nutritious forage hence its
substantial component of the diet. However, Equisetum also has a high silica
content which must affect bison teeth as evidenced by Figure 7.
There remains concern from local residents that the presence of bison in
the Liard Valley has altered the patterns of use of riparian areas by moose
because bison have chased moose from the river. We have observed moose
during 3 of our 5 sex and age classification surveys conducted since 2002. The
summer diet of moose generally includes aquatic vegetation (MacCracken 1992),
which would be found in ponds or oxbow lakes away from the main river
channels. Moose inhabit areas also occupied by free-roaming bison herds like
Wood Buffalo National Park, the Mackenzie Bison Sanctuary, Elk Island National
Park and the Aishihik. Studies addressing the interspecific relationships between
bison and other ungulates are lacking and limited to diet and habitat studies
which point towards selective habitat use by different ungulates (Cairns and
Telfer 1980). Whether similar interspecific relationships hold following re-
introductions of bison is unknown. Bison may indirectly influence predation rates

24
on moose by supporting a higher density of wolves than would exist without
bison as an alternate prey source (Larter et al. 1994).
Sex/age Classification Surveys
There are wide annual fluctuations in the number of calves per 100 adult
females, similar to that reported for the Mackenzie population. However,
absolute numbers are lower. Rarely were there fewer than 30 calves per 100
adult females in the Mackenzie population between 1984 and 1998 (Larter et al.
2000), but in 3 of the 6 surveys of the Nahanni population fewer than 30 calves
per 100 adult females have been recorded. During 1984-1998, overwinter
survival of calves in the Mackenzie population ranged 26-97%, averaging 54%.
This is higher than the overwinter survival reported for the Nahanni population
over the past 4 years. During 1984-1998, the Mackenzie population was
undergoing an increase in numbers (Larter et al. 2000). We suspect the Nahanni
population is slowly increasing in number but future population surveys are
required in order to determine the population trend.
The survey results indicate that overwinter survival of calves has been
increasing. This is conditional on the assumption that the number of females in
the population has remained relatively constant over time (Caughley 1974). It is
unlikely that we are missing many late born calves by conducting the surveys at
almost the same date in mid-July. It is also unlikely that there has been
inconsistent classification of females because it has been the same group of
observers classifying for each survey. There is the possibility that more adult
females died this past summer with the high water levels and flooding. At least
three bison carcasses washed up in the Mackenzie River in the Sahtu following
this year’s flooding. The percent of subadult males that are B1 versus B2
increased from 13% in 2002 to ranging from 32-45% in subsequent years. This
provides further indication that there has been increasing number of young
animals in the population over the past 5 years and would be consistent with an
increasing trend in overwinter survival of calves. A further population survey is
required in order to corroborate increased overwinter calf survival.

25
Even if overwinter survival of calves has been increasing recently, it is
highly unlikely that the Nahanni population would go through the same kind of
eruptive population growth that was observed with the Mackenzie population.
The Nahanni population has lower calf production, its highest estimated
overwinter calf survival is 20% lower than that reported for the Mackenzie
population and it is most likely that the lifespan of Nahanni animals is significantly
shorter due to the high silica intake in the diet which rapidly wears down the teeth
(see Fig. 7).
We saw more groups of bison during the 2006 survey than in other years,
including more male only groups than other years. This explains why we had a
higher mature male per 100 female ratio in 2006 than in other years. Generally
we are able to classify 1 or 2 large mixed sex/age groups, which we believe
provides a fairly accurate assessment of the female, calf, and immature (yearling,
B1 and B2 males) component. Because fewer mature males are associated with
these mixed sex/age groups during summer we likely underestimate the mature
male (B3 and B4) component of the population (Komers et al. 1992).
Population Surveys
The population estimate of 399 non-calf bison for March 2004 has a high
coefficient of variation, which is not surprising. The shape of the study area,
which is close to the current distribution of animals, has a very narrow section
with much wider sections at the ends (see Figure 2). This increases the
likelihood of having zero animal counts on transects which is exacerbated by the
fact that bison tend to be clumped in large groups dispersed over the range.
We feel that the estimate is relatively accurate for a number of reasons.
We have consistently observed a minimum of 130-160 bison over the past 5
years when we have conducted sex/age classification surveys in a 2-3 day
period traveling the river. The overwinter survival of calves has been increasing
over the past 5 years. In 1997, 107 bison were counted in the third consecutive
year that a reconnaissance survey was conducted in parts of the bison range
known to be frequented by bison. An instantaneous growth rate per year of
approximately r=0.19 would result in an estimate of approximately 399 bison in

26
2004. This is likely a liberal estimate of r since some bison were most likely
inhabiting parts of the range that were not surveyed. Bison have been dispersed
into British Columbia, but there is no reason to believe that dispersal is only out
of the Northwest Territories.
We conducted the population survey in late-winter because tracks in the
snow permit the opportunity to find animals that may not be seen, whether on or
off transect, and this can provide information useful in formulating sightability
correction factors. A strict line transect survey method may not be the most
appropriate for providing a population estimate with a relatively tight coefficient of
variation. We are exploring other options based upon the current survey area
shape. The Nahanni bison distribution is bounded by the Liard Range to the
west and we do not anticipate animals dispersing to the east out of the river
valley because of the lack of meadow habitat and oxbow lakes. Hence there will
continue to be an awkwardly shaped survey area within which the survey must
be conducted. Maybe a tighter coefficient of variation is not as critical as being
able to do repeatable surveys of the area on a more timely rotation.
Biological Samples Motor Vehicle Collisions
The Departments of Transportation (DOT) and Environment and Natural
Resources (ENR) take the subject of motor vehicle collisions very seriously, and
try to gather as much information from these unfortunate incidents as possible
(see Appendix 2). Although the number of collisions along the Liard Highway
(Hwy 7) pales in comparison to those occurring on the Mackenzie Highway (Hwy
1) between the Mackenzie River crossing and Yellowknife, accidents still occur.
Collisions to date have not caused any loss of human life but have caused
significant damage to property and the loss of life of a number of bison.
Bison seem to frequent the road corridor more during August-October in
association with the rut. Well worn trails are often seen along the side of the
road between Flett crossing and Muskeg River (kms 90 and 45 on Hwy 7). Still,
an alarming number of local residents are oblivious to the fact that bison inhabit
the area and can often be seen along the road corridor and interestingly, most
27
collisions on Hwy 7 are between bison and vehicles driven by local residents, not
visiting tourists or truck drivers. Most collisions occurred between dusk and
dawn and near a dip or rise in the road. All collisions occurred in areas of known
high use by bison. Each fall DOT and ENR conduct a media campaign on the
radio and in the newspapers reminding people that bison may be encountered on
the highways and to be especially alert during low light conditions. Posters are
also circulated. Even with the media blitz fall 2004 was especially bad for motor
vehicle collisions on the Hwy 7. In response to the number of collisions in fall
2004, DOT and ENR erected an additional 8 highway signs over a 200 km
stretch of Hwy 7 in spring 2005. These signs reminded motorists to be aware of
bison presence in the area.
Disease
Wood bison in and around Wood Buffalo National Park (WBNP) are
infected with two introduced cattle diseases, bovine tuberculosis and bovine
brucellosis. The presence of these two diseases is considered the largest single
obstacle to wood bison conservation and recovery in Canada (Gates et al. 2001),
and is also a real concern to the commercial livestock industry and to those
people who hunt animals from infected populations. For this reason, it is very
important to prevent the spread of these diseases to currently disease-free wood
bison populations like the Nahanni, and to have adequate surveillance programs
in place to remain confident in the health status of these populations. The
national Wood Bison Recovery Team has highlighted the need to maintain
adequate ongoing surveillance of all free-roaming herds. Testing to date
suggests that the Nahanni population remains free of both diseases.
Johne’s Disease is a chronic disease of domestic ruminants that causes
significant loss of body condition and diarrhea. While reported in a number of
wildlife species, it has seldom been recognized as a significant disease-causing
problem in free-ranging wildlife populations with several exceptions where there
are predisposing management issues. A unique strain of Mycobacterium avium
subspecies paratuberculosis, the causative agent of Johne’s Disease, was
recently identified in a number of free-ranging and captive bison populations in

28
Canada. While no clinical disease has been recognized in these populations, the
significance of this organism for wood bison populations is not currently known.
As part of ongoing efforts to monitor for the organism in herds across Canada,
sampling of the Nahanni population has not found any evidence of M. a.
paratuberclosis.
Anthrax, the other major disease of wood bison in northern Canada, has
not been detected in the range of the Nahanni bison population. Bacillus
anthracis, the causative agent of anthrax, forms long-lived spores that persist in
the environment and can cause disease under certain environmental factors.
Anthrax is endemic in bison in northern Canada, with 10 outbreaks documented
in WBNP, the Slave River Lowlands and the Mackenzie populations between
1962 and 2006. The suitable conditions for spore persistence and disease
outbreaks may not exist within the range of the Nahanni bison population, which
may explain the absence of disease in this population.
Legal Harvest
In 1998 a legal harvest was established for the Nahanni bison population.
Two tags are issued annually for male bison, one each for a resident of Nahanni
Butte and a resident of Fort Liard. Hunting can take place from 1 July to 15
March and from 15-30 June. Complete biological sampling kits are issued with
each tag and every effort is made to have an ENR staff member (wildlife officer,
biologist, technician) accompany the hunt to assist with the collection of
biological samples. To date only 2 bison have been taken, one by each
community. A wildlife officer accompanied the hunts and collected the required
biological samples (K. Davidge, pers. comm.). Because there has been little
interest from the communities of Fort Liard and Nahanni Butte to legally harvest
bison, we get limited information on the presence and incidence of diseases in
the bison population, and have relied on opportunistic collections of biological
samples from reported animal carcasses and animals involved in motor vehicle
collisions to bolster our sample size. If the legal quotas were filled annually we
would certainly have a more consistent collection of samples over time from
which to detect disease presence and incidence in this population.

29
Nuisance Bison Bison, that frequent the communities of Fort Liard and Nahanni Butte
regularly, have been considered a nuisance by some local residents. Beyond
their physical presence within the community, bison have been known to damage
gardens, yards, fences, and planted trees. They make use of unfenced sandy
and dusty areas because they provide ideal wallow sites for dust baths which
relieve them of insect harassment. Bison often frequent community airstrips and
their vicinity likely attracted by the good quality of forage available adjacent to the
airstrips from seeding and regrowth of disturbed areas. Bison, as a nuisance, are
more commonly reported by residents of Fort Liard than by residents of Nahanni
Butte with most complaints occurring during June to September.
Mitigating measures that make things less attractive to bison and reduce
bison damage include fencing draped with flagging around planted trees and
gardens, regularly cutting grass and lawns to reduce the amount of feed, and
brushing out under story vegetation around the community. Wallows that have
been created by bison could be covered in gravel. Any sand pits associated with
playgrounds should be fenced off before bison have discovered them. Tags to
harvest bison could be used to remove bison that have become habituated to the
community. A public education campaign would go a long way to reducing bison
interactions in communities. The Department of Environment and Natural
Resources and the Fort Providence Resource Management Board are
pioneering a poster information campaign for Fort Providence, another Dehcho
community that has been experiencing challenges with bison frequenting the
community. A similar campaign should be considered for Fort Liard and Nahanni
Butte.

30
RECOMMENDATIONS
1) Sex and age classification surveys should continue to be conducted
annually during July.
2) A population survey, covering a similar area and with a comparable
methodology to the March 2004 survey, should be conducted in March
2008 or 2009 in order to get another population estimate and to put into
context the calf production and overwinter calf survival data estimated
from the sex and age classification surveys.
3) A public education campaign heightening public awareness of bison,
describing bison behaviour, ways to reduce bison presence within the
community, and actions to avoid when bison are present should be
initiated in Fort Liard and Nahanni Butte.
4) Additional fecal samples need to be collected, especially during months
where data are lacking, in order to better address the seasonal changes in
bison diet composition.
5) Biological samples should continue to be collected on an opportunistic
basis.
6) Government of the Northwest Territories staff should continue to assist
with any legal bison harvest in order to ensure biological samples are
collected.
7) There should continue to be a detailed collection of data from any motor
vehicle collisions and continued coordination of the data collection and
information sharing between law enforcement agencies and GNWT
Departments (DOT, ENR).
8) There should continue to be a public education campaign during fall to
remind and alert residents about bison presence on highways.

31
ACKNOWLEDGEMENTS
This project would not have been initiated without the support of the Nahanni
Butte Dene Band and the Acho Dene Koe Band of Fort Liard, and the financial
support of the Government of the Northwest Territories. We acknowledge the
assistance of Jim Deneron, Troy Ellsworth, Deborah Johnson, Isadore Lomen,
Gavin More, John Nishi, Michael Sassie, Dale Timbre, George Tsetso, and Doug
Villeneuve with various aspects of the sex and age classification surveys. We
acknowledege the assistance of Edward Cholo, Thomas Jung, Raymond and
Steve Vital with the population survey. The Yukon Territorial Government
provided financial support for the population survey and Aaron Close of
Wolverine Air provided skillful piloting. Ken Davidge is acknowledged for his
assistance with the legal harvest and biological sampling. Daniel Allaire, Carl
Lafferty and George Tsetso are acknowledged for their assistance with bison –
vehicle collisions and biological sampling. Brett Elkin is acknowledged for
assistance with biological sampling, preliminary sample analysis, coordinating
samples and results with southern laboratories and with comments for earlier
drafts of this report. Hal Reynolds, Nahum Lee, Norm Cool, Wes Olson and Troy
Ellsworth are acknowledged for unearthing information on historical releases of
bison. Floyd Bertrand, Floyd Diamond-C, and Ross Hagen are acknowledged for
logistical assistance. Matson’s Laboratory, Milltown Montana aged the teeth.
The Micro Composition Lab, Fort Collins, Colorado completed the diet analysis.
Blood and lymph node samples were inspected for disease presence by the
Canadian Food Inspection Agency.

32
PERSONAL COMMUNICATIONS Daniel Allaire, Forest Officer, Government of the Northwest Territories, Fort
Simpson.
Shawn Brinsky, Conservation Officer, British Columbia Government, Fort Nelson.
Ken Davidge, Renewable Resources Officer III, Government of the Northwest
Territories, Fort Simpson.
Cormack Gates, Coordinator – Environmental Science Program, University of
Calgary.
Dolphus Jumbo, Harvester, Trout Lake.
Leon Konisenta, Harvester, Nahanni Butte. John Nishi, Bison Ecologist, Government of the Northwest Territories, Fort Smith.
Wes Olson, Senior Park Warden, Parks Canada, Elk Island National Park.
33
LITERATURE CITED Barker, R.D. 1986. An investigation into the accuracy if herbivore diet analysis.
Australian Wildlife Research 13: 559-568. Cairns, A.L. and Telfer, E.S. 1980. Habitat use by four sympatric ungulates in
northern boreal mixedwood forest. Journal of Wildlife Management 44: 849-857.
Carbyn, L.N., Oosenbrug, S.M., and Anions, D.W. 1993. Wolves, bison, and the
dynamics related to the Peace-Athabasca Delta in Canada’s Wood Buffalo National Park. Circumpolar Research Series No. 4, Canadian Circumpolar Institute, University of Alberta, Edmonton, AB. 270pp.
Caughley, G. 1974. Interpretation of age ratios. Journal of Wildlife Management
38: 557-562. Fuller, W.A. 1959. The horns and teeth as indicators of age in bison. Journal of
Wildlife Management 23: 342-345. Fuller, W.A. 1966. The biology, and management of bison of Wood Buffalo
National Park. Wildlife Management Bulletin Series 1. 52pp. Gates, C.C., Chowns, T. and Reynolds, H. 1992. Wood Buffalo at the
crossroads. Aberta: Studies in the Arts and Sciences 3: 139-165. University of Alberta Press, Edmonton, AB.
Gates, C.C., Stephenson, R.O., Reynolds, H.W., van Zyll de Jong, C.G.,
Schwantje, H., Hoefs, M., Nishi, J., Cool, N., Chisholm, J. and Koonz, B. 2001. National recovery plan for the wood bison (Bison Bison athabascae). National Recovery Plan No. 21. Ottawa: Recovery of Nationally Endangered Wildlife (RENEW).
Gordon, B.C. 1970. Bison antiquus from the Northwest Territories. Arctic 23:
132-133. Government of British Columbia. 2002. Wildlife in British Columbia at Risk –
Wood Bison. Ministry of Water, Land and Air Protection, Victoria, BC 6pp. Hansen, R.M., Foppe, T.M., Gilbert, M.B., Clark, R.C. and Reynolds, H.W. 1976.
The microhistological analyses of feces as an indicator of herbivore diet. Unpublished report available from the Department of Range science, Colorado State University, Fort Collins, CO.
Harper, W.L. and Gates, C.C. 2000. Recovery of wood bison in British
Columbia. In: Darling, L.M. ed. Proceedings of a conference on the biology and management of species and habitats at risk, Kamloops BC,

34
15-19 February 1999. Vol. 2. British Columbia Ministry of Environment, Lands, and Parks, Victorial BC and University College of the Cariboo, Kamloops, BC. 520pp.
Johnson, M.K., Wofford, H. and Pearson, H.A. 1983. Digestion and
fragmentation: influence on herbivore diet analysis. Journal of Wildlife Management 47: 877-879.
Jolly, G.M. 1969. Sampling methods for aerial census of wildlife populations.
East African Forestry Journal 34: 46-49. Komers, P.E., Messier, F. and Gates, C.C. 1992. Search or relax: the case of
bachelor wood bison. Behavioral Ecology and Sociobiology 31: 195-203. Larter, N.C. and Gates, C.C. 1991. Diet and habitat selection of wood bison in
relation to seasonal changes in forage quality. Canadian Journal of Zoology 69: 2677-2685.
Larter, N.C. and Gates, C.C. 1994. Home range size of wood bison: Effects of
age, sex, and forage availability. Journal of Mammalogy 75: 142-149. Larter, N.C., A.R.E. Sinclair and C.C. Gates. 1994. The response of predators to
an erupting Bison (Bison bison athabascae) population. Canadian Field-Naturalist 108: 318-327.
Larter, N.C., Sinclair, A.R.E., Ellsworth, T., Nishi, J. and Gates, C.C. 2000.
Dynamics of reintroduction in an indigenous large ungulate: the wood bison of northern Canada. Animal Conservation 4: 299-309.
Larter, N.C., Nishi, J.S., Ellsworth, T., Johnson, D., More G. and Allaire, D.G.
2003. Observations of wood bison swimming across the Liard River, Northwest Territories, Canada. Arctic 56: 408-412.
MacCracken, J.G. 1992. Ecology of the moose on the Copper River Delta,
Alaska. Ph. D. thesis, Univ. of Idaho, Moscow. 338pp. MacGregor, J.G. 1952. The land of twelve foot Davis. (A history of the Peace
Country.) The Institute of Applied Art Lt. Edmonton, AB. 394pp. Marsh, A.S., Arone III, J.A., Borman, B.T. and Gordon, J.C. 2000. The role of
Equisetum in nutrient cycling in an Alaskan shrub wetland. J ournal of Ecology 88: 999-1011.
Matson, G.M. 1981. Workbook for cementum analysis. Milltown, MO. 30pp. Meagher, M.M. 1973. The bison of Yellowstone National Park. National Parks
Service Scientific Monograph Series No. 1. 161pp.

35
Norton-Griffiths, M. 1978. Counting animals. Serengeti Monitoring Program Publication Number 1. Nairobi, Kenya: African Wildlife Leadership Foundation.
Ogilvie, W. 1983. Report on the Peace River tributaries in 1981. Annual report.
Department of Interior Canada for 1892, part 7. 144pp. Reynolds, H.W., McGillis, J.R. and Glaholt, R. 1980. Range assessment of the
Liard-South Nahanni Rivers region, Northwest Territories as habitat for wood bison. Unpublished report. Canadian Wildlife Service, Edmonton, AB. 39pp.
Soper, J.D. 1941. History, range and home life of the northern bison. Ecological
Monographs 11: 347-412. Sparkes, D.R. and Malechek, J.C. 1968. Estimating percentage dry weights
using a microscopic technique. Journal of Range Management 21: 264-265.
Stephenson, R.O., Gerlach, S.H., Guthrie, R.D., Harrington, C.R., Mills, R.O. and
Hare, G. 2001. Wood bison in late Holocene Alaska and adjacent Canada: Paleontological, archaeological and historical records. In: Gerlach, S.C. and Murray, M.S. eds. People and wildlife in northern North America: Essays in honor of R. Dale Guthrie. British Archaeological Reports, International Series 994. Pgs 125-159.

36
Appendix 1. Plates showing the 7 different sex and age classes of wood bison. See methods for detailed descriptions.
B4 (see broomed horn), B3 Cow, Cow, Calf Cow, Yearling
B3, B2, Yearling, Cow, Cow, Calf Yearling, B1 Cow, B3, Cow, Yearling
Cow, Calf, Cow B3, B3, B1, B3, B3, B2 B2, B3

37
Appendix 2. A copy of the information sheet completed for bison-vehicle
collisions.
Station: RCMP File #: Time:
Sex:
Occupants: Y / N
Occupant(s) Name:
Date: Time of Accident (24h):
Passenger Car Light or Heavy duty Truck Bus RV Semi -Trailer Other: Ambient Temperature (°C):
Estimate of Damage: Light Conditions:
Road Surface Type: Asphalt Gravel Dirt Surface Conditions:
Weather Conditions:
Road Description: Turn Dip Rise Straight - Away
Was Animal(s) Killed on Impact: Y / N
Total Number of Animals Involved: Males:
Females:
Hide Salvaged: Y /N Skull Salvaged: Y /N Biological Samples Collected: Y / N Sample ID#
Lymph Nodes: Y /N Fecal: Y /N Blood: Y / N
Full Girth (CM): Half Girth (CM):Date: Time:
Address: Phone #:
Dawn Day Dusk Night
Vehicle / Weather Information
Describe any Injuries to Driver or Occupants:
Occupant(s) Name:
Vehicle Description (Licence Plate #):
Address:
Address: Phone #: Number of Occupants:
Age:Licence #:Name of Driver:
Informant Name: Phone #:
NWT Wildlife - Vehicle Collision Report Form
Km Post:
Address:
Date:
Location of Incident (Hwy #):
Latitude / Longitude (Use GPS & fill out on scene):
Occupant Information
Occurrence #:
Officer Responding:
Phone #:
Meat Salvaged: Y /N
Method of Carcass Disposal:
Describe any Injuries to Wildlife:
Photos taken: Y / NDominant Vegetation along Roadside Right-of Way:
Photos of Vehicle Taken: Y / N
Did Animal(s) Have To Be Destroyed: Y / N Number:
Minimal Extensive Wrecked
Teeth(Middle Incisors): Y / N Ear(DNA): Y / N
Wildlife Species:
Wildlife Information
Dry Wet Icy Loose Snow Packed Snow
Raining Cloudy Clear Snowing Fog Sunny Windy Other
Other Comments:
_____ Calf _____ Yearling _____ Sub-Adult _____ Adult _____ Unknown
_____ Calf _____ Yearling _____ Sub-Adult _____ Adult _____ Unknown
Nose - Tail Length (CM):