Historical Development of U.S. Food System Development of U.S. Food... · Historical Development of...
93
Historical Development of U.S. Food System By: Ben Champion K-State Director of Sustainability Assistant Professor, Geography
Transcript of Historical Development of U.S. Food System Development of U.S. Food... · Historical Development of...

Historical Development of U.S. Food System
By: Ben Champion K-State Director of Sustainability
Assistant Professor, Geography

Environmental Geography
• Nature matters
• Current regional specialization has a lot to do with natural resources
• But not in a deterministic sense


PRISM: Parameter-elevation Regressions on Independent Slopes Model

Climate Change Prospects
• http://climatecommunication.org/#

Climate Change and Wheat
http://news.bbc.co.uk/2/hi/science/nature/6200114.stm


Great Plains
– Originally extensive grasslands
– Current leader in wheat, corn, beef, especially beef feedlots and slaughter
HISTORICAL CONTEXT OF FOOD SYSTEMS DEVELOPMENT IN U.S.

Settlement History
• Colonial settlements • Louisiana Purchase
– Used to finance federal government for decades – “Manifest Destiny”
• War with Mexico – Gold discoveries in California and other places in the West
• Homestead Act 1863 and subsequent continuations to entice further settlement, especially throughout Great Plains and western U.S.
• Largely immigrant populations of people seeking a better life – Successive waves, creating clusters of ethnicities in the geographies of
settlement depending on immigration patterns at the time of settlement for an area
– Usually not the poorest, those of some means, but not wealthy


A Distinctive History for a National Food System
• How many countries in the world were established nearly completely through immigration?
• How many nearly completely displaced the indigenous populations in order to settle anew?
• American settlement carries a subtext of terrible violence toward Native American peoples
– Many many different strategies of marginalization


Exceptional History
• American agriculture developed alongside industrial capitalism – And with important interdependence
• Different than European countries which had long histories of agriculture and land management predating industrial technologies and market mechanisms
• Recent European agricultural development has happened in tension with these traditional forms
• Those traditions for the most part do not exist in the U.S., and where they exist, the developed alongside industrial forms

SYSTEMS OF DEVELOPMENT Extensive System – the 1800’s

System of Extensive Development
• Reinforcing systems
– Policies
– Markets
– Corporate actors and NGO’s
– Technologies
– Nature
– Individuals
– Culture
• Impacts and destructive internal contradictions

Policies
• Federal lands sold for settlement
• Homestead Act
• Land grants to incentivize private infrastructure development
– especially railroads
• Marketing programs promoting settlement

Markets
• Demand from growing urban centers
– Working industrial class
• Emergence of commodity markets
– Chicago Board of Trade first
• (read Nature’s Metropolis by William Cronon for excellent history of Chicago’s role in shaping U.S. capitalism, its food system, and geographies of settlement)
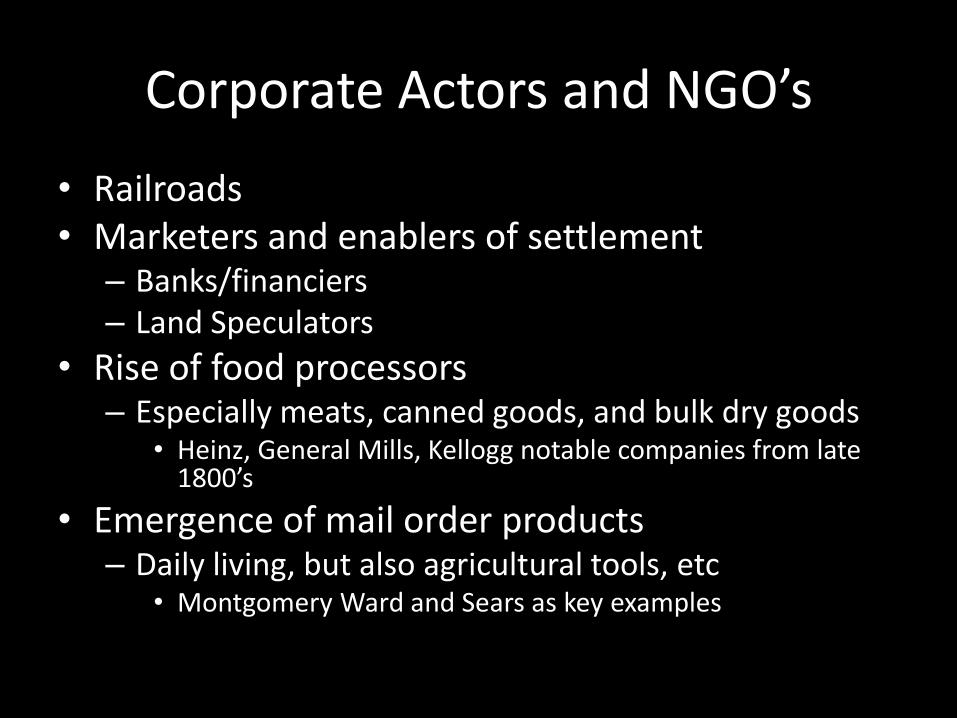
Corporate Actors and NGO’s
• Railroads • Marketers and enablers of settlement
– Banks/financiers – Land Speculators
• Rise of food processors – Especially meats, canned goods, and bulk dry goods
• Heinz, General Mills, Kellogg notable companies from late 1800’s
• Emergence of mail order products – Daily living, but also agricultural tools, etc
• Montgomery Ward and Sears as key examples

Technologies
• Railroads for transportation
– Key to development of commodity markets
– What would have happened if U.S. settlement happened 100 years earlier, before industrial development of railroad technologies?
• Limited mechanical inventions in agriculture
– Barbed wire – 1870’s
• Invention of grain elevator – Chicago mid-1800’s
• Industrial food processing in later 1800’s

Nature
• 100’s of millions of acres of natural landscapes
• Regions of excellent soil quality and favorable precipitation and temperatures
• Two major river systems with some of the largest watersheds in the world for transportation throughout U.S. Midwest/Great Plains

Individuals
• Entrepreneurial-minded immigrants seeking fresh starts and better lives – Hard workers
– Willing to brave frontier environments with few or no amenities
– Escaping cultural discrimination and oppression in many cases
• Market and land speculators – profit-oriented individualistic outlook

Culture
• “Manifest Destiny” – Faith in American progress – American dream of everyone having a chance to make
something for themselves through hard work and doing the right thing
– America’s destiny for the great American “experiment” to extend across the continent
• Belief in agrarian values and lifestyles as inherently virtuous – Jeffersonian vision of an enlightenment society
• Folk optimism – “Rain will follow the plow”

History of Economic Development
• U.S. needed economic growth initially to pay for war costs in revolutionary war – Set in motion compromises to original theories of
enlightenment society by founding leaders
– Capitalist forces from the beginning exploited this opening of an entire new geographical and political landscape
• Encouragement of settlement through cheap land for economic development and a tax base

• Industries in East
• Agricultural hinterlands to supply
• Transportation development and railroads
• Emergence of commodity markets for agricultural goods in mid-1800’s
• Emergence of food manufacturing in later 1800’s
• Drygoods grocers gave way to first supermarkets after WWII – mainly in urban areas initially
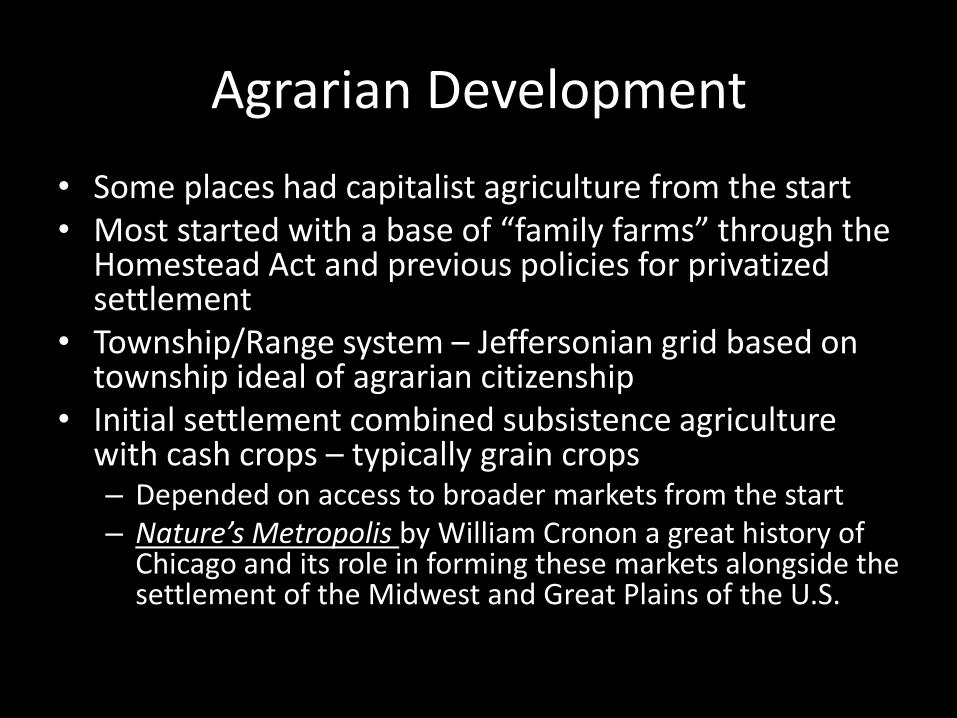
Agrarian Development
• Some places had capitalist agriculture from the start • Most started with a base of “family farms” through the
Homestead Act and previous policies for privatized settlement
• Township/Range system – Jeffersonian grid based on township ideal of agrarian citizenship
• Initial settlement combined subsistence agriculture with cash crops – typically grain crops – Depended on access to broader markets from the start – Nature’s Metropolis by William Cronon a great history of
Chicago and its role in forming these markets alongside the settlement of the Midwest and Great Plains of the U.S.

Consumer Culture
• Not well developed
• Dry good stores available for basic staple goods in most communities
• Some industrial development of canned goods and meat processing toward end of 1800’s for food preservation – mainly serving urban consumption needs,
although some frontier needs
• Early nutritional science developments

SYSTEMS OF DEVELOPMENT Intensive Development – the 20th Century

System of Intensive Development
• Reinforcing systems – Policies
– Markets
– Corporate actors and NGO’s
– Technologies
– Nature
– Individuals
– Culture
• Impacts and destructive internal contradictions – Regional specialization

Policies • Water - building dams/reservoirs and pipelines in the arid West • Land grant colleges, extension system
– Enabler of technology intensification in 20th century – Through education and outreach programs
• Financing support for farmer investments in tractors and other high capital investments
• Farm Bill – Various crop supports and subsidies in post WWII – Consumer low-income food insecurity programs
• Food stamps/SNAP, WIC • Subsidized school lunch program
• Encouragement of agricultural specialization and loss of farm population during cold war – Create larger labor pool for industrial growth, reduce food costs to enable
more discretionary spending on consumer goods to create demand for industrial consumer goods • Earl Butz – 1970’s Secretary of Agriculture in U.S. – “Get Big or Get Out”

Markets
• WWI and WWII created massive demand for commodity grains
• Boom and bust cycles in commodity prices
• Later half of 20th Century with sustained overproduction - low commodity prices
– creating extended competition among producers for efficiency gains and technology investment

Corporate Actors and NGO’s
• Financing agricultural technology investments advanced and promoted heavily
• Emergence of agricultural input industries – Pesticides, herbicides, seed technologies
• Horizontal integration of retail sector
• Horizontal integration of commodities transport, marketing, and processing
• Lobbying for government policies through industry trade groups – Farm Bureau

Technologies
• Tractors and other mechanized agriculture started first few decades of 1900’s – Continuously increasing scale and sophistication
• Refrigerated shipping containers (rail and highway) enabled cross-country and eventually global marketing and distribution systems
• Water management through massive govt. investment in dams, reservoirs, and pipelines
• Water “mining” from aquifers in Great Plains • Chemical management – pesticides, herbicides after WWII (originated
with chemical weapons testing/development); nitrogen fertilizer after WWI – Haber-Bosch process
• “Green Revolution” of hybrid seed development 1960’s-70’s • Invention of processed food products – e.g. margarine, high fructose corn
syrup, canola, synthetic flavor and color chemicals, etc. • Molecular/genetic biotechnology starting 1990’s and continuing • Fossil fuels needed for most of this

Nature
• 1930’s drought • No decade-long drought since 1930’s • Large underground water resources initially • Large initial topsoil in major grain producing regions • Plant and animal genetics amenable to heavy breeding for
specific marketable traits
• Increasing pesticide and herbicide resistance • Increasing spread of invasive species • Climate change • Soil loss • Dead zones

Individuals
• Rural populations responded quite “rationally” to lack of growth opportunities in agrarian lifestyles by moving to cities
• Farmers willingly embraced and financed technological “progress” in their systems, as well as specialization away from diversified farming
• Families embraced new consumer goods from industry when they first emerged – Convenience – Progress – “Quality”

Culture
• Post WWII faith in technological progress and American exceptionalism
• Rise of “consumer culture” and conspicuous consumption in 1950’s and 1960’s
• Rise of counter culture in 1960’s and 70’s concerned about negative externalities

20th Century Maturation of Industrial Agriculture
• Intensive Technology Development in Agriculture
– Agricultural technology developed hand-in-hand with mechanical and chemical industries
– WWI and WWII were especially important in driving technological development, and marketing to agriculture (among other sectors) became the focus at the conclusion of these wars
• Agriculture and Food Policies have encouraged intensive agricultural technology utilization

Continual Crisis
• Overproduction as a consistent feature – Due to technologically intensive production of small
number of commodities – Leads to low commodity prices in general and
punctuated by periodic price collapses – Two potential responses to overproduction: 1)
support innovation, crop diversity, and the production of high value crops; 2) “get big or get out”
– The former has been systematically repressed by agricultural education & extension, by USDA funding priorities, by US subsidy systems, and by agri-business industrial interests (input suppliers, seed companies, food processing conglomerates, and others)

Implications of Overproduction
• Cheap raw commodities – Not just cheap staples for consumers
• Subsidizes the food industry – furthering technological innovation in food processing and preservation
• Industrial use of raw commodities – Early (1920’s): Margarine, animal feed
– Middle: manufactured foods often with soybean oil and wheat gluten as a cheap protein filler and binding agent
– Later: high fructose corn syrup (early 1980’s), and now ethanol
• Efforts to expand markets through global trade

Developing Global Markets for Exports
• Green revolution – exporting our technology to encourage others to grow our types of crops and buy our companies’ seeds – Once we were all growing the same stuff, we created global markets for those
commodities where our US crops could out-compete others based on our subsidies
– This expanded markets for American agricultural commodities – Also served to create dependency in the third world on our capitalist markets
for their daily bread • Global trade as instrument of geopolitical influence in the Cold War
• US-Soviet grain deals – The Soviet Union had widespread wheat crop failures in 1972, and the US
bailed them out with a massive purchase arrangement of US wheat – Solved two temporary crises – Soviet shortage and depressed US prices – However, it laid the economic foundations for the 1980’s farm crisis – Prices for wheat and other major commodities went up, and farmers invested
in new equipment and acreage for more output. – Prices crashed again in the late 1970’s and stayed that way for a decade,
forcing a large number of farmers out of farming.

Changes in the Agriculture Sector
• Rural depopulation and farm loss – Overproduction and successive farm crises – Technology treadmill forces increasing farm size
through farm consolidation and leasing – Less labor required in agriculture, and people
leave for the cities • Regional specialization of production
– Centered on specific natural resource bases – Aided by local land use policies and subsidies – Enabled by regionalization of supply chain
infrastructure

Dust Bowl – Extreme Example
• Occupying a key transition time between extensive and intensive agricultural and food system regimes


Consumer Culture
• Urbanization of U.S. population throughout 1900’s
• Post-WWII developed a consumer culture – Supermarkets took over from small grocery stores,
alongside development of suburbs
• Nutritional science continues development – Identification of macro and micro nutrients
– Leads to food health fads emphasizing specific food properties

Intermediaries and Input Suppliers
• Food processing, distribution, and manufacturing all become big businesses
• Enabled by many technological innovations
• Efficiencies through economies of scale and substitution of technology for human labor as key drivers of consolidation

KANSAS AS A CASE STUDY Food System Evolution:

Kansas as Example
• Number of farms: – 135,000 in 1950, Avg. size 374 acres – 64,414 in 2002, Avg. size 733 acres
• Rural population – 912,000 in 1950; 767,000 in 2000
• Urban population – 993,000 in 1950; 1,920,000 in 2000
• Past agricultural productivity mix: – 1960: 4.4 M cattle, 390 K milk cows, 5.5 Ma sorghum, 594K soy, 2 Ma
corn
• Current agricultural productivity mix: – 2004: 6.7 M cattle, 110K milk cows, 3.2 Ma sorghum, 2.8 Ma soy, 3.1
Ma corn

Geographies of Agriculture in Kansas
• 2003 KASS Figures

Water and Agriculture in KS
• (Left) Extent of High Plains Aquifer in KS, (Right) KS Precipitation Gradient


Concentration in KS Agriculture (2002)
• 64,414 total farms in Kansas – 57,238 of which are family farms
– However, only 11,000 sold more than $100K in products a year – only 17,000 sold more than $50K in products • 20,444 sold less than $2,500 in products
• The vast majority of farms do not provide a living for their farmers – it’s a lifestyle choice for most family farmers that must be subsidized with other income
• 200 of the 220 farms accounting for 50% of all Kansas agricultural sales were feedlots – 8.7$ billion in total agricultural sales; $5.7 billion were cattle sales
– By contrast, there were 270 vegetable farms selling $14.3 million in product

2007 Census of Ag Statistics
• 2007 – Kansas had 65,531 farms – 50% of sales (315)
– 75% of sales (3,268)
• Sales of $14.4 Billion – $4.5B grains $8.5B cattle,
– $506M hogs $376M dairy
• Grains – – 9 million acres wheat 5M corn
– 4M soybeans 3M milo

Concentration in Livestock Farming
• 1978 – Kansas had 5,691 dairies
– today 420 dairies (65% of cows in 20 farms)
• 1978 -- Kansas 13,329 hog farms
– today 1,454 hog farms (95% of sales – 319)
• 2007 - 27,565 cattle farms
– 275 farms (50% of sales)
– 2,141 (75% of sales)

Other statistics:
• 1995-2009 – 85% of all farm payments to 20% of farms – 1/3 farms – no $’s
• 7% of Kansas’ farmers 35 and younger – 32% over the age 65 – (57 is average)
• 24,419 principal operators farm fulltime – 41,112 work off farm some amount


Food Consumption in KS
• Kansans spend $767 million yearly on produce - $32 million grown in Kansas
• Food Stamps - $450 million/303,000 Kansans
• 102 farmers markets - $27,000
• 60% adults & 1/3 children overweight/obese - $561M annual obesity cost/KHI
• 2009 CDC Report – Only 10% of Kansans have 2 fruits/ 3 vegetables daily

Expenditures on Food
• Kansans spend $985 million yearly on meats – no local meat sales $’s computed
• There are 48 custom, 42 state-inspected, 16 small/medium federal, and 5 mega-plants (Fed. Inspected)
• Total 2010 food expenditures in Kansas - $7.5 Billion (42% is outside home)
(2,918,747 Kansans X $2,577 – U.S. Bureau of Labor Statistics, 2010)


Consumption in Kansas
• Total KS $ Spent on Food in 2003 – $52.9 Billion
• Wichita – $8.2 Billion
• Topeka – $3.3 Billion
• Lawrence – $2.1 Billion
• Kansas City (KS & MO) – $40.3 Billion

FOOD
• 51% of the 675 Kansas towns have no grocery stores
• Since 2007, 82 of 213 grocery stores closed in Kansas’ communities under 2,500
• Nationally, 3,800 Wal-Marts have 25% of supermarket sales
(David Proctor – K-State Center for Engagement & Community Development)

Kansas Food Retail Locations (2007)
KansasKansasKansasKansasKansasKansasKansasKansasKansas
ManhattanManhattanManhattanManhattanManhattanManhattanManhattanManhattanManhattan
Emporia
SalinaSalinaSalinaSalinaSalinaSalinaSalinaSalinaSalina
WichitaWichitaWichitaWichitaWichitaWichitaWichitaWichitaWichita
LawrenceLawrenceLawrenceLawrenceLawrenceLawrenceLawrenceLawrenceLawrence
Ottawa
TopekaTopekaTopekaTopekaTopekaTopekaTopekaTopekaTopeka
Bronson
Kansas CityKansas CityKansas CityKansas CityKansas CityKansas CityKansas CityKansas CityKansas City
St. JosephSt. JosephSt. JosephSt. JosephSt. JosephSt. JosephSt. JosephSt. JosephSt. Joseph
ColoradoColoradoColoradoColoradoColoradoColoradoColoradoColoradoColorado
OklahomaOklahomaOklahomaOklahomaOklahomaOklahomaOklahomaOklahomaOklahoma
Rich Hill
Nevada
Joplin
No active Legend.


Status of Fruits and Vegetables
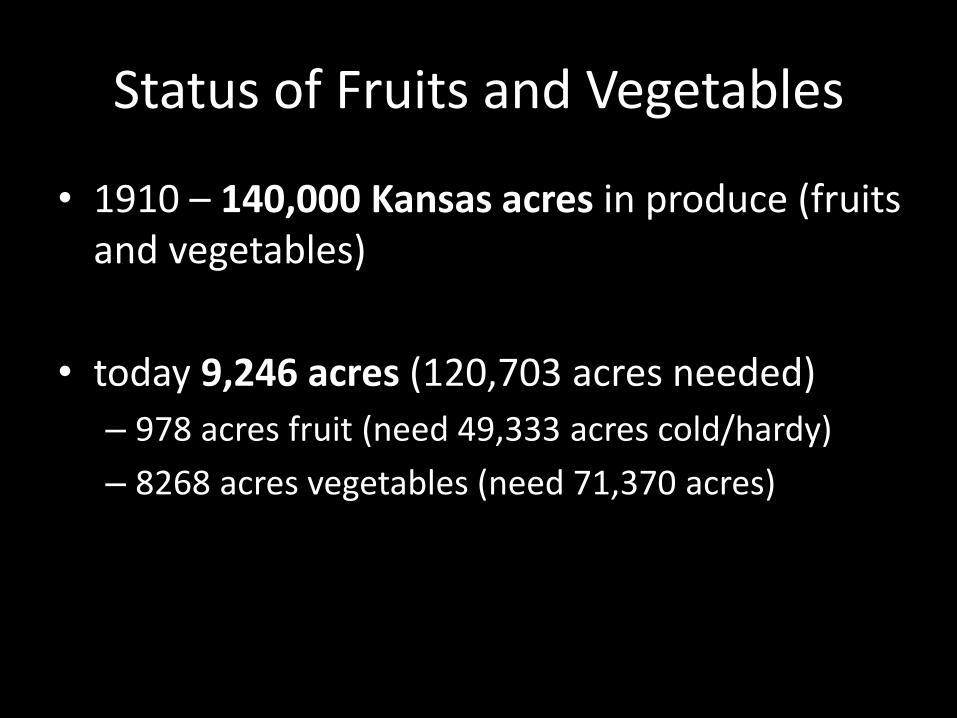
• 1910 – 140,000 Kansas acres in produce (fruits and vegetables)
• today 9,246 acres (120,703 acres needed)
– 978 acres fruit (need 49,333 acres cold/hardy)
– 8268 acres vegetables (need 71,370 acres)


0
20
40
60
80
100
120
<$10
00
1000
-250
0
2500
-500
0
5000
-10,00
0
10,000
-25,
000
25,000
-50,
000
50,000
-100
,000
100,00
0-25
0,00
0
250,00
0-50
0,00
0
500,00
0-1,
000,
000
$>1,
000,
000
Fruit Farms #
Veg Farms #
2007 Fruit and Vegetable Growers in Kansas by Economic Return/size

Temperate
Fruit Crop
Total per
capita fw
lb/year
lb needed in
KS/year
Acres
needed in
KS
Acres in
KS 2007
Days of
Fruit
2007
Apples 50.8 141,020,648 11752 333 10
Grapes 19.1 53,021,543 8837 299 12
Peaches 9.5 26,371,972 5274 213 15
Strawberry 7 19,431,979 2429 15 2
Pears 5.6 15,545,583 1413 32 8
Nectarines 3 8,327,991 1666 12 3
Plums 2.5 6,939,993 1157 11 3
Cherry 1.9 5,274,394 2637 25 3
Apricots 0.9 2,498,397 357 8 8
Blueberries 0.8 2,220,798 370 4 4
Raspberry 0.2 555,199 278 5 7
Blackberries 0.1 277,600 56 15 99
Other berries 0.1 277,600 93 4 16
Persimmon 0.05(?) 138,800 69 2 11

Days of Fruit 2007
0
20
40
60
80
100
120
App
les
Grape
s
Pea
ches
Straw
berry
Pea
rs
Nectarines
Plums
Cherry
Apricots
Blueb
erries
Raspberry
Blackbe
rries
Other berries
Persimmon
36.5 days = 10%
73 days = 20%

Days of Veg 2007
0
50
100
150
200
250
300
350
potatoes-Irish
tomatoes
sweet corn
waterm
elon
lettu
ce
carrots
cucumber
cantelope
broccoli
bean-snap
pepper-bell
pepper-hot
pumpkins
squash
potato-sweet
36.5 days = 10%
73 days = 20%

Question: what about growing tomatoes in greenhouses in the winter?
• Kansas has approx. 46 greenhouses producing tomatoes (2007 census of ag)
• Using typical yield values, they produce about 654,340 lb per year of tomatoes.
• To meet the 258 million lb “tomato gap” in KS field production, we would need an additional 17,893 more greenhouses!

Vegetable
Per capita
consumpt
ion lb/year
lb needed
in KS/year
Acres
needed in
KS
Acres
in KS
2007
Days of
Veg
2007
spinach 3 8,327,991 757.090091 5 2
garlic 2.4 6,662,393 1332.47856 5 1
asparagus 1.5 4,163,996 1665.5982 76 17
eggplant 0.9 2,498,397 499.67946 7 5
beets 0.7 1,943,198 161.933158 8 18
beans lima 0.5 1,387,999 231.333083 1 2
chinese cabbage 0.5 1,387,999 69.399925 2 11
cauliflower 0.5 1,387,999 126.181682 1 3
collards 0.5 1,387,999 126.181682 1 3
kale 0.5 1,387,999 126.181682 1 3
mustard & turnip gr 0.5 1,387,999 126.181682 11 32
okra 0.5 1,387,999 346.999625 12 13
onion green 0.5 1,387,999 126.181682 3 9
peas 0.5 1,387,999 231.333083 8 13
radish 0.5 1,387,999 115.666542 8 25
rhubarb 0.5 1,387,999 462.666167 12 9
turnip/rutabaga 0.5 1,387,999 115.666542 17 54

Days of Veg 2007
0
10
20
30
40
50
60
spinac
h
garlic
aspa
ragu
s
eggp
lant
beets
bean
s lim
a
chines
e cabba
ge
cauliflower
collards
kale
mus
tard & turnip gr
okra
onion gree
n
peas
radish
rhub
arb
turnip/rutaba
ga
36.5 days = 10%


Gap of $735 million for Kansas per year –
a possible goal for the future?
Overall Patterns • Vast bounty of food through amazing advances in technology,
industrial organization, and supply chain management • Appearance of a great diversity (roughly 40,000 different
marketed products in the avg. supermarket) • High degree of concentration in intermediaries and input
suppliers • Lack of consumer transparency about food production
methods and social organization of the food system • Food deserts on the rise – rural and inner city areas
– What is available is highly processed and often low nutritional content
• Agricultural product diversity and farming system diversity has vastly reduced
• Agriculture is increasingly contract-oriented, locking farmers into specific supply chain marketing channels instead of broader commodity markets – Especially livestock/meats, but increasingly grains as well

Implications
• Serious environmental and social side-effects (externalities) of production
• Serious health effects of consumption
• Serious inequalities of access to healthy foods

Health Implications
• Rise of food allergies – Fractionated foods present bodies with massive doses of simplified
ingredients – Pesticide and antibiotic residues present bodies with foreign matter that it can
view as a threat – Bodies respond by developing immune responses – we’re becoming allergic to
food
• Obesity and Diabetes – High proportion of oils and starches from fractionated foods – Little fiber to impede uptake – The body has no choice but to store the energy-rich sugars – a challenge for
metabolic processes (esp. insulin regulators)
• GMO’s – We have to wonder how our bodies will respond to new forms of food without
precedent through genetic modification – Does this have the potential to generate widespread food allergies?

Geographies of Land Use, Labor, and Consumption
• Depopulation of rural areas due to technological substitution for human labor wherever possible
• The amazing productivity of industrial agriculture has enabled and driven this demographic shift – Few economic opportunities in rural America due to systematic
overproduction and depression of farm returns on investment – Yet, high productivity means cheap foods, especially as technology is
leveraged to consolidate processing, manufacturing, and transport/distribution of foods
– Centralization of consumption in cities drives these gains further
• Urbanization has led to a population of consumers without much connection to processes of food production
• Agrarian living is devalued and structurally disadvantaged at the societal level. Preference is given to industrial and urban concentrations of population, capital, and development, and the cultures of business and consumption that go along with them.
• This is a profound dialectic between consumer culture, land/resource use, labor pools, and food system structure

Societal Implications • It’s a food system!
– It is a set of industrial relationships with a long history of punctuated development • Crises of overproduction have led to great technological innovations, but also to a focus on
relatively few commodities • A very large portion of family farms have ceased to be primary agents of productivity in the food
system • Rural depopulation and a greater rural/urban social divide has resulted
– In some ways, many positive benefits • Frees population for non-agricultural pursuits, wide availability and abundance of food, excellent
food choice within certain parameters
– Also problems • Agrarian lifestyles must be subsidized through off-farm employment, health concerns related to
changes in diets, resource intensive/dependent production and supply chains, environmental ills from industrial agriculture, increased separation between production and consumption
– The existing food system is defended by allies at each stage of the supply chain – input/technology industries, large-scale and corporate farms, food processors & wholesalers, food retailers & restaurant industries.
– Trying to address problems at any one point induces responses from other members of the system, no matter how scientific or rational the approach
• And the food system is tied to broader societal and capitalist systems dynamics

Good Additional Reading
• Willard Cochrane (1993) The Development of American Agriculture: A Historical Analysis University of Minnesota Press – THE classic text reviewing the overall evolution of American agriculture – I have borrowed heavily from this
book’s organization in the historical overview lecture
• Richard Walker (2004) The Conquest of Bread: 150 Years of Agribusiness in California. The New
Press – Excellent history of agricultural development in California
• William Cronon (1992) Nature’s Metropolis: Chicago and the Great West W.W. Norton
– History of Chicago’s rise as a great American city, including its role in development of agricultural markets and linking the great American breadbasket with global markets
• Harvey Levenstein – two volume set chronicling the historical development of U.S. culinary
traditions, diet, and food fads, including the science of nutrition and food quality Revolution at the Table (2003 revised edition) University of California Press Paradox of Plenty (2003 revised edition) University of California Press

To Be Continued…
• We will revisit systems thinking directly later in the course
• And we will be reminded of systems relationships as we go along