Historical climatology, 1950-2006 - OpenEdition
37
Belgeo Revue belge de géographie 3 | 2006 Geoarcheology, historical geography and paleoecology Historical climatology, 1950-2006 An overview of a developing science with a focus on the Low Countries Évolution de la climatologie historique de 1950 à 2006 en Europe avec zoom sur les Pays-Bas Adriaan M.J. de Kraker Electronic version URL: http://journals.openedition.org/belgeo/12073 DOI: 10.4000/belgeo.12073 ISSN: 2294-9135 Publisher: National Committee of Geography of Belgium, Société Royale Belge de Géographie Printed version Date of publication: 30 September 2006 Number of pages: 307-338 ISSN: 1377-2368 Electronic reference Adriaan M.J. de Kraker, « Historical climatology, 1950-2006 », Belgeo [Online], 3 | 2006, Online since 30 October 2013, connection on 02 May 2019. URL : http://journals.openedition.org/belgeo/12073 ; DOI : 10.4000/belgeo.12073 This text was automatically generated on 2 May 2019. Belgeo est mis à disposition selon les termes de la licence Creative Commons Attribution 4.0 International.
Transcript of Historical climatology, 1950-2006 - OpenEdition

BelgeoRevue belge de géographie
3 | 2006Geoarcheology, historical geography and paleoecology
Historical climatology, 1950-2006An overview of a developing science with a focus on the Low Countries
Évolution de la climatologie historique de 1950 à 2006 en Europe avec zoom sur
les Pays-Bas
Adriaan M.J. de Kraker
Electronic versionURL: http://journals.openedition.org/belgeo/12073DOI: 10.4000/belgeo.12073ISSN: 2294-9135
Publisher:National Committee of Geography of Belgium, Société Royale Belge de Géographie
Printed versionDate of publication: 30 September 2006Number of pages: 307-338ISSN: 1377-2368
Electronic referenceAdriaan M.J. de Kraker, « Historical climatology, 1950-2006 », Belgeo [Online], 3 | 2006, Online since 30October 2013, connection on 02 May 2019. URL : http://journals.openedition.org/belgeo/12073 ; DOI :10.4000/belgeo.12073
This text was automatically generated on 2 May 2019.
Belgeo est mis à disposition selon les termes de la licence Creative Commons Attribution 4.0International.

Historical climatology, 1950-2006An overview of a developing science with a focus on the Low Countries
Évolution de la climatologie historique de 1950 à 2006 en Europe avec zoom sur
les Pays-Bas
Adriaan M.J. de Kraker
Introduction
1 Traditionally, climate research has been considered the domain of the natural sciences,
such as meteorology, palaeo-climatology and geology. Climate change was considered to
be restricted to particular geological periods. For instance, the alternation of cold glacials
and warm interglacials was considered to be characteristic for mainly the Pleistocene,
while the present Holocene period was looked at as a short and mainly warm period.
Although weather variability and the impact of weather conditions on human events
were well recognised, the historical period (AD) was generally considered to have a stable
climate similar to that of the 1950s and 1960s.
2 During the recent five decades continuing research has changed this view profoundly.
Thanks to systematic palaeo-climatological research in Northwestern-Europe in general
and large scale soil mapping in the Belgian and Dutch coastal areas in particular there
now is a better understanding of how climate developed since the end of the last glacial
period. We also know now much more details about the connection between general sea
level rise and the formation of particular soil types in coastal regions and its hinterland.
Moreover research on tree rings, ice cores, sediments, solar radiation and volcanic
eruptions, has also resulted in a more accurate signal of climate variability during the
recent millennia.
3 Yet historical climatology has also contributed to a better understanding of climate
variability during the last millennium. Because it has its origin in the social sciences, this
article will show how historical climatology has evolved from history, historical
geography and historical ecology into a field of research of its own. First will be shown
how important historical climatology has become by giving an overview of how it has
Historical climatology, 1950-2006
Belgeo, 3 | 2006
1
spread amongst European universities and climate research centres. Although historical
records are the main source of information used by historical climatologists, only specific
information about weather conditions is useful. Therefore the major categories of climate
related written sources will be discussed. Because most of the information is prior to the
mid-18th century instrumental observations and therefore of a qualitative nature, it needs
to be transferred into quantitative data. Historical climatologists have therefore
developed a special methodology that enables them to reconstruct temperature, air
pressure, rainfall and wind force of the past. This methodology will be discussed briefly
and then mention will be made of the main results achieved by historical climatologists
so far by focusing on various examples of climate reconstruction, weather extremes and
their impact on society. Finally, it will be shown how historical climatology in the Low
Countries can contribute to a higher spatial and temporal resolution climate
reconstruction and therefore a better understanding of climatic change, climate extremes
and their prediction for the near future.
Background: terminology and evolution of historicalclimatology
Terminology
4 The history of climate can be studied by using data from the natural environment, such as
ice cores, tree rings, varves and lake sediments. This data provides information related to
periods of variable duration. Information of a more recent history of climate is provided
by instrumental measurements and by data that is provided by historical documents.
Consequently, the term “historical evidence” was introduced by the meteorologist Lamb
(1977) suggesting the use of only written documents. However, looking at the present
methods used by historical climatologists, it seems better to define historical climatology
in terms of reconstructing climate and weather extremes and their impact by primarily
using written documents in combination with instrumental weather data. Results must
also be compared to all additional information on climate variability during a particular
period provided by proxy data obtained by research of tree rings, sediments, ice cores,
etc. (Jones and Mann, 2004).
5 This in fact primarily puts historical climatology in the field of history and historical
geography in close co-operation with other disciplines of climate research. At the same
time it places historical climatology within a European context, because of its long
tradition of keeping records.
6 Historical climatologists use specific terms relating to certain periods. Within the Late
Holocene period (2,000 years), several warmer and colder periods have been
distinguished. The Medieval Warm Epoch (MWE) is an example of the former while the
Little Ice Age (LIA) is perhaps the best known example of the latter. The Late Maunder
Minimum (LMM) is also distinguished as a specific period within the LIA. There is also a
temporal distinction based on the kind of data used. The instrumental period is divided
into an Early Instrumental Period (EIP, mid-18th – mid-19th century) and a Recent Instru ‐mental Period (RIP, mid 19th century until the present day).
Historical climatology, 1950-2006
Belgeo, 3 | 2006
2

Historical evolution
7 Interest for climate started well before the Second World War. Although some very old
and systematically kept weather observations are known from 14th century England
(Mortimer, 1981; Buisman, 1995), on the European continent some scientists started
recording daily weather conditions as early as the 16th century. In the German Lands
perhaps, Tycho Brahe (Lenke, 1968) Kilian Leib and Wolgang Haller (Schwarz-Zanetti et al.
, 1992; Pfister, 1999b) have left the most famous weather diaries of their time. In the
Netherlands Johan Fabricius and Isaac Beeckman are of interest (Lenke, 1968; 1939-1953;
Buisman, 1995). Fabricius who lived in Frisia, kept a weather diary from 1590 to 1612;
Beeckman, who lived partly in Zierikzee, Utrecht, Dordrecht and Rotterdam, kept a diary
of which only the period November 1612 to March 1615 has survived. Beeckman was not
content with just recording meteorological phenomena, he also wanted to understand the
mechanisms behind them. He argued that the only method to understand the natural
mechanisms of the environment was by measuring all aspects of daily weather, such as
rain, wind, temperature and pressure. Because no useful thermometers existed at the
time, he used a kind of wording system (see below) to assess temperature. Unfortunately,
Beeckman never succeeded in studying his weather data the way he meant them to be
used.
8 During the 17th and following centuries systematic recording of weather conditions
evolved from a mainly descriptive method into measurements of temperature, wind
direction and wind force and pressure (Geurts et al., 1983, 1985 and 1992; Kington, 1997;
Brázdil et al., 2002). Although at that time none of the early instrumental data was
analysed in any detail, it did not result in the founding of national meteorological
institutes (e.g. De Bilt and Ukkel).
9 It was not until the 20th century that scientists became interested in the climate of the
recent past. Although Easton’s (1928) book on historic winters was already published in
the Netherlands, a wider interest in climate history began to sprout in England (Britton,
1937), Germany and France as well. The most important centres that have contributed to
the development of historical climatology are mentioned in the following paragraph.
The Netherlands and Belgium
10 As far as The Netherlands and Belgium are concerned, the geological and soil mapping of
the coastal region that started just after the end of the Second World War and the 1953
storm surge, stimulated climate research which focused on the Holocene. From this the
concept of transgressions and regressions (Tavenier, 1948; Ervynck et al., 1999) was
initiated and an inventory on historic storm surges (Gottschalk, 1971-1977) was
published. Having a wider time scope, palaeoclimate research carried out by Verbruggen
(Verbruggen et al., 1991) needs to be mentioned that helped to lay a foundation for similar
further research. Next to this storm surge research, reconstruction of winters started in
the 1970s (De Vries, 1977) and 1980s (Buisman, 1984). This resulted in a very detailed
inventory of historical weather data compiled by Buisman and Van Engelen (Buisman et
al., 1995-2006). While the storm surge research concentrated at the universities of
Amsterdam and Ghent during the 1960s and 1970s, the broader reconstruction of weather
of the past concentrated mainly at the Koninklijk Nederlands Meteorologisch Instituut
(K.N.M.I., De Bilt) during the 1990s. The Koninklijk Meteorologisch Instituut (K.M.I.) in
Historical climatology, 1950-2006
Belgeo, 3 | 2006
3

Ukkel is also doing similar research on the history of climate (Demarée, 1990, 1993, 1999;
Demarée et al., 2000, 2001).
Great Britain
11 In Great Britain the development of historical climatology owes a great deal to the
pioneering work of Hubert Lamb. He used to work at the British Meteorological Office,
but in 1979 he started the Climate Research Unit of the University of East Anglia in
Norwich. Besides the simple methodologies developed by him, he also initiated the
interdisciplinary and multidisciplinary research into recent climate variability (Lamb,
1961, 1965) by including history. Next to Lamb, Gordon Manley focused on the
reconstruction and variability of rainfall and temperatures of the past (Manley, 1952,
1974). While a lot of the early historical climatologists stuck to the study of written
sources, such as Wigley, Kington (1975a, 1975b, 1980, 1997) Ogilvie (Bell et al., 1978; Jones
et al., 2001) soon the Climate Research Unit would be dominated by specialists in the
reconstruction of natural climate forcing (tree rings, solar activity) early instrumental
measurements and by climate modelers. On the other hand the new generation of
researchers of climate history focused on many more fields of climate history and
developed a global perspective, which proved to be very valuable during the 1990s.
France
12 During the 1950s and 1960s the French Annales historians were eagerly seeking all kinds
of processes (trends) that were determining the economic and social development of past
and present societies. In order to assess the impact of these underlying processes,
everyone who wanted to be taken serious as a social scientist started to compile long
series of prices and wages. In particular Braudel (1958) set the tone by distinguishing
three trends: the “longue durée”, shorter trends and the events, which he considered to
be mere passing inconveniences of a political and military nature. His paper did not only
add to the search for and compilation of long time series, it also stimulated the “histoire
de mentalité” and it focused the attention of some historians on climate again.
13 In France historical climatology became closely connected to mainly one pioneer: the
historian Emmanuel Le Roy Ladurie. Except for his contribution to methodology (Le Roy
Ladurie, 1959; Le Roy Ladurie et al., 1980) he also published one of the first books on the
reconstruction of climate of the past millennium (Le Roy Ladurie, 1967). Although a
second major contribution to the reconstruction of climate during the Middle Ages was
made by Alexandre (1987) and a third by De Vries (1977), it was not the “Institut des
Sciences Humaines” in Paris that would develop into a kind of climate research unit.
Germany
14 In Germany the meteorologist Hermann Flohn, the third pioneer of historical
climatology, published a paper about 16th century weather conditions in Zürich in 1949.
In following papers he also noted the variability of climate, in particular during the
Middle Ages (Flohn, 1949, 1950, 1958, 1967). It would be until the 1990s before another
major step forward could be made. In several papers and related publications Glaser
(1991, 1996; Glaser et al., 1990, 1991, 1999) set out to study the period prior to
Historical climatology, 1950-2006
Belgeo, 3 | 2006
4

instrumental measurements by using records on harvesting, as well as some climate
impact studies carrying out (Glaser, 1998; Glaser et al., 1990; Jacubowski-Tiessen, 1992).
Switzerland
15 During the 1970s the centre of historical climatology on the European continent slowly
shifted from France to Switzerland, in particular to the Bern University, where the
climate department was directed by Christian Pfister. As early as 1975 this outstanding
researcher published a major work on the relationship between agriculture and weather,
which was followed by a number of papers (Pfister, 1975, 1977, 1981, 1986) and finally his
extended study on the Swiss climate from c. 1525 onwards (Pfister, 1988). Swiss historical
climatology focuses on the research of documentary evidence from the pre-instrumental
period that provides data on plant growth, agricultural production and alike. Apart from
a special method that has been developed to quantify these data, also a database
(CLIMHIST) (Pfister, 1985) has been set up for collecting weather data from all over
Europe. Thus a European network of historical climatologists was created.
Czech Republic and Eastern Europe
16 In the Czech Republic the most outstanding research is directed by Brázdil. Similar to
other countries, Czech historical climatology aims at publishing relevant weather diaries
and investigating data on weather extremes, such as extreme rainfall and its impact and
historic storms and their impact (Brázdil, 1992, 1996; Brázdil et al., 1999, 2000, 2001).
Meanwhile, in co-operation with Pfister a methodology has been developed to process
qualitative data into quantitative data (see below).
17 In Poland and Hungary historical climatology concentrates around a few universities,
such as the Jagiellonian University of Cracow (Glaser et al., 1999; Bokwa et al., 2001) and
the Hungarian Academy of Sciences (Glaser et al., 1999). Of course, much additional
research on the recent history of climate is carried out in various countries, but many
results are published in national journals and in the native language and thus hard to
obtain and read for foreign researchers.
Scandinavia
18 In Sweden research was carried out on an individual basis. The astronomer Maunder, for
instance, showed that the second half of the seventeenth century was characterised by a
decreasing solar activity. This period (1645-1715) has become known as the Maunder
Minimum. His fellow country man Utterström (1955) noted a series of very mild winters
between 1721 and 1735. Recent research focuses the oldest instrumental data (Barring,
2000).
19 In Norway historical climatology focuses on the changes in land use in mountainous
regions and the relation with climatic change (Nordli, 2001; Nordli et al., 2003).
Italy and Spain
20 In Italy the research carried out by Camuffo warrants a mention. Focusing on Northern
Italy he studied climate extremes, such as storm surges and winter severity around
Venice (Camuffo, 1987, 1993). He also tried to reconstruct climate during historic periods
Historical climatology, 1950-2006
Belgeo, 3 | 2006
5
(Camuffo et al., 1992; Glaser et al., 1999). In Spain much of the research has focused on
annual rainfall (Rodrigo et al., 1994) and flooding events (Barriendos et al., 1998).
Historical climatology and its weather data
Introduction
21 In order to reconstruct temperatures, rainfall, air pressure, wind direction and wind force
during the pre-instrumental period, weather extremes and their impact, historical
climatology is looking for information about weather conditions of the past obtained
from the study of written sources. Fortunately historical climatologists are able to extract
direct and indirect information from specials kinds of written sources, so that they can
reconstruct rainfall, air pressure, wind force and temperature. The specific climate
information provided by these written sources is also very important for comparison
with similar climate signals obtained from the climate research on tree rings, ice cores
and varves. Although the written sources can hardly be discussed separately from the
method that is used to process them, first the written sources that have a high potential
for climate research will be discussed.
Kinds of written (climate) sources
Wind
22 Wind force plays a vital role in pre-industrial times, providing energy for ships to sail and
wind mills to grind grain, press oil and saw wood. When the recording of wind, its force
and direction has begun remains unknown, but as soon as this became of a high economic
interest, records began to provide some information. First it was only information on
extreme events, such as devastating storms causing mills to collapse and ships to sink.
During the 16th century ships logs were kept on ships that went to overseas areas (Oliver
et al., 1970; Wheeler, 1988; De Kraker, 2000a: Wheeler, 2005). The motivation to keep these
logs was manifold. Logs were kept for eventually recording the safest and fastest route to
the overseas European colonies. Logs were also kept for military reasons, while in the
Dutch Republic ships sailing to the East Indies were even ordered to keep ships logs.
23 Logs are the most important source for wind force and wind direction. These
characteristics were observed on a daily basis, sometimes to four times a day. Wind
direction was recorded by using a compass of 32 wind directions (fig. 1). Wind force was
characterised in a standard vocabulary. This wording system consisted of hundreds of
words and expressions to characterise what kind of wind was blowing and at what speed.
Although sailors from different European countries each had their own language, the
kind of words and expressions used were rather similar. This wording system slowly
evolved into the Beaufort scale. Sailors used to record all kinds of other weather
conditions in their logs as well, such as cloud cover and rainfall. There can be no doubt
about the high quality of ships logs for the reconstruction of weather conditions. It
should be noted that because most of the time ships are on the move, weather conditions
cannot be so easily reconstructed for a particular area over a longer period. However,
some logs even have recorded weather conditions while ships were anchored for a long
time.
Historical climatology, 1950-2006
Belgeo, 3 | 2006
6

Figure 1. Part of a ships log kept by Philips Grimmaert on the ship Zeelandia, June 1599.
National Archives, The Hague, East India Company, no. 54
24 Records and accounts kept of wind mills also provide some information on wind direction
and wind force in particular. The oldest records date from the 14th and 15th centuries and
deal with the letting out to lease and maintenance of wind mills. Repairs to wind mills
were mostly carried out after severe storms or thunder storms. In such cases only
weather extremes have been observed. In general millers had thorough knowledge of
wind, storms and how thunder storms could arise on the horizon and how these could
affect a windmill. So in Holland some millers kept records of daily winds as early as the 17th century. The way they characterized winds is somewhat similar to that of the ships
logs. Mills were also situated on canals and lakes in order to drain recently reclaimed
polder areas, and therefore sluice masters began to record wind directions on a daily
basis, for instance at Bilderdam, Amsterdam and places in the vicinity (fig. 2).
Historical climatology, 1950-2006
Belgeo, 3 | 2006
7

Figure 2. Wind observation at Bilderdam, 1-10 September 1707.
Oudarchief Rijnland, 975a
25 Accounts of dike maintenance and upkeep of dunes also provide information on wind,
although mostly extreme storm events were recorded because they caused damage
requiring repairs (De Kraker, 1997). Similar information can be provided by accounts of
maintenance of high towers of city halls, churches and castles. Even accounts of large
domains, such as forests, may provide information of storminess. Each severe storm
causes extra work for labourers to clean up the forest and restart planting young trees
after major thunderstorms.
Temperature
26 It was not until the 17th century that thermometers were introduced. In the Dutch
Republic these instruments were first seen during the 1620s. Some scientists began to use
thermometers. Because different instruments were used in different places, most of these
recorded temperatures, if even preserved, are inaccurate. Although temperature
observations began to improve during the 18th and 19 th centuries, most of these early
instrumental (EIP) measurements remain to be homogenized.
27 So for the pre-instrumental period other written sources need to be used to reconstruct
temperature. If a distinction is made between winter, spring, summer and autumn
temperatures, one can look at all kinds of mainly economic activity characteristic for one
of the four seasons or strongly affected by changing in temperature. This knowledge
provides two major categories of written evidence.
28 The first category contains accounts on shipping, ranging from toll accounts to accounts
of leasing out of barges, passing and repairs of locks and bridges. Because canals and
rivers formed the most important transportation routes during the pre-industrial period,
any kind of interruption was harmful to the economy, resulting in a loss of income on
tolls, on leasing out of barges and on dues paid at bridges and locks. Long-lasting
interruption could even lead to social unrest in large cities, due to the lack of supplies of
food and fuel. Consequently all revenues were administered very accurately, often on a
daily basis and also all events that meant a loss of income. Among these events, warfare
Historical climatology, 1950-2006
Belgeo, 3 | 2006
8

was one thing, repairs on canals were another. The most important cause of shipping to
be interrupted, however, was ice coverage of canals or rivers. So most accounts record
the beginning and ending of these periods and often provide additional information on
the severity of the frosty period as well (fig. 3). Similarly accounts of water mills may also
provide such information.
Figure 3. Interruption of shipping caused by frosty weather, January 1694.
Municipal Archives Furnes, NG, no. 528
29 The second major category of written sources has an agricultural background. Most
domain accounts register crop production and how arable land and pastures were let out
to lease. Specific information for climate reconstruction is provided by the time of
harvest or other events related to harvesting and the production of crops.
30 Some of these accounts also record weather that completely destroyed crops. For
instance long lasting frosty weather destroyed the Brassica napus crop, while a long rainy
period could destroy the grain harvest. Generally cold and dry weather conditions have a
negative impact, while warmer weather with variable periods of rain may have a positive
impact on crop production. Milder weather may stimulate an early harvest. After a long
hot summer grape harvest may begin in the middle of September. Colder weather
generally causes a later harvesting, consequently grape harvesting sometimes started
during the second week of October.
31 In fact milder weather conditions in winter and in spring may stimulate an early
blossoming of trees, such as the cherry tree. Sometimes time series of such phenological
data may go back more than a thousand years.
32 A particular kind of account records the letting out to lease of tithes. Tithes are a 10%
taxation on every tenth sheaf or newly born farm animals. Usually putting out to lease
Historical climatology, 1950-2006
Belgeo, 3 | 2006
9

occurred on a fixed date prior to the harvesting. If harvesting occurred early, then
putting out to lease the tithes also occurred early, if harvesting occurred late, then this
also occurred late (fig. 4). In fact the annual date of putting out to lease the tithes
correlates very well with the annual date of the beginning of the harvest and is therefore
an excellent proxy. Moreover tithes occurred in every part of Christian Europe and were
abolished as late as the French Revolution while in some countries tithes occurred even
as late as the middle of the 19th century, resulting in a long overlap with the instrumental
records.
Figure 4. Tithe leasing at Koekelare-Ichtegem, 8th July 1749.
National Archives Bruges, “Bisdom”, Nieuw Kerkarchief, no. 316
Precipitation and general weather information
33 Finally old chronicles, diaries and travel journals should be mentioned as important
sources of weather information. Most of these written sources often have a negative
perception of weather events. So weather extremes such as severe storm surges that
caused large scale flooding were recorded and “explained”. Long severe droughts or long
frosty periods, that often led to scarcity and therefore famine and consequently an
increase in mortality, were noticed by chroniclers. Extreme rainfall causing river flooding
and thunder storms with large hailstones destroying crops were also mentioned. In fact
the larger part of the information on weather events is an inventory of extreme weather
events. It should be noted that as soon as chroniclers started to record weather events
from far away areas or from much earlier periods, their information starts to become
unreliable.
34 There are few specific written sources on rainfall which usually occurs very locally.
Generally weather diaries contain information on rain fall (Manley, 1952; Manley, 1974).
Historical climatology, 1950-2006
Belgeo, 3 | 2006
10

Also accounts of crop production and accounts related to the transportation on rivers
may provide information on rainfall. Most written sources providing information on
rainfall, mention extreme rainfall events and periods of extreme droughts. In cases where
river flooding caused by extreme rainfall has a negative affect on cities, city accounts may
also provide important rainfall information (Barriendos et al., 1998; Brázdil et al., 1999).
35 Most of the written records discussed so far are continuous until the end of the 18th
century. Putting out to lease tithes and barges on canals even continued well into the 19th
century. At the same time the early instrumental weather records began to appear (EIP).
These are mostly not counted among the traditional written records, because they
contain rows of figures which are the result of daily measuring temperature, wind (force
and directions) rain fall and air pressure. During the 18th and the larger part of the 19th
century these results have never been used to gain a thorough knowledge of the weather
system or climate. Moreover most of the instruments used at that time were not very
accurate for one thing and for another, very different kinds of instruments were being
used. Still, these instrumental series of temperatures, rainfall and air pressure are the
only ones that co-existed with the proxy data obtained for the written sources for more
than a century. Therefore these early instrument series play a crucial part in, for
instance, processing the proxies into series of temperatures.
Methodology
36 Research of written records prior to the instrumental measurements provides mainly
indirect weather observations, in fact mostly with the consequences of particular weather
conditions. In order to transfer this qualitative information or proxy data into
quantitative data, historical climatology has developed a methodology of its own. This
method aims at extending the times series of, for instance temperatures provided by the
instrumental measurements, as far back into time as the earliest time series of proxy data
start. This can only be successful if both the instrumental measurements and the proxy
data have a long overlapping period, if the qualitative data can be directly transferred
into hard quantitative data or if the proxies can calibrated with similar climate signals
provided by other disciplines of climate research.
37 Research of high potential climate related written sources begins with a critical analysis
of the written sources. Looking at the beginning years of historical climatology, most of
the research was carried out by meteorologists who were only interest in historical data.
Unfortunately most of their studies seriously lacked the critical analysis of the written
sources used (Easton, 1928; Weikinn, 1958; Vanderlinden, 1924). This had consequences
for the reliability of their compiled time series and the way these were used. On the other
hand most historians and historical geographers, using the critical historical analysis of
the written sources did not know how to compile their time series into quantitative data
(Gottschalk, 1971-1977; Alexandre, 1987). This remained a problem until far into the 1990s
and was one of the major causes why natural scientists had little faith in the outcome of
reconstructions made by historical climatologists. Despite the fact that historical
climatology started to develop its own methods, scepticism from natural scientists
continued throughout the 1990s (Pfister et al., 1999a).
Historical climatology, 1950-2006
Belgeo, 3 | 2006
11

Historical analysis
38 Le Roy Ladurie (1959) showed that high quality written sources had to comply with three
criteria. The first criterion was that written records need to be annual, providing a
similar climate signal for every year of the period under consideration. The second
criterion was that written series of records need to be long and continuous, showing no
serious gaps. At least time series need to be continuous for several decades in order to
calculate a five to eleven years average. The third criterion was that written sources need
to be homogenous and uniform. This implies that climate signals recorded in the
documents need to have been observed in the same area and under the same conditions.
It also implies that for instance crop production needs to be administered in the same
way, yields are about the same species and agriculture techniques need to remain
somehow unchanged.
39 If these three criteria are applied to written sources, this results in a selection of only
specific records providing very special types of proxy data. This critical and very selective
part of the methodology used by historical climatologists is rather similar to that used by
tree ring specialists (fig. 5). Only trees of the same species, grown under roughly the same
environmental conditions, including soil and climate conditions, the same latitude and
altitude qualify for reconstructing long time series of proxies.
Figure 5. Diagram of methodology used to process proxy data into hard climate data.
Indices and verification (data control)
40 High quality written sources provide a climate signal or proxy data, which can be
expressed as, for instance annual indices; temperature indices (TI) and precipitation
Historical climatology, 1950-2006
Belgeo, 3 | 2006
12

indices (PI). If such a proxy data is provided by written records on the length of frosty
weather, this is the number of frosty days per winter season. However, if winter seasons
have been very mild, there is no record of frosty days. Temperature during such winter
seasons may range from slightly above Celsius to 3 or more degrees minus Celsius. In such
cases additional weather information is required.
41 If proxy data is provided by written records on the time of harvesting (phenological data),
the date of harvesting provides the annual indices. So if grape harvesting began on 15th
September 1651, this results in an indices of 15. If proxy data is provided by records on
the time of leasing out the tithes, which always occurred at a fixed time prior to the time
of harvesting, the tithe data similarly provides a proxy data. So leasing out the tithes at
for instance the 31st, 15th or the 5th of July is providing an indices of respectively 1, 17 or
27.
42 In order to have the necessary data control and to check errors and all kinds of anomalies
in the long series of indices, it is important to have at least three or more parallel time
series of indices from the same region. In this way Le Roy Ladurie combined many long
parallel time series of dates of grape harvesting in France (Le Roy Ladurie et al., 1980).
This resulted in a kind of standardized time series of dates of grape harvesting, which
starts in 1484. Because each particular crop has its own specific growing conditions and
consequently its own time of harvesting, proxy data of the time of the grain harvesting
(rye, wheat, oats, etc.) and of the harvesting of Brassica napus as a winter crop, also
provide valuable annual indices (De Kraker, 2004).
43 Another way to obtain (temperature) indices (TI) consists of assessing (evaluating)
temperatures every ten days into seven categories or levels (seven level index). For
instance if the first ten days of January have been very mild the assessment is +2 or +3, if
weather during the second ten days has changed into frost, the assessment will be 0 and if
during the last ten days of January frost is continuous, the assessment will be –1 or –2
(Lamb, 1963, 1965; Pfister, 1988, 1992, 1999b; Brázdil et al., 1996; Glaser et al., 1999). Of
course it is hard to make an accurate assessment of each short period, but much of this
also depends on additional information on weather conditions provided by other written
sources and comparison to weather conditions during other winter seasons. The same
method of assessment can be applied to the temperatures of the other three seasons. In
fact assessing temperatures this way is rather similar to assessing wind force by the
wording system, discussed earlier on.
44 The seven level index can also be used for assessing precipitation. So dry months are
assessed –1; average months 0 and wet months +1 (Glaser et al., 1999). Because assessment
as such is mostly considered to be rather subjective, the results acquired so far have to
undergo additional processing.
Comparison: correlation coefficients and transfer
45 Depending on the kind of data used to compile time series of indices, series also need to
be continuous right throughout the 18th century when early instrumental time series are
available (fig. 6). The overlap in time is required in order to correlate the indices with for
instance the temperature series (De Vries, 1977; Van den Dool et al., 1978; Shabalova et al.,
2003).
Historical climatology, 1950-2006
Belgeo, 3 | 2006
13
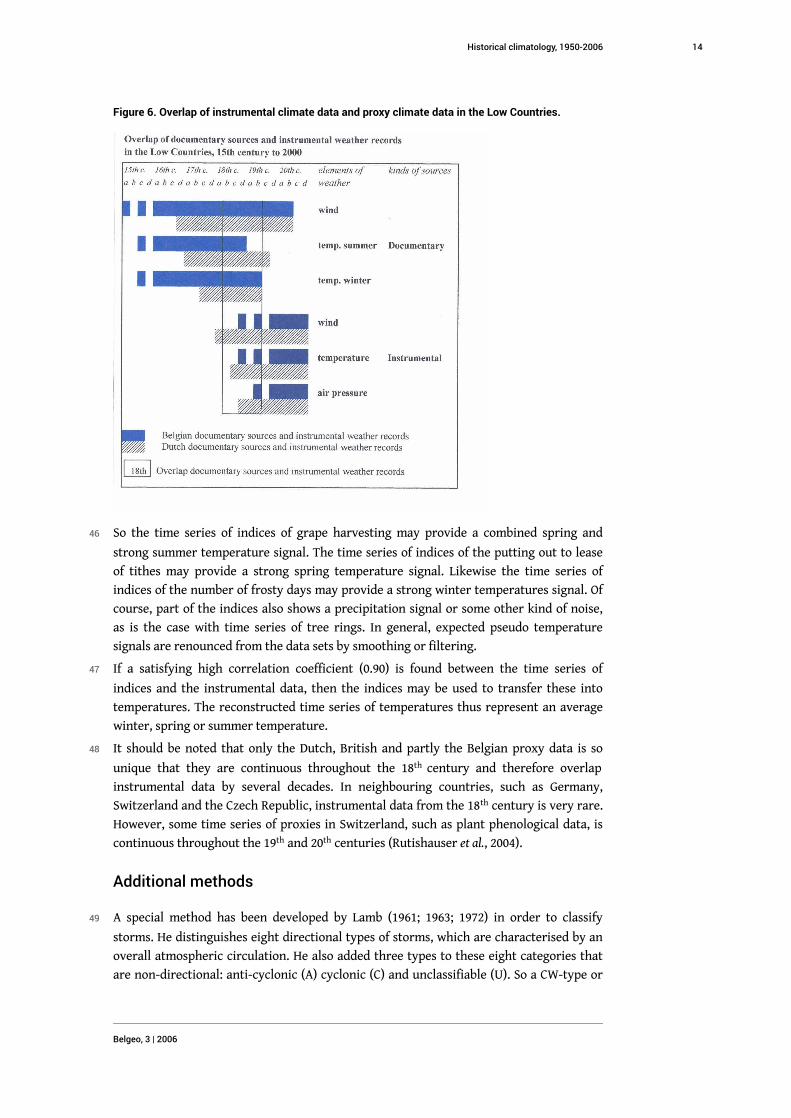
Figure 6. Overlap of instrumental climate data and proxy climate data in the Low Countries.
46 So the time series of indices of grape harvesting may provide a combined spring and
strong summer temperature signal. The time series of indices of the putting out to lease
of tithes may provide a strong spring temperature signal. Likewise the time series of
indices of the number of frosty days may provide a strong winter temperatures signal. Of
course, part of the indices also shows a precipitation signal or some other kind of noise,
as is the case with time series of tree rings. In general, expected pseudo temperature
signals are renounced from the data sets by smoothing or filtering.
47 If a satisfying high correlation coefficient (0.90) is found between the time series of
indices and the instrumental data, then the indices may be used to transfer these into
temperatures. The reconstructed time series of temperatures thus represent an average
winter, spring or summer temperature.
48 It should be noted that only the Dutch, British and partly the Belgian proxy data is so
unique that they are continuous throughout the 18th century and therefore overlap
instrumental data by several decades. In neighbouring countries, such as Germany,
Switzerland and the Czech Republic, instrumental data from the 18th century is very rare.
However, some time series of proxies in Switzerland, such as plant phenological data, is
continuous throughout the 19th and 20th centuries (Rutishauser et al., 2004).
Additional methods
49 A special method has been developed by Lamb (1961; 1963; 1972) in order to classify
storms. He distinguishes eight directional types of storms, which are characterised by an
overall atmospheric circulation. He also added three types to these eight categories that
are non-directional: anti-cyclonic (A) cyclonic (C) and unclassifiable (U). So a CW-type or
Historical climatology, 1950-2006
Belgeo, 3 | 2006
14

cyclonic westerly circulation “corresponds to a situation where the steering of synoptic
features is from west to east” with depressions passing over the northern part of the
North Sea (Kelly et al., 1997). The use of this classification is that weather types can be
roughly linked to pressure field patterns and precipitation.
50 Finally a method has been developed to assess wind force and its variability on a longer
time scale (De Kraker, 1997, 1999) by studying long continuous time series of dike
accounts. This method distinguishes eight categories by taking into account the following
criteria. One criterion is the way how a particular storm is described in the document:
high tide, storm, storm surge or disastrous storm surge, etc. Additional information on
the duration of a storm, the wind direction and the height of the flood is also taken into
account. Next the consequences of storm are assessed, for instance some only caused
damage to dikes others flooded many thousands of acres of arable land, while many cattle
and people drowned (De Kraker, 2000).
Climate reconstruction: temperature
General
51 About 1950 historical climatology was still non-existent. For several countries and
European regions traditional compilations were available on climate extremes, some of
them providing an overview of extremely cold winters (Easton, 1928) others of flooding
events. In fact most of these compilations were unreliable, but still these were used by
meteorologists interested in the past. On the other hand historians and geographers
began to critically analyse the older weather observations, but still were not able to find a
method to reconstruct parts of past climates. Within half a century this changed.
Especially from the fields of history and geography ideas about the use of unexplored
historical weather data emerged and new methods were applied from both the social and
natural sciences. From meteorologists much effort was put into getting their older
instrumental measurements right. At the same time a closer co-operation between the
two fields resulted in interdisciplinary approach of historical climatology. A brief
overview of the results obtained so far follows.
Temperature reconstructions
52 During the 1950s the historical climatological debate was dominated by Lamb, Flohn and
Le Roy Ladurie.
53 Lamb thought that climate of the recent 2,000 years was variable, which he concluded on
the basis of evidence coming from human activities in the Northern Atlantic, the
changing tree lines in mountainous regions and the related glacier movements, grape
cultivation and the then existing compilations of severe winters (Lamb, 1965). Although
most of his historic evidence was of a qualitative nature, he consequently distinguished a
Medieval Warm Epoch (MWE) and a Little Ice Age (LIA). Lamb did not invent the name
Little Ice Age; this seems to have been initiated by Matthes (1942). Lamb believed the LIA
started about 1550 (Lamb, 1977). He also developed a method of roughly measuring
temperature that has been discussed above (Lamb, 1963). Following from here several
studies were made of very recent climatic periods by looking at the consequences of
temperature change, such as the advance and retreat of glaciers.
Historical climatology, 1950-2006
Belgeo, 3 | 2006
15

54 One of the first historians to look into this problem was Le Roy Ladurie (1967). Using
glacier data, he distinguished five periods of glacier advancing during the last 3,500 years
(Le Roy Ladurie, 1983). The interval or warmer periods are referred to as optima, the
periods of glacier advancing are referred to as maximums. Particularly the long period of
advancing glacier between 1550 and 1850, Le Roy Laduries fifth period, was the Little Ice
Age. This hot item has also been thoroughly analysed by Jean M. Grove (1988, 2001; Grove
et al. 1995) who finally admitted the LIA started about 1250-1300, agreeing with Porter
(1986) and O’Brien (O’Brien et al., 1995) who considered the LIA to be complex. The
complexity of the LIA was shown by a sequence of alternating cold and warmer periods.
One of the colder periods started during the last quarter of the 16th century (Pfister et al.,
1996). But perhaps the coldest period of the LIA was the Maunder Period (1675-1730)
which received much attention during the nineties (Frenzel et al., 1994). By now it has
been firmly established that the Maunder Period is also much more complex and
consequently shows two extremely cold decades 1676 to 1695, that are explained by solar
variability, an increase in volcanic activity and the internal oscillation in the North
Atlantic region (Luterbacher, 2001).
55 At the same time discussion on the beginning and nature of the LIA was well underway,
also the MWE, prior to the LIA received much attention. While Lamb argued mainly on
biological and phenological data, that the period about 1200 was relatively warm,
although settlement of Iceland began in the 9th century A.D. and written evidence stops
about 1430, Ogilvie could not find the perfect connection with climatic conditions (Ogilvie
et al., 1997). During the MWE Icelandic climate seems to have been more variable than in
other parts of Europe. On the other hand research carried out by Alexandre (1987) clearly
established a relatively warm period that seems to have lasted well into the 15th century.
Recent research tends to an earlier ending of the MWE (Ogilvie et al., 1997; Gunnarson et
al., 2002)
56 A more accurate climate variability of the recent millennium was obtained by the
availability of an increasing number of publications on historical weather observations
and proxy data, combined with the use of better statistical methods of reconstruction.
Research on the freezing of waterbodies by De Vries (1977, 1980) not only showed the
variability of winter severity on a long time scale by analysing the number of days
shipping was interrupted on the Haarlem canals, but he also initiated a method to
translate the length of the frosty winter period into temperatures (fig. 7). Although his
method was corrected immediately (Van den Dool et al., 1978; Van Engelen et al., 2001) it
proved to be a valid one and it showed that the winters of 1634 to 1838 indicated that the
Little Ice Age was more complex than had been assumed. In fact, it showed that in
particular the late 17th century was a period of extremely cold winters. It was also
realised that more than just proxies for winter temperature were needed to assess the
variability of temperature throughout the last five or six centuries.
Historical climatology, 1950-2006
Belgeo, 3 | 2006
16

Figure 7. Reconstruction of winter temperature in the Netherlands, 1634-1810.
De Vries, 1977
57 Studying proxy data provided by growth of plants also proved to be a very promising
path to obtain a more accurate annual mean temperature. The most outstanding early
example of such a study was carried out by Le Roy Ladurie, who already in 1959 addressed
the potential of the dates of the grape harvest. Grape harvesting usually occurs in
September, but the exact date and its annual fluctuation on longer time scale were closely
connected to the April-July temperature. Shortly after De Vries’ (1977) innovative paper
on reconstructed winter temperatures, Le Roy Ladurie (Le Roy Ladurie et al., 1980)
compiled a long time series of dates of grape harvesting, which was soon to be used to
estimate mean temperatures for April-June (Burkhardt et al., 1985; Lauscher, 1985) (fig. 8).
There was more evidence to come from other phenological data. First dates of the grain
harvest were studied in Germany (Glaser, 1991, 1995, 1997) and elsewhere (Tarand et al.,
1994) and first dates of the blossoming of fruit trees, such as the cherry tree (Pfister, 1988,
1999c). All results showed a similar variability of reconstructed temperatures throughout
the periods under study.
Historical climatology, 1950-2006
Belgeo, 3 | 2006
17
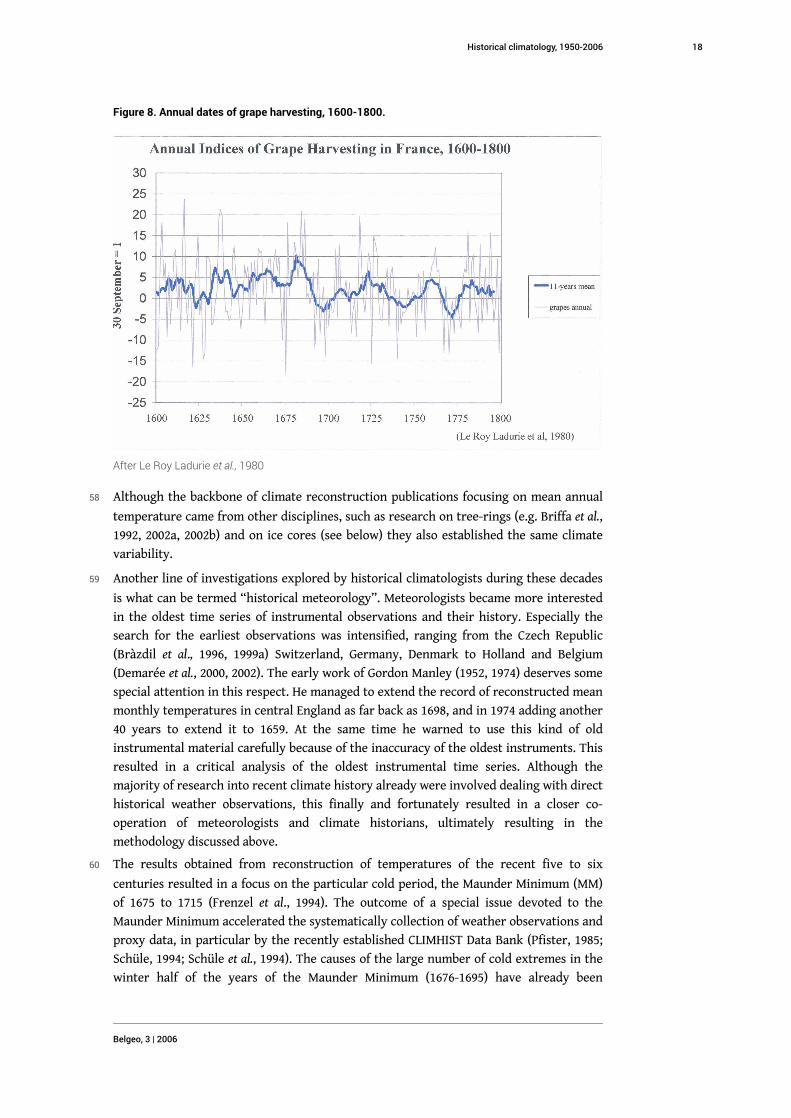
Figure 8. Annual dates of grape harvesting, 1600-1800.
After Le Roy Ladurie et al., 1980
58 Although the backbone of climate reconstruction publications focusing on mean annual
temperature came from other disciplines, such as research on tree-rings (e.g. Briffa et al.,
1992, 2002a, 2002b) and on ice cores (see below) they also established the same climate
variability.
59 Another line of investigations explored by historical climatologists during these decades
is what can be termed “historical meteorology”. Meteorologists became more interested
in the oldest time series of instrumental observations and their history. Especially the
search for the earliest observations was intensified, ranging from the Czech Republic
(Bràzdil et al., 1996, 1999a) Switzerland, Germany, Denmark to Holland and Belgium
(Demarée et al., 2000, 2002). The early work of Gordon Manley (1952, 1974) deserves some
special attention in this respect. He managed to extend the record of reconstructed mean
monthly temperatures in central England as far back as 1698, and in 1974 adding another
40 years to extend it to 1659. At the same time he warned to use this kind of old
instrumental material carefully because of the inaccuracy of the oldest instruments. This
resulted in a critical analysis of the oldest instrumental time series. Although the
majority of research into recent climate history already were involved dealing with direct
historical weather observations, this finally and fortunately resulted in a closer co-
operation of meteorologists and climate historians, ultimately resulting in the
methodology discussed above.
60 The results obtained from reconstruction of temperatures of the recent five to six
centuries resulted in a focus on the particular cold period, the Maunder Minimum (MM)
of 1675 to 1715 (Frenzel et al., 1994). The outcome of a special issue devoted to the
Maunder Minimum accelerated the systematically collection of weather observations and
proxy data, in particular by the recently established CLIMHIST Data Bank (Pfister, 1985;
Schüle, 1994; Schüle et al., 1994). The causes of the large number of cold extremes in the
winter half of the years of the Maunder Minimum (1676-1695) have already been
Historical climatology, 1950-2006
Belgeo, 3 | 2006
18

discussed (Luterbacher, 2001). It also showed that the Maunder Minimum effect was
stronger in Central and Northern-Europe than in the Mediterra nean.
61 During the last decade studies on temperature reconstruction have made a remarkable
progress. One of the most outstanding publications is without any doubt the result of a
huge collection of detailed weather observations and proxy data by Van Engelen and
Buisman. It is not their published data base of weather observations with all kinds of
irrelevant anecdotal stories (Buisman, 1995-2006) but the processing of these proxy data
into long series of reconstructed winter and summer temperatures, that is of interest
(Van Engelen et al., 2001; Shabalova et al., 2003) (fig. 9). These time series have a long
overlap with the time series of instrumental measured temperatures from the 18th
century. As a result, the mean temperatures of the Netherlands could be reconstructed as
far back as 843 A.D. However, looking a little bit closer to this time series, it soon appears
that the increasing uncertainty renders the reconstructed time series of temperatures
before 1400 far less useful. It therefore needs to be used as a means of reference with
other time series, such as tree-ring series and ice cores, from that early period. On the
other hand such time series always originate from far away regions. The Dutch
reconstructed temperature series and the Mid-England series are in good accordance
with each other.
Figure 9. Reconstruction of Winter and Summer temperatures of the Netherlands, 800-2000.
Historical climatology, 1950-2006
Belgeo, 3 | 2006
19

Van Engelen et al., 2001
Climate reconstruction, extremes, impact andperception
High tides, storms and storm surges
62 One of the climate events that triggered renewed interest in historical climatology was
beyond any doubt the storm surge of 1953. In order to know whether this climate
extreme, that killed 1,836 people in The Netherlands alone, was an exception or the
beginning of a new era, characterised by an accelerated rise of general sea level and
consequently increasing danger for the coastal defence, the study of historic storms
gained a huge interest. This renewed interest in fact coincided with the recently
developed concept by Quaternary geologists of transgression and regression phases
during the Holocene (Tavenier, 1948; Ervynck et al., 1999). Some even believed the 1953
storm surge to be the signal for another transgression phase, the so called Dunkirk IV?
(Ervynck et al., 1999).
63 Already in 1970 the All Saints Flood of 1570 received so much attention, that a special
congress was held to present an overview of the devastating aspects of the storm surge
from several part of the Netherlands, Belgium and Northern Germany (De Vries and
Winsemius, 1970). This revived interest immediately made clear that there was no
inventory of historic storms, not even of historic storm surges. Moreover it showed that
using old chronicles for the reconstruction of historic storms was dangerous, because
most of these writings were considered unreliable. During the post-war decades there
already was a large expertise in the Netherlands from the domain of historical geography
on using written sources to reconstruct historic landscapes and the development of
landscapes on long time scales (Gottschalk, 1955-1958). At the same time historical
geography studies paid attention to the impact of e.g. historic storm surges (Gottschalk,
1955-1958; Dekker, 1980). Thus it was a relatively small step for scientists to start a study
of old chronicles and their use for compiling historical storm surges and river flooding
Historical climatology, 1950-2006
Belgeo, 3 | 2006
20

events. However, at the same time this was a major step towards the historical climate
research as well.
64 During the 1970s this research resulted in a three volume edition of “Storm surges and
river flooding in the Low Countries, 800 AD to 1700 AD” (Gottschalk, 1971-1977). Not only
did it show that many historic storm surges could be ignored, because chroniclers had
made serious mistakes, it also showed the spatial and temporal variability of storm surges
in the Low Countries coastal region. For instance, the disastrous storm surges of 1424
caused considerably less damage in the Northern German coastal region than in the
Dutch coastal region. Unfortunately, the big effort did not result in any other research of
similar impact in the Netherlands. Undoubtedly the major reason was that from the
storm surges compilation it was concluded that it would be impossible to make a
quantitative assessment of the storm surges for the pre-instrumental period. Moreover
the study was “only” based on chronicles, not on a large amount of additional primary
written sources. Similarly Augustyn’s ecological study was restricted to qualitative
aspects of climate (Augustyn, 1992).
65 During the 1990s a first attempt was made to quantify storminess, by using primary
written sources, such as accounts on dike maintenance (De Kraker, 1997, 1999, 2005). A
special method was used to assess the impact of the weather event, such as the duration,
wind direction, water levels reached during spring tide, the way in which the event was
characterised (wording system) the duration of storm events and all possible
consequences of the event, from small scale damage to large scale flooding of polders.
The quantification of storm surges, storm and high tides resulted in a record of
storminess variability during the 16th century (fig.10). Still, the area studied for this
purpose remained limited to a polder area of approximately 400 km2 to the west of
Antwerp.
66 Finally, further study on the proxies of storms is carried out to translate the wording
systems into hard numbers. One of the most important category of written sources used
to reach this goal is ships logs (see below).
Historical climatology, 1950-2006
Belgeo, 3 | 2006
21

Figure 10. Frequency of storminess in the Zeeland Delta, 1488-1609.
De Kraker, 1999
Atmospheric density maps
67 Research on the variability of storms in the past in Great Britain continued to be one of
the topics of Lamb. After having classified daily weather types (see above), historic storms
were put into a broader temporal and geographical perspective resulting in the first
attempt to reconstruct an entire historical pressure field pattern (Douglas et al., 1978) (fig.
11). These synoptic maps became a starting point to continue the compilation of historic
storms and soon more reconstructions of pressure field patterns of particular storm
events were produced (Lamb et al., 1991). In fact it resulted in combining the data of the
earliest known instrumental observations of air pressure and wind direction with the
written evidence on historic storms in the North Sea region on a global scale, linking
them with the North Atlantic Oscillation Index and other climate phenomena such as El
Niño, La Niña, solar forcing, ice core results from the Greenland area and the results of
the tree ring record. The first attempt to link land and marine weather data was made by
Jones (Jones et al., 1982, 1986, 1999; Kelly et al., 1997). By now this research has included
much additional data of meteorological stations around the world, including those from
oceanic stations of which the larger number only dates from the post-Second World War
era. A very promising recent development of this research is the digitising of old ships
logs dating as far back as the mid 18th century (Koek et al., 2003; Garcia-Herrera et al.,
2003; Wheeler, 2004, 2005), extending the pre-instrumental data base is prolonged back
into time. Already a huge amount of data is available, but only from the well known sea
routes, along the South African coast to the East Indies and the North and Mid Atlantic
routes. Besides the large spatial and temporal coverage of this oceanic climate data, they
need to be assessed in such a way that for instance the observations of wind and storms
can be easily translated into wind force as it has evolved into the Beaufort scale about
Historical climatology, 1950-2006
Belgeo, 3 | 2006
22

1800 (Gram Jensen, 1985). However, the outlooks of achieving this goal are very promising
(Wheeler et al., 2004).
Figure 11. Reconstruction of air pressure fields during the Armada attack, 1588.
Lamb et al., 1991
Climate extremes, impact and perception
68 Apart from reconstructing past climates, historical climatology also sets out to
investigate extreme climate events and their impact, such as flooding events caused by
extreme rainfall or storm surges. Although climate is variable within certain boundaries,
these boundaries become more tightened as soon as regions become populated and man
begins to change its environment. As soon as boundaries are dictated by man climate
extremes tend to be considered natural catastrophes. Such catastrophes leave important
traces in the written sources, because they are very harmful to society.
69 In fact, the earlier compilations of climate events and weather data were mere collections
of extreme weather events, such as extreme cold winters, long droughts and storms. As
shown above, the renewed interest for storm surges in the Netherlands after the storm
surge of 1953, resulted in a detailed study of recorded storm surges from 800 AD to 1700
AD (Gottschalk, 1971-1977). Recently, storms in the Zeeland delta have been studied in
more detail (De Kraker, 1997, 2000). The analysis of the 1717 Christmas storm surge in
Germany (Jacubowski-Tiessen, 1992) included not only the causes and the immediate
impact but also the longer term consequences. Similarly, storm surges have been studied
for the Adriatic region (Camuffo, 1993).
70 An increase in extreme weather events caused by heavy rainfall during the last ten years
has again turned the attention of climatic controls on flooding of European rivers. Of
course, earlier researchers had focused on rainfall events (Wales-Smith, 1971, 1973;
Craddock, 1976; Wigley et al., 1977) before. In the Netherlands special attention was paid
to the rivers Waal and Maas (Driessen, 1994; Stangl, 2003).
71 In Spain and Italy the Mediterranean climate produces torrential floods mainly during
winter, which may turn into catastrophic floods, affecting city centres located on the
main rivers (Barriendos et al., 1998; Camuffo et al., 1996; Bràdzil et al., 1999b).
72 River flooding in Germany, Poland and the Czech Republic in 2000 and 2002 also attracted
considerable scientific attention from historical climatologists (Brázdil et al., 2003;
Munzar, 2003; Deutsch et al., 2003; Glaser, 2003; Poliwoda, 2003; Rohr, 2003; Stangl, 2003).
Historical climatology, 1950-2006
Belgeo, 3 | 2006
23

73 The impact of extreme cold periods on society is shown from scarcity during severe
winters, which could result in hunger and an increased mortality rate. One of the most
interesting case studies of this kind of impact on society is the severe winter of 1740
(Post, 1984, 1985). Similarly, the relation between hot and dry summers and the
occurrence of malaria in former salt marsh regions of the Low Countries is an example of
climate impact, which can now be shown from the increased knowledge of climate
variability of the pre-industrial centuries (Devos, 2001).
74 Attention was again paid to the impact of extreme weather events on military campaigns
and on politics in general. The weather conditions that led to the attempt of the Spanish
Armada to sail around Scotland in the autumn of 1588 can be considered a classic
example (Douglas et al., 1978).
75 Finally, perception of weather extremes has become important, because the way people
perceived extremes in the past may teach us vital lessons how to deal with present
extremes. For instance, there is a close link between human response to storm surges
causing large scale flooding and perception in which the Divine Act played an important
role throughout the centuries (Kempe, 2003; Stuber, 2003). However, the concept of a
gradual diminishing interest of religious beliefs in perceiving weather extremes
particularly during the Age of Enlightenment, is a far too simple concept. Because hardly
any attention has been paid to this aspect of historical climatology in the Low Countries
(Buisman, 1995-2006; Slager, 2003), this will not be further explained.
Discussion, conclusion and outlook
76 This review has traced the development of historical climatology as an emerging science
during the past 50 years. Having its origin in the social sciences, of which historical
geography and history are most distinctive, historical climatology has contributed much
to the understanding of climate variability of the recent millennium by showing what
kind of climate information is provided by written sources and how this information can
be used. While at the start only a few individuals, such as Lamb, Flohn and Le Roy Ladurie,
showed any interest in recent climate, within a few decades historical climatology
evolved into a specialised field of research. By now most of the European countries, of
which England, Switzerland, Germany and the Czech Republic are by far the most
important contributors, are involved in historical climatology.
77 During these five decades historical climatology has already contributed greatly to all
aspects of climate and weather research. First, it has unlocked a wide variety of written
sources mainly dating from the pre-instrumental period providing indirect information
on climate conditions: proxy data. These proxy data provides a climate signal
(temperature, precipitation and pressure) which has been used to compile long time
series of climate related signals. Second, historical climatology has developed special
methods in order to transfer the indirect climate signal into data that is directly
comparable to the data provided by instrumental measurement of weather. In this way it
has contributed hugely to extending the time series of instrumentally measured
temperature back into the 16th century and for some parts of Europe, even earlier. Third,
historical climatology is able to assess the impact of man and how this has changed
during the recent millennium, which is of great interest in the present discussion on
recent climate change.
Historical climatology, 1950-2006
Belgeo, 3 | 2006
24

78 Finally, historical climatology as a specialised field of research of its own has not only
contributed very much to the understanding of climate variability of the recent
millennium, but can continue to do so in the future.
79 In the Low Countries, for instance, one major contribution is the ongoing study of long
series of written sources that provide temperatures, storms and precipitation signals (De
Kraker, 2003, 2004; Shabalova et al., 2003; Demarée et al., 2002). In Belgium these series
start as early as 1400 and are continuous throughout the 18th century. Among these time
series of tithe leasing and of river tolls and putting out to lease of barges are by far the
most important (De Kraker, 2003). For the Netherlands most of these series are
continuous from the second half of the 16th century to the 18th century, while some tithe
records series extend to the first quarter of the 19th century. The second benefit of the
existence of such long time series of written records in the Low Countries is the long
overlap these documents have with the beginning of instrumental time series. This
overlap period is long enough to establish a good calibration of the historical
temperature proxy data for nearly all seasons. Until now, only a single reconstructed
time series of temperatures has been compiled for the Netherlands focusing on mainly
the central part of Holland (Shabalova et al., 2003). Furthermore, the high number of
available high potential time series of historical records in the Low Countries provide an
unrivalled spatial resolution for the reconstruction of weather and climate patterns,
which, when combined with present-day data, may lead to better reconstructions of
pressure fields and weather systems (De Kraker, 2003, 2004). A final contribution can be
made by studying the climate extremes and their impact on society in their temporal and
geographical context, so that it can be shown how much of weather extremes is natural
and how much of it is human induced.
BIBLIOGRAPHY
ALEXANDRE P. (1976), Le climat au Moyen Age en Belgique et dans les régions voisines (Rhénanie, Nord
de la France), Liège, publications n°50 du Centre Belge d’Histoire Rurale.
ALEXANDRE P. (1987), Le climat en Europe au Moyen Age. Contribution à l’histoire des variations
climatiques de 1000 à 1425, d’après les sources narratives de l‘Europe occidentale, Paris, Editions de
l’École des Hautes Études en Sciences Sociales.
ARENDS F. (1974), Physische Geschichte der Nordsee-Küste und deren Veränderungen durch
Sturmfluthen seit der Enbrischen Fluth bis jezt, Verlag Schuster in Leer, Emden 1833, Reprinted in
1974.
AUGUSTYN B. (1992), Zeespiegelrijzing, transgressiefasen en stormvloeden in maritiem Vlaanderen tot
het einde van de XVIde eeuw. Een landschappelijke, ecologische en klimatologische studie in historisch
perspektief, Brussels, Alge meen Rijksarchief, 2 vols.
BARRING L. (2000), “Preliminary analysis of pressure tendency variability in the Lund record
(1780-), southern Sweden”, in MIKAMI T. (ed.), Proceedings of the International Conference on Climate
Historical climatology, 1950-2006
Belgeo, 3 | 2006
25

Change and Variability – Past, Present and Future – Tokyo, 13-17 Sept. 1999, Tokyo Metropolitan
University, pp. 145-151.
BARRIENDOS M. & MARTIN-VIDE J. (1998), “Secular climatic oscillations as indicated by
catastrophic floods in the Spanish Mediterranean coastal area (14th -19th centuries)”, Climatic
Change, 38, pp. 473-491.
BELL W.T. & OGILVIE A.E.J. (1978), “Weather compilations as a source of data for the
reconstruction of European climate during the medieval period”, Climatic Change, 1, pp. 331-348.
BIJVOET H.C., HAM C.J., VAN DER GROEN P., RIJKOORT P.J., SCHMIDT F.H., VERPLOEGH G. &
WEENINK M.P.H. (1960), Meteorological and oceanographic aspects of storm surges on the Dutch coast,
K.N.M.I., Bijdrage tot het rapport van de Deltacommissie.
BOKWA A., LIMANÓWKA, D. & WIBIG J. (2001), “Pre-instrumental observations”, in JONES P.D.,
OGILVIE A.E.J., DAVIS T.D. & BRIFFA K.R. (eds.), History and Climate. Memories of the Future?, New
York, Boston, Dordrecht, London, Moscow, Kluwer Academic/Plenum Publishers, pp. 9-29.
BRAUDEL F. (1958), “Histoire et Sciences Sociales: La longue durée”, Annales, Économies,
Civilisations et Sociétés, pp. 725-753.
BRÁZDIL R. (1990), “Climatic Fluctuations in Bohemia from the 16th century until the present”,
Theoretical and Applied Cli matology, 42, pp. 121-128.
BRÁZDIL R. (1992), “Climatic conditions of the Little Ice Age in Bohemia”, in MIKAMI T. (ed.),
Proceedings of the International Symposium on the Little Ice Age Climate, Tokyo, Tokyo Metropolitan
University, pp. 214-220.
BRÁZDIL R. & KOTYZA O. (1995), “Daily meteorological observations of Charles senior of Zerotin
in the years 1588-1591”, Scripta Fac. Nat. Univ. Masaryk Brun, 25, pp. 7-37.
BRÁZDIL R. & KOTYZA O. (1996), History of weather and climate in the Czech Lands II. The earliest
observations of the weather in the Czech Lands, Brno, Masaryck University.
BRÁZDIL R. & KOTYZA O. (1999a), History of weather and climate in the Czech Lands III. Daily weather
records in the Czech Lands in the sixteenth century II, Brno, Masaryck University.
BRÁZDIL R., GLASER R., PFISTER C., DOBROVOLNÝ P., ANTOINE J-M., BARRIENDOS VALLVÉ M.,
CAMUFFO D., DEUTCH M., ENZI S., GUIDOBONI E., KOTYZA O. & SANCHEZ RODRIGO F. (1999b),
“Flood events of selected European rivers in the sixteenth century”, Climatic Change, 43, pp. 239-287.
BRÁZDIL R. & KOTYZA O. (2000), History of weather and climate in the Czech Lands IV. Utilisation of
economic sources for the study of climate fluctuations in the Louny region in the fifteenth-seventeenth
centuries, Brno, Masaryck University.
BRÁZDIL R. & KOTYZA O. (2002), History of weather and climate in the Czech Lands V. Instrumental
meteorological measurements in Moravia up to the end of the eighteenth century, Brno, Masaryck
University.
BRÁZDIL R., VALÁŠECK H. & SVITÁK Z. (2003), “Historical economic data as a source of
information for the study of meteorology and hydrological extremes in the Czech Republic”,
Dealing with Diversity, Prague. 2nd International Conference of the European Society for Environmental
History, pp. 23-29.
BRIFFA K.R., JONES P.D., BARTHOLIN T.S., ECKSTEIN D., SCHWEINGRUBER F.H., KARLÉN W,
ZETTERBERG P. & ERONEN M. (1992), “Fennoscandian summers from A.D. 500: temperature
changes on short and long timescales”, Climate Dynamics, 7, pp. 111-119.
Historical climatology, 1950-2006
Belgeo, 3 | 2006
26

BRIFFA K.R. & MATTHEWS JA. (2002a), “Advance-10K: a European contribution towards a
hemispheric dendroclimatology for the Holocene”, The Holocene, 12, 6, pp. 639-642.
BRIFFA K.R., OSBORN T.J., SCHWEIN GRUBER F.H., JONES P.D., SHIYATOV S.G. & VAGANOV E.A.
(2002b), “Tree-ring width and density data around the Northern Hemisphere. Part 2, spatio-
temporal variability and associated climate patterns”, The Holocene, 12, 6, pp. 759-789.
BRITTON C.E. (1937), A meteorological chronology to AD 1450, Meteorological Office, London,
Geophysical Memoirs, N° 70.
BUISMAN J. (1984), Bar en boos. Zeven eeuwen winterweer in de Lage Landen, Baarn, Bosch en Keuning
n.v.
BUISMAN J. & ENGELEN A.F.V. van (eds.) (1995-2006), Duizend jaar weer, wind en water in de Lage
Landen, 5 vols., Franeker, Uitgeverij Van Wijnen.
BURKHARDT T. & HENSE A. (1985), “On the reconstruction of temperature records from proxy
data in Mid-Europe”, Arch. Met. Geoph. Biocl., B 35, pp. 341-359.
CAMUFFO D. (1987), “Freezing of the Venetian Lagoon since the 9th century A.D. in comparison to
the climate of Western Europe and England”, Climatic Change, 10, pp. 43-67.
CAMUFFO D. & ENZI S. (1992), “Reconstructing the climate of Northern Italy from archive
sources”, in BRADLEY R.S., JONES P.D. (eds.), Climate since A.D. 1500, London, Routledge, pp. 143-154.
CAMUFFO D. (1993), “An analysis of the sea surges at Venice from A.D. 782 to 1990”, Theoretical
and Applied. Climatology, 47, pp. 1-14.
CAMUFFO D. & ENZI S. (1995), “Impact of clouds of volcanic aerosols in Italy in the past
centuries”, Natural Hazards, 11, pp. 433-450.
CAMUFFO D. & ENZI S. (1996), “The analysis of two bi-millenary series: Tiber and Po river floods”,
in JONES P.D., BRADLEY R.S. & JOUZEL J. (eds.), “Climatic Variations and forcing mechanisms of
the last 2000 years”, NATA ASI Series, 41, Berlin-Heidelberg, Springer Verlag, pp. 433-450.
CRADDOCK J.M. (1976), “Annual rainfall in England since 1725”, Quaternary Journal Royal
Meteorological Society, 102, pp. 823-840.
DEKKER C. (1980), “Resultaten van het historisch-geografisch onderzoek in Zeeland”, in
VERHULST A. & GOTT SCHALK M.K.E., Transgressions and the history of settlement in the coastal areas
of Holland and Belgium, Proceedings Colloquium Gent 5-7 September 1978, pp. 75-93.
DEMARÉE G. (1990), “On the re-discovery of the XVIIIth century daily meteorological observations
carried out at Verviers by G.L. Godart”, Bulletin de la Société Belge d’Études Géographiques, 2, pp. 171-181.
DEMARÉE G. (1993), “Guillaume Lambert Godart: médecin, philosophe et météorologiste. Un
savant oublié du XVIIIe siècle”, Ciel et Terre, 109, pp. 47-51.
DEMARÉE G. (1999), “Annus mirabilis A.D. 1783; Een kroniek van merckenweerdigste voorvallen
langs de Schreven”, Liber Amicorum R.A. Blondeau, Poperinge, Schoonaert, pp. 79-94.
DEMARÉE G., VERHOEVE T. LACHAERT P.J & THOEN E. (2000), “The long-term temperature time-
series of Central Belgium (1767-1999)”, in OBREBSKASTARKEL B. (ed.), Reconstructions of climate
and its modelling. Millennium images and reconstructions of weather and climate over the last millennium,
Cracow, Institute of Geography of the Jagiellonian University, pp. 41-49.
DEMARÉE G.R. & OGILVIE A.E.J. (2001), “Bons Baisers d’Islande: Climatic, Environmental and
human dimensions impacts of the Lakagigar eruption (1783-1784) in Iceland”, in JONES P.D.,
Historical climatology, 1950-2006
Belgeo, 3 | 2006
27

OGILVIE A.E.J., DAVIES T.D. BRIFFA K.R. (eds.), History and climate. Memories of the future?, New
York, Boston, Dordrecht, London, Moscow, Kluwer Academic/ Plenum Publishers, pp. 219-247.
DEMARÉE G.R., LACHAERT P.J., VERHOEVE T. & THOEN E. (2002), “The long-term daily central
Belgium temperatures (CBT), series (1767-1998), and early instrumental Meteorological
Observations in Belgium”, Climatic Change, 53, pp. 269-293.
DEUTSCH M. & PÖRTGE K-H. (2003), “Extreme/disastrous floods in Thuringia (Germany),
1500-1900 A.D.”, Dealing with Diversity, Prague. 2nd International Conference of the European Society for
Environmental History, Abstract Book, 47.
DEVOS I. (2001), “Malaria in Vlaanderen tijdens de 18de en 19de eeuw”, in PARMENTIER J. &
SPANOGHE S. (eds.), Orbis in Orbem. Liver Amicorum John Everaert, Gent, Academia Press, pp. 197-235.
DOOL H.M. VAN DEN KRIJNEN H.J, & SCHUURMANS C.J.E. (1978), “Average winter temperatures
at De Bilt (the Netherlands), 1634-1977”, Climatic Change, I, pp. 331-348.
DOUGLAS K.S., LAMB H.H. & LOADER C. (1978), A meteorological study of July to October 1588: The
Spanish Armada storms, Norwich CRU RP-6.
DRIESSEN A.M.A.J. (1994), Watersnood tussen Maas en Waal. Overstromingsrampen in het rivierengebied
tussen 1780 en 1810, Gelderse Historische reeks XXI, Zutphen, Walburg Pers.
EASTON E. (1928), Les hivers dans l’Europe occidentale, Lei den.
ENGELEN A.F.V. VAN BUISMAN J. & IJNSEN F. (2002), “A millennium of Weather, Winds and Water
in the Low Countries”, in JONES P.D., OGILVIE A.E.J., DAVIES T.D. & BRIFFA K.R. (eds.), History and
climate. Memories of the future?, New York, Boston, Dordrecht, London, Moscow. Kluwer Academic/
Plenum Publishers, pp. 101-125.
ERVYNCK A., BAETEMAN C., DEMIDDELE H., HOLLEVOET Y., PIETERS M., SCHELVIS J., TYS D.,
STRIJDONCK M. VAN & VERHAEGHE F. (1999), “Human occupation because of a regression, or the
cause of a transgression. A critical review of the interaction between geological events and
human occupation in the Belgian coastal plain during the first millennium AD”, Probleme der
Küsten forschung im südlichen Nordseegebiet, 26, Olden burg, pp. 97-121.
FLOHN H. (1949), “Klima und Wit terungsablauf in Zürich im 16. Jahr hundert”, Vierteljaresschrift
der Naturfor schen den Gesellschaft in Zürich, 94, pp. 28-41.
FLOHN H. (1950), “Klimaschwankungen im Mittelalter und ihre historisch-geographischen
Bedeutung”, Berichte zur Deutschen Landeskunde, 72, pp. 347-357.
FLOHN H. (1958), “Klimaschwankungen der letzten 1000 Jahre und ihre Geophysikalischen
Ursachen”, Deutsche Geogr. Tagung Würzberg, 1957 – Tagungsberichte und Wissenschaftl. Abh.
Wiesbaden, pp. 201-214.
FLOHN H. (1967), “Klimaschwankungen in historischer Zeit”, in RUDLOFF H. von (ed.), Die
Schwankungen und Pendlungen in Europa seit dem Beginn der regelmässigen Instrumentenbeobachtung
(1670), Braunschweig, pp. 81-90.
GARCIA-HERRERA R., WHEELER D., KÖNNEN G.P., ROSARIO PRIETO M. DEL & JONES P. (2003),
“CLIWOC; a co-operative effort to recover climate data for oceanic areas (1750-1850)”, Dealing
with Diversity, Prague, 2nd International Conference of the European Society for Environmental History,
pp. 43-47.
GEURTS H.A.M. & ENGELEN A.F.V. van (1983), Geschiedenis van weerkundige waarnemingen in het
bijzonder in Nederland voor de oprichting van het K.N.M.I., De Bilt.
Historical climatology, 1950-2006
Belgeo, 3 | 2006
28

GEURTS H.A.M. & ENGELEN A.F.V. van (1985), Nicolaus Cruquius (1678-1754), and his meteorological
observations, De Bilt.
GEURTS H.A.M. & ENGELEN A.F.V. van (1992), Beschrijving antieke meetreeksen, part V. KNMI
publication, n° 165-V.
GEURTS H.A.M. & ENGELEN A.F.V. van (1994), “Historische weerkundige waarnemingen in
Zeeland. Het weer in Zierikzee bijgehouden door Beeckman en Baster”, Kroniek van het Land van de
Zeemeermin, 19, pp. 5-18.
GLASER R. (1991), Klimarekonstruktion für Mainfranken Bauland und Odenwald anhand direkter und
indirekter Witte rungs daten seit 1500, Akademie der Wissen schaften und der Literatur, Paläo klima ‐forschung, vol. 5, Mainz-Stuttgart-New York.
GLASER R. (1996), “Data and methods of climatological evaluation in historical climatology”,
Historical Social Research, 21, pp. 56-88.
GLASER R. (1998), “Historische Hochwässer im Maingebiet. Mögelichkeiten und Perspektiven auf
der Basis der Historische Klimadatenbank Deutschland (HSIKLD)”, Erfurter Geographische Arbeiten,
7, pp. 109-128.
GLASER R., & HAGEDORN H. (1990), “Die Überschwemmungskatastrophe von 1784 im Maintal.
Eine Chronologie ihrer witterungsklimatischen Voraus setzungen und Auswirkingen”, Die Erde,
121, pp. 1-14.
GLASER R. & WALSH R.P.D. (1991), “Historical climatology in different climatic zones –
Historische Klimatologie in verschiedenen Klimazonen”, Würzburger Geographische Arbeiten, 80,
pp. 465-490.
GLASER R, BRÁDZIL R., PFISTER C., DOBROVOLNÝ P., BARRIENDOS VALLVÉ M., BOKWA A.,
CAMUFFO D., KOTYZA O., LIMANÓWKA D., RÁCZ L., RODRIGO F.S. (1999), “Seasonal temperature
and precipitation fluctuations in selected parts of Europe during the sixteenth century”, Climatic
Change, 43, pp. 169-200.
GLASER R. (2003), “1000 Years of climate and floods in Central-Europe”, Dealing with Diversity,
Prague. 2nd International Conference of the European Society for Environmental History, Abstract Book, pp. 60-61.
GOTTSCHALK M.K.E. (1955-1958), Historische geografie van Westelijk Zeeuws-Vlaanderen, Assen, Van
Gorcum, 2 vols.
GOTTSCHALK M.K.E. (1971-1977), Stormvloeden en rivieroverstromingen in Nederland, Assen, Van
Gorcum & Comp. N.V., 3 vols.
GRAM-JENSEN I.B. (1985), Sea Floods. Contributions to the climatic history of Denmark, Kopenhagen.
GROVE J.M. (1988), The Little Ice Age, London-New York, Routledge.
GROVE J.M. & SWITSUR R. (1994), “Glacial geological evidence for the Medieval Warm Period”,
Climatic Change, 30, pp. 1-27.
GROVE J.M. & CONTERIO A. (1995), “The climate of Crete in the sixteenth and seventeenth
centuries”, Climatic Chan ge, 30, pp. 223-247
GROVE J.M. (2001), “The onset of the Little Ice Age”, in JONES P.D., OGILVIE A.E.J., DAVIES T.D. &
BRIFFA K.R. (eds.), History and Climate. memories of the future? New York, Boston, Dordrecht,
London, Moscow, Kluwer Academic/ Plenum Publishers, pp. 153-187.
GUNNARSON B.E. & LINDERHOLM H.W. (2002), “Low-frequency summer temperature variation in
central Sweden since the tenth century inferred from tree rings”, The Holocene, 12, pp. 667-673.
Historical climatology, 1950-2006
Belgeo, 3 | 2006
29

JAKUBOWSKI-TIESSEN M. (1992), Sturmflut 1717. Die Bewältigung einer Naturkatastrophe in der Frühen
Neuzeit, R. Oldenbourg Verlag München.
JELGERSMA S. (1992), “Vulnerability of coastal lowlands of the Netherlands to a future sea-level
rise”, in TOOLEY M.J. & JELGERSMA S. (1992), Impacts of sea-level rise on European coastal lowlands,
Blackwell, Oxford-Cambridge, pp. 94-124.
JONES P.D. & KELLY P.M. (1982), “Principal component analysis of the Lamb Classification of daily
weather types. Part 1. Annual frequencies”, Journal of Climatology, pp. 147-157.
JONES P.D., RAPER S.C.B., BRADLEY R.S., DIAZ H.F., KELLY P.M. & WIGLEY T.M.L. (1986),
“Northern Hemisphere surface air temperatures variations: 1851-1984”, Journal of Climate and
Applied Meteorology, 25, pp. 161-179.
JONES P.D., DAVIES T.D., LISTER D.H., SLOMOSK, V., JÓNSSON T., BARING L., JÖNSSON P.,
MAHERAS P., KOLYVA-MACHERA F., BARRIENDOS M., MARTIN-VIDE J., RODRIGUEZ R., ALCO ‐FODARO M.J., WANNER H., PFISTER C., LUTERBACHER J., RICKLI R., SCHUEPBACH E., KAAS E.,
SCHMITH T., JACOBEIT J. AND BECK C. (1999), “Monthly mean pressure reconstructions for
Europe for the 1780s-1995 period”, International Journal of Climatology, 19, pp. 347-364.
JONES P.D. & MANN M.E. (2004), “Climate over the past millennia”, Reviews of Geophysics 42,
American Geophysical Union, Paper number 2003RG2002/2004.
KELLY M.P., JONES P. & BRIFFA K. (1997), “Classifying the winds and weather”, in HULME M. &
BARROW E. (eds.), Climates of the British Isles, present, past and future, London-New York, pp. 153-173.
KEMPE M. (2003), “Noah’s Flood: The Genesis Story and Natural Disasters in Early Modern
Times”, Environment and History, 9, pp. 151-171.
KINGTON J. (1975a), “The construction of 500-milibar charts for the Eastern North Atlantic-
European sector from 1781”, Meteorological Magazine, 104, pp. 336-340.
KINGTON J. (1975b), “An analysis of the seasonal characteristics of 1781-84 and 1968-71 using
PSCM indices”, Weather, 30, 1, pp. 109-114.
KINGTON J. (1975c), “A comparison of British Isles weather type frequencies in the climatic
record from 1781 to 1971”, Weather, 30, pp. 21-24.
KINGTON J. (1980), “Searches for historical weather data: Appeals and responses”, Weather, 35,
pp. 124-134.
KINGTON J. (1997), “Observing and measuring the weather: A brief history”, in HULME M. &
BARROW E. (eds.), Climates of the British Isles, present, past and future, London and New York,
Routledge, pp. 135-153.
KOEK F.B. & KÖNNEN G.P. (2003), “CLIWOC-extends the pre-instrumental databases back in time
with quantitative data over the oceans”, Dealing with Diversity, Prague, 2nd International Conference of
the European Society for Environmental History, pp. 52-55.
KRAKER A.M.J. de (1997), Landschap uit balans. De invloed van de natuur, de economie en de politiek op
de ontwikkeling van de Vier Ambachten en het Land van Saeftinghe tussen 1488 en 1609. Utrecht.
Uitgeverij Matrijs.
KRAKER A.M.J. de (1999), “A method to assess the impact of high tides, storms and storm surges
as vital elements in climatic history. The case of stormy weather and dikes in the northern part
of Flanders, 1488 to 1609”, Climatic Change, 43, pp. 287-303.
Historical climatology, 1950-2006
Belgeo, 3 | 2006
30

KRAKER A.M.J. de (2a), “The oldest Dutch ship’s logs (1595-1610), their interest for climate
history in general and global climatic change in particular”, in MIKAMI T. (ed.), Proceedings of the
International Conference. Climate Change and Variability – Past, Present and Future - Tokyo, 13-17 Sept.
1999. Tokyo Metropolitan University, pp. 95-101.
KRAKER A.M.J. de (2b), “Storm surges, high tides and storms as extreme weather events, their
impact on the coastal zone of the North Sea and the human response, 1350 to 2””, in OBREBSKA-
STARKEL B. (ed.), Reconstructions of climate and its modelling. Millennium images and reconstructions of
weather and climate over the last millennium, Cracow. Institute of Geography of the Jagiellonian
University, pp. 85-101.
KRAKER A.M.J. de (2003), “Reconstructing winter temperatures between 1670 and 1730 in
Holland and Belgium by using written documents on shipping: new evidence and an old
methodology reconsidered”, Dealing with Diversity, Prague. 2nd International Conference of the
European Society for Environmental History, Abstract Book, pp. 46-47.
KRAKER A.M.J. de (2004), “Tithe records and the reconstruction of winter, spring and summer
temperatures in the Low Countries, 1600 to 1800, Abstract in Programme Book of: Fourth Annual
Meeting of the European Meteorological Society & 5th European Conference on Applied Climatology (ECAC),
Nice, France, 26-30 September.
KRAKER A.M.J. de (2005), “Reconstruction of Storm Frequency in the North Sea Area of the Pre-
industrial Period, 1400-1625 and the Connection with Reconstructed Time Series of
Temperatures”, History of Meteorology 2, pp. 51-69.
LAMB H.H. (1959), “The southern westerlies: a preliminary survey: main characteristics and
apparent associations”, Quarterly Journal of the Royal Meteorological Society, 85, 363, pp. 1-23.
LAMB H.H. (1961), “Atmospheric circulation, climate and climatic variations”, Geography, 46, pp. 208-222.
LAMB H.H. (1963), “What can we find out about the trend of our climate?”, Weather, 18, pp. 194-216.
LAMB H.H. (1965), “The early medieval warm epoch and its sequel”, Palaeogeography,
Palaeoclimatology, Palaeoeco logy, 1, pp. 13-37.
LAMB H.H. (1972), “British Isles weather types and a register of the daily sequence of circulation
patterns, 1861-1971”, Geographic al Memoirs, 116, H.M.S.O. London.
LAMB H.H. (1977), Climate: Present, Past and Future, Vol. 2. Climatic History and the Future, London,
Methuen.
LAMB H.H. (1979), “Climatic variation and changes in the wind and ocean circulation: The Little
Ice Age in the Northeast Atlantic”, Quaternary Research, 11, pp. 1-20.
LAMB H.H. (1980), “Climatic fluctuations in historical times and their connection with
transgressions of the sea, storm floods and other coastal changes”, in VERHULST A. AND
GOTTSCHALK M.K.E. (eds.), Transgressions and the history of settlement in the coastal areas of Holland
and Belgium, Proceedings Colloquium Gent 5-7 September 1978, pp. 251-285.
LAMB H.H. (1984), “Climate in the last thousand years: natural climatic fluctuations and change”,
in FLOHN H. & FANTESCHI R (eds.), The climate of Europe: Past, Present and Future. Dordrecht, D.
Reidel Publishing Company, pp. 25-64.
LAMB H.H. & Frydendahl, K. (1991), Historic storms of the North Sea, British Isles and Northwest
Europe, Cambridge University Press.
Historical climatology, 1950-2006
Belgeo, 3 | 2006
31

LAUSCHER F. (1985), “Beiträge zur Wetterchronik seit dem Mittelalter”, Sitzungsberichte mathem.-
naturw, Kl.-Abt. II, 194, pp. 93-131.
LENKE W. (1968), “Das Klima Ende des 16. und Anfang des 17. Jahrhunderts nach Beobachtungen
von Tycho de Brahe auf Hven, Leonhard III. Treuttwein in Fürstenfeld und David Fabricius in
Ostfriesland”, Berichte des Deutsche Wettersdiensten, 110, pp. 1-49.
LE ROY LADURIE E. (1959), “Histoire et climat”, Annales, Économies, Sociétés et Civilisations, pp. 3-34.
LE ROY LADURIE E. (1961), “Aspect historiques de la nouvelle climatologie”, Revue Historique, 85e,
vol. CCXXV, pp. 1-20.
LE ROY LADURIE E. (1967), “Le climat depuis l’an mil”, Paris, Champs-Flammarion, Reprinted in
1983 in 2 vols.
LE ROY LADURIE E. & BAULANT M. (1980), “Grape harvest from the fifteenth through the
nineteenth centuries”, Journal of Interdisciplinary History, X, pp. 839-849.
LE ROY LADURIE E. & GOY J. (1978), “La dîme et le reste, XIVe-XVIIIe siècles”, Revue Historique, 102,
vol. CCLX, pp. 123-142.
LE ROY LADURIE E. (2004), Histoire humaine et comparée du climat. Canicules et glaciers. XIIIe-XVIIIe
siècles. Paris, Fayard, Vol. 1.
LUTERBACHER J. (2001), “The Late Maunder Minimum (1675-1715), – Climax of the “Little Ice
Age” in Europe”, in JONES P.D., OGILVIE A.E.J., DAVIES T.D. & BRIFFA K.R. (eds.), History and
Climate. Memories of the Future?, New York, Boston, Dordrecht, London, Moscow. Kluwer
Academic/Plenum Publishers, pp. 29-55.
MANLEY G. (1952), “Thomas Barker’s Meteorological Journals, 1748-1763 and 1777-1789”,
Quaternary Journal of the Royal Meteorological Society, pp. 255-259.
MANLEY G. (1974), “Central England temperatures: monthly means 1659 to 1973”, Quaternary
Journal of the Royal Meteorological Society, 100, pp. 389-405.
MATTHES F.E. (1942), “Glaciers”, in MEINZER O.E. (ed.), Hydrology, New York, pp. 149-219.
MORTIMER R. (1981), “William Merle’s weather diary and the reliability of historical evidence for
medieval climate”, Climate Monitor, 10, 20, pp. 42-45.
MUNZAR J. (2003), “Floods and people in the Czech Republic: Loss of historical memory, in Dealing
with Diversity, Prague”, 2nd International Conference of the European Society for Environmental History,
pp. 55-59.
NORDLI P. Ø. (2001), “Reconstruction of the nineteenth century summer temperatures in Norway
by proxy data from farmers’ diaries”, Climatic Change, 48, pp. 201-218.
NORDLI P. Ø., LIE, O., NESSIE A. & DAHL S.O. (2003), “Spring-Summer temperature reconstruction
in western Norway 1734-2003: A data-synthesis approach”, International Journal of Climatology, 23,
pp. 1821-1841.
NORDLI P. Ø. (2004), Spring and summer temperatures in Trondelag 1701-2003, Meteorogical Report
from the Norwegian Meteorological Institute no. 05/2004 Climate.
O’ BRIEN S.R., MAYEWSKI P.A., MEEKER L.D., MEESE D.A., TWICKLER, M.S. & WHITLOW, S. (1995),
“Complexity of Holocene climate as reconstructed from a Greenland Ice Core”, Science, 270, pp. 1962-1964.
OLIVER J. & KINGTON J.A. (1970), “The usefulness of ships’ log-books in the synoptic analysis of
past climates”, Weather, 25, pp. 520-528.
Historical climatology, 1950-2006
Belgeo, 3 | 2006
32

PFISTER C. (1975), “Agrarkonjunktur und Witterungsverlauf im westlichen Schweizer Mittelland
1755-1797”, Geo gra phica Bernensia, G 2.
PFISTER C. (1977), “Zum Klima des Raumes Zürich im späten 17. und frühen 18. Jahrhundert”,
Vierteljahresschrift der Naturforschenden Gesellschaft Zürich, 122, 4, pp. 447-471.
PFISTER C. (1981), “Die Fluktionen der Weinmosterträge im schweizerischen Weinland vom 16.
bis ins frühe 19. Jahrhundert. Limatische Ursachen und sozioökonomische Bedeutung”, Schwei ze ‐rische Zietschrift für Geschichte, 31, pp. 136-173.
PFISTER C. (1985), Witterungsdaten CLIMHIST. Vol. 1: Schweiz 1525-1863, Bern.
PFISTER C. (1988), Klimageschichte der Schweiz, 1525-1860. Das Klima der Schweiz von 1525-1860 und
seine Bedeutung in der Geschichte von Bevö l kerung und Landwirtschaft, Bern/ Stuttgart, Academica
Helvetia 6.
PFISTER C. (1992), “Monthly temperature and precipitation in central Europe 1525-1979,
quantifying documentary evidence on weather and its effects”, in BRADLEY R.S., JONES P.D.
(eds.), Climate since A.D. 1500. London/New York, Routledge, pp. 118-142.
PFISTER C. (1999a), Weighted temperature and precipitation indices for Switzerland in 1496-1622, Bern.
PFISTER C. (1999b), Wetternachhersage. 500 Jahre Klimavariationen und Naturkatastrophen (1496-1995),
Bern/ Stutt gart/Wien.
PFISTER C., KINGTON J., KLEINLOGEL G., SCHÜLE H. & SIFFERT E. (1994), “High resolution spatio
temporal reconstructions of past climate from direct meteorological observations and proxy
data”, in FRENZEL B., PFISTER C. & GLÄSER B. (eds.), Climatic trends and anomalies in Europe
1675-1715. High resolution spatio-temporal reconstructions from direct meteorological observations and
proxy data. Methods and results. Stuttgart-Jena-New York. Gustav Fischer Verlag, pp. 329-375.
PFISTER C. & BRÁZDIL R. (1999a), “Climatic variability in sixteenth century Europe and its social
dimension: A synthesis”, Climatic Change, 43, pp. 5-55.
PFISTER C., BRÁZDIL R., GLASER G., BARRIENDOS M., CAMUFF, D., DEUTSCH M., DOBROVOLNY P.,
ENZI S., GUIDOBONI E., KOTYZA O., MILITZER E., RÁCZ L. & RODRIGO F.S. (1999b), “Documentary
evidence on climate in sixteenth century Europe”, Climatic Change, 43, pp. 55-100.
POLIWODA G.N. (2003), “Disaster management and the social response to catastrophic floods. The
example of Saxony (1784-1845)”, Dealing with Diversity, Prague. 2nd International Conference of the
European Society for Environmental History, Abstract Book, 103.
PORTER S.C. (1986), “Pattern and forcing of Northern Hemisphere glacier variations during the
last millennium”, Quaternary Research, 28, pp. 27-48.
POST J.D. (1984), “Climate variability and the European mortality wave of the early 1740s”, Journal
of Interdisciplinary History, 15, pp. 1-30.
POST J.D. (1985), Food shortage, climatic variability, and epidemic disease in preindustrial Europe. The
mortality peak in the early 1740s, Ithaca, London, Cornel University Press.
RODRIGO P.S., ESTABAN-PARRA M.J. & CASTRO-DIEZ Y. (1994), “An attempt to reconstruct the
rainfall regime of Andalusia (Southern Spain), from 1601 A.D. to 1650 A.D. using historical
documents”, Climatic Change, 27, pp. 397-418.
ROHDE H. (1977), “Sturmfluthöhen und säkularer Wasserstandsanstieg an der deutschen
Nordseeküste, Die Küste”, Archiv für Forschung und Technik an der Nord- und Ostsee, Heft 30, pp. 53-143.
Historical climatology, 1950-2006
Belgeo, 3 | 2006
33
ROHR C. (2003), “Living with the calculable disaster on the perception, interpretation and
management of floods of the Danube river (13th-16th c.)”, Dealing with Diversity, Prague. 2nd
International Conference of the European Society for Environmental History, Abstract Book, pp. 108-109.
ROWE M. (1988), “The storm of 16th October 1787 and a brief comparison with three other
historic gales in southern England (1362, 1662, 1703)”, Journal of Meteorology, 13, pp. 149-155.
RUTISHAUSER T., LUTERBACHER J., PFISTER C. & WANNER H. (2004) “Plant phenological
observations in Switzerland and their potential for climate reconstruction”, Abstract in
Programme Book of: Fourth Annual Meeting of the European Meteorological Society & 5th European
Conference on Applied Climatology (ECAC), Nice, France, 26-30 September .
SCHÜLE H. (1994), “Data handling and process structure in the EURO CLIMHIST Data Bank”, in
BURKHARD F., PFISTER C. & GLÄSER B. (eds.), Climatic trends and anomalies in Europe 1675-1715. High
resolution spatio-temporal reconstructions from direct meteorological observations and proxy data.
Methods and results, Stuttgart-Jena-New York, Gustav Fisher Verlag, pp. 425-461.
SCHÜLE H. & PFISTER, C. (1994), “Coding climate proxy information for the EURO-CLIMHIST Data
Base, revised version (Summer 1993)”, in BURKHARD F., PFISTER C. & GLÄSER B. (eds.), Climatic
trends and anomalies in Europe 1675-1715. High resolution spatio-temporal reconstructions from direct
meteorological observations and proxy data. Methods and results, Stuttgart-Jena-New York, Gustav
Fisher Verlag, pp. 461-477.
SCHWARZ-ZANETTI W. & SCHWARZ-ZANETTI G. (1992), “Simultaneous weather diaries – A
unique body of evidence for reconstructing the climate history of Southern Germany from 1480
to 153”0, in BURKHARD F., PFISTER C. & GLÄSER B. (eds.), Climatic trends and anomalies in Europe
1675-1715. High resolution spatio-temporal reconstructions from direct meteorological observations and
proxy data. Methods and results, Stuttgart-Jena-New York, Gustav Fisher Verlag, pp. 33-43.
SHABALOVA M.V. & ENGELEN A.F.V. van (2003), “Evaluation of a reconstruction of winter and
summer temperatures in the Low Countries, AD 764-1998”, Climatic Change, 58, pp. 219-242.
SLAGER K. (2003), De ramp. Een reconstructie van de watersnood van 1953, Uitgeverij Atlas –
Amsterdam/ Antwerpen.
STANGL H. (2003), “Historical floods in the Dutch Rhine Delta”, Dealing with Diversity, Prague. 2nd
International Conference of the European Society for Environmental History, Abstract Book, pp. 118-119.
STORCH H. VON, ZORITA E. & CU BASCH (1993), Changing statistics of storms in the North Atlantic?,
MPI rep. 116.
STORCH H. VON & REICHARDT H. (1997), “A scenario of storm surge statistics for the German
Bight at the expected time of doubled atmospheric carbon dioxide concentration”, Journal of
Climate, 10, pp. 2653-2662.
STUBER M. (2003), “Divine punishment or object of research? The resonance of earthquakes,
floods, Epidemics and famine in the correspondence network of Albrecht von Haller”,
Environment and History, 9, pp. 173-193.
TARAND A. & KUIV P. (1994), “The beginning of the rye harvest - a proxy indicator of summer
climate in the Baltic Area”, in BURKHARDT F., PFISTER C. & GLÄSER B. (eds.), Climatic trends and
anomalies in Europe 1675-1715. High resolution spatio-temporal reconstructions from direct meteorological
observations and proxy data. Methods and results, Stuttgart-Jena-New York, Gustav Fisscher Verlag,
pp. 61-73.
TAVENIER R. (1948), “De jongste geologische geschiedenis der Vlaamse kustvlakte”, Handelingen
der Maatschappij voor Geschiedenis en Oudheidkunde te Gent, Nieuwe Reeks, 2, pp. 107-115.
Historical climatology, 1950-2006
Belgeo, 3 | 2006
34

TITOW J.Z. (1960), “Evidence of weather in the account rolls of the Bishopric of Winchester,
1209-135”0, Economic History Review, 2nd series, vol. 12, pp. 360-407.
UTTERSTRÖM G. (1955), “Climatic fluctuations and population problems in early modern
history”, Scandinavian Economic History Review, 3, 1, pp. 3-47.
VANDERLINDEN E. (1924), “Chronique des Evénéments Météorologiques en Belgique jusqu’en
1834”, Brussels.
VERBRUGGEN C., DENYS L. & KIDEN P. (1991), “Paleo-econologische en geomorfologische evolutie
van Laag- en Midden België tijdens het Laat-Kwartair”, De Aardrijkskunde, pp. 357-376.
VERHULST A. & GOTTSCHALK M.K.E. (1980), Transgressions and the history of settlement in the coastal
areas of Holland and Belgium, Proceedings Colloquium Gent 5-7 September 1978.
VRIES J. de (1977), “Histoire du climat et économie: des faits nouveaux, une interprétation
différente”, Annales, Économies, Sociétés et Cultures, 32, pp. 198-226.
VRIES J. de (1980), “Measuring the impact of Climate on History: The search for appropriate
methodologies”, Journal of Interdisciplinary History, X, pp. 599-630.
VRIES K. DE & WINSEMIUS J.P. (1970), De Allerheiligenvloed van 1570, Leeuwarden, Miedema Pers.
WALES-SMITH B.G. (1971), “Monthly and annual totals of rain-fall representative of Kew, Surrey,
from 1697 to 197”0, Meteo rological Magazine, 100, pp. 345-362.
WALES-SMITH B.G. (1973), “An analysis of monthly rainfall totals representative of Kew, Sury
from 1697 to 197”0, Meteorological Magazine, 102, pp. 157-171.
WEE H. van der (1963), The growth of the Antwerp market and the European Economy (14th-16th century),
The Hague, 3 vols.
WEIKINN C. (1958-1961), Quellentexte zur Witterungsgeschichte Europas von der Zeitwende bis zum
Jahre 1850. Quellensammlung zur Hydrolographie und Meteorologie, Berlin, 3 vols.
WHEELER D.A. (1988), “Sailing ships’ logs as weather records: A test case”, Journal of Meteorology,
13, pp. 122-125.
WHEELER D.A., GARCIA HERRERA R., DEL ROSARIO PRIETO M., KOEK F., KÖNNEN G. & JONES P.
(2004), “Naval logbooks in pre-instrumental climatic reconstructions: source verification and
results”, Abstract in Programme Book of: Fourth Annual Meeting of the European Meteorological Society &
5th European Conference on Applied Climatology (ECAC), Nice, France, 26-30 September.
WHEELER D.A. (2005), “British Naval Logbooks from the Late Seventeenth Century: New climatic
information from old sources”, History of Meteorology, 2, pp. 133-145
WIGLEY T.M.L. & ATKINS T.C. (1977), “Dry years in south-east England since 1698", Nature, 265,
pp. 431-434.
ABSTRACTS
This article presents an overview of the development of historical climatology during the past 50
years and how this discipline has contributed to a better understanding of past, present and
future climate change. It not only shows how historical climatology has evolved from mainly the
social sciences as a special field of research and how it operates, but also how it has spread
among institutes, universities and meteorological services throughout Europe.
Historical climatology studies written sources providing indirect information on weather
Historical climatology, 1950-2006
Belgeo, 3 | 2006
35

conditions, ranging from rainfall, temperatures and air pressure to extreme weather events.
Discussing the wide range of written sources, it is explained what kind of a climate signal they
provide and how historical climatology has used this indirect climate information or proxy data
by developing a methodology of its own, which aims to transfer the proxy data into
reconstructed temperatures, rainfall and air pressure time series. Then the contribution of
historical climatology to a better understanding of climate variability and its impact of the
recent millennium will be discussed by showing the results reached so far. In this respect the
paper strongly focuses on temperature change which occurred during the Little Ice Age and in
particular the Maunder Minimum and weather extremes such as storm surges and their impact.
Finally, perspectives for further research are discussed by focusing on the Low Countries.
Cet article examine le développement de la climatologie historique au cours du dernier demi-
siècle et montre comment elle a permis de mieux appréhender les changements climatiques
passés, présents et futurs. Outre son fonctionnement, l’article montre comment cette discipline
s’est développée à partir des sciences sociales pour devenir un domaine spécifique de recherche,
et comment elle s’est propagée parmi les instituts, universités et services météorologiques à
travers l’Europe.
La climatologie historique étudie les sources écrites fournissant une information indirecte sur les
conditions météorologiques, depuis le niveau des précipitations, la température et la pression
atmosphérique jusqu’aux événements climatiques extrêmes. L’examen des multiples sources
écrites permet de savoir quel type de signal climatique est fourni et comment la climatologie
historique a utilisé ces informations indirectes en développant sa propre méthodologie visant à
transformer ces indications en séries temporelles de reconstruction des températures,
précipitations et pression atmosphérique.
Nous verrons ensuite comment la climatologie historique a contribué à mieux appréhender la
question de la variabilité du climat durant le dernier millénaire en présentant les résultats
atteints jusqu’ici. A cet égard, l’article est fortement centré sur le changement de température
intervenu au cours du Petit âge glaciaire, en particulier le Minimum de Maunder et les
événements climatiques extrêmes comme les ondes de tempête et leur impact.
Enfin, nous aborderons les perspectives de recherche aux Pays-Bas.
INDEX
Keywords: Belgium, climatic change, climate impact, climate reconstruction, historical
climatology, instrumental weather data, Little Ice Age, Medieval Warm Epoch, proxy data, storm
surges, The Netherlands, weather extremes, written sources
Mots-clés: Belgique, changement climatique, impact climatique, reconstruction climatique,
climatologie historique, données climatiques instrumentales, Petit âge glaciaire, Période
médiévale chaude, indicateurs, ondes de tempête, Pays-Bas, événements climatiques extrêmes,
sources écrites
AUTHOR
ADRIAAN M.J. DE KRAKER
Vrije Universiteit Amsterdam, [email protected]
Historical climatology, 1950-2006
Belgeo, 3 | 2006
36