Historical and Potential Reserve Growth in Oil and Gas...
20
Saskatchewan Geological Survey 1 Summary of Investigations 2004, Volume 1 Historical and Potential Reserve Growth in Oil and Gas Pools in Saskatchewan Mahendra K. Verma 1 and Mitchell E. Henry 1 Verma, M.K. and Henry, M.E. (2004): Historical and potential reserve growth in oil and gas pools in Saskatchewan; in Summary of Investigations 2004, Volume 1, Saskatchewan Geological Survey, Sask. Industry Resources, Misc. Rep. 2004-4.1, CD-ROM, Paper A-1, 20p. Abstract Reserve growth – a concept that is recognized as one of the major contributors to estimates of additional hydrocarbon reserves around the world, particularly in fields in mature petroleum provinces – was evaluated for oil and gas at both the pool and field levels in Saskatchewan. Of the known 648 oil pools and 175 gas pools in the region, 256 oil pools and 51 gas pools were chosen for reserve-growth analysis based on their adequate reserve data. Despite the low average oil-recovery factor (about 15%) in Saskatchewan pools, there is a reserve growth of 4.9 to 5.6% per year, depending on the method used for estimating the growth. Of the 51 gas pools, 45 are nonassociated and six are associated. They have average recovery factors of about 70%. Reserves in nonassociated gas pools grew by about 4.7% per year, whereas associated pools showed no growth. Models based on the Modified Arrington and the Group Growth methods – whereby the recoverable hydrocarbon volumes of pools with a certain minimum growth period are summed by year starting from the first production year, and then cumulative growth is determined – show fairly similar results for potential additional hydrocarbon volumes, which are expected over the next five-, 10-, and 15-year periods, beginning with 2001. At the end of years 2006, 2011 and 2016, increases in oil reserves of 0.4 to 0.5, 0.7 to 0.8, and 0.9 to 1.2 billion barrels (58.4 to 72.9, 106.9 to 134.7, and 149.7 to 190.0 x 10 6 cubic metres, m 3 ) and gas reserves of 0.9 to 1.0, 1.8 to 2.0, and 2.7 to 3.0 trillion cubic feet (26.0 to 28.4, 51.8 to 56.8, and 77.6 to 85.2 x 10 9 m 3 ), respectively, are expected to be added, assuming that current economic and operating conditions prevail. Keywords: reserve growth, field growth, oil and gas pools. 1. Introduction Reserve (or field) growth is the increase in successive estimates of recoverable crude oil, natural gas, and natural gas liquids (Klett and Gautier, 2003) in discovered accumulations. The recoverable hydrocarbon volumes include cumulative production plus proved reserves (i.e., remaining reserves). In this study, reserve-growth definition has been extended to: 1) pools (a pool is defined as “A porous and permeable underground rock formation that contains a natural accumulation of crude oil or natural gas and related substances, or combinations of them, that is confined by impermeable rock or water barrier, and that is individual and separate from other reservoirs”, Canadian Gas Potential Committee (CGPC), 2001); and 2) fields (a field is defined as “A geographically defined area in which accumulations of crude oil, natural gas, and related substances occur”, CGPC, 2001). Pools in Saskatchewan are generally equivalent to what are termed reservoirs in the U.S. and other countries. Reserve growth has been observed in almost all fields or provinces, but most notably in mature petroleum provinces, like many in the U.S., where it has contributed substantial additional reserves over the last two decades. Many papers have been published on the reserve growth for oil and gas fields in the U.S. (Attanasi and Root, 1994; Root et al., 1995; Lore et al., 1996; Schmoker and Attanasi, 1997; Klett and Gautier, 2003), North Sea (Sem and Ellerman, 1999; Watkins, 2000), and the former Soviet Union (Verma et al., 2001; Verma and Ulmishek, 2003). Odell (2001) has pointed out the importance and realities of reserve growth globally. Because no known studies on reserve growth in Canadian oil and gas pools have been published, Saskatchewan was selected for such an analysis on the basis of its generally well-kept, long historical records, which offered an excellent opportunity to study reserve growth both at pool and field levels. The primary objective was to study reserve growth using both the Modified Arrington and the Group Growth methods and to develop models for forecasting additional hydrocarbon proved reserves in the province. 1 U.S. Geological Survey, Box 25046 MS 939, Denver Federal Center, Denver, CO 80225.
Transcript of Historical and Potential Reserve Growth in Oil and Gas...

Saskatchewan Geological Survey 1 Summary of Investigations 2004, Volume 1
Historical and Potential Reserve Growth in Oil and Gas Pools in Saskatchewan
Mahendra K. Verma 1 and Mitchell E. Henry 1
Verma, M.K. and Henry, M.E. (2004): Historical and potential reserve growth in oil and gas pools in Saskatchewan; in Summary of Investigations 2004, Volume 1, Saskatchewan Geological Survey, Sask. Industry Resources, Misc. Rep. 2004-4.1, CD-ROM, Paper A-1, 20p.
Abstract Reserve growth – a concept that is recognized as one of the major contributors to estimates of additional hydrocarbon reserves around the world, particularly in fields in mature petroleum provinces – was evaluated for oil and gas at both the pool and field levels in Saskatchewan. Of the known 648 oil pools and 175 gas pools in the region, 256 oil pools and 51 gas pools were chosen for reserve-growth analysis based on their adequate reserve data. Despite the low average oil-recovery factor (about 15%) in Saskatchewan pools, there is a reserve growth of 4.9 to 5.6% per year, depending on the method used for estimating the growth. Of the 51 gas pools, 45 are nonassociated and six are associated. They have average recovery factors of about 70%. Reserves in nonassociated gas pools grew by about 4.7% per year, whereas associated pools showed no growth.
Models based on the Modified Arrington and the Group Growth methods – whereby the recoverable hydrocarbon volumes of pools with a certain minimum growth period are summed by year starting from the first production year, and then cumulative growth is determined – show fairly similar results for potential additional hydrocarbon volumes, which are expected over the next five-, 10-, and 15-year periods, beginning with 2001. At the end of years 2006, 2011 and 2016, increases in oil reserves of 0.4 to 0.5, 0.7 to 0.8, and 0.9 to 1.2 billion barrels (58.4 to 72.9, 106.9 to 134.7, and 149.7 to 190.0 x 10⁶ cubic metres, m3) and gas reserves of 0.9 to 1.0, 1.8 to 2.0, and 2.7 to 3.0 trillion cubic feet (26.0 to 28.4, 51.8 to 56.8, and 77.6 to 85.2 x 10⁹ m3), respectively, are expected to be added, assuming that current economic and operating conditions prevail.
Keywords: reserve growth, field growth, oil and gas pools.
1. Introduction Reserve (or field) growth is the increase in successive estimates of recoverable crude oil, natural gas, and natural gas liquids (Klett and Gautier, 2003) in discovered accumulations. The recoverable hydrocarbon volumes include cumulative production plus proved reserves (i.e., remaining reserves). In this study, reserve-growth definition has been extended to: 1) pools (a pool is defined as “A porous and permeable underground rock formation that contains a natural accumulation of crude oil or natural gas and related substances, or combinations of them, that is confined by impermeable rock or water barrier, and that is individual and separate from other reservoirs”, Canadian Gas Potential Committee (CGPC), 2001); and 2) fields (a field is defined as “A geographically defined area in which accumulations of crude oil, natural gas, and related substances occur”, CGPC, 2001). Pools in Saskatchewan are generally equivalent to what are termed reservoirs in the U.S. and other countries.
Reserve growth has been observed in almost all fields or provinces, but most notably in mature petroleum provinces, like many in the U.S., where it has contributed substantial additional reserves over the last two decades. Many papers have been published on the reserve growth for oil and gas fields in the U.S. (Attanasi and Root, 1994; Root et al., 1995; Lore et al., 1996; Schmoker and Attanasi, 1997; Klett and Gautier, 2003), North Sea (Sem and Ellerman, 1999; Watkins, 2000), and the former Soviet Union (Verma et al., 2001; Verma and Ulmishek, 2003). Odell (2001) has pointed out the importance and realities of reserve growth globally. Because no known studies on reserve growth in Canadian oil and gas pools have been published, Saskatchewan was selected for such an analysis on the basis of its generally well-kept, long historical records, which offered an excellent opportunity to study reserve growth both at pool and field levels. The primary objective was to study reserve growth using both the Modified Arrington and the Group Growth methods and to develop models for forecasting additional hydrocarbon proved reserves in the province.
1 U.S. Geological Survey, Box 25046 MS 939, Denver Federal Center, Denver, CO 80225.
Saskatchewan Geological Survey 2 Summary of Investigations 2004, Volume 1
Although reserve growth on individual pool or field levels may be either positive or negative, the growth of reserves within a country or petroleum province is generally positive, and provides a means for estimating future potential reserves. An evaluation of reserve growth, however, is complex, being affected not only by geological, reservoir, and engineering factors, but also by local laws and policies that control exploration, reserve reporting, and field-development activities. In the present study, geological and reservoir aspects of reserve growth, such as oil type, pool size, and porosity, were investigated. Also, reserve growth was evaluated at both pool and field levels to provide more representative reserve-growth model(s) for Saskatchewan oil pools in the near future.
2. Methodology The Petroleum and Natural Gas Division of Saskatchewan Industry and Resources provided the data for this study. Although efforts were made to retain all of the original data to facilitate crosschecking, several new columns were added to the database for three reasons: 1) to report all the data in one common reporting unit, which was necessary because of the change in units of various parameters – in North American oil-field units prior to 1978 and in metric units from 1978 through 2001; 2) to modify names of pools and reservoir beds to bring consistency in names and continuity of data sequences; and 3) to allow efficient data management.
Reserve growth was estimated using two different approaches: 1) the Modified Arrington method (Verma, in press), and 2) the Group Growth method, which requires summing by year since first production the recoverable reserve volumes of pools with a certain minimum growth period in each individual group of pools. The latter method was found to be useful if data were available from only a limited number of fields, as was the case in the study on the Volga-Ural and West Siberian basins of the former Soviet Union (Verma et al., 2001; Verma and Ulmishek, 2003). However, the number of pools for study in Saskatchewan is neither too large nor too small for reserve-growth analysis, therefore allowing the application of the above two methods and providing an excellent opportunity to compare their respective results for validation.
For the Modified Arrington method, annual growth factors (AGFs) were calculated based on utilizing recoverable reserve volumes of all pools or fields discovered as recently as 2000. The Group Growth method, first used in the evaluation of reserve growth in the two petroleum basins of the former Soviet Union, requires the data to be organized for individual pools or fields starting from a common reference point, which was either the discovery year, as in the U.S., or the first reserve-reporting/production year, as was the case in the former Soviet Union. For the Saskatchewan reserve-growth study, the first production year was used as the basis for the pool’s age (note that the time between the discovery year and the first production year ranges from zero to 23 years for individual pools).
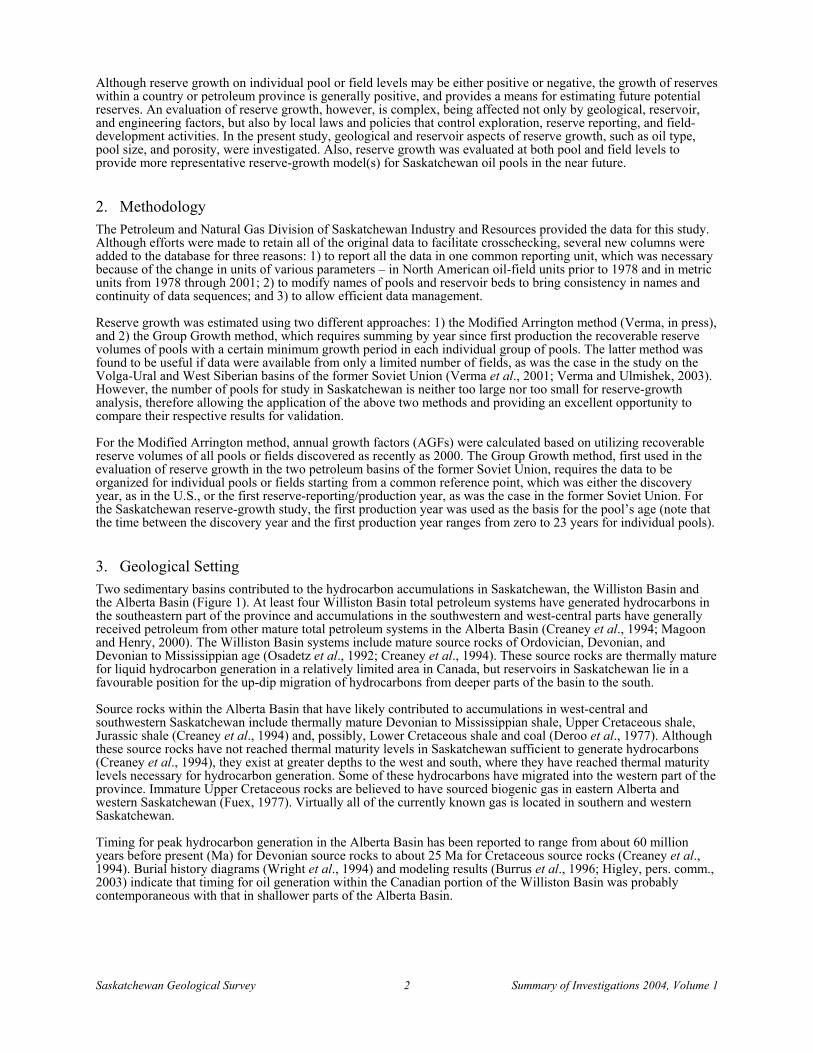
3. Geological Setting Two sedimentary basins contributed to the hydrocarbon accumulations in Saskatchewan, the Williston Basin and the Alberta Basin (Figure 1). At least four Williston Basin total petroleum systems have generated hydrocarbons in the southeastern part of the province and accumulations in the southwestern and west-central parts have generally received petroleum from other mature total petroleum systems in the Alberta Basin (Creaney et al., 1994; Magoon and Henry, 2000). The Williston Basin systems include mature source rocks of Ordovician, Devonian, and Devonian to Mississippian age (Osadetz et al., 1992; Creaney et al., 1994). These source rocks are thermally mature for liquid hydrocarbon generation in a relatively limited area in Canada, but reservoirs in Saskatchewan lie in a favourable position for the up-dip migration of hydrocarbons from deeper parts of the basin to the south.
Source rocks within the Alberta Basin that have likely contributed to accumulations in west-central and southwestern Saskatchewan include thermally mature Devonian to Mississippian shale, Upper Cretaceous shale, Jurassic shale (Creaney et al., 1994) and, possibly, Lower Cretaceous shale and coal (Deroo et al., 1977). Although these source rocks have not reached thermal maturity levels in Saskatchewan sufficient to generate hydrocarbons (Creaney et al., 1994), they exist at greater depths to the west and south, where they have reached thermal maturity levels necessary for hydrocarbon generation. Some of these hydrocarbons have migrated into the western part of the province. Immature Upper Cretaceous rocks are believed to have sourced biogenic gas in eastern Alberta and western Saskatchewan (Fuex, 1977). Virtually all of the currently known gas is located in southern and western Saskatchewan.
Timing for peak hydrocarbon generation in the Alberta Basin has been reported to range from about 60 million years before present (Ma) for Devonian source rocks to about 25 Ma for Cretaceous source rocks (Creaney et al., 1994). Burial history diagrams (Wright et al., 1994) and modeling results (Burrus et al., 1996; Higley, pers. comm., 2003) indicate that timing for oil generation within the Canadian portion of the Williston Basin was probably contemporaneous with that in shallower parts of the Alberta Basin.
Saskatchewan Geological Survey 3 Summary of Investigations 2004, Volume 1
Figure 1 - Map showing oil and gas pools and the four production areas in Saskatchewan. Red shading represents gas pools and green shading represents oil pools. Pool type and locations are from digital spatial data files from Saskatchewan Energy and Mines (2001). Digital file for area boundary lines was created from a map by Saskatchewan Energy and Mines (1985).
116°00’00" 115°00’00" 114°00’00" 113°00’00" 112°00’00" 111°00’00" 110°00’00" 109°00’00" 108°00’00" 107°00’00" 106°00’00"105°00’00" 104°00’00"
103°00’00"102°00’00"
101°00’00"100°00’00"
49°00’00"
50°00’00"
51°00’00"
52°00’00"
53°00’00"
54°00’00"
55°00’00"
56°00’00"
57°00’00"
58°00’00"
ALBERTA
AREA I
AREA II
AREA III
AREA IV
SASKATCHEWAN
MAN
ITOBA
(gas and heavy oil)
(gas and heavy and light oil)
(gas and medium oil)
WILLISTON BASINFORELAND FOLD
AND THRUST BELT
ALBERTA BASIN
SASKATCHEWANMANITOBA
ALBERTABRITISHCOLUMBIA
WILLISTON BASIN PROVINCE(CANADIAN PART)
ALBERTA BASIN PROVINCE
FORELAND FOLD AND THRUST BELT PROVINCECANADAUSA
CANADAUSA
STUDY AREA
(medium and light oil)
0 100 200 Miles
0 100 200 300 Kilometres

Saskatchewan Geological Survey 4 Summary of Investigations 2004, Volume 1
A generalized stratigraphic chart showing the major source and reservoir rocks in southern Saskatchewan is shown in Figure 2. The reported oil-in-place and proved oil reserves as of 2001 for all pools in Saskatchewan are shown by age of reservoir rocks in Figure 3. The largest volume of the proved oil reserves, about 45% of the total reserves in the province, are located in Lower Carboniferous carbonate reservoirs, followed by about 32% in Lower Cretaceous sandstone reservoirs, and about 17% in Jurassic sandstone reservoirs. The remaining 6% of Saskatchewan’s oil reserves are in Ordovician, Devonian to Mississippian, and Upper Cretaceous rocks.
In contrast to the distribution of proved reserves, about 51% of the approximately 34 billion barrels of the oil-in-place (OIP) in Saskatchewan is in Lower Cretaceous rocks, followed by 30% in Lower Carboniferous rocks. Of the remaining 19% of Saskatchewan’s OIP, Jurassic rocks account for about 9%, and Devonian to Mississippian rocks hold about 7%. Cretaceous oil pools in west-central Saskatchewan generally contain heavy oil (≤20°API or ≥0.93 g/cm3), which accounts for their relatively low average recovery factor of about 9%. These pools are generally shallow and contain oil that has probably been altered by processes similar to those suggested by Deroo et al. (1977) for heavy oils in eastern Alberta. Based on the data in Figure 3, the average recovery factors for Lower Carboniferous and Jurassic oil pools are 22% and 28%, respectively.
4. Proved Reserves of Saskatchewan
According to the Society of Petroleum Engineers (SPE) and World Petroleum Congress (WPC), proved reserves are defined as those quantities of petroleum which, by analysis of geological and engineering data, can be estimated with reasonable certainty to be commercially recoverable, from a given date forward, from known reservoirs and pools and under current economic conditions, operating methods, and government regulations (McMichael, 2001). According to this definition, proved reserves do not include cumulative production. The recoverable reserves in Saskatchewan have increased from 309 to 4926 million barrels of oil (MMBO) (49.1 to 783.2 x 10⁶ m3) (Figure 4) and from
Figure 2 - Generalized stratigraphic chart for southern Saskatchewan (adapted from the Stratigraphic Correlation Chart, Saskatchewan Industry and Resources (2004)).
++ ++ +
SECOND WHITE SPECKS
MEDICINE HATFIRST WHITE SPECKLED SHALE
CARLILE
ALDERSON(MILK RIVER)
FOREMOST
BE
LLY
RIV
ER
(JU
DIT
H R
IVE
R)
LEA PARK
?
?
CYPRESS HILLS
WOOD MOUNTAIN
NIOBRARA
RIBSTONE CREEK
GLACIAL DRIFT
OLDMAN
BEARPAW
EASTEND
WHITEMUD
BATTLE
FRENCHMAN
RAVENSCRAG
SWIFT CURRENT
SOUTHERN SASKATCHEWAN
SHAUNAVON
GRAVELBOURG
JOLI FOU
VIKING
FISH SCALES
BELLE FOURCHE
WESTGATE
CO
LO
RA
DO
GR
OU
PV
AN
GU
AR
D
ROSERAY
RUSH LAKE
MA
NN
VIL
LE
CA
NT
UA
R ATLAS
DIMMOCK CREEK
McCLOUD
PENSE
RIERDON
MASEFIELD
UPPER WATROUS
SUCCESS S2
CHARLES
MISSIONCANYON
LODGEPOLE
POPLAR
RATCLIFFE
MIDALE
TILSTON
SOURIS VALLEY
FROBISHERALIDA
KISBEY
MA
DIS
ON
GR
OU
P
BIG SNOWYGROUP KIBBEY
DEADWOOD
WINNIPEG
HERALDSTONY MOUNTAIN
INTERLAKE
MANITOBAGROUP
ELKPOINT
GROUPASHERN
SOURIS RIVER
SASKATCHEWANGROUP DUPEROW
BIRDBEAR
PRAIRIEEVAPORITEWINNIPEGOSIS
DAWSON BAYST1 RED BED
ND2 RED BED
BAKKEN
PRECAMBRIAN
STONEWALL
BIG VALLEYTORQUAY
THREEFORKSGROUP
SUCCESS S1
LOWER WATROUS
SERIESERA SYSTEM
QUATERNARY
CE
NO
ZO
IC
TE
RT
IAR
Y
ME
SO
ZO
IC
CR
ETA
CE
OU
S
UP
PE
R C
RE
TA
CE
OU
SL
OW
ER
CR
ETA
CE
OU
S
JU
RA
SS
IC
UPPERJURASSIC
MIDDLEJURASSIC
LOWER JURASSIC
TRIASSIC
PERMIANPENNSYLVANIAN
NEOGENE
PALEOGENE
UPPERTRIASSICMIDDLE
TRIASSICLOWER
TRIASSIC
PA
LE
OZ
OIC
MIS
SIS
SIP
PIA
N
UPPERDEVONIAN
DE
VO
NIA
N
MIDDLEDEVONIAN
LOWERDEVONIAN
SILURIAN
OR
DO
VIC
IAN
UPPERSILURIAN
LOWERSILURIAN
UPPERORDOVICIAN
MIDDLEORDOVICIAN
LOWERORDOVICIAN
MIDDLECAMBRIAN
CAMBRIANUPPER
CAMBRIAN
PRECAMBRIAN
BIG
HO
RN
GR
OU
P
CA
RB
ON
IFE
RO
US
MILK RIVER
?
?
YEOMAN
Important source rock interval
Probable source for biogenic gas
Major reservoir-bearing interval
UNCONFORMITIES
+ +
SANDSTONE
SHALE
CARBONATE
EVAPORITE
GLACIAL DRIFT
PRECAMBRIAN
RED BEDS

Saskatchewan Geological Survey 5 Summary of Investigations 2004, Volume 1
Figure 3 - Bar chart showing distribution of oil-in-place (red bar) and oil reserves (blue bar), in Saskatchewan by age of reservoir rocks. The Lower Cretaceous reservoirs generally contain heavy oil and the largest amount (51%) of the oil-in-place.
409 to 6865 billion cubic feet of gas (BCFG) (11.6 to 194.4 x 10⁹ m3 of gas) (Figure 5) over a 48-year period (1954 to 2001). Figure 4 shows the OIP, recoverable reserves, and average recovery by year for all pools in Saskatchewan; as indicated, oil recovery has averaged around 22% prior to 1977 and 15% in the last 15 years. Similarly, Figure 5 shows the gas-in-place (GIP), recoverable gas reserves, and average recovery by year. Gas recovery was as high as 79% in earlier years but has averaged around 69% since 1990. These increases in oil and gas recoverable reserves in Saskatchewan pools include contributions from new discoveries as well as from reserve growth.
5. Pool-selection Criteria for Group Growth Method For reserve-growth analysis, total reserve data have been organized by year starting from the first production year. In Saskatchewan, the following criteria were used to select the pools for the reserve-growth analysis:
1) Pools with at least 11 years of proved reserve data as well as cumulative production data, giving ten years of growth values.
2) Recoverable reserve data must extend into 2001. 3) Cumulative production is the only form of production data consistently available by years and has therefore
been used to define the first production year. The first production year was defined only when the cumulative production at the end of the first year was: a) less than or equal to half of the cumulative production at the end of the second year, or b) was less than 10% of the depletion rate (ratio of annual production to the known reserves), if the cumulative production at the end of the first year was more than half of the cumulative production at the end of the second year.
Application of these criteria resulted in decreasing the total number of pools included in this analysis from 648 to 256 for oil and from 175 to 51 for gas. These pools represent 70.3% of Saskatchewan’s recoverable oil reserves and 61.9% of its recoverable gas reserves. Of the 51 gas pools, 45 were nonassociated and six were associated.
6. Analysis and Results Reserve growth for oil and gas pools was estimated using both the Modified Arrington and Group Growth methods. For the Group Growth method, the total proved reserves data were organized by pool and by the first reserve-reporting year as well as by each subsequent reporting year (or data year). Because each pool has a different length
0
2,000
4,000
6,000
8,000
10,000
12,000
14,000
16,000
18,000
20,000
1 2 3 4 5
Age of reservoir rocks
Rec
over
able
oil
rese
rves
(milli
ons
of b
arre
ls)
Early Cretaceous
Jurassic EarlyCarboniferous
Devonian- Mississippian
Other
Oil in-place
Proved oil reserves

Saskatchewan Geological Survey 6 Summary of Investigations 2004, Volume 1
Figure 4 - Plot showing oil-in-place (red line), proved oil reserves (green line), and average recovery factors (blue line) for all oil pools in Saskatchewan. Volume of oil-in-place has increased significantly since 1977, and the low oil reserves are due to a low recovery factor.
Figure 5 - Plot showing gas-in-place (red line), gas reserves (green line), and average recovery factors (blue line) for all gas pools in Saskatchewan. Volume of gas-in-place has increased significantly since 1977, and the recovery factor has been relatively constant at about 70% since 1975.
0
5,000
10,000
15,000
20,000
25,000
30,000
35,000
1950 1955 1960 1965 1970 1975 1980 1985 1990 1995 2000 2005
Year
Oil-
in-p
lace
(OIP
), R
ecov
erab
le O
il R
eser
ves
Mill
ions
of b
arre
ls
0
5
10
15
20
25
30
35
Rec
over
y Fa
ctor
, per
cent
Oil-in-place (OIP)
Recovery Factor
Recoverable Oil Reserves
0
1000
2000
3000
4000
5000
6000
7000
8000
9000
10000
1950 1955 1960 1965 1970 1975 1980 1985 1990 1995 2000 2005
Years
GIP
, Gas
Res
erve
s, in
BC
F
50
55
60
65
70
75
80
85
90
95
100
Rec
over
y Fa
ctor
Gas-in-place (GIP)
Recoverable gas Reserves
Recovery Factor

Saskatchewan Geological Survey 7 Summary of Investigations 2004, Volume 1
of historical reserve record from other pools, separate groups of pools with the same minimum growth period (e.g., 10, 15, 20, 25, 30, and 35 years) were formed. The group with at least ten years of reserve-growth values was the one that had the reserve values reported as early as 1954 and as late as 1991 for both oil and gas and had the largest number of pools – 256 oil pools and 45 nonassociated gas pools. The next group with at least 15 years of growth included those pools that had their reserves reported as early as 1954 and as late as 1986 for both oil and gas. It included 221 oil and 22 nonassociated gas pools. This process was repeated for all the groups with different lengths of historical reserves data, and resulted in 187 oil and 12 gas pools for the 20-year growth periods, 154 oil and 12 gas pools for the 25-year growth periods, 141 oil and eight gas pools for the 30-year growth periods, and 103 oil and four gas pools for the 35-year growth periods. For reserve-growth model development, it was necessary to choose a group that had an adequate number of pools for fair representation of their variability as well as a sufficient length of historical reserve record to help establish a trend of reserve growth.
Analysis was carried out separately for oil and gas pools. More detailed work was conducted for oil pools because of the availability of more pools and the additional parameter of oil gravity as reported in Saskatchewan database; for our purpose, heavy oil was defined as having oil gravity ≤20°API (or ≥0.93 g/cm3), medium oil as having gravity >20°API (or <0.93 g/cm3) but ≤30°API (or ≥0.88 g/cm3), and light oil having gravity >30°API (or <0.88 g/cm3). Heavy oil is conventionally defined as having gravity of ≤20°API (or ≥0.93 g/cm3) (Crysdale and Schenk, 1990), whereas the distinction between medium and light oil is somewhat arbitrary.
a) Reserve Growth in Oil Pools For a better understanding of oil reserve growth in the Saskatchewan pools, the effects of oil gravity, pool size, and reservoir porosity on reserve growth were evaluated. A total of 256 pools, with pool size ranging from 0.063 to 282.6 MMBO (0.01 to 44.9 x 10⁶ m3) reserves, were included in the present study.
As explained earlier, pools were grouped based on the length of reserve record, such as 10, 15, 20, 25, 30, and 35 years, using the first production year as the criterion for age. The annual growth factor (AGF), which is a ratio of recoverable reserve volume in a particular year to the volume in the previous year, is calculated for each group of pools by year. The next step is to calculate cumulative growth factor (CGF), which is obtained by multiplying the AGF of a particular year with the AGFs of all the previous years, as shown in the equation:
CGFn = AGF0*AGF1*AGF2*AGF3*………..AGFn (1) where AGF0 is the first reporting year and its value is 1, and suffix 1, 2, 3, … n are the values of AGF at end of 1, 2, 3, … nth years from the year since first production.
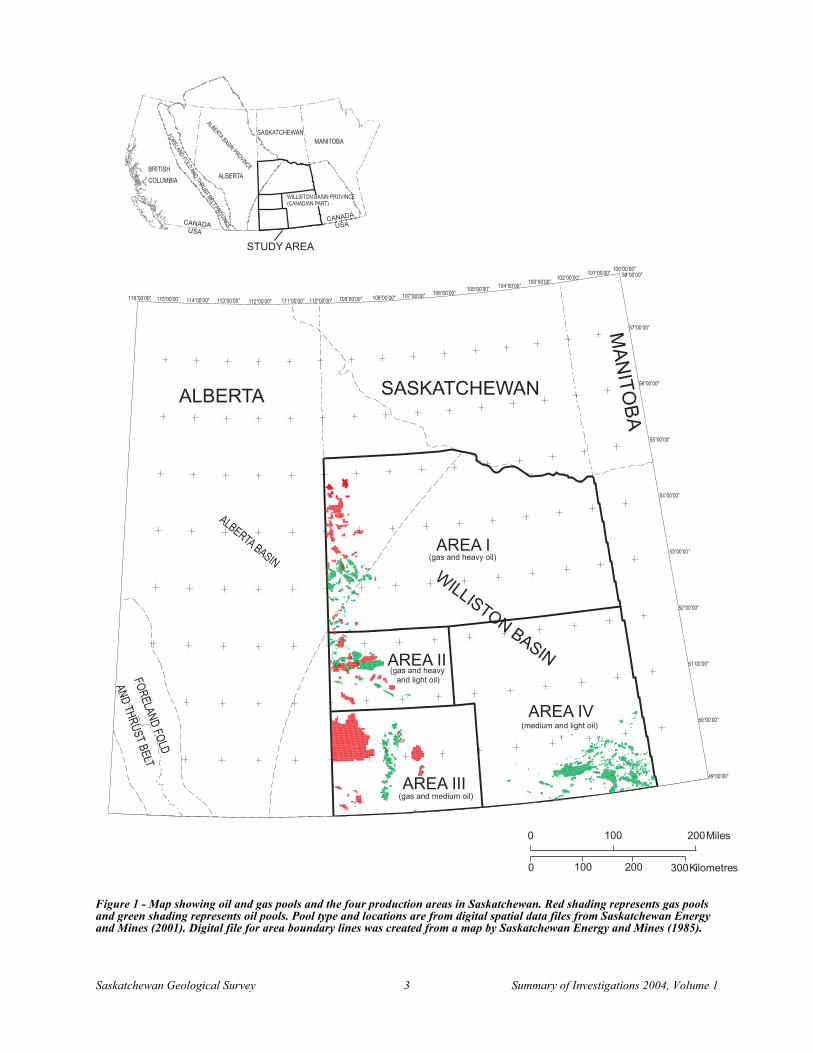
The CGFs for groups of oil pools calculated by the Group Growth method and the Modified Arrington method are plotted in Figure 6. The growth curves based on the Group Growth method show a decline in the rate of growth as the length of the historical reserves record increases, implying lower CGF values for groups with longer growth periods compared to groups having shorter growth periods. Therefore, it was important to select a group of pools considered to best represent the average reserve growth for the Saskatchewan pools in developing reserve-growth models using CGFs. Based on the plotted results in Figure 6, the group of 154 pools with 25 years of growth was chosen as being representative for the entire province. This group shows a growth of 3.27-fold (227%) increase over the 25-year period, an equivalent of 4.9% per year. All the curves in Figure 6 show a general decrease in rate of growth at about 11 years. However, these growth factors are to be used with caution, because they represent estimates of overall additional reserves for an entire province or country and not for individual pools.
The growth curve based on the Modified Arrington method closely tracks the growth curve for the group of 256 pools with ten-year growth period from the Group Growth method. It shows higher growth of 4.0-fold (300% increase) over a 25-year period, an equivalent of 5.7% per year, largely because of inclusion of recently reported pools. However, the slope of the Modified Arrington’s growth curve after the first few years is similar to the 25-year growth curve developed from the Group Growth method; therefore, the forecast results from the two methods are relatively close.
Reserve-growth Sensitivity to Pool Size
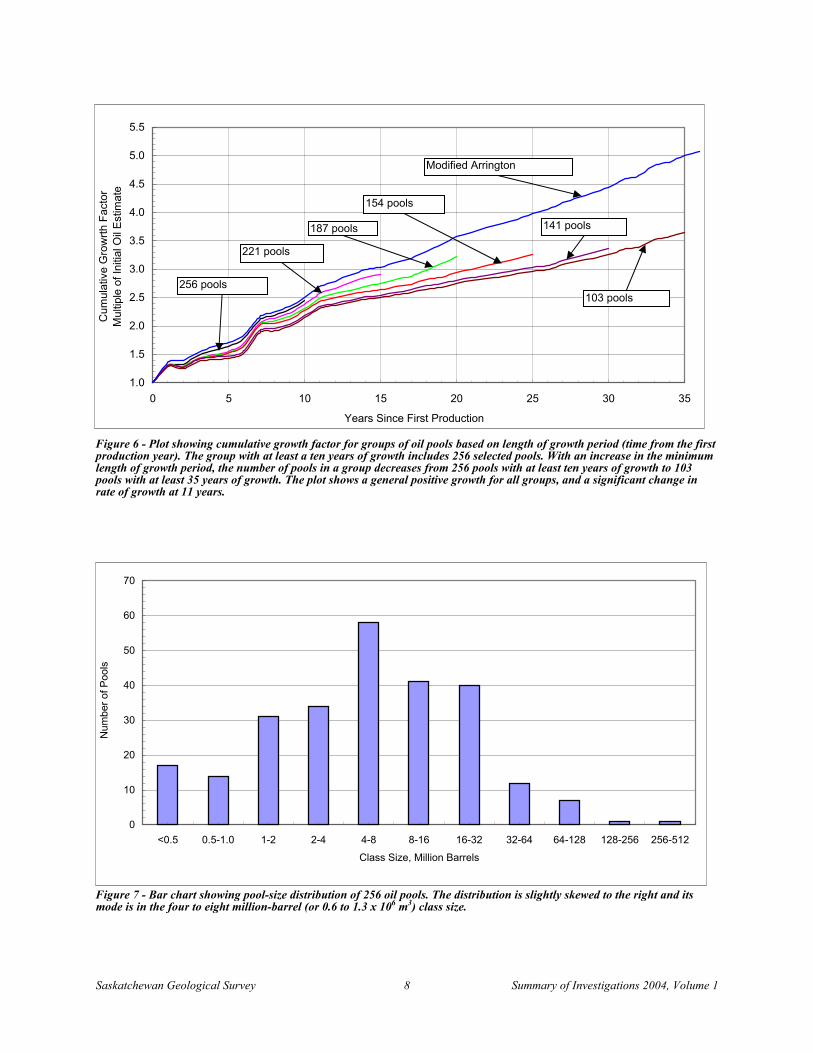
To study the effect of oil-pool size on reserve growth, all 256 pools were grouped into different class sizes as shown in Figure 7. Based on their plotted distribution, pools were grouped into two sizes, those smaller than 8 MMBO (1.3 x 10⁶ m3) of proved reserves, and those larger. Because the group with 154 pools and 25 years of historical record was chosen to represent the entire province, the CGFs were calculated for these two different pool sizes within the group and plotted against the time since the first production year (Figure 8). There are 68 pools >8 MMBO and 86 pools ≤8 MMBO (1.3 x 10⁶ m3). The smaller pools, which make up only 14.1% of the recoverable reserves
Saskatchewan Geological Survey 8 Summary of Investigations 2004, Volume 1
Figure 6 - Plot showing cumulative growth factor for groups of oil pools based on length of growth period (time from the first production year). The group with at least a ten years of growth includes 256 selected pools. With an increase in the minimum length of growth period, the number of pools in a group decreases from 256 pools with at least ten years of growth to 103 pools with at least 35 years of growth. The plot shows a general positive growth for all groups, and a significant change in rate of growth at 11 years.
Figure 7 - Bar chart showing pool-size distribution of 256 oil pools. The distribution is slightly skewed to the right and its mode is in the four to eight million-barrel (or 0.6 to 1.3 x 10⁶ m3) class size.
1.0
1.5
2.0
2.5
3.0
3.5
4.0
4.5
5.0
5.5
0 5 10 15 20 25 30 35
Years Since First Production
Cum
ulat
ive
Gro
wrth
Fac
tor
Mul
tiple
of I
nitia
l Oil
Estim
ate
256 pools
221 pools
187 pools
154 pools
141 pools
103 pools
Modified Arrington
0
10
20
30
40
50
60
70
<0.5 0.5-1.0 1-2 2-4 4-8 8-16 16-32 32-64 64-128 128-256 256-512
Class Size, Million Barrels
Num
ber o
f Poo
ls

Saskatchewan Geological Survey 9 Summary of Investigations 2004, Volume 1
Figure 8 - Graph showing the cumulative growth factor plotted against years since first production for the group of 154 pools having 25 years of growth period. Also shown are the cumulative growth factors for the two subsets of 154 pools, based on pool sizes (≤8 MMBO or >8 MMBO, where 8 MMBO is 1.3 x 10⁶ m3).
within the 154 pools, show a 1.78-fold (78%) increase over a 25-year period, an equivalent of 2.3% per year, whereas the larger pools show a 3.61-fold (261%) increase over a 25-year period, an equivalent of 5.3% per year. The reserve growth of large pools is similar to that of all 154 pools (3.27-fold or 227% increase). A change in growth rates at 11 years is evident in all the three curves in Figure 8, similar to what was observed in Figure 6.
The effect of the four largest pools (with recoverable reserves >100 MMBO or 15.9 x 10⁶ m3) on the overall growth was also examined. The CGFs for the combined 154 pools, the group of four largest pools, and the group with remaining 150 smaller pools (with recoverable reserves of ≤100 MMBO or 15.9 x 10⁶ m3) are plotted against the years since first production in Figure 9, which shows higher growth in the four largest size pools (5.28-fold, an increase of 428% over 25 years) compared to smaller size pools (2.85-fold, an increase of 185% over the same period). The peak in the curve for the four largest pools at the seventh year is mostly due to an appreciable increase in recoverable reserves in 1962.
Reserve-growth Sensitivity to Oil Gravity
On the basis of oil gravity (≤20°API or ≥0.93 g/cm3 for heavy oil, >20° to ≤30°API or <0.93 to ≥0.88 g/cm3 for medium oil, and >30°API or <0.88 g/cm3 for light oil), CGFs were calculated for each of the three oil groups and plotted in Figure 10, along with the CGF curve for all 154 pools, which falls in the middle of the three other curves. The following observations can be made:
1) The heavy oil pools, which are generally of Cretaceous age and younger, showed no growth during the first four years and then grew at a relatively higher rate than the pools with medium or light oil over the next seven years, followed by slower growth (though still faster than the other three pool categories) during the remainder of the 25-year period.
2) The medium-gravity oil pools also showed little growth in the first six years, then grew at a steeper rate for one year followed by a growth rate similar to that for light oil pools.
3) The light oil pools show highest reserve growth in the first five years (2.27-fold increase) and moderate growth in subsequent years.
1.0
1.5
2.0
2.5
3.0
3.5
4.0
0 5 10 15 20 25
Years Since First Production
Cum
ulat
ive
Gro
wth
Fac
tor (
CG
F)M
ultip
le o
f Ini
tial O
il Es
timat
e
All 154 Pools, 25 years
68 Pools, reserves of >8 MMBO
86 Pools, reserves of <8 MMBO

Saskatchewan Geological Survey 10 Summary of Investigations 2004, Volume 1
Figure 9 - Plot showing cumulative growth factors versus years since first production for 154 pools with at least 25 years of growth period for each pool, the group of the four largest pools with individual pool reserves of >100 MMBO (15.9 x 10⁶ m3), and the 150 smaller pools.
Figure 10 - Plot showing cumulative growth factors versus years since first production for the group of 154 pools and for the three individual groups categorized by oil gravity. Heavy and light oil pools show higher growth compared to the medium oil pools.
1.0
1.5
2.0
2.5
3.0
3.5
4.0
4.5
5.0
5.5
0 5 10 15 20 25
Years Since First Production
Cum
ulat
ive
Gro
wth
Fac
tor (
CG
F)M
ultip
le o
f Ini
tial O
il Es
timat
e
All 154 Pools, 25 years
4 largest pools, reserves of >100 MMBO
150 Smaller pools, reserves of <100 MMBO)
1.0
1.5
2.0
2.5
3.0
3.5
4.0
0 5 10 15 20 25
Years Since the First Production
Cum
ulat
ive
Gro
wth
Fac
tor (
CG
F)M
ultip
le o
f Ini
tial O
il Es
timat
e
Heavy Oil, 35 pools
Average, 154 pools
Light Oil, 65 pools
Medium Gravity Oil, 54 pools
Saskatchewan Geological Survey 11 Summary of Investigations 2004, Volume 1
Reserve-growth Sensitivity to Porosity
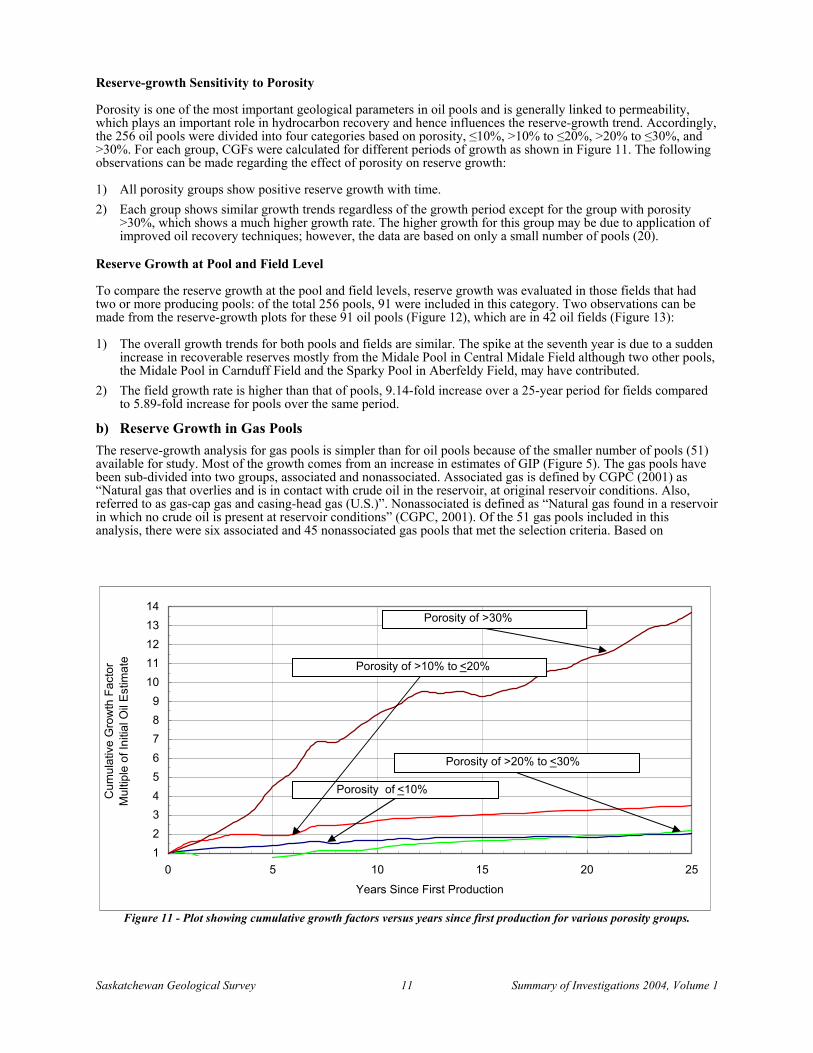
Porosity is one of the most important geological parameters in oil pools and is generally linked to permeability, which plays an important role in hydrocarbon recovery and hence influences the reserve-growth trend. Accordingly, the 256 oil pools were divided into four categories based on porosity, ≤10%, >10% to ≤20%, >20% to ≤30%, and >30%. For each group, CGFs were calculated for different periods of growth as shown in Figure 11. The following observations can be made regarding the effect of porosity on reserve growth:
1) All porosity groups show positive reserve growth with time. 2) Each group shows similar growth trends regardless of the growth period except for the group with porosity
>30%, which shows a much higher growth rate. The higher growth for this group may be due to application of improved oil recovery techniques; however, the data are based on only a small number of pools (20).
Reserve Growth at Pool and Field Level
To compare the reserve growth at the pool and field levels, reserve growth was evaluated in those fields that had two or more producing pools: of the total 256 pools, 91 were included in this category. Two observations can be made from the reserve-growth plots for these 91 oil pools (Figure 12), which are in 42 oil fields (Figure 13):
1) The overall growth trends for both pools and fields are similar. The spike at the seventh year is due to a sudden increase in recoverable reserves mostly from the Midale Pool in Central Midale Field although two other pools, the Midale Pool in Carnduff Field and the Sparky Pool in Aberfeldy Field, may have contributed.
2) The field growth rate is higher than that of pools, 9.14-fold increase over a 25-year period for fields compared to 5.89-fold increase for pools over the same period.
b) Reserve Growth in Gas Pools The reserve-growth analysis for gas pools is simpler than for oil pools because of the smaller number of pools (51) available for study. Most of the growth comes from an increase in estimates of GIP (Figure 5). The gas pools have been sub-divided into two groups, associated and nonassociated. Associated gas is defined by CGPC (2001) as “Natural gas that overlies and is in contact with crude oil in the reservoir, at original reservoir conditions. Also, referred to as gas-cap gas and casing-head gas (U.S.)”. Nonassociated is defined as “Natural gas found in a reservoir in which no crude oil is present at reservoir conditions” (CGPC, 2001). Of the 51 gas pools included in this analysis, there were six associated and 45 nonassociated gas pools that met the selection criteria. Based on
Figure 11 - Plot showing cumulative growth factors versus years since first production for various porosity groups.
123456789
1011121314
0 5 10 15 20 25
Years Since First Production
Cum
ulat
ive
Gro
wth
Fac
tor
Mul
tiple
of I
nitia
l Oil
Est
imat
e
Porosity of >30%
Porosity of >10% to <20%
Porosity of >20% to <30%
Porosity of <10%

Saskatchewan Geological Survey 12 Summary of Investigations 2004, Volume 1
Figure 12 - Plot showing cumulative growth factors versus years since first production for pools included in the field-growth study. The curves show higher growth and different trends than that seen for all pools in Figure 6.
Figure 13 - Plot showing cumulative growth factors versus years since first production for the fields with multiple pools. Although growth patterns for fields are similar to those for pools (Figure 12), the growth rates are slightly higher, regardless of length of growth periods.
1.0
2.0
3.0
4.0
5.0
6.0
7.0
0 5 10 15 20 25 30 35
Years Since First Production
Cum
ulat
ive
Gro
wth
Fac
tor
Mul
tiple
of I
nitia
l Oil
Est
imat
e
91 pools 85 pools 70 pools 50 pools 44 pools 29 pools
1
2
3
4
5
6
7
8
9
10
0 5 10 15 20 25 30 35
Years Since First Production
Cum
ulat
ive
Gro
wth
Fac
tor
Mul
tiple
of I
nitia
l Oil
Est
imat
e
42 fields 42 fields 36 fields 27 fields 24 fields 17 fields

Saskatchewan Geological Survey 13 Summary of Investigations 2004, Volume 1
limited data, the average growth in potential reserves for the six associated gas pools was essentially negligible. For the larger amount of data on the nonassociated gas pools, both the Modified Arrington and the Group Growth method were used to estimate reserve growth as discussed below.
Using the Group Growth method, the CGFs for nonassociated gas pools were calculated for groups of pools with different growth periods – ten years (45 pools), 15 years (22 pools), 20 to 25 years (12 pools), 30 years (eight pools), and 35 years (four pools) – and plotted in Figure 14, which also includes CGFs based on the Modified Arrington method. The groups with 30- and 35-year growth periods have a small number of pools, and groups with ten- and 15-year growth periods have a limited growth history. The number of pools constituting the 20- and 25-year growths period is the same (12), and the group having the 25-year growth period was chosen to be representative of growth within the province. The results of the Modified Arrington method are closely similar to those of the Group Growth method (3.18-fold or 218% increase in reserves) for the group of 12 pools within the with 25-year growth period. This growth is equivalent to a 4.7% increase per year (Figure 14). In Figure 15, reserve growth for this group of 12 gas pools is compared with those of groups consisting of 10 smaller pools and of the two largest pools, Hatton Milk River (reserves of 1802 BCFG or 51.0 x 10⁹ m3) and Hatton Medicine Hat (reserves of 658 BCFG or 18.6 x 10⁹ m3). The smaller pools show little growth but the larger pools have contributed substantially to the overall reserve growth.
7. Reserve-growth Prediction Models Two reserve-growth models, one for oil pools and one for nonassociated gas pools, were developed for predicting potential reserve growth in Saskatchewan by application of both the Group Growth method and the Modified Arrington method.
a) Oil Pools A prediction model for oil pools based on the Group Growth method applies the data from the representative group of 154 pools with 25 years of growth. Of the three mathematical functions (power, reciprocal, and hyperbolic), the power function gave the best fit to the transformed variables of CGF and year data where the correlation becomes a straight line.
Figure 14 - Plot showing cumulative growth factors (CGFs) for 45 nonassociated gas pools included in the analysis versus years since first production, using the Group Growth method. All groups with different numbers of pools and growth periods show positive growth. The CGF curve for the Modified Arrington method is similar to the CGF curve for the 20- to 25-year growth periods.
1.0
1.5
2.0
2.5
3.0
3.5
4.0
4.5
5.0
0 5 10 15 20 25 30 35
Years Since First Production
Cum
ulat
ive
Gro
wth
Fac
tor (
CG
F)M
ultip
le o
f Ini
tial G
as E
stim
ate
45 Pools, 10 yrs
22 Pools, 15 yrs
12 Pools, 20-25 yrs
4 Pools, 35 yrs
8 Pools, 30 yrs
Modified Arrington

Saskatchewan Geological Survey 14 Summary of Investigations 2004, Volume 1
Figure 15 - Plot showing cumulative growth factors for the group of 12 nonassociated gas pools with a minimum of 25 years of growth history versus years since first production. Because approximately one-third of Saskatchewan’s total gas reserves are contained in the Hatton Milk River and Hatton Medicine Hat pools, the cumulative growth factors for these pools were plotted individually. The group of 12 pools grew by 3.18-fold (218%) and the group of ten smaller pools grew by only 1.04-fold (4%) over a period of 25 years.
For the Group Growth method, the correlation coefficient (R2) for the plot of transformed variables, CGF, and years since first production (YSFP) is 0.938. The equation is given as:
CGF=1.0191(YSFP)0.3485 (2) where YSFP is equal to two or more years. The CGF at the end of the first year is the average value of CGFs at the end of the zero and second year.
For the Modified Arrington method, which considers data from all pools and fields, the correlation coefficient (R2) for the plot of transformed variables, CGF, and YSFP, is 0.956, and the equation is:
CGF=0.989(YSFP)0.4278 (3) where YSFP is equal to two or more years. The CGF at the end of the first year is the average value of CGFs at the end of the zero and second year.
The oil CGF data and model results from the Group Growth method and the Modified Arrington method are plotted in Figure 16.
b) Gas Pools A prediction model based on the Group Growth method applies data from the group of 12 nonassociated gas pools with 25 years of growth, from which a reserve-growth model was developed with the linear function giving the best fit for the CGF data plotted against YSFP. Similarly, a model was developed using the Modified Arrington method using data from all the nonassociated pools that met the selection criteria. This correlation is linear because GIP has increased in linear fashion since 1980 and recovery factor has remained relatively constant (Figure 5). Equations for the two models are given below and the results as plotted in Figure 17 show the curves to be linear and to correlate closely. The equation based on the Group Growth method is:
CGF=0.0835*YSFP+1.0375 (4)
0
1
2
3
4
5
6
7
8
9
10
11
12
0 5 10 15 20 25
Years Since First Production
Cum
ulat
ive
Gro
wth
Fac
tor (
CG
F)M
ultip
le o
f Ini
tial G
as E
stim
ate
Hatton Milk River, 1802 BCFG
All 12 Pools, 3150 BCFGHatton Medicine Hat, 658 BCFG
10 Smaller Pools, 690 BCFG

Saskatchewan Geological Survey 15 Summary of Investigations 2004, Volume 1
Figure 16 - Plot showing cumulative growth factors (CGFs) as a function of years since first production for the group of 154 oil pools with at least 25 years of growth history for each pool and the CGFs from the predictive models based on the Modified Arrington and the Group Growth methods. The blue solid squares represent the CGFs calculated from the Group Growth method and the solid blue line represents the CGFs calculated from Equation 2 (see text).The solid red triangles represent the calculated CGFs from the Modified Arrington method, and the solid red line represents the CGFs calculated from Equation 3 (see text).
Figure 17 - Plot showing cumulative growth factors and the CGFs calculated from the Modified Arrington and Group Growth methods, as a function of years since first reserve reporting. Linear function gave the best fit for both the models.
1.0
1.5
2.0
2.5
3.0
3.5
4.0
0 5 10 15 20 25
Years Since First Production
Cum
ulat
ive
Gro
wth
Fac
tor (
CG
F)M
ultip
le o
f Ini
tial O
il E
stim
ate
CGF: Data, Model - Group Growth method
CGF: Data, Model - Modified Arrington method
1.0
1.2
1.4
1.6
1.8
2.0
2.2
2.4
2.6
2.8
3.0
3.2
3.4
0 5 10 15 20 25
Years Since First Production
Cum
ulat
ive
Gro
wth
Fac
tor (
CG
F)M
ultip
le o
f Ini
tial G
as E
stim
ate
CGF: Data and Model - Modified Arrington method
CGF: Data, Model - Group Growth method
Saskatchewan Geological Survey 16 Summary of Investigations 2004, Volume 1
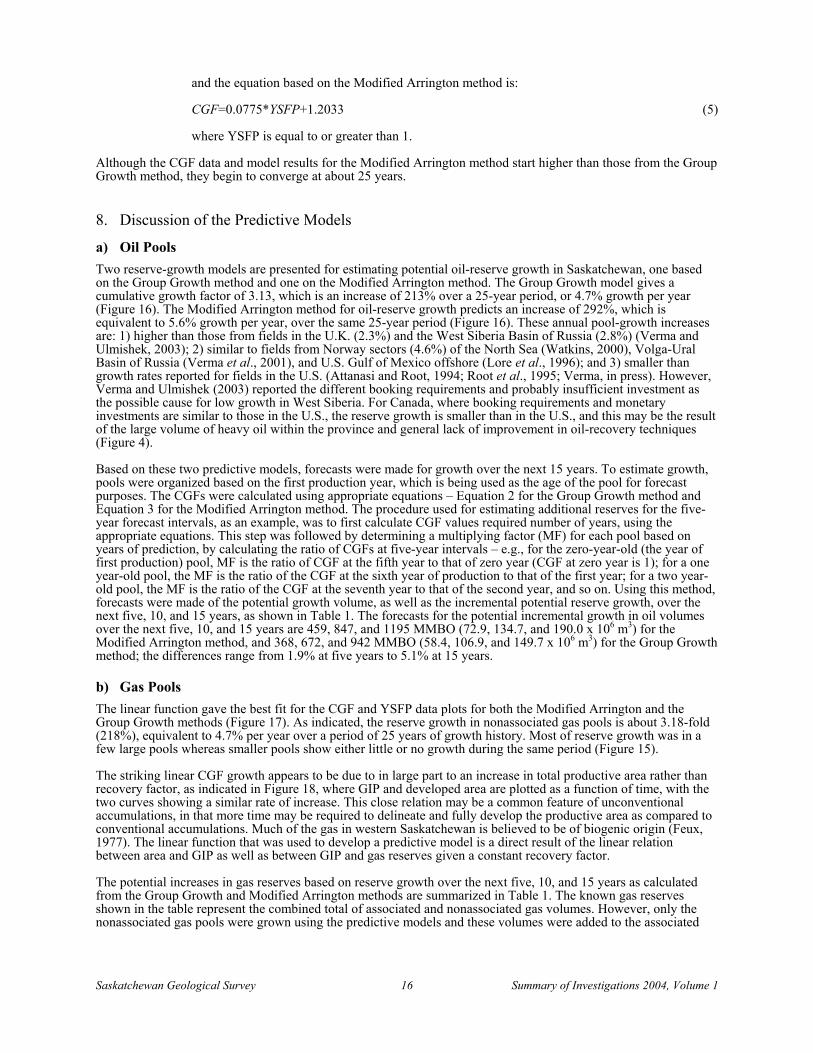
and the equation based on the Modified Arrington method is:
CGF=0.0775*YSFP+1.2033 (5) where YSFP is equal to or greater than 1.
Although the CGF data and model results for the Modified Arrington method start higher than those from the Group Growth method, they begin to converge at about 25 years.
8. Discussion of the Predictive Models
a) Oil Pools Two reserve-growth models are presented for estimating potential oil-reserve growth in Saskatchewan, one based on the Group Growth method and one on the Modified Arrington method. The Group Growth model gives a cumulative growth factor of 3.13, which is an increase of 213% over a 25-year period, or 4.7% growth per year (Figure 16). The Modified Arrington method for oil-reserve growth predicts an increase of 292%, which is equivalent to 5.6% growth per year, over the same 25-year period (Figure 16). These annual pool-growth increases are: 1) higher than those from fields in the U.K. (2.3%) and the West Siberia Basin of Russia (2.8%) (Verma and Ulmishek, 2003); 2) similar to fields from Norway sectors (4.6%) of the North Sea (Watkins, 2000), Volga-Ural Basin of Russia (Verma et al., 2001), and U.S. Gulf of Mexico offshore (Lore et al., 1996); and 3) smaller than growth rates reported for fields in the U.S. (Attanasi and Root, 1994; Root et al., 1995; Verma, in press). However, Verma and Ulmishek (2003) reported the different booking requirements and probably insufficient investment as the possible cause for low growth in West Siberia. For Canada, where booking requirements and monetary investments are similar to those in the U.S., the reserve growth is smaller than in the U.S., and this may be the result of the large volume of heavy oil within the province and general lack of improvement in oil-recovery techniques (Figure 4).
Based on these two predictive models, forecasts were made for growth over the next 15 years. To estimate growth, pools were organized based on the first production year, which is being used as the age of the pool for forecast purposes. The CGFs were calculated using appropriate equations – Equation 2 for the Group Growth method and Equation 3 for the Modified Arrington method. The procedure used for estimating additional reserves for the five-year forecast intervals, as an example, was to first calculate CGF values required number of years, using the appropriate equations. This step was followed by determining a multiplying factor (MF) for each pool based on years of prediction, by calculating the ratio of CGFs at five-year intervals – e.g., for the zero-year-old (the year of first production) pool, MF is the ratio of CGF at the fifth year to that of zero year (CGF at zero year is 1); for a one year-old pool, the MF is the ratio of the CGF at the sixth year of production to that of the first year; for a two year-old pool, the MF is the ratio of the CGF at the seventh year to that of the second year, and so on. Using this method, forecasts were made of the potential growth volume, as well as the incremental potential reserve growth, over the next five, 10, and 15 years, as shown in Table 1. The forecasts for the potential incremental growth in oil volumes over the next five, 10, and 15 years are 459, 847, and 1195 MMBO (72.9, 134.7, and 190.0 x 10⁶ m3) for the Modified Arrington method, and 368, 672, and 942 MMBO (58.4, 106.9, and 149.7 x 10⁶ m3) for the Group Growth method; the differences range from 1.9% at five years to 5.1% at 15 years.
b) Gas Pools The linear function gave the best fit for the CGF and YSFP data plots for both the Modified Arrington and the Group Growth methods (Figure 17). As indicated, the reserve growth in nonassociated gas pools is about 3.18-fold (218%), equivalent to 4.7% per year over a period of 25 years of growth history. Most of reserve growth was in a few large pools whereas smaller pools show either little or no growth during the same period (Figure 15).
The striking linear CGF growth appears to be due to in large part to an increase in total productive area rather than recovery factor, as indicated in Figure 18, where GIP and developed area are plotted as a function of time, with the two curves showing a similar rate of increase. This close relation may be a common feature of unconventional accumulations, in that more time may be required to delineate and fully develop the productive area as compared to conventional accumulations. Much of the gas in western Saskatchewan is believed to be of biogenic origin (Feux, 1977). The linear function that was used to develop a predictive model is a direct result of the linear relation between area and GIP as well as between GIP and gas reserves given a constant recovery factor.
The potential increases in gas reserves based on reserve growth over the next five, 10, and 15 years as calculated from the Group Growth and Modified Arrington methods are summarized in Table 1. The known gas reserves shown in the table represent the combined total of associated and nonassociated gas volumes. However, only the nonassociated gas pools were grown using the predictive models and these volumes were added to the associated

Saskatchewan Geological Survey 17 Summary of Investigations 2004, Volume 1
Table 1 - Forecast of potential increases in Saskatchewan’s oil and gas reserves, based on the Modified Arrington method and the Group Growth method.
Total Hydrocarbon Volumes (oil volumes are in barrels and gas volumes in cubic feet) Oil Volumes (million barrels) Gas Volumes (billion cubic feet)
Year of Reserve Estimate/Forecast
Oil Reserves Estimate
(million barrels) Modified Arrington
Group Growth
Gas Reserves Estimate
(billion cubic feet) Modified Arrington
Group Growth
2001 4926.2 6864.6 2006 5384.7 5293.6 7782.5 7868.3 2011 5773.3 5598.5 8693.6 8870.8 2016 6121.0 5867.9 9604.7 9873.3
Incremental Hydrocarbon Volumes (oil volumes are in barrels and gas volumes in cubic feet) Oil Volumes (million barrels) Gas Volumes (billion cubic feet) Year of Reserve
Forecast Modified Arrington Group Growth Modified Arrington Group Growth 2006 458.6 367.5 917.9 1003.7 2011 847.1 672.3 1829.0 2006.2 2016 1194.8 941.7 2740.1 3008.7
Total Hydrocarbon Volumes (oil and gas volumes are in cubic metres) Oil Volumes (106 m3) Gas Volumes (109 m3)
Year of Reserve Estimate/Forecast
Oil Reserves Estimate (106 m3)
Modified Arrington
Group Growth
Gas Reserves Estimate (109 m3)
Modified Arrington
Group Growth
2001 783.2 194.4 2006 856.1 841.6 220.4 222.8 2011 917.9 890.1 246.2 251.2 2016 973.2 932.9 272.0 279.6
Incremental Hydrocarbon Volumes (oil and gas volumes are in cubic metres) Oil Volumes (106 m3) Gas Volumes (109 m3) Year of Reserve
Forecast Modified Arrington Group Growth Modified Arrington Group Growth 2006 72.9 58.4 26.0 28.4 2011 134.7 106.9 51.8 56.8 2016 190.0 149.7 77.6 85.2
Figure 18 - Graph showing the increases in gas-in-place (GIP) and size of developed area as a function of time.
0
1,000
2,000
3,000
4,000
5,000
6,000
7,000
8,000
9,000
10,000
1950 1955 1960 1965 1970 1975 1980 1985 1990 1995 2000 2005
Year
Rec
over
able
Gas
Res
erev
es, G
as-in
-pla
ce (G
IP)
Billi
on c
ubic
feet
500,000
1,000,000
1,500,000
2,000,000
2,500,000
3,000,000
Dev
elop
ed A
rea,
Acr
e
Gas-in-place (GIP)
Developed area (acres)

Saskatchewan Geological Survey 18 Summary of Investigations 2004, Volume 1
gas volumes (for which reserve growth was not determined) to get the total volumes at the five-, 10-, and 15-year intervals. The potential increases over these five-year intervals for the Modified Arrington method are 918, 1829, and 2740 BCFG (26.0, 51.8, and 77.6 x 10⁹ m3) and for the Group Growth method 1004, 2006, and 3009 BCFG (28.4, 56.8, and 85.2 x 10⁹ m3). The difference in the forecasts resulting from the two models ranges from 1.2% at five years to 3.9% at 15 years.
9. Conclusions Reserve growth has become an important part of estimating total potential reserves of an individual petroleum province or a country. Reserve-growth analysis of Saskatchewan reveals the following important features:
• The cumulative growth factor for 154 pools after 25 years of growth calculated using the Group Growth method is a 227% increase, equivalent to a 4.9% increase per year. Over the same time period, the Modified Arrington method gave an increase of 300%, equivalent to a 5.7% increase per year.
• The reserve growth by pool for various oil types showed that pools with heavy oil and light oil grew by 293% over a period of 25 years, equivalent to about 5.6% per year. For the same period, the medium oil pools showed a 148% increase, which is equal to about 3.7% per year.
• Smaller oil pools (≤8 MMBO or 1.3 x 10⁶ m3) out of the group of 154 pools with at least 25 years of growth history grew by 78%, equivalent to a rate of 2.3% per year, whereas larger pools (>8 MMBO or 1.3 x 10⁶ m3) increased 261%, or 5.3% per year.
• The four largest pools (each pool with reserves of >100 MMBO or 15.9 x 10⁶ m3) grew 428%, equivalent to a rate of 6.9% per year, whereas the remaining 150 smaller pools grew 185%, or 4.3% per year, the average increase for all 154 pools with 25 years of growth being 227%, equivalent to 4.9% per year.
• Reserve growth at the field level is higher than at the pool level.
• The average recovery factor for Saskatchewan oil pools is about 15%.
• The difference between the five- and 15-year forecasts for potential incremental oil volumes from the Modified Arrington method and the Group Growth method ranges from 1.9 to 5.1%, respectively.
• For nonassociated gas pools, the average recovery factor is 70%, and the CGF increased 218% over a 25-year period, which is equivalent to 4.7% per year.
• The difference in forecasts from the two models for potential incremental gas volumes ranges from 1.3% at the fifth year to 3.9% at the 15th year.
10. Acknowledgments The authors thank Thomas S. Ahlbrandt and Timothy R. Klett for their thorough review of our paper and valuable comments. Contributions to the study by Troy Cook, Raymond C. Obuch, and Pam Ketterer are also gratefully acknowledged. We likewise express our sincere thanks to our colleagues at Saskatchewan Industry and Resources, Regina, without whose co-operation and assistance this work would not have been possible.
11. References Attanasi, E.D. and Root, D.H. (1994): The enigma of oil and gas growth; Amer. Assoc. Petrol. Geol. Bull., v78,
no3, p, 321-332.
Burrus, J., Osadetz, K., Wolf, S., and Visser, K. (1996): Physical and numerical modeling constraints on oil expulsion and accumulation in the Bakken and Lodgepole petroleum systems of the Williston Basin (Canada-USA); Bull. Can. Petrol. Geol., v44, no3, p429-445.
Canadian Gas Potential Committee (2001): Natural gas potential in Canada–2001; Canadian Gas Potential Committee, Calgary, Alberta, Canada, published as a loose-leaf binder containing sixteen chapters and three appendices, pages not sequentially numbered.

Saskatchewan Geological Survey 19 Summary of Investigations 2004, Volume 1
Creaney, S., Allen, J., Cole, K.S., Fowler, M.G., Brooks, P.W., Osadetz, K.G., Macqueen, R.W., Snowden, L.R., and Riediger, C.L. (1994): Petroleum generation and migration in the Western Canada Sedimentary Basin; in Mossop, G.D. and Shetsen, I. (comps.), Geological Atlas of the Western Canada Sedimentary Basin, Can. Soc. Petrol. Geol./Alta. Resear. Counc., Calgary, p455-468.
Crysdale, B.L. and Schenk, C.J. (1990): Heavy Oil Resources of the United States; U.S. Geol. Surv., Bull. 1885, 127p.
Deroo, G., Powell, T.G., Tissot, B., McCrossan, R.G., with contributions by Hacquebard, P.A. (1977): The origin and migration of petroleum in the Western Canada Sedimentary Basin, Alberta: A geochemical and thermal maturation study; Geol. Surv. Can., Bull. 262, 136p.
Fuex, A.N. (1977): The use of stable carbon isotopes in hydrocarbon exploration; J. Geochem. Explor., v7, p155-188.
Klett, T.R. and Gautier, D.L. (2003): Characteristics of reserve growth in oil fields of the North Sea Graben area; 65th European Association of Geoscientists and Engineers Conference and Exhibition, 2-5 June, Stavanger, Norway, extended abstract and exhibitor’s catalogue, 4p.
Lore, G.L., Brooke, J.P., Cooke, D.W., Klazynski, R.J., Olson, D.L., and Ross, K.M. (1996): Summary of the 1995 assessment of the conventionally recoverable hydrocarbon resources of the Gulf of Mexico and Atlantic Shelf, Mineral Management Service, Outer Continental Shelf Rep. MMS 96-003, Appendix A, 4p.
Magoon, L.B. and Henry, M.E. (2000): Region 5 assessment summary – North America; in U.S. Geological Survey World Energy Assessment Team, U.S. Geological Survey World Petroleum Assessment 2000 – Description and Results, U.S. Department of the Interior, U.S. Geol. Surv., Digital Data Series DDS-60, version 1.1.
McMichael, C.L. (ed.) (2001): Guidelines for the evaluation of Petroleum Reserves and Resources: Supplement to the SPE/WPC Petroleum Reserves Definition and the Soc. Petrol. Eng./World Petrol. Cong./Amer. Assoc. Petrol. Geol., Petroleum Resources Definitions; Soc. Petrol. Eng., 141p.
Odell, P.R. (2001): Oil and Gas: Crises and Controversies, 1961-2000, Volume 1: Global Issues; Multi-Science Publishing Company Ltd., Brentwood, England, 793p.
Osadetz, K.G., Brooks, P.W., and Snowden, L.R. (1992): Oil families and their sources in Canadian Williston Basin (southeastern Saskatchewan and southwestern Manitoba); Bull. Can. Petrol. Geol., v40, no3, p254-273.
Root, D.H., Attanasi, E.D., Mast, R.F., and Gautier, D.L. (1995): Estimates of inferred reserves for the 1995 USGS National Oil and Gas Resources Assessment; U.S. Geol. Surv., Open File Rep. 95-75-L, 29p.
Saskatchewan Energy and Mines (1985): Reservoir Annual 1985 – Petroleum and Natural gas; Sask. Energy Mines, Misc. Rep. 86-1, pB-1.
__________ (2001): Geological Atlas of Saskatchewan; Sask. Energy Mines, CD-ROM, version 4.
Saskatchewan Industry and Resources (2004): Stratigraphic Correlation Chart, February 5, 2004 version.
Schmoker, J.W. and Attanasi, E.D. (1997): Reserve growth important to U.S. gas supply; Oil Gas J., v95, no4, p95-96.
Sem, T. and Ellerman, D. (1999): North Sea reserve appreciation, production and depletion; Mass. Inst. Tech., MIT-CEEPR 99-011 WP, 39p.
Verma, M.K. (in press): Modified Arrington method for calculating reserve growth – a new reserve growth model for U.S. oil and gas fields: U.S. Geol. Surv., Bull. 2172.
Verma, M.K., Ulmishek, G.F., and Gilbershtein, A.P. (2001): Slower reserve growth rates observed in Volga-Ural Province, Russia; Oil Gas J., v99, no9, p34-44.
Verma, M.K. and Ulmishek, G.F. (2003): Reserve Growth in oil fields of West Siberia Basin, Russia; Natur. Resour. Resear., v12, no2, p105-119.
Watkins, G.C. (2000): Characteristics of North Sea oil reserves appreciation; Mass. Inst. Tech., MIT-CEEPR 2000-008 WP, 33p.
Saskatchewan Geological Survey 20 Summary of Investigations 2004, Volume 1
Wright, G.N., McMechan, M.E., and Potter, D.E.G. (1994): Structure and architecture of the Western Canada Sedimentary Basin; in Mossop, G.D. and Shetsen, I. (comps.), Geological Atlas of the Western Canada Sedimentary Basin, Can. Soc. Petrol. Geol./Alta. Resear. Counc., Calgary, p25-40.