Historic Rehabilitation Tax Credits Final Evaluation …iec.ok.gov/sites/g/files/gmc216/f/Historic...
38
State of Oklahoma Incentive Evaluation Commission Historic Rehabilitation Tax Credit Final Report November 28, 2016 Prepared by
Transcript of Historic Rehabilitation Tax Credits Final Evaluation …iec.ok.gov/sites/g/files/gmc216/f/Historic...
State of Oklahoma
Incentive Evaluation Commission
Historic Rehabilitation Tax Credit
Final Report
November 28, 2016
Prepared by
Table of Contents
At A Glance ................................................................................................................................................. 1
Executive Summary ................................................................................................................................... 1
Introduction .................................................................................................................................................. 4
Program Background and Benchmarking ............................................................................................... 6
Fiscal Impact ............................................................................................................................................. 15
Economic Impact ...................................................................................................................................... 15
Technical and Administrative Issues ..................................................................................................... 14
Outcomes .................................................................................................................................................. 19
Recommendation ..................................................................................................................................... 27
1
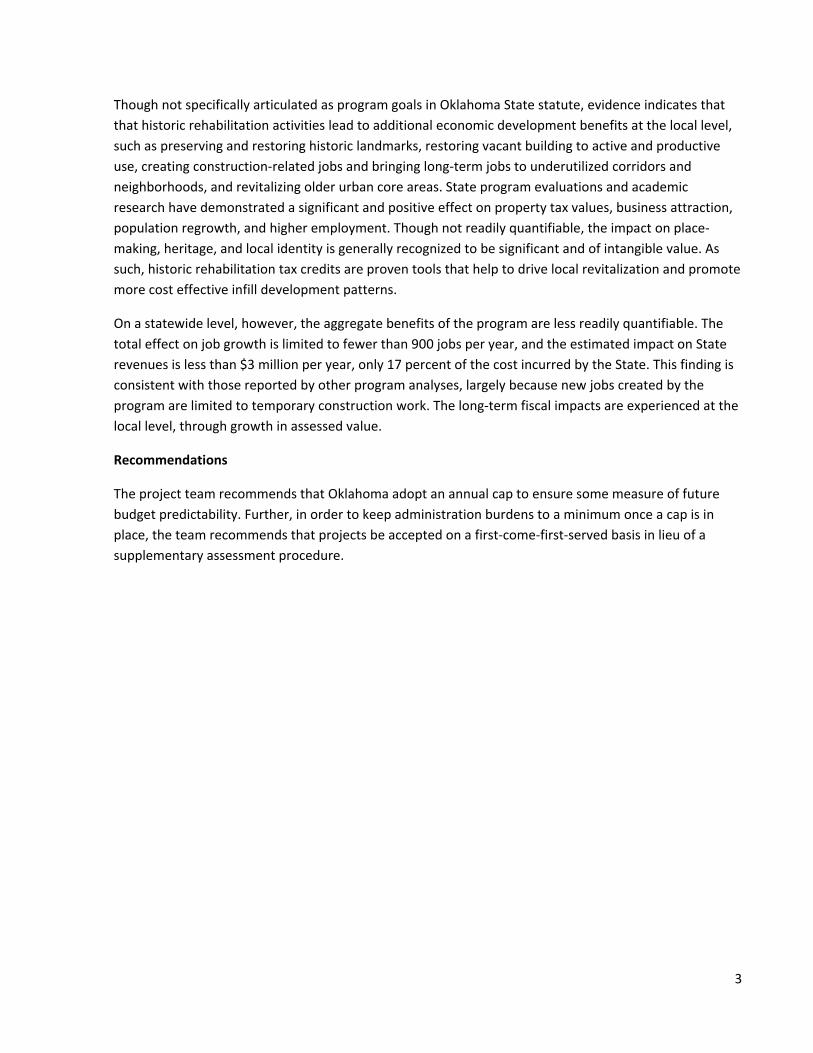
At a Glance: Historic Rehabilitation Tax Credit
Statute: O.S. 68 Section 2357.41
Program Goals
Increase Historic Rehabilitation Activity
Fiscal Impact 2011 2012 2013 2014 2015
Dollar Amount $10,091,775 $3,918,729 $8,666,174 $7,847,800 $17,162,851 Claimants 7 6 5 8 13
Economic Impact 2011 2012 2013 2014 2015
Output $84,709,102 $31,044,069 $76,822,052 $78,184,082 $121,777,262 Labor Income $29,737,729 $10,898,240 $26,968,925 $27,447,075 $42,750,770 Employment 620 227 563 572 892
Total Tax Revenue $2,060,753 $744,166 $1,881,973 $1,861,635 $2,895,507
Adequate Protections for Future Fiscal Impact? No. Without an annual cap in place, the cost burden on the State could grow beyond the point of
desirability.
Effective Administration? Yes. The Oklahoma program is among the most efficient nationwide because it is directly tied to the federal
program with not additional administrative burdens or costs. The policies and procedures in place are timely, transparent, and accountable.
Achieving its Goals?
Yes. Since 2005, the year that the program was tied to the federal process, the average number of historical rehabilitation projects has quadrupled and total development investment has increased by 82 times. This level of growth far exceeds that of most other states.
Retain, Reconfigure, Repeal?
The project team recommends that Oklahoma retain the program and adopt an annual cap to ensure some measure of future budget predictability.
Changes to Improve Future Evaluation?
None
$0
$5,000,000
$10,000,000
$15,000,000
$20,000,000
2011 2012 2013 2014 2015
Dollar Amount of Tax Credits Claimed by Year
$0
$50,000,000
$100,000,000
$150,000,000
2011 2012 2013 2014 2015
Economic Output by Year

Executive Summary

2
More than 30 states have historic preservation incentives in place. The growth of these programs has
been driven in part by interest in leveraging the Federal Historic Preservation Tax Credit, which allows
developers to claim 20 percent income tax credits for the rehabilitation expenses incurred while restoring
income‐producing buildings that are listed on the National Register of Historic Places or certified by the
National Parks Service.
Program Requirements, Eligibility, and Administration
In 1992, in the Local Development Act, the Oklahoma Legislature enacted a rehabilitation tax credit
available to historic hotels and newspaper plants. In 2005, HB 3024 expanded the program to income‐
producing historic buildings, and allowed projects that qualify for the federal 20 percent credit to
automatically qualify for the same amount of State tax credit without additional paperwork. The State tax
credit mirrors the Federal Historic Preservation Tax Credit, and the program is administered by the State
Historic Preservation Office (SHPO) in partnership with the National Park Service (NPS). Historic
rehabilitation tax credits earned but not used may be carried forward for up to ten years. The credits are
also transferrable, if not used, for up to five years after being earned.
Every state bordering Oklahoma has a historic rehabilitation tax credit program in place. Compared to
this benchmark group, Oklahoma’s credit amount of 20 percent is smaller than most. Oklahoma is also
one of the few states to restrict the credit to income‐producing structures, a choice that limits the
Oklahoma’s exposure to some of the program abuses and unintended loopholes that other states have
struggled with, such as state‐subsidized rehabilitation of luxury private residences.
Without an annual cap or a program cap in place, the cost burden on the State could continue to grow
beyond the point of desirability. Other states, such as Missouri, have experienced growth in this program
far beyond the initial predicted utilization levels. At present, more than half of all states have an annual
cap in place.
Because Oklahoma’s program is directly tied to the federal program with no additional administrative
burdens or costs, it is among the most efficient nationwide. Each project is vetted and screened by SHPO
and the NPS, and the credit is granted only after completion and certification of compliance with the U.S.
Secretary of Interior Standards. The incremental burdens to the State above and beyond those involved
in the administration of the federal tax credit program are minimal. The policies and procedures in place
are timely, transparent, and accountable.
Program Impacts
The 2005 legislative changes – including both the expansion of eligibility and the alignment of
administrative procedures with federal requirements – have led to a substantial increase in tax credit
utilization. Since 2005 (the year of that the program was tied to the federal process), the average annual
historic rehabilitation projects has quadrupled and the total development investment has increased 82
times, from just over $1.0 million in 2005 to $85.9 million in 2015. In FY2009, Oklahoma ranked 41st out
of 47 states in the number of certified expenses; in FY2015, the state came in at 16th. The program has
been exceptionally successful at increasing investment in historic rehabilitation in Oklahoma.
3
Though not specifically articulated as program goals in Oklahoma State statute, evidence indicates that
that historic rehabilitation activities lead to additional economic development benefits at the local level,
such as preserving and restoring historic landmarks, restoring vacant building to active and productive
use, creating construction‐related jobs and bringing long‐term jobs to underutilized corridors and
neighborhoods, and revitalizing older urban core areas. State program evaluations and academic
research have demonstrated a significant and positive effect on property tax values, business attraction,
population regrowth, and higher employment. Though not readily quantifiable, the impact on place‐
making, heritage, and local identity is generally recognized to be significant and of intangible value. As
such, historic rehabilitation tax credits are proven tools that help to drive local revitalization and promote
more cost effective infill development patterns.
On a statewide level, however, the aggregate benefits of the program are less readily quantifiable. The
total effect on job growth is limited to fewer than 900 jobs per year, and the estimated impact on State
revenues is less than $3 million per year, only 17 percent of the cost incurred by the State. This finding is
consistent with those reported by other program analyses, largely because new jobs created by the
program are limited to temporary construction work. The long‐term fiscal impacts are experienced at the
local level, through growth in assessed value.
Recommendations
The project team recommends that Oklahoma adopt an annual cap to ensure some measure of future
budget predictability. Further, in order to keep administration burdens to a minimum once a cap is in
place, the team recommends that projects be accepted on a first‐come‐first‐served basis in lieu of a
supplementary assessment procedure.

Introduction
4
Overview
The Oklahoma Incentive Evaluation Commission (the Commission) was established in HB2182, which was
enacted and became law in 2015. It requires the Commission to conduct evaluations of all qualified state
incentives over a four‐year timeframe. The law also provides that criteria specific to each incentive be
used for the evaluation. The Historic Rehabilitation Tax Credit is one of the incentives reviewed in 2016
by the Commission with recommendations to the Governor and the State Legislature.
Introduction
More than 30 states have historic preservation incentives in place. The growth of these programs has
been driven in part by interest in leveraging the Federal Historic Preservation Tax Credit, which allows
developers to claim 20 percent income tax credits for the rehabilitation expenses incurred while restoring
income‐producing buildings that are listed on the National Register of Historic Places or certified by the
National Parks Service.
In 1992, in the Local Development Act, the Oklahoma Legislature enacted a rehabilitation tax credit
available to historic hotels and newspaper plants. In 2005, HB3024 expanded the program to income‐
producing historic buildings, and allowed projects that qualify for the federal 20 percent credit to
automatically qualify for the same amount of State tax credit without additional paperwork. 1 The State
tax credit mirrors the Federal Historic Preservation Tax Credit, and the program is administered by the
State Historic Preservation Office (SHPO) in partnership with the National Park Service.
Historic rehabilitation tax credits earned but not used may be carried forward for up to ten years. The
credits are also transferrable, if not used, for up to five years after being earned.
Criteria for Evaluation
A key factor in evaluating the effectiveness of incentive programs is to determine whether they are
meeting the stated goals as established in state statute or legislation. In the case of this credit, the
specific goals were not included in the legislation that established it. In other states, articulated goals
have included preserving and restoring historic landmarks, restoring vacant building to active and
productive use, creating construction‐related jobs and bringing long‐term jobs to underutilized corridors
and neighborhoods, and revitalizing older urban core areas.
There are other criteria that may be used to evaluate this program. To assist in a determination of the
effectiveness of the program, the Incentive Evaluation Commission has adopted the following criteria:
Total amount of rehabilitation expenditures and number of qualified projects
State tax credit as a percent of total rehabilitation improvement for qualified projects
Change in assessed value for rehabilitation projects approved for credit.
Percent of qualified structures on the national registry of historic places that receive assistance
1 68 O.S. Section 2357.41
5
Economic impact related to tourism, sales tax generated, etc.
Connection with other related business incentives
Return on investment (economic impact versus financial impact)
In the course of conducting this analysis, it became clear that local data availability constrained analysis
of criteria 3, 5, and 6, though findings pertaining to these criteria produced by other academic research
studies are reported in the benchmarking section below. In addition, it was determined that criterion 4
would not provide insight into the percentage of eligible buildings that have utilized the tax credit , as the
National Registry of Historic Places is not the sole determination of eligibility.

Program Background and Benchmarking

6
Background
In 1992, the Oklahoma legislature enacted a rehabilitation tax credit available to historic hotels and
newspaper plants in the Local Development Act. In 2005, House Bill 3024 expanded the program to
income‐producing historic buildings, creating a 20 percent income tax credit incentive for qualified
rehabilitation of Oklahoma’s certified historic buildings. Additionally, these 2005 amendments allowed
projects that qualify for the federal 20 percent credit to automatically qualify for the same amount of
state tax credit without additional paperwork.
After these changes, the number of tax credit projects expanded significantly until 2008, when
development projects of all kinds halted due to the recession. In 2010‐2012, the legislature instituted a
deferral of the tax credits, which allowed certified projects to move forward but not to claim credits
until the deferral was lifted. In 2013, the first year of the reinstated tax credits, the number of
completed projects more than doubled. As developers’ access to credit has continued to improve and
market rents are strengthening, the number of tax credits claimed has grown to $15.4 million in 2015.
There is no cap in place to limit future expenditure growth.
Source: State Historic Preservation Office, 2016
Since 2001, over 77 historic buildings have been rehabilitated using state historic tax credits, for a
cumulative total of $415 million in rehabilitation expenditures and total project investment reaching
$520 million.
7
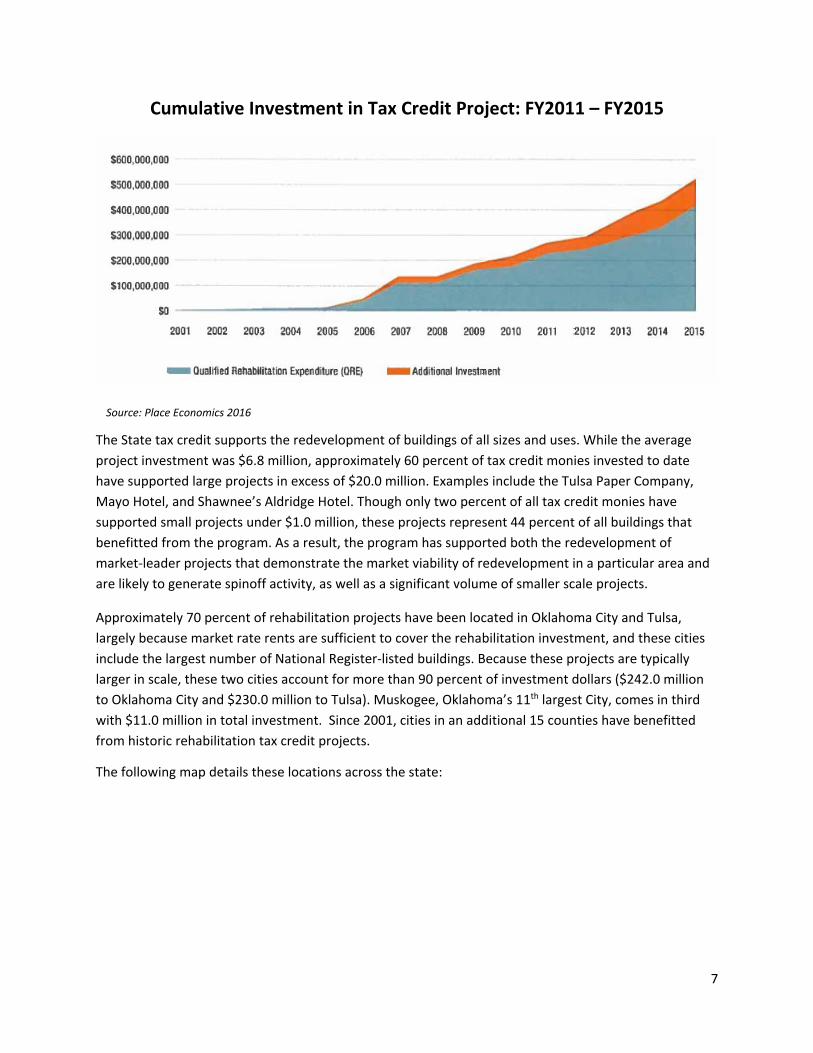
Cumulative Investment in Tax Credit Project: FY2011 – FY2015
The State tax credit supports the redevelopment of buildings of all sizes and uses. While the average
project investment was $6.8 million, approximately 60 percent of tax credit monies invested to date
have supported large projects in excess of $20.0 million. Examples include the Tulsa Paper Company,
Mayo Hotel, and Shawnee’s Aldridge Hotel. Though only two percent of all tax credit monies have
supported small projects under $1.0 million, these projects represent 44 percent of all buildings that
benefitted from the program. As a result, the program has supported both the redevelopment of
market‐leader projects that demonstrate the market viability of redevelopment in a particular area and
are likely to generate spinoff activity, as well as a significant volume of smaller scale projects.
Approximately 70 percent of rehabilitation projects have been located in Oklahoma City and Tulsa,
largely because market rate rents are sufficient to cover the rehabilitation investment, and these cities
include the largest number of National Register‐listed buildings. Because these projects are typically
larger in scale, these two cities account for more than 90 percent of investment dollars ($242.0 million
to Oklahoma City and $230.0 million to Tulsa). Muskogee, Oklahoma’s 11th largest City, comes in third
with $11.0 million in total investment. Since 2001, cities in an additional 15 counties have benefitted
from historic rehabilitation tax credit projects.
The following map details these locations across the state:
Source: Place Economics 2016

8
Source: Place Economics 2016
Benchmarking
Over half the states in the U.S. have tax credit programs that supplement federal historic preservation
tax credits. In 2014, it was estimated that 48 percent of the completed projects that benefitted from
the federal tax credit also received a state historic tax credit.2 Every state bordering Oklahoma has a
historic rehabilitation tax credit program in place. A review of these states provides insight into the
different incentives regional developers weigh when pursuing projects.
Among the group of comparison states, differentiating program characteristics include the credit
amount, credit caps, and eligibility that exceed federal limits.
Credit Amount: Oklahoma’s credit amount of 20 percent of eligible expenses is low among the
comparison group. Arkansas, Kansas, Missouri, and Texas each offer credits of 25 percent of eligible
expenses. Colorado’s credit is 20 to 30 percent. New Mexico offers up to 50 percent of eligible
expenses, but this is limited to $50,000, which indicates a focus on smaller projects. Looking beyond the
region, Connecticut encourages the historic rehabilitation of affordable housing developments by
offering a higher (30 percent) credit exclusively for this use.
Credit Caps: Oklahoma is one of 12 (out of 30) states that have chosen not to established an overall
annual program limit. While surrounding states may offer higher levels of subsidies to individual
projects, the number of projects that can benefit from these incentives are often limited by a cap.
Arkansas, for example has a limit of $125,000 per project. New Mexico has a cap of the lower of 50
2 National Park Services. 2015. Annual Tax Incentive Report. Available at: https://www.nps.gov/tps/tax‐incentives/taxdocs/tax‐incentives‐2015annual.pdf

9
percent of eligible expenses and five years of tax liability. Maryland directly appropriates the aggregate
amount of available credits.3
States with caps must decide whether to review applications on a first‐come‐first‐served basis or
institute a supplementary review process in order to determine which qualified applicants will receive
the state credit. The State of Ohio, for example, conducts a cost‐benefit analysis as part of the
application process, using a 100‐point scoring system measuring a project’s economic impact,
community benefit and return on investment to state and local governments. The analysis uses
estimates of the future, post‐rehabilitation property value, anticipated construction and permanent jobs
and anticipated economic activity at the project site to estimate future tax revenue to both state and
local governments. This additional step creates additional administrative burdens on both the applicant
and the state, but it does result in greater available data to document economic impacts.
Carry Forward. To avoid budget challenges, states not only need to know how much incentives will cost
over the long‐term but also need to be able anticipate how much the programs will cost from year to
year. States are more likely to face difficulties predicting the timing if companies are allowed to carry
forward unused credits to future years. The Pew Charitable Trust has conducted extensive research on
the use of incentives and has found that the longer a business can carry forward an incentive, the harder
it generally will be for state officials to predict the timing of the costs to the state. Oklahoma’s historic
preservation program allows 10‐year carryforwards, which is comparable to many other states—though
some states allow carryforwards of only five (or fewer) years.
Transferability: All states adjacent to Oklahoma allow for the transferability of tax credits.
Eligibility: Texas is the only bordering state to limit the credit to only income‐producing structures.
Other states allow private residences to access the tax credit. However, as will be discussed later, an
audit of Missouri’s state tax credit program found that greater care should be used in extending the
program to owner‐occupied structures to ensure that the tax credits make a tangible difference to
project feasibility.
Given the popularity of the historic rehabilitation tax credit program, several academic studies and
programmatic analysis have examined their effectiveness. Some of the overarching findings are
summarized below.
Several research studies conducted at the national and state level have found that historic preservation
has a positive impact on property values.4 The Center for Urban Policy Research at Rutgers University
3 Stennis Institute of Government. The Economic and Fiscal Effects of the Mississippi Historic Preservation Tax Incentives Program: An Overview for Decision‐Makers. Mississippi State University. Prepared at the Request of Philip Gunn, Speaker of the House. Available at: http://www.preservationnation.org/take‐action/advocacy‐center/additional‐resources/The‐Economic‐and‐Fiscal‐Effects‐of‐the‐Mississippi‐Historic‐Preservation‐Tax‐Incentives‐Program.pdf 4 Zahirovic‐Herbert, Velma and Chatterjee, Swarn. “Historic Preservation and Residential Property Values: Evidence from Quantile Regression.” Urban Studies 49.2 (2012): 369‐382; Clark, D.E. and Herrin, W.E. “Historical preservation and home sale prices: evidence from the Sacramento housing market.” Journal of Real Estate Finance and Economics 27 (1997): 29‐48.

10
has found that historic designation is associated with average property value increases ranging between
5 to 20 percent of the total property value.5 Based on a review of county auditor and treasurer records,
Cleveland State University (CSU) found that the property values of completed historic preservation tax
credit projects rose more than 250.0 percent, and parcels adjacent to projects increased an average of
12.1 percent.6 These increases in property values lead to additional local tax revenue to help local
communities grow and provide services. The CSU study found that taxes collected from properties on
project parcels increased by about $7.2 million overall, or about 355 percent, while taxes rose by about
55 percent on adjacent parcels and by 30 percent on radial parcels.
By linking the addresses of project buildings to granular state employment and business data,7 the CSU
study also found that the use of the historic rehabilitation led to an increase in employment, in the
number of business establishments, and in the wages earned by people working for businesses
registered in renovated buildings. From 2008 to 2014 (a period which includes the national recession),
total employment of businesses registered at project buildings increased by 3,612 jobs (a 58.3 percent
growth) and generated 70 more business establishments (a 50 percent increase), while adding $201.4
million in total wages (a 57.5 percent increase, accounting for inflation). Similar results were found in a
study conducted by the Iowa Department of Revenue, which additionally documented a 352.7 percent
increase in total annual sales revenues associated with businesses located in tax credit projects.8 In
other words, the tax credit has been found to be an important tool in attracting higher quality jobs and
businesses to otherwise underutilized neighborhoods and business districts. It is not clear how much of
these substantial local benefits translate into an aggregate impact on the statewide economy, though
the Iowa Department of Revenue survey did find that an average of 84.3 percent of tax‐credit supported
project expenditures are spent on in‐state goods and services.
Another theme evident in state tax credit assessments is that the historic rehabilitation tax credit
program has intangible benefits that are difficult to quantify. Through interviews, case studies, and
before/after documentation, many reports attempt to convey that these buildings, while useful
economic engines, are also intricately intertwined with the identity, meaning and heritage of the state’s
neighborhoods, towns and cities. A programmatic assessment conducted by the State of Connecticut
directly asserts that any job growth or increase in tax revenue spurred by the tax credit is incidental to
5 Leichenko, R., Coulson, E. and Listokin, D. “Historic preservation and residential property values: an analysis of Texas cities.” Urban Studies 38.11 (2001): 1973‐1987. 6 Cleveland State University, Center for Economic Development. October 2015. Ohio Historic Preservation Tax Credit Economic Impact Study. Prepared for the Ohio Development Services Agency. Available at: https://development.ohio.gov/files/redev/2015OHPTCComprehensiveReport.pdf 7 A government program that publishes a quarterly count of employment and wages reported by employers 8 Zhong Jin. December 2014. Iowa Historic Preservation and Cultural and Entertainment District Tax Credit: Tax Credits Program Evaluation Study.” Iowa Department of Revenue, Tax Research and Program Analysis Section. Available at: https://tax.iowa.gov/sites/files/idr/Historic%20Preservation%20Tax%20Credit%20Evaluation%20Study.pdf

11
the program’s primary purpose, which is to stimulate and support the preservation of historically
important buildings.9
State assessments generally agree that state tax credit programs that are administered in tandem with
the Federal tax credit are the most streamlined, transparent, and easy‐to‐use. Only one of the state
historic tax credit programmatic audits reviewed – that issued by the State of Missouri – issued specific
recommendations for improved program administration. These included:10
Minimizing the time that passes between project completion and tax credit certificate
issuance, which interest costs incurred by developers and reduces equity going toward
construction.
Modifying transferability regulations to increase the proportion of the tax credit dollars
allocated specifically towards rehabilitation. Options include: making the tax credit
refundable to make the credit more attractive to investors and reduce the incentive to sell
the certificates at a discount; requiring credits be assigned to a state agency, local political
subdivision or other not‐for‐profit organization that would sell the credits in the market and
grant the proceeds to the project; or eliminating the use of the state tax credits in favor of
direct appropriations through a state agency to fund historical rehabilitation projects.
Disallowing the use of tax credits on high value owner‐occupied residences. The Missouri
audit found that their credit has been used for renovations to homes with high property
values and high renovation costs. Because the tax credits represented a small percentage of
total renovation costs, the credits may not have been a significant determining factor in the
decision to redevelop the properties. The Audit recommended limiting the maximum tax
credit allowed for owner‐occupied residences to $50,000 and prohibiting the tax credit for
owner‐occupied residences if the home was purchased for more than $150,000.
Improving state oversight by conducting site visits, monitoring project approval time,
maintaining accurate program activity projections, and ensuring consistency in determining
the eligibility of certain costs.
It is worth noting that the Oklahoma administrative processes already incorporate these
recommendations, as noted in the administrative process section below.
The Missouri audit is also the only reviewed program assessment that recommends a reduction in the
state historic rehabilitation tax credit program. The State of Missouri has led the nation in qualified
rehabilitation expenses for historic preservation purposes, with approximately $80 million in
9 Department of Economic and Community Development. September 2014. An Assessment of Connecticut’s Tax Credit and Abatement Programs. Available at: http://www.ct.gov/ecd/lib/ecd/decd_sb_501_sec_27_report_revised_2013_final.pdf 10 Missouri State Auditor. March 2014. Historic Preservation Tax Credit Program. Report No. 2014‐018. Available at: http://app.auditor.mo.gov/Repository/Press/2014018370056.pdf

12
redemptions annually. The state imposed a $140 million annual program limit in 2010; and the
Governor’s Tax Credit Review Commission recommended a further reduction of this limit to $75 million.
The following tables summarize program characteristics for neighboring states, as well as project caps
for all state programs currently in place nationwide.

13
Credit Amount Cap
Minimum Investment
Private Residence Eligible
Carry Forward Transferrable
Oklahoma 20% No Cap Greater of $5,000 or the structure's book
value No 10 Years Yes
Arkansas 25%
$125,000 per project, $4 million state
aggregate cap per year
$25,000 Yes 5 years Yes
Colorado 20 to 30% $1 million annually,
per property
25% of the structure's book
value Yes 10 years Yes
Kansas 25% No Cap $5,000 Yes 10 years Yes Missouri 25% No Cap None Specified Yes 10 years Yes
New Mexico 50% Lower of $25,000 or
five years of tax liability per project
None Specified Yes 4 years Yes
Texas 25% No Cap None Specified No 5 years Yes

14
Aggregate and Project Caps on State Historic Tax Credits for Commercial Properties11
11 Stennis Institute of Government. The Economic and Fiscal Effects of the Mississippi Historic Preservation Tax Incentives Program: An Overview for Decision‐Makers. Mississippi State University. Prepared at the Request of Philip Gunn, Speaker of the House. Available at: http://www.preservationnation.org/take‐action/advocacy‐center/additional‐resources/The‐Economic‐and‐Fiscal‐Effects‐of‐the‐Mississippi‐Historic‐Preservation‐Tax‐Incentives‐Program.pdf

Fiscal Impact

14
For this evaluation, fiscal impact is considered to be the directly attributable impact of the credit on State
revenues and expenditures. The evaluation will discuss but not quantify revenue and expenditure impacts
on local governments; as noted in the benchmarking section above, research indicates that significant
benefits will accrue to local governments related to increased property value and increasing the economic
use of formerly underutilized historic properties. However, there is far less attenuation from these local
impacts for a discussion of a state incentive program – for a variety of reasons (including the impact of local
decision making outside the state’s control on local revenues and expenditures and the widely divergent
impacts throughout the state).
The following table identifies the tax credits associated with this program, by year of project completion
and final certification. As already noted, the developers may carry forward the tax credits for up to 10
years and transfer them for up to five years.
There is, of course, some additional revenue that would be generated from economic activity associated
with this credit, which will be discussed in the following chapter. Note that the costs of program
administration are born by the SHPO and are neither disaggregated from the rest of the Office’s annual
expenditures nor included in the table.
One of the requirements of HB2182 is that each evaluation should determine “whether adequate
protections are in place to ensure the fiscal impact of the incentive does not increase substantially
beyond the state’s expectations in future years.” As illustrated in the table, the financial impacts
YearNo. of
Projects
Total
Development
Investment
Eligible
ExpensesOK Tax Credits
Annual
Growth
2001 2 $3,191,081 $3,191,081 $638,216
2002 5 $5,004,763 $3,275,015 $655,003 2.6%
2003 4 $2,152,971 $2,130,646 $426,129 ‐34.9%
2004 1 $352,480 $352,480 $70,496 ‐83.5%
2005 3 $1,044,270 $1,042,724 $208,545 195.8%
2006 7 $32,943,797 $31,188,899 $6,237,780 2891.1%
2007 5 $92,002,882 $70,079,366 $14,015,873 124.7%
2008 4 $1,221,769 $1,157,269 $231,454 ‐98.3%
2009 2 $48,358,427 $48,342,527 $9,668,505 4077.3%
2010 5 $31,177,962 $16,567,171 $3,313,434 ‐65.7%
2011 7 $53,129,592 $50,458,876 $10,091,775 204.6%
2012 6 $21,364,103 $19,593,647 $3,918,729 ‐61.2%
2013 5 $77,991,394 $43,330,869 $8,666,174 121.1%
2014 8 $64,477,895 $39,239,000 $7,847,800 ‐9.4%
2015 13 $85,908,755 $85,814,255 $17,162,851 118.7%
Total 77 $520,322,141 $415,763,825 $83,152,765
15
associated with this program are growing and will impact the revenue structure for an additional ten
years thereafter. Several states have struggled when historic rehabilitation tax credits prove more
popular than anticipated. As noted previously, the Missouri tax credit program has averaged $123.0
million for the past five years, almost 10 times larger than the estimated annual cost of $14.3 million
projected at the time that the program was created.12 This trend led the State Legislature to introduce an
annual cap in 2010, and an additional lowering of the cap has been recommended. Oklahoma may find
that a similar modification to the historic rehabilitation program may be a necessary and appropriate step
to help ensure that the fiscal impact does not exceed the State’s expectation in future years.
12 Missouri State Auditor. March 2014. Historic Preservation Tax Credit Program. Report No. 2014‐018. http://app.auditor.mo.gov/repository/press/2014018832873.pdf
Economic Impact
16
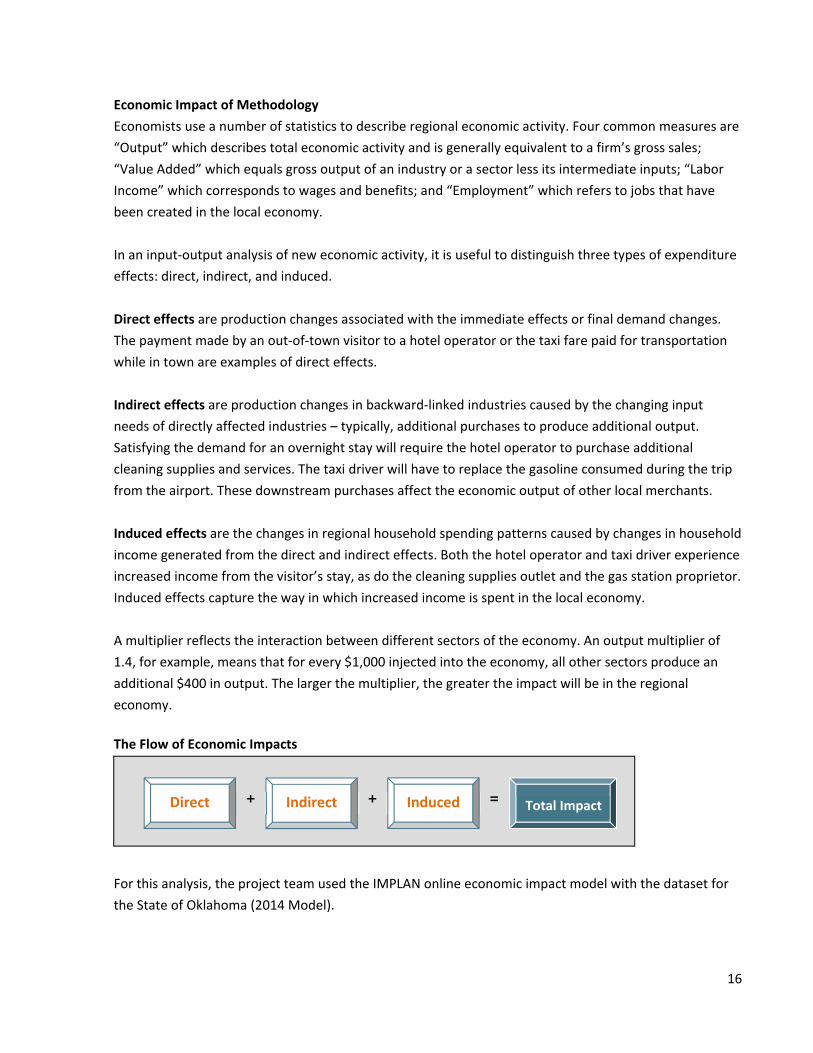
Economic Impact of Methodology
Economists use a number of statistics to describe regional economic activity. Four common measures are
“Output” which describes total economic activity and is generally equivalent to a firm’s gross sales;
“Value Added” which equals gross output of an industry or a sector less its intermediate inputs; “Labor
Income” which corresponds to wages and benefits; and “Employment” which refers to jobs that have
been created in the local economy.
In an input‐output analysis of new economic activity, it is useful to distinguish three types of expenditure
effects: direct, indirect, and induced.
Direct effects are production changes associated with the immediate effects or final demand changes.
The payment made by an out‐of‐town visitor to a hotel operator or the taxi fare paid for transportation
while in town are examples of direct effects.
Indirect effects are production changes in backward‐linked industries caused by the changing input
needs of directly affected industries – typically, additional purchases to produce additional output.
Satisfying the demand for an overnight stay will require the hotel operator to purchase additional
cleaning supplies and services. The taxi driver will have to replace the gasoline consumed during the trip
from the airport. These downstream purchases affect the economic output of other local merchants.
Induced effects are the changes in regional household spending patterns caused by changes in household
income generated from the direct and indirect effects. Both the hotel operator and taxi driver experience
increased income from the visitor’s stay, as do the cleaning supplies outlet and the gas station proprietor.
Induced effects capture the way in which increased income is spent in the local economy.
A multiplier reflects the interaction between different sectors of the economy. An output multiplier of
1.4, for example, means that for every $1,000 injected into the economy, all other sectors produce an
additional $400 in output. The larger the multiplier, the greater the impact will be in the regional
economy.
The Flow of Economic Impacts
For this analysis, the project team used the IMPLAN online economic impact model with the dataset for
the State of Oklahoma (2014 Model).
Indirect Induced Total Impact Direct + + =
17
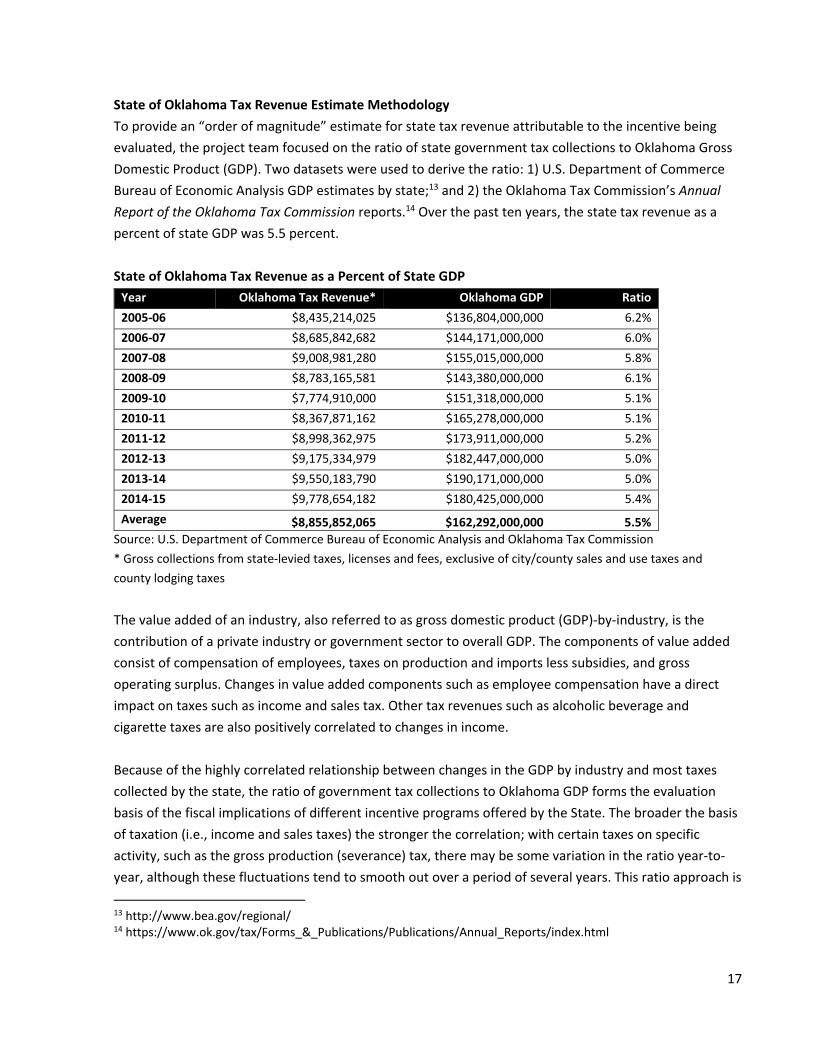
State of Oklahoma Tax Revenue Estimate Methodology
To provide an “order of magnitude” estimate for state tax revenue attributable to the incentive being
evaluated, the project team focused on the ratio of state government tax collections to Oklahoma Gross
Domestic Product (GDP). Two datasets were used to derive the ratio: 1) U.S. Department of Commerce
Bureau of Economic Analysis GDP estimates by state;13 and 2) the Oklahoma Tax Commission’s Annual
Report of the Oklahoma Tax Commission reports.14 Over the past ten years, the state tax revenue as a
percent of state GDP was 5.5 percent.
State of Oklahoma Tax Revenue as a Percent of State GDP
Year Oklahoma Tax Revenue* Oklahoma GDP Ratio
2005‐06 $8,435,214,025 $136,804,000,000 6.2%
2006‐07 $8,685,842,682 $144,171,000,000 6.0%
2007‐08 $9,008,981,280 $155,015,000,000 5.8%
2008‐09 $8,783,165,581 $143,380,000,000 6.1%
2009‐10 $7,774,910,000 $151,318,000,000 5.1%
2010‐11 $8,367,871,162 $165,278,000,000 5.1%
2011‐12 $8,998,362,975 $173,911,000,000 5.2%
2012‐13 $9,175,334,979 $182,447,000,000 5.0%
2013‐14 $9,550,183,790 $190,171,000,000 5.0%
2014‐15 $9,778,654,182 $180,425,000,000 5.4%
Average $8,855,852,065 $162,292,000,000 5.5%
Source: U.S. Department of Commerce Bureau of Economic Analysis and Oklahoma Tax Commission
* Gross collections from state‐levied taxes, licenses and fees, exclusive of city/county sales and use taxes and
county lodging taxes
The value added of an industry, also referred to as gross domestic product (GDP)‐by‐industry, is the
contribution of a private industry or government sector to overall GDP. The components of value added
consist of compensation of employees, taxes on production and imports less subsidies, and gross
operating surplus. Changes in value added components such as employee compensation have a direct
impact on taxes such as income and sales tax. Other tax revenues such as alcoholic beverage and
cigarette taxes are also positively correlated to changes in income.
Because of the highly correlated relationship between changes in the GDP by industry and most taxes
collected by the state, the ratio of government tax collections to Oklahoma GDP forms the evaluation
basis of the fiscal implications of different incentive programs offered by the State. The broader the basis
of taxation (i.e., income and sales taxes) the stronger the correlation; with certain taxes on specific
activity, such as the gross production (severance) tax, there may be some variation in the ratio year‐to‐
year, although these fluctuations tend to smooth out over a period of several years. This ratio approach is
13 http://www.bea.gov/regional/ 14 https://www.ok.gov/tax/Forms_&_Publications/Publications/Annual_Reports/index.html

18
somewhat standard practice, and is consistent with what IMPLAN and other economic modeling software
programs use to estimate changes in tax revenue.
To estimate State of Oklahoma tax revenue generated in a given year, TXP multiplied the total value
added figure produced by the IMPLAN model by the corresponding annual ratio (about 5.5%). For
example, if the total value added was $1.0 million, then the estimated State of Oklahoma tax revenue
was $55,000 ($1.0 million x 5.5%).

19
Data Collection, Model Inputs, and Other Issues
The project team performed the following steps to derive the economic and tax revenue impact:
1. The project team collected existing data and studies from State of Oklahoma agencies including
the Oklahoma Tax Commission and Oklahoma Department of Commerce.
2. The project team collected and analyzed studies performed or commissioned by other
organizations such as the Tulsa Foundation for Architecture and the National Park Service.
3. Data on Oklahoma annual estimated qualified rehabilitation expenditures (QRE) was obtained
from the National Park Service – U.S. Department of the Interior15 for the years 2011 to 2015.
4. The certified rehabilitation costs, reported on the Part 3 application form, represent the
estimated amount reported by the applicant to be claimed as qualifying costs associated with the
rehabilitation. These costs do not include new construction and other work ineligible for the
credit.
5. IMPLAN sector 57 Construction of New Commercial Structures was used to model the economic
impact.
6. There was not sufficient detail available to model the economic impact of new construction and
other work ineligible for the credit.
7. It was not possible to determine if the project developer would have constructed a new facility in
Oklahoma instead of rehabilitating the historic facility. In some situations, the historic building
and the tax credit was critical to the project success. In other circumstances, a project developer
might have chosen a different building to renovate.
8. Total expenditures (also referred to as “economic activity”) are not the same as the tax historic
tax credit. It is common, but not accurate, in economic impact studies to compare economic
activity against the incentives offered. This comparison does not provide any insights into if the
public sector is making a net profit or loss on the incentive program.
15 https://www.nps.gov/tps/tax‐incentives/reports.htm

20
Annual Economic Impact of the State of Oklahoma Historic Preservation Tax Credit
Year Output Value Added Labor Income Employment
Estimated OK
Tax Revenue
2011 Direct Effect $48,857,842 $21,892,657 $18,945,199 393
Indirect Effect $17,790,490 $8,354,573 $5,210,973 90
Induced Effect $18,060,769 $9,859,854 $5,581,557 137
Total Effect $84,709,102 $40,107,084 $29,737,729 620 $2,060,753
2012 Direct Effect $17,905,351 $8,023,189 $6,943,009 144
Indirect Effect $6,519,833 $3,061,772 $1,909,710 33
Induced Effect $6,618,885 $3,613,425 $2,045,521 50
Total Effect $31,044,069 $14,698,386 $10,898,240 227 $744,166
2013 Direct Effect $44,308,812 $19,854,288 $17,181,260 357
Indirect Effect $16,134,063 $7,576,700 $4,725,792 82
Induced Effect $16,379,177 $8,941,828 $5,061,873 124
Total Effect $76,822,052 $36,372,815 $26,968,925 563 $1,881,973
2014 Direct Effect $45,094,393 $20,206,298 $17,485,878 363
Indirect Effect $16,420,115 $7,711,033 $4,809,579 83
Induced Effect $16,669,574 $9,100,363 $5,151,618 126
Total Effect $78,184,082 $37,017,693 $27,447,075 572 $1,861,635
2015 Direct Effect $70,237,721 $31,472,744 $27,235,497 566
Indirect Effect $25,575,495 $12,010,481 $7,491,261 130
Induced Effect $25,964,046 $14,174,462 $8,024,011 196
Total Effect $121,777,262 $57,657,688 $42,750,770 892 $2,895,507
Source: TXP, Inc

Technical and Administrative Issues

21
Overview
To qualify for the Oklahoma State tax incentive, projects must qualify for the federal tax credit, meeting
the requirements established by both the Internal Revenue Service and the U.S. Department of the
Interior. The State Historic Preservation Office (SHPO) serves as the initial point of contact for applicants,
and it participates in the determination that a building is a "certified historic structure" and the review of
rehabilitation work. The U.S. Department of the Interior, National Park Service (NPS), is the agency
responsible for certifying historic structures and rehabilitation work. The Oklahoma Tax Commission
(OTC) addresses taxpayer questions regarding the State tax return, State statutes, and OTC rules for using
the State tax credits.
The administrative process has three parts:
1. Building Eligibility. In order to be eligible for historic preservation tax credits, all projects must be
certified as historic structures. A certified historic structure is a building that is listed individually
in the National Register of Historic Places —OR— a building that is located in a registered historic
district and certified by the National Park Service as contributing to the historic significance of
that district. The “structure” must be a building—not a bridge, ship, railroad car, or dam (A
registered historic district is any district listed in the National Register of Historic Places. Buildings
individually listed in the National Register of Historic Places are already certified historic
structures).
Owners of buildings within historic districts must complete Part 1 of the Historic Preservation
Certification Application—Evaluation of Significance. The owner submits this application to SHPO.
The SHPO reviews the application within 30 days of receipt and forwards it to the NPS with a
recommendation for approving or denying the request. The NPS then has 30 days to determine
whether the building contributes to the historic district. If so, the building becomes a certified
historic structure. The NPS bases its decision on the U.S. Secretary of the Interior’s Standards for
Evaluating Significance within Registered Historic Districts.
If the building is not within a historic district but otherwise qualifies for the National Register,
NPS will issue a preliminary determination of significance. Under such circumstances, formal
listing of the building in the National Register must occur within 30 months of the date the tax
credits are claimed. The formal National Register listing process is separate from the Historic
Preservation Certification Application process, though SHPO serves as the applicant’s primary
point of contact for both processes.
2. Preliminary Certification of Qualified Expenses. The NPS must approve, or “certify,” all
rehabilitation projects, ensuring that the proposed project will not damage, destroy, or cover
materials or features, whether interior or exterior, that help define the building’s historic
character. Before rehabilitation work begins, the property owner completes a Part II application
to receive preliminary certification of the proposed work. SHPO reviews the application within 30

22
days of receipt, requests additional information if needed, and transmits the application to NPS
along with its assessment of eligibility. NPS then has 30 days to review and make a determination
of eligibility.
In order to qualify for the federal credit, the following conditions must be met:
‐ The building must be depreciable. That is, it must be used in a trade or business or held
for the production of income. It may be used for offices, for commercial, industrial or
agricultural enterprises, or for rental housing. It may not serve exclusively as the owner’s
private residence.
‐ Qualified rehabilitation expenditures (QRE) include costs of the work on the historic
building, as well as architectural and engineering fees, site survey fees, legal expenses,
development fees, and other construction‐related costs, if such costs are added to the
property basis and are reasonable and related to the services performed. They do not
include acquisition or furnishing costs, new additions that expand the building, new
building construction, or parking lots, sidewalks, landscaping, or other related facilities.
On average, approximately 20 percent of the funds invested in a historic rehabilitation
project are not eligible for the tax credit.
‐ Upon receiving preliminary certification, the owner must complete the rehabilitation
project within 24 months or in phases with all work completed within 60 months of the
approved Part 2. Should changes in the proposed work be deemed necessary, the owner
must submit an amendment sheet in the same manner as the original Part II.
‐ The property must be placed in service (that is, returned to use). The rehabilitation tax
credit is generally allowed in the taxable year the rehabilitated property is placed in
service.
3. Certification of Complete Work. Upon completion of the rehabilitation project, the property
owner completes the Part III application to obtain final project approval. Within 30 days of
submission, SHPO conducts an on‐site inspection of the completed project, and transmits the
application to NPS along with its assessment of eligibility. NPS then has 30 days to review and
issue the final certification.
4. Tax Credit Receipt. The federal tax credit is equal to 20 percent of QRE. This means that, when
coupled with the State credit, 40 percent of eligible expenses may be reimbursed for qualified
historic rehabilitation projects in Oklahoma. Owners may begin claiming the tax credits on the
basis of their approved Part II application. However, failure to obtain an approved Part 3
application will result in recapture of any credits claimed.
Due to the transferability of the tax credit during the five years following the year of
rehabilitation, developers are able to transfer the amount of the tax credit to an entity or person
to offset tax liability. Applicants generally sell the credit to third parties and use the proceeds to
reduce construction‐related debt, but the sale of a HPTC certificate creates taxable income,

23
resulting in additional income tax due by the seller. As a result, only $0.80 to $0.90 of every
Oklahoma tax credit dollar issued actually goes towards rehabilitation costs; the remainder goes
to investors, tax credit brokers or syndicators, and the federal and state government (in the form
of income taxes). This is higher than the nationwide average of $0.65 to $0.75 per dollar. Though
the length of the transferability period allows the Oklahoma tax credit to convey more “bang for
the buck” than those offered by other states, this also introduces a measure of unpredictability
into the state budget.
The owner must hold the building for five full years after completing the rehabilitation or pay
back the credit. If the owner disposes of the building within a year after it is placed in service, 100
percent of the credit is recaptured. For properties held between one and five years, the tax credit
recapture amount is reduced by 20 percent per year. The NPS or the SHPO may inspect a
rehabilitated property at any time during the five‐year period. The NPS may revoke certification if
work was not done as described in the Historic Preservation Certification Application, or if
unapproved alterations were made for up to five years after certification of the rehabilitation.
Work done after the initial five year period is not subject to review.
5. Reporting. Both SHPO and NPS maintain databases with information on tax credit projects, and
NPS issues annual reports for each fiscal year. The Federal data on the completed projects is also
available through the free data interface PolicyMap, with the name and address of the property,
the final estimated qualified cost, and the use available.
Summary
Overall, the decision by legislators to tie the State tax credit to the federal process results in more
efficient, streamlined, and accountable program administration. Each project is vetted and screened by
SHPO and the NPS, and the credit is granted only after completion and certification of compliance with
the U.S. Secretary of Interior Standards. The incremental burdens to the State above and beyond those
involved in the administration of the federal tax credit program are minimal.

Outcomes

24
Outcomes
From the prior discussion, the following have been identified as key issues for evaluation:
1. What has been the impact of the credit on identified goals?
2. How does Oklahoma’s experience compare to the nation as a whole and other states?
3. How should the identified costs be weighed against the benefits (both quantitative and qualitative)?
Impact: Increase Investment in Historic Rehabilitation
Whether the underlying goal is to increase property
investment or support the construction industry or
revitalize aging neighborhoods, the stated objective of the
historic tax credit program is to increase the number of
historic rehabilitation projects in the state of Oklahoma.
The State tax credit program has been highly successful in
this regard, both compared to the period prior to the tax
credit as well as compared to nationwide trends. Since
2005, the year of that the program was tied to the federal
process, the average number of annual historic
rehabilitation projects has quadrupled, and the total
development investment has increased by 82 times the
prior investment, from just over $1.0 million in 2005 to
$85.9 million in 2015. According to National Park Services
Data, in FY2009, Oklahoma ranked 41st out of 47 states in
the number of certified expenses; in FY2015, the state
came in at 16th. 16 Of the six states that border Oklahoma,
only Missouri saw more historic property tax investment.
According to data compiled from the NPS by Place
Economics, between FY2000‐FY2005, developers in Texas invested almost 17 times more in historic
preservation developments as developers in Oklahoma. These trends have changed demonstratively
under Oklahoma’s current regulations. In the last five years for which data was available, Oklahoma’s
historic preservation development was 14 percent higher than that of Texas. The recently‐enacted Texas
historic tax credit program was modeled after the Oklahoma Credit.17
16 U.S. Department of the Interior, National Park Service, Technical Preservation Services. March 2016. “Statistical Report and Analysis for Fiscal Year 2015.” Federal Tax Incentives for Rehabilitating Historic Buildings. Available at: http://www.nps.gov/tps/tax‐incentives/taxdocs/tax‐incentives‐2015statistical.pdf 17 Place Economics. 2016. Oklahoma Historic Tax Credit: Impact on the Oklahoma Economy. Prepared for the Tulsa Foundation for Architecture.
Source: Place Economics 2016

25
Impact on Identified Goals: the “But For” Analysis.
An important factor in considering the efficacy of incentives is the consideration of whether the incentive
is necessary to spur the investment. In the theory of incentives, the ‘but for’ test refers to the argument
that a project or a capital investment would not be made without the incentive (‘but for the incentive’
the rehabilitation project would not occur in Oklahoma). In the case of many projects, the existence of
incentives in other states can be cited as a need for the Oklahoma incentive – ‘but for’ the Oklahoma
incentive, the project will occur in other states. Tax incentives provide benefits to states to the extent
they change behavior (as opposed to rewarding what a business or individual would have done anyway).
In the case of historic preservation credits, the key question is to what extent the incentive caused
rehabilitation to occur within the state that wouldn’t have occurred otherwise.
With historic preservation, this question is complicated by the presence of federal tax incentives for
rehabilitating historic buildings, the largest of which provides a 20% credit that often stacks with state‐
provided credits. Evaluations not taking federal credits into account likely overstate the economic
impacts of state incentives. However, it is extremely difficult and labor intensive to obtain the data
necessary to disaggregate the impacts of these two tax incentives.
Several studies have developed methods to estimate the added value of the state tax credits. One
approach is to present the results based on different scenarios, then analyze which scenario is most
plausible. An assessment by the State of Connecticut presents four attribution scenarios: the incentive is
responsible for 0%, 20%, 50%, and 100% of the measured economic activity.18 Another approach is to
study projects that applied for state incentives but did not receive them. If projects that were rejected for
incentives ended up going forward anyway, that could be a sign that the incentives often are not
necessary.19 The State of Oklahoma does not retain this type of data, because it is not required under the
federal process.
A third study used survey instruments and focus groups with tax credit users, who reported that very
few, if any, of the projects on which they have worked or with which they are familiar would have been
completed without tax credits. A few might have been done, but at such a low level of quality that they
might not have been able to attract users. Both tax credit users and local‐government officials stated that
there is ample demand for rehabilitated historic properties in their cities, but the costs of rehabilitation
are so great that tax credits are still needed to close the gap between market value after rehabilitation
and the costs of rehabilitation.20
18 Department of Economic and Community Development. September 2014. An Assessment of Connecticut’s Tax Credit and Abatement Programs. Available At: http://www.ct.gov/ecd/lib/ecd/decd_sb_501_sec_27_report_revised_2013_final.pdf 19 Ohio Development Services Agency. 2015. Ohio Historic Preservation Tax Credit: 2015 Comprehensive Report. Available at: https://development.ohio.gov/files/redev/2015OHPTCComprehensiveReport.pdf 20 Virginia Commonwealth University, Center for Urban and Regional Development. January 2014. Economic Impact of Historic Rehabilitation Tax Credit Programs in Virginia. Available at: https://preservationvirginia.org/docs/VCU_Historic_Tax_Credit_Report_FINAL_21‐1‐2014smallpdf.com.pdf

26
In other words, it is not possible to conclusively demonstrate that the state tax credit changes behavior
independently from the developer tax credit. However, self‐reported data and findings from academic
research indicate that this may be the case.
Cost Benefit Analysis
The financial analysis suggests that the costs of providing the historic tax credit are likely to continue to
grow in the near future. The economic impact analysis suggests that the estimated tax revenue to the
State of Oklahoma does not approach the level of the tax incentive.
These are aggregate impacts, and do not take into account spinoff effects on adjacent property values,
the tipping point effect of a significant development in an otherwise underutilized retail corridor, or cost
savings in local service provision due to infill development. In smaller towns, one building can have a big
impact and start a wave of interest for new businesses and privately funded building rehabilitation
projects. Local communities benefit from reuse of existing buildings because infrastructure is already in
place. Constructing a new building on undeveloped land requires new roads and/ or utility lines. Historic
buildings can often take advantage of existing roads and utilities, saving infrastructure costs to local
governments. These local effects, which can be vitally important on the neighborhood and city level, are
not reflected in the aggregate statewide perspective.

Recommendations
27
Recommendation: Reconfigure with a Program Cap
The historic rehabilitation tax credit is widely used around the country, and has been generally
recognized for its significant and wide ranging impacts on the local level. State program evaluations and
academic research have demonstrated a significant and positive effect on property tax values, business
attraction, population regrowth, and higher employment. Though not readily quantifiable, the impact on
place‐making, heritage, and local identify is generally recognized to be significant and of intangible value.
As such, historic rehabilitation tax credits are proven tools that help to drive local revitalization and
promote more cost effective infill development patterns.
On a statewide level, however, the aggregate benefits of the program are less readily quantifiable. The
total effect on job growth is limited to fewer than 900 jobs per year, and the estimated impact on State
revenues is less than $3.0 million per year, only 17 percent of the cost incurred by the State. This finding
is consistent with those reported by other program analyses, largely because new jobs created by the
program are limited to temporary construction work. The long‐term fiscal impacts are experienced at the
local level, through growth in assessed value.
The Oklahoma program is among the most efficient nationwide, because it is directly tied to the federal
program with no additional administrative burdens or costs. The policies and procedures in place are
timely, transparent, and accountable.
The 2005 legislation changes – including both the expansion of eligibility and the alignment of
administrative procedures with federal requirements – have led to a substantial increase in tax credit
utilization. Since 2005, the year of that the program was tied to the federal process, the average annual
historic rehabilitation projects has quadrupled and the total development investment has increased 82
times, from just over $1.0 million in 2005 to $85.9 million in 2015. In FY2009, Oklahoma ranked 41st out
of 47 states in the number of certified expenses; in FY2015, the state came in at 16th. The program has
been exceptionally successful at increasing investment in historic rehabilitation in Oklahoma.
However, without a cap in place, the cost burden on the State could continue to grow beyond the point
of desirability. Other states, such as neighboring Missouri, have experienced growth in this program far
beyond the initial predicted utilization levels. At present, more than half of all states have an annual cap
in place.
The project team recommends that Oklahoma adopt an annual cap to ensure some measure of future
budget predictability. Further, in order to keep administration burdens to a minimum, once a program
cap is in place, the team recommends that projects be accepted on a first‐come‐first‐serve basis in lieu of
a supplementary assessment procedure.