Histamine production in Lactobacillus vaginalis improves ...
36
1 Histamine production in Lactobacillus vaginalis improves cell 1 survival at low pH by counteracting the acidification of the 2 cytosol 3 4 Maria Diaz 1 , Beatriz del Rio 1,2, *, Victor Ladero 1,2 , Begoña Redruello 1 , María 5 Fernández 1,2 , Maria Cruz Martin 1 , and Miguel A. Alvarez 1,2 6 7 1 Dairy Research Institute (IPLA-CSIC), Paseo Rio Linares s/n, 33300 8 Villaviciosa, Spain. 9 2 Molecular Microbiology Group, Instituto de Investigación Sanitaria del 10 Principado de Asturias (ISPA), Oviedo, Spain 11 12 *Corresponding author: Beatriz del Rio 13 Phone: +34 985 89 21 31 Fax: +34 985 89 22 33 14 Email: [email protected] 15 16 Email addresses: 17 [email protected] 18 [email protected] (B. del Rio) 19 [email protected] (V. Ladero) 20 [email protected] (B. Redruello) 21 [email protected] (M. Fernandez) 22 [email protected] (M.C. Martin) 23 [email protected] (M.A. Alvarez) 24
Transcript of Histamine production in Lactobacillus vaginalis improves ...

1
Histamine production in Lactobacillus vaginalis improves cell 1
survival at low pH by counteracting the acidification of the 2
cytosol 3
4
Maria Diaz1, Beatriz del Rio1,2,*, Victor Ladero1,2, Begoña Redruello1, María 5
Fernández1,2, Maria Cruz Martin1, and Miguel A. Alvarez1,2 6
7
1Dairy Research Institute (IPLA-CSIC), Paseo Rio Linares s/n, 33300 8
Villaviciosa, Spain. 9
2Molecular Microbiology Group, Instituto de Investigación Sanitaria del 10
Principado de Asturias (ISPA), Oviedo, Spain 11
12
*Corresponding author: Beatriz del Rio 13
Phone: +34 985 89 21 31 Fax: +34 985 89 22 33 14
Email: [email protected] 15
16
Email addresses: 17
[email protected] (B. del Rio) 19
[email protected] (V. Ladero) 20
[email protected] (B. Redruello) 21
[email protected] (M. Fernandez) 22
[email protected] (M.C. Martin) 23
[email protected] (M.A. Alvarez) 24

2
Abstract 25
Histamine, one of the most toxic and commonly encountered biogenic amines 26
(BA) in food, is produced by the microbial decarboxylation of histidine. It may 27
accumulate at high concentrations in fish and fermented food. Cheese has 28
some of the highest histamine concentrations, the result of the histidine-29
decarboxylase activity of certain lactic acid bacteria (LAB). The present work 30
describes the nucleotide sequence and transcriptional organization of the gene 31
cluster responsible for histamine biosynthesis (the HDC cluster) in Lactobacillus 32
vaginalis IPLA 11064 isolated from cheese. The influence of histidine 33
availability and pH on histamine production and the expression of the HDC 34
cluster genes is also examined. The results suggest that the production of 35
histamine under acidic conditions improves cell survival by maintaining the 36
cytosol at an appropriate pH. 37
38
Keywords 39
Biogenic amines, histamine, Lactobacillus vaginalis, HDC cluster, gene 40
expression, internal pH 41
42
3
1. Introduction 43
Histamine is a biogenic amine (BA) that can accumulate in food through the 44
undesirable microbial decarboxylation of histidine. Histamine is commonly found 45
at high concentrations in fish and fermented foods (EFSA, 2011; Shalaby, 46
1996). The consumption of food rich in histamine may trigger neurological, 47
gastrointestinal and respiratory disorders (Alvarez and Moreno-Arribas, 2014; 48
Ladero et al., 2010); indeed, histamine has been confirmed cytotoxic at food 49
concentrations (Linares et al., 2016). A synergistic effect with tyramine, another 50
BA frequently detected in cheeses and other fermented foods, is known to 51
occur (del Rio et al., 2017). Histamine is the only BA for which maximum legal 52
limits have been established - although only for fish and fish products (200-400 53
mg/kg, established by European Union Commission Directives 2073/2005 and 54
1019/2013, and 50 mg/kg, established by the US Food and Drug Administration 55
(FDA, 2001)]). It has been detected in cheese, however, at concentrations far 56
exceeding these suggested limits (Fernandez et al., 2007). 57
In fermented foods, histamine is mainly produced by certain LAB (Linares et al., 58
2011; Shalaby, 1996), which catalyze the decarboxylation of histidine via the 59
action of the enzyme histidine decarboxylase (HdcA). The secretion of 60
histamine from the cytosol in exchange for histidine is undertaken by the 61
antiporter HdcP. These proteins are encoded by the genes hdcA and hdcP 62
respectively, both of which are found in the HDC cluster. The HDC cluster can 63
also include the gene hdcB, which codes for a protein that catalyses the 64
maturation of HdcA (Trip et al., 2011), and hisS, which encodes a putative 65
histidyl-tRNA synthetase (Martin et al., 2005). The HDC cluster has been 66
described in several species of LAB, including Lactobacillus saerimneri 67
4
(Romano et al., 2013), Lactobacillus parabuchneri (formerly L. buchneri) (Diaz 68
et al., 2016; Martin et al., 2005), Lactobacillus hilgardii (Lucas et al., 2005), 69
Lactobacillus vaginalis (Diaz et al., 2015), Tetragenococcus halophilus (Satomi 70
et al., 2008), and Streptococcus thermophilus (Calles-Enriquez et al., 2010). It 71
can be also found in the genome of Lactobacillus reuteri (Gene ID: 5189585) 72
and Tetragenococcus muriaticus (Gene ID: 13919182). 73
Amino acid decarboxylations are proton-consuming reactions that may provide 74
acid resistance by helping to maintain the intracellular pH (Kanjee and Houry, 75
2013). Certainly, tyrosine decarboxylation improves the survival of 76
Enterococcus faecalis under acidic conditions (Perez et al., 2015), and when 77
histidine is present the heterologous expression of the corresponding 78
decarboxylase pathway in S. thermophilus and Lactococcus lactis increases 79
their survival of acid stress (Trip et al., 2012). This suggests that pH might 80
regulate amino acid decarboxylation via gene expression and/or enzymatic 81
activity. An increase in histidine decarboxylation activity at acidic pH has been 82
reported for L. saerimneri and S. thermophilus (Schelp et al., 2001; Tabanelli et 83
al., 2012). Histamine accumulation is also influenced by environmental factors 84
such as, temperature, salt concentration, thermization, and the presence of 85
ethanol (Landete et al., 2008b; Linares et al., 2012a). Understanding the factors 86
that influence histamine accumulation in foods such as cheese is key if it is to 87
be reduced. 88
The present work examines the transcriptional organization of the HDC cluster 89
in the cheese isolate L. vaginalis IPLA 11064, a representative histamine-90
producing strain. The influence of histidine availability and pH on histamine 91
production was also examined, and the role played by histamine in the survival 92
5
of this strain under acidic conditions, i.e., those found in cheese matrices - 93
investigated. 94
95
2. Materials and Methods 96
2.1. Strains and growth conditions 97
L. vaginalis IPLA 11064, a histamine-producing strain isolated from cheese 98
(Diaz et al., 2015), was grown in MRS (Oxoid, Basingstoke, UK) at 37°C without 99
aeration. 100
To check the effect of histidine concentration on gene expression and histamine 101
production, cells were grown in 50 mL of chemically defined medium (CDM) 102
(Poolman and Konings, 1988) supplemented with different histidine 103
concentrations (CDM+His), and incubated at 37°C for 14.5 h. To examine gene 104
expression and histamine production under controlled pH conditions, cells were 105
cultivated in a Six-Fors bioreactor (Infors AG, Bottmingen, Switzerland) in MRS 106
supplemented with 10 mM histidine (MRS+His) for 10 h. Sterile fermentation 107
vessels were aseptically filled with 400 mL MRS+10 mM His at pH 4.0, 5.0, 6.0 108
and 7.0. The pH was maintained during the culture period by the automatic 109
addition of 2 N NaOH or 2 N HCl. The reactor was maintained at 37°C, with 110
stirring at 50 rpm and zero air input. 111
112
113
114
6
2.2. RNA isolation 115
L. vaginalis cells grown under the above-described conditions were harvested 116
by centrifugation. Total RNA was extracted using the TRI Reagent (Sigma-117
Aldrich, St. Louis, MO, USA) as previously described (Linares et al., 2009). To 118
eliminate any DNA, RNA samples were treated with Turbo™ DNase (Thermo-119
Fisher Scientific, Waltham, MA, USA) as described by the manufacturer. The 120
total RNA concentration was determined using an Epoch Microplate 121
Spectrophotometer (BioTek, Winooski, VT, USA). 122
123
2.3. Reverse transcription PCR (RT-PCR) 124
cDNA was synthesized from 0.5 µg of total RNA using the reverse transcription 125
(RT) iScript™ cDNA Synthesis kit (Bio-Rad, Hercules, CA, USA) following the 126
manufacturer’s recommendations. Three µL of the cDNA suspension were used 127
as a template for the PCR reactions, adding 400 nM of each primer (Table 1), 128
200 µL of dNTP, 1 U of Taq polymerase (DreamTaq, Fermentas, Vilnius, 129
Lithuania) and the reaction buffer. Amplifications were performed over 35 cycles 130
(95°C for 30 s, 50°C for 45 s and 72°C for 1 min) and the resulting fragments 131
electrophoretically separated in 1% agarose gels in TAE buffer (40 mM 132
TRIS/acetate, 1 mM EDTA; pH 8.0). The absence of contaminating DNA in the 133
DNase-treated RNA samples was confirmed by PCR performed under the same 134
conditions but using samples of RNA from before the reverse transcription step 135
as a template. 136
137

7
2.4. Quantification of gene expression by RT-qPCR 138
Gene expression was examined by reverse transcription quantitative real-time 139
PCR (RT-qPCR) using a 7500 Fast Real-Time PCR System (Applied 140
Biosystems, Carlsbad, CA, USA) and employing the SYBR® Green PCR Master 141
Mix (Applied Biosystems). Amplifications were performed with specific primers 142
(Table 1), the design of which was based on the genome sequence of L. 143
vaginalis ATCC 49540 (GenBank accession no. ACGV01000000) (performed 144
using Primer Express software [Applied Biosystems]). Fourfold dilutions of the 145
cDNA samples were used as a template (4 µL) in a final volume of 20 µL. RecA 146
and gap genes were used as internal controls to normalize the RNA 147
concentration. The linearity and amplification efficiency of the reactions were 148
tested for each primer pair using five 10-fold serial dilutions of genomic L. 149
vaginalis IPLA 11064 DNA. The primer concentration used for RT-qPCR 150
analysis was 200 nM for LvagRecAF/LvagRecAR, 300 mM for 151
LvagGapF/LvagGapR, and 800 nM for hdcQLvF/hdcQLvR, qhisSLvF/qhisSLvR 152
and qhdcPLvF/qhdcPLvR. No-template samples were included in each run as 153
negative controls. The cycling settings were the defaults set by Applied 154
Biosystems. Threshold cycle (Ct) values were calculated automatically using 155
7500 Software v.2.0.4 (Applied Biosystems). The abundance of messenger 156
RNA (mRNA) species was calculated following the 2-ΔΔCt method (Livak and 157
Schmittgen, 2001). The condition with the lowest level of expression in each 158
experiment was selected as the calibrator. In all cases, RT-qPCR analysis was 159
performed on RNA purified from three independently grown cultures. 160
161

8
2.5. Quantification of histamine 162
Histamine in the supernatants obtained by centrifugation (8000 x g for 10 min) 163
of the cultures grown under the different experimental conditions was quantified 164
by ultra-high performance liquid chromatography (UHPLC). All supernatants 165
were filtered through 0.45 µm polytetrafluoroethylene (PTFE) filters (VWR, 166
Barcelona, Spain), derivatized with diethyl ethoxymethylenemalonate (Sigma-167
Aldrich), and the histamine content quantified using the UPLC™ system 168
(Waters, Milford, MA, USA) as previously described (Redruello et al., 2013). 169
Data were acquired and analyzed using Empower 2 software (Waters). The 170
histamine concentrations provided are the mean of three independent 171
experiments. 172
173
2.6. Determination of cell viability under acid shock 174
Following Romano et al. (2014) with some modifications, cells were grown on 175
MRS until early-exponential phase (OD 0.7 approximately) and harvested by 176
centrifugation (3000 g x 10 min). They were then washed in sterile PBS at pH 177
5.0 and resuspended at OD 0.2 in PBS with or without histidine (10 mM final 178
concentration) at pH 4.0, 3.0 or 2.0. These cell suspension were then incubated 179
at 37°C for 4 h. The aliquots were serially diluted and 100 µL of each dilution 180
plated on MRS and incubated at 37°C under anaerobic conditions (10% H2, 181
10% CO2 and 80% N2) in a Mac 500 anaerobic workstation (Don Whitley 182
Scientific, Shipley, UK) for 48 h. The initial viable cell concentration (in CFU/mL) 183
was calculated from cell suspensions in PBS at pH 5 without histidine before 184
incubation. At the end of the experiment, the amount of histamine was 185
9
quantified by UHPLC as described in 2.5. All experiments were performed in 186
triplicate. 187
188
2.7. Measurement of internal pH 189
Internal pH measurements were taken using the internally conjugated 190
fluorescence pH probe carboxyfluorescein succinimidyl ester (cFSE, Sigma-191
Aldrich) as previously described (Perez et al., 2015). Briefly, cells were grown in 192
MRS until mid-exponential phase, harvested by centrifugation and washed 193
twice in CPK buffer (sodium citrate 50 mM, disodium phosphate 50 mM, 194
potassium chloride 50 mM) at pH 7.0. They were resuspended in CPK buffer at 195
the pH required (ranging from 4.5 to 7.5) and incubated at 37°C for 30 min in 196
the presence of the precursor probe carboxyfluorescein diacetate succinimidyl 197
ester. The cells were then washed and resuspended in CPK buffer with 10 mM 198
glucose at the corresponding pH and incubated at 37°C for 15 min. The cells 199
were then washed again in CPK buffer at the required pH. Finally, the treated 200
cells were resuspended in 100 µL of CPK buffer supplemented with 10 mM 201
histidine (final concentration) at the required pH, and under the same conditions 202
but without histidine (controls). Fluorescence intensities were measured over 20 203
min (at intervals of 0.45 s) using a Cary Eclipse fluorescence 204
spectrophotometer (Varian Inc., Palo Alto, CA, USA) using previously described 205
excitation and emission values (Breeuwer et al., 1996). Background 206
fluorescence levels were determined by examining the non-fluorescent control 207
cells. Internal pH values were calculated from the ratio of the fluorescent signal 208
obtained at 490/440 nm, using a calibration curve constructed employing 209

10
buffers at pH 4.5-7.5, and after equilibrating the internal (pHin) and external 210
(pHout) pH with valinomycin (1 µM) and nigericin (1 µM). The value given for 211
each condition is the average of three independent replicates (each the mean of 212
values obtained over 15 min of monitoring). 213
214
2.8. Statistical analysis 215
Means were compared using the Student t test. Significance was set at p<0.05. 216
217
3. Results 218
3.1. Effect of histidine concentration on histamine production 219
L. vaginalis was grown at 37ºC for 14.5 h in CDM supplemented with different 220
histidine concentrations (0, 0.05, 0.1, 0.5, 1, 5 and 10 mM). In the absence of 221
histidine, no histamine was detected. The production of histamine was 222
observed after the addition of 0.1 mM histidine, and increased as the 223
concentration of histidine increased, reaching a stable maximum at 5 mM 224
histidine (Figure 1). 225
226
3.2. Low pH increased histamine biosynthesis 227
The influence of acidic pH on histamine production was studied by measuring 228
growth (via optical density) and the production of histamine itself at different 229
pHs. Figure 2A shows that histamine production was greater at pH 4.0 and 5.0 230
and less intense at higher pHs (minimal production reached at pH 7.0). The 231

11
OD600 at pH 4.0 (Figure 2B) was lower than that recorded for the other pH 232
conditions assayed over the entire growth curve, indicating that the greater 233
production of histamine at pH 4.0 was not due to greater growth. Increased 234
gene expression at this pH, or greater histidine decarboxylase activity, are the 235
likely alternatives. 236
3.3. Transcriptional organization of the HDC cluster 237
To study the expression of the HDC cluster genes, the transcriptional 238
organization of the cluster was first determined. cDNA of the total RNA of 239
cultures grown in CDM with histidine (10 mM) and without was RT-PCR 240
amplified. Internal fragments of the four genes from the HDC cluster were 241
amplified (data not shown) using five additional pairs of primers (Table 1) 242
designed to amplify the intergenic and flanking regions of the HDC cluster 243
(Figure 3A and S1). As expected, no RT-PCR amplification was seen for the 244
intergenic regions between hdcP and the gene located upstream (a gene that 245
codes for a C4-dicarboxylate anaerobic carrier not expected to be involved in 246
histamine synthesis), nor between hisS and the gene located downstream 247
(which codes for a major facilitator superfamily transporter not expected to be 248
involved in histamine synthesis either) (Figure 3). Amplicons were only obtained 249
for the intergenic region between hdcA and hdcB (Figure 3B), indicating that 250
hdcA and hdcB are co-transcribed. The mRNA covering hdcA and hdcB starts 251
with a putative hdcA promoter and ends at the putative rho-independent 252
terminator hairpin downstream of hdcB (ΔGhdcB=-13.5 kcal/mol) (Figure 3A and 253
S1). No amplicons were obtained for the hdcP-hdcA or hdcB-hisS intergenic 254
regions, indicating that hdcP and hisS are individually transcribed as 255
monocistronic mRNAs covering the region from their own putative promoters to 256

12
the putative rho-independent terminator hairpins (ΔGhdcP= -10.3 kcal/mol and 257
ΔGhisS= -22.8 kcal/mol) located downstream of them (Figure 3A and S1). The 258
same results were obtained when cells were grown in CDM without histidine 259
(data not shown) indicating the existence of a basal transcription level for the 260
genes of the HDC cluster. 261
262
3.4. Effect of histidine concentration and pH on the expression of genes in the 263
HDC cluster 264
To examine the effect of the histidine concentration on HDC cluster gene 265
expression, the strain was cultured in CDM with histidine concentrations ranging 266
from 0 to 10 mM. hisS, hdcA and hdcP gene expression was then quantified by 267
RT-qPCR after 14.5 h of incubation (a point at which the cells were in 268
exponential growth and had not exhausted the histidine in the medium). Figure 269
4 shows that maximum hisS expression occurred in the absence of, or low 270
concentrations of, histidine. The expression of hisS diminished when the 271
histidine concentration was 1 mM or higher. In contrast, the expression of hdcA 272
correlated positively with the concentration of histidine. Induction was enhanced 273
up to a histidine concentration of 0.5 mM, after which no significant increase 274
was observed (Figure 4). The same cDNAs used in previous experiments were 275
used to quantify hdcP expression, which increased with the concentration of 276
histidine, reaching a maximum at 0.5 mM histidine, after which the expression 277
was stable (Figure 4). 278

13
The expression of hdcA was quantified by RT-qPCR using cultures grown in 279
CDM medium supplemented with 10 mM histidine, at pH 4.0, 5.0, 6.0 or 7.0. No 280
significant differences in expression were recorded (data not shown). 281
These results show that histidine concentration, but not acidic pH, controls the 282
transcription of the genes in the HDC cluster. 283
284
3.5. Histamine biosynthesis improves cell survival under acidic conditions 285
The effect of histidine decarboxylation on L. vaginalis survival at pH 2.0, 3.0, 286
and pH 4.0 was using examined cells growing in MRS. The presence or 287
absence of histidine had no effect on survival at pH 4 (Figure 5). However, the 288
presence of 10 mM histidine increased survival at pH 3 from 71.19 % to 100%. 289
The largest effect was observed at pH 2: no cells survived in the absence of 290
histidine, but more than 70% of the population survived in the presence of 10 291
mM histidine (Figure 5). In the samples containing histidine, the production of 292
histamine was quantified at the end of the experiment and was found to be 293
greater at pH 3.0 (0.763 mM) and pH 2.0 (0.627 mM) than at pH 4.0 (0.166 mM) 294
(Figure 5). 295
296
3.6. Histamine biosynthesis counteracts the acidification of the cytosol under 297
acidic conditions 298
To determine whether the effect of histamine synthesis on survival under acid 299
stress conditions is related to the ability to maintain the intracellular pH, the 300
cytosolic pH was monitored at pH 4.5-7.5 in the presence/absence of histidine 301
14
(10 mM). Figure 6 shows that in the presence of histidine the variation in the 302
intracellular pH at different extracellular pHs was less than in its absence. Even 303
at the lowest assayed external pH (4.5), the internal pH was above 6.5 in the 304
presence of histidine. These results suggest a role for histamine in pH 305
homeostasis, counteracting the intracellular acidification caused by reductions 306
in the external pH. 307
308
4. Discussion 309
Histamine can accumulate at high concentrations in cheese (Fernandez et al., 310
2007), and the ingestion of such food can pose a health risk to consumers. 311
Although, there is no legal limit for the presence of histamine in fermented dairy 312
products, it is recommended that its accumulation be avoided (EFSA, 2011; 313
Ladero et al., 2010). Determining the factors that influence the accumulation of 314
histamine, including the presence of histamine-producing microorganisms, is 315
essential if we are to apply appropriate food safety measures. Certainly, 316
knowledge of the physiological role and molecular regulation mechanisms of 317
histamine in microorganisms isolated from cheese is essential. The present 318
work helps in this respect by describing the effect of substrate availability and 319
pH on histamine and HDC cluster gene expression, and the acid-resistance role 320
of histamine in L. vaginalis strain IPLA 11064 (Diaz et al., 2015). 321
Different transcriptional organizations of the HDC cluster have been reported for 322
different LAB species. In the present L. vaginalis IPLA 11064 strain, a 323
bicistronic mRNA covering hdcA and hdcB was seen, while hdcP and hisS were 324
transcribed as single monocistronic mRNAs, both in the presence and absence 325

15
of histidine. In S. thermophilus CHCC1524, however, hdcA is transcribed as a 326
monocistronic mRNA, or as part of a polycistronic mRNA that includes the 327
hdcA, hdcP and hdcB genes (Calles-Enriquez et al., 2010). In L. parabuchneri 328
(formerly L. buchneri) B301, hdcA, hdcB and hisS are cotranscribed in a 329
polycistronic mRNA in the absence of histidine, while hdcP is transcribed 330
independently. In the presence of histidine, however, the polycistronic mRNA 331
only includes hdcA and hdcB, while hdcP and hisS are transcribed 332
independently as monocistronic mRNAs (Martin et al., 2005). The 333
transcriptional organization of L. vaginalis IPLA 11064 is therefore similar to that 334
of L. parabuchneri B301 in the presence of histidine. The regulation of hisS by 335
histidine in this latter strain is due to the presence of a leader region upstream 336
of the start codon of the gene, which has the sequence features of a tRNA-337
mediated antitermination system (Martin et al., 2005). The sequence features 338
that determine the termination-antitermination system for the regulation of hisS 339
were not found in silico in L. vaginalis IPLA 11064 (supplementary Figure S1). 340
The lack of these features might explain the observed difference with L. 341
parabuchneri B301 in the absence of histidine. Although L. vaginalis IPLA 342
11064 lacked this regulation system, the expression of hisS, which encodes a 343
tyrosyl-tRNA synthetase-like enzyme, was somehow repressed by high 344
concentrations of histidine (Figure 4). As described for other aminoacyl-tRNA 345
synthetase-like genes in other aminoacyl decarboxylation gene clusters 346
(Linares et al., 2012b; Perez et al., 2015), the transcription of hisS was inversely 347
correlated with the concentration of histidine (Figure 4). 348
The influence of histidine on the biosynthesis of histamine has been studied in 349
several species (Lonvaud-Funel and Joyeux, 1994; Pessione et al., 2005). In 350

16
the present work, as more histidine became available the production of 351
histamine increased (Figure 1). This result is of importance with respect to dairy 352
fermentations: milk has a high protein content and proteolysis during the 353
ripening of cheeses results in high concentrations of free histidine for 354
conversion into histamine (Joosten, 1987; Linares et al., 2011, 2012a). The 355
present analysis of hdcA expression showed that histidine enhances the 356
expression of hdcA and hdcP in L. vaginalis IPLA 11064, which translates into 357
an increase in histamine production (Figure 1 and Figure 4). This has also been 358
reported for other LAB species such as L. hilgardii 464, P. parvulus P270 and 359
O. oeni 4042 (Landete et al., 2006), and for S. thermophilus strains found in the 360
dairy environment (Calles-Enriquez et al., 2010; Rossi et al., 2011). The 361
expression of hdcA in L. vaginalis IPLA 11064 was induced by a histidine 362
concentration as low as 0.05 mM, even though L. vaginalis IPLA 11064 was 363
found to be auxotrophic for histidine (data not shown), indicating that the cells 364
decarboxylated this histidine even though it was needed for protein 365
biosynthesis. 366
pH has also been described to have an influence on the accumulation of 367
histamine (Landete et al., 2008a). The present results show that an acidic pH 368
enhances histamine biosynthesis in L. vaginalis IPLA 11064. Histamine 369
production at pH 4 and 5 was significantly greater than at pH 6 and 7 (Figure 370
2A). Moreover, the growth recorded at pH 4 was less than that recorded under 371
the other conditions assayed. This indicates that the greater production of 372
histamine at pH 4 is not due to increased growth but to an increased histamine 373
production rate. These results agree with the greater production of histamine at 374
acidic pHs recorded for other histamine-producing bacteria such as O. oeni 375

17
(Lonvaud-Funel and Joyeux, 1994), L. hilgardii and P. parvulus (Landete et al., 376
2006). The increase in histamine production at acidic pH might be due to the 377
induction of gene expression or more intense enzymatic activity. In the present 378
L. vaginalis IPLA 11064 strain, pH had no effect on hdcA expression, indicating 379
that the increased production of histamine at low pH is explained by the 380
activation of HdcA, as described for L. saerimneri 30a (Schelp et al., 2001) and 381
L. hilgardii (Landete et al., 2008b). Acidic pH has also been shown to have no 382
influence on the transcription of hdcA in S. thermophilus (Calles-Enriquez et al., 383
2010). This contrasts with that observed for other decarboxylation clusters 384
involved in the formation of tyramine in E. faecalis and E. durans, in which the 385
tyrosine decarboxylase gene (tdcA) is transcriptionally activated at acidic pH 386
(Linares et al., 2009; Perez et al., 2015). 387
The decarboxylation of amino acids has been described to help bacteria resist 388
acidic environments (Fernandez de Palencia et al., 2011; Kanjee and Houry, 389
2013; Pereira et al., 2009) - such as those found in fermented products - via the 390
maintenance of the internal pH (Perez et al., 2015; Romano et al., 2014; Trip et 391
al., 2012). In the present work, in which L. vaginalis IPLA 11064 cells were 392
incubated under acidic conditions, the presence of histidine increased the 393
survival rate (Figure 5). Indeed, histamine production was greater at pH 3.0 and 394
2.0 than at pH 4.0 (Figure 1). The results also suggest that the protection 395
afforded by histamine was achieved via the maintenance of the cytosol pH 396
(Figure 2). These results agree with those obtained by other authors who also 397
indicate histidine decarboxylation to help maintain the internal pH (Perez et al., 398
2015; Romano et al., 2014; Trip et al., 2012). 399

18
In conclusion, the decarboxylation of histidine provides a means by which L. 400
vaginalis IPLA 11064 can resist acidic external pHs, i.e., by counteracting the 401
acidification of the cytosol. The production of histamine from histidine is 402
influenced by the histidine concentration, but it is enhanced at such pHs. 403
Therefore, the HDC pathway could be considered an acid stress resistance 404
mechanism for L. vaginalis that provides important advantages when facing 405
acidic environments, such as those encountered in dairy fermentations. 406
However, it should be noted that the product is histamine, a toxic compound 407
that has food safety implications. 408
409
5. Declaration of competing interest 410
The authors declare no conflict of interest. 411
412
6. Acknowledgements 413
This work was funded by the Spanish State Research Agency (AEI) and the 414
European Regional Development Funds (FEDER) (AGL2016-78708-R, 415
AEI/FEDER, UE), by the Plan for Science, Technology and Innovation of the 416
Principality of Asturias 2018– 2020, co-financed by FEDER (IDI/2018/000114, 417
FICYT/FEDER, UE), and by the Spanish National Research Council 418
(CSIC201870I091, CSIC). The authors are grateful to Adrian Burton for 419
language assistance. 420
421
422
423
424

19
7. References 425
Alvarez, M.A., Moreno-Arribas, M.V., 2014. The problem of biogenic amines in 426
fermented foods and the use of potential biogenic amine-degrading 427
microorganisms as a solution. Trends Food Sci Tech. 39, 146-155. 428
Breeuwer, P., Drocourt, J.L., Rombouts, F.M., Abee, T., 1996. A novel method 429
for continuous determination of the intracellular pH in bacteria with the 430
internally conjugated fluorescent probe 5 (and 6-)-carboxyfluorescein 431
succinimidyl ester. Appl Environ Microbiol. 62, 178-183. 432
Calles-Enriquez, M., Eriksen, B.H., Andersen, P.S., Rattray, F.P., Johansen, 433
A.H., Fernandez, M., Ladero, V., Alvarez, M.A., 2010. Sequencing and 434
transcriptional analysis of the Streptococcus thermophilus histamine 435
biosynthesis gene cluster: factors that affect differential hdcA expression. 436
Appl Environ Microbiol. 76, 6231-6238. 437
del Rio, B., Redruello, B., Linares, D.M., Ladero, V., Fernandez, M., Martin, 438
M.C., Ruas-Madiedo, P., Alvarez, M.A., 2017. The dietary biogenic amines 439
tyramine and histamine show synergistic toxicity towards intestinal cells in 440
culture. Food Chem. 218, 249-255. 441
Diaz, M., del Rio, B., Ladero, V., Redruello, B., Fernandez, M., Martin, M.C., 442
Alvarez, M.A., 2015. Isolation and typification of histamine-producing 443
Lactobacillus vaginalis strains from cheese. Int J Food Microbiol. 215, 117-444
123. 445
Diaz, M., del Rio, B., Sanchez-Llana, E., Ladero, V., Redruello, B., Fernandez, 446
M., Martin, M.C., Alvarez, M.A., 2016. Histamine-producing Lactobacillus 447

20
parabuchneri strains isolated from grated cheese can form biofilms on 448
stainless steel. Food Microbiol. 59, 85-91. 449
EFSA, 2011. Scientific Opinion on risk based control of biogenic amine 450
formation in fermented foods. EFSA Panel on Biological Hazards 451
(BIOHAZ). EFSA J. 9(10), 2393-2486. 452
FDA, 2001. Scombro toxin (histamine) formation, in: Department of Health and 453
Human Services, P.H.S., Food and Drug Administration, Center for Food 454
Safety and Applied Nutrition, Office of Seafood, Washington, DC. (Ed.), 455
Fish and Fishery Products Hazards and Controls Guide, p. 1. 456
Fernandez de Palencia, P., Fernandez, M., Mohedano, M., Ladero, V., 457
Quevedo, C., Alvarez, M., Lopez, P., 2011. Role of tyramine synthesis by 458
food-Borne Enterococcus durans in adaptation to the gastrointestinal tract 459
environment. Appl Environ Microbiol. 77, 699-702. 460
Fernandez, M., Linares, D.M., del Rio, B., Ladero, V., Alvarez, M.A., 2007. 461
HPLC quantification of biogenic amines in cheeses: correlation with PCR-462
detection of tyramine-producing microorganisms. J Dairy Res. 74, 276-463
282. 464
Joosten, H.M.L.J., 1987. Biogen Amines - Conditions allowing the formation of 465
biogenic-Amines in cheese .3. Factors Influencing the Amounts Formed. 466
Neth Milk Dairy J. 41, 329-357. 467
Kanjee, U., Houry, W.A., 2013. Mechanisms of acid resistance in Escherichia 468
coli. Annu Rev Microbiol. 67, 65-81. 469
21
Ladero, V., Calles-Enríquez, M., Fernández, M., Alvarez, M.A., 2010. 470
Toxicological effects of dietary biogenic amines. Curr Nutr Food Sci. 6, 471
145-156. 472
Landete, J.M., De Las Rivas, B., Marcobal, A., Munoz, R., 2008a. Updated 473
molecular knowledge about histamine biosynthesis by bacteria. Crit Rev 474
Food Sci Nutr. 48, 697-714. 475
Landete, J.M., Pardo, I., Ferrer, S., 2006. Histamine, histidine, and growth-476
phase mediated regulation of the histidine decarboxylase gene in lactic 477
acid bacteria isolated from wine. FEMS Microbiol Lett. 260, 84-90. 478
Landete, J.M., Pardo, I., Ferrer, S., 2008b. Regulation of hdc expression and 479
HDC activity by enological factors in lactic acid bacteria. J Appl Microbiol. 480
105, 1544-1551. 481
Linares, D.M., Martin, M.C., Ladero, V., Alvarez, M.A., Fernandez, M., 2011. 482
Biogenic amines in dairy products. Crit Rev Food Sci Nutr. 51, 691-703. 483
Linares, D.M., del Rio, B., Ladero, V., Martinez, N., Fernandez, M., Martin, 484
M.C., Alvarez, M.A., 2012a. Factors influencing biogenic amines 485
accumulation in dairy products. Front Microbiol. 3, 1-10. 486
Linares, D.M., del Rio, B., Redruello, B., Ladero, V., Martin, M.C., Fernandez, 487
M., Ruas-Madiedo, P., Alvarez, M.A., 2016. Comparative analysis of the in 488
vitro cytotoxicity of the dietary biogenic amines tyramine and histamine. 489
Food Chem. 197, 658-663. 490
Linares, D.M., Fernandez, M., del Rio, B., Ladero, V., Martin, M.C., Alvarez, 491
M.A., 2012b. The tyrosyl-tRNA synthetase like gene located in the 492
22
tyramine biosynthesis cluster of Enterococcus durans is transcriptionally 493
regulated by tyrosine concentration and extracellular pH. BMC Microbiol. 494
12:23, 1-12. 495
Linares, D.M., Fernandez, M., Martin, M.C., Alvarez, M.A., 2009. Tyramine 496
biosynthesis in Enterococcus durans is transcriptionally regulated by the 497
extracellular pH and tyrosine concentration. Microb Biotechnol. 2, 625-498
633. 499
Livak, K.J., Schmittgen, T.D., 2001. Analysis of relative gene expression data 500
using real-time quantitative PCR and the 2(T)(-Delta Delta C) method. 501
Methods. 25, 402-408. 502
Lonvaud-Funel, A., Joyeux, A., 1994. Histamine production by wine lactic acid 503
bacteria: isolation of a histamine-producing strain of Leuconostoc oenos. J 504
Appl Bacteriol. 77, 401-407. 505
Lucas, P.M., Wolken, W.A.M., Claisse, O., Lolkema, J.S., Lonvaud-Funel, A., 506
2005. Histamine-producing pathway encoded on an unstable plasmid in 507
Lactobacillus hilgardii 0006. Appl Environ Microbiol. 71, 1417-1424. 508
Martin, M.C., Fernandez, M., Linares, D.M., Alvarez, M.A., 2005. Sequencing, 509
characterization and transcriptional analysis of the histidine decarboxylase 510
operon of Lactobacillus buchneri. Microbiology. 151, 1219-1228. 511
Pereira, C.I., Matos, D., Romao, M.V.S., Crespo, M.T.B., 2009. Dual role for the 512
tyrosine decarboxylation pathway in Enterococcus faecium E17: response 513
to an acid challenge and generation of a proton motive force. Appl Environ 514
Microbiol. 75, 345-352. 515
23
Perez, M., Calles-Enriquez, M., Nes, I., Martin, M.C., Fernandez, M., Ladero, 516
V., Alvarez, M.A., 2015. Tyramine biosynthesis is transcriptionally induced 517
at low pH and improves the fitness of Enterococcus faecalis in acidic 518
environments. Appl Microbiol Biotechnol. 99, 3547-3558. 519
Pessione, E., Mazzoli, R., Giuffrida, M.G., Lamberti, C., Garcia‐Moruno, E., 520
Barello, C., Conti, A., Giunta, C., 2005. A proteomic approach to studying 521
biogenic amine producing lactic acid bacteria. Proteomics. 5, 687-698. 522
Poolman, B., Konings, W.N., 1988. Relation of growth of Streptococcus lactis 523
and Streptococcus cremoris to amino acid transport. J Bacteriol. 170, 700-524
707. 525
Redruello, B., Ladero, V., Cuesta, I., Alvarez-Buylla, J.R., Martin, M.C., 526
Fernandez, M., Alvarez, M.A., 2013. A fast, reliable, ultra high 527
performance liquid chromatography method for the simultaneous 528
determination of amino acids, biogenic amines and ammonium ions in 529
cheese, using diethyl ethoxymethylenemalonate as a derivatising agent. 530
Food Chem. 139, 1029-1035. 531
Romano, A., Ladero, V., Alvarez, M.A., Lucas, P.M., 2014. Putrescine 532
production via the ornithine decarboxylation pathway improves the acid 533
stress survival of Lactobacillus brevis and is part of a horizontally 534
transferred acid resistance locus. Int J Food Microbiol. 175, 14-19. 535
Romano, A., Trip, H., Campbell-Sills, H., Bouchez, O., Sherman, D., Lolkema, 536
J.S., Lucas, P.M., 2013. Genome sequence of Lactobacillus saerimneri 537

24
30a (Formerly Lactobacillus sp. Strain 30a), a reference lactic acid 538
bacterium strain producing biogenic amines. Genome Announc. 1, 1-2. 539
Rossi, F., Gardini, F., Rizzotti, L., La Gioia, F., Tabanelli, G., Torriani, S., 2011. 540
Quantitative analysis of histidine decarboxylase gene (hdcA) transcription 541
and histamine production by Streptococcus thermophilus PRI60 under 542
conditions relevant to cheese making. Appl Environ Microbiol. 77, 2817-543
2822. 544
Satomi, M., Furushita, M., Oikawa, H., Yoshikawa-Takahashi, M., Yano, Y., 545
2008. Analysis of a 30 kbp plasmid encoding histidine decarboxylase gene 546
in Tetragenococcus halophilus isolated from fish sauce. Int J Food 547
Microbiol. 126, 202-209. 548
Schelp, E., Worley, S., Monzingo, A.F., Ernst, S., Robertus, J.D., 2001. pH-549
induced structural changes regulate histidine decarboxylase activity in 550
Lactobacillus 30a. J Mol Biol. 306, 727-732. 551
Shalaby, A.R., 1996. Significance of biogenic amines to food safety and human 552
health. Food Res Int. 29, 675-690. 553
Tabanelli, G., Torriani, S., Rossi, F., Rizzotti, L., Gardini, F., 2012. Effect of 554
Chemico-physical parameters on the histidine decarboxylase (HdcA) 555
enzymatic activity in Streptococcus thermophilus PRI60. J Food Sci. 77, 556
M231-237. 557
Trip, H., Mulder, N.L., Lolkema, J.S., 2012. Improved acid stress survival of 558
Lactococcus lactis expressing the histidine decarboxylation pathway of 559
Streptococcus thermophilus CHCC1524. J Biol Chem. 287, 11195-11204. 560
25
Trip, H., Mulder, N.L., Rattray, F.P., Lolkema, J.S., 2011. HdcB, a novel enzyme 561
catalysing maturation of pyruvoyl-dependent histidine decarboxylase. Mol 562
Microbiol. 79, 861-871. 563
564
8. Figure legends 565
Figure 1. Production of histamine by L. vaginalis IPLA 11064 in CDM medium 566
supplemented with 0, 0.05, 0.1, 0.5, 1, 5, or 10 mM histidine for 14.5 h. 567
Supernatants were analyzed by UHPLC to determine the histamine 568
concentration of the extracellular medium. 569
Figure 2. A) Influence of pH (4.0, black bar; 5.0, white bar; 6.0, grey bar and 570
7.0, dotted bar) on histamine production in L. vaginalis IPLA 11064. Asterisks 571
indicate a significant difference in histamine production (p<0.05) compared with 572
pH 4.0 (Student t test). B) Growth curves of L. vaginalis IPLA 11064 at pH 4.0 573
(rhombus), 5.0 (square), 6.0 (triangle) and 7.0 (circle). 574
Figure 3. Genetic organization and transcriptional analysis of the HDC cluster 575
of L. vaginalis IPLA 11064. A) Organization of the HDC cluster of L. vaginalis. 576
Possible promoters are indicated by curved arrows and termination regions are 577
represented by hairpins. Intergenic regions amplified by RT-PCR are 578
represented by the letters A-E and the expected mRNAs are indicated. B) RT-579
PCR amplification of the intergenic regions: fragment A (C4-hdcP), fragment B 580
(hdcP-hdcA), fragment C (hdcA-hdcB), fragment D, (hdcB-hisS) and fragment E 581
(hisS-MFS). Negative control (-) consisting of DNase-treated RNA samples 582
without reverse transcriptase, and positive controls (+) with chromosomal DNA. 583
M molecular weight markers (GeneRuler DNA ladder mix, Fermentas). 584
26
Figure 4. Quantification of gene expression by RT-qPCR. Effect of different 585
histidine concentrations on the expression of hdcA (grey bars), hdcP (black 586
bars) and hisS (white bars), in L. vaginalis IPLA 11064 grown in CDM 587
supplemented with histidine. The lowest expression level for each gene was 588
normalized to 1 and used as the reference condition. Bars with the same letter 589
indicate significant differences with respect to the no-histidine condition 590
(Student t test). 591
Figure 5. Cell survival and histamine production in L. vaginalis IPLA 11064 592
exposed to acid shock in the presence and absence of histidine. Survival (%) of 593
L. vaginalis IPLA 11064 incubated for 4 h in the presence (black bars) and 594
absence (grey bars) of 10 mM histidine. Survival was measured by plate 595
counts. Values are expressed as a percentage of the control value (the 100% 596
control value for untreated cells corresponded to 1.49x10⁷ CFU/mL). Asterisks 597
indicate a significant difference (p<0.05; Student t test). The production of 598
histamine in the presence of histidine under each condition is indicated. The 599
results are the mean ± SD of experiments performed in triplicate. 600
Figure 6. Variation of the intracellular pH (pHin) at different extracellular pHs 601
(pHout) measured using a cFSE probe in resting L. vaginalis IPLA 11064 cells in 602
the presence (black circles, 10 mM histidine) and absence (white circles, control 603
condition) of histidine. Asterisks indicate significant differences (*p<0.05, 604
**p<0.005; Student t test). 605
606
27
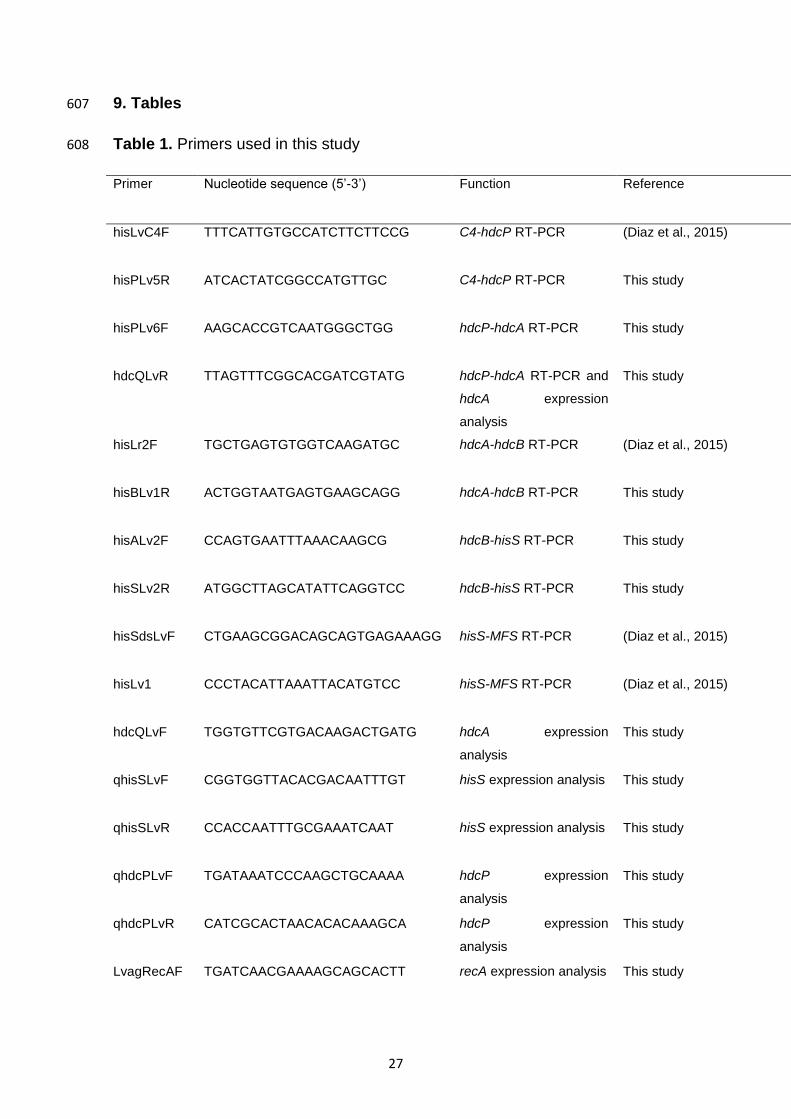
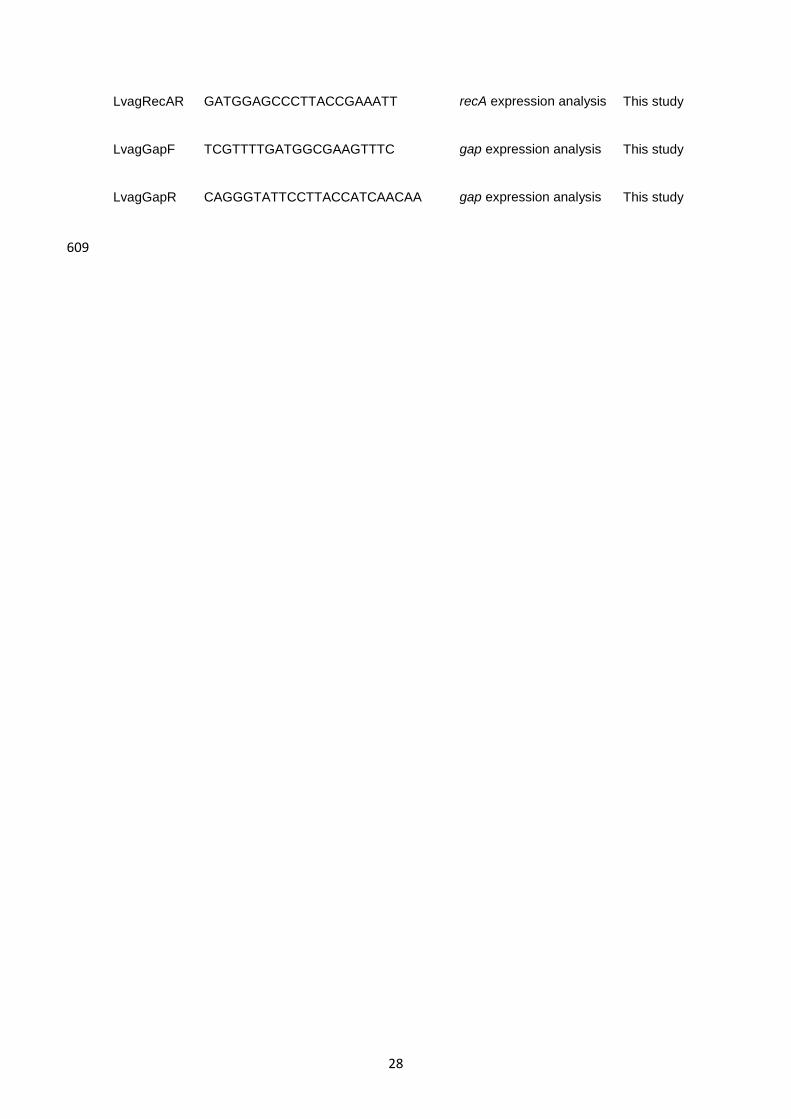
9. Tables 607
Table 1. Primers used in this study 608
Primer Nucleotide sequence (5’-3’) Function Reference
hisLvC4F TTTCATTGTGCCATCTTCTTCCG C4-hdcP RT-PCR (Diaz et al., 2015)
hisPLv5R ATCACTATCGGCCATGTTGC C4-hdcP RT-PCR This study
hisPLv6F AAGCACCGTCAATGGGCTGG hdcP-hdcA RT-PCR This study
hdcQLvR TTAGTTTCGGCACGATCGTATG hdcP-hdcA RT-PCR and
hdcA expression
analysis
This study
hisLr2F TGCTGAGTGTGGTCAAGATGC hdcA-hdcB RT-PCR (Diaz et al., 2015)
hisBLv1R ACTGGTAATGAGTGAAGCAGG hdcA-hdcB RT-PCR This study
hisALv2F CCAGTGAATTTAAACAAGCG hdcB-hisS RT-PCR This study
hisSLv2R ATGGCTTAGCATATTCAGGTCC hdcB-hisS RT-PCR This study
hisSdsLvF CTGAAGCGGACAGCAGTGAGAAAGG hisS-MFS RT-PCR (Diaz et al., 2015)
hisLv1 CCCTACATTAAATTACATGTCC hisS-MFS RT-PCR (Diaz et al., 2015)
hdcQLvF TGGTGTTCGTGACAAGACTGATG hdcA expression
analysis
This study
qhisSLvF CGGTGGTTACACGACAATTTGT hisS expression analysis This study
qhisSLvR CCACCAATTTGCGAAATCAAT hisS expression analysis This study
qhdcPLvF TGATAAATCCCAAGCTGCAAAA hdcP expression
analysis
This study
qhdcPLvR CATCGCACTAACACACAAAGCA hdcP expression
analysis
This study
LvagRecAF TGATCAACGAAAAGCAGCACTT recA expression analysis This study
28
LvagRecAR GATGGAGCCCTTACCGAAATT recA expression analysis This study
LvagGapF TCGTTTTGATGGCGAAGTTTC gap expression analysis This study
LvagGapR CAGGGTATTCCTTACCATCAACAA gap expression analysis This study
609

Histidine (mM)
OD 0.039 0.109 0.140 0.177 0.174 0.155 0.149
±0.0005 ±0.0108 ±0.010 ±0.029 ±0.025 ±0.024 ±0.017
0
0.2
0.4
0.6
0.8
1
1.2
1.4
1.6
1.8
0 0.05 0.1 0.5 1 5 10
His
tam
ine
(m
M)
Figure 1
Figure 1

0
0.2
0.4
0.6
0.8
1
1.2
1.4
0 2 4 6 8 10
OD
Time (h)
0
2
4
6
8
10
12
0 2 4 5 6 7 8 9 10
His
tam
ine
(m
M)
Time (h)
Figure 2
*
*
*
*
*
*
A)
B)
Figure 2

A
cDNA - + cDNA - + cDNA - + cDNA - + cDNA - +
B C D E
hdcA hdcP hisS C4 hdcB
b
A B C D E
A)
B)
Figure 3
M M
MFS
Figure 3

0
5
10
15
20
25
30
35
40
45
0 0.05 0.1 0.5 1 5 10
Rel
ativ
e ge
ne e
xpre
ssio
n
Histidine (mM)
Figure 4
a c c c
b a b a b a b a b
Figure 4

0
20
40
60
80
100
pH 4 pH 3 pH 2
% s
urv
iva
l
Histamine (mM) 0.166 0.763 0.627
±0.235 ±0.368 ±0.322
*
*
Figure 5
Figure 5

6
6.5
7
7.5
8
4 5 6 7 8
pH
in
pHout
* * ** **
**
**
*
Figure 6
Figure 6

TTGATGAATTAGAGTGTGAGCCAGCAAAGAACTTGCGGAAAGATAACACTAACTCCCGACGAAGGCGTCTCGCGCCTAGGAGGGAGGGT
GTTATCTCTAGCAAGTTCCTGGCGAACACGTTTTTACTCTGTGACAGTAGAACGTTATCTTGAGGGAGCTTAGGCTGAGCGCGTTTTGGCT
GTGTTGCAGTAGGAGCTACTGCGCAGATCTTGGCTATGCTACCGAGAAAATTTATAATACAAAAAATGGTATTCAGAAAATTTCTGAATACC
ATTTTTCATTAAAGGGCGGTATGTGGGATTCGAACCCACGCGTGCCGGACCCACAAACCGGTGTGTTAACCAAACTTCACCAACACCGCC
ATGAAATAACAGTAACAAGTGTAGCATATTTTTTGAAAAATGAATAACTCTTTTTGAACAGGATCGCGGTTATTAATATTATTAACTTATGAGA
GCGGTTAATATTTTATTGAACATTCAATATACAAGTGATATATTGTTTGTGAACATTGCGCATATTCCTATTCCTTACAAATACTGAGTAAGGG
ATGTGTGCAACATGGCCGAT
C4
hdcP
ΔG=-15.8
tRNA-His
RBS -35 -10
A)
ATTCACTAGCCCTTTAGTTAAATATTAATTTATGTGCTTTATAAATATATTTTCTAAAAACAATAATATGGCTGTAAAAGGCGTCAAAATAAC
AATTTTGGCGTTTTTTTCTTTTAAATTTTACTTTTAATTATCCTAAAAATTGCAATTTTTTCAACAAATTTTCCGTTTCCTATTGACATATATAT
ATATATATATATACTGAGGCTTGTAAGGAATAGGAAGCGCTTTCGTTCGTTGCTATTGTTGTAACTTTTGTTTTAATTAATGGAGGTCTAAT
TATGTCCGAA
ΔG=-10.3
-35
-10 RBS
B) hdcP
hdcA
AGCTGGAAAGTAAAACGTGGTAAATGCATATTGACAAATTCATATGATCGTTTATCATTTAATTCAAGAGCAGTATTAATTTAATACTTGTTCT
TCAAAAAGATTAGTCGACTAATTCTTTTTATTGATTTGAGAAACATCTTTAATTCACATTTTGCTTATGTGAATACTAAAAATATTTCGTGATGG
GGAGCGTTATTACCCCGGCGGGTGGTTATACCATTTACCCGGTGGAACACTTTACCTTGATGGTAGGTGTGAATTAAGGTAGTATATAAAG
GCTCTTCATAAGTCATTAGACTTACTGAGGAGCCTTTTTATTTGAAAAGGTGGGTTCTATAATATGGCAAAAGCTA
C) -35 -10
RBS ΔG=-13.5
hdcB
hisS
AATATTTGAAGTAATATCAATTACTACACAATAGCAATGAAATAAATGGACAATGAAAAAAGAGTAATGGTCGGGACGGACACTTGACCATT
ACTCTTTTTCGTTAATTAGTAAATTTACTTGAG
D) hisS
MTS
ΔG=-22.8
Figure S1
Supplementary Figure 1S

Figure S1. L. vaginalis IPLA 11064 sequences of the hdcP upstream region (A), hdcP-‐hdcA (B), hdcB-‐hisS (C) intergenic regions, and the hisS downstream region (D). The putaFve -‐10 and -‐35 promoter sequences, ribosome binding site sequences (RBS) and rho-‐independent terminator sequences (dashed lines) are indicated. The nucleoFdes of genes appear in gray backgrounds and start and stop codons in bold. The transcripFonal direcFon is represented by doPed arrows.