Maryland Enterprise Zone Map - Business Resources | Site ...
HISPANICS IN MARYLAND: HEALTH DATA AND RESOURCES
HISPANOS EN MARYLAND:
INFORMACIÓN Y RECURSOS
PARA LA SALUD
May 2013
Office of Minority Health and Health Disparities
Maryland Department of Health and Mental Hygiene
Oficina de Salud de las Minorías y Disparidades de Salud
Departamento de Salud e Higiene Mental de Maryland
Martin O’Malley, Governor Anthony G. Brown, Lt. Governor
Joshua M. Sharfstein, Secretary
Hispanics in Maryland: Health Data and resources
Page 1 Office of Minority Health and Health Disparities Maryland Department of Health and Mental Hygiene
MARYLAND HISPANICS HEALTH DATA HIGHLIGHTS
The 2010 Census showed that the Hispanic population accounted for 8.2 percent of the total population in Maryland. The Maryland Hispanic population has doubled from 227,916 persons in 2000, to 470,632 persons in 2010.
Hispanics in Maryland were younger than the overall population, and there were more Hispanic males than Hispanic females (52.4% males, 47.6% females).
41 percent of Hispanics in Maryland spoke English less than “very well”, and 40 percent of Hispanics were not U.S. citizens at the time of survey.
The age-adjusted all-cause mortality rate for Hispanics has increased from 2001 to 2010. The five leading causes of death for Hispanics in Maryland were cancer, heart disease, stroke, accident, and diabetes.
Hispanics in Maryland were three times more likely to not be able to afford seeing a doctor, and were five times more likely to be without health insurance, than Non-Hispanic Whites.
Hispanics ages 18-64 were more obese than their Non-Hispanic Whites counterparts, and Hispanics were significantly less likely to engage in leisure time physical activities.
The HIV incidence rate was 3.6 times higher and the AIDS incidence rate was 4.7 times higher, for Hispanics than for Non-Hispanic Whites in Maryland.
Tuberculosis incidence was 15 times higher for Hispanics than Non-Hispanic Whites in Maryland.
The percentage of births to Hispanic mothers younger than 18 years of age was twice that of Whites; the percentage of births to unmarried Hispanic mothers was 1.7 times higher than that of Whites.
In the 18-44 age group, Hispanics were 32% less likely than Non-Hispanic Whites to report having ever seen a provider for a mental health problem. More Hispanics of all ages reported experiencing poor mental health compared to Non-Hispanic Whites.
Please note that, some data sources report race without regard to Hispanic or Latino ethnicity, and
report Hispanic or Latino ethnicity without regard to race. Other data sources report results in
categories of Non-Hispanic race and Hispanic. Thus, in this document where “White” or “Black”
appear not specified as Non-Hispanic, those data include both Hispanics or Latinos and persons
not Hispanic or Latino. Where a race appears preceded by “Non-Hispanic” or “NH”, those data
refer only to the persons of that race who are not Hispanic or Latino.
A NOTE ON HISPANIC/LATINO TERMINOLOGY
Often, the terms, “Latino” and “Hispanics,” are used interchangeably; however we will use the term “Hispanic” for this data publication throughout the narratives, tables and
figures because the data sources we cited, consistently used the term “Hispanic.”
Hispanics in Maryland: Health Data and resources
Page 2 Office of Minority Health and Health Disparities Maryland Department of Health and Mental Hygiene
MARYLAND HISPANIC POPULATION
Maryland is one of the states where the size of the combined racial and ethnic minority population is beginning to approach the Non-Hispanic White population. An estimated 45.3% of Maryland’s population identified as a racial or ethnic minority in 2010. The 2010 Census showed that the Hispanic population was 8.2% of the total population in Maryland (Table 1). According to U.S. Census, the Maryland Hispanic population was counted as 125,102 persons, 227,916 persons, and 470,632 persons for the years 1990, 2000, and 2010, respectively (Figure 1).
Table 1. Maryland Population, 2010 U.S. Census by Race and Ethnicity (8.2% Hispanic population)
All Ethnicity Non-Hispanic Hispanic
White 3,359,284 58.2% 3,157,958 54.7% 201,326 3.5%
Non-White 2,414,268 41.8% 2,144,962 37.2% 269,306 4.7%
Black 1,700,298 29.4% 1,674,229 26,069
Asian Asian 318,853 5.5% 316,694 2,159
3,157 0.1% 2,412 745
American Indian 20,420 0.4% 13,815 6,605
206,832 3.6% 11,972 194,860
164,708 2.9% 125,840 38,868
MD Total 5,773,552 100.0% 5,302,920 91.8% 470,632 8.2%
Hawaiian/ Pac Isle
Two or More Races
Some Other Race
Source: 2010 Census Demographic Profiles, Department of Planning, Projections and Data Analysis/State Data Center, May 2011
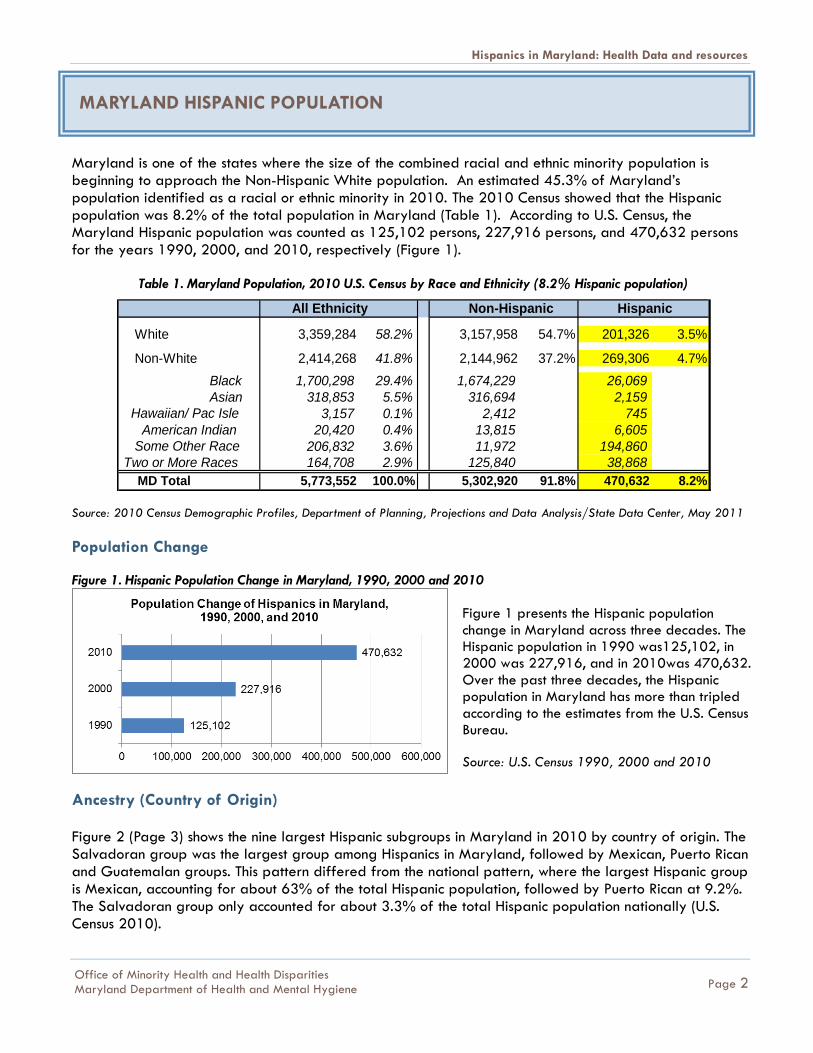
Population Change Figure 1. Hispanic Population Change in Maryland, 1990, 2000 and 2010
Figure 1 presents the Hispanic population change in Maryland across three decades. The Hispanic population in 1990 was125,102, in 2000 was 227,916, and in 2010was 470,632. Over the past three decades, the Hispanic population in Maryland has more than tripled according to the estimates from the U.S. Census Bureau. Source: U.S. Census 1990, 2000 and 2010
Ancestry (Country of Origin) Figure 2 (Page 3) shows the nine largest Hispanic subgroups in Maryland in 2010 by country of origin. The Salvadoran group was the largest group among Hispanics in Maryland, followed by Mexican, Puerto Rican and Guatemalan groups. This pattern differed from the national pattern, where the largest Hispanic group is Mexican, accounting for about 63% of the total Hispanic population, followed by Puerto Rican at 9.2%. The Salvadoran group only accounted for about 3.3% of the total Hispanic population nationally (U.S. Census 2010).
Hispanics in Maryland: Health Data and resources
Page 3 Office of Minority Health and Health Disparities Maryland Department of Health and Mental Hygiene
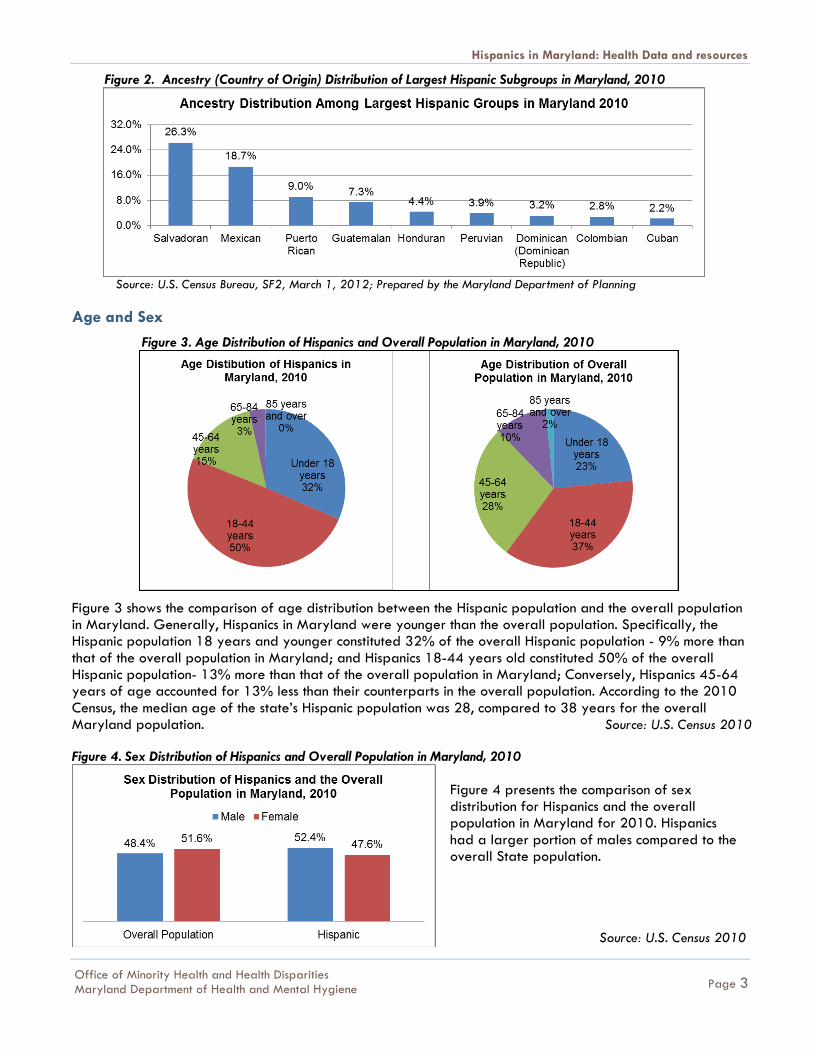
Figure 2. Ancestry (Country of Origin) Distribution of Largest Hispanic Subgroups in Maryland, 2010
Source: U.S. Census Bureau, SF2, March 1, 2012; Prepared by the Maryland Department of Planning
Age and Sex
Figure 3. Age Distribution of Hispanics and Overall Population in Maryland, 2010
Figure 3 shows the comparison of age distribution between the Hispanic population and the overall population in Maryland. Generally, Hispanics in Maryland were younger than the overall population. Specifically, the Hispanic population 18 years and younger constituted 32% of the overall Hispanic population - 9% more than that of the overall population in Maryland; and Hispanics 18-44 years old constituted 50% of the overall Hispanic population- 13% more than that of the overall population in Maryland; Conversely, Hispanics 45-64 years of age accounted for 13% less than their counterparts in the overall population. According to the 2010 Census, the median age of the state’s Hispanic population was 28, compared to 38 years for the overall Maryland population. Source: U.S. Census 2010
Figure 4. Sex Distribution of Hispanics and Overall Population in Maryland, 2010
Figure 4 presents the comparison of sex distribution for Hispanics and the overall population in Maryland for 2010. Hispanics had a larger portion of males compared to the overall State population.
Source: U.S. Census 2010
Hispanics in Maryland: Health Data and resources
Page 4 Office of Minority Health and Health Disparities Maryland Department of Health and Mental Hygiene
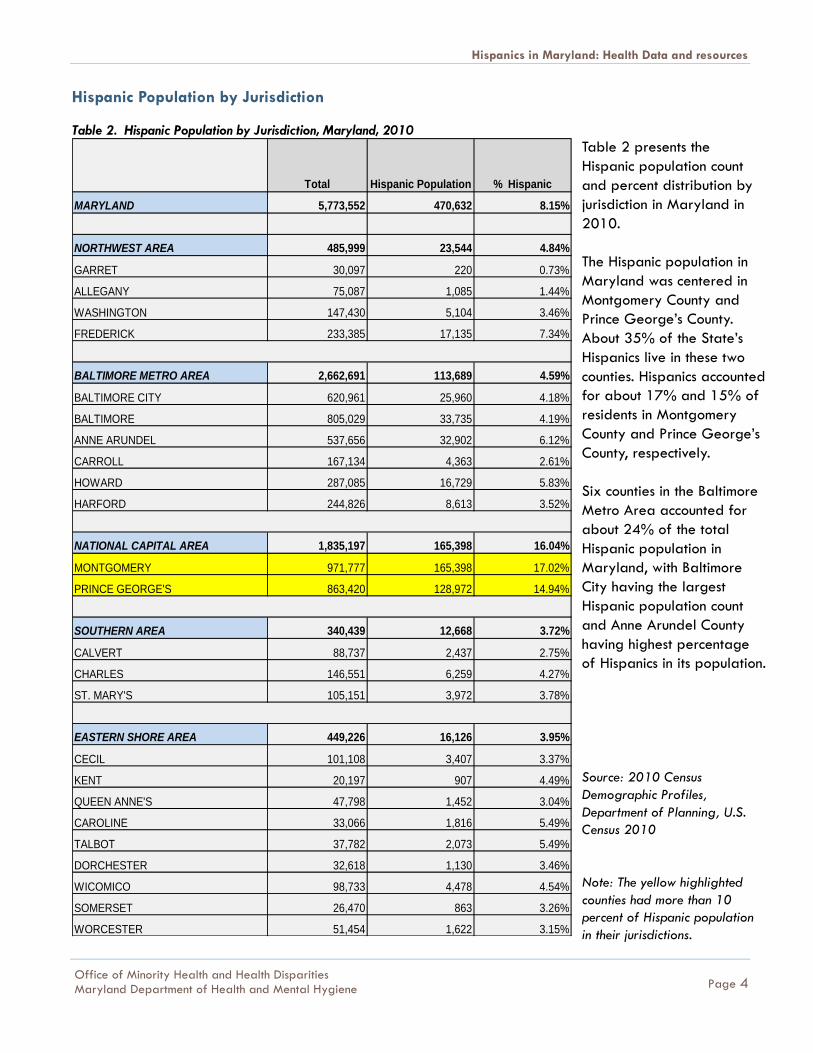
Hispanic Population by Jurisdiction Table 2. Hispanic Population by Jurisdiction, Maryland, 2010
Total Hispanic Population % Hispanic
MARYLAND 5,773,552 470,632 8.15%
NORTHWEST AREA 485,999 23,544 4.84%
GARRET 30,097 220 0.73%
ALLEGANY 75,087 1,085 1.44%
WASHINGTON 147,430 5,104 3.46%
FREDERICK 233,385 17,135 7.34%
BALTIMORE METRO AREA 2,662,691 113,689 4.59%
BALTIMORE CITY 620,961 25,960 4.18%
BALTIMORE 805,029 33,735 4.19%
ANNE ARUNDEL 537,656 32,902 6.12%
CARROLL 167,134 4,363 2.61%
HOWARD 287,085 16,729 5.83%
HARFORD 244,826 8,613 3.52%
NATIONAL CAPITAL AREA 1,835,197 165,398 16.04%
MONTGOMERY 971,777 165,398 17.02%
PRINCE GEORGE'S 863,420 128,972 14.94%
SOUTHERN AREA 340,439 12,668 3.72%
CALVERT 88,737 2,437 2.75%
CHARLES 146,551 6,259 4.27%
ST. MARY'S 105,151 3,972 3.78%
EASTERN SHORE AREA 449,226 16,126 3.95%
CECIL 101,108 3,407 3.37%
KENT 20,197 907 4.49%
QUEEN ANNE'S 47,798 1,452 3.04%
CAROLINE 33,066 1,816 5.49%
TALBOT 37,782 2,073 5.49%
DORCHESTER 32,618 1,130 3.46%
WICOMICO 98,733 4,478 4.54%
SOMERSET 26,470 863 3.26%
WORCESTER 51,454 1,622 3.15%
Table 2 presents the
Hispanic population count
and percent distribution by
jurisdiction in Maryland in
2010.
The Hispanic population in
Maryland was centered in
Montgomery County and
Prince George’s County.
About 35% of the State’s
Hispanics live in these two
counties. Hispanics accounted
for about 17% and 15% of
residents in Montgomery
County and Prince George’s
County, respectively.
Six counties in the Baltimore
Metro Area accounted for
about 24% of the total
Hispanic population in
Maryland, with Baltimore
City having the largest
Hispanic population count
and Anne Arundel County
having highest percentage
of Hispanics in its population.
Source: 2010 Census
Demographic Profiles,
Department of Planning, U.S.
Census 2010
Note: The yellow highlighted
counties had more than 10
percent of Hispanic population
in their jurisdictions.

Hispanics in Maryland: Health Data and resources
Page 5 Office of Minority Health and Health Disparities Maryland Department of Health and Mental Hygiene
SOCIAL AND ECONOMIC WELL-BEING OF HISPANICS IN MARYLAND
Language Use and English Proficiency
Figure 5. Language Spoken at Home and English Proficiency for Hispanics in Maryland, 2006-2010
Figure 5 shows languages spoken at home and English proficiency for Hispanics in Maryland. Over 40% of Hispanics in Maryland spoke English less than “very well” and were considered to have Limited English Proficiency (LEP); A total of 35% of Hispanics in Maryland spoke languages other than English at home and spoke English “very well”, while 24% of Hispanics in Maryland spoke only English at home.
Place of Births and Citizenship
Figure 6. Place of Births and U.S. Citizenship Status of Hispanics in Maryland, 2006-2010
Figure 6 presents places of births and U.S. citizenship status of Hispanics in Maryland. Forty six percent of Hispanics in Maryland were born in the U.S. Additionally, 14% of Hispanics in Maryland were born out of the country and became U.S. citizens later; whereas 40% of Hispanics in Maryland were born out of the country, and were not U.S. citizens at the time of survey.
Source: American Community Survey 2006-2010
Educational Attainment
Figure 7. Educational Attainment of Hispanics and Overall Population (25 years and older) in Maryland, 2009-2011
Figure 7 presents the educational attainment of Hispanics and the overall population in Maryland. The percentage of Hispanics who have obtained at least a bachelor’s degree was less than half that of the overall population in the state. Additionally, the percentage of Hispanics with less than high school diploma was three times higher than that of the overall population. Source: American Community Survey 2009-2011
Hispanics in Maryland: Health Data and resources
Page 6 Office of Minority Health and Health Disparities Maryland Department of Health and Mental Hygiene
Economic Characteristics
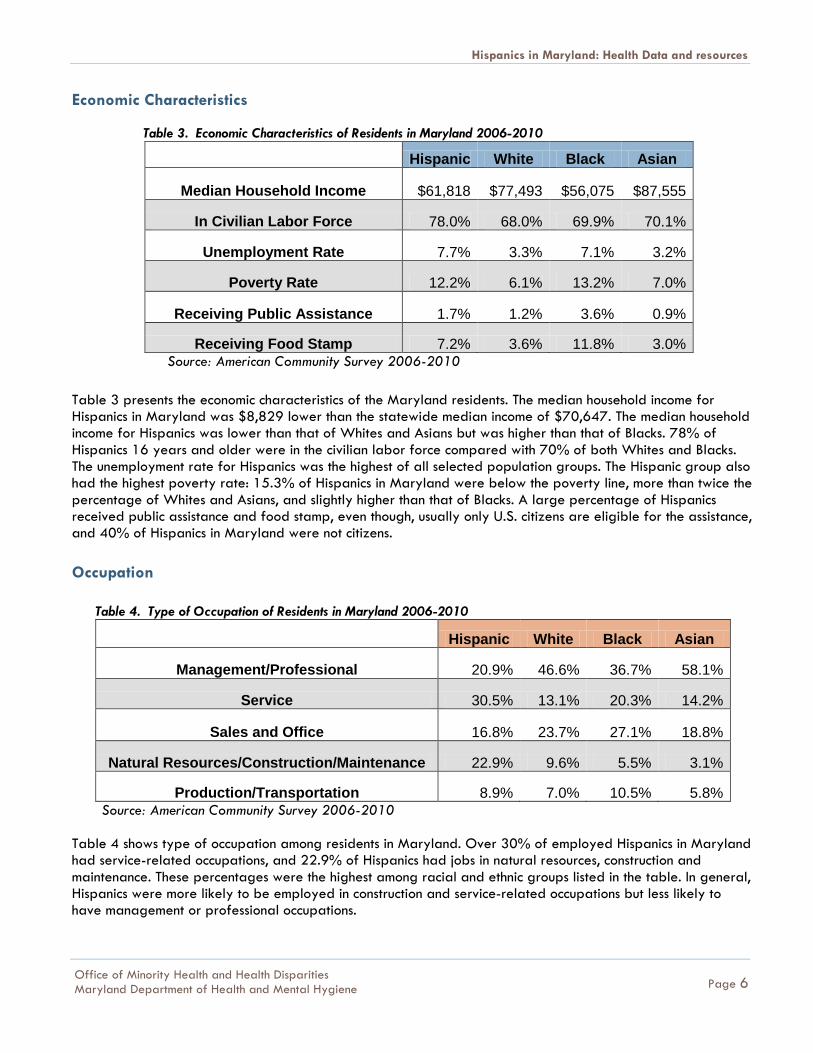
Table 3. Economic Characteristics of Residents in Maryland 2006-2010
Hispanic White Black Asian
Median Household Income $61,818 $77,493 $56,075 $87,555
In Civilian Labor Force 78.0% 68.0% 69.9% 70.1%
Unemployment Rate 7.7% 3.3% 7.1% 3.2%
Poverty Rate 12.2% 6.1% 13.2% 7.0%
Receiving Public Assistance 1.7% 1.2% 3.6% 0.9%
Receiving Food Stamp 7.2% 3.6% 11.8% 3.0% Source: American Community Survey 2006-2010
Table 3 presents the economic characteristics of the Maryland residents. The median household income for Hispanics in Maryland was $8,829 lower than the statewide median income of $70,647. The median household income for Hispanics was lower than that of Whites and Asians but was higher than that of Blacks. 78% of Hispanics 16 years and older were in the civilian labor force compared with 70% of both Whites and Blacks. The unemployment rate for Hispanics was the highest of all selected population groups. The Hispanic group also had the highest poverty rate: 15.3% of Hispanics in Maryland were below the poverty line, more than twice the percentage of Whites and Asians, and slightly higher than that of Blacks. A large percentage of Hispanics received public assistance and food stamp, even though, usually only U.S. citizens are eligible for the assistance, and 40% of Hispanics in Maryland were not citizens.
Occupation
Table 4. Type of Occupation of Residents in Maryland 2006-2010
Hispanic White Black Asian
Management/Professional 20.9% 46.6% 36.7% 58.1%
Service 30.5% 13.1% 20.3% 14.2%
Sales and Office 16.8% 23.7% 27.1% 18.8%
Natural Resources/Construction/Maintenance 22.9% 9.6% 5.5% 3.1%
Production/Transportation 8.9% 7.0% 10.5% 5.8% Source: American Community Survey 2006-2010
Table 4 shows type of occupation among residents in Maryland. Over 30% of employed Hispanics in Maryland had service-related occupations, and 22.9% of Hispanics had jobs in natural resources, construction and maintenance. These percentages were the highest among racial and ethnic groups listed in the table. In general, Hispanics were more likely to be employed in construction and service-related occupations but less likely to have management or professional occupations.
Hispanics in Maryland: Health Data and resources
Page 7 Office of Minority Health and Health Disparities Maryland Department of Health and Mental Hygiene
MORTALITY
Five Leading Causes of Death
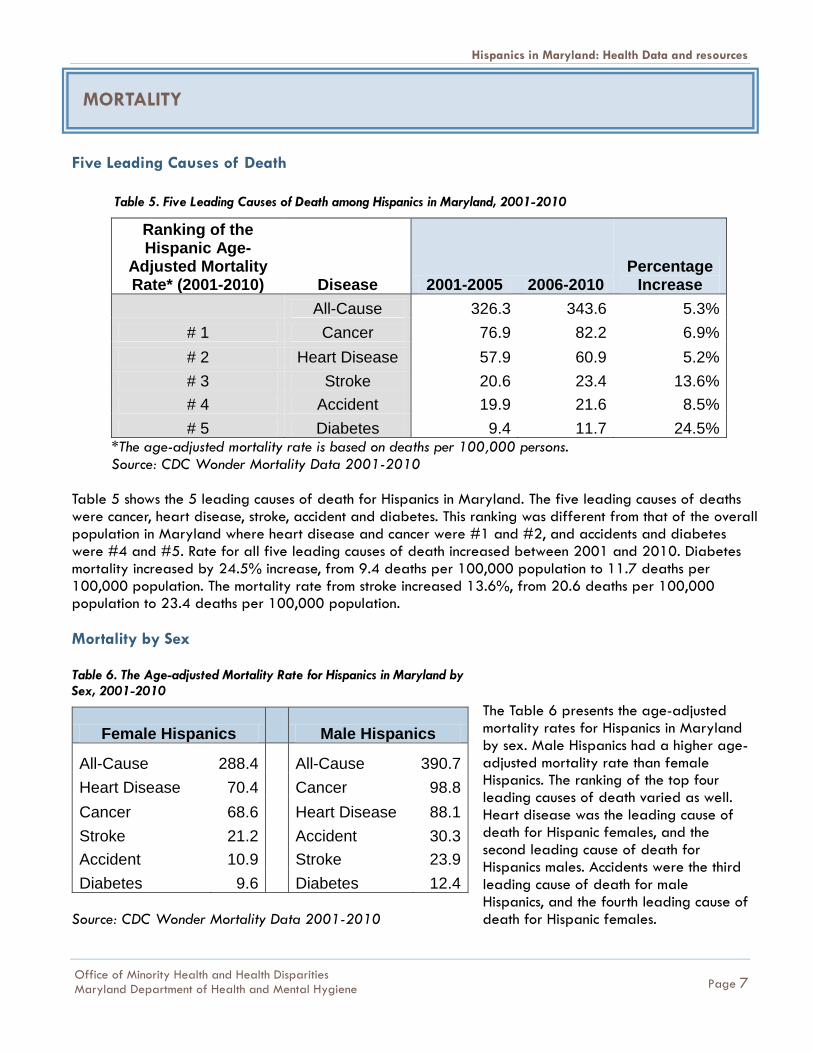
Table 5. Five Leading Causes of Death among Hispanics in Maryland, 2001-2010
Ranking of the Hispanic Age-
Adjusted Mortality Rate* (2001-2010) Disease 2001-2005 2006-2010
Percentage Increase
All-Cause 326.3 343.6 5.3%
# 1 Cancer 76.9 82.2 6.9%
# 2 Heart Disease 57.9 60.9 5.2%
# 3 Stroke 20.6 23.4 13.6%
# 4 Accident 19.9 21.6 8.5%
# 5 Diabetes 9.4 11.7 24.5% *The age-adjusted mortality rate is based on deaths per 100,000 persons. Source: CDC Wonder Mortality Data 2001-2010 Table 5 shows the 5 leading causes of death for Hispanics in Maryland. The five leading causes of deaths were cancer, heart disease, stroke, accident and diabetes. This ranking was different from that of the overall population in Maryland where heart disease and cancer were #1 and #2, and accidents and diabetes were #4 and #5. Rate for all five leading causes of death increased between 2001 and 2010. Diabetes mortality increased by 24.5% increase, from 9.4 deaths per 100,000 population to 11.7 deaths per 100,000 population. The mortality rate from stroke increased 13.6%, from 20.6 deaths per 100,000 population to 23.4 deaths per 100,000 population.
Mortality by Sex Table 6. The Age-adjusted Mortality Rate for Hispanics in Maryland by Sex, 2001-2010
Female Hispanics
Male Hispanics
All-Cause 288.4
All-Cause 390.7
Heart Disease 70.4
Cancer 98.8
Cancer 68.6
Heart Disease 88.1
Stroke 21.2
Accident 30.3
Accident 10.9
Stroke 23.9
Diabetes 9.6
Diabetes 12.4 Source: CDC Wonder Mortality Data 2001-2010
The Table 6 presents the age-adjusted mortality rates for Hispanics in Maryland by sex. Male Hispanics had a higher age-adjusted mortality rate than female Hispanics. The ranking of the top four leading causes of death varied as well. Heart disease was the leading cause of death for Hispanic females, and the second leading cause of death for Hispanics males. Accidents were the third leading cause of death for male Hispanics, and the fourth leading cause of death for Hispanic females.
Hispanics in Maryland: Health Data and resources
Page 8 Office of Minority Health and Health Disparities Maryland Department of Health and Mental Hygiene
HEALTHCARE ACCESS
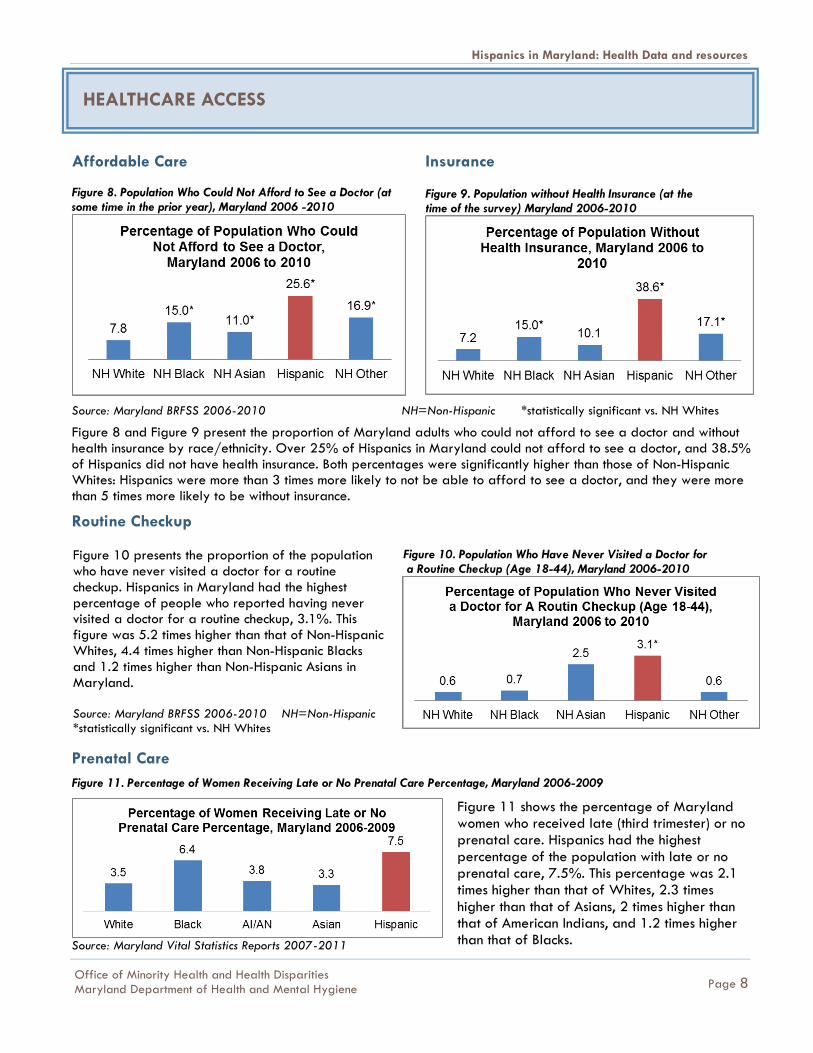
Affordable Care Figure 8. Population Who Could Not Afford to See a Doctor (at some time in the prior year), Maryland 2006 -2010
Insurance Figure 9. Population without Health Insurance (at the time of the survey) Maryland 2006-2010
Source: Maryland BRFSS 2006-2010 NH=Non-Hispanic *statistically significant vs. NH Whites
Figure 8 and Figure 9 present the proportion of Maryland adults who could not afford to see a doctor and without health insurance by race/ethnicity. Over 25% of Hispanics in Maryland could not afford to see a doctor, and 38.5% of Hispanics did not have health insurance. Both percentages were significantly higher than those of Non-Hispanic Whites: Hispanics were more than 3 times more likely to not be able to afford to see a doctor, and they were more than 5 times more likely to be without insurance.
Routine Checkup
Prenatal Care
Figure 11. Percentage of Women Receiving Late or No Prenatal Care Percentage, Maryland 2006-2009
Source: Maryland Vital Statistics Reports 2007-2011
Figure 11 shows the percentage of Maryland women who received late (third trimester) or no prenatal care. Hispanics had the highest percentage of the population with late or no prenatal care, 7.5%. This percentage was 2.1 times higher than that of Whites, 2.3 times higher than that of Asians, 2 times higher than that of American Indians, and 1.2 times higher than that of Blacks.
Figure 10 presents the proportion of the population who have never visited a doctor for a routine checkup. Hispanics in Maryland had the highest percentage of people who reported having never visited a doctor for a routine checkup, 3.1%. This figure was 5.2 times higher than that of Non-Hispanic Whites, 4.4 times higher than Non-Hispanic Blacks and 1.2 times higher than Non-Hispanic Asians in Maryland. Source: Maryland BRFSS 2006-2010 NH=Non-Hispanic *statistically significant vs. NH Whites
Figure 10. Population Who Have Never Visited a Doctor for a Routine Checkup (Age 18-44), Maryland 2006-2010
Hispanics in Maryland: Health Data and resources
Page 9 Office of Minority Health and Health Disparities Maryland Department of Health and Mental Hygiene
HEALTH RISK AND PROTECTIVE FACTORS
Obesity
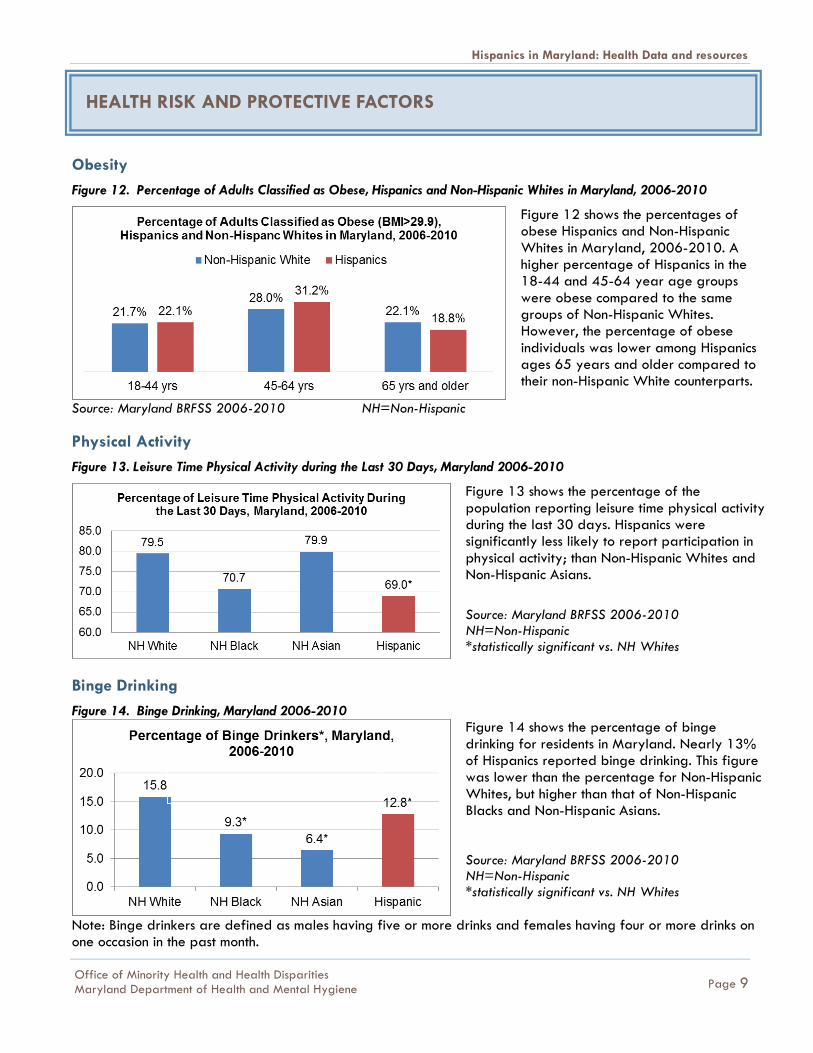
Figure 12. Percentage of Adults Classified as Obese, Hispanics and Non-Hispanic Whites in Maryland, 2006-2010
Figure 12 shows the percentages of obese Hispanics and Non-Hispanic Whites in Maryland, 2006-2010. A higher percentage of Hispanics in the 18-44 and 45-64 year age groups were obese compared to the same groups of Non-Hispanic Whites. However, the percentage of obese individuals was lower among Hispanics ages 65 years and older compared to their non-Hispanic White counterparts.
Source: Maryland BRFSS 2006-2010 NH=Non-Hispanic
Physical Activity
Figure 13. Leisure Time Physical Activity during the Last 30 Days, Maryland 2006-2010
Figure 13 shows the percentage of the population reporting leisure time physical activity during the last 30 days. Hispanics were significantly less likely to report participation in physical activity; than Non-Hispanic Whites and Non-Hispanic Asians.
Source: Maryland BRFSS 2006-2010 NH=Non-Hispanic *statistically significant vs. NH Whites
Binge Drinking
Figure 14. Binge Drinking, Maryland 2006-2010
Figure 14 shows the percentage of binge drinking for residents in Maryland. Nearly 13% of Hispanics reported binge drinking. This figure was lower than the percentage for Non-Hispanic Whites, but higher than that of Non-Hispanic Blacks and Non-Hispanic Asians. Source: Maryland BRFSS 2006-2010 NH=Non-Hispanic *statistically significant vs. NH Whites
Note: Binge drinkers are defined as males having five or more drinks and females having four or more drinks on one occasion in the past month.

Hispanics in Maryland: Health Data and resources
Page 10 Office of Minority Health and Health Disparities Maryland Department of Health and Mental Hygiene
Smoking
Figure 15. Percentage of Current Smokers, Maryland, 2006-2010
Figure 15 shows that the percentage of current smokers among Hispanics in Maryland was significantly lower than that of Non-Hispanic Whites and Non-Hispanic Blacks. Current smokers are defined here as individuals who smoked at least 100 cigarettes in their lifetime and were currently smoking. *statistically significantly vs. Non-Hispanic Whites NH=Non-Hispanic Source: Maryland BRFSS 2006-2010
Occupational Injury
Figure 16. Fatal Occupational Injuries by Race, Maryland 2011
Figure 16 shows the distribution of fatal occupational injuries by race and ethnicity in Maryland. Eleven percent of Hispanics total fatal injuries occurred among Hispanics, which was 2.8 percent higher than Hispanics’ contribution to the total population in Maryland. Hispanics were more likely to have fatal occupational injuries than Non-Hispanic Whites and Non-Hispanic Asians/Pacific Islanders/Native Hawaiians. NH=Non-Hispanic Source: Maryland Occupational Safety and Health (MOSH) Research and Statistics Unit, 2011
Flu Shot Pneumonia Shot
Figure 17. Percentage of Population that Received Flu Vaccine, Maryland, 2006-2010
Figure 18. Percentage of Population that Received Pneumonia Vaccine, Maryland, 2006-2010
Source: Maryland BRFSS 2006-2010 NH=Non-Hispanic *statistically significantly vs. Non-Hispanic Whites
Figure 17 and Figure 18 show the percentages of the population that received flu and pneumonia vaccinations. Hispanics in Maryland had the lowest percentages of individuals receiving vaccines for both flu and pneumonia, significantly lower than the rate for other population groups. Specifically, the percentage of Hispanics who received a flu shot was13.9% lower than that of Non-Hispanics Whites, and the percentage of Hispanics that received a pneumonia shot was 7.8 percentage point lower than that of Non-Hispanic Whites.

Hispanics in Maryland: Health Data and resources
Page 11 Office of Minority Health and Health Disparities Maryland Department of Health and Mental Hygiene
CANCER
Leading Cancer Deaths Figure 19. Leading Cancer Mortality for Hispanics in Maryland 2006-2010
Figure 19 shows the seven leading causes of cancer deaths by cancer type for Hispanics in Maryland. Lung cancer ranked the first, followed by colon cancer and stomach cancer. Other leading cancer causes also included breast cancer, pancreatic cancer, prostate cancer, and blood cancer. Source: CDC Wonder Mortality Data 2006-2010
Mammogram Figure 20. Percentage of Women Age 50 or Older Who Have Had a Mammogram Within Past Two Years, Maryland 2006 to 2010
Source: Maryland BRFSS 2006-2010
Pap Smear Figure 21. Percentage of Women Age 18 or Older With Intact Cervix Who Have Ever Had a Pap Smear, Maryland 2006 to 2010
*statistically significantly vs. Non-Hispanic Whites
Source: Maryland BRFSS 2006-2010
Figure 20 presents the breast cancer screening rates for Hispanics in Maryland. It can be seen that Hispanics had the highest percentage of population having had a mammogram within the past two years, compared to all other racial and ethnic groups. Figure 21 presents the cervical cancer screening rate for Hispanics in Maryland. Hispanic women were more likely to have had a pap smear than Asian women, but less likely to have had a pap smear than other population groups.

Hispanics in Maryland: Health Data and resources
Page 12 Office of Minority Health and Health Disparities Maryland Department of Health and Mental Hygiene
CHRONIC DISEASE
Diabetes
Figure 22. Percentage of Adults Age 65 or Older Reporting Diagnosed Diabetes, Maryland 2006-2010
Figure 22 shows the percentage of adults 65 years and older with diabetes in Maryland. Nearly 30% of Hispanics who were 65 and older had diabetes, which was 11.8% higher than the proportion reported for Non-Hispanic Whites. *significantly different vs. Non-Hispanic Whites Source: Maryland BRFSS Data 2006 to 2010
Asthma
Figure 23. Prevalence of Asthma among Adults by Race/Ethnicity, Maryland 2007-2009
Figure 23 shows the current asthma prevalence among adults in Maryland. Hispanics had the lowest prevalence of asthma across all racial and ethnic groups. The referenced report also shows that Hispanics had the lowest asthma hospitalization rate across all groups. Source: Maryland Asthma Surveillance Report, Asthma in Maryland 2011
End Stage Renal Disease
Figure 24. Incidence of All-Cause ESRD by Age and Ethnicity, Maryland 1991-2001
Figure 24 shows the incidence of all-cause end stage renal disease (ESRD) in Maryland. Based on the pooled data from 1991 through 2001, the rates of new cases of ESRD in Maryland were higher for Hispanics than for Non-Hispanic Whites in the age groups older than 54 years of age (NOTE: Hispanic ethnicity was not collected prior to 1996). Source: DHMH Analysis of US Renal Data System Data

Hispanics in Maryland: Health Data and resources
Page 13 Office of Minority Health and Health Disparities Maryland Department of Health and Mental Hygiene
HIV AND INFECTIOUS DISEASES
HIV AIDS
Figure 25. HIV Incidence Rate by Race/Ethnicity Maryland 2009
Figure 26. AIDS Incidence Rate by Race/Ethnicity Maryland 2009
Figure 25 and Figure 26 present HIV and AIDS incidence rate by race/ethnicity in Maryland in 2009. The incidence rate of HIV was 3.6 times higher than that of Non-Hispanic Whites, and the AIDS incidence rate was 4.7 times higher for Hispanics than for Non-Hispanic Whites. However, the incidence of both HIV and AIDS were significantly lower among Hispanics than among Non-Hispanic Blacks.
Source: Maryland HIV/AIDS Epidemiological Profile Fourth Quarter 2009 Note: only Non-Hispanic Whites and the racial groups that ranked the first and the last
were chosen to be listed in the Figure 25 and Figure 26 due to space limitation.
Syphilis
Figure 27. Syphilis Rate by Race/Ethnicity, Maryland 2011
Figure 27 shows the syphilis rate by race/ethnicity in Maryland in 2011. Hispanics had a higher syphilis rate than Non-Hispanic Asian/Pacific Islanders, and Non-Hispanic Whites, but the rate was much lower than that of Non-Hispanic Blacks. NOTE: race/ethnicity was unknown to 2% of syphilis cases Source: Center STI Prevention-PHPA, DHMH, 2012
Tuberculosis (TB)
Figure 28. Tuberculosis Incidence in Maryland 2007-2011
Figure 28 presents the tuberculosis (TB) incidence in Maryland. Hispanics had a TB incidence rate of 10.5 per 100,000 population. This rate was 15 times higher than that of Non-Hispanic Whites, and 1.7 times higher than that of Non-Hispanic Blacks, but substantially lower than the rate for Asians. Source: Maryland DHMH, IDEAHA Center For Tb Control & Prevention, 2012
Hispanics in Maryland: Health Data and resources
Page 14 Office of Minority Health and Health Disparities Maryland Department of Health and Mental Hygiene
MATERNAL AND INFANT HEALTH
Infant Mortality
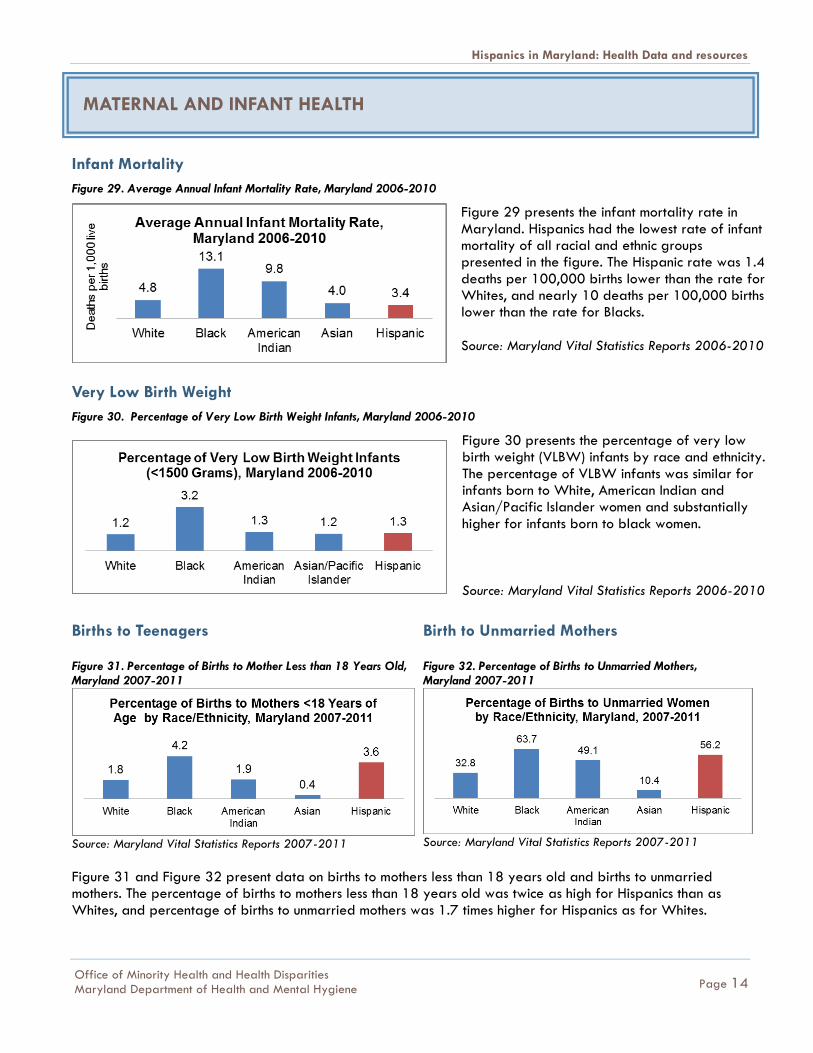
Figure 29. Average Annual Infant Mortality Rate, Maryland 2006-2010
Figure 29 presents the infant mortality rate in Maryland. Hispanics had the lowest rate of infant mortality of all racial and ethnic groups presented in the figure. The Hispanic rate was 1.4 deaths per 100,000 births lower than the rate for Whites, and nearly 10 deaths per 100,000 births lower than the rate for Blacks. Source: Maryland Vital Statistics Reports 2006-2010
Very Low Birth Weight
Figure 30. Percentage of Very Low Birth Weight Infants, Maryland 2006-2010
Figure 30 presents the percentage of very low birth weight (VLBW) infants by race and ethnicity. The percentage of VLBW infants was similar for infants born to White, American Indian and Asian/Pacific Islander women and substantially higher for infants born to black women.
Source: Maryland Vital Statistics Reports 2006-2010
Births to Teenagers Figure 31. Percentage of Births to Mother Less than 18 Years Old, Maryland 2007-2011
Source: Maryland Vital Statistics Reports 2007-2011
Birth to Unmarried Mothers Figure 32. Percentage of Births to Unmarried Mothers, Maryland 2007-2011
Source: Maryland Vital Statistics Reports 2007-2011
Figure 31 and Figure 32 present data on births to mothers less than 18 years old and births to unmarried mothers. The percentage of births to mothers less than 18 years old was twice as high for Hispanics than as Whites, and percentage of births to unmarried mothers was 1.7 times higher for Hispanics as for Whites.

Hispanics in Maryland: Health Data and resources
Page 15 Office of Minority Health and Health Disparities Maryland Department of Health and Mental Hygiene
MENTAL HEALTH
Mental Health Care Seeking Table 7. Percent of Maryland Adults Reporting Seeing a Provider For a Mental Health Problem, By Race/Ethnicity, 2001-2002
NH White NH Black NH Other NH Multiracial Hispanic
Age 18-44 24.8% 13.4%* 11.5%* DNS 14.7%*
Age 45-64 24.7% 12.2%* 7.0%* DNS DNS
Age 65 + 13.3% 5.5%* DNS DNS DNS
* minority group is statistically significantly different from NH Whites
DNS = Data not sufficient to report a result
Percent Reporting Ever Seeing a Provider for a Mental Health Problem
By Race and Ethnicity, Maryland BRFSS 2001 and 2002 Pooled
Source: Maryland BRFSS Data 2001 to 2002
Maryland’s Behavioral Risk Factor Surveillance System (BRFSS) data indicates an underutilization of mental health services by minority populations. Table 7 presents the percentage of individuals by racial/ethnic group who have ever seen a provider for a mental health problem, and Table 8 presents percentage of each racial/ethnic group reporting poor mental health in the previous month. In the 18-44 age group, Non-Hispanic Whites were 68% more likely than Hispanics to report ever having ever seen a provider for a mental health problem (Table 7), despite reporting a lower burden of poor mental health days compared to Hispanics of the same age group (Table 8). This difference in care-seeking between Hispanic and Non-Hispanic Whites was statistically significant (Table 7). Additionally, Hispanics of all age groups reported higher levels of poor mental health than Non-Hispanic Whites (Table 8).
Poor Mental Health Table 8. Percent of Maryland Adults Reporting 30 Days Of Poor Mental Health In The Previous Month, By Race/ Ethnicity, 2003-2007
NH White NH Black NH Other NH Multiracial Hispanic
Age 18-44 3.9% 5.7%* 3.6% 6.2% 4.9%
Age 45-64 4.7% 5.6% 6.0% 13.1%* 5.4%
Age 65 + 3.2% 3.8% 2.2% DNS 3.5%
* minority group is statistically significantly different from NH Whites
DNS = Data not sufficient to report a result
Percent Reporting 30 days of Poor Mental Health in Previous Month
By Race and Ethnicity, Maryland BRFSS 2003 to 2007 Pooled
Source: Maryland BRFSS Data 2003 to 2007
NOTE: Maryland BRFSS mental health data is not available for the period of 2006-2010

Hispanics in Maryland: Health Data and resources
Page 16 Office of Minority Health and Health Disparities Maryland Department of Health and Mental Hygiene
MARYLAND HISPANICS HEALTH RESOURCES
Casa de Maryland | http://www.casademaryland.org/home
CASA's primary mission is to work with the community to improve the quality of life and fight for equal treatment and full access to resources and opportunities for low-income Latinos.
Proyecto Salud Clinic | http://www.proyectosalud.org/
Located in Montgomery County, Proyecto Salud Clinic seeks to provide high quality, culturally competent, and affordable primary healthcare services to its patients. Staff at the clinic speak English, Spanish, Mandarin and French.
Mary’s Center | http://www.maryscenter.org
Mary’s Center is a Federally Qualified Health Center that provides health care, family literacy and social services to individuals whose needs too often go unmet by the public and private systems. Locations in Maryland include Silver Spring and Adelphi.
Latino Health Initiative | http://www.lhiinfo.org/index/en-index.asp
The Latino Health Initiative works to improve the quality of life of Latinos living in Montgomery County by contributing to the development and implementation of an integrated, coordinated, culturally and linguistically competent health wellness system that supports Latino families and communities.
El Programa de Recursos y Servicios Para la Comunidad Latina | http://www.healthcareaccessmaryland.org/programs-services/immigrant-resources-and-services/hispanic-resources/
Baltimore HealthCare Access’ Hispanic Resources and Services Program seek to reduce barriers to quality health care in the Latino community. They provide assistance to the Latino community in a variety of ways – through publications, community connections, and outreach activities.
Spanish Catholic Center | http://www.catholiccharitiesdc.org/
The Spanish Catholic Center offers medical and dental clinics, job training programs, English classes, a food pantry and case management services in four locations (including two locations in Montgomery County).
Centro de la Comunidad | http://www.centrodlc.org/
Centro de la Comunidad promotes the continued successful participation of the Hispanic community in the social, economic, and political life of the greater Baltimore Metropolitan region.
FIRN | http://www.firnonline.org
FIRN empowers immigrants, refugees, asylees and other foreign-born individuals by helping them to access community resources and opportunities in Howard County Maryland.
Maryland Department of Health and Mental Hygiene Office of Minority Health and Health Disparities
Website: http://dhmh.maryland.gov/mhhd/ | Tel: (410) 767-7117 |
Email: [email protected] | Address: Room 500, 201 West Preston Street Baltimore,
MD 21201 | Facebook: https://www.facebook.com/MarylandMHHD
Acknowledgement: Carlessia Hussein, R.N., Dr.P.H., Julia Chen, MPP., CHES., David Mann, MD., PhD