Hispanic-Serving Institutions (HSIs): 2019-20
16
Hispanic-Serving Institutions (HSIs): 2019-20 www.EdExcelencia.org Summary of the 2019-20 HSI List In the 1980s, leaders recognized a small set of institutions enrolled a large percentage of Latino students but had low levels of resources to educate these students. The classification of Hispanic-Serving Institutions (HSIs) formally recognized these institutions for capacity-building and other support. HSIs are defined as accredited, degree-granting public or private nonprofit institutions of higher education with 25% or more total undergraduate Hispanic full-time equivalent (FTE) student enrollment. 1 In 2019-20, 569 institutions met the enrollment definition of HSIs. HSIs represent 18% of colleges/universities and enroll 67% of Latino undergraduates. The list of institutions identified as HSIs in this analysis is not intended to designate eligibility for any specific program; rather, the list is meant to assist in considering and analyzing the institutions that meet the basic legislative definition of a Hispanic-Serving Institution. The following list of HSIs was created using data from the Integrated Postsecondary Education Data System (IPEDS). 2 1 Summary of Title V of the Higher Education Opportunity Act, as amended in 2008. To be eligible for the “Developing HSIs Program,” the law further requires that an HSI have a high enrollment of needy students and low core expenses. 2 IPEDS is a system of surveys designed to collect institution-level data from all primary providers of postsecondary education. IPEDS is maintained at the National Center for Education Statistics (NCES), U.S. Department of Education. The mission of Excelencia in Education is to accelerate Latino student success in higher education. A critical group of institutions enrolling and graduating Latino students are Hispanic-Serving Institutions (HSIs). Location State/Location # HSIs California 175 Texas 100 Puerto Rico 64 New York 35 Florida 29 Illinois 29 New Mexico 24 Arizona 22 New Jersey 20 Colorado 15 Massachusetts 9 Connecticut 8 Oregon 6 Washington 6 Kansas 4 Nevada 4 Pennsylvania 3 Indiana 2 Oklahoma 2 Wisconsin 2 Arkansas 1 District of Columbia 1 Georgia 1 Idaho 1 Louisiana 1 Maryland 1 North Carolina 1 Ohio 1 Rhode Island 1 Utah 1 Total (n=30): 569 Sector Sector # HSIs % HSIs Public, 2-year 235 41% Private not-for-profit, 4-year or above 169 30% Public, 4-year or above 150 26% Private not-for-profit, 2-year 15 3% Total: 569 100% Full-Time Equivalent (FTE) Enrollment FTE Enrollment # HSIs % of HSIs < 500 95 17% 500 - 1,000 54 9% 1,001 - 2,000 76 13% 2,001 - 3,000 53 9% 3,001 - 4,000 47 8% 4,001 - 5,000 35 6% 5,001 - 10,000 104 18% > 10,000 105 18% Total: 569 100% Degree of Urbanization Type # HSIs % of HSIs City 305 54% Suburb 171 7% Town 53 30% Rural 40 9% Total: 569 100% Total FTE Enrollment at HSIs Race/Ethnicity Undergraduate Hispanic/Latino 1,490,244 All students 3,244,469 % Latino: 46%
Transcript of Hispanic-Serving Institutions (HSIs): 2019-20
Hispanic-Serving Institutions (HSIs): 2019-20
www.EdExcelencia.org
Summary of the 2019-20 HSI List In the 1980s, leaders recognized a small set of institutions enrolled a large percentage of Latino students but had low levels of resources to educate these students. The classification of Hispanic-Serving Institutions (HSIs) formally recognized these institutions for capacity-building and other support. HSIs are defined as accredited, degree-granting public or private nonprofit institutions of higher education with 25% or more total undergraduate Hispanic full-time equivalent (FTE) student enrollment.1
In 2019-20, 569 institutions met the enrollment definition of HSIs. HSIs represent 18% of colleges/universities and enroll 67% of Latino undergraduates.
The list of institutions identified as HSIs in this analysis is not intended to designate eligibility for any specific program; rather, the list is meant to assist in considering and analyzing the institutions that meet the basic legislative definition of a Hispanic-Serving Institution. The following list of HSIs was created using data from the Integrated Postsecondary Education Data System (IPEDS).2
1 Summary of Title V of the Higher Education Opportunity Act, as amended in 2008. To be eligible for the “Developing HSIs Program,” the law further
requires that an HSI have a high enrollment of needy students and low core expenses. 2 IPEDS is a system of surveys designed to collect institution-level data from all primary providers of postsecondary education. IPEDS is maintained
at the National Center for Education Statistics (NCES), U.S. Department of Education.
The mission of Excelencia in Education is to accelerate Latino student success in higher education. A critical group of institutions enrolling and graduating Latino students are Hispanic-Serving Institutions (HSIs).
Location State/Location # HSIs California 175 Texas 100 Puerto Rico 64 New York 35 Florida 29 Illinois 29 New Mexico 24 Arizona 22 New Jersey 20 Colorado 15 Massachusetts 9 Connecticut 8 Oregon 6 Washington 6 Kansas 4 Nevada 4 Pennsylvania 3 Indiana 2 Oklahoma 2 Wisconsin 2 Arkansas 1 District of Columbia 1 Georgia 1 Idaho 1 Louisiana 1 Maryland 1 North Carolina 1 Ohio 1 Rhode Island 1 Utah 1
Total (n=30): 569
Sector Sector # HSIs % HSIs Public, 2-year 235 41% Private not-for-profit, 4-year or above 169 30% Public, 4-year or above 150 26% Private not-for-profit, 2-year 15 3%
Total: 569 100% Full-Time Equivalent (FTE) Enrollment FTE Enrollment # HSIs % of HSIs < 500 95 17% 500 - 1,000 54 9% 1,001 - 2,000 76 13% 2,001 - 3,000 53 9% 3,001 - 4,000 47 8% 4,001 - 5,000 35 6% 5,001 - 10,000 104 18% > 10,000 105 18%
Total: 569 100%
Degree of Urbanization Type # HSIs % of HSIs City 305 54% Suburb 171 7% Town 53 30% Rural 40 9%
Total: 569 100%
Total FTE Enrollment at HSIs Race/Ethnicity Undergraduate Hispanic/Latino 1,490,244 All students 3,244,469
% Latino: 46%

Hispanic-Serving Institutions (HSIs): 2019-20
www.EdExcelencia.org1 of 15
Institution City Sector Total Hispanic %
HispanicARIZONA (AZ)Arizona State University-Downtown Phoenix Phoenix 4 Pub 8,104 2,750 33.9%Arizona State University-West Glendale 4 Pub 4,288 1,617 37.7%Arizona Western College Yuma 2 Pub 3,894 2,910 74.7%Central Arizona College Coolidge 2 Pub 2,643 973 36.8%Chandler-Gilbert Community College Chandler 2 Pub 8,124 2,150 26.5%Cochise County Community College District Sierra Vista 2 Pub 2,214 1,064 48.0%CollegeAmerica-Phoenix Phoenix 4 Priv 392 192 49.0%Estrella Mountain Community College Avondale 2 Pub 5,562 3,166 56.9%GateWay Community College Phoenix 2 Pub 2,553 1,274 49.9%Glendale Community College Glendale 2 Pub 9,687 3,929 40.6%Mesa Community College Mesa 2 Pub 10,899 3,437 31.5%Northern Arizona University Flagstaff 4 Pub 23,660 5,934 25.1%Ottawa University-Phoenix Phoenix 4 Priv 253 73 28.7%Ottawa University-Surprise Surprise 4 Priv 671 172 25.7%Paradise Valley Community College Phoenix 2 Pub 4,185 1,132 27.1%Phoenix College Phoenix 2 Pub 5,611 3,234 57.6%Pima Community College Tucson 2 Pub 9,678 4,629 47.8%Rio Salado College Tempe 2 Pub 7,856 2,013 25.6%South Mountain Community College Phoenix 2 Pub 2,262 1,293 57.1%Southwest University of Visual Arts-Tucson Tucson 4 Priv 84 41 48.5%University of Arizona Tucson 4 Pub 31,209 8,248 26.4%University of Arizona-Sierra Vista Sierra Vista 4 Pub 308 146 47.3%
AZ Total 22 144,138 50,378 35.0%ARKANSAS (AK)Cossatot Community College of the University of Arkansas De Queen 2 Pub 899 244 27.2%
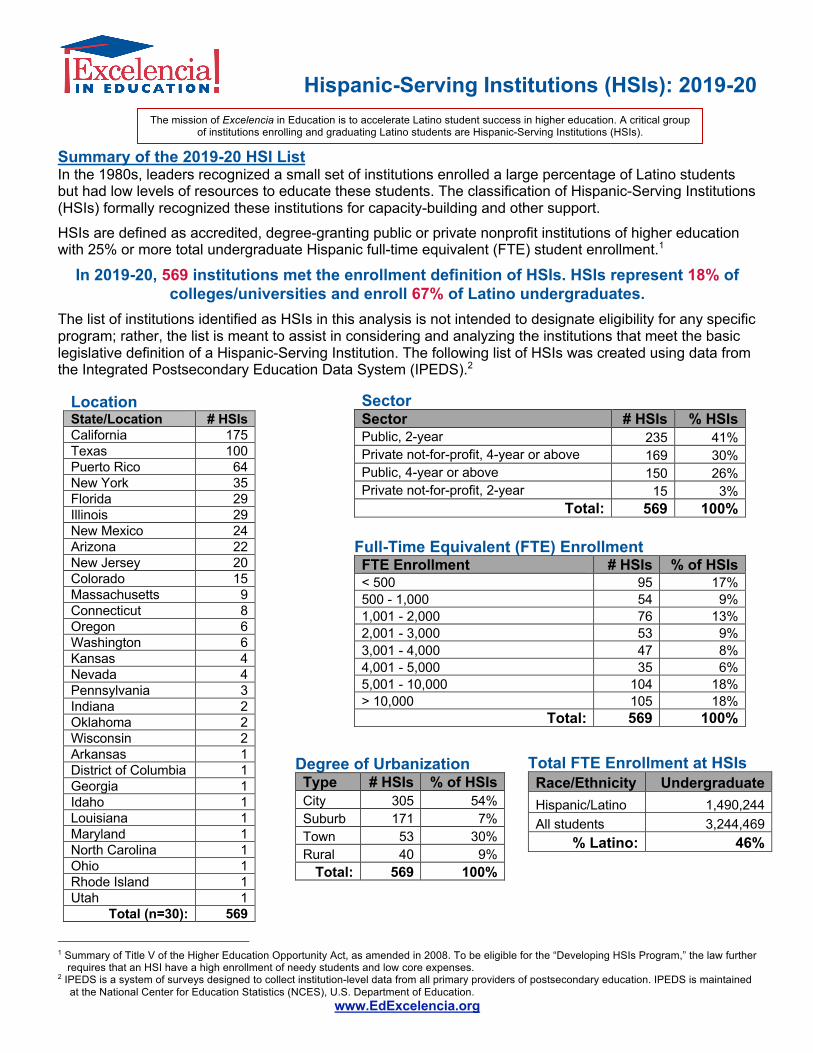
AK TOTAL 1 899 244 27.2%CALIFORNIA (CA)Allan Hancock College Santa Maria 2 Pub 6,381 4,206 65.9%American River College Sacramento 2 Pub 14,559 3,991 27.4%Antelope Valley College Lancaster 4 Pub 8,076 4,710 58.3%Antioch University-Santa Barbara Santa Barbara 4 Priv 53 14 25.5%Azusa Pacific University Azusa 4 Priv 4,696 1,561 33.2%Bakersfield College Bakersfield 4 Pub 15,225 10,584 69.5%Barstow Community College Barstow 2 Pub 1,864 820 44.0%Berkeley City College Berkeley 2 Pub 2,869 777 27.1%Butte College Oroville 2 Pub 6,590 2,024 30.7%Cabrillo College Aptos 2 Pub 6,176 3,036 49.2%California Baptist University Riverside 4 Priv 7,670 2,772 36.1%California College San Diego San Marcos 4 Priv 250 117 46.8%California College San Diego San Diego 4 Priv 536 208 38.8%California Lutheran University Thousand Oaks 4 Priv 3,013 1,117 37.1%California State Polytechnic University-Pomona Pomona 4 Pub 24,749 11,717 47.3%California State University-Bakersfield Bakersfield 4 Pub 9,069 5,424 59.8%California State University-Channel Islands Camarillo 4 Pub 6,424 3,432 53.4%California State University-Chico Chico 4 Pub 15,470 5,373 34.7%California State University-Dominguez Hills Carson 4 Pub 13,419 9,031 67.3%
Undergraduate FTE Enrollment
Hispanic-Serving Institutions (HSIs): 2019-20
www.EdExcelencia.org2 of 15
(California - continued)
Institution City Sector Total Hispanic%
HispanicCalifornia State University-East Bay Hayward 4 Pub 11,671 4,347 37.2%California State University-Fresno Fresno 4 Pub 19,966 10,898 54.6%California State University-Fullerton Fullerton 4 Pub 31,449 14,438 45.9%California State University-Long Beach Long Beach 4 Pub 30,488 13,458 44.1%California State University-Los Angeles Los Angeles 4 Pub 20,967 14,671 70.0%California State University-Monterey Bay Seaside 4 Pub 6,351 3,121 49.1%California State University-Northridge Northridge 4 Pub 31,531 16,467 52.2%California State University-Sacramento Sacramento 4 Pub 26,007 9,162 35.2%California State University-San Bernardino San Bernardino 4 Pub 17,248 11,573 67.1%California State University-San Marcos San Marcos 4 Pub 13,237 6,290 47.5%California State University-Stanislaus Turlock 4 Pub 8,852 5,048 57.0%Canada College Redwood City 2 Pub 2,611 1,223 46.8%Casa Loma College-Van Nuys Van Nuys 2 Priv 162 58 35.8%CBD College Los Angeles 2 Priv 788 245 31.1%Cerritos College Norwalk 2 Pub 12,233 8,150 66.6%Cerro Coso Community College Ridgecrest 2 Pub 2,505 1,000 39.9%Chabot College Hayward 2 Pub 7,067 2,874 40.7%
Chaffey CollegeRancho Cucamonga 2 Pub 11,757 7,685 65.4%
Charles R Drew University of Medicineand Science Los Angeles 4 Priv 162 49 30.1%Citrus College Glendora 2 Pub 7,948 5,139 64.7%City College of San Francisco San Francisco 2 Pub 13,253 3,451 26.0%Clovis Community College Fresno 2 Pub 4,466 1,942 43.5%Coastline Community College Fountain Valley 2 Pub 4,475 1,401 31.3%College of Alameda Alameda 2 Pub 2,608 721 27.6%College of Marin Kentfield 2 Pub 2,547 824 32.4%College of San Mateo San Mateo 2 Pub 4,197 1,280 30.5%College of the Canyons Santa Clarita 2 Pub 10,421 5,189 49.8%College of the Desert Palm Desert 2 Pub 7,250 5,377 74.2%College of the Sequoias Visalia 2 Pub 7,949 5,487 69.0%Compton College Compton 2 Pub 2,870 1,866 65.0%Concordia University-Irvine Irvine 4 Priv 1,651 417 25.3%Contra Costa College San Pablo 2 Pub 3,619 1,727 47.7%Copper Mountain Community College Joshua Tree 2 Pub 879 328 37.3%Cosumnes River College Sacramento 2 Pub 7,393 2,030 27.5%Crafton Hills College Yucaipa 2 Pub 3,642 1,806 49.6%Cuesta College San Luis Obispo 2 Pub 5,891 1,917 32.5%Cuyamaca College El Cajon 2 Pub 4,234 1,463 34.6%Cypress College Cypress 4 Pub 9,648 4,570 47.4%De Anza College Cupertino 2 Pub 12,457 3,248 26.1%Diablo Valley College Pleasant Hill 2 Pub 11,512 2,927 25.4%Dominican University of California San Rafael 4 Priv 1,325 340 25.7%East Los Angeles College Monterey Park 2 Pub 16,909 11,728 69.4%East San Gabriel Valley Regional Occupational Program West Covina 2 Pub 73 57 78.9%El Camino Community College District Torrance 2 Pub 13,606 5,688 41.8%Evergreen Valley College San Jose 2 Pub 5,204 2,237 43.0%Feather River Community College District Quincy 4 Pub 1,140 303 26.6%
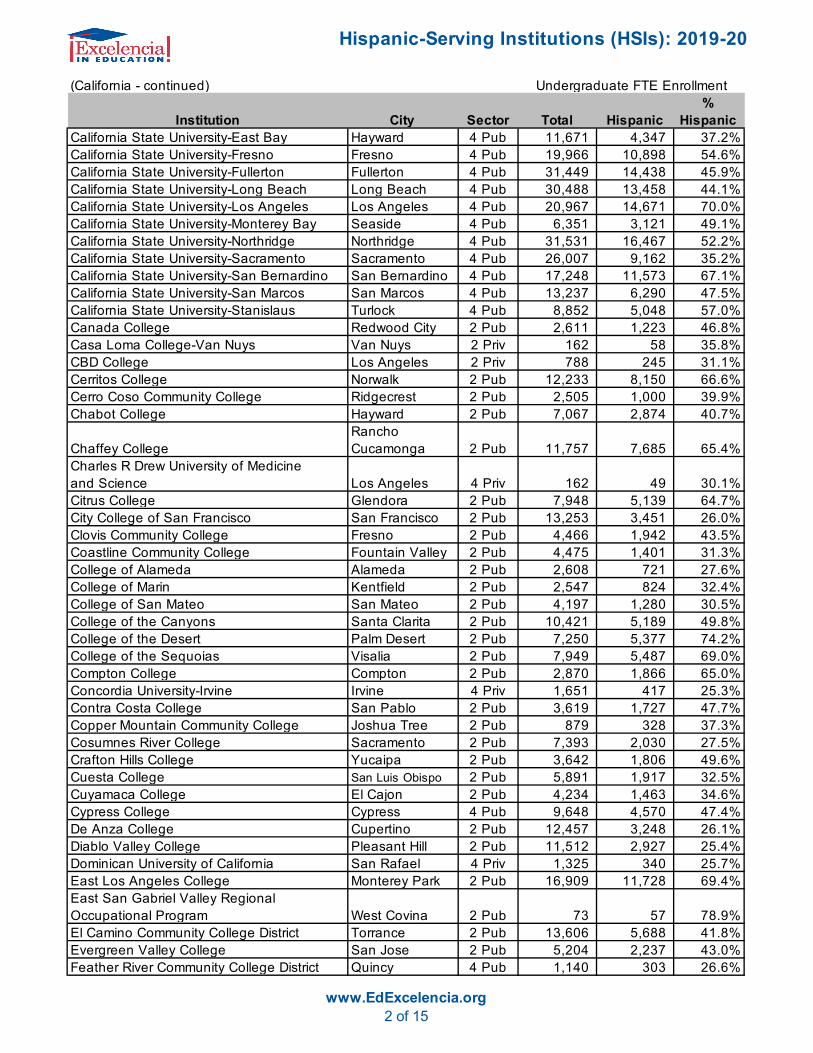
Undergraduate FTE Enrollment
Hispanic-Serving Institutions (HSIs): 2019-20
www.EdExcelencia.org3 of 15
(California - continued)
Institution City Sector Total Hispanic%
HispanicFoothill College Los Altos Hills 4 Pub 8,589 2,454 28.6%Fresno City College Fresno 2 Pub 13,504 8,203 60.7%Fresno Pacific University Fresno 4 Priv 2,640 1,470 55.7%Fullerton College Fullerton 2 Pub 13,218 7,591 57.4%Gavilan College Gilroy 2 Pub 3,161 1,981 62.7%Glendale Community College Glendale 2 Pub 8,999 2,630 29.2%Golden West College Huntington Beach 2 Pub 6,741 2,430 36.0%Grossmont College El Cajon 2 Pub 9,616 3,561 37.0%Hacienda La Puente Adult Education La Puente 2 Pub 720 507 70.4%Hartnell College Salinas 2 Pub 6,783 4,896 72.2%Holy Names University Oakland 4 Priv 622 250 40.3%Homestead Schools Torrance 4 Priv 151 42 28.0%Hope International University Fullerton 4 Priv 576 172 29.8%Humboldt State University Arcata 4 Pub 6,286 2,205 35.1%Humphreys University-Stockton and Modesto Campuses Stockton 4 Priv 222 64 28.8%Imperial Valley College Imperial 2 Pub 5,571 5,135 92.2%John Paul the Great Catholic University Escondido 4 Priv 266 75 28.4%La Sierra University Riverside 4 Priv 1,664 817 49.1%Lake Tahoe Community College South Lake Tahoe 2 Pub 1,310 421 32.1%Las Positas College Livermore 2 Pub 4,886 1,407 28.8%Lassen Community College Susanville 2 Pub 1,228 365 29.7%Life Pacific University San Dimas 4 Priv 423 175 41.3%Loma Linda University Loma Linda 4 Priv 1,021 371 36.4%Long Beach City College Long Beach 2 Pub 14,365 8,631 60.1%Los Angeles City College Los Angeles 2 Pub 7,183 3,815 53.1%Los Angeles County College of Nursing and Allied Health Los Angeles 2 Pub 67 32 47.7%Los Angeles Harbor College Wilmington 2 Pub 4,493 2,757 61.4%Los Angeles Mission College Sylmar 2 Pub 4,660 3,710 79.6%Los Angeles Pacific University San Dimas 4 Priv 923 413 44.8%Los Angeles Pierce College Woodland Hills 2 Pub 9,724 4,624 47.6%Los Angeles Southwest College Los Angeles 2 Pub 2,940 1,406 47.8%Los Angeles Trade Technical College Los Angeles 2 Pub 6,049 4,180 69.1%Los Angeles Valley College Valley Glen 2 Pub 8,188 4,175 51.0%Los Medanos College Pittsburg 2 Pub 5,275 2,340 44.4%Marymount California University Rancho Palos Verdes 4 Priv 592 259 43.8%Mendocino College Ukiah 2 Pub 1,988 780 39.3%Menlo College Atherton 4 Priv 849 220 25.9%Merced College Merced 2 Pub 6,955 3,878 55.8%Merritt College Oakland 2 Pub 3,329 1,148 34.5%Mills College Oakland 4 Priv 693 226 32.6%MiraCosta College Oceanside 4 Pub 8,124 3,175 39.1%Mission College Santa Clara 2 Pub 3,470 1,052 30.3%Modesto Junior College Modesto 4 Pub 10,626 5,725 53.9%Monterey Peninsula College Monterey 2 Pub 4,213 1,997 47.4%Moorpark College Moorpark 2 Pub 8,293 2,970 35.8%Moreno Valley College Moreno Valley 2 Pub 5,176 3,323 64.2%
Undergraduate FTE Enrollment
Hispanic-Serving Institutions (HSIs): 2019-20
www.EdExcelencia.org4 of 15
(California - continued)
Institution City Sector Total Hispanic%
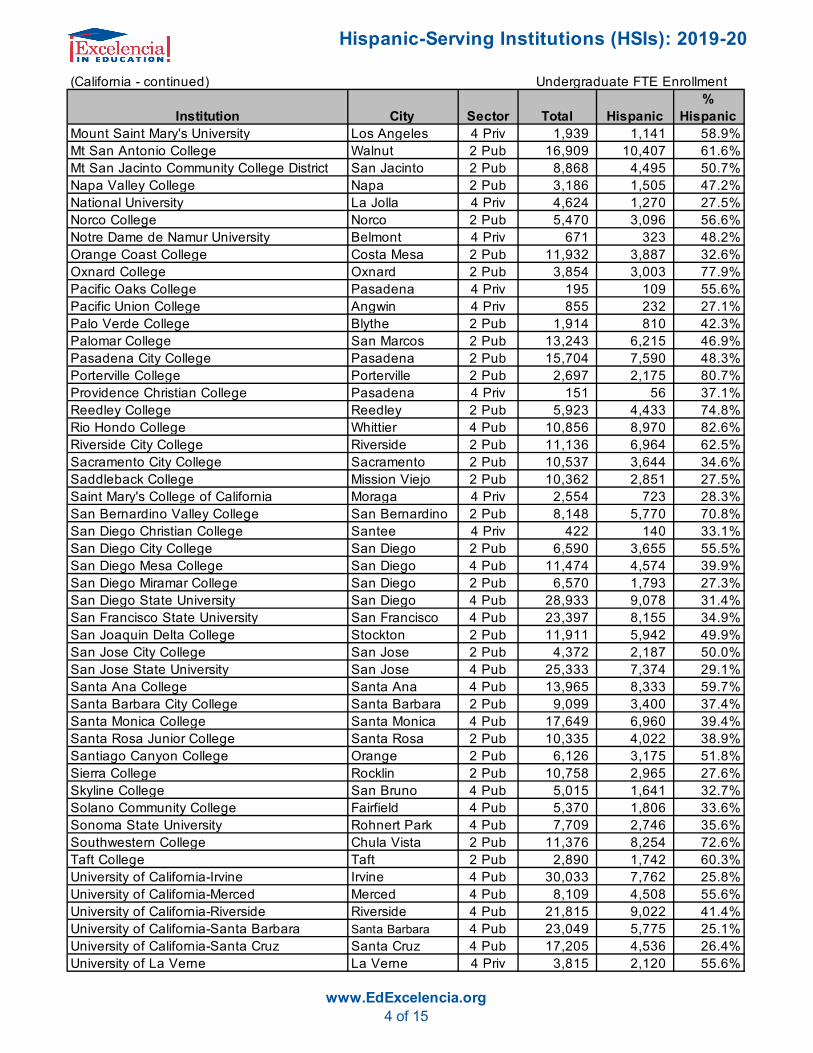
HispanicMount Saint Mary's University Los Angeles 4 Priv 1,939 1,141 58.9%Mt San Antonio College Walnut 2 Pub 16,909 10,407 61.6%Mt San Jacinto Community College District San Jacinto 2 Pub 8,868 4,495 50.7%Napa Valley College Napa 2 Pub 3,186 1,505 47.2%National University La Jolla 4 Priv 4,624 1,270 27.5%Norco College Norco 2 Pub 5,470 3,096 56.6%Notre Dame de Namur University Belmont 4 Priv 671 323 48.2%Orange Coast College Costa Mesa 2 Pub 11,932 3,887 32.6%Oxnard College Oxnard 2 Pub 3,854 3,003 77.9%Pacific Oaks College Pasadena 4 Priv 195 109 55.6%Pacific Union College Angwin 4 Priv 855 232 27.1%Palo Verde College Blythe 2 Pub 1,914 810 42.3%Palomar College San Marcos 2 Pub 13,243 6,215 46.9%Pasadena City College Pasadena 2 Pub 15,704 7,590 48.3%Porterville College Porterville 2 Pub 2,697 2,175 80.7%Providence Christian College Pasadena 4 Priv 151 56 37.1%Reedley College Reedley 2 Pub 5,923 4,433 74.8%Rio Hondo College Whittier 4 Pub 10,856 8,970 82.6%Riverside City College Riverside 2 Pub 11,136 6,964 62.5%Sacramento City College Sacramento 2 Pub 10,537 3,644 34.6%Saddleback College Mission Viejo 2 Pub 10,362 2,851 27.5%Saint Mary's College of California Moraga 4 Priv 2,554 723 28.3%San Bernardino Valley College San Bernardino 2 Pub 8,148 5,770 70.8%San Diego Christian College Santee 4 Priv 422 140 33.1%San Diego City College San Diego 2 Pub 6,590 3,655 55.5%San Diego Mesa College San Diego 4 Pub 11,474 4,574 39.9%San Diego Miramar College San Diego 2 Pub 6,570 1,793 27.3%San Diego State University San Diego 4 Pub 28,933 9,078 31.4%San Francisco State University San Francisco 4 Pub 23,397 8,155 34.9%San Joaquin Delta College Stockton 2 Pub 11,911 5,942 49.9%San Jose City College San Jose 2 Pub 4,372 2,187 50.0%San Jose State University San Jose 4 Pub 25,333 7,374 29.1%Santa Ana College Santa Ana 4 Pub 13,965 8,333 59.7%Santa Barbara City College Santa Barbara 2 Pub 9,099 3,400 37.4%Santa Monica College Santa Monica 4 Pub 17,649 6,960 39.4%Santa Rosa Junior College Santa Rosa 2 Pub 10,335 4,022 38.9%Santiago Canyon College Orange 2 Pub 6,126 3,175 51.8%Sierra College Rocklin 2 Pub 10,758 2,965 27.6%Skyline College San Bruno 4 Pub 5,015 1,641 32.7%Solano Community College Fairfield 4 Pub 5,370 1,806 33.6%Sonoma State University Rohnert Park 4 Pub 7,709 2,746 35.6%Southwestern College Chula Vista 2 Pub 11,376 8,254 72.6%Taft College Taft 2 Pub 2,890 1,742 60.3%University of California-Irvine Irvine 4 Pub 30,033 7,762 25.8%University of California-Merced Merced 4 Pub 8,109 4,508 55.6%University of California-Riverside Riverside 4 Pub 21,815 9,022 41.4%University of California-Santa Barbara Santa Barbara 4 Pub 23,049 5,775 25.1%University of California-Santa Cruz Santa Cruz 4 Pub 17,205 4,536 26.4%University of La Verne La Verne 4 Priv 3,815 2,120 55.6%
Undergraduate FTE Enrollment

Hispanic-Serving Institutions (HSIs): 2019-20
www.EdExcelencia.org5 of 15
(California - continued)
Institution City Sector Total Hispanic%
HispanicUniversity of Redlands Redlands 4 Priv 2,868 1,005 35.0%University of Saint Katherine San Marcos 4 Priv 223 96 43.0%University of the West Rosemead 4 Priv 148 44 29.7%Vanguard University of Southern California Costa Mesa 4 Priv 1,779 783 44.0%Ventura College Ventura 2 Pub 6,896 4,423 64.1%Victor Valley College Victorville 2 Pub 7,124 4,210 59.1%West Hills College-Coalinga Coalinga 2 Pub 1,887 1,312 69.5%West Hills College-Lemoore Lemoore 2 Pub 2,473 1,656 67.0%West Los Angeles College Culver City 4 Pub 6,724 3,258 48.5%West Valley College Saratoga 2 Pub 4,225 1,344 31.8%Whittier College Whittier 4 Priv 1,759 904 51.4%Woodbury University Burbank 4 Priv 1,079 410 38.0%Woodland Community College Woodland 2 Pub 2,170 1,009 46.5%World Mission University Los Angeles 4 Priv 157 50 31.9%Yuba College Marysville 2 Pub 3,417 1,250 36.6%
CA TOTAL 175 1,303,657 606,273 46.5%COLORADO (CO)Adams State University Alamosa 4 Pub 1,601 610 38.1%Aims Community College Greeley 2 Pub 3,689 1,303 35.3%CollegeAmerica-Colorado Springs Colorado Springs 4 Priv 89 24 27.0%CollegeAmerica-Denver Denver 2 Priv 72 44 61.1%Colorado Mountain College Glenwood Springs 4 Pub 3,266 888 27.2%Colorado State University-Pueblo Pueblo 4 Pub 3,520 1,237 35.2%Community College of Aurora Aurora 2 Pub 3,925 1,177 30.0%Community College of Denver Denver 4 Pub 4,785 1,702 35.6%Lamar Community College Lamar 2 Pub 578 183 31.7%Metropolitan State University of Denver Denver 4 Pub 15,052 4,616 30.7%Morgan Community College Fort Morgan 4 Pub 698 233 33.4%Otero Junior College La Junta 2 Pub 799 306 38.3%Pueblo Community College Pueblo 4 Pub 3,807 1,296 34.0%Trinidad State Junior College Trinidad 2 Pub 1,020 452 44.3%University of Colorado Denver/Anschutz Medical Campus Denver 4 Pub 11,666 2,918 25.0%
CO TOTAL 15 54,566 16,988 31.1%CONNECTICUT (CT)Capital Community College Hartford 2 Pub 1,491 482 32.3%Gateway Community College New Haven 2 Pub 3,577 1,049 29.3%Housatonic Community College Bridgeport 2 Pub 2,639 980 37.1%Naugatuck Valley Community College Waterbury 2 Pub 3,427 1,140 33.3%Norwalk Community College Norwalk 2 Pub 2,823 1,161 41.1%Tunxis Community College Farmington 2 Pub 2,250 592 26.3%University of Bridgeport Bridgeport 4 Priv 2,565 690 26.9%University of Connecticut-Stamford Stamford 4 Pub 1,959 585 29.9%
CT TOTAL 8 20,730 6,679 32.2%DISTRICT OF COLUMBIA (DC)Trinity Washington University Washington 4 Priv 1,132 376 33.2%
DC TOTAL 1 1,132 376 33.2%Undergraduate FTE Enrollment
Undergraduate FTE Enrollment
Hispanic-Serving Institutions (HSIs): 2019-20
www.EdExcelencia.org6 of 15
Institution City Sector Total Hispanic%
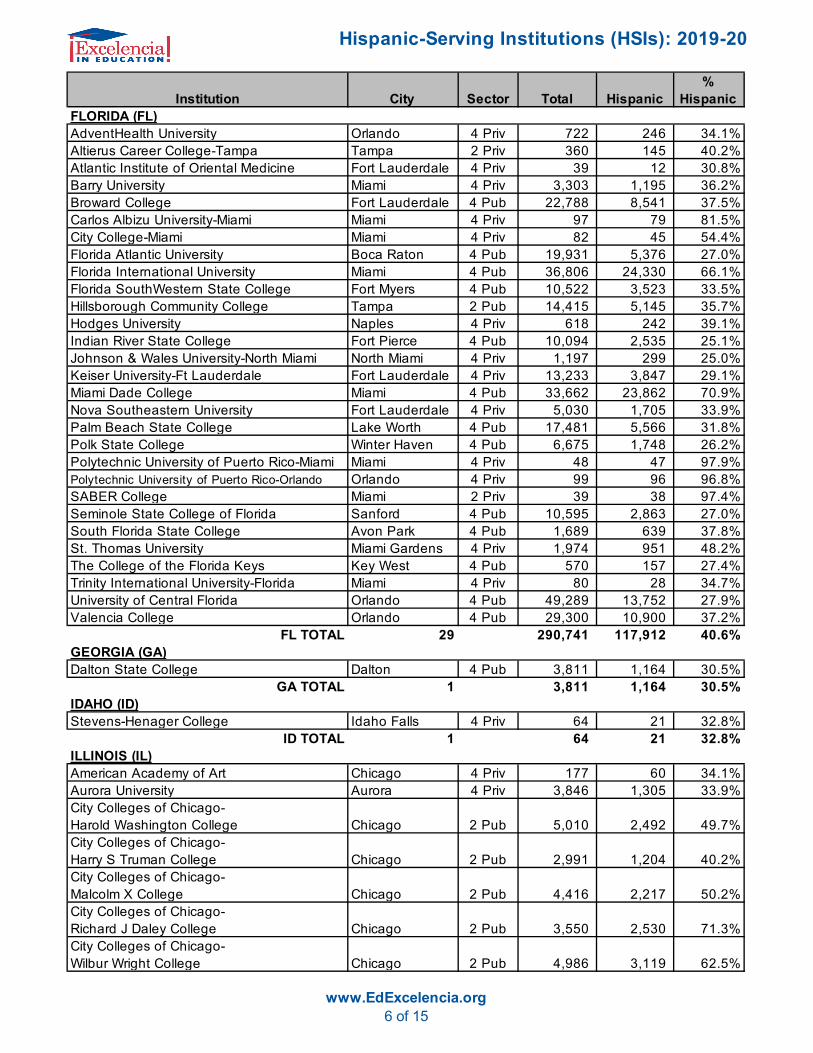
HispanicFLORIDA (FL)AdventHealth University Orlando 4 Priv 722 246 34.1%Altierus Career College-Tampa Tampa 2 Priv 360 145 40.2%Atlantic Institute of Oriental Medicine Fort Lauderdale 4 Priv 39 12 30.8%Barry University Miami 4 Priv 3,303 1,195 36.2%Broward College Fort Lauderdale 4 Pub 22,788 8,541 37.5%Carlos Albizu University-Miami Miami 4 Priv 97 79 81.5%City College-Miami Miami 4 Priv 82 45 54.4%Florida Atlantic University Boca Raton 4 Pub 19,931 5,376 27.0%Florida International University Miami 4 Pub 36,806 24,330 66.1%Florida SouthWestern State College Fort Myers 4 Pub 10,522 3,523 33.5%Hillsborough Community College Tampa 2 Pub 14,415 5,145 35.7%Hodges University Naples 4 Priv 618 242 39.1%Indian River State College Fort Pierce 4 Pub 10,094 2,535 25.1%Johnson & Wales University-North Miami North Miami 4 Priv 1,197 299 25.0%Keiser University-Ft Lauderdale Fort Lauderdale 4 Priv 13,233 3,847 29.1%Miami Dade College Miami 4 Pub 33,662 23,862 70.9%Nova Southeastern University Fort Lauderdale 4 Priv 5,030 1,705 33.9%Palm Beach State College Lake Worth 4 Pub 17,481 5,566 31.8%Polk State College Winter Haven 4 Pub 6,675 1,748 26.2%Polytechnic University of Puerto Rico-Miami Miami 4 Priv 48 47 97.9%Polytechnic University of Puerto Rico-Orlando Orlando 4 Priv 99 96 96.8%SABER College Miami 2 Priv 39 38 97.4%Seminole State College of Florida Sanford 4 Pub 10,595 2,863 27.0%South Florida State College Avon Park 4 Pub 1,689 639 37.8%St. Thomas University Miami Gardens 4 Priv 1,974 951 48.2%The College of the Florida Keys Key West 4 Pub 570 157 27.4%Trinity International University-Florida Miami 4 Priv 80 28 34.7%University of Central Florida Orlando 4 Pub 49,289 13,752 27.9%Valencia College Orlando 4 Pub 29,300 10,900 37.2%
FL TOTAL 29 290,741 117,912 40.6%GEORGIA (GA)Dalton State College Dalton 4 Pub 3,811 1,164 30.5%
GA TOTAL 1 3,811 1,164 30.5%IDAHO (ID)Stevens-Henager College Idaho Falls 4 Priv 64 21 32.8%
ID TOTAL 1 64 21 32.8%ILLINOIS (IL)American Academy of Art Chicago 4 Priv 177 60 34.1%Aurora University Aurora 4 Priv 3,846 1,305 33.9%City Colleges of Chicago- Harold Washington College Chicago 2 Pub 5,010 2,492 49.7%City Colleges of Chicago- Harry S Truman College Chicago 2 Pub 2,991 1,204 40.2%City Colleges of Chicago-Malcolm X College Chicago 2 Pub 4,416 2,217 50.2%City Colleges of Chicago- Richard J Daley College Chicago 2 Pub 3,550 2,530 71.3%City Colleges of Chicago- Wilbur Wright College Chicago 2 Pub 4,986 3,119 62.5%
Hispanic-Serving Institutions (HSIs): 2019-20
www.EdExcelencia.org7 of 15
(Illinois - continued)
Institution City Sector Total Hispanic%
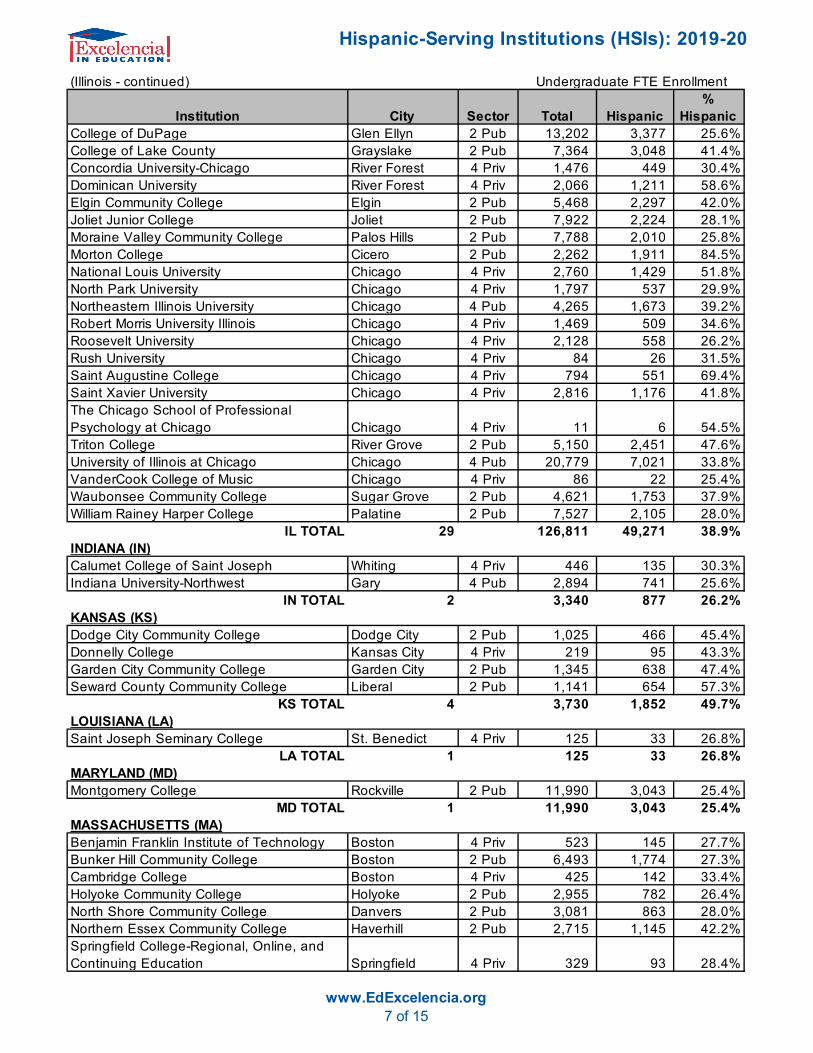
HispanicCollege of DuPage Glen Ellyn 2 Pub 13,202 3,377 25.6%College of Lake County Grayslake 2 Pub 7,364 3,048 41.4%Concordia University-Chicago River Forest 4 Priv 1,476 449 30.4%Dominican University River Forest 4 Priv 2,066 1,211 58.6%Elgin Community College Elgin 2 Pub 5,468 2,297 42.0%Joliet Junior College Joliet 2 Pub 7,922 2,224 28.1%Moraine Valley Community College Palos Hills 2 Pub 7,788 2,010 25.8%Morton College Cicero 2 Pub 2,262 1,911 84.5%National Louis University Chicago 4 Priv 2,760 1,429 51.8%North Park University Chicago 4 Priv 1,797 537 29.9%Northeastern Illinois University Chicago 4 Pub 4,265 1,673 39.2%Robert Morris University Illinois Chicago 4 Priv 1,469 509 34.6%Roosevelt University Chicago 4 Priv 2,128 558 26.2%Rush University Chicago 4 Priv 84 26 31.5%Saint Augustine College Chicago 4 Priv 794 551 69.4%Saint Xavier University Chicago 4 Priv 2,816 1,176 41.8%The Chicago School of Professional Psychology at Chicago Chicago 4 Priv 11 6 54.5%Triton College River Grove 2 Pub 5,150 2,451 47.6%University of Illinois at Chicago Chicago 4 Pub 20,779 7,021 33.8%VanderCook College of Music Chicago 4 Priv 86 22 25.4%Waubonsee Community College Sugar Grove 2 Pub 4,621 1,753 37.9%William Rainey Harper College Palatine 2 Pub 7,527 2,105 28.0%
IL TOTAL 29 126,811 49,271 38.9%INDIANA (IN)Calumet College of Saint Joseph Whiting 4 Priv 446 135 30.3%Indiana University-Northwest Gary 4 Pub 2,894 741 25.6%
IN TOTAL 2 3,340 877 26.2%KANSAS (KS)Dodge City Community College Dodge City 2 Pub 1,025 466 45.4%Donnelly College Kansas City 4 Priv 219 95 43.3%Garden City Community College Garden City 2 Pub 1,345 638 47.4%Seward County Community College Liberal 2 Pub 1,141 654 57.3%
KS TOTAL 4 3,730 1,852 49.7%LOUISIANA (LA)Saint Joseph Seminary College St. Benedict 4 Priv 125 33 26.8%
LA TOTAL 1 125 33 26.8%MARYLAND (MD)Montgomery College Rockville 2 Pub 11,990 3,043 25.4%
MD TOTAL 1 11,990 3,043 25.4%MASSACHUSETTS (MA)Benjamin Franklin Institute of Technology Boston 4 Priv 523 145 27.7%Bunker Hill Community College Boston 2 Pub 6,493 1,774 27.3%Cambridge College Boston 4 Priv 425 142 33.4%Holyoke Community College Holyoke 2 Pub 2,955 782 26.4%North Shore Community College Danvers 2 Pub 3,081 863 28.0%Northern Essex Community College Haverhill 2 Pub 2,715 1,145 42.2%Springfield College-Regional, Online, and Continuing Education Springfield 4 Priv 329 93 28.4%
Undergraduate FTE Enrollment

Hispanic-Serving Institutions (HSIs): 2019-20
www.EdExcelencia.org8 of 15
(Massachusetts - continued)
Institution City Sector Total Hispanic%
HispanicSpringfield Technical Community College Springfield 2 Pub 3,147 946 30.1%Urban College of Boston Boston 2 Priv 329 219 66.7%
MA TOTAL 9 19,997 6,109 30.5%NEVADA (NV)College of Southern Nevada Las Vegas 4 Pub 19,759 6,812 34.5%Nevada State College Henderson 4 Pub 3,426 1,390 40.6%Truckee Meadows Community College Reno 4 Pub 6,395 2,166 33.9%University of Nevada-Las Vegas Las Vegas 4 Pub 22,067 6,748 30.6%
NV TOTAL 4 51,647 17,116 33.1%NEW JERSEY (NJ)Atlantic Cape Community College Mays Landing 2 Pub 3,155 828 26.2%Bergen Community College Paramus 2 Pub 8,882 2,979 33.5%Bloomfield College Bloomfield 4 Priv 1,554 505 32.5%Caldwell University Caldwell 4 Priv 1,648 508 30.8%College of Saint Elizabeth Morristown 4 Priv 709 190 26.8%Cumberland County College Vineland 2 Pub 1,908 688 36.1%Essex County College Newark 2 Pub 4,894 1,329 27.1%Fairleigh Dickinson University- Metropolitan Campus Teaneck 4 Priv 3,779 1,236 32.7%Felician University Lodi 4 Priv 1,723 567 32.9%Hudson County Community College Jersey City 2 Pub 5,748 3,232 56.2%Kean University Union 4 Pub 10,746 3,412 31.7%Middlesex County College Edison 2 Pub 7,154 2,391 33.4%Montclair State University Montclair 4 Pub 15,597 4,670 29.9%New Jersey City University Jersey City 4 Pub 5,453 2,144 39.3%Passaic County Community College Paterson 2 Pub 3,806 2,155 56.6%Pillar College Newark 4 Priv 388 214 55.0%Rutgers University-Newark Newark 4 Pub 8,517 2,434 28.6%Saint Peter's University Jersey City 4 Priv 2,289 1,118 48.9%Union County College Cranford 2 Pub 5,890 2,412 41.0%William Paterson University of New Jersey Wayne 4 Pub 7,746 2,526 32.6%
NJ TOTAL 20 101,586 35,537 35.0%NEW MEXICO (NM)Central New Mexico Community College Albuquerque 2 Pub 11,819 6,426 54.4%Clovis Community College Clovis 2 Pub 1,475 678 46.0%Eastern New Mexico University- Ruidoso Branch Community College Ruidoso 2 Pub 333 112 33.8%Eastern New Mexico University-Main Campus Portales 4 Pub 3,233 1,280 39.6%Eastern New Mexico University-Roswell Campus Roswell 2 Pub 1,389 672 48.4%Luna Community College Las Vegas 2 Pub 561 459 81.9%Mesalands Community College Tucumcari 2 Pub 407 166 40.7%New Mexico Highlands University Las Vegas 4 Pub 1,412 819 58.0%New Mexico Institute of Mining and Technology Socorro 4 Pub 1,237 392 31.7%New Mexico Junior College Hobbs 2 Pub 1,269 628 49.5%New Mexico Military Institute Roswell 2 Pub 487 145 29.8%New Mexico State University-Alamogordo Alamogordo 2 Pub 747 328 43.8%New Mexico State University-Carlsbad Carlsbad 2 Pub 859 483 56.3%
Undergraduate FTE Enrollment
Hispanic-Serving Institutions (HSIs): 2019-20
www.EdExcelencia.org9 of 15
(New Mexico - continued)
Institution City Sector Total Hispanic%
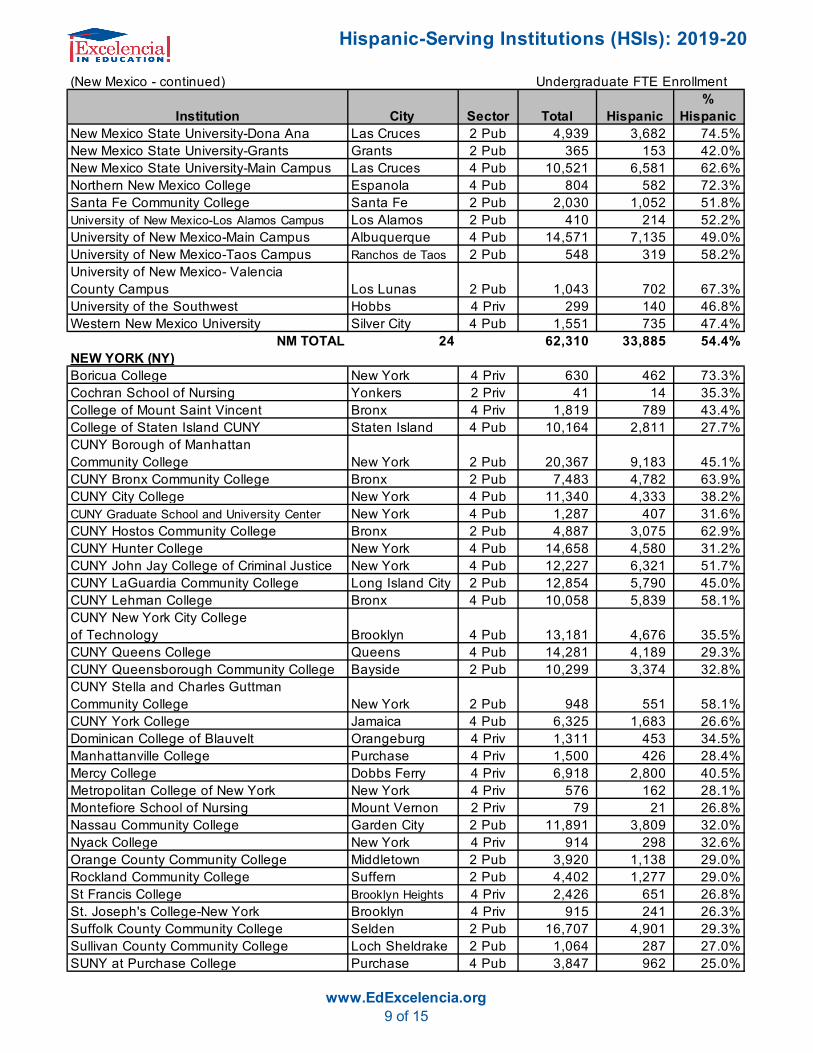
HispanicNew Mexico State University-Dona Ana Las Cruces 2 Pub 4,939 3,682 74.5%New Mexico State University-Grants Grants 2 Pub 365 153 42.0%New Mexico State University-Main Campus Las Cruces 4 Pub 10,521 6,581 62.6%Northern New Mexico College Espanola 4 Pub 804 582 72.3%Santa Fe Community College Santa Fe 2 Pub 2,030 1,052 51.8%University of New Mexico-Los Alamos Campus Los Alamos 2 Pub 410 214 52.2%University of New Mexico-Main Campus Albuquerque 4 Pub 14,571 7,135 49.0%University of New Mexico-Taos Campus Ranchos de Taos 2 Pub 548 319 58.2%University of New Mexico- Valencia County Campus Los Lunas 2 Pub 1,043 702 67.3%University of the Southwest Hobbs 4 Priv 299 140 46.8%Western New Mexico University Silver City 4 Pub 1,551 735 47.4%
NM TOTAL 24 62,310 33,885 54.4%NEW YORK (NY)Boricua College New York 4 Priv 630 462 73.3%Cochran School of Nursing Yonkers 2 Priv 41 14 35.3%College of Mount Saint Vincent Bronx 4 Priv 1,819 789 43.4%College of Staten Island CUNY Staten Island 4 Pub 10,164 2,811 27.7%CUNY Borough of Manhattan Community College New York 2 Pub 20,367 9,183 45.1%CUNY Bronx Community College Bronx 2 Pub 7,483 4,782 63.9%CUNY City College New York 4 Pub 11,340 4,333 38.2%CUNY Graduate School and University Center New York 4 Pub 1,287 407 31.6%CUNY Hostos Community College Bronx 2 Pub 4,887 3,075 62.9%CUNY Hunter College New York 4 Pub 14,658 4,580 31.2%CUNY John Jay College of Criminal Justice New York 4 Pub 12,227 6,321 51.7%CUNY LaGuardia Community College Long Island City 2 Pub 12,854 5,790 45.0%CUNY Lehman College Bronx 4 Pub 10,058 5,839 58.1%CUNY New York City College of Technology Brooklyn 4 Pub 13,181 4,676 35.5%CUNY Queens College Queens 4 Pub 14,281 4,189 29.3%CUNY Queensborough Community College Bayside 2 Pub 10,299 3,374 32.8%CUNY Stella and Charles Guttman Community College New York 2 Pub 948 551 58.1%CUNY York College Jamaica 4 Pub 6,325 1,683 26.6%Dominican College of Blauvelt Orangeburg 4 Priv 1,311 453 34.5%Manhattanville College Purchase 4 Priv 1,500 426 28.4%Mercy College Dobbs Ferry 4 Priv 6,918 2,800 40.5%Metropolitan College of New York New York 4 Priv 576 162 28.1%Montefiore School of Nursing Mount Vernon 2 Priv 79 21 26.8%Nassau Community College Garden City 2 Pub 11,891 3,809 32.0%Nyack College New York 4 Priv 914 298 32.6%Orange County Community College Middletown 2 Pub 3,920 1,138 29.0%Rockland Community College Suffern 2 Pub 4,402 1,277 29.0%St Francis College Brooklyn Heights 4 Priv 2,426 651 26.8%St. Joseph's College-New York Brooklyn 4 Priv 915 241 26.3%Suffolk County Community College Selden 2 Pub 16,707 4,901 29.3%Sullivan County Community College Loch Sheldrake 2 Pub 1,064 287 27.0%SUNY at Purchase College Purchase 4 Pub 3,847 962 25.0%
Undergraduate FTE Enrollment
Hispanic-Serving Institutions (HSIs): 2019-20
www.EdExcelencia.org10 of 15
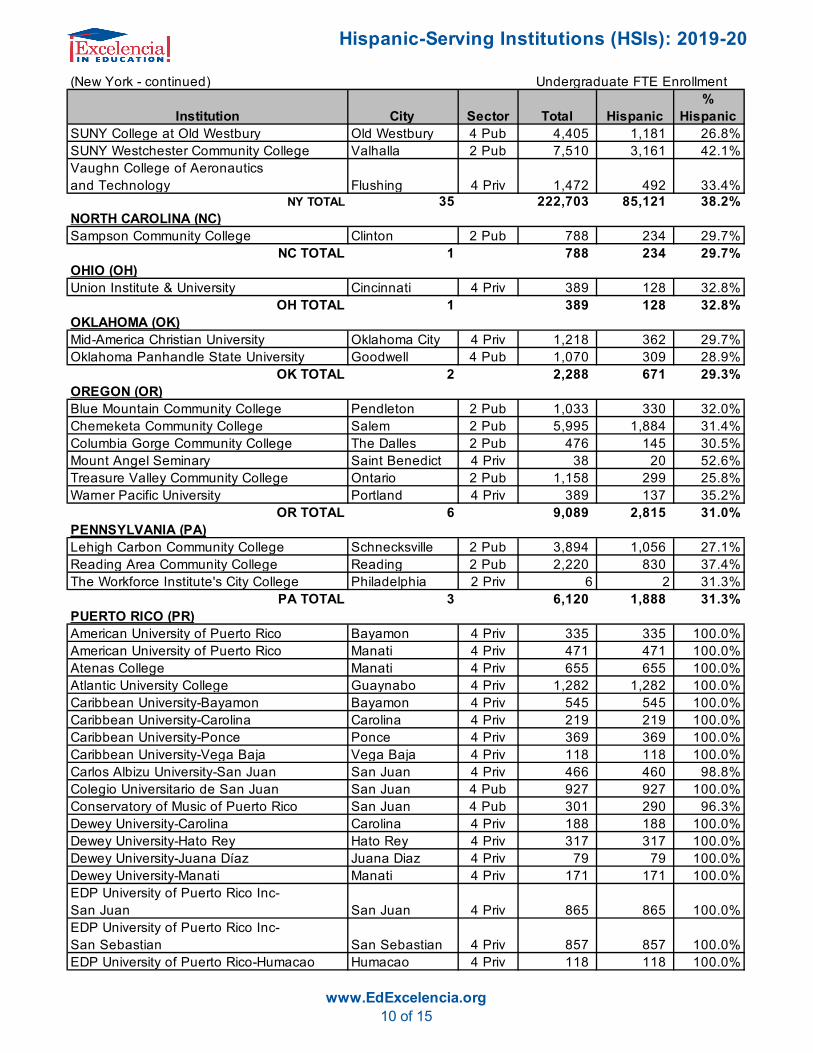
(New York - continued)
Institution City Sector Total Hispanic%
HispanicSUNY College at Old Westbury Old Westbury 4 Pub 4,405 1,181 26.8%SUNY Westchester Community College Valhalla 2 Pub 7,510 3,161 42.1%Vaughn College of Aeronautics and Technology Flushing 4 Priv 1,472 492 33.4%
NY TOTAL 35 222,703 85,121 38.2%NORTH CAROLINA (NC)Sampson Community College Clinton 2 Pub 788 234 29.7%
NC TOTAL 1 788 234 29.7%OHIO (OH)Union Institute & University Cincinnati 4 Priv 389 128 32.8%
OH TOTAL 1 389 128 32.8%OKLAHOMA (OK)Mid-America Christian University Oklahoma City 4 Priv 1,218 362 29.7%Oklahoma Panhandle State University Goodwell 4 Pub 1,070 309 28.9%
OK TOTAL 2 2,288 671 29.3%OREGON (OR)Blue Mountain Community College Pendleton 2 Pub 1,033 330 32.0%Chemeketa Community College Salem 2 Pub 5,995 1,884 31.4%Columbia Gorge Community College The Dalles 2 Pub 476 145 30.5%Mount Angel Seminary Saint Benedict 4 Priv 38 20 52.6%Treasure Valley Community College Ontario 2 Pub 1,158 299 25.8%Warner Pacific University Portland 4 Priv 389 137 35.2%
OR TOTAL 6 9,089 2,815 31.0%PENNSYLVANIA (PA)Lehigh Carbon Community College Schnecksville 2 Pub 3,894 1,056 27.1%Reading Area Community College Reading 2 Pub 2,220 830 37.4%The Workforce Institute's City College Philadelphia 2 Priv 6 2 31.3%
PA TOTAL 3 6,120 1,888 31.3%PUERTO RICO (PR)American University of Puerto Rico Bayamon 4 Priv 335 335 100.0%American University of Puerto Rico Manati 4 Priv 471 471 100.0%Atenas College Manati 4 Priv 655 655 100.0%Atlantic University College Guaynabo 4 Priv 1,282 1,282 100.0%Caribbean University-Bayamon Bayamon 4 Priv 545 545 100.0%Caribbean University-Carolina Carolina 4 Priv 219 219 100.0%Caribbean University-Ponce Ponce 4 Priv 369 369 100.0%Caribbean University-Vega Baja Vega Baja 4 Priv 118 118 100.0%Carlos Albizu University-San Juan San Juan 4 Priv 466 460 98.8%Colegio Universitario de San Juan San Juan 4 Pub 927 927 100.0%Conservatory of Music of Puerto Rico San Juan 4 Pub 301 290 96.3%Dewey University-Carolina Carolina 4 Priv 188 188 100.0%Dewey University-Hato Rey Hato Rey 4 Priv 317 317 100.0%Dewey University-Juana Díaz Juana Diaz 4 Priv 79 79 100.0%Dewey University-Manati Manati 4 Priv 171 171 100.0%EDP University of Puerto Rico Inc-San Juan San Juan 4 Priv 865 865 100.0%EDP University of Puerto Rico Inc-San Sebastian San Sebastian 4 Priv 857 857 100.0%EDP University of Puerto Rico-Humacao Humacao 4 Priv 118 118 100.0%
Undergraduate FTE Enrollment
Hispanic-Serving Institutions (HSIs): 2019-20
www.EdExcelencia.org11 of 15
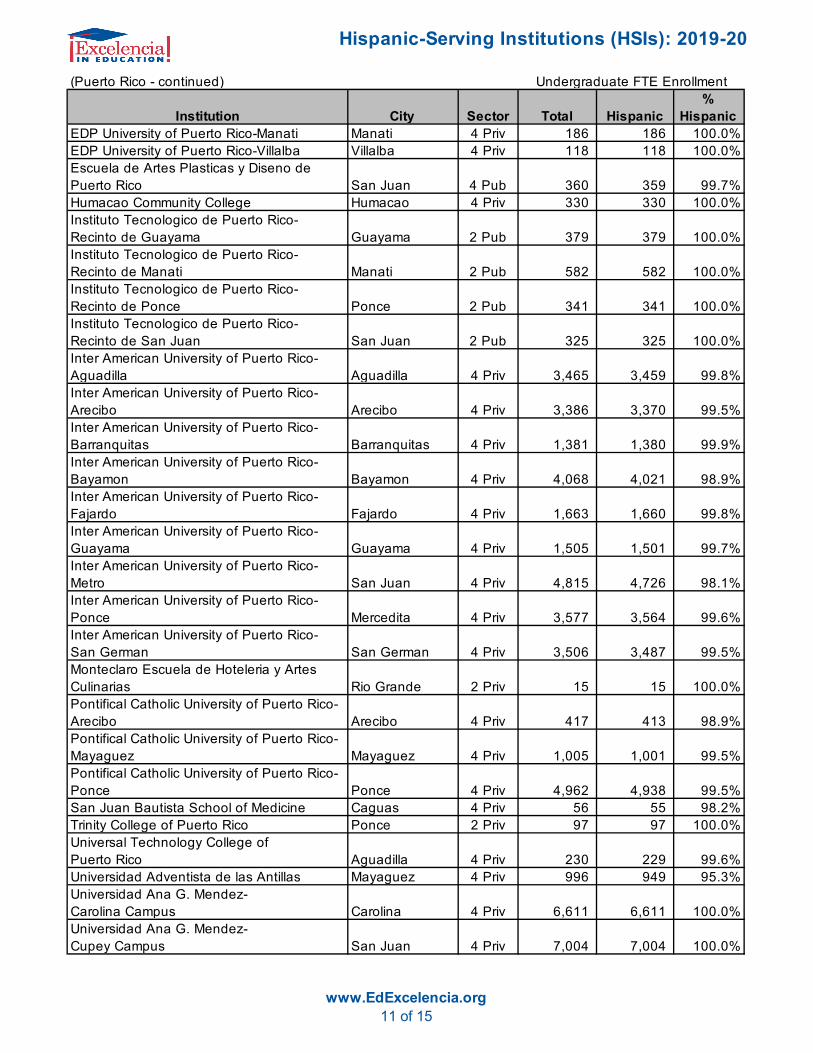
(Puerto Rico - continued)
Institution City Sector Total Hispanic%
HispanicEDP University of Puerto Rico-Manati Manati 4 Priv 186 186 100.0%EDP University of Puerto Rico-Villalba Villalba 4 Priv 118 118 100.0%Escuela de Artes Plasticas y Diseno de Puerto Rico San Juan 4 Pub 360 359 99.7%Humacao Community College Humacao 4 Priv 330 330 100.0%Instituto Tecnologico de Puerto Rico- Recinto de Guayama Guayama 2 Pub 379 379 100.0%Instituto Tecnologico de Puerto Rico- Recinto de Manati Manati 2 Pub 582 582 100.0%Instituto Tecnologico de Puerto Rico- Recinto de Ponce Ponce 2 Pub 341 341 100.0%Instituto Tecnologico de Puerto Rico- Recinto de San Juan San Juan 2 Pub 325 325 100.0%Inter American University of Puerto Rico- Aguadilla Aguadilla 4 Priv 3,465 3,459 99.8%Inter American University of Puerto Rico- Arecibo Arecibo 4 Priv 3,386 3,370 99.5%Inter American University of Puerto Rico- Barranquitas Barranquitas 4 Priv 1,381 1,380 99.9%Inter American University of Puerto Rico- Bayamon Bayamon 4 Priv 4,068 4,021 98.9%Inter American University of Puerto Rico- Fajardo Fajardo 4 Priv 1,663 1,660 99.8%Inter American University of Puerto Rico- Guayama Guayama 4 Priv 1,505 1,501 99.7%Inter American University of Puerto Rico- Metro San Juan 4 Priv 4,815 4,726 98.1%Inter American University of Puerto Rico- Ponce Mercedita 4 Priv 3,577 3,564 99.6%Inter American University of Puerto Rico- San German San German 4 Priv 3,506 3,487 99.5%Monteclaro Escuela de Hoteleria y Artes Culinarias Rio Grande 2 Priv 15 15 100.0%Pontifical Catholic University of Puerto Rico- Arecibo Arecibo 4 Priv 417 413 98.9%Pontifical Catholic University of Puerto Rico- Mayaguez Mayaguez 4 Priv 1,005 1,001 99.5%Pontifical Catholic University of Puerto Rico- Ponce Ponce 4 Priv 4,962 4,938 99.5%San Juan Bautista School of Medicine Caguas 4 Priv 56 55 98.2%Trinity College of Puerto Rico Ponce 2 Priv 97 97 100.0%Universal Technology College of Puerto Rico Aguadilla 4 Priv 230 229 99.6%Universidad Adventista de las Antillas Mayaguez 4 Priv 996 949 95.3%Universidad Ana G. Mendez-Carolina Campus Carolina 4 Priv 6,611 6,611 100.0%Universidad Ana G. Mendez-Cupey Campus San Juan 4 Priv 7,004 7,004 100.0%
Undergraduate FTE Enrollment
Hispanic-Serving Institutions (HSIs): 2019-20
www.EdExcelencia.org12 of 15
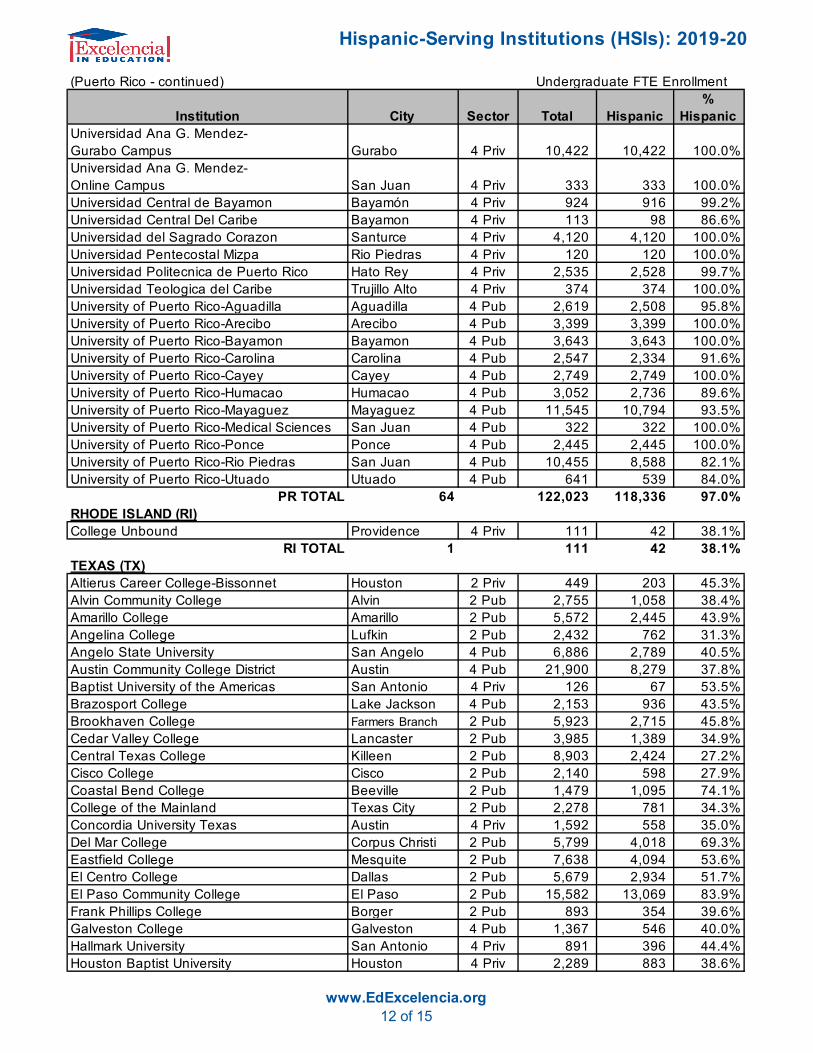
(Puerto Rico - continued)
Institution City Sector Total Hispanic%
HispanicUniversidad Ana G. Mendez-Gurabo Campus Gurabo 4 Priv 10,422 10,422 100.0%Universidad Ana G. Mendez-Online Campus San Juan 4 Priv 333 333 100.0%Universidad Central de Bayamon Bayamón 4 Priv 924 916 99.2%Universidad Central Del Caribe Bayamon 4 Priv 113 98 86.6%Universidad del Sagrado Corazon Santurce 4 Priv 4,120 4,120 100.0%Universidad Pentecostal Mizpa Rio Piedras 4 Priv 120 120 100.0%Universidad Politecnica de Puerto Rico Hato Rey 4 Priv 2,535 2,528 99.7%Universidad Teologica del Caribe Trujillo Alto 4 Priv 374 374 100.0%University of Puerto Rico-Aguadilla Aguadilla 4 Pub 2,619 2,508 95.8%University of Puerto Rico-Arecibo Arecibo 4 Pub 3,399 3,399 100.0%University of Puerto Rico-Bayamon Bayamon 4 Pub 3,643 3,643 100.0%University of Puerto Rico-Carolina Carolina 4 Pub 2,547 2,334 91.6%University of Puerto Rico-Cayey Cayey 4 Pub 2,749 2,749 100.0%University of Puerto Rico-Humacao Humacao 4 Pub 3,052 2,736 89.6%University of Puerto Rico-Mayaguez Mayaguez 4 Pub 11,545 10,794 93.5%University of Puerto Rico-Medical Sciences San Juan 4 Pub 322 322 100.0%University of Puerto Rico-Ponce Ponce 4 Pub 2,445 2,445 100.0%University of Puerto Rico-Rio Piedras San Juan 4 Pub 10,455 8,588 82.1%University of Puerto Rico-Utuado Utuado 4 Pub 641 539 84.0%
PR TOTAL 64 122,023 118,336 97.0%RHODE ISLAND (RI)College Unbound Providence 4 Priv 111 42 38.1%
RI TOTAL 1 111 42 38.1%TEXAS (TX)Altierus Career College-Bissonnet Houston 2 Priv 449 203 45.3%Alvin Community College Alvin 2 Pub 2,755 1,058 38.4%Amarillo College Amarillo 2 Pub 5,572 2,445 43.9%Angelina College Lufkin 2 Pub 2,432 762 31.3%Angelo State University San Angelo 4 Pub 6,886 2,789 40.5%Austin Community College District Austin 4 Pub 21,900 8,279 37.8%Baptist University of the Americas San Antonio 4 Priv 126 67 53.5%Brazosport College Lake Jackson 4 Pub 2,153 936 43.5%Brookhaven College Farmers Branch 2 Pub 5,923 2,715 45.8%Cedar Valley College Lancaster 2 Pub 3,985 1,389 34.9%Central Texas College Killeen 2 Pub 8,903 2,424 27.2%Cisco College Cisco 2 Pub 2,140 598 27.9%Coastal Bend College Beeville 2 Pub 1,479 1,095 74.1%College of the Mainland Texas City 2 Pub 2,278 781 34.3%Concordia University Texas Austin 4 Priv 1,592 558 35.0%Del Mar College Corpus Christi 2 Pub 5,799 4,018 69.3%Eastfield College Mesquite 2 Pub 7,638 4,094 53.6%El Centro College Dallas 2 Pub 5,679 2,934 51.7%El Paso Community College El Paso 2 Pub 15,582 13,069 83.9%Frank Phillips College Borger 2 Pub 893 354 39.6%Galveston College Galveston 4 Pub 1,367 546 40.0%Hallmark University San Antonio 4 Priv 891 396 44.4%Houston Baptist University Houston 4 Priv 2,289 883 38.6%
Undergraduate FTE Enrollment
Hispanic-Serving Institutions (HSIs): 2019-20
www.EdExcelencia.org13 of 15
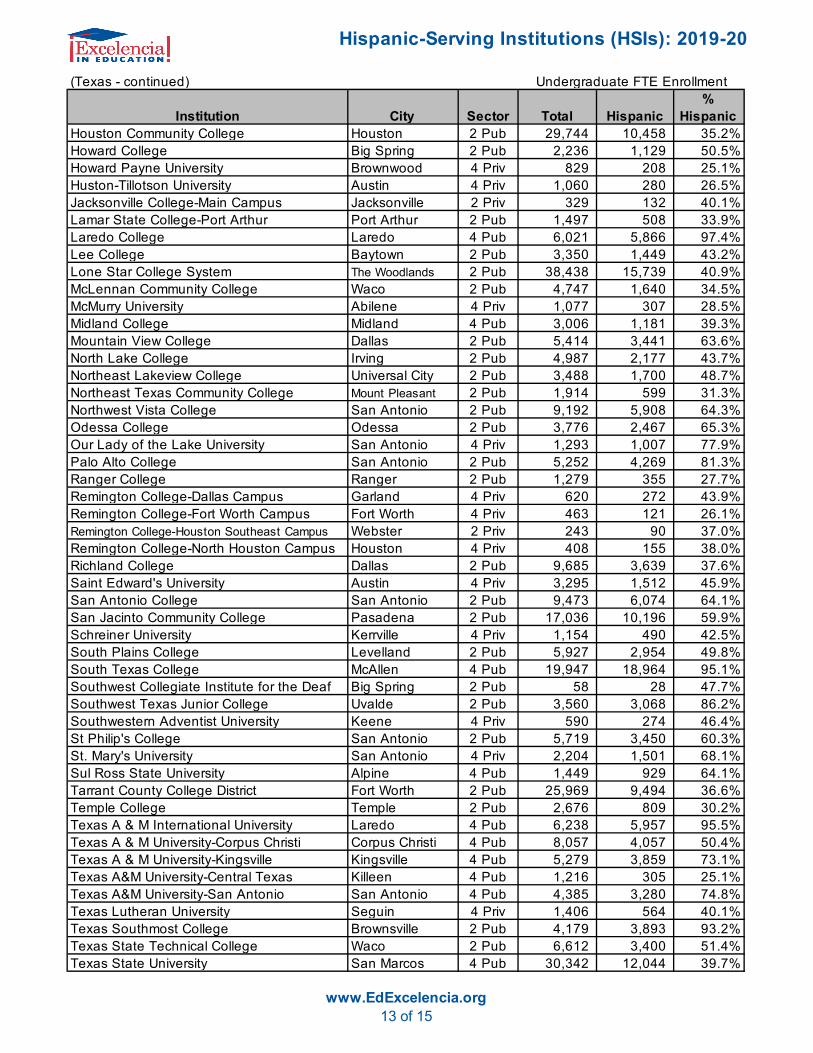
(Texas - continued)
Institution City Sector Total Hispanic%
HispanicHouston Community College Houston 2 Pub 29,744 10,458 35.2%Howard College Big Spring 2 Pub 2,236 1,129 50.5%Howard Payne University Brownwood 4 Priv 829 208 25.1%Huston-Tillotson University Austin 4 Priv 1,060 280 26.5%Jacksonville College-Main Campus Jacksonville 2 Priv 329 132 40.1%Lamar State College-Port Arthur Port Arthur 2 Pub 1,497 508 33.9%Laredo College Laredo 4 Pub 6,021 5,866 97.4%Lee College Baytown 2 Pub 3,350 1,449 43.2%Lone Star College System The Woodlands 2 Pub 38,438 15,739 40.9%McLennan Community College Waco 2 Pub 4,747 1,640 34.5%McMurry University Abilene 4 Priv 1,077 307 28.5%Midland College Midland 4 Pub 3,006 1,181 39.3%Mountain View College Dallas 2 Pub 5,414 3,441 63.6%North Lake College Irving 2 Pub 4,987 2,177 43.7%Northeast Lakeview College Universal City 2 Pub 3,488 1,700 48.7%Northeast Texas Community College Mount Pleasant 2 Pub 1,914 599 31.3%Northwest Vista College San Antonio 2 Pub 9,192 5,908 64.3%Odessa College Odessa 2 Pub 3,776 2,467 65.3%Our Lady of the Lake University San Antonio 4 Priv 1,293 1,007 77.9%Palo Alto College San Antonio 2 Pub 5,252 4,269 81.3%Ranger College Ranger 2 Pub 1,279 355 27.7%Remington College-Dallas Campus Garland 4 Priv 620 272 43.9%Remington College-Fort Worth Campus Fort Worth 4 Priv 463 121 26.1%Remington College-Houston Southeast Campus Webster 2 Priv 243 90 37.0%Remington College-North Houston Campus Houston 4 Priv 408 155 38.0%Richland College Dallas 2 Pub 9,685 3,639 37.6%Saint Edward's University Austin 4 Priv 3,295 1,512 45.9%San Antonio College San Antonio 2 Pub 9,473 6,074 64.1%San Jacinto Community College Pasadena 2 Pub 17,036 10,196 59.9%Schreiner University Kerrville 4 Priv 1,154 490 42.5%South Plains College Levelland 2 Pub 5,927 2,954 49.8%South Texas College McAllen 4 Pub 19,947 18,964 95.1%Southwest Collegiate Institute for the Deaf Big Spring 2 Pub 58 28 47.7%Southwest Texas Junior College Uvalde 2 Pub 3,560 3,068 86.2%Southwestern Adventist University Keene 4 Priv 590 274 46.4%St Philip's College San Antonio 2 Pub 5,719 3,450 60.3%St. Mary's University San Antonio 4 Priv 2,204 1,501 68.1%Sul Ross State University Alpine 4 Pub 1,449 929 64.1%Tarrant County College District Fort Worth 2 Pub 25,969 9,494 36.6%Temple College Temple 2 Pub 2,676 809 30.2%Texas A & M International University Laredo 4 Pub 6,238 5,957 95.5%Texas A & M University-Corpus Christi Corpus Christi 4 Pub 8,057 4,057 50.4%Texas A & M University-Kingsville Kingsville 4 Pub 5,279 3,859 73.1%Texas A&M University-Central Texas Killeen 4 Pub 1,216 305 25.1%Texas A&M University-San Antonio San Antonio 4 Pub 4,385 3,280 74.8%Texas Lutheran University Seguin 4 Priv 1,406 564 40.1%Texas Southmost College Brownsville 2 Pub 4,179 3,893 93.2%Texas State Technical College Waco 2 Pub 6,612 3,400 51.4%Texas State University San Marcos 4 Pub 30,342 12,044 39.7%
Undergraduate FTE Enrollment
Hispanic-Serving Institutions (HSIs): 2019-20
www.EdExcelencia.org14 of 15
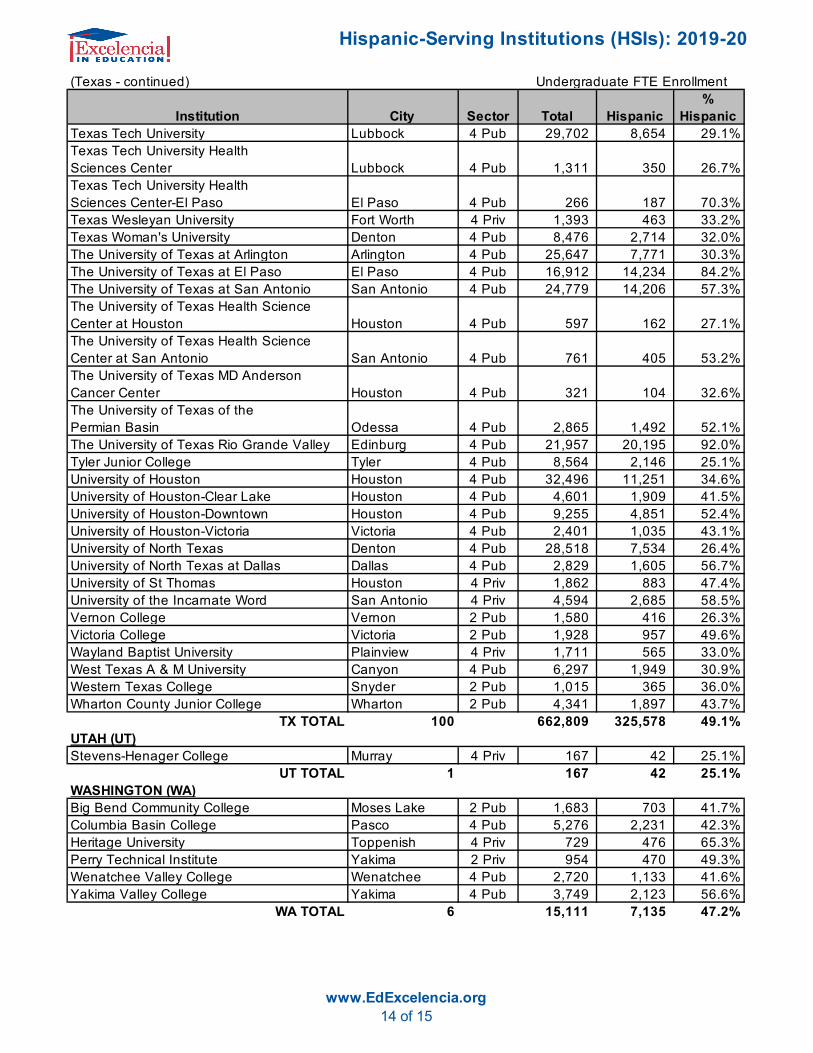
(Texas - continued)
Institution City Sector Total Hispanic%
HispanicTexas Tech University Lubbock 4 Pub 29,702 8,654 29.1%Texas Tech University Health Sciences Center Lubbock 4 Pub 1,311 350 26.7%Texas Tech University Health Sciences Center-El Paso El Paso 4 Pub 266 187 70.3%Texas Wesleyan University Fort Worth 4 Priv 1,393 463 33.2%Texas Woman's University Denton 4 Pub 8,476 2,714 32.0%The University of Texas at Arlington Arlington 4 Pub 25,647 7,771 30.3%The University of Texas at El Paso El Paso 4 Pub 16,912 14,234 84.2%The University of Texas at San Antonio San Antonio 4 Pub 24,779 14,206 57.3%The University of Texas Health Science Center at Houston Houston 4 Pub 597 162 27.1%The University of Texas Health Science Center at San Antonio San Antonio 4 Pub 761 405 53.2%The University of Texas MD Anderson Cancer Center Houston 4 Pub 321 104 32.6%The University of Texas of the Permian Basin Odessa 4 Pub 2,865 1,492 52.1%The University of Texas Rio Grande Valley Edinburg 4 Pub 21,957 20,195 92.0%Tyler Junior College Tyler 4 Pub 8,564 2,146 25.1%University of Houston Houston 4 Pub 32,496 11,251 34.6%University of Houston-Clear Lake Houston 4 Pub 4,601 1,909 41.5%University of Houston-Downtown Houston 4 Pub 9,255 4,851 52.4%University of Houston-Victoria Victoria 4 Pub 2,401 1,035 43.1%University of North Texas Denton 4 Pub 28,518 7,534 26.4%University of North Texas at Dallas Dallas 4 Pub 2,829 1,605 56.7%University of St Thomas Houston 4 Priv 1,862 883 47.4%University of the Incarnate Word San Antonio 4 Priv 4,594 2,685 58.5%Vernon College Vernon 2 Pub 1,580 416 26.3%Victoria College Victoria 2 Pub 1,928 957 49.6%Wayland Baptist University Plainview 4 Priv 1,711 565 33.0%West Texas A & M University Canyon 4 Pub 6,297 1,949 30.9%Western Texas College Snyder 2 Pub 1,015 365 36.0%Wharton County Junior College Wharton 2 Pub 4,341 1,897 43.7%
TX TOTAL 100 662,809 325,578 49.1%UTAH (UT)Stevens-Henager College Murray 4 Priv 167 42 25.1%
UT TOTAL 1 167 42 25.1%WASHINGTON (WA)Big Bend Community College Moses Lake 2 Pub 1,683 703 41.7%Columbia Basin College Pasco 4 Pub 5,276 2,231 42.3%Heritage University Toppenish 4 Priv 729 476 65.3%Perry Technical Institute Yakima 2 Priv 954 470 49.3%Wenatchee Valley College Wenatchee 4 Pub 2,720 1,133 41.6%Yakima Valley College Yakima 4 Pub 3,749 2,123 56.6%
WA TOTAL 6 15,111 7,135 47.2%
Undergraduate FTE Enrollment

Hispanic-Serving Institutions (HSIs): 2019-20
www.EdExcelencia.org15 of 15
Institution City Sector Total Hispanic%
HispanicWISCONSIN (WI)Alverno College Milwaukee 4 Priv 985 330 33.5%Mount Mary University Milwaukee 4 Priv 614 167 27.3%
WI TOTAL 2 1,599 497 31.1%
Source: Excelencia in Education analysis using U.S. Department of Education, NCES, IPEDS, 2019-20 fall institutional characteristics and enrollment surveys
For more information on HSIs, please visit: http://www.edexcelencia.org.
Undergraduate FTE Enrollment