CGA Services and Harvard Map Collection Resources February 16, 2007.

© Rosana Hernández. Francisco Moreno-Fernández (dir.)
Hispanic Map of the United States 2018
Informes del Observatorio / Observatorio Reports. 044-10/2018EN
ISSN: 2373-874X (online) doi: 10.15427/OR044-10/2018EN
Cervantes Institute at FAS - Harvard University © Cervantes Institute at the Faculty of Arts and Sciences of Harvard University
1
ISSN 2373–874X (online) 044-10/2018EN
Hispanic Map of the United
States 2018
Rosana Hernández
Francisco Moreno-Fernández (dir.)
Topic: Spanish and Hispanics in the United States
Abstract: Analysis of the Spanish language and the Hispanic population in the United
States, based on demographic, educational, economic, social, political, and media
indicators: October 2018.
Keywords: Hispanics, Latinos, Spanish, education, economics, politics, media, identity

© Rosana Hernández. Francisco Moreno-Fernández (dir.)
Hispanic Map of the United States 2018
Informes del Observatorio / Observatorio Reports. 044-10/2018EN
ISSN: 2373-874X (online) doi: 10.15427/OR044-10/2018EN
Cervantes Institute at FAS - Harvard University © Cervantes Institute at the Faculty of Arts and Sciences of Harvard University
2
Index
Introduction .................................................................................................................. 3
1. Demographics .......................................................................................................... 5
2. Language Proficiency and Use ............................................................................. 11
2.1. Spanish Speakers.......................................................................................... 12
2.2. Spanish Education in the U.S. ...................................................................... 16
3. Educational Landscape ........................................................................................ 20
3.1. Primary and Secondary Education ............................................................... 20
3.2. University Education ...................................................................................... 22
3.3. Average Education Level ............................................................................... 24
4. Economic and Socioeconomic Trends ................................................................ 26
4.1. Income and Poverty ....................................................................................... 27
4.2. Homeownership and Health Insurance ....................................................... 30
4.3. Cell Phones and Internet Access .................................................................. 31
5. Politics ................................................................................................................... 33
5.1. Voter Registration and Turnout .................................................................... 33
5.2. Latino Representatives ................................................................................. 37
5.3. Spanish in U.S. Politics.................................................................................. 40
6. Media, Film, and Social Networks ....................................................................... 42
6.1. Television ....................................................................................................... 43
6.2. Radio .............................................................................................................. 45
6.3. Press and Online Media ................................................................................ 45
6.4. Online Platforms ............................................................................................ 46
6.5. Film ................................................................................................................. 47
6.7. Social Media .................................................................................................. 49
Conclusions ............................................................................................................... 50
References................................................................................................................. 54

© Rosana Hernández. Francisco Moreno-Fernández (dir.)
Hispanic Map of the United States 2018
Informes del Observatorio / Observatorio Reports. 044-10/2018EN
ISSN: 2373-874X (online) doi: 10.15427/OR044-10/2018EN
Cervantes Institute at FAS - Harvard University © Cervantes Institute at the Faculty of Arts and Sciences of Harvard University
3
Introduction
On September 17, 1968, President Lyndon B. Johnson signed a law that declared
the week of September 15 National Hispanic Heritage Week. Twenty years later,
on August 17, 1988, Ronald W. Reagan transformed that week into National
Hispanic Heritage Month by signing a bill submitted by Esteban Torres, a
Democratic representative from California. Torres stated that the legislation’s
supporters “want the American people to learn of our heritage. We want the public
to know that we share a legacy with the rest of the country, a legacy that includes
artists, writers, Olympic champions, and leaders in business, government, cinema,
and science.”1
Two years after the first official celebration of Hispanic heritage, the U.S. Census
Bureau began including a question about Hispanic background on its survey, which
made it possible to begin generating statistics about the country’s Latino
population.2 “Are you Hispanic, Latino, or of Spanish origin?” Although the answer
makes it possible to distinguish between Mexican, Mexican-American, Chicano,
Puerto Rican, Cuban, and other Hispanic or Latino backgrounds (Argentinian,
Colombian, Dominican, Nicaraguan, Salvadoran, Spanish, among others), there is
no doubt that the terms “Hispanic” and “Latino” simplify far more complex
historical, cultural, and even linguistic realities.
The terms also gloss over dissimilar characteristics and situations in the U.S.
Latinos of Argentinian origin have an average annual household income of
$60,640 and a poverty rate of 11%; 39% have a bachelor’s degree or higher, 76%
are proficient in English, 58% own their own home, and 13% do not have health
insurance. At the opposite end of the spectrum, Latinos of Honduran origin have
an average income of $36,800 and a poverty rate of 27%; only 11% have a
1 See https://bit.ly/2PaypKp 2 The 1930 census included the category “Mexican” when asking about race and ethnicity. See:
https://bit.ly/2PbKYoJ and https://bit.ly/2LcY2YO

© Rosana Hernández. Francisco Moreno-Fernández (dir.)
Hispanic Map of the United States 2018
Informes del Observatorio / Observatorio Reports. 044-10/2018EN
ISSN: 2373-874X (online) doi: 10.15427/OR044-10/2018EN
Cervantes Institute at FAS - Harvard University © Cervantes Institute at the Faculty of Arts and Sciences of Harvard University
4
bachelor’s degree or higher, and only 28% own their own home; 46% are proficient
in English, and 37% do not have health insurance (Flores 2017).
Despite these simplifications, the data generated from the 1970 census makes it
possible to trace the evolution of the Hispanic population in the country, its current
situation, the ways in which that situation has improved, and the areas in which
Latinos still fall short of the U.S. average.
That is the goal of this report, the fourth edition of the “Hispanic Map of the United
States,” an annual project that the Observatory of the Cervantes Institute at
Harvard University began publishing in 2015. This annual report presents a general
overview of the Hispanic and Spanish-speaking population in the U.S. This year, on
the 50th anniversary of the declaration of Hispanic Heritage Week, it seeks to
compare the Latino reality of five decades ago with that reality today. To achieve
this, it examines the chief demographic, linguistic, educational, socioeconomic,
and political indicators, organized thematically into six sections.
The first section considers Hispanic demographics in the U.S., with data on their
origins, physical distribution throughout the country, and development, as well as
the latest published projections. The second focuses on the Spanish language,
regarding both proficiency among Hispanics and the teaching of Spanish at the
various educational levels. The third looks at the evolution of Latinos’ educational
performance and the fourth analyzes their socioeconomic status based on
indicators of income, poverty, health coverage, home ownership, and internet
access.
The fifth section examines the Hispanic presence in U.S. politics, with data on
electoral participation, political demands, and Hispanic representatives, as well as
a special focus on the midterm elections that will take place on November 6th of
this year. Finally, the sixth section consists of information on use of media and film
© Rosana Hernández. Francisco Moreno-Fernández (dir.)
Hispanic Map of the United States 2018
Informes del Observatorio / Observatorio Reports. 044-10/2018EN
ISSN: 2373-874X (online) doi: 10.15427/OR044-10/2018EN
Cervantes Institute at FAS - Harvard University © Cervantes Institute at the Faculty of Arts and Sciences of Harvard University
5
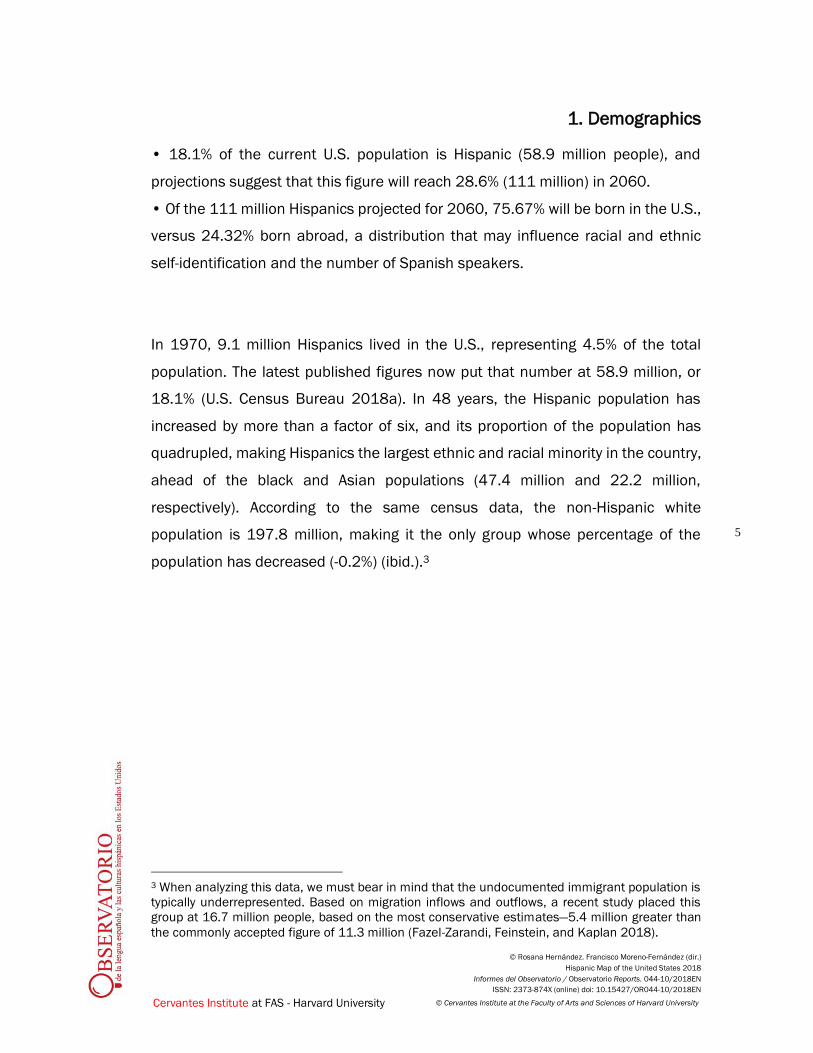
1. Demographics
• 18.1% of the current U.S. population is Hispanic (58.9 million people), and
projections suggest that this figure will reach 28.6% (111 million) in 2060.
• Of the 111 million Hispanics projected for 2060, 75.67% will be born in the U.S.,
versus 24.32% born abroad, a distribution that may influence racial and ethnic
self-identification and the number of Spanish speakers.
In 1970, 9.1 million Hispanics lived in the U.S., representing 4.5% of the total
population. The latest published figures now put that number at 58.9 million, or
18.1% (U.S. Census Bureau 2018a). In 48 years, the Hispanic population has
increased by more than a factor of six, and its proportion of the population has
quadrupled, making Hispanics the largest ethnic and racial minority in the country,
ahead of the black and Asian populations (47.4 million and 22.2 million,
respectively). According to the same census data, the non-Hispanic white
population is 197.8 million, making it the only group whose percentage of the
population has decreased (-0.2%) (ibid.).3
3 When analyzing this data, we must bear in mind that the undocumented immigrant population is
typically underrepresented. Based on migration inflows and outflows, a recent study placed this
group at 16.7 million people, based on the most conservative estimates—5.4 million greater than
the commonly accepted figure of 11.3 million (Fazel-Zarandi, Feinstein, and Kaplan 2018).

© Rosana Hernández. Francisco Moreno-Fernández (dir.)
Hispanic Map of the United States 2018
Informes del Observatorio / Observatorio Reports. 044-10/2018EN
ISSN: 2373-874X (online) doi: 10.15427/OR044-10/2018EN
Cervantes Institute at FAS - Harvard University © Cervantes Institute at the Faculty of Arts and Sciences of Harvard University
6
Figure 1. U.S. Hispanic population, in millions. Source: U.S. Census Bureau (n.d.; 2018a);
Ennis, Ríos-Vargas, and Albert (2011).
Despite the Hispanic population’s historic presence in what is today U.S. territory,
especially in the southwest, this major population growth is driven, at least since
the second half of the 20th century, by the increase in immigration from Latin
America following the passage of the Immigration and Nationality Act of 1965 (the
Hart-Celler Act), which eliminated country-based migration quotas that had been
imposed by an earlier law (Moreno-Fernández 2016). According to Pew Research
estimates, without considering immigration, the number of Hispanics in the U.S. in
2015 would have been around 20 million (Lopez, Passel, and Rohal 2015), when
in reality it exceeded 56 million. As shown in figure 2, of the immigrant population
in the U.S. in the 1960s, over seven million came from Europe, followed by Canada4
with fewer than one million, and Latin America with around 900,000 (Migration
Policy Institute n.d.). It was in the 1980s that Latin America beat out the other
regions and became the chief source of immigrants to the U.S.
4 Since the 1980s, “Northern America” has included not only Canada, but also Bermuda and other
unclassified territories.
9.1
14.6
22.4
35.3
50.5
58.9
0
10
20
30
40
50
60
70
1970 1980 1990 2000 2010 2017

© Rosana Hernández. Francisco Moreno-Fernández (dir.)
Hispanic Map of the United States 2018
Informes del Observatorio / Observatorio Reports. 044-10/2018EN
ISSN: 2373-874X (online) doi: 10.15427/OR044-10/2018EN
Cervantes Institute at FAS - Harvard University © Cervantes Institute at the Faculty of Arts and Sciences of Harvard University
7
Figure 2. Immigrant population in the U.S. by region of origin, in millions, 1960-2016.
Source: Migration Policy Institute (n.d.).
Since then, the Hispanic population has undergone notable changes not only in its
size but also in its distribution in the country and composition. In terms of volume,
the growth rate following the demographic boom of the 1980s has been gradually
slowing: although the current decade is not yet over, it is possible to anticipate that
population growth will be far lower than that of the previous decade: between 2010
and 2017, the Hispanic population increased 16.6%, versus 43.1% between 2000
and 2010. In this sense, the Asian population has been growing at a faster rate
than the Hispanic population since 2010 (Krogstad 2017), at 3.1% versus 2.1% in
2017 (U.S. Census Bureau 2018a).
The distribution of the Hispanic population in the country has also changed in
recent decades; although the greatest concentration remains in the southwest
states, it has gradually expanded to the northeast, and to the major urban hubs of
the east coast. The following maps compare the Latino presence of 1970 with that
of today.
0
5,000,000
10,000,000
15,000,000
20,000,000
25,000,000
30,000,000
35,000,000
40,000,000
45,000,000
50,000,000
1960 1970 1980 1990 2000 2010 2016
Europe Asia Africa Oceania Latin America Northern America Total

© Rosana Hernández. Francisco Moreno-Fernández (dir.)
Hispanic Map of the United States 2018
Informes del Observatorio / Observatorio Reports. 044-10/2018EN
ISSN: 2373-874X (online) doi: 10.15427/OR044-10/2018EN
Cervantes Institute at FAS - Harvard University © Cervantes Institute at the Faculty of Arts and Sciences of Harvard University
8
Figure 3. Distribution of U.S. Hispanic population by county, based on the 1970 census
and the 2016 ACS.5 Source: Social Explorer.
According to the latest figures from the ACS (U.S. Census Bureau/American
FactFinder 2018: PEPASR6H), the states with the largest total number of Hispanics
5 The terms and definitions used by the census and the ACS (“Spanish Origin or Descent” in 1970
and “Hispanic or Latino” in 2016) reveal differences in the questions that make a strict comparison
impossible, though we are still able to reflect on the population’s general progression. Alaska and
Hawaii are not represented at the same scale as the rest of the territory.

© Rosana Hernández. Francisco Moreno-Fernández (dir.)
Hispanic Map of the United States 2018
Informes del Observatorio / Observatorio Reports. 044-10/2018EN
ISSN: 2373-874X (online) doi: 10.15427/OR044-10/2018EN
Cervantes Institute at FAS - Harvard University © Cervantes Institute at the Faculty of Arts and Sciences of Harvard University
9
are California (15.48 million), Texas (11.16 million), Florida (5.37 million), New
York (3.81 million), and Illinois (2.21 million), while those in which Hispanics make
up the largest percentage of the population are New Mexico (48.77%), Texas
(39.42%), California (39.15%), Arizona (31.39%), and Nevada (28.84%). Of the ten
states with the largest total number of Latinos, those with the greatest increase in
that population between 2000 and 2015 were Georgia (a 118.8% increase),
Florida (85.6%), Arizona (62.4%), Texas (60.4%), and Colorado (58.4%) (Flores
2017). Of all 50 states, the greatest percentage increases took place in South
Dakota (190%), Tennessee (176%), South Carolina (172%), Alabama (164%), and
Kentucky (154%) (Stepler and Lopez 2016).
Finally, in the final decades of the 20th century and the beginning of the 21st, there
have been changes in the Hispanic population’s places of origin. Mexico remains
the country of origin of most Latinos (62.31% of the total), followed by Puerto Rico
(9.5%), Cuba (3.94%), El Salvador (3.93%), and the Dominican Republic (3.54%)
(U.S. Census Bureau/American FactFinder 2018: B03001). However, from 2007
until at least 2015, the Mexican-born population decreased by 6% while the Central
American-born population saw marked growth (a 19% increase from El Salvador,
31% from Guatemala, and 32% from Honduras, for a Central American average of
25%) (Cohn, Passel, and Gonzalez-Barreda 2017).
This decrease in immigration from Latin America and in particular from Mexico,
whose behavior largely determines the total figures, is transforming the
composition of the Hispanic population in the U.S. The percentage of Latinos born
abroad dropped from its peak of 40.1% in 2000 to 34.4% in 2015 (Flores 2017).
According to the latest demographic projections from the U.S. Census Bureau, this
trend will continue in the coming decades. The Hispanic population will be around
111 million in 2060, 27.5% of the total population of 403.7 million (Vespa,
Armstrong, and Medina 2018). Of those 111 million, 84 million (75.67%) will be
born in the U.S., versus a little over 27 million (24.32%) who will be born abroad.

© Rosana Hernández. Francisco Moreno-Fernández (dir.)
Hispanic Map of the United States 2018
Informes del Observatorio / Observatorio Reports. 044-10/2018EN
ISSN: 2373-874X (online) doi: 10.15427/OR044-10/2018EN
Cervantes Institute at FAS - Harvard University © Cervantes Institute at the Faculty of Arts and Sciences of Harvard University
10
This increase in the U.S. Latino population may have major consequences for the
presence of the Spanish language in the country, given that, as mentioned in
section 2.1, there is a gradual loss of Spanish in the generations following
migration.
Figure 4. Projections of the Hispanic population through 2060, in millions. Source: Vespa,
Armstrong, and Medina (2018).
These figures are somewhat lower than earlier projections (Colby and Ortman
2015), which placed the Latino population at 119 million (28.6% of the total
population) by 2060. These population estimates do not consider two elements
that may prove key to the evolution of the Hispanic population in the U.S. First,
natural disasters or the political climate, such as changes in immigration policies
or political instability, may directly affect population flows (Vespa, Armstrong, and
Medina 2018). Second, changes in racial and ethnic self-identification can also
change the size of these groups in ways that such figures cannot predict (ibid). Pew
Research has demonstrated that self-identification as Hispanic or Latino
decreases with the generations: while 97% of those born abroad consider
themselves Hispanic, this percentage decreases to 77% by the third generation,
and to 50% in the fourth and following generations (Lopez, Gonzalez-Barrera, and
López 2017). Thus, in addition to affecting the future of the Spanish language, the
0
20
40
60
80
100
120
2016 2030 2060
Hispanic population U.S.-born Hispanics Foreign-born Hispanics

© Rosana Hernández. Francisco Moreno-Fernández (dir.)
Hispanic Map of the United States 2018
Informes del Observatorio / Observatorio Reports. 044-10/2018EN
ISSN: 2373-874X (online) doi: 10.15427/OR044-10/2018EN
Cervantes Institute at FAS - Harvard University © Cervantes Institute at the Faculty of Arts and Sciences of Harvard University
11
growth of the Latino population born in the U.S. may also impact trends in self-
identification and, consequently, the official size of the group.
2. Language Proficiency and Use
• With 41 million speakers in 2017, Spanish is the most spoken language in the
U.S. after English.
• A total of 7.4 million primary- and secondary school students studied Spanish in
the 2014-15 academic year, versus 1.3 million who studied French, 330,898 who
studied German, and 227,086 who studied Chinese.
• 712,240 university students studied Spanish in 2016, a decrease of 17.3%
since 2009.
Although the U.S. Census first asked about citizens’ English proficiency in 1890,
the question used today first appeared in 1980 (Leeman 2018). According to
Leeman (2018: 7-8), the new version of the question no longer acted as a stand-
in for national or ethno-racial origin (the question about Hispanic or Latino origin
was added in 1970), but instead aimed to produce statistics about languages to
comply with legislation and regulations on bilingual education, English-language
education, and the provision of election materials in other languages.

© Rosana Hernández. Francisco Moreno-Fernández (dir.)
Hispanic Map of the United States 2018
Informes del Observatorio / Observatorio Reports. 044-10/2018EN
ISSN: 2373-874X (online) doi: 10.15427/OR044-10/2018EN
Cervantes Institute at FAS - Harvard University © Cervantes Institute at the Faculty of Arts and Sciences of Harvard University
12
Figure 5. The question on language used in the U.S. Census. Source: U.S. Census 2000
Form6.
Although the census and the American Community Survey (ACS) offer the most
reliable estimates on the number of Spanish speakers in the country, they must be
regarded as approximations, as several difficult-to-quantify realities prevent a more
precise estimate. These factors include the number of non-Hispanics who are
proficient in Spanish but do not speak it at home, and the number of Hispanics
born abroad who speak Spanish but who, because they arrived in the U.S. at a
young age, are not proficient in it.
2.1. Spanish Speakers
In 1980, the first year for which data is available, 11.12 million people spoke
Spanish at home in the U.S. (Ortman and Shin 2011). At that time, it was the
country’s most spoken language after English, the sole language of 187.19 million
U.S. Americans. In third place was Italian (1.62 million speakers), followed by
German (1.59 million), and French (1.55 million). Thirty-six years later, the number
6 Available at: https://bit.ly/2O1wsDc

© Rosana Hernández. Francisco Moreno-Fernández (dir.)
Hispanic Map of the United States 2018
Informes del Observatorio / Observatorio Reports. 044-10/2018EN
ISSN: 2373-874X (online) doi: 10.15427/OR044-10/2018EN
Cervantes Institute at FAS - Harvard University © Cervantes Institute at the Faculty of Arts and Sciences of Harvard University
13
of Spanish speakers has nearly quadrupled to 41 million, according to the latest
available data (U.S. Census Bureau/American FactFinder 2018: C16006;
C16005): Spanish remains in second place after English, which is now the sole
language of 237.81 million people. However, the following three languages by
number of speakers are not European, but Asian: Chinese (3.46 million), Tagalog
(1.75 million), and Vietnamese (1.45 million), respectively (U.S. Census
Bureau/American FactFinder 2018: B16001).
Figure 6. Spanish speakers older than five in the U.S., in millions (Ortman and Shin 2011
and U.S. Census Bureau/American FactFinder 2017: C16006, C16005).
Of those 41 million Spanish speakers, 38.4 million are Hispanic (U.S. Census
Bureau/American Fact Finder 2017: C16006), and 2.6 million are individuals who
do not identify as Hispanic but who also speak Spanish at home (U.S. Census
Bureau/American FactFinder 2016: C16005).
The only projections currently available anticipate between 39.39 and 43.13
million Spanish speakers by 2020, depending on immigration patterns (Ortman
and Shin 2011). High net migration would result in 43.1 million Spanish speakers
(41.11 Hispanics and 2.01 non-Hispanics), and low net migration would result in
39.49 million Spanish speakers (38.18 Hispanics and 1.97 non-Hispanics).
0
5,000,000
10,000,000
15,000,000
20,000,000
25,000,000
30,000,000
35,000,000
40,000,000
45,000,000
1980 1990 2000 2010 2017

© Rosana Hernández. Francisco Moreno-Fernández (dir.)
Hispanic Map of the United States 2018
Informes del Observatorio / Observatorio Reports. 044-10/2018EN
ISSN: 2373-874X (online) doi: 10.15427/OR044-10/2018EN
Cervantes Institute at FAS - Harvard University © Cervantes Institute at the Faculty of Arts and Sciences of Harvard University
14
Therefore, the behavior of migration from Latin America will influence the future of
Spanish in the U.S., as we know that linguistic proficiency among Hispanics varies
by place of birth and, for U.S. American Hispanics, by generation. This is not a
defining characteristic of the Spanish language: to the contrary, notwithstanding a
few isolated groups, “all other ethnolinguistic minorities in the United States lose
their ethnic mother tongue fairly completely by their second or third generation of
encounter with American urban life” (Fishman, in Crawford 1992: 168). Fishman
writes that the only difference is that there is a “slightly longer retention of Spanish,
due to the continued influx of monolingual Spanish speakers into their urban
barrios” (ibid).
According to an analysis by Pew Research, the use of Spanish decreased by 5% in
the country’s 25 largest metropolitan areas between 2006 and 2015 (Krogstad
and Lopez 2017). Unfortunately, there is no data that would facilitate a comparison
between the evolution of Spanish and that of other languages, such as Chinese,
making it impossible to determine if this is a generalized trend among all non-
English languages or if the behavior of Spanish is governed by its inherent
dynamics.
Figure 7 represents active and passive linguistic proficiency in English and Spanish
among first, second, third, and subsequent Hispanic generations. Clearly, the origin
of U.S. American Latinos is a relevant factor in the determination of the Spanish
language’s future in the U.S.

© Rosana Hernández. Francisco Moreno-Fernández (dir.)
Hispanic Map of the United States 2018
Informes del Observatorio / Observatorio Reports. 044-10/2018EN
ISSN: 2373-874X (online) doi: 10.15427/OR044-10/2018EN
Cervantes Institute at FAS - Harvard University © Cervantes Institute at the Faculty of Arts and Sciences of Harvard University
15
Figure 7. Linguistic proficiency of Hispanics in the U.S. by generation. Source: Taylor,
Lopez, Martínez, and Velasco 2012.
Thus, 61% of Hispanics born abroad speak Spanish as their primary language,
versus 8% of second-generation Hispanics, and 1% of third- and subsequent-
generation Hispanics (Taylor, Lopez, Martínez, and Velasco 2012). English
proficiency follows just the opposite trajectory: 6% of the first generation speaks
English as their primary language, a figure that increases to 40% in the second
generation and 69% in the third and subsequent generations. Bilingualism among
Hispanics peaks at 53% in the second generation, compared to 33% in the first
generation and 29% in the third and subsequent generations.
Of the total number of people with limited English proficiency (LEP), 16.4 million
speak Spanish as their primary language (Batalova and Zong 2016). Persons are
considered to have LEP when they report on the census that they speak English
less than “very well.” Spanish speakers make up 77% of the U.S.-born LEP
population (3.6 million) and 61% of the immigrant LEP population (12.8 million).
0 20 40 60 80 100 120
First generation
Second generation
Third and higher generation
Reads Spanish "very well"/"pretty well" Speaks Spanish «"very wel l"/"pretty well"
Reads English "very well"/"pretty well" Speaks English "very well"/"pretty well"
© Rosana Hernández. Francisco Moreno-Fernández (dir.)
Hispanic Map of the United States 2018
Informes del Observatorio / Observatorio Reports. 044-10/2018EN
ISSN: 2373-874X (online) doi: 10.15427/OR044-10/2018EN
Cervantes Institute at FAS - Harvard University © Cervantes Institute at the Faculty of Arts and Sciences of Harvard University
16
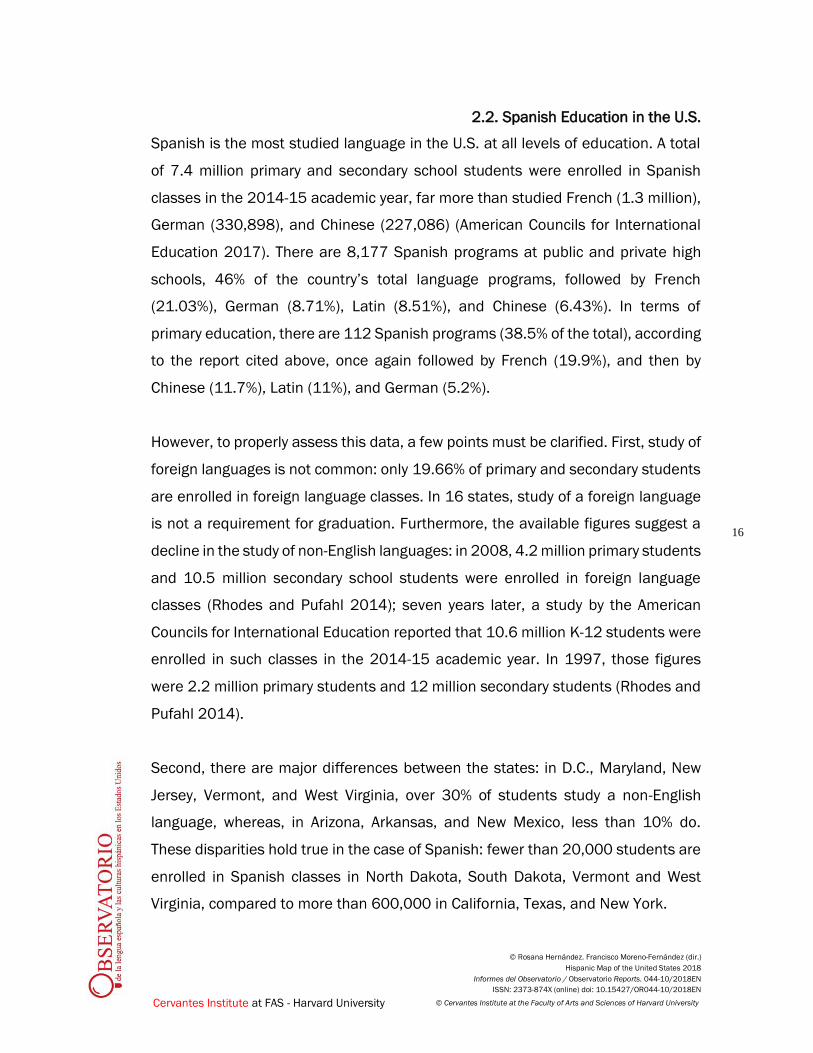
2.2. Spanish Education in the U.S.
Spanish is the most studied language in the U.S. at all levels of education. A total
of 7.4 million primary and secondary school students were enrolled in Spanish
classes in the 2014-15 academic year, far more than studied French (1.3 million),
German (330,898), and Chinese (227,086) (American Councils for International
Education 2017). There are 8,177 Spanish programs at public and private high
schools, 46% of the country’s total language programs, followed by French
(21.03%), German (8.71%), Latin (8.51%), and Chinese (6.43%). In terms of
primary education, there are 112 Spanish programs (38.5% of the total), according
to the report cited above, once again followed by French (19.9%), and then by
Chinese (11.7%), Latin (11%), and German (5.2%).
However, to properly assess this data, a few points must be clarified. First, study of
foreign languages is not common: only 19.66% of primary and secondary students
are enrolled in foreign language classes. In 16 states, study of a foreign language
is not a requirement for graduation. Furthermore, the available figures suggest a
decline in the study of non-English languages: in 2008, 4.2 million primary students
and 10.5 million secondary school students were enrolled in foreign language
classes (Rhodes and Pufahl 2014); seven years later, a study by the American
Councils for International Education reported that 10.6 million K-12 students were
enrolled in such classes in the 2014-15 academic year. In 1997, those figures
were 2.2 million primary students and 12 million secondary students (Rhodes and
Pufahl 2014).
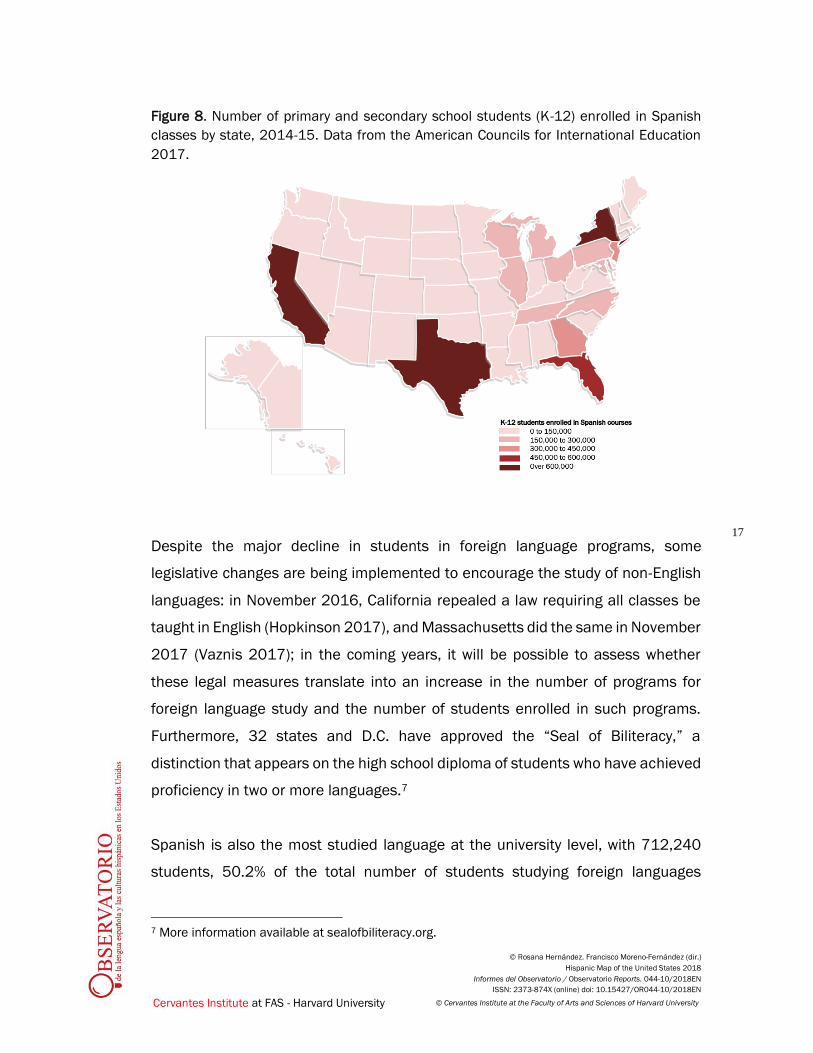
Second, there are major differences between the states: in D.C., Maryland, New
Jersey, Vermont, and West Virginia, over 30% of students study a non-English
language, whereas, in Arizona, Arkansas, and New Mexico, less than 10% do.
These disparities hold true in the case of Spanish: fewer than 20,000 students are
enrolled in Spanish classes in North Dakota, South Dakota, Vermont and West
Virginia, compared to more than 600,000 in California, Texas, and New York.
© Rosana Hernández. Francisco Moreno-Fernández (dir.)
Hispanic Map of the United States 2018
Informes del Observatorio / Observatorio Reports. 044-10/2018EN
ISSN: 2373-874X (online) doi: 10.15427/OR044-10/2018EN
Cervantes Institute at FAS - Harvard University © Cervantes Institute at the Faculty of Arts and Sciences of Harvard University
17
Figure 8. Number of primary and secondary school students (K-12) enrolled in Spanish
classes by state, 2014-15. Data from the American Councils for International Education
2017.
Despite the major decline in students in foreign language programs, some
legislative changes are being implemented to encourage the study of non-English
languages: in November 2016, California repealed a law requiring all classes be
taught in English (Hopkinson 2017), and Massachusetts did the same in November
2017 (Vaznis 2017); in the coming years, it will be possible to assess whether
these legal measures translate into an increase in the number of programs for
foreign language study and the number of students enrolled in such programs.
Furthermore, 32 states and D.C. have approved the “Seal of Biliteracy,” a
distinction that appears on the high school diploma of students who have achieved
proficiency in two or more languages.7
Spanish is also the most studied language at the university level, with 712,240
students, 50.2% of the total number of students studying foreign languages
7 More information available at sealofbiliteracy.org.

© Rosana Hernández. Francisco Moreno-Fernández (dir.)
Hispanic Map of the United States 2018
Informes del Observatorio / Observatorio Reports. 044-10/2018EN
ISSN: 2373-874X (online) doi: 10.15427/OR044-10/2018EN
Cervantes Institute at FAS - Harvard University © Cervantes Institute at the Faculty of Arts and Sciences of Harvard University
18
(Looney and Lusin 2018). This has been the case since Spanish overtook French
in 1970. The following chart shows the evolution of the seven languages most
studied at U.S. universities.
Figure 9. Students of the seven languages most studied at U.S. universities. Source:
Looney and Lusin 2018.
As the chart indicates, in 1958, French was the most studied language in the U.S.,
with a total of 157,900 students. Spanish became the most popular language
among U.S. university students in the 1970s, and it remains the most popular
today. The number of students in Spanish classes increased every year until 2009,
when this number began to drop for Spanish and all other foreign languages,
except for Japanese (3%) and Korean (12.1%). Between 2009 and 2016,
enrollment in non-English language programs decreased by 15.3% at the national
level. The numbers had not fallen since 1970 (except for an isolated decrease in
1995). Then, in 1980, after a decade of decline, 7.3 of every 100 university
students were enrolled in language classes; by 2016, it was 7.5 in 100.
As for Spanish, the number of students enrolled has decreased by 17.3% at the
national level since 2009 and reached 712,240 students in the fall of 2016. This
0
100,000
200,000
300,000
400,000
500,000
600,000
700,000
800,000
900,000
1,000,000
1958 1970 1980 1990 1995 2002 2006 2009 2013 2016
Spanish French American Sign Language German Japanese Italian Chinese
© Rosana Hernández. Francisco Moreno-Fernández (dir.)
Hispanic Map of the United States 2018
Informes del Observatorio / Observatorio Reports. 044-10/2018EN
ISSN: 2373-874X (online) doi: 10.15427/OR044-10/2018EN
Cervantes Institute at FAS - Harvard University © Cervantes Institute at the Faculty of Arts and Sciences of Harvard University
19
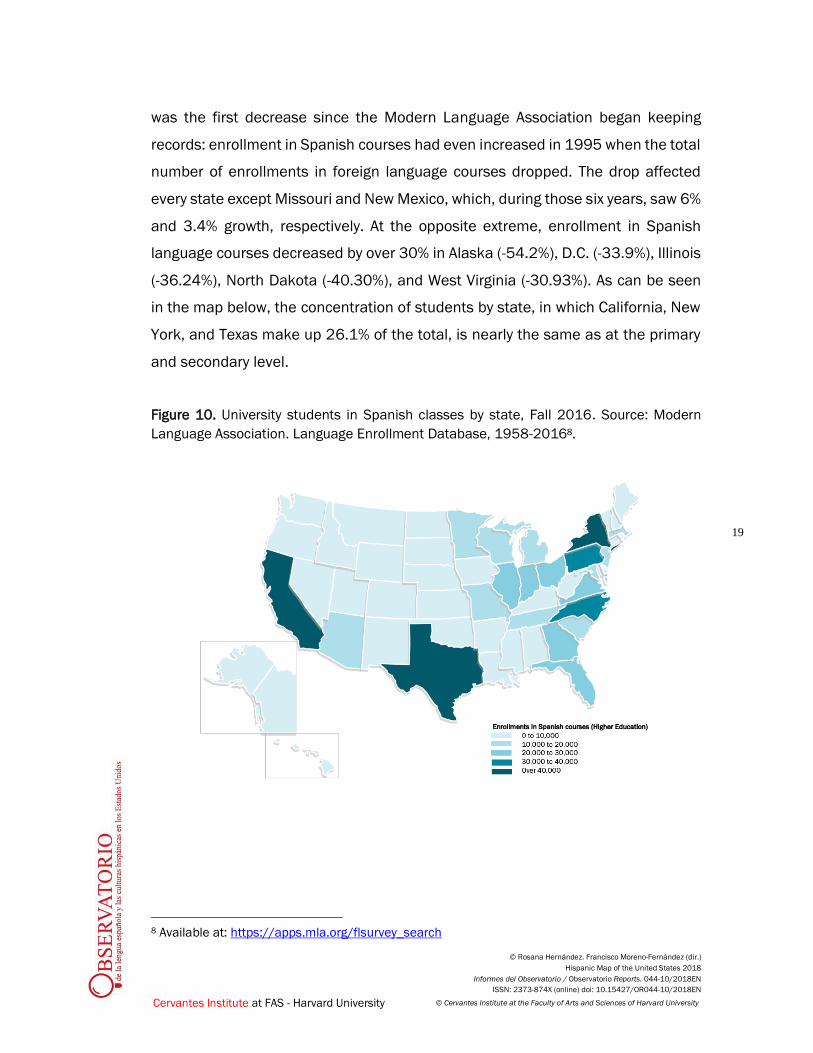
was the first decrease since the Modern Language Association began keeping
records: enrollment in Spanish courses had even increased in 1995 when the total
number of enrollments in foreign language courses dropped. The drop affected
every state except Missouri and New Mexico, which, during those six years, saw 6%
and 3.4% growth, respectively. At the opposite extreme, enrollment in Spanish
language courses decreased by over 30% in Alaska (-54.2%), D.C. (-33.9%), Illinois
(-36.24%), North Dakota (-40.30%), and West Virginia (-30.93%). As can be seen
in the map below, the concentration of students by state, in which California, New
York, and Texas make up 26.1% of the total, is nearly the same as at the primary
and secondary level.
Figure 10. University students in Spanish classes by state, Fall 2016. Source: Modern
Language Association. Language Enrollment Database, 1958-20168.
8 Available at: https://apps.mla.org/flsurvey_search

© Rosana Hernández. Francisco Moreno-Fernández (dir.)
Hispanic Map of the United States 2018
Informes del Observatorio / Observatorio Reports. 044-10/2018EN
ISSN: 2373-874X (online) doi: 10.15427/OR044-10/2018EN
Cervantes Institute at FAS - Harvard University © Cervantes Institute at the Faculty of Arts and Sciences of Harvard University
20
3. Educational Landscape
• The percentage of Hispanics that have completed secondary education has
increased from 59% in 1990 to 88% in 2015.
• The high school dropout rate has decreased by 20 percentage points since
1992, reaching 8.6% in 2016.
• Of Hispanic students in four-year college programs, 55.7% finish their studies
within six years, as compared with 71.7% of white students and 75.8% of Asian
students.
In 2017, 73% of Latinos believed that improving the education system should be
the top priority of the president of the U.S. and Congress (Pew Research 2017b).
In 2016, when asked about the most important issues in the presidential election,
education was one of Latinos’ biggest concerns, at the same level as healthcare
and terrorism, and second only to the economy (Krogstad 2016). Education’s
presence among Hispanics’ political concerns reveals the importance they place
on it: 64% of Hispanics say a university education is a key part of the American
Dream (compared to 50% among whites and 48% among African Americans).
Similarly, 41% believe that education is the most important element in the path to
economic success, versus 27% of whites and 34% of African Americans (The
Washington Post 2014). The value that the Latino population places on education
may be partially responsible for the improvement in the levels of enrollment and
completion at the various levels of education, though major disparities with the
country’s other racial and ethnic groups remain.
3.1. Primary and Secondary Education
In 2013, Hispanic children represented 25% of all children enrolled in Pre-K
through 12th grade, a 6% increase since 2003; the Hispanic student population is
expected to make up 29% of the total by 2025 (National Center for Education
Statistics 2017). Furthermore, the number of Hispanics on the teaching force is

© Rosana Hernández. Francisco Moreno-Fernández (dir.)
Hispanic Map of the United States 2018
Informes del Observatorio / Observatorio Reports. 044-10/2018EN
ISSN: 2373-874X (online) doi: 10.15427/OR044-10/2018EN
Cervantes Institute at FAS - Harvard University © Cervantes Institute at the Faculty of Arts and Sciences of Harvard University
21
gradually increasing. In 1987-88, Hispanics accounted for 3% of public-school
teachers, but by 2015-16 they accounted for 8.8%; in private schools, they
accounted for 5.2% in 2011-12, the last year for which data is available (NCES
2017. 209.10).
But, apart from the growing Hispanic presence in classrooms, all indications
suggest constant improvement in Latinos’ academic performance. In 2015, 88%
of Hispanics aged 18 to 24 had completed secondary school, an increase of 29%
since 1990 (59%), although the rate remains below other groups and the national
average (95% for whites, 92% for African Americans, 97% for Asians, 94% for
Pacific Islanders, 82% for American Natives and Native Alaskans, for a national
average of 93%) (National Center for Education Statistics 2017). Birthplace
influences the rate at which students complete their studies, especially among
Hispanics: 79% of Latinos born abroad between ages 18 and 24 completed their
secondary school studies in 2015, compared to 92% of first-generation Hispanics
and 90% of second- and subsequent-generation Hispanics. Among non-Hispanics,
95% of those born abroad complete their secondary schooling, followed by 98% of
the first generation and 94% of subsequent generations. Given that Hispanics born
in the U.S. represent a growing percentage of the Latino population, one can expect
this and other indicators to improve over time.
The continual decrease in the secondary school dropout rate among Hispanics
aged 16 to 24 confirms that advances are being made in education. In 2016, that
rate was 8.6%, a 20.8% decrease since 1992, when it was 29.4% (NCES 2017.
219.70). Although Latinos do have a greater dropout rate, the difference with
respect to other groups has dropped dramatically: in 1992, the Hispanic rate was
18.4 points higher than the national average (11% versus 29.4%); by 2016 that
difference had shrunk to 2.5 points (6.1% versus 8.6%).

© Rosana Hernández. Francisco Moreno-Fernández (dir.)
Hispanic Map of the United States 2018
Informes del Observatorio / Observatorio Reports. 044-10/2018EN
ISSN: 2373-874X (online) doi: 10.15427/OR044-10/2018EN
Cervantes Institute at FAS - Harvard University © Cervantes Institute at the Faculty of Arts and Sciences of Harvard University
22
Figure 11. Secondary school dropout rate over time, by race and ethnicity, 1992-2016.
Source: NCES 2017. 219.70.
Once again, birthplace has a major impact: in 2014, the dropout rate was 8%
among Hispanics born in the U.S. and 21% among Hispanics born abroad. Place of
origin also plays a determining role among Pacific Islanders (7% for those born in
the U.S. and 23% for those born abroad) and American Natives and Native
Alaskans (11% and 22%); this is not true among African Americans (7% and 6%),
Asians (2% and 3%), or whites (4% in both categories) (NCES 2017). The main
reason given for young Latinos leaving school is the need to support their families
financially (74%), along with poor English proficiency (around 50%), and dislike for
school and the feeling that they do not need more education for their desired
careers (around 40%) (Lopez 2009).
3.2. University Education
The Hispanic population’s evolution in university-level education is similar to its
experience at the primary and secondary levels: benchmarks are gradually
improving, and disparities with other groups are shrinking, though they still exist.
In 2016, 39.2% of Hispanics aged 18 to 24 were enrolled in an institution of higher
00
05
10
15
20
25
30
35
1992
1993
1994
1995
1996
1997
1998
1999
2000
2001
2002
2003
2004
2005
2006
2007
2008
2009
2010
2011
2012
2013
2014
2015
2016
All races White Black Hispanic
© Rosana Hernández. Francisco Moreno-Fernández (dir.)
Hispanic Map of the United States 2018
Informes del Observatorio / Observatorio Reports. 044-10/2018EN
ISSN: 2373-874X (online) doi: 10.15427/OR044-10/2018EN
Cervantes Institute at FAS - Harvard University © Cervantes Institute at the Faculty of Arts and Sciences of Harvard University
23
learning, in two- or four-year programs (NCES 2017. 302.60). Since 2003, the first
year in which NCES used the same ethnic and racial breakdown it uses today, that
figure has increased by 15.7%. Furthermore, the disparity with the national average
has decreased from 14.3 points in 2003 (37.8% among the general population
aged 18 to 24 versus 23.5% of the Hispanic population) to 2% in 2016 (41.2%
versus 39.2%).
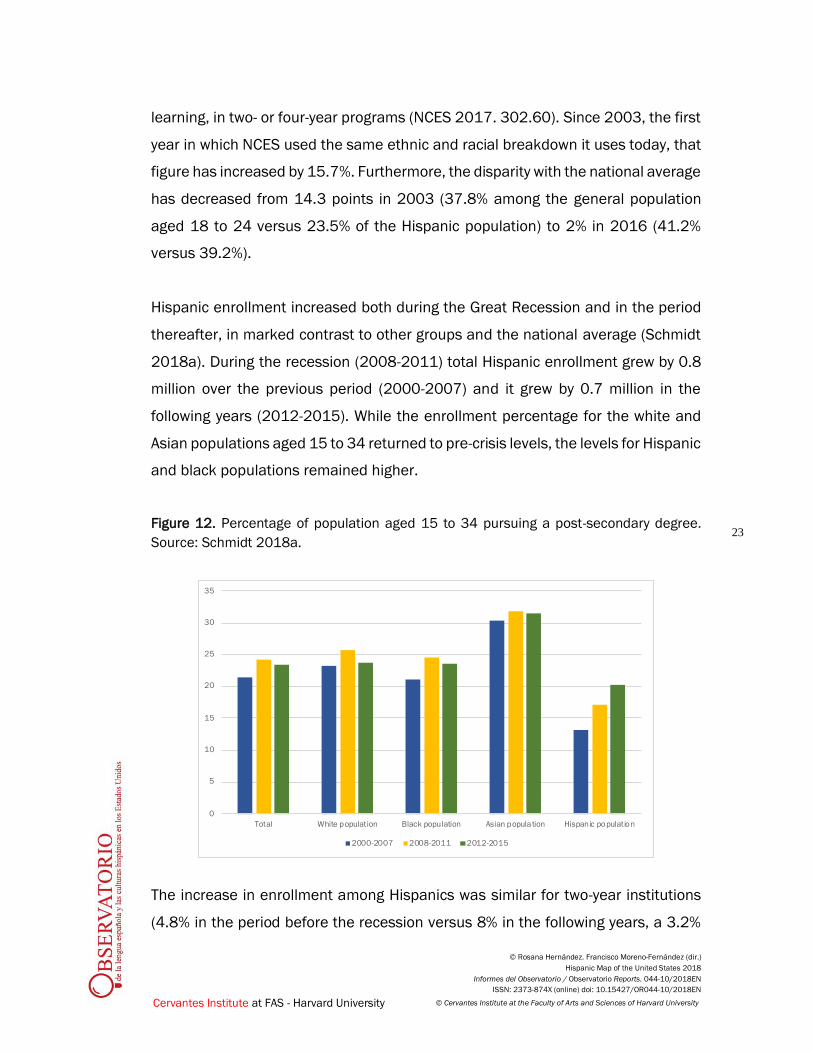
Hispanic enrollment increased both during the Great Recession and in the period
thereafter, in marked contrast to other groups and the national average (Schmidt
2018a). During the recession (2008-2011) total Hispanic enrollment grew by 0.8
million over the previous period (2000-2007) and it grew by 0.7 million in the
following years (2012-2015). While the enrollment percentage for the white and
Asian populations aged 15 to 34 returned to pre-crisis levels, the levels for Hispanic
and black populations remained higher.
Figure 12. Percentage of population aged 15 to 34 pursuing a post-secondary degree.
Source: Schmidt 2018a.
The increase in enrollment among Hispanics was similar for two-year institutions
(4.8% in the period before the recession versus 8% in the following years, a 3.2%
0
5
10
15
20
25
30
35
Total White population Black population Asian population Hispanic population
2000-2007 2008-2011 2012-2015

© Rosana Hernández. Francisco Moreno-Fernández (dir.)
Hispanic Map of the United States 2018
Informes del Observatorio / Observatorio Reports. 044-10/2018EN
ISSN: 2373-874X (online) doi: 10.15427/OR044-10/2018EN
Cervantes Institute at FAS - Harvard University © Cervantes Institute at the Faculty of Arts and Sciences of Harvard University
24
increase) and four-year institutions (7.1% versus 10.5%, a 3.4% increase).
Enrollments tend to increase during economic contractions, both as a means of
improving job readiness and because the shortage of employment opportunities
decreases the opportunity cost of devoting time to study (ibid.). Therefore, in the
coming years, it will be essential to observe if these trends continue or if they are
influenced by the impact of the Great Recession of 2008.
Despite Hispanics’ undoubted improvement in university education, some nuances
should be mentioned. First, according to an analysis published by The New York
Times, the mechanism of affirmative action has not been sufficient to reduce the
disparities between the general university-age population and that group’s
percentage of students. Among Hispanics, this difference was 3% in 1980, while
in 2015 it was 9% (22% of the university-age population versus 13% of first-year
students) (Ashkenas, Park, and Pearce 2017).
Furthermore, race and ethnicity are associated with differences in how long it takes
a student to complete a degree. According to the annual report of the National
Student Clearinghouse Research Center, which analyzes data from students who
began their studies six years earlier, 55.7% of Hispanics at four-year public
institutions finished within six years, ten points higher than black students (45.9%),
and far behind white and Asian students (71.7% and 75.8%, respectively) (Shapiro,
Dundar, Huie, Wakhungy, Yuan, Nathan, and Bhimdiwali 2017). Furthermore,
Hispanics are more likely to attend two-year institutions than students of other
ethnic and racial groups: 46% of the total number of post-secondary degree
students, compared to a national average of 36.6% (Hispanic Association of
Colleges and Universities 2018).
3.3. Average Education Level
As a consequence of the above trends, the last few decades have seen an
improvement in the average education level of the Hispanic population. Whereas

© Rosana Hernández. Francisco Moreno-Fernández (dir.)
Hispanic Map of the United States 2018
Informes del Observatorio / Observatorio Reports. 044-10/2018EN
ISSN: 2373-874X (online) doi: 10.15427/OR044-10/2018EN
Cervantes Institute at FAS - Harvard University © Cervantes Institute at the Faculty of Arts and Sciences of Harvard University
25
in 1997 only 55% of Hispanics aged 25 and older had completed secondary school,
in 2017 that percentage reached 71%, though, again, that figure remains behind
the graduation rate for whites (94%), Asians (87%), and African Americans (87%)
(Schmidt 2018b). Here, too, place of birth affects the odds of completing secondary
school: 15% of U.S.-born Hispanics did not complete secondary school, as opposed
to 76% of those born abroad (ibid.).
Figure 13. Percentage of the population with a university degree or higher. Source: NCES
2017. 104.10.
The university graduation rate has also increased, although, as is clear from the
above chart, growth of that rate among Hispanics between 1992 and 2017 was
the slightest of all groups and, consequently, lower than the average (7.9% versus
an average of 12.8%, 14.9% among whites, 12.5% among African Americans, and
14.5% among Asians). Not to mention, the percentage of Latinos with post-
secondary degrees of any level remains 17% below the national average.
Therefore, these benchmarks reveal the same situation as the earlier indicators:
there have been significant improvements among the Hispanic population in the
past few decades, but the results remain far behind the average for the overall U.S.
population. The differences between foreign-born and U.S.-born Hispanics are also
00
10
20
30
40
50
60
1992 1997 2002 2007 2012 2017
All races White population Black population
Hispanic population Asian population

© Rosana Hernández. Francisco Moreno-Fernández (dir.)
Hispanic Map of the United States 2018
Informes del Observatorio / Observatorio Reports. 044-10/2018EN
ISSN: 2373-874X (online) doi: 10.15427/OR044-10/2018EN
Cervantes Institute at FAS - Harvard University © Cervantes Institute at the Faculty of Arts and Sciences of Harvard University
26
repeated in this category: according to data from 2015, of the foreign-born Latino
population aged 25 to 34, only 11% have a bachelor’s degree or some post-
secondary degree, compared to 20% of U.S.-born Hispanics (NCES 2017. 104.60).
Among Asians in the U.S., the difference is less drastic and reversed: 61.7% of
those born in the U.S. have completed post-secondary degrees, versus 66% of
those born in other countries.
4. Economic and Socioeconomic Trends
• The annual per-capita income among the non-Hispanic white population
($38,487) is nearly double that of the Hispanic population ($19,537).
• The proportion of Hispanics living below the poverty level reached the historic
low of 18.3% in 2017.
• In 2017, 16.1% of the Latino population lacked health insurance, versus
11.6% of the black population, 7.3% of the Asian population, and 6.3% of the
white population.
• Only 67.5% of Hispanic households have a computer, and 81.8% have a
smartphone.
Today, Hispanics have a buying power of 1.5 trillion dollars, a 203% increase since
2000, giving Hispanics 10.3% of the country’s total buying power. This figure is
expected to increase to 11.2% by 2022, though this growth is slower than that of
Asian Americans (Weeks 2018). The number of Latino-owned businesses and the
value of those businesses are also growing. According to data from Geoscape
(2017), the number of Latino businesses in the U.S. increased by 31.6% between
2012 and 2017, compared to a growth rate of only 13.8% among other racial and
ethnic groups. A total of 4.37 million such businesses generate $700 billion in the
U.S. economy.
© Rosana Hernández. Francisco Moreno-Fernández (dir.)
Hispanic Map of the United States 2018
Informes del Observatorio / Observatorio Reports. 044-10/2018EN
ISSN: 2373-874X (online) doi: 10.15427/OR044-10/2018EN
Cervantes Institute at FAS - Harvard University © Cervantes Institute at the Faculty of Arts and Sciences of Harvard University
27
However, as with educational indicators, Hispanics’ economic situation remains
behind that of other racial and ethnic groups and behind the national average,
despite gradual improvement. Furthermore, the Great Recession of 2008 impeded
economic performance among the entire population, such that the past several
years have been spent trying to return to pre-crisis income, poverty, and
employment levels.
4.1. Income and Poverty
The average per-capita annual income among Hispanics in 2017 was $19,537
(U.S. Census Bureau/American FactFinder 2018: S1902), compared to $38,487
among the non-Hispanic white population, $38,019 among the Asian population,
and $22,175 among the black population. At the low point of the Great Recession,
in 2010, per-capita income among Hispanics reached $14,801, compared to
$26,059 for the U.S. population as a whole. In terms of household income, those
headed by Hispanics have an average annual income of $47,675, below that of
those headed by whites ($65,041) and Asians ($81,431), and ahead only of those
headed by African Americans ($39,490) (Semega, Fontenot, and Kollar 2017).
Since 1973, average per-capita income has increased by 72.5% for Latinos, from
$12,136 to $20,937 in 20179 (U.S. Census Bureau n.d.-b). The Hispanic and
African American populations have seen the greatest rate growth, with growth
around 95%, versus 69.3% growth among the white population and 55.1% growth
among the Asian population (data on the Asian population goes back only to 1993).
As with many other indicators, improvements have not been large enough to bridge
initial disparities.
9 In 2017 dollars. The amounts reported by the census in these charts differs from those reported
by American FactFinder for the same year; in any case, it is still possible to observe general trends
since 1973.

© Rosana Hernández. Francisco Moreno-Fernández (dir.)
Hispanic Map of the United States 2018
Informes del Observatorio / Observatorio Reports. 044-10/2018EN
ISSN: 2373-874X (online) doi: 10.15427/OR044-10/2018EN
Cervantes Institute at FAS - Harvard University © Cervantes Institute at the Faculty of Arts and Sciences of Harvard University
28
Figure 14. Per-capita income by race and ethnicity, 2016 Source: U.S. Census
Bureau/American FactFinder 2018: S1902.
As for poverty, improvements have been moderate and slow. From 1972 to the
present day, the proportion of the Hispanic population living below the poverty level
has decreased by 4.5 percentage points (from 22.8% to 18.3% in 2017), and the
national average has increased from 11.9% in 1972 to 12.3% today (U.S. Census
Bureau 2018b). The poverty rate among the Latino population hit a high in 1994,
with 30.7% living below the poverty level. That number slowly decreased until the
Great Recession, when it again began to increase, reaching 26.5% in 2010. Today
it is 18.3% (ibid.). As is clear from figure 15, the Hispanic population behaves
similarly to other racial and ethnic groups, among which inequality has decreased
slightly, or even increased over the past 15 years; consequently, disparities
between the groups persist.
38,487 38,019
22,175
19,537
0
5,000
10,000
15,000
20,000
25,000
30,000
35,000
40,000
45,000
White (Non-
Hispanic)
Asian Black Hispanic

© Rosana Hernández. Francisco Moreno-Fernández (dir.)
Hispanic Map of the United States 2018
Informes del Observatorio / Observatorio Reports. 044-10/2018EN
ISSN: 2373-874X (online) doi: 10.15427/OR044-10/2018EN
Cervantes Institute at FAS - Harvard University © Cervantes Institute at the Faculty of Arts and Sciences of Harvard University
29
Figure 15. Percent of the population living below the poverty line by race and ethnicity
(2002-2017). Source: U.S. Census Bureau 2018b.
These disparities hold across age groups. The black population has the highest
child poverty rate, with 30.8% of those under 18 living below the poverty level; that
same figure is 26.6% for the Hispanic population, 11.1% for the Asian population,
and 9.5% for the white population; among those ages 18 to 64, those percentages
reduce to 18.9% among blacks, 15.8% among Hispanics, 9.5% among Asians, and
9.2% among whites. Finally, 18.7% of the black population older than 65 lives
below the poverty level, followed by 17.4% of senior Hispanics, 11.8% of senior
Asians, and 8.1% of senior whites (Semega, Fontenot, and Kollar 2017).
Furthermore, a recent Pew Research study on intragroup inequality highlighted that
the median Hispanic household income is below that of other ethnic and racial
groups and that it is has grown less than that of all other groups since 1970
(Kochhar and Cilluffo 2018). The Hispanic and white populations have the least
internal inequality: the top-earning 10% of Hispanics earn 7.8 times the lowest-
earning 10%, whereas, among the Asian population, the income at the 90th
percentile represents 10.7% of the 10th percentile (ibid.).
8.00 8.70
24.10
21.20
10.10 10.00
21.80
18.30
0.00
5.00
10.00
15.00
20.00
25.00
30.00
2002
2003
2004
2005
2006
2007
2008
2009
2010
2011
2012
2013
2014
2015
2016
2017
White (Non-Hispanic) Black Asian Hispanic
© Rosana Hernández. Francisco Moreno-Fernández (dir.)
Hispanic Map of the United States 2018
Informes del Observatorio / Observatorio Reports. 044-10/2018EN
ISSN: 2373-874X (online) doi: 10.15427/OR044-10/2018EN
Cervantes Institute at FAS - Harvard University © Cervantes Institute at the Faculty of Arts and Sciences of Harvard University
30
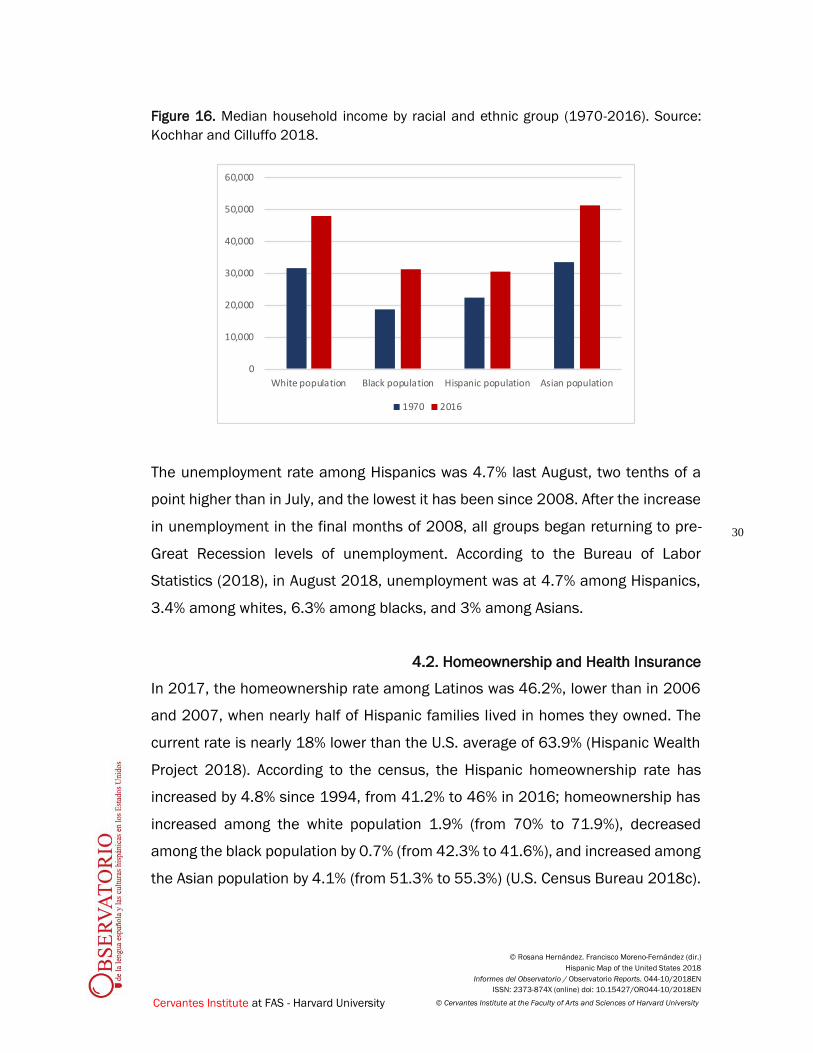
Figure 16. Median household income by racial and ethnic group (1970-2016). Source:
Kochhar and Cilluffo 2018.
The unemployment rate among Hispanics was 4.7% last August, two tenths of a
point higher than in July, and the lowest it has been since 2008. After the increase
in unemployment in the final months of 2008, all groups began returning to pre-
Great Recession levels of unemployment. According to the Bureau of Labor
Statistics (2018), in August 2018, unemployment was at 4.7% among Hispanics,
3.4% among whites, 6.3% among blacks, and 3% among Asians.
4.2. Homeownership and Health Insurance
In 2017, the homeownership rate among Latinos was 46.2%, lower than in 2006
and 2007, when nearly half of Hispanic families lived in homes they owned. The
current rate is nearly 18% lower than the U.S. average of 63.9% (Hispanic Wealth
Project 2018). According to the census, the Hispanic homeownership rate has
increased by 4.8% since 1994, from 41.2% to 46% in 2016; homeownership has
increased among the white population 1.9% (from 70% to 71.9%), decreased
among the black population by 0.7% (from 42.3% to 41.6%), and increased among
the Asian population by 4.1% (from 51.3% to 55.3%) (U.S. Census Bureau 2018c).
0
10,000
20,000
30,000
40,000
50,000
60,000
White population Black population Hispanic population Asian population
1970 2016

© Rosana Hernández. Francisco Moreno-Fernández (dir.)
Hispanic Map of the United States 2018
Informes del Observatorio / Observatorio Reports. 044-10/2018EN
ISSN: 2373-874X (online) doi: 10.15427/OR044-10/2018EN
Cervantes Institute at FAS - Harvard University © Cervantes Institute at the Faculty of Arts and Sciences of Harvard University
31
In terms of medical coverage, 16.1% of Hispanics did not have health insurance in
2017, versus 11.6% of blacks, 7.3% of Asians, and 6.3% of whites (Berchick, Hood,
and Barnett 2018). The percentage of Hispanics with private health insurance is
once again the lowest of all groups (53.5%), and it is the demographic group with
the second highest rate of insurance through government plans (39.5%), behind
only the black population (44.1%) (ibid.).
As with many of the other benchmarks discussed in this report, place of birth is
associated with key differences. In this case, 49% of Hispanics born abroad lacked
health insurance, versus 18% of those born in the U.S. (Krogstad and Lopez 2014).
Furthermore, although the 2010 Affordable Care Act (ACA) represented a major
improvement for the Hispanic population, many states with large Latino
populations—including Texas and Florida, with a combined Hispanic population of
16.5 million—have not expanded their Medicaid programs within the framework of
that law, which has limited the scope of the reform. Thus, before July 2014, 24%
of adult Hispanics between 19 and 24 living in states that expanded Medicaid did
not have health insurance, versus 46% of those in states that did not expand it
(Doty, Beutel, Rasmussen, and Collins 2015).
A second report by the Commonwealth Fund shows that differences in access to
healthcare between the black and Hispanic populations and all others decreased
between 2013 and 2015, largely in states that expanded Medicaid (Hayes, Riley,
Radley, and McCarthy 2017). In the face of political movements to reform the ACA,
UnidosUS has asserted that a repeal would result in a loss of coverage for six
million Hispanics (National Hispanic Leadership Agenda 2017).
4.3. Cell Phones and Internet Access
The gap in internet use by racial and ethnic groups has practically disappeared:
according to data from the Pew Research Center (2018a), the internet is used by

© Rosana Hernández. Francisco Moreno-Fernández (dir.)
Hispanic Map of the United States 2018
Informes del Observatorio / Observatorio Reports. 044-10/2018EN
ISSN: 2373-874X (online) doi: 10.15427/OR044-10/2018EN
Cervantes Institute at FAS - Harvard University © Cervantes Institute at the Faculty of Arts and Sciences of Harvard University
32
89% of the white population, 87% of the black population, and 88% of the Hispanic
population; only eight years ago, those figures were 78%, 68%, and 71%,
respectively. These differences are due mainly to device type and internet
subscription services. Ryan (2018) notes that low-income households are less
likely to have high connectivity—that is, to have a computer, a smartphone, a tablet,
and a broadband internet connection—while, to the contrary, most such
households have only smartphones. The same situation can be observed in
Hispanic or Black households: they have lower rates of high connectivity and a
higher number of only smartphones.
Only 67.5% of Hispanic households have a desktop or laptop computer, a rate that
is higher only than that of black households (63.9%) and far below the rates for
white and Asian households (80.9% and 89%, respectively) (Ryan 2018). The
situation is very different in terms of smartphones, which can be found in 81.8% of
Hispanic households, 87.6% of Asian households, 74.9% of white households, and
74.8% of black households (ibid.).
In terms of internet connectivity, there is a clear gap between the Hispanic and
black populations at one end and the white and Asian populations at the other, in
terms of subscriptions to any internet service and subscriptions to broadband
service, as is clear from table 1.
Table 1: Homes with an internet connection by connection type and ethnic and racial
group, 2016 Source: Ryan 2018.
Any internet subscription Broadband connection
Non-Hispanic white 83.9 83.4
Black 72.6 72.3
Asian 90.3 90.1
Hispanic 77.3 77.1

© Rosana Hernández. Francisco Moreno-Fernández (dir.)
Hispanic Map of the United States 2018
Informes del Observatorio / Observatorio Reports. 044-10/2018EN
ISSN: 2373-874X (online) doi: 10.15427/OR044-10/2018EN
Cervantes Institute at FAS - Harvard University © Cervantes Institute at the Faculty of Arts and Sciences of Harvard University
33
5. Politics
• Hispanic electoral participation is typically 13 to 18 points below the average
in presidential elections and 20 to 25 points lower in midterm elections.
• In 2017, 4% of senators and 7.8% of representatives were Hispanic, while
the Latino population makes us 18.1% of the general population.
• State congresses have a total of 322 Hispanic members: 243 in state houses
of representatives and 79 in state senates, with more Democrats (263) than
Republicans (59).
On November 6, 2018, the U.S. will hold midterm elections to choose 435
members of the House of Representatives10 and 35 senators, one third of the 100
in the national Senate. Thirty-six states will also select their governors. These
elections are also often interpreted as an informal referendum on the performance
of the president and his party, in this case, Donald Trump and the Republican Party.
The following overview examines the role of Hispanics in U.S. politics, including
their participation in elections and presence in national and state legislatures.
5.1. Voter Registration and Turnout
With every election, there is no shortage of reports on a dormant Latino voting bloc
with the power to swing the balance to one party or another. However, these
expectations have never materialized. This was the case in the 2016 presidential
election: predictions of increased turnout (Gross 2016) did not come true. First,
Hispanic voter registration (57.3%) decreased slightly with respect to the 2012
elections, below the average (61.4%), white registration (73.9%), and black
10 In addition to these 435 state representatives, there will also be one representative for
Washington, D.C., and five delegates (Guam, Islas Marianas, the U.S. Virgin Islands, Puerto Rico,
and Samoa).

© Rosana Hernández. Francisco Moreno-Fernández (dir.)
Hispanic Map of the United States 2018
Informes del Observatorio / Observatorio Reports. 044-10/2018EN
ISSN: 2373-874X (online) doi: 10.15427/OR044-10/2018EN
Cervantes Institute at FAS - Harvard University © Cervantes Institute at the Faculty of Arts and Sciences of Harvard University
34
registration (69.4%); only the Asian population had a lower voter registration rate
(56.3%) (U.S. Census Bureau 2017, Table 11). Second, Hispanic voter turnout was
also slightly lower than in 2012, at 47.6% (48% in 2012), compared with a national
average of 61.4% (61.8% in 2012).
An analysis of voter registration and turnout makes it possible to identify the
evolution of electoral behavior among the U.S. population in general and the U.S.
Hispanic population in particular. Voter registration is typically around 70% for
presidential elections and 60% for midterm elections. These rates are always lower
among the Hispanic population, with differences of between 12 and 15% in
presidential elections and 25 to 30% in midterm elections: thus, in 2014, 59.3%
of the U.S. population was registered to vote, as versus 34.9% of the Latino
subgroup.
Figure 17. Voter registration rates in presidential and midterm elections (striped bars),
1978-2016. Source: U.S. Census Bureau n.d.-c: Tables A-6 and A-8.
0
10
20
30
40
50
60
70
80
1978
1980
1982
1984
1986
1988
1990
1992
1994
1996
1998
2000
2002
2004
2006
2008
2010
2012
2014
2016
Average Hispanics

© Rosana Hernández. Francisco Moreno-Fernández (dir.)
Hispanic Map of the United States 2018
Informes del Observatorio / Observatorio Reports. 044-10/2018EN
ISSN: 2373-874X (online) doi: 10.15427/OR044-10/2018EN
Cervantes Institute at FAS - Harvard University © Cervantes Institute at the Faculty of Arts and Sciences of Harvard University
35
UnidosUS, the largest Hispanic organization in the U.S., aware of the major gap
between Hispanics and other groups, has demanded effective steps to increase
voter registration and an increase in investment to encourage registered voters to
participate (UnidosUS and California Civic Engagement Project 2018).
Turnout disparities affect both presidential and midterm elections, though the
effect is less drastic in the former. In presidential elections, Hispanic turnout is
typically between 13 and 18 points below the national average; the smallest gap
was in 2018 when Hispanic turnout was 13.7 points lower than the average. In
midterm elections, discrepancies in turnout are between 20 and 25 points lower
than the national average. Furthermore, as is clear from figure 18, turnout for
midterm elections among both the general population and the Hispanic population
is typically 20 to 30 points lower than for presidential elections. For example, in the
2012 presidential election, 61.8% of the national population and 48% of the
Hispanic population voted, while in the 2014 midterms, those percentages
decreased to 38.5% and 18.4%, respectively.
Figure 18. Voter turnout in presidential and midterm elections (striped bars), 1978-2016.
Source: U.S. Census Bureau n.d.-c: Tables A-6 and A-7.
0
10
20
30
40
50
60
70
80
1978
1980
1982
1984
1986
1988
1990
1992
1994
1996
1998
2000
2002
2004
2006
2008
2010
2012
2014
2016
Average Hispanics

© Rosana Hernández. Francisco Moreno-Fernández (dir.)
Hispanic Map of the United States 2018
Informes del Observatorio / Observatorio Reports. 044-10/2018EN
ISSN: 2373-874X (online) doi: 10.15427/OR044-10/2018EN
Cervantes Institute at FAS - Harvard University © Cervantes Institute at the Faculty of Arts and Sciences of Harvard University
36
According to DeSipio and De la Garza (2002), the demographic characteristics of
the Hispanic population help explain the turnout gap between Latinos, the U.S.
average, and other groups: in any sort of population, young people, people with
less education, as well as people with lower incomes, are less probable to vote;
these groups are all overrepresented in the Hispanic population.
If the trends reflected in these figures continue, Hispanic voter registration and
turnout can be expected to be notably lower than the national average on
November 6th of this year; furthermore, in if the usual patterns apply, turnout will
be at least 25% lower than the recorded turnout for 2016.
To take control of the Senate, the Democratic Party must win 28 of the 33 seats
being selected in November; that is, the 26 Democratic senators currently running
for reelection must win, and Democrats must win two additional seats currently
held by Republicans. The Republican Party will hold control of the Senate if it wins
nine elections (Lee and Parlapiano 2018). As for the House of Representatives, in
which every member must run for reelection every two years, Democrats must add
24 seats to their current 194. According to The New York Times, based on
estimates by three organizations,11 seats for 48 of the 435 districts are
competitive: of those, 41 are currently held by Democrats and seven are held by
Republicans (Lee 2018).
Could Latino voters play a decisive role in the House elections? UnidosUS has
identified a total of 25 competitive congressional districts in the 2018 elections in
which Latinos represent at least 6% of the voting-age population. In 24 of those
districts, the voting Latino population was greater than the margin of victory
between the two candidates in the 2016 presidential election (UnidosUS and
California Civic Engagement Project 2018): they are Arizona's 1st and 2nd districts;
11 Cook Political Report, Inside Elections with Nathan L. Gonzales and the University of Virginia’s
Center for Politics.

© Rosana Hernández. Francisco Moreno-Fernández (dir.)
Hispanic Map of the United States 2018
Informes del Observatorio / Observatorio Reports. 044-10/2018EN
ISSN: 2373-874X (online) doi: 10.15427/OR044-10/2018EN
Cervantes Institute at FAS - Harvard University © Cervantes Institute at the Faculty of Arts and Sciences of Harvard University
37
California's 10th, 25th, 39th, 45th, 48th, and 49th; Colorado's 6th; Florida's 18th,
26th, and 27th; Illinois’ 6th and 14th; New Jersey's 7th and 11th; New Mexico's
2nd; Nevada's 3rd; New York's 11th; Texas's 7th, 23rd, and 32nd; Utah's 4th; and
Washington's 8th. That said, as indicated above, the tendency towards low
midterm voter registration and turnout among Hispanics may diminish this
potential influence.
5.2. Latino Representatives
Latinos remain far from having their demographic presence proportionally
reflected in the national legislative bodies. Although Hispanics make up 18.1% of
the national population, there are only four Hispanic senators (4% of the total).
Marco Rubio (Rep. FL); Catherine Cortez Masto (Dem. NV); Robert Menendez (Dem.
NJ), and Ted Cruz (Rep. TX). The seats currently held by Menendez and Cruz are
among those up for grabs on November 6th, and both senators are running for
reelection. Although there is a greater Hispanic presence in the House of
Representatives, it is still far from reflecting the demographics of the country. The
34 Hispanic members of the House (7.8%) are distributed as follows, by state:12
Arizona (2), California (12), Florida (4); Idaho (1); Illinois (1); New Jersey (1); New
Mexico (2); Nevada (1); New York (3); Texas (5); Washington (1); and West Virginia
(1) (NALEO Educational Fund 2017a).
12The number of representatives in the House for each state is determined by the population of the
same. Every state is represented by two senators, regardless of that state’s population.

© Rosana Hernández. Francisco Moreno-Fernández (dir.)
Hispanic Map of the United States 2018
Informes del Observatorio / Observatorio Reports. 044-10/2018EN
ISSN: 2373-874X (online) doi: 10.15427/OR044-10/2018EN
Cervantes Institute at FAS - Harvard University © Cervantes Institute at the Faculty of Arts and Sciences of Harvard University
38
Figure 19. Representatives in the U.S. House of Representatives and Senate. Source:
NALEO Educational Fund 2017a.
The situation is different in state legislative bodies. Only in three cases the
percentage of Hispanic representatives is the same or higher than the percentage
of the Latino population, but the differences, at least in states with a greater
Hispanic presence, are far less drastic. In 2017, there were 243 Hispanics in the
lower state houses (194 Democrats and 49 Republicans) and 79 state senators
(69 Democrats and ten Republicans) (NALEO Educational Fund 2017b). The three
states where the Hispanic representation in the legislature is greater than the
Hispanic presence in the population13 are Hawaii (16% of the State Senate, 10.4%
of the population); Michigan (5.45% of the State House of Representatives, 5% of
the population); and West Virginia (2% of the State House of Representatives and
2.94% of the State Senate, 1.5% of the population). In general, lesser differences
can be found in states where Hispanics make up a smaller percentage of the total
population: the five states with the least divergence between percentage of
Hispanic residents and percentage of representatives in the lower house are
Vermont (1.2% difference), Maine (no Hispanic representatives), and Ohio (1.7%).
Conversely, the greatest disparities appear in the states with the largest Hispanic
presence: Texas (14.4% lower), California (12.7% lower), and Idaho (no
representatives despite a population that is 12.3% Hispanic). This trend is also
13 These population percentages are drawn from 2016 data by the American Community Survey
(ACS), table PEPASR6H.
© Rosana Hernández. Francisco Moreno-Fernández (dir.)
Hispanic Map of the United States 2018
Informes del Observatorio / Observatorio Reports. 044-10/2018EN
ISSN: 2373-874X (online) doi: 10.15427/OR044-10/2018EN
Cervantes Institute at FAS - Harvard University © Cervantes Institute at the Faculty of Arts and Sciences of Harvard University
39
present in state senates, where there is a 28.9% difference in California, a 19%
difference in Nevada, and a 16.5% difference in Texas, versus a 0.9% difference in
Kentucky, a 1.2% difference in Missouri, and Maine, which has no Hispanic state
senators.
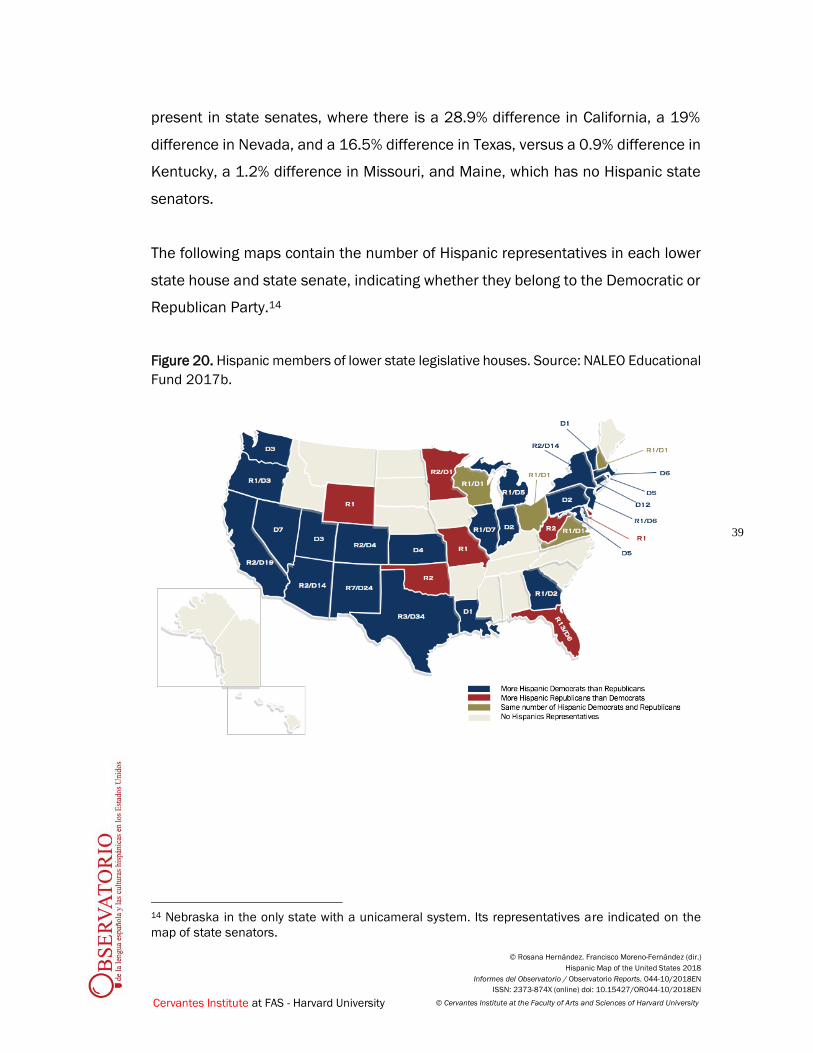
The following maps contain the number of Hispanic representatives in each lower
state house and state senate, indicating whether they belong to the Democratic or
Republican Party.14
Figure 20. Hispanic members of lower state legislative houses. Source: NALEO Educational
Fund 2017b.
14 Nebraska in the only state with a unicameral system. Its representatives are indicated on the
map of state senators.

© Rosana Hernández. Francisco Moreno-Fernández (dir.)
Hispanic Map of the United States 2018
Informes del Observatorio / Observatorio Reports. 044-10/2018EN
ISSN: 2373-874X (online) doi: 10.15427/OR044-10/2018EN
Cervantes Institute at FAS - Harvard University © Cervantes Institute at the Faculty of Arts and Sciences of Harvard University
40
Figure 21. Hispanic members of state senates. Source: NALEO Educational Fund 2017b.
The oldest available data is from 1984, when the NALEO Directory of Latino Elected
Officials accounted for 119 Hispanics in lower state legislative houses and state
senates.15 In 2017, that figure was 322, reflecting a 170.1% increase; from 1980
to 2017, the Hispanic population in the U.S. increased by 303.4%.
5.3. Spanish in U.S. Politics
The use of Spanish in election campaigns seems to have a clear impact on Hispanic
voter turnout. According to a study by Latino Decisions, exposure to Spanish-
language ads increases turnout among Latinos and increases the odds that the
voter will vote for the party that produces the ad (Barreto and Wilcox-Archuleta
2018). It is understandable, then, that some political candidates choose to use
Spanish in their campaigns, such as Tim Kaine, the Democratic candidate for vice
president in 2016, who gave an entire speech in Spanish in Miami (Florida), or the
15 No data exists that differentiates between representatives and senators, nor by state.

© Rosana Hernández. Francisco Moreno-Fernández (dir.)
Hispanic Map of the United States 2018
Informes del Observatorio / Observatorio Reports. 044-10/2018EN
ISSN: 2373-874X (online) doi: 10.15427/OR044-10/2018EN
Cervantes Institute at FAS - Harvard University © Cervantes Institute at the Faculty of Arts and Sciences of Harvard University
41
Republican senator from Texas, Ted Cruz, who used Spanish in a televised debate
during the Republican primaries that same year.
Outside of election campaigns, according to an analysis by Univision16 (Peinado
and Melgar 2017), 15 of the 34 congress people in Hispanic-majority districts did
not provide any information in Spanish on their webpages, and 16 did not use
Spanish on their Twitter or Facebook profiles. In the Senate, the websites of nine
of the 18 senators who represent the nine states with the highest percentage of
Hispanics did not have any information in Spanish, and 11 did not use Spanish on
their social networks.
As for the use of Spanish in communications from the White House, the Spanish
version of the White House website ceased to be available on January 20, 2017,
the day that Donald Trump was sworn in as president of the U.S. Although the
Director of Media Affairs, Helen Aguirre, explained that they were working on that
content (Bierman 2017), the Spanish version of the website has still not been
reactivated. According to a survey by the Observatory of the Cervantes Institute at
Harvard University, 55.4% of Hispanics indicated that the White House shutting
down its Spanish website was part of an English-only policy, while 40.8% attributed
it to the Republican ideology, and 40% to the elimination of linguistic diversity
(Hernández-Nieto and Moreno-Fernández 2017).
The Spanish version of the White House website was launched during the George
W. Bush administration and maintained during Barack Obama's two terms, along
with the Head of Hispanic Media Communications, which was also eliminated by
the current administration (Associated Press 2017). The White House Twitter
account (@LaCasaBlanca) is still active, but its posts are sporadic and are not
aligned with the official English profile. The current U.S. president already made his
16 This analysis is based on social media use in August 2017 and the information available on the
officials’ websites in that same month.

© Rosana Hernández. Francisco Moreno-Fernández (dir.)
Hispanic Map of the United States 2018
Informes del Observatorio / Observatorio Reports. 044-10/2018EN
ISSN: 2373-874X (online) doi: 10.15427/OR044-10/2018EN
Cervantes Institute at FAS - Harvard University © Cervantes Institute at the Faculty of Arts and Sciences of Harvard University
42
position on Spanish clear during his primary campaign for the Republican
nomination in 2015, when, in a debate with the other candidates, and in response
to another candidate, Jeb Bush, using Spanish, Donald Trump stated that “This is
a country where we speak English, not Spanish” (CNN 2015).
The president’s position, however, is nothing new in U.S. politics; it fits well within
the arguments of lobby groups like U.S. English, which advocates for the use of
English as the nation’s sole language and as a point of unity for the country. This
notion is also reflected in several state laws that declare English as the official
language and that, in one way or another, reflect the linguistic situation of official
U.S. processes: English is the national language, and only in certain very narrowly
defined situations does the government consider using other languages
(Hernández 2019).
6. Media, Film, and Social Networks
• In 2016, 54% of Hispanics consumed news in both English and Spanish, 29%
consumed news only in English, and 17% consumed news only in Spanish.
• The Spanish-language news audience for the two largest Hispanic television
groups, Univision and Telemundo, continued to shrink in 2017.
• Hispanics represent 23% of individuals who go to the movies at least once per
month, and the average annual Hispanic movie attendance in 2016 was 4.6.
• 72% of Hispanics are on social networks, and Facebook, YouTube, and WhatsApp
are more popular among Hispanics than among other groups within the U.S.
population.
The demographic changes in the Hispanic population in the last few years (see Part
1), with a decrease in Latin American immigration and an increase in Latinos born
in the U.S., have led to an increase in English monolingualism and English-Spanish

© Rosana Hernández. Francisco Moreno-Fernández (dir.)
Hispanic Map of the United States 2018
Informes del Observatorio / Observatorio Reports. 044-10/2018EN
ISSN: 2373-874X (online) doi: 10.15427/OR044-10/2018EN
Cervantes Institute at FAS - Harvard University © Cervantes Institute at the Faculty of Arts and Sciences of Harvard University
43
bilingualism. This has translated into an increase in consumption of English-
language news, which has, in turn, had an impact on the audience revenue of the
major Spanish-language media aimed at Hispanics. According to figures from Pew
Research (Flores and Lopez 2018), 29% of Latinos consumed news only in English
in 2016, 54% consumed news in both English and Spanish, and 17% consumed
news only in Spanish.
Table 2: News consumption among the Latino population by language. Source: Lopez and
Gonzalez-Barreda 2013; Flores and Lopez 2018.
2006 2008 2012 2016
English and Spanish 55% 51% 50% 54%
Only Spanish 22% 27% 35% 29%
Only English 22% 22% 18% 17%
The preference for Spanish is increasing for those born abroad, with 89%
consuming at least some news in Spanish, while among millennials, there is a
contrary trend: 91% report consuming at least some news in English, compared to
68% who consume at least some news in Spanish (ibid.). In any case, as can be
seen in table 2, there is no easily discernible pattern.
6.1. Television
The Spanish-language television audience continued to decline in 2017. Although
Univision’s revenue remained constant, at around $3 billion (Pew Research
2018b),17 both Univision and Telemundo, the main Spanish-language television
channels, saw notable losses to their news audiences: the audience during the
afternoon time slot (4 p.m. to 7 p.m.) dropped by a total of 6%, 1.1 million fewer
viewers for Univision and around 700,000 fewer for Telemundo; the late-night time
slot (11 p.m. to 2 a.m.) decreased by 7% for Univision and 5% for Telemundo.
Finally, Univision had a major drop (17%) in its morning time slot audience (6 a.m.
to 9 a.m.). This drop also affects the viewership of these channels’ news affiliates:
17 No data available for Telemundo.

© Rosana Hernández. Francisco Moreno-Fernández (dir.)
Hispanic Map of the United States 2018
Informes del Observatorio / Observatorio Reports. 044-10/2018EN
ISSN: 2373-874X (online) doi: 10.15427/OR044-10/2018EN
Cervantes Institute at FAS - Harvard University © Cervantes Institute at the Faculty of Arts and Sciences of Harvard University
44
Univision’s have lost 35% of their late-night news audience and 8% of their morning
news audience; Telemundo has lost 2% of their late-night news audience, 6% of
their afternoon news audience, and 11% of their morning news audience.
Although the change in Pew Research’s source of audience data18 makes it difficult
to compare the last two years with preceding years, earlier figures showed a drop
in Univision’s audience and that of its affiliate channels beginning in 2013, while
at Telemundo, the drops began in 2014 and, in the case of “Noticiero Telemundo,”
the audience grew (Pew Research 2017a).
However, this data only covers news programs, which prevents us from making a
broader generalization about Spanish TV chains’ audiences. While the most
popular news programs (the Univision afternoon time slot) had 1.14 million viewers
in 2017 (Pew Research 2018b), the audience for all of the ten most viewed regular
Spanish programs in 2017 exceeded 2 million (Statista 2018a).
Figure 22. Most viewed regular Spanish programs in the U.S., 2017 (millions of viewers)
Source: Statista 2018a.
18 From Nielsen comScore TV Essentials and comScore StationView Essentials.
2.10 2.15 2.20 2.25 2.30 2.35 2.40
Color de la Pasión (Monday) (Univisión)
Color de la Pasión (Thursday) (Univisión)
Color de la Pasión (Friday) (Univ isión)
Color de la Pasión (Wednesday) (Univisión)
Color de la Pasión (Tuesday) (Univisión)
Vino el Amor (Monday) (Univisión)
El Chema (Monday) (Telemundo)
Vino el Amor (Tuesday) (Univisión)
José de Egipto (Monday) (Univisión)
Señor de los Cielos (Telemundo)

© Rosana Hernández. Francisco Moreno-Fernández (dir.)
Hispanic Map of the United States 2018
Informes del Observatorio / Observatorio Reports. 044-10/2018EN
ISSN: 2373-874X (online) doi: 10.15427/OR044-10/2018EN
Cervantes Institute at FAS - Harvard University © Cervantes Institute at the Faculty of Arts and Sciences of Harvard University
45
6.2. Radio
In 2017, Spanish-language news radio stations saw a 4% drop in their average
income with respect to the previous year (from $1.26 million to $1.21 million) (Pew
Research 2018b). As for Spanish-language radio advertising, the latest available
data is from 2015 (Statista 2017a) and indicates an annual average of $855,000,
following a steady decline since 2007, when they exceeded $1.5 million.
Every week, 42.4 million Hispanics listen to national radio, averaging 12 hours and
50 minutes of listening time. The Latino audience represents 17% of the total
radio-listening population (Nielsen 2017), a percentage that approaches the
group’s demographic weight (currently 18.1%). According to Nielsen, the preferred
format among Hispanic radio listeners is regional Mexican, except among those
ages 12 to 17, who prefer pop hits, and among Hispanics whose dominant
language is English, who prefer English-language music, news, commentary, and
country music. The regional Mexican format—that is, musical styles from Mexico—
prevails among Spanish-language radio stations, second only to stations with
religious programming (González-Tosat 2017).
6.3. Press and Online Media
The average circulation of Hispanic newspapers decreased in 2017, including for
dailies, weeklies, and semi-weeklies (Pew Research 2018b). In terms of daily
papers, the three for which data is available reveal an 18% drop (ibid.) on top of
the decline in circulation that has been noted for several years.

© Rosana Hernández. Francisco Moreno-Fernández (dir.)
Hispanic Map of the United States 2018
Informes del Observatorio / Observatorio Reports. 044-10/2018EN
ISSN: 2373-874X (online) doi: 10.15427/OR044-10/2018EN
Cervantes Institute at FAS - Harvard University © Cervantes Institute at the Faculty of Arts and Sciences of Harvard University
46
Figure 23. Circulation of Hispanic newspapers (average Monday to Friday circulation).
Source: Pew Research 2018b.
Data on the 20 Hispanic weeklies and semi-weeklies with the widest circulation
suggests a far more moderate decline, with circulation dropping by 0.3% between
2016 and 2017, and by 8.7% since 2013 (Pew Research 2018b).
Like the rest of the population, the percentage of Latinos getting their news online
has increased from 37% in 2006 to 74% in 2016 (Flores and Lopez 2018), in
tandem with a decrease in the percentage who get their news from television (from
92% to 79%), radio (from 64% to 55%), and newspapers (from 58% to 34%). The
Observatory of the Cervantes Institute at Harvard University has identified a total
of 321 U.S.-based online newspapers in Spanish across 39 states and Washington
D.C. (González-Tosat 2015).
6.4. Online Platforms
According to data from Morning Consult gathered by Statista (2018), 73% of
Hispanics subscribe to or have access to Netflix, making them the group that most
uses this online video content platform, ahead of African Americans (65%), whites
0
10,000
20,000
30,000
40,000
50,000
60,000
70,000
2014 2015 2016 2017
El Nuevo Heraldo (Brownsville, Texas) El Nuevo Herald (Miami)
La Opinión (Los Ángeles) El Diar io La Prensa (Nueva York)

© Rosana Hernández. Francisco Moreno-Fernández (dir.)
Hispanic Map of the United States 2018
Informes del Observatorio / Observatorio Reports. 044-10/2018EN
ISSN: 2373-874X (online) doi: 10.15427/OR044-10/2018EN
Cervantes Institute at FAS - Harvard University © Cervantes Institute at the Faculty of Arts and Sciences of Harvard University
47
(58%), and other groups (69%). It is also the most popular video content provider
among Hispanics: according to data from March 2017, 51% of those surveyed
indicated Netflix as one of the platforms they use, followed by cable television
(43%), YouTube (39%), and satellite television (30%) (Statista 2018c).
Furthermore, Hispanics use Netflix most frequently, with 32% accessing the
platform several times a day, compared to 21% of the white population, 26% of the
African American population, and 29% of other groups (Statista 2018d).
6.5. Film
Hispanics represent 23% of individuals who go to the movies at least once per
month (Motion Picture Association of America 2017). In 2016, 8.3 million Latinos
saw a film every month, versus 18.3 million Caucasians, 5.6 million African
Americans, and 3.9 million Asians. The Hispanic population is also slightly
overrepresented among moviegoers with respect to its demographic weight,
independent of frequency and tickets sold, making up 20% of attendees and 21%
of tickets sold. The percentage of moviegoers who are Hispanic has remained
stable in recent years, though the number of tickets sold to Hispanics has
decreased slightly since 2012 (ibid.). Average annual movie attendance among
Hispanics has gradually decreased since 2012; it reached 4.6 in 2016. On the
other hand, for the group “Asian/other,” that figure has grown from four times a
year in 2012 to 6.1 in 2016.

© Rosana Hernández. Francisco Moreno-Fernández (dir.)
Hispanic Map of the United States 2018
Informes del Observatorio / Observatorio Reports. 044-10/2018EN
ISSN: 2373-874X (online) doi: 10.15427/OR044-10/2018EN
Cervantes Institute at FAS - Harvard University © Cervantes Institute at the Faculty of Arts and Sciences of Harvard University
48
Figure 24. Per-capita movie attendance by ethnicity. Source: Motion Picture Association of
America 2016.
Twenty-six percent of the audience for Finding Dory, one of the highest-grossing
films of the year, was Hispanic, the highest figure for any film in 2016. Given that
this report is based on figures from 2016, it does not account for Coco, a Pixar
production about the Mexican Day of the Dead celebration, which became the 13th
highest-grossing film in the U.S. and the 11th highest-grossing worldwide. Beyond
its box-office success, Coco, which hit theaters at a moment in which anti-Hispanic
rhetoric was gaining ground in public discourse in the wake of statements and
policies of President Donald Trump, included a number of Hispanic consultants on
its production team (including, among others, the film’s codirector, Adrian Molina;
Ugwu 2017), trying to achieve an approach to Mexican culture that would avoid
accusations of cultural appropriation. Furthermore, Coco’s audience heard
characters speak in Spanish, at times without subtitles (ibid.), and heard those
same characters speak English with various accents; most of the voice actors for
the Spanish-language dubbed version of the film were Mexican, including Gael
García Bernal and Anthony González.
3.63.8
6.4
4
3.4
4.2
6
4.3
3.2
3.6
5.1 5.2
3.4 3.5
5.24.9
3.2
4.2
4.6
6.1
0
1
2
3
4
5
6
7
Caucasian African American Hispanic Asian/Others
2012 2013 2014 2015 2016

© Rosana Hernández. Francisco Moreno-Fernández (dir.)
Hispanic Map of the United States 2018
Informes del Observatorio / Observatorio Reports. 044-10/2018EN
ISSN: 2373-874X (online) doi: 10.15427/OR044-10/2018EN
Cervantes Institute at FAS - Harvard University © Cervantes Institute at the Faculty of Arts and Sciences of Harvard University
49
That said, Hispanics are not a common sight on the silver screen. According to
analysis by the USC Annenberg School for Communication and Journalism (Smith,
Choueiti, and Pieper 2016), of all the films, programs, and TV series produced by
the ten largest media companies, only 5.8% of characters with names or dialogue
are Hispanic. Furthermore, when Latino characters do appear on-screen, they are
often typically associated with negative stereotypes: for example, 50% of fictional
Latino immigrants appear committing an illegal act, as versus 9% of white
immigrants (Villafañe 2017).
6.7. Social Media
Social media use among Hispanics is slightly higher than among other groups: 72%
of Latinos use social media, as versus 68% of the white population and 69% of the
black population (Pew Research 2018c). As is clear from table 3, it is possible to
find differences among racial and ethnic groups in their use of different platforms.
Table 3: Percent of adults using each social media platform. Source: Pew Research
(2018c).
White population Black population Hispanic population
Facebook 67% 70% 73%
Instagram 32% 43% 38%
LinkedIn 26% 28% 13%
Twitter 24% 26% 20%
Pinterest 32% 23% 23%
Snapchat 24% 36% 31%
YouTube 71% 76% 78%
WhatsApp 14% 21% 49%
Hispanics use Facebook, YouTube, and WhatsApp more, and LinkedIn less, than
the white and black populations. In terms of WhatsApp, this disparity could largely
be explained by differences in cell phone services and rates (Quirós 2015).

© Rosana Hernández. Francisco Moreno-Fernández (dir.)
Hispanic Map of the United States 2018
Informes del Observatorio / Observatorio Reports. 044-10/2018EN
ISSN: 2373-874X (online) doi: 10.15427/OR044-10/2018EN
Cervantes Institute at FAS - Harvard University © Cervantes Institute at the Faculty of Arts and Sciences of Harvard University
50
In terms of Hispanics’ preferred language on social media, in the case of Facebook,
38.5% use Spanish as their main language, 34.6% use English, and 26.9% use the
site bilingually (Facebook n.d.).19
Conclusions
Ever since branches of the U.S. government began gathering data specifically on
the Hispanic or Latino population, that group has only improved according to every
metric. The group’s spectacular demographic growth has been complemented by
an improvement in average education level, an increase in per-capita income, and
a decrease in the percent of the population living below the poverty level. The rates
at which Latinos own their own home, are covered by health insurance, and own
their own businesses have all increased. In the long run, and in isolation, the past
50 years tell a story of success for Hispanics in the U.S. The table below
summarizes the progress of the main indicators reviewed in this report.
Table 4. Demographic, linguistic, educational, and socioeconomic indicators for the
Hispanic population in the U.S.
Indicator Indicator, date 1 Indicator, date 2 Difference
Hispanic population
9.1 million
(1970, U.S. Census
Bureau n.d.).
58.9 million
(2017, U.S. Census
Bureau 2018a).
+ 49.8 million
(+ 547.2%)
Percent Hispanic
4.5%
(1970, U.S. Census
Bureau n.d.).
18.1%
(2017, U.S. Census
Bureau 2018a).
+ 13.6%
Immigrant population
by birthplace
908,309
(1960s, Migration
Policy Institute n.d.).
22,294,730
(2016, Migration
Policy Institute n.d.).
+ 21,386,421
(+ 2,454%)
Spanish speakers
11.12 million
(1980, Ortman and
Shin 2011).
41 million
(U.S. Census
Bureau/American
FactFinder 2018:
C16006; C16005)
+ 29.88 million
(+ 238.7%)
19 Facebook's “Monthly Active Users” include anyone who has logged into and used Facebook within
one month.

© Rosana Hernández. Francisco Moreno-Fernández (dir.)
Hispanic Map of the United States 2018
Informes del Observatorio / Observatorio Reports. 044-10/2018EN
ISSN: 2373-874X (online) doi: 10.15427/OR044-10/2018EN
Cervantes Institute at FAS - Harvard University © Cervantes Institute at the Faculty of Arts and Sciences of Harvard University
51
Indicator Indicator, date 1 Indicator, date 2 Difference
Students enrolled in
university Spanish
courses
126,303
(1958, Looney and
Lusin 2018)
712,240
(2016, Looney and
Lusin 2018)
+ 585,937
(+ 464%)
Percent of the
population (18-24
years old) that has
finished secondary
school
59%
(1992, National
Center for Education
Statistics 2017)
88%
2016, National
Center for Education
Statistics 2017)
+ 29%
Secondary school
dropout rate
29.4%
(1992, NCES 2017:
219.70)
8.6%
(2016, NCES 2017:
219.70)
- 20.8%
Percent of the
population with
completed university
studies
9.3%
(1992, NCES 2017.
104.10).
17.2%
(2017, NCES 2017.
104.10).
+ 7.9%
Per-capita income
$12,136
(1973, U.S. Census
Bureau n.d.-b)
$20,937
(1973, U.S. Census
Bureau n.d.-b)
8,801 (+72.5%)
Percent of population
living below the
poverty level
22.8%
(1972, U.S. Census
Bureau 2018b).
18.3%
(2017, U.S. Census
Bureau 2018b).
- 4.5%
However, these achievements are dimmed by the comparative performance of
other groups and the national average. The percent of Hispanics aged 18 to 24
who had completed their secondary education has increased by 29% since 1990,
reaching 59%, yet it remains 34% lower than the national average. The dropout
rate at this education level has decreased by 20 percentage points since 1992,
but it remains 2.5% below the national average. Hispanics complete post-
secondary university degrees at a rate of 7.9%, 4.9 points lower than the national
average.
The situation is worse when we turn to socioeconomic benchmarks: average
income has improved, but it remains at nearly half that of the non-Hispanic white
and Asian populations, and below that of the black population. The homeownership
rate is lower than that of all other groups except for African Americans. Finally, the
percent of the Hispanic population living at or below the poverty level is more than
ten points higher than that of the white and Asian populations, and lower only than
the African American population. The homeownership rate is lower than that of all
other groups except, again, for African Americans.

© Rosana Hernández. Francisco Moreno-Fernández (dir.)
Hispanic Map of the United States 2018
Informes del Observatorio / Observatorio Reports. 044-10/2018EN
ISSN: 2373-874X (online) doi: 10.15427/OR044-10/2018EN
Cervantes Institute at FAS - Harvard University © Cervantes Institute at the Faculty of Arts and Sciences of Harvard University
52
In areas such as poverty, voter registration, and voter turnout, the behavior of the
Hispanic population is mainly the same as the general population’s. Thus, the few
advances in the past few decades have been the same advances experienced by
all other groups. Voter registration and turnout in both presidential and midterm
elections have only increased slightly, and, in a few cases, have decreased, both
among Latinos and in the general population. As there are major disparities in
registration, if the performance of the Latino population remains the same as the
general population’s, these disparities will remain.
All of these comparisons are based on the Hispanic population in general. If we
break the analysis down by place of birth—that is, drawing a distinction between
Latinos born in the U.S. and those born abroad—divergences between the latter
and all other demographics are greater in every category. To give one example,
while 18% of U.S.-born Latinos do not have health insurance, that figure reaches
49% for those born abroad.
The drop in migration from Latin America, and specifically from Mexico, means that
the proportion of U.S. born Hispanics in the total Latino population is increasing.
As this U.S.-born group has better educational and socioeconomic results than the
group born abroad, it is appropriate to expect that, in keeping with this evolution,
the overall situation of the Hispanic population will improve: the rates at which
young people finish secondary school and university degrees will climb, the
percentage of the population without insurance will decrease, and the number of
Hispanics with the right to vote will increase.
Language, however, is one category in which the future is unclear for the U.S.-born
Hispanic population. As with other languages, proficiency in Spanish gives way to
English as the generations advance, either through bilingualism or English
monolingualism. Spanish is the dominant language of 61% of Hispanics born
abroad, while only 7% of this same group speaks mainly in English. By the third

© Rosana Hernández. Francisco Moreno-Fernández (dir.)
Hispanic Map of the United States 2018
Informes del Observatorio / Observatorio Reports. 044-10/2018EN
ISSN: 2373-874X (online) doi: 10.15427/OR044-10/2018EN
Cervantes Institute at FAS - Harvard University © Cervantes Institute at the Faculty of Arts and Sciences of Harvard University
53
generation, 75% speak mainly English and 24% are bilingual (Lopez, Gonzalez-
Barreda, and López 2017). It stands to reason, then, that as the population arriving
from Latin America decreases, so will the number of Spanish speakers in the U.S.,
despite the fact that 95% of Latinos believe that maintaining the language is
important for future generations (Taylor, Lopez, Martínez, and Velasco 2012).
Furthermore, the issue of language is linked to other questions that are established
around the Latino population and the Latino identity. For 70% of the population,
speaking English is a key aspect of the U.S. identity (Stokes 2017); 71% of
Hispanics believe that speaking Spanish is not necessary to be considered as such
(Lopez 2016). Like language, Hispanic self-identification wanes with the
generations (from 97% among those born abroad to 50% among fourth and
subsequent generations; Lopez, Gonzalez-Barreda, and López 2017), a trend that
would curb the use of Spanish in the U.S. even if it were a defining characteristic
for U.S. Hispanics.

© Rosana Hernández. Francisco Moreno-Fernández (dir.)
Hispanic Map of the United States 2018
Informes del Observatorio / Observatorio Reports. 044-10/2018EN
ISSN: 2373-874X (online) doi: 10.15427/OR044-10/2018EN
Cervantes Institute at FAS - Harvard University © Cervantes Institute at the Faculty of Arts and Sciences of Harvard University
54
References
American Councils for International Education (2017). “The National K-12 Foreign
Language Enrollment Survey Report.” http://bit.ly/2xej4AZ [Accessed 24 Aug
2017].
Ashkenas, Jeremy, Haeyoun Park, and Adam Pearce (2017). “Even with Affirmative
Action, Blacks and Hispanics Are More Underrepresented at Top Colleges
Than 35 Years Ago.” The New York Times. http://nyti.ms/2wBoKY5
[Accessed 26 Aug 2017].
Associated Press (2017). “Trump White House continues to neglect Spanish
speakers.” http://bit.ly/2yuFuRT [Accessed 06 Oct 2017].
Batalova, Jeanne, and Jie Zong (2016). “Language Diversity and English Proficiency
in the United States.” Migration Policy Institute. https://bit.ly/2kPL4Fo
[Accessed 03-09-2017].
Barreto, Matt A. and Wilcox-Archuleta, Bryan (2018). “Assessing Spanish Ads and
Latino Turnout.” Latino Decisions. https://bit.ly/2MtOqhK [Accessed 06 Jun
018].
Berchick, Edward, R., Emily Hood, and Jessica C. Barnett (2018). Health Insurance
Coverage in the United States: 2017. Current Population Reports. United
States Census Bureau. https://bit.ly/2OkRUQq [Accessed 22 Sep 2018].
Bierman, Noah (2017). “White House promises website will restore Spanish
content: ‘We’re just building up.’” Los Angeles Times.
http://lat.ms/2wCmsEC [Accessed 06-10-2017].
Box Office Mojo (n.d.). Yearly Box Office. 2017 Worldwide Grosses.
https://bit.ly/2Kclrhm [Accessed 26 Jun 2018].
Bureau of Labor Statistics (2018). Databases, Tables & Calculators by Subject.
Series ID: LNS14000003, LNS14000006, LNS14032183, LNS14000009.
https://bit.ly/2hbEN7I [Accessed 22 Sep 018].
CNN (16 September 2015). “Trump: We speak English here, not Spanish.”
YouTube. https://bit.ly/2hQrk1K [Accessed 06 Jun 2018].
Cohn, D’Vera, Jeffrey S. Passel, and Ana Gonzalez-Barrera (2017). “Rise in U.S.
Immigrants From El Salvador, Guatemala and Honduras Outpaces Growth
from Elsewhere.” Pew Research Center. Hispanic Trends.
https://pewrsr.ch/2FekI9p [Accessed 09 Jul 2018].
© Rosana Hernández. Francisco Moreno-Fernández (dir.)
Hispanic Map of the United States 2018
Informes del Observatorio / Observatorio Reports. 044-10/2018EN
ISSN: 2373-874X (online) doi: 10.15427/OR044-10/2018EN
Cervantes Institute at FAS - Harvard University © Cervantes Institute at the Faculty of Arts and Sciences of Harvard University
55
Colby, Sandra L., and Jennifer M. Ortman (2015). “Projections of the Size and
Composition of the U.S. Population: 2014 to 2060.” U.S. Census Bureau.
http://bit.ly/1G8av78 [Accessed 25-07-2017].
DeSipio, Louis and Rodolfo O. De la Garza (2002). “Forever Seen as New: Latino
Participation in American Elections», in M. M. Suárez-Orozco in M. M. Páez
(eds.), Latinos. Remaking America. California and London: University of
California Press, p. 398-429.
Doty, M., Sophie Beutel, Petra Rasmussen, and Sara Collins (2015). “Latinos Have
Made Coverage Gains but Millions are Still Uninsured.” The Commonwealth
Fund. http://bit.ly/1GF9ANn [Accessed 10 Jul 2016].
Ennis, Sharon R., Merarys Ríos-Vargas, and Nora G. Albert (2011). “The Hispanic
Population 2010: 2010 Census Brief.” U.S. Census Bureau.
https://bit.ly/2vi7QJB [Accessed 28 Jun 2018].
Facebook (n.d.). “U.S. Hispanic Affinity on Facebook.” https://bit.ly/1D4B6j4
[Accessed 06 Oct 2017].
Fazel-Zarandi, Mohammad M., Jonathan S. Feinstein, and Edward H. Kaplan
(2018). The number of undocumented immigrants in the United States:
Estimates based on demographic modeling with data from 1990 to 2016.
PLoS ONE 13 (9): e0201193. https://bit.ly/2O1EdJf [Accessed 30 Sep
2018].
Fishman, Joshua A. (1992). “The Displaced Anxieties of Anglo-Americans.” In
James Crawford, Language Loyalties: A Source Book on the Official English
Controversy. Chicago: The University of Chicago Press: 165-70.
Flores, Antonio (2017). “How the U.S. Hispanic population is changing.” Pew
Research Center. https://pewrsr.ch/2w40fPs [Accessed 09 Jul 2018].
Flores, Antonio, and Mark Hugo Lopez (2018). “Among U.S. Latinos, the internet
now rivals television as a source for news.” https://pewrsr.ch/2DmSyZe
[Accessed 20 Jul 2018].
Geoscape (2017). “Hispanic Business & Entrepreneurs Drive Growth in the New
Economy: 5th Annual Report 2017.” http://bit.ly/2gOw3Cb [Accessed 10 Oct
2017].
González-Tosat, Clara (2015). “Cibermedios en los Estados Unidos” Informes del
Observatorio/Observatorio Reports IO/OR. Cambridge: Instituto Cervantes at
Harvard University. https://bit.ly/2pxGKNs [Accessed 09 Jul 2017].

© Rosana Hernández. Francisco Moreno-Fernández (dir.)
Hispanic Map of the United States 2018
Informes del Observatorio / Observatorio Reports. 044-10/2018EN
ISSN: 2373-874X (online) doi: 10.15427/OR044-10/2018EN
Cervantes Institute at FAS - Harvard University © Cervantes Institute at the Faculty of Arts and Sciences of Harvard University
56
González-Tosat, Clara (2017). “La radio en español en los Estados Unidos.”
Informes del Observatorio/Observatorio Reports IO/OR. Cambridge: Instituto
Cervantes at Harvard University. http://bit.ly/2xHo40U [Accessed 09 Jul
2017].
Gross, Justin (2016). “Latino Electorate on Track for Historic Turnout In 2016.”
Latino Decisions. http://bit.ly/2yt3IJ7 [Accessed 22 Jul 2017].
Hernández, Rosana (2019). Language Legislation in the United States. A
Nationwide Analysis. Cambridge: Instituto Cervantes at Harvard University.
Hernández-Nieto, Rosana, and Francisco Moreno-Fernández (2017). “Los
hispanos rechazan la desaparición del español en la web de la Casa Blanca.”
http://bit.ly/2nAbbQ0 [Accessed 06 Oct 2017].
Hispanic Association of Colleges and Universities (2018). “2018 Fact Sheet:
Hispanic Higher Education and HSIs.” http://bit.ly/1jeytcj [Accessed 09 Jul
2018].
Hispanic Wealth Project (2018). “State of Hispanic Homeownership Report.”
https://bit.ly/2IoEDDR [Accessed 22 Sep 2018].
Hopkinson, Ashley (2017). “A new era for bilingual education: Explaining
California’s Proposition 58.” EdSource. http://bit.ly/2xY5Vy4 [Accessed 29
Sep 2017].
Kochhar, Rakesh, and Anthony Cilluffo (2018). “Income Inequality in the U.S. is
Rising Most Rapidly Among Asians.” Pew Research Center.
https://pewrsr.ch/2zuLWty [Accessed 15-07-2017].
Krogstad, Jens Manuel (2016). “2016 Electorate Will Be the Most Diverse in the
U.S. History.” Pew Research Center. http://pewrsr.ch/23KPKwo [Accessed
06-06-2016].
Krogstad, Jens Manuel (2017). «U.S. Hispanic population growth has leveled off».
Pew Research Center. http://pewrsr.ch/2hB1NO0 [Accessed 22 Aug 2017].
Krogstad, Jens Manuel, and Mark Hugo Lopez (2017). “Use of Spanish declines
among Latinos in major U.S. metros.” Pew Research Center.
https://pewrsr.ch/2xFmsUN [Accessed 02-03-2018].
Lee, Jasmine C. (2018). To Reclaim the House, Democrats Need to Flip 24 G.O.P.
Seats. 25 Are in Clinton Territory. The New York Times, 26 March 2018.
https://nyti.ms/2GcnZtM [Accessed 22-07-2018].
© Rosana Hernández. Francisco Moreno-Fernández (dir.)
Hispanic Map of the United States 2018
Informes del Observatorio / Observatorio Reports. 044-10/2018EN
ISSN: 2373-874X (online) doi: 10.15427/OR044-10/2018EN
Cervantes Institute at FAS - Harvard University © Cervantes Institute at the Faculty of Arts and Sciences of Harvard University
57
Lee, Jasmine C. and Alicia Parlapiano (2018). Democrats Need to Win 28 Seats to
Control the Senate. Republicans Need Only 9. The New York Times, 27 March
2018. https://nyti.ms/2BMJuyC [Accessed 22 Jul 2018].
Leeman, Jennifer (2018). “Questioning the Language Questions: Federal Policy
and the Evaluation of the U.S. Census Bureau’s Statistics on Language.” U.S.
Census Bureau. Washington, D.C. 20233 Research Report Series. Survey
Methodology #2018-11 https://bit.ly/2MVrhV0 [Accessed 04-06-2018].
Looney, Dennis, and Natalia Lusin (2018). “Enrollments in Languages other than
English in United States Institutions of Higher Education, Summer 2016 and
Fall 2016: Preliminary Report.” Modern Language Association of America.
https://bit.ly/2Fusb3Q [Accessed 06-07-2018].
Lopez, Mark Hugo (2009). “Latinos and Education: Explaining the Attainment Gap.”
Pew Hispanic Center. https://pewrsr.ch/2wp3uTF [Accessed 22 Jul 2018].
Lopez, Mark Hugo (2016). “Is speaking Spanish necessary to be Hispanic? Most
Hispanics say no.” Pew Research Center. http://pewrsr.ch/1LxfvVE
[Accessed 09 Oct 2017].
Lopez, Mark Hugo, and Ana Gonzalez-Barrera (2013). “A growing share of Latinos
get their news in English.” Pew Research Center. http://pewrsr.ch/1iIBeNX
[Accessed 12 Jun 2015].
Lopez, Mark Hugo, Ana Gonzalez-Barrera, and Gustavo López (2017). “Hispanic
Identity Fades Across Generations as Immigrant Connections Fall Away.” Pew
Research Center. Hispanic Trends. https://pewrsr.ch/2ktqkn5 [Accessed 09
Jul 2018].
Lopez, Mark Hugo, Jeffrey Passel, and Molly Rohal (2015). “Modern Immigration
Wave Brings 59 Million to U.S., Driving Population Growth and Change
Through 2065. Views of Immigration’s Impact on U.S. Society Mixed.” Pew
Research Center: Washington D.C. https://pewrsr.ch/2OLNBy3 [Accessed
28 Jun 2018].
Migration Policy Institute (n.d.). “Largest U.S. Immigrant Groups over Time, 1960-
Present.” Migration Policy Institute Data Hub. https://bit.ly/2DUqpZx
[Accessed 27 Jun 2018].
Moreno Fernández, Francisco (2016). “La lengua como dilema hispano.” Política
Exterior, no. 174, November-December: 84-92.
Motion Picture Association of America (2017). “Theatrical Market Statistics 2016.”
https://bit.ly/2I86mJt [Accessed 19-Jun 2018].

© Rosana Hernández. Francisco Moreno-Fernández (dir.)
Hispanic Map of the United States 2018
Informes del Observatorio / Observatorio Reports. 044-10/2018EN
ISSN: 2373-874X (online) doi: 10.15427/OR044-10/2018EN
Cervantes Institute at FAS - Harvard University © Cervantes Institute at the Faculty of Arts and Sciences of Harvard University
58
NALEO Educational Fund (2017a). “National Directory of Latino Elected Officials.”
https://bit.ly/2oiFAoq [Accessed 09 Jul 2018].
——————— (2017b). “National Directory of Latino Elected Officials.” Excel
Database https://bit.ly/2PTGCTE [Accessed 06 Jul 2018].
National Center for Education Statistics, NCES (2017). “Status and Trends in the
Education of Racial and Ethnic Groups 2017.” http://bit.ly/2tNukpn
[Accessed 19 Sep 2017].
National Center for Education Statistics, NCES (2017). Table 104.10. Rates of high
school completion and bachelor’s degree attainment among persons age 25
and over, by race/ethnicity and sex. Selected years, 1910 through 2016.
https://bit.ly/2tHz4tS [Accessed 22 Jul 2018].
——————— Table 104.60. Number of persons 25 to 34 years old and percentage
with bachelor’s or higher degree, by undergraduate field of study, sex,
race/ethnicity, and U.S. nativity and citizen status: 2015.
https://bit.ly/2N3Aesh [Accessed 22 Jul 2018].
——————— Table 209.10. Number and percentage distribution of teachers in
public and private elementary and secondary schools, by selected teacher
characteristics: Selected years, 1987-88 through 2015-16. Available at:
https://bit.ly/2MFPUpl [Accessed 19 Jun 2018].
——————— Table 219.70. Percentage of high school dropouts among persons 16
to 24 years old (status dropout rate), by sex and race/ethnicity. Selected
years, 1960 through 2015. http://bit.ly/2ynfJjd [Accessed 09 Sep 2017].
——————— Table 302.60. Percentage of 18- to 24-year-olds enrolled in college, by
level of institution and sex and race/ethnicity of student: 1970 to 2016.”
https://bit.ly/2MDEEtl [Accessed 22 Jul 2018].
National Hispanic Leadership Agenda (2017). “National Latino Leaders Denounce
American Health Care Act and Its Potentially Devastating Effects on the Latino
Community.” http://bit.ly/2ysKssm [Accessed 12 Sep 2017].
Nielsen (2017). “State of the Media: Audio Today 2017. A Focus on Black &
Hispanic Audiences.” September 2017.
Nielsen (2018). “Descubrimiento digital. The Online Lives of Latinx Consumers.”
https://bit.ly/2wTm8Ua [Accessed 23 Sep 2018].
Ortman, Jennifer M. and Hyon B. Shin (2011). “Language Projection 2010 to
2020.” U.S. Census Bureau: Social, Economic, Housing Division.
http://bit.ly/2aHT3Pb. [Accessed 06 Sep 2016].

© Rosana Hernández. Francisco Moreno-Fernández (dir.)
Hispanic Map of the United States 2018
Informes del Observatorio / Observatorio Reports. 044-10/2018EN
ISSN: 2373-874X (online) doi: 10.15427/OR044-10/2018EN
Cervantes Institute at FAS - Harvard University © Cervantes Institute at the Faculty of Arts and Sciences of Harvard University
59
Peinado, Fernando, and Luis Melgar (2017). “Análisis: Los miembros del Congreso
apenas se comunican en español con los hispanos.” Univisión.
https://bit.ly/2xPeH0x [Accessed 30 Sep 2018].
Pew Research Center (2017a). “State of the News Media 2017.”
https://pewrsr.ch/2MUt34t [Accessed 06 Jun 2018].
Pew Research Center (2017b). “Latinos and the new Trump administration.”
https://pewrsr.ch/2lAcT4t [Accessed 06 Jul 2018].
Pew Research Center (2018a). “Internet/Broadband Fact Sheet.”
https://pewrsr.ch/2kQtkrM [Accessed 22 Sep 2018].
——————— (2018b). “Hispanic and African American News Media Fact Sheet.”
https://pewrsr.ch/2veeuSe [Accessed 20 Sep 2018].
——————— (2018c). “Social Media Fact Sheet.” https://pewrsr.ch/2jmwndT
[Accessed 20 Jul 2018].
Quirós, Luis Diego (14 March 2015). “¿Por qué Whatsapp es tan popular en
América Latina pero en EEUU es casi desconocido?” Revista Summa.
https://bit.ly/2QUMWLR [Accessed 23-08-2018].
Rhodes, Nancy C., and Ingrid Pufahl (2014). Foreign Language Teaching in U.S.
Schools. Results of a National Survey. Washington D.C.: Center for Applied
Linguistics.
Ryan, Camile (2018). “Computer and Internet Use in the United States: 2016.”
American Community Survey Reports. U.S. Census Bureau.
https://bit.ly/2PjrxLV [Accessed 22-09-2018].
Statista (2017a). Advertising revenue at Spanish radio stations in the United States
from 2007 to 2015 (in 1,000 U.S. dollars). https://bit.ly/2yKg6Vb [Accessed
06 Jun 2018].
——————— (2018a). “Leading regularly scheduled Spanish-language TV programs
in the United States in 2017, based on average viewers (in millions).”
https://bit.ly/2zoEX33 [Accessed 06 Jun 2018].
——————— (2018b). “Do you currently subscribe to, or have access to, Netflix?”
——————— (2018c). “Most popular video content providers among Hispanics in
the United States as March of 2017.”
——————— (2018d). “How often do you use Netflix?”
Semega, Jessica L., Kayla R. Fontenot, and Melissa A. Kollar (2017). “Income and
Poverty in the United States: 2016.” U.S. Census Bureau, U.S. Department of
Commerce. http://bit.ly/2f2YwGH [Accessed 15 Sep 2017].

© Rosana Hernández. Francisco Moreno-Fernández (dir.)
Hispanic Map of the United States 2018
Informes del Observatorio / Observatorio Reports. 044-10/2018EN
ISSN: 2373-874X (online) doi: 10.15427/OR044-10/2018EN
Cervantes Institute at FAS - Harvard University © Cervantes Institute at the Faculty of Arts and Sciences of Harvard University
60
Schmidt, Erik P. (2018a). Postsecondary Enrollment Before, During, and Since the
Great Recession. U.S. Census Bureau. Current Population Reports. April,
2018. https://bit.ly/2PPG6XG [Accessed 09 Jul 2018].
——————— (2018b). “For the First Time, 90 Percent Completed High School or
More.” U.S. Census Bureau. https://bit.ly/2wAX2IO [Accessed 09 Aug 2018].
Shapiro, D., A. Dundar, F. Huie, P.K. Wakhungu, X. Yuan, A. Nathan and A.
Bhimdiwali (2017). “Completing College: A National View of Student
Completion Rates – Fall 2011 Cohort.” December 2017, Report 14. Herndon,
VA: National Student Clearinghouse Research Center. https://bit.ly/2Bugs6k
[Accessed 26-08-2018].
Smith, Stacy L.; Marc Choueiti and Katherine Pieper (2016). “Inclusion or
Invisibility? Comprehensive Annenberg Report on Diversity in Entertainment.”
Institute for Diversity and Empowerment at Annenbert (IDEA). USC Annenberg
School for Communication and Journalism. https://bit.ly/2vep7ba [Accessed
26 Jun 2018].
Stepler, Renee and Mark Hugo Lopez (2016). “U.S. Latino Population Growth and
Dispersion Has Slowed Since Onset of the Great Recession.”
http://pewrsr.ch/2cJjdWC [Accessed 04 April 2017].
Stokes, Bruce (2017). “What It Takes to Truly Be ‘One of Us.’” Pew Research
Center. http://pewrsr.ch/2k4P3yk [Accessed 08 Sep 2017]
Taylor, Paul, Mark Hugo López, Jessica Martínez, and Gabriel Velasco (2012).
“When Labels Don’t Fit: Hispanics and their view of identity.” Identity, Pan-
Ethnicity and Race. Pew Research Center. http://pewrsr.ch/Z6T3jU
[Accessed 04-04-2015].
The Washington Post (30 Jan 2014). “Hispanics and the American Dream.”
https://wapo.st/2OMGUeX [Accessed 04 Sep 2018].
Ugwu, Reggie (19 November 2017). “How Pixar Made Sure ‘Coco’ Was Culturally
Conscious.” The New York Times. https://nyti.ms/2ANCi2a [Accessed 26 Jun
2018].
UnidosUS and California Civic Engagement Project (2018). “Midterm Elections:
Latino Vote Hot Spots.” Policy Brief Special Series: Issue Two. July 2018.
https://bit.ly/2wrueSX [Accessed 26 July 2018].
U.S. Census Bureau (2017). Table 11. Reported Voting and Registration Among
Native and Naturalized Citizens, by Race, Hispanic Origin, and Region of Birth:
November 2016. https://bit.ly/2pCONWV [Accessed 27 Sep 2017].

© Rosana Hernández. Francisco Moreno-Fernández (dir.)
Hispanic Map of the United States 2018
Informes del Observatorio / Observatorio Reports. 044-10/2018EN
ISSN: 2373-874X (online) doi: 10.15427/OR044-10/2018EN
Cervantes Institute at FAS - Harvard University © Cervantes Institute at the Faculty of Arts and Sciences of Harvard University
61
U.S. Census Bureau (2018a). “Midwest Home to Most of the Counties with
Decreases in Median Age.” https://bit.ly/2If3TLw [Accessed 28 Jun 2018].
U.S. Census Bureau (2018b). “Historical Poverty Tables: People and Families –
1959 to 2017.” Table 2 http://bit.ly/2w7yp4N [Accessed 22 Sep 2018].
U.S. Census Bureau (2018c). “Housing Vacancies and Homeownership. Table 22.
Homeownership Rates by Race and Ethnicity of Householder: 1994 to
2016.” https://bit.ly/2xKJnz7 [Accessed 22 Jul 2018].
U.S. Census Bureau (n.d.-a). “Who is Hispanic in America?” https://bit.ly/2Mwt4jP
[Accessed 30 Jun 2018].
U.S. Census Bureau (n.d.-b). “Historical Income Tables: People. Table P-1. Total CPS
Population and Per-Capita Income.” https://bit.ly/2eFg7jh [Accessed 22 Jul
2018].
U.S. Census Bureau (n.d.-c). Table A-6. “Reported Voting and Registration for Total
and Citizen Voting-age Population by Race and Hispanic Origin: Presidential
Elections 1980 to 2016.” Last review: January 29, 2018
https://bit.ly/2Pcxrxe [Accessed 22 Jul 2018].
——————— Table A-7. “Reported Voting Rates in Congressional Election Years, by
Selected Characteristics: November 1966 to 2014.” Last review: January 29,
2018 https://bit.ly/2Pcxrxe [Accessed 22 Jul 2018].
——————— Table A-8. “Reported Registration Rates in Congressional Election
Years, by Selected Characteristics: November 1966 to 2014.” Last review:
January 29, 2018 https://bit.ly/2Pcxrxe [Accessed 22 Jul 2018].
U.S. Census Bureau/American FactFinder (2018). “PEPASR6H. Annual Estimates
of the Resident Population by Sex, Age, Race, and Hispanic Origin for the
United States: April 1, 2010 to July 1, 2016.” 2017 American Community
Survey 1-Year Estimates. http://bit.ly/2u6GQA0 [Accessed 15 Sep 2018].
——————— “C16006. Language Spoken at Home by Ability to Speak English for the
Population 5 Years and Over (Hispanic or Latino).” 2017 American
Community Survey 1-Year Estimates. http://bit.ly/2x06R10 [Accessed 20
Sep 2018].
——————— “B03001. Hispanic or Latino Origin by Specific Origin.” 2017 American
Community Survey 1-Year Estimates. http://bit.ly/2xuyEdl [Accessed 22
Sep 2018].
© Rosana Hernández. Francisco Moreno-Fernández (dir.)
Hispanic Map of the United States 2018
Informes del Observatorio / Observatorio Reports. 044-10/2018EN
ISSN: 2373-874X (online) doi: 10.15427/OR044-10/2018EN
Cervantes Institute at FAS - Harvard University © Cervantes Institute at the Faculty of Arts and Sciences of Harvard University
62
——————— “C16005. Nativity by Language Spoken at Home by Ability to Speak
English for the Population 5 Years and Over.” 2017 American Community
Survey 1-Year Estimates. https://bit.ly/2JcHEvn [Accessed 20 Sep 2018].
——————— “B16001. Language Spoken at Home by Ability to Speak English for the
Population 5 Years and Over.” https://bit.ly/2NBlVPR 2017 American
Community Survey 1-Year Estimates. [Accessed 20 Sep 2018].
——————— “S1902. Mean Income in the Past 12 Months (in 2016 Inflation-
Adjusted Dollars).” 2017 American Community Survey 1-Year Estimates.
http://bit.ly/2fvqPdA [Accessed 20 Sep 2018].
Vaznis, James (2017). “New law clears way for bilingual teaching in Mass. Public
schools.” The Boston Globe. https://bit.ly/2tm3DWp [Accessed 12 Dec
2017].
Vespa, Jonathan, David M. Armstrong, and Lauren Medina (2018). Demographic
Turning Points for the United States: Population Projections for 2020 to
2060. U.S. Census Bureau. https://bit.ly/2tL4Auc [Accessed 09 Jun 2018].
Villafañe, Veronica (18 May 2017). “Latino, Black and Middle-Eastern Immigrants
Portrayed as Criminals in TV.” Forbes. https://bit.ly/2MZGVM5 [Accessed 26
Jun 2018].
Weeks, Matt (2018). “UGA report: Asian-Americans see the biggest gains in buying
power.” https://bit.ly/2O2k5qp [Accessed 03 Sep 2018].
Rosana Hernández Instituto Cervantes at Harvard University
Rafael del Pino Foundation
Francisco Moreno-Fernández (dir.) Instituto Cervantes at Harvard University