Hinterland Connections of Seaports - UNECE Homepage · LITERATURE REVIEW ... VIII. DISCUSSION: ......
84
United Nations Economic Commission for Europe Hinterland Connections of Seaports New York and Geneva, 2010
Transcript of Hinterland Connections of Seaports - UNECE Homepage · LITERATURE REVIEW ... VIII. DISCUSSION: ......
United Nations Economic Commission for Europe
Hinterland Connections of Seaports
New York and Geneva, 2010

NOTE The designations employed and the presentation of the material in this publication do not imply the expression of any opinion whatsoever on the part of the Secretariat of the United Nations concerning the legal status of any country, territory, city or area, or of its authorities, or concerning the delimitation of its frontiers or boundaries.
ACKNOWLEDGEMENTS The report was prepared by Dr. Allan Woodburn, University of Westminster, United Kingdom. The author would like to express his thanks to all members of the UNECE Expert Group on Hinterland Connections of Seaports for their input in the course of drafting this report, and to all those who participated in the questionnaire survey that formed a part of this research.
ECE/TRANS/210 UNITED NATIONS PUBLICATION Sales No. E. 10 …. ISBN …
CONTENTS
FOREWORD ................................................................................................................................... iii LIST OF ABBREVIATIONS............................................................................................................. iv EXECUTIVE SUMMARY................................................................................................................. v I. INTRODUCTION ................................................................................................................... 1 II. THE POLICY CONTEXT ....................................................................................................... 3 III. LITERATURE REVIEW ......................................................................................................... 7 IV. THE UNECE PIRAEUS CONFERENCE AND QUESTIONNAIRE SURVEY ....................... 10 V. CONTAINER AND FERRY FREIGHT TRANSPORT ACTIVITY IN THE UNECE REGION 12 VI. KEY ISSUES AND CHALLENGES ....................................................................................... 22 VII. GOOD PRACTICE IN PORT HINTERLAND FLOW EFFICIENCY AND SUSTAINABILITY 29 VIII. DISCUSSION: WHAT SHOULD THE NEXT STEPS BE?.................................................... 41 IX. CONCLUSIONS .................................................................................................................... 43 BIBLIOGRAPHY ............................................................................................................................. 49
ANNEXES I. UNECE QUESTIONNAIRE ......................................................................................................... 54 II. STATISTICAL INFORMATION .................................................................................................. 63 III. LIST OF PARTICIPANTS........................................................................................................... 68
i
LIST OF TABLES Table 1.1: Relationship between study objectives and report structure Table 4.1: Responses to UNECE questionnaire survey Table 5.1: World economic growth, 1991-2008 Table 5.2: Estimated containerized cargo flows on major trade routes Table 5.3: Long-term trends in the cellular container ship fleet Table 5.4: Top ten container lines by slot capacity Table 5.5: Top 20 EU container ports, 2000 – 2006 Table 5.6: Container throughput at selected non-EU ports in the UNECE region, 2006 Table 5.7: Modal split at major north European container ports Table 5.8: Extent to which transport modes currently satisfy the requirements of container flows through
the port Table 5.9: Ro-ro traffic handled in top 20 EU ports, 2006 Table 5.10: Forecast Great Britain containerized and ro-ro traffic, 2004-2030 Table 5.11: Extent to which performance of transport modes is likely to change in the next 10 years for
container flows through ports Table 6.1: What EU data are currently collected? Table 7.1: European rail freight liberalization and trends in rail freight activity Table 7.2: Mean TEU capacity utilization per train, by port and train operator
LIST OF FIGURES Figure 5.1: Annual change in volume of world merchandise trade and GDP, 2000-07 Figure 5.2: Total TEU capacity of large container ships Figure 5.3: Distribution of ro-ro traffic by EU country (and Croatia and Norway), 2006 Figure 6.1: Estimated average CO2 intensity values for freight transport modes Figure 6.2: Eurostat’s strategy for intermodal transport statistics Figure 7.1: Alternative supply chain route between Asia and Austria via Danube and port of Constanta Figure 7.2: Strategic national freight corridors for England Figure 7.3: Duisburg port traffic flows in 1000 TEU, 2005 Figure 7.4: Rotterdam-Genoa corridor
ii
FOREWORD BY THE EXECUTIVE SECRETARY 1. The United Nations Economic Commission for Europe (UNECE) has been engaged in the work related to the development of coherent transport networks across the pan-European region since its inception in 1947. It has been internationally recognized for its activities in this domain, including the elaboration of major international infrastructure agreements that define key pan-European inland transport routes. A number of such routes provide strategic connections between the hinterland and seaports. Such linkages are of great importance to UNECE countries and their economic development. 2. This publication, entitled Hinterland Connections of Seaports, fulfils the mandate of the Expert Group of the Working Party on Transport Trends and Economics that was established with the approval of the UNECE Inland Transport Committee and Executive Committee in the spring of 2008. The Expert Group organized a high-level UNECE Conference on Hinterland Connections of Seaports that was hosted by the Government of Greece in Piraeus in the fall of the same year. The Group also designed and distributed a questionnaire survey of hinterland connections that was answered by more than thirty seaport authorities from fifteen countries of the UNECE region. 3. The following report describes the container and ferry transport trends in the UNECE region and analyzes policy responses to traffic congestion and other problems. It also develops, on the basis of conclusions of the Piraeus Conference and responses to the questionnaire survey, a number of recommendations for the UNECE and its member States. The report reflects the excellent quality of work of members of the Expert Group on Hinterland Connections of Seaports, supported by the UNECE secretariat and UNECE consultant, Dr. Allan Woodburn of the University of Westminster. The UNECE Working Party on Transport Trends and Economics adopted the report at its twenty-second session (8-9 September 2009). 4. In conclusion, the following UNECE report contributes to our search for equitable and sustainable development by identifying good practice in achieving efficient and environmentally friendly hinterland goods movements, by considering ways in which the specific problems faced by landlocked emerging economies can be overcome, and by recommending how the connectivity of seaports and their hinterlands can be improved. I should like to encourage all UNECE member States and the organizations concerned to undertake the steps necessary for a progressive implementation of the recommendations contained in this report.
Geneva, December 2009
Ján Kubiš Executive Secretary
United Nations Economic Commission for Europe
iii
LIST OF ABBREVIATIONS AGC European Agreement on Main International Railway Lines AGR European Agreement on Main International Traffic Arteries AGTC European Agreement on Important International Combined Transport Lines and Related Installations APA Almaty Programme of Action CIS Commonwealth of Independent States DG TREN Directorate-General for Energy and Transport ECA Emissions Control Area EATL Euro-Asian Transport Linkages EECCA Eastern Europe, Caucasus and Central Asia EPA Environmental Protection Authority ESPO European Sea Ports Organisation EU European Union GT Gross tons HGV Heavy goods vehicle IMO International Maritime Organization ITS Intelligent Transport Systems IWW Inland Waterway LPI Logistics Performance Index MDG Millennium Development Goal NSI National Statistical Office OECD/ITF Organization for Economic Co-Operation and Development (OECD)/ International
Transport Forum (ITF) OSCE Organization for Security and Cooperation in Europe SEE South-East Europe SPECA Special Programme for Economies of Central Asia TEM Trans-European North-South Motorway TEN-T Trans-European Transport Network TER Trans-European Railway TEU Twenty-foot equivalent unit TINA Transport Infrastructure Needs Assessment UNCTAD United Nations Conference on Trade and Development UNECE United Nations Economic Commission for Europe UNESCAP United Nations Economic and Social Commission for Asia and the Pacific WCO World Customs Orzanisation WTO World Trade Organization
iv
EXECUTIVE SUMMARY 1. The last few decades have seen rapid growth in port throughput resulting from the liberalization of international trade and the geographical dispersion of manufacturing. As this report shows, considerable strain has been placed on port hinterland connections, with consequent economic, environmental and social problems. In particular, inefficient hinterland links lead to increased supply chain costs and inefficiencies and greater environmental impacts. 2. This report examines the ways in which seaports and their hinterland connections can help to improve supply chain performance, through the removal of bottlenecks and the improvement in the efficiency and sustainability of port hinterland links in the UNECE region. In order to achieve this, the objectives are:
(a) to determine the key issues in the existing literature relating to the performance of seaports and their hinterland connections;
(b) to assess the key trends in the container and ferry markets in the UNECE region, including port hinterland flows;
(c) to identify good practice in achieving efficient and sustainable hinterland goods movements; (d) to consider ways in which the specific problems faced by landlocked emerging economies
can be overcome; (e) to recommend ways in which the connectivity of seaports and their hinterlands can be
improved. 3. The study is based on a mix of quantitative and qualitative techniques, with the analytical process being evidence-based as much as possible. The study draws on a range of sources of material, including published statistics, academic literature and industry reports. In addition, considerable use has been made of the material presented at the UNECE Conference on Hinterland Connections to Seaports which took place in Piraeus, Greece in September 2008 and an original questionnaire survey of port authorities conducted by UNECE. 4. Contemporary public policy focuses on sustainable mobility, though there is still tension between the efforts to promote economic growth and improve accessibility and the stated need to reduce the consumption of fossil fuels and the associated greenhouse gas emissions. The European Union, a key player within UNECE, has called for public policy to align itself with the concept of ‘comodality’, defined as the optimal and sustainable use and combination of the various modes of transport, in combination with measures to fully internalize the costs of the different modes. Global climate change discussions are ongoing, with a successor to the Kyoto Protocol currently under negotiation. International flows by sea and hinterland modes are a major contributor to the problem, and measures to improve hinterland flows could play an important role in reducing the environmental impacts of transport activity. 5. There are strong commercial reasons for port authorities to pay attention to their hinterland connections. Hinterland areas are rarely captive now, but are instead contestable with two or more ports competing to serve the inland areas. This has led to the removal of distinct hinterlands and the emergence of overlapping port coverage of inland areas. Given that logistics chain decision makers are now more likely to be considering the attributes of entire chains rather than specific legs, and as a result of hinterland connections increasingly becoming the weakest link of the chain, there is a considerable risk that ports will suffer a loss of traffic if their connections are inefficient or costly. 6. As part of this study, a questionnaire was developed by UNECE and distributed to port authorities, freight forwarders, infrastructure managers, terminal operators and transport ministries of UNECE member States. Thirty-three completed questionnaires were received. Despite concerns about the extent to which the sample is representative of ports in the UNECE region, nine of the top 20 EU container ports and three of the top 10 EU ro-ro ferry ports are included; in addition, two of the top 20 non-EU container ports in the UNECE region responded. 7. Global economic development and international trade growth are strongly correlated. Globally, economic growth increased by more than 3 per cent per annum between 1991 and 2008. In general
v
terms, economic growth rates in South-East Europe and CIS have been far greater than the world average, while in the EU and United States growth has been slower. The recent economic downturn that has occurred in the last year has reversed the economic growth trend, with subsequent knock-on effects on international trade volumes and therefore on port hinterland flows. Containerised traffic appears to have been particularly badly affected. The long-term implications of the downturn are not yet clear, making realistic projections of future trade volumes and port hinterland connection flows extremely difficult. 8. The study has identified the challenges associated with the consideration of port hinterland flows in isolation from other transport activity given the use of common infrastructure and the application of common regulations. To ensure that the best use is made of transport infrastructure, and that investment is appropriately targeted, it is important to consider all the transport activity demands, especially across strategic transport networks that link ports with their hinterlands. 9. There is no agreed standard means of measuring hinterland connection performance, and data availability and consistency issues make international comparison difficult. This lack of consistent, good quality data hinders the detailed understanding of the effects of different factors on the performance of hinterland transport and an evidence-based assessment of policy priorities for intervention. Examples of good practice in the development of data specifically relating to intermodal transport have been identified, but there is a need for the development of a broader integrated assessment tool which will adequately evaluate transport’s role in supply chains and its contribution to countries’ competitiveness. 10. In appraising port hinterland connections, it is imperative to consider more than just the existence of physical infrastructure. Infrastructure attributes, such as speed, capacity and quality, are important, as are the wider transport performance measures that affect supply chain decision making, such as transit time variability and in-transit risk. Measures relating to environmental performance are increasingly important. There is a need for the development of an integrated assessment tool which will adequately evaluate transport’s role in supply chains and its contribution to countries’ competitiveness. 11. Border crossing performance is a major influence on the functioning of hinterland flows that cross international frontiers en route to/from ports. Obstacles at border crossings have a disproportionate effect on landlocked countries since they do not have direct access to one or more seaports without crossing a land frontier, whereas countries with a coastline have the opportunity to develop direct shipping services. 12. Examples of good practice in enhancing the efficiency and sustainability of hinterland freight movement are highlighted in the report. These good practice examples could form part of a toolkit of measures to be adopted in different situations and locations, as appropriate. The examples are grouped into six themes:
(a) initiatives to satisfy trade requirements while minimizing transport distance; (b) hinterland transport infrastructure provision and use initiatives; (c) initiatives to make efficient and sustainable use of transport modes ; (d) cross-border transport initiatives and the development of partnerships; (e) non-transport initiatives to reduce border crossing delays; (f) data availability.
13. The ‘good practice’ reveals considerable potential for improving port hinterland efficiency and sustainability through more widespread adoption of successful initiatives that have already been applied in certain locations. In particular, the initiatives demonstrate the importance of a coordinated approach, frequently requiring multimodal and cross-border cooperation to overcome the traditional barriers that result in inefficient hinterland transport activity. 14. From the analysis carried out to address the study’s objectives, a series of recommendations has been made in the report for future consideration:
(a) to ensure that hinterland connections of seaports are well integrated into transport development strategic plans at national and international levels;
i
vi
(b) UNECE to continue its participation in Eurostat’s intermodal and maritime task forces with a view to developing intermodal statistical measures and methodological approaches that would be adopted by both EU and non-EU countries;
(c) based on the UNECE questionnaire on hinterland connections of seaports, the Working Party on Transport Statistics (WP.6) to collect and process harmonized statistics on annual port-hinterland container and ro-ro ferry (including ro-pax) traffic flows in UNECE member countries that would help to inform policy making for hinterland transport;
(d) UNECE to launch the development of a new evaluation tool for identifying key pinch points and points of weakness/failure in transport systems, and benchmarking performance of transport and logistics systems against peer economies;
(e) to encourage better coordination of increases of container ships’ carrying capacities with seaports infrastructure and their hinterland connections;
(f) to continue to encourage good practice adoption for border crossings; this will improve hinterland efficiency in general terms, but most particularly for landlocked non-EU countries;
(g) UNECE TEM and TER projects and the UNECE-UNESCAP project on developing Euro-Asian transport links should be supported and strengthened by UNECE countries concerned;
(h) to encourage the EU to maintain a clear focus on improving transport infrastructure and operations with neighbouring UNECE countries, particularly EU candidate countries;
(i) in conjunction with others, UNECE to consider what would be the most appropriate form of international agency to promote strategic hinterland transport connections, and to determine the most appropriate forum in which to continue the development of policies for hinterland connections to seaports.
15. In addition, a number of issues for further consideration have been identified:
(a) to explore frameworks within which port managers could be encouraged to minimize the negative impacts of port hinterland flows by making use of a network of hub and feeder ports, promoting comodality and placing greater emphasis on rail and waterborne modes, as well as enhance the efficiency of utilization and operation of each transport mode for hinterland flows;
(b) to assess the relative merits of the continued development of hub ports or an alternative regional approach, together with the desirability of a hierarchical sea-based network with shorter hinterland routes;
(c) to identify areas in which modifications to current UN international conventions and agreements administered by UNECE may be necessary and make relevant proposals.
16. In light of the evidence that hinterland connections of seaports are the weakest link in global supply chains and the apparent need for further work in this area, UNECE governments may consider the extension of the mandate of the Expert Group for a further two years, dependent upon the availability of a funding source for the period from March 2010 to February 2012.
vii

I. INTRODUCTION A. Scope of report 1. The last few decades have been characterized by rapid growth in port throughput as a result of the liberalization of international trade and the geographical dispersion of manufacturing (OECD/ITF, 2009). As this report shows, considerable strain has been placed on port hinterland connections, with consequent economic, environmental and social problems. In particular, inefficient hinterland links lead to increased supply chain costs and inefficiencies and greater environmental impacts. The purpose of this report is to examine ways in which ports and their hinterland connections can improve supply chain performance, both in terms of specific port hinterland links and between ports and inland areas across the UNECE region as a whole. The report embraces the entire UNECE region, although most of the focus is on Europe and Central Asia; North American experience is included where appropriate, particularly insofar as determining whether there are examples of good practice that may be transferable to other UNECE countries. The detailed functions and tasks set out in the terms of reference for preparing this report are as follows:
(a) to describe and analyse the available information on container and ferry freight transport trends and projections in the UNECE region;
(b) to describe and analyse the policy response to traffic congestion and other problems in hinterland connections of seaports while sharing and drawing on good practices, conclusions of the UNECE Conference (Piraeus, 17-18 September 2008) and other relevant contributions and available research, including the problems facing UNECE landlocked emerging market economies in respect to the efficiency of seaport operations and their connectivity with inland transport modes.
B. Study aims and objectives 2. The study aims to analyse the performance of and bottlenecks in hinterland transport connections of seaports. In order to achieve this, the objectives are:
(a) to determine the key issues in the existing literature relating to the performance of seaports and their hinterland connections;
(b) to assess the key trends in the container and ferry markets in the UNECE region, including port hinterland flows;
(c) to identify good practice in achieving efficient and sustainable hinterland goods movements; (d) to consider ways in which the specific problems faced by landlocked emerging economies can
be overcome; (e) to recommend ways in which the connectivity of seaports and their hinterlands can be improved.
C. Methodology 3. The study is based on a mix of quantitative and qualitative techniques, with the analytical process being evidence-based as much as possible. The study draws on a range of sources of material, including published statistics, academic literature and industry reports. In addition, considerable use has been made of the material presented at the UNECE Conference on Hinterland Connections to Seaports which took place in Piraeus, Greece in September 2008 and an original questionnaire survey of port authorities conducted by UNECE. D. Structure of report 4. The report first (in Chapters II and III) sets the scene by synthesizing the salient points from the published literature and then summarizing the policy background that influences international trade flows. In Chapter IV, the original information gathering elements of this project are reported, namely a summary of the key findings from the UNECE Piraeus conference and the implementation of the questionnaire survey of port authorities. Chapter V presents the key trends and projections for container and ferry traffic in the UNECE region. Chapter VI explores in detail the key issues and challenges facing hinterland connections to seaports, with a particular focus on the landlocked emerging economies in Central Asia.
1
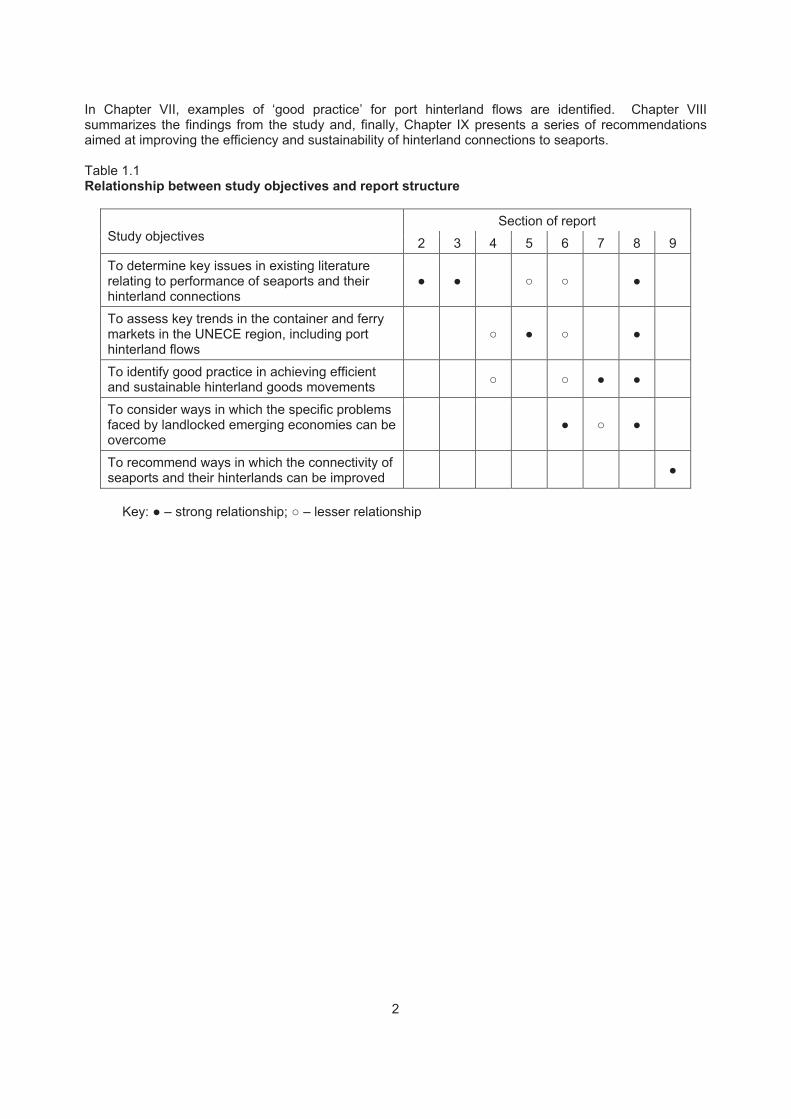
In Chapter VII, examples of ‘good practice’ for port hinterland flows are identified. Chapter VIII summarizes the findings from the study and, finally, Chapter IX presents a series of recommendations aimed at improving the efficiency and sustainability of hinterland connections to seaports. Table 1.1 Relationship between study objectives and report structure
Section of report Study objectives 2 3 4 5 6 7 8 9
To determine key issues in existing literature relating to performance of seaports and their hinterland connections
� � � �
�
To assess key trends in the container and ferry markets in the UNECE region, including port hinterland flows
� � �
�
To identify good practice in achieving efficient and sustainable hinterland goods movements � � � �
To consider ways in which the specific problems faced by landlocked emerging economies can be overcome
� � �
To recommend ways in which the connectivity of seaports and their hinterlands can be improved �
Key: � – strong relationship; � – lesser relationship
2
II. THE POLICY CONTEXT A. Introduction 5. This Chapter sets out the existing policy framework influencing ports and their transport links. Given the role of the EU within much of the UNECE region, and the lead that it has taken in formulating transport policy, much of this Chapter is devoted to the evolution of EU policies that are of relevance to port hinterland connections. The broad transport policy framework is described first, followed by specific initiatives that have particular relevance for port hinterland connections. A brief review of relevant UNECE activities is then presented. The Chapter concludes with an overview of the sustainability policies that are likely to influence supply chain operations in the future. 6. The assumed definition of a port’s ‘hinterland’ is the area inland from the port to which imports are distributed and from which exports are collected. For a number of reasons, not least the limited extent and quality of inland transport networks and restrictions on cross border movements, ports traditionally each tended to have a relatively clearly defined independent hinterland. This situation changed considerably in the second half of the 20th century as a consequence of infrastructural, political and technological developments, with Cuadrado et al. (2004, p.322) highlighting that “it is no longer possible to talk about captive traffic in a port but rather volatile traffic which can be captured by several ports”. This report adopts this concept that port hinterlands are generally indistinct and overlapping, with considerable variability in their characteristics in both the short and long term. The availability and cost of inland transport services have typically been the determining factors, but others such as journey time and service quality factors (e.g. variability of transit time, in-transit risk and damage, provision of value-added services) have increasingly influenced the nature and extent of ports’ hinterlands. B. European Union transport policy 7. The policy context has evolved considerably since the early 1990s, when the EU first turned its attention to the development of a Europe-wide transport strategy, with an increasing role for port-related policies in the last decade. EU Transport White Papers have been produced in 1992 and 2001 (European Commission, 2001), followed more recently by a review of the 2001 White Paper (European Commission, 2006a) which sought to evaluate and give new direction to EU transport policy to reflect the changing situation, notably resulting from the EU enlargement from 15 to 27 countries since 2004. The enlargement has led to more variability in the concerns relating to freight transport flows, from the increasing focus on the environment and congestion in the western member countries to the more traditional concerns about infrastructure provision and accessibility in many of the new member states. As a consequence of this and other changes (e.g. continued globalization of logistics activity, increasing evidence of climate change, adoption of new technologies), the EU argues that a “broader, more flexible transport policy toolbox is needed” (European Commission, 2006a, p.6). The policy focus is very much on sustainable mobility, though there is still tension between the efforts to promote economic growth and improve accessibility and the stated need to reduce the consumption of fossil fuels and the associated greenhouse gas emissions. The review calls for public policy to align itself with the concept of ‘comodality’, defined as the optimal and sustainable use and combination of the various modes of transport, in combination with measures to fully internalize the costs of the different modes. C. Specific EU initiatives 8. Recognising the widely differing approaches in EU member States, the Green Paper on Sea Ports and Maritime Infrastructure (European Commission, 1997) focused the policy-makers’ attention on goods flows through ports, primarily concerning itself with the role of ports within the Trans-European Transport Network (TEN-T) programme, the finance and charging regimes for ports and the organization of port services. By this time, it was recognized that ports were important transfer points in the intermodal transport chain, and consequently that the growth in maritime goods transport and the concentration of activity at a relatively limited number of ports in combination were factors influencing land-based transport activity. More recently, the EU has produced two communication documents that are relevant to this study: a Communication on an Integrated Maritime Policy for the EU (European Commission, 2007a) and a Communication on a Ports Policy (European Commission, 2007b). The former has a very broad remit,
3
recognizing the supranational nature of many issues relating to the maritime environment, and identifying interrelationships between trade, fishing, national security, environmental impacts, etc. The latter communication focuses its attention specifically on the ports sector, identifying the following key challenges:
(a) increasing demand for international transport; (b) technological changes, not least the development of container transport and a range of IT
applications; (c) commitment to tackle greenhouse gas emissions, local air pollution and road congestion; (d) involvement of stakeholders in the port region and beyond.
9. In addition, given the nature of many port undertakings, often in receipt of public funds and frequently also being public or quasi-public bodies, compliance with Directive 2006/111/EC is necessary. This sets out obligations to ensure the transparency of financial relations between member states and public undertakings. This also applies to other elements of the transport system where the public sector may operate or fund aspects of infrastructure or service provision. 10. Overall, the evolution of maritime and inland transport policies has traditionally not been well-integrated, although there are signs that this is now improving. An example can be seen with the evolution of the TEN-T programme. This was adopted by the EU in 1996, with the aim of removing obstacles to the implementation of the Single European Market through the creation of modern and efficient strategic transport infrastructure across the continent. Progress has generally been slow, leading the EU to review the initiative and focus much more clearly on transnational projects. A revised set of 30 transnational corridors was identified in 2004 (European Commission, 2005), a number of which relate very directly to port connections while others are likely to have a more limited impact. Those projects most closely related to ports and their hinterlands include the new Betuwe line connecting Rotterdam and the German border, the UK/Ireland/Benelux road axis providing landbridges between ferry ports, the rail axis from Algeciras to France, and the Rhine/Meuse – Main – Danube inland waterway axis. Specifically considering ports, almost 300 are included in the TEN-T programme, but there has been little prioritization so far. To promote short-sea shipping, the Motorways of the Sea initiative was adopted as part of the TEN-T programme in 2004, with four main aims (European Commission, 2006b):
(a) to encourage more efficient, cost-effective freight transport that is less polluting; (b) to alleviate road congestion on Europe’s strategic road network; (c) to improve the connectivity of peripheral regions, enhancing cohesion across Europe; (d) to help to promote economic growth in a more sustainable manner.
11. In addition to the TEN-T budget, projects may be eligible for funding from Cohesion and Structural Funds. The EU intends to have a network of Motorways of the Sea projects in operation by 2010, though progress to date has been limited. Consultation is taking place in early 2009 as to how the TEN-T programme can better meet the EU’s economic and environmental objectives, with the policy review Green Paper (European Commission, 2009) identifying the interconnection of modes for flows such as those to/from port hinterlands as being important considerations. It was stated in the review that to enable efficient supply chain operations requires appropriate infrastructure provision, particularly in terms of intermodal terminals, rail, sea and river port capacity (including land access to seaports), parking areas for commercial vehicles and ITS to integrate infrastructure components and as a means of tracking and tracing cargo. 12. Concurrently, the EU is also working on extending a number of the axes to neighbouring countries, most of whom are members of UNECE. It was underlined in the TEN-T policy review that Europe’s economic growth depends on its global competitiveness, which requires good transport links to all of the EU’s immediate neighbours, including Africa. In addition to the economic benefits, such links are vital from a political and security point of view. 13. The Freight Transport Logistics Action Plan identified that “the surge in containerized trade and liner shipping is leading to high congestion in certain seaports and port-hinterland connections”
4
(European Commission, 2007c, p.2), and that the performance of terminals (including ports) is critical for supply chain efficiency. This Plan also argues the need for the removal of administrative barriers within the maritime sector in the EU to increase the attractiveness of short-sea shipping, and promotes the concept of ‘green corridors’ for freight in conjunction with the TEN-T programme and other initiatives such as the priority rail freight network. In December 2008, the EU published further, more detailed, proposals for developing international rail freight corridors and encouraging interoperable systems (European Commission, 2008), recognizing the typical problems encountered when using rail for cross-border flows and proposing a series of measures designed to encourage greater use of rail for such flows. D. Relevant UNECE activities 14. Many previous studies and existing initiatives that impact on port hinterland flows, and this report takes cognisance of those that are of particular significance. In particular, the following UNECE projects are relevant:
(a) Trans-European North-South Motorway (TEM) Network, aimed at improving the quality and efficiency of transport operations across much of Central and Eastern Europe;
(b) Trans-European Railway (TER), intended to develop efficient international rail and combined transport operations through Central and Eastern Europe;
(c) Special Programme for the Economies of Central Asia (SPECA), a joint UNECE-UNESCAP activity which includes a Working Group on Transport and Border Crossing Facilitation;
(d) the Euro-Asian Transport Linkages (EATL) project, another joint UNECE-UNESCAP programme which incorporated numerous initiatives (including TEM and TER) with a broader geographical remit for the development of links between Europe and Asia.
15. In many respects, these UNECE projects complement EU transport and trade policies by extending the focus further east towards non-member States in Eastern and South-Eastern Europe and Central Asia. It is also important to bear in mind the Millennium Development Goals (MDGs) which underpin the United Nations’ work in improving economic, social and environmental conditions around the world. The goals were developed as a consequence of Agenda 21, a sustainable development programme agreed by the United Nations in 1992, and the goals are as follows:
(a) MDG1: Eradicate extreme poverty and hunger; (b) MDG2: Achieve universal primary education; (c) MDG3: Promote gender equality and empower women; (d) MDG4: Reduce child mortality; (e) MDG5: Improve maternal health; (f) MDG6: Combat HIV/AIDS, malaria and other diseases; (g) MDG7: Ensure environmental sustainability; (h) MDG8: Develop a global partnership for development.
goals are of greater relevance to the least developed countries, but the latter two
are of particular significance to the entire UNECE region; some of the others do apply to the relatively less economically advanced UNECE countries in the Eastern Europe, Caucasus and Central Asia (EECCA) region and South-East Europe (SEE). In addition, UNECE (2006) views the development of transport infrastructure as a factor in addressing poverty reduction (MDG1). The transport infrastructure projects outlined above are viewed as being important components of the plan to meet the goals through infrastructure agreements dealing with road, rail, inland waterway and combined transport networks. E. Policies in support of sustainability 17. With the notable exception of the United States of America, the overwhelming majority of UNECE countries signed and ratified the Kyoto Protocol, which set differential targets for greenhouse gas emissions by 2008-2012 based on 1990 levels. For the EU-15, the target reduction was 8 per cent, but the majority of countries seem unlikely to meet this given recent trends. However, the climate change problem is now regarded as more serious and urgent than when the Kyoto Protocol was agreed, and stricter targets are being developed. For example, the EU is expected to agree a carbon emissions target
5
16. Many of these
of at least a 20 per cent reduction by 2020 (based on 1990 emissions levels); this may be increased to 30 per cent as part of a more global agreement. A successor to the Kyoto Protocol is under negotiation at present, and in 2007 the G8 nations agreed an aim to reduce carbon emissions by at least 50 per cent by 2050. Some countries are developing even more stringent targets, such as the United Kingdom which has now agreed a greenhouse gas emissions target reduction of 80 per cent by 2050. 18. Transport is a large contributor to greenhouse gas emissions, and its share of total emissions has been rising. Across the European Union, carbon emissions from freight transport are rising rapidly, with the overall growth in activity (particularly by road) far exceeding efficiency improvements. For the EU-27, total greenhouse gas emissions fell by 8 per cent between 1990 and 2004, but rose by 26 per cent in the transport sector (excluding international aviation and maritime transport); in 2005, the transport sector accounted for 22 per cent of EU-27 greenhouse gas emissions (EEA, 2008). If maritime transport activity was also included, the share would be even greater. It is evident, therefore, that transport is a sector on which attention needs to be focused to meet emissions reduction targets. International flows by sea and feeder modes are a major contributor to the problem, and measures to improve hinterland flows could play an important role in reducing the environmental impacts of transport activity. F. Summary of the current policy context 19. European transport policy has traditionally concerned itself with transport liberalization and the development of a competitive market as a means of achieving economic growth and the implementation of the Single European Market. Within the last decade, however, sustainability concerns have become increasingly important, with mode share issues and the internalization of external costs featuring strongly. At present, therefore, policies aim to balance economic development/globalization and sustainability, with the likelihood of increasingly stringent targets for greenhouse gas emissions, and company-specific caps (for large companies) which may influence decision making and encourage greater sustainability within supply chains.
6
III. LITERATURE REVIEW 20. This Chapter seeks to identify the key themes from the previous literature relating to port hinterland connections; there is not scope here to go into detail about all of the issues raised before, but many specific points will be explored in further detail in the context of the report’s later analysis. First, the general literature relating to developments in maritime logistics chains is reviewed briefly. This is followed by a summary of the main literature examining the importance of port hinterland connections. Specific trends in the container (and ferry) sector are analyzed in Chapter V rather than in this Chapter. A. Developments in maritime logistics chains 21. International trade is an enabler of economic growth and enhanced productivity, although the direct role of transport infrastructure and service provision is difficult to quantify (HM Treasury, 2006a) since it is difficult to isolate the specific transport effects. The development of global logistics chains has had a major impact on the function of ports (OECD/ITF, 2009) and, as a consequence, of port hinterland connections. The performance of the transport system directly impacts on transport costs and, as a consequence, on logistics costs, with evidence that transport costs are a barrier to international trade volumes (ECMT, 2005; HM Treasury, 2006a). According to ECMT (2005), half of all international trade by weight is between countries no more than 3,000 km apart, with longer distance trade often constrained by high transport costs. 22. Cariou (2008) argues that the container shipping market has been evolving, with three key trends since the early-1990s: horizontal integration; vertical integration; and the development of larger vessels. In each case, the scale of operation has increased and shipping lines have consequently become more significant global players in the logistics chain, gaining additional decision making powers. At the same time, ports have typically become less dominant as competition between ports has been increasing and new or enlarged ports have developed, providing more choice to shipping lines (Pando et al., 2005). In consequence, ports have become more commercially aware, recognizing the need for efficient operations within the port area itself, but also along the logistics chain. With the globalization of flows, shippers and customers have become more concerned about the performance of the entire logistics chain (OECD/ITF, 2009). Van de Voorde and Vanelslander (2009, p.5) state that “the competitive strength of a port or any other maritime player does not depend exclusively on the own infrastructure and organization; it is also affected by a variety of other market forces”. The authors emphasize that market actors are now increasingly chosen for their role in a successful international maritime logistics system rather than on the basis of their individual performance. 23. A key question that has not yet been resolved in the literature is the extent to which economies of scale and scope can continue to be gained from ever-increasing container vessel size and port throughput. Van de Voorde and Vanelslander (2009) believe that the costs associated with handling ever larger volumes from ever larger ships at hub ports may open up opportunities for more cost effective direct services between smaller ports where volumes justify this. Hub-based networks tend to be favoured when flow density is low, since volume can be consolidated over the long distance leg, but are less attractive when flow density rises above a critical mass that favours direct service provision (OECD/ITF, 2009). One way in which increased economies have been generated has been the evolution of transhipment, where containers are transferred from deep sea to feeder vessel (and vice versa) to separate out the trunk flow from the onward distribution/collection. According to Baird (2007), for at least 20 of the 100 largest container ports the majority of traffic handled is ship-to-quay-to-ship, rather than being transferred to/from other modes of transport. B. Port hinterland connections 24. The issues relating to hinterland connections in the context of port competition are comprehensively covered by the OECD/ITF Joint Transport Research Centre Round Table (OECD/ITF, 2009) and the supporting documentation (e.g. de Langen, 2008; Notteboom, 2008; Zhang, 2008). It has been asserted that “in most door-to-door transport chains, the costs of hinterland transport are higher than maritime transport costs and port costs combined” (de Langen, 2008, p.10), and the increasing attention being devoted to hinterland transport problems suggests that this is the case. Notteboom
7
(2008) agrees that shipping lines are aware of the increasing importance of the quality of the land connections for their customers, given the potential that they have to affect the overall door-to-door performance of the logistics chain. Given that ports’ hinterland areas have typically been growing, from both the perspective of specific ports and of product supply chains the importance of considering port hinterland connections has increased. This is confirmed by Wiegmans et al. (2008), who identify the availability and performance of inland connections as being one of the key criteria applied by deep-sea container shipping lines when deciding on port calls. In the context of imports to the USA from Asia, Leachman (2008) highlights inland transport costs as being an important factor in port choice, with this being a function of the quality of the connections available, emphasizing that the issue is not limited to Europe. Such views have been reinforced by representatives from a range of UNECE countries during the course of this study and there is broad agreement that the quality of port hinterland connections is vital. These connections typically involve a wide range of actors, which adds to the complexity of dealing with the problems identified. 25. The wider arguments for giving greater consideration to port hinterland connections for reasons of economic development and sustainability are well rehearsed. For example, the Eddington Transport Study (HM Treasury, 2006a) asserted that poorly performing ports or internal transport networks could significantly reduce the volume of international trade and claimed that, even with full internalization of environmental and social costs, further capacity will be required at ports and on the hinterland routes. It seems clear that increasing strain will be placed on port hinterland connections if the current hub-based shipping model continues to develop, since larger volumes of goods will need to be moved to/from the hinterland areas of the major ports. This may benefit the rail and inland waterway modes, which are better able than road to move large volumes efficiently. If there is a move towards more direct service provision, a different set of hinterland connections would be expected to develop. Pricing of the environmental and social costs is an important issue, and if fully implemented would be expected to alter the status quo of port hinterland flows in favour of alternative modes and, perhaps, fundamentally different logistic chain structures. To date, there has been little coordinated international (or even national) intervention to systematically deal with the internalization of such costs (OECD/ITF, 2009). This has important implications for the role of the different transport modes. 26. De Langen (2008) believes that port authorities have a role to play in the integration of hinterland connections into the logistics chain, particularly where they have a public policy role to reduce the externalities of logistics-related activities. While this typically will involve improvements within the port area itself, or in the connections between the port and the hinterland networks, there may be arguments for involvement in hinterland connections more distant from the port. An important objective will typically be to boost port throughput in the face of competition from other ports. Gouvernal et al. (2005) argue that, along with efficient port operations, well-functioning hinterland connections are an important factor in maintaining the dominance of the established northern range ports in Europe. This makes it more difficult for ports in the Mediterranean to gain a larger share of the market, even from Asia where they would be expected to have an advantage in distance and time terms. As a consequence, the Mediterranean ports still largely serve hinterlands that are far more restricted than those of the large ports such as Rotterdam, Antwerp and Hamburg. 27. Parola and Veenstra (2008) argue that shipping lines have been more successful at developing global strategies than have ports or container terminal operators, consolidating their strong position in the marketplace. As identified earlier (Cariou, 2008), a well established trend towards vertical consolidation in the maritime shipping and port industry has evolved at the same time. For some time, container shipping lines have acquired or developed cooperative arrangements with port terminal operators, and this is increasingly spreading to involvement in the inland rail and water transport operations serving port hinterlands. This is particularly noticeable at the main hub ports, where shipping lines have expanded into the inland transport market, for example in operating their own rail services and inland terminals. This has led to greater integration of the maritime and land legs of logistics chains, typically with increased consolidation of inland volumes and a consequent higher modal share for rail (Notteboom, 2008). The ‘dry port’ concept has evolved (see, for example, Roso et al.), linking seaports directly by rail to inland container terminals, which is a means of container terminals and/or shipping lines extending their reach along the logistics chain, with the aim of improving the door-to-door experience and achieve modal shift away from road to rail. Similarly, Konings (2007) identifies similar opportunities using inland
8
waterway transport from Rotterdam through the development of ‘trunk line’ operations in the port’s hinterland to key inland terminals. 28. The impact of these trends on future hinterland flows is not clear, as the growing dominance of large shipping lines would seem to make liner services more likely to switch between ports in response to changes in competitiveness, while the development of long-term relationships between shipping lines and terminal operators or transport providers appear more likely to reduce the likelihood of port switching. Similar issues have been raised about consolidation within the hinterland modes, notably the rail freight industry. As Pilsbury and Meaney (2009) discuss, there is a growing trend for both horizontal and vertical mergers involving rail freight companies, but it is not yet clear whether this is beneficial for, or a hindrance to, competitive and sustainable logistics chains. 29. The World Bank (2005) has emphasized the importance of considering corridors, particularly at the international level, as a means of improving the physical flows of goods when compared to the traditional consideration of transport infrastructure and services on a fragmented basis. A useful distinction is made between three types of trade corridors: domestic trade corridors; foreign trade corridors; and transit trade corridors. The second and third types are important in the context of port hinterland flows. Foreign trade corridors perform a role in moving imports and exports for a particular country, using either ports or international land border crossings. Transit trade corridors are used to move goods between other countries, normally with a port or land border crossing at one end and a land border crossing at the other. Well performing corridors of both types are important in enabling international trade and improving efficiency and competitiveness as a result of economic cooperation and regional integration. C. Summary 30. In addition to the public policy concerns identified in Chapter II, it seems that port authorities need to take seriously the performance of their hinterland connections. Hinterland areas are rarely captive now, but are instead contestable with two or more ports competing to serve the inland areas. This has led to the removal of distinct hinterlands and the emergence of overlapping port coverage of inland areas. Given that logistics chain decision makers are now more likely to be considering the attributes of entire chains rather than specific legs, and as a result of hinterland connections increasingly becoming the weakest link of the chain, there is a considerable risk that ports will suffer a loss of traffic if their connections are inefficient or costly. There does not appear to be a consensus in the literature as to the appropriate balance between public policy intervention and free market competition in the port hinterland market.
9

IV. THE UNECE PIRAEUS CONFERENCE AND QUESTIONNAIRE SURVEY 31. This Chapter first presents the key findings of the UNECE Piraeus conference and second provides background information relating to the original questionnaire survey that has been conducted for this project. A. Key findings of the UNECE Piraeus conference 32. This section is intended to provide a brief summary of the findings of the two day conference held in Piraeus, Greece, in September 2008. Full details of the conference presentations can be found on the UNECE website (UNECE, 2008), and specific points are discussed in later sections of this report as appropriate. The conference featured a large number of presentations organized into four main themes:
(a) Seaport good practices: the interface between maritime and inland transport; (b) Hinterland connections of seaports: bottlenecks or seamless links with roads, railroads and
inland waterways; (c) Port operations and management: a key factor in the supply chain management; (d) Challenges to the development of seaports in the globalized world (bearing in mind that the
conference took place before the impacts of the global economic downturn were felt).
33. There was considerable discussion regarding the importance of ports within supply chains that are becoming increasingly global in nature, reflected in the dramatic increases in volumes of containers and other unitized loads passing through the key UNECE ports in recent years. Much of this growth has resulted from the rapid development of Chinese manufacturing industries, with unprecedented growth in throughput at the key Chinese ports since the early-2000s. Hinterland connections were identified as a generally weak link in international supply chains since they were typically fragmented with their provision and use being the responsibility of many different actors from both the private and public sectors. This applies to port activities themselves, transport links along hinterland corridors, and the inland terminals used to handle international flows. While much of the focus of the conference related to physical infrastructure provision and capability, it is important to recognize the potential impacts of other factors such as improved asset utilization, better regulation, adoption of new technologies, reduced bureaucracy and greater interoperability (particularly at international borders), more international cooperation between supply chain parties, etc. Perhaps understandably, there often remains a tendency for governments to take a fairly nationalistic approach to port hinterlands, although there is evidence of EU cross-border policies taking effect within its area. The importance of well functioning hinterland connections was noted as being a particular issue for landlocked economies which have no direct access to their own port facilities, especially those in Central Asia where poor quality international connections seriously hinder economic development. 34. In addition to issues surrounding the efficiency of hinterland operations, the importance of reducing the environmental impacts of international freight flows was also stressed, as was the role of international trade in encouraging broader social and economic development in line with the Millennium Development Goals. Environmental and social issues featured more strongly in the presentations from the more ‘western’ parts of the UNECE region, while further east the focus on economic development often dominated. A number of speakers commented on the tendency for public or private agencies to focus on specific issues, for example related to a particular mode, port or corridor, rather than taking a more holistic, system-based approach that considers supply chains as a whole. For the future, a key question relates to the scale of port development and the impacts on hinterland flows, both in terms of efficiency and sustainability. There was no clear consensus as to whether the continued development of hub ports is to be encouraged, often with long distance hinterland movements as a consequence, or whether it would be more beneficial to encourage the ‘regionalization’ of port activity to reduce land-based legs. Alternatively, a hierarchical sea-based network may be a viable option, with greater use of feeder shipping services between hub and regional ports. These issues will be explored later in this report. It is evident, though, that there are many different port capacity schemes at various stages of development and implementation, but only a limited awareness of the extent to which hinterland flows may be affected in the future.
10
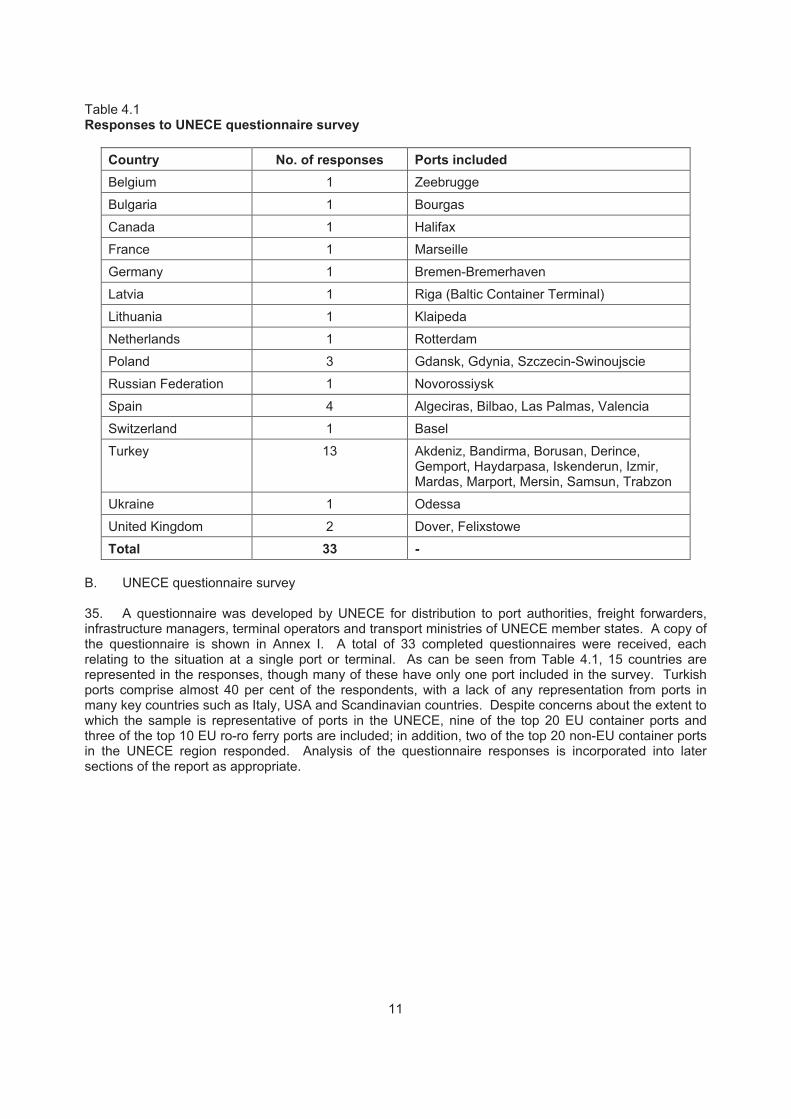
Table 4.1 Responses to UNECE questionnaire survey
Country No. of responses Ports included Belgium 1 Zeebrugge
Bulgaria 1 Bourgas
Canada 1 Halifax
France 1 Marseille
Germany 1 Bremen-Bremerhaven
Latvia 1 Riga (Baltic Container Terminal)
Lithuania 1 Klaipeda
Netherlands 1 Rotterdam
Poland 3 Gdansk, Gdynia, Szczecin-Swinoujscie
Russian Federation 1 Novorossiysk
Spain 4 Algeciras, Bilbao, Las Palmas, Valencia
Switzerland 1 Basel
Turkey 13 Akdeniz, Bandirma, Borusan, Derince, Gemport, Haydarpasa, Iskenderun, Izmir, Mardas, Marport, Mersin, Samsun, Trabzon
Ukraine 1 Odessa
United Kingdom 2 Dover, Felixstowe
Total 33 - B. UNECE questionnaire survey 35. A questionnaire was developed by UNECE for distribution to port authorities, freight forwarders, infrastructure managers, terminal operators and transport ministries of UNECE member states. A copy of the questionnaire is shown in Annex I. A total of 33 completed questionnaires were received, each relating to the situation at a single port or terminal. As can be seen from Table 4.1, 15 countries are represented in the responses, though many of these have only one port included in the survey. Turkish ports comprise almost 40 per cent of the respondents, with a lack of any representation from ports in many key countries such as Italy, USA and Scandinavian countries. Despite concerns about the extent to which the sample is representative of ports in the UNECE, nine of the top 20 EU container ports and three of the top 10 EU ro-ro ferry ports are included; in addition, two of the top 20 non-EU container ports in the UNECE region responded. Analysis of the questionnaire responses is incorporated into later sections of the report as appropriate.
11

V. CONTAINER AND FERRY FREIGHT TRANSPORT ACTIVITY IN THE UNECE REGION 36. This Chapter first briefly charts the global trends in international trade and, more specifically, the container sector, since these influence maritime and hinterland freight transport activity in the UNECE region. It then examines the specific recent trends at container and ferry ports, before considering the projections for future traffic levels to 2020 (and beyond). It should be noted that the data used to analyze the trends come from a range of sources that are not always wholly consistent with each other as a result of differing methodologies and assumptions. Where there is significant variability, this is highlighted in the text. A. International trade trends 37. Global economic development and international trade growth are strongly correlated. Table 5.1 reveals the economic growth rates at the global level and for specific country groups and countries in the UNECE region for the period since 1991. On average, global economic growth has averaged more than 3 per cent per annum between 1991 and 2008. Broadly speaking, since 2002, economic growth rates in the EU and United States have been lower than the world average while those in South-East Europe and CIS have been far greater. Table 5.1 World economic growth, 1991-2008
Region/country
1991-2001a
2002
2003
2004
2005
2006
2007b
2008c
World 3.1 1.9 2.7 4.0 3.4 3.9 3.8 2.9 Developed countries 2.6 1.3 1.9 3.0 2.4 2.8 2.5 1.6 of which:
United States 3.5 1.6 2.5 3.6 3.1 2.9 2.2 1.4
European Union 2.4 1.2 1.3 2.5 1.8 3.0 2.9 1.8
of which:
Euro area 2.2 0.9 0.8 2.0 1.5 2.7 2.6 1.6
France 2.0 1.0 1.1 2.5 1.9 2.2 2.1 1.5
Germany 1.8 0.0 -0.2 1.2 0.9 2.9 2.5 1.8
Italy 1.6 0.3 0.0 1.1 0.0 1.7 1.5 0.4
United Kingdom 2.8 2.1 2.7 3.3 1.9 2.8 3.0 1.6
South-East Europe & CIS - 4.9 7.1 7.6 6.6 7.5 8.4 7.4 South-East Europe d - 3.0 2.4 4.5 5.0 5.0 6.0 5.2
CIS - 5.2 7.6 8.0 6.8 7.7 8.6 7.6
of which:
Russian Federation - 4.7 7.3 7.1 6.4 6.7 8.1 7.5
Turkey e - 7.9 5.8 8.9 7.4 6.0 4.5 1.1 a – average; b – preliminary estimate; c – forecast; d – Albania, Bosnia & Herzegovina, Croatia, Montenegro, Serbia and FYR Macedonia; e – estimate based on GDP data released by Turkish Statistical Institute
Source: based on UNCTAD (2008a). 38. Globally, trade volumes have increased at a much greater rate than economic growth, as is evident from Figure 5.1. With the exception of 2001, when trade volumes actually decreased due to the prevailing economic conditions, the total volume of exports has substantially outstripped economic growth. The admittance of China to the WTO in December 2001 has been a significant factor in
12
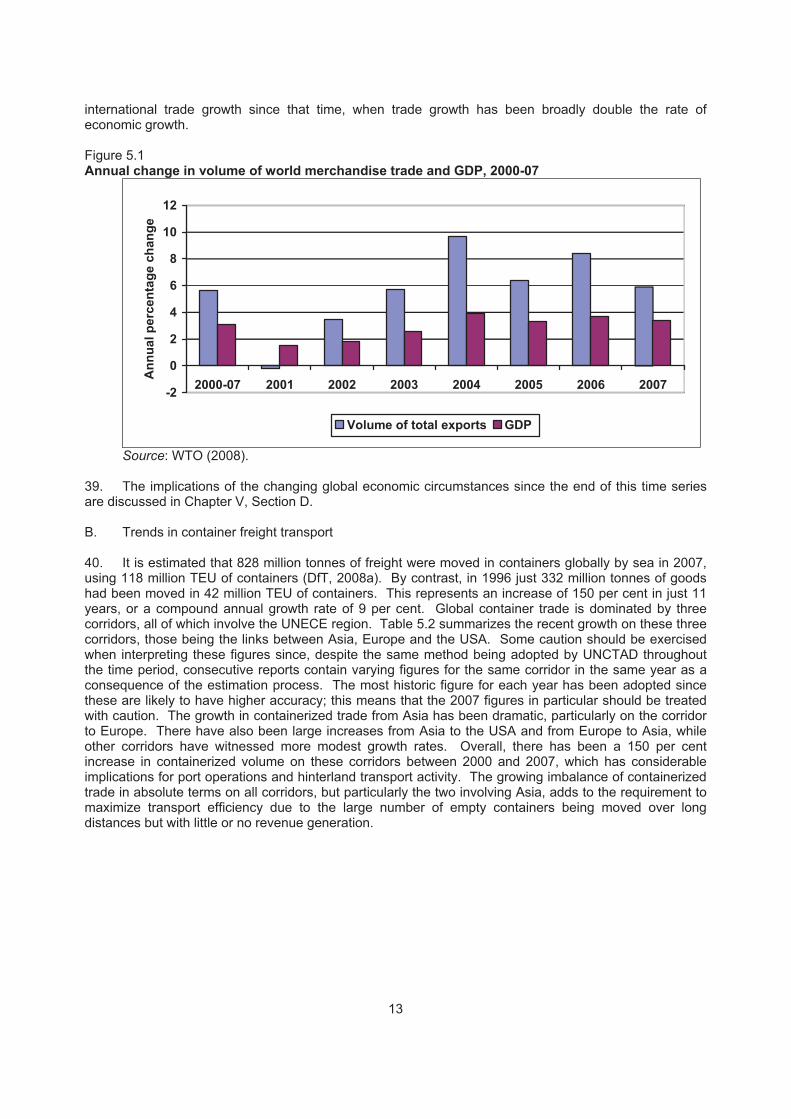
international trade growth since that time, when trade growth has been broadly double the rate of economic growth.
Figure 5.1 Annual change in volume of world merchandise trade and GDP, 2000-07
-2
0
2
4
6
8
10
12
2000-07 2001 2002 2003 2004 2005 2006 2007
Ann
ual p
erce
ntag
e ch
ange
Volume of total exports GDP
Source: WTO (2008).
39. The implications of the changing global economic circumstances since the end of this time series are discussed in Chapter V, Section D.
B. Trends in container freight transport
40. It is estimated that 828 million tonnes of freight were moved in containers globally by sea in 2007, using 118 million TEU of containers (DfT, 2008a). By contrast, in 1996 just 332 million tonnes of goods had been moved in 42 million TEU of containers. This represents an increase of 150 per cent in just 11 years, or a compound annual growth rate of 9 per cent. Global container trade is dominated by three corridors, all of which involve the UNECE region. Table 5.2 summarizes the recent growth on these three corridors, those being the links between Asia, Europe and the USA. Some caution should be exercised when interpreting these figures since, despite the same method being adopted by UNCTAD throughout the time period, consecutive reports contain varying figures for the same corridor in the same year as a consequence of the estimation process. The most historic figure for each year has been adopted since these are likely to have higher accuracy; this means that the 2007 figures in particular should be treated with caution. The growth in containerized trade from Asia has been dramatic, particularly on the corridor to Europe. There have also been large increases from Asia to the USA and from Europe to Asia, while other corridors have witnessed more modest growth rates. Overall, there has been a 150 per cent increase in containerized volume on these corridors between 2000 and 2007, which has considerable implications for port operations and hinterland transport activity. The growing imbalance of containerized trade in absolute terms on all corridors, but particularly the two involving Asia, adds to the requirement to maximize transport efficiency due to the large number of empty containers being moved over long distances but with little or no revenue generation.
13
2001 7.2 3.9 5.9 4.0 2.7 3.6
2002 8.8 3.9 3.9 6.1 1.5 2.6
2003 10.2 4.0 7.3 4.9 1.7 2.9
2004 12.4 4.2 8.9 5.2 1.7 3.2
2005 12.4 4.4 10.8 5.5 2.1 3.8
2006 15.0 4.7 15.3 9.1 2.5 4.4
2007 15.4 4.9 17.7 10.0 2.7 4.5
% change 2000-07
175 53 293 178 23 55
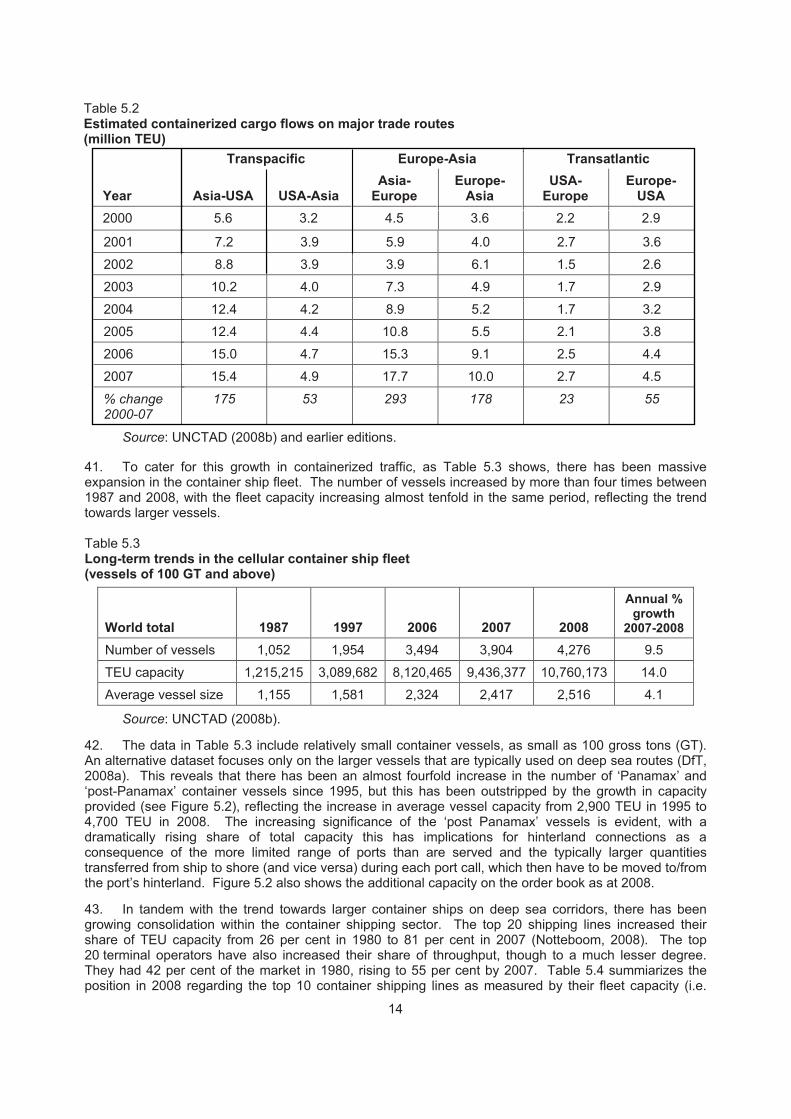
Source: UNCTAD (2008b) and earlier editions. 41. To cater for this growth in containerized traffic, as Table 5.3 shows, there has been massive expansion in the container ship fleet. The number of vessels increased by more than four times between 1987 and 2008, with the fleet capacity increasing almost tenfold in the same period, reflecting the trend towards larger vessels. Table 5.3 Long-term trends in the cellular container ship fleet (vessels of 100 GT and above)
World total 1987 1997 2006 2007 2008
Annual % growth
2007-2008
Number of vessels 1,052 1,954 3,494 3,904 4,276 9.5
TEU capacity 1,215,215 3,089,682 8,120,465 9,436,377 10,760,173 14.0
Average vessel size 1,155 1,581 2,324 2,417 2,516 4.1
Source: UNCTAD (2008b). 42. The data in Table 5.3 include relatively small container vessels, as small as 100 gross tons (GT). An alternative dataset focuses only on the larger vessels that are typically used on deep sea routes (DfT, 2008a). This reveals that there has been an almost fourfold increase in the number of ‘Panamax’ and ‘post-Panamax’ container vessels since 1995, but this has been outstripped by the growth in capacity provided (see Figure 5.2), reflecting the increase in average vessel capacity from 2,900 TEU in 1995 to 4,700 TEU in 2008. The increasing significance of the ‘post Panamax’ vessels is evident, with a dramatically rising share of total capacity this has implications for hinterland connections as a consequence of the more limited range of ports than are served and the typically larger quantities transferred from ship to shore (and vice versa) during each port call, which then have to be moved to/from the port’s hinterland. Figure 5.2 also shows the additional capacity on the order book as at 2008. 43. In tandem with the trend towards larger container ships on deep sea corridors, there has been growing consolidation within the container shipping sector. The top 20 shipping lines increased their share of TEU capacity from 26 per cent in 1980 to 81 per cent in 2007 (Notteboom, 2008). The top 20 terminal operators have also increased their share of throughput, though to a much lesser degree. They had 42 per cent of the market in 1980, rising to 55 per cent by 2007. Table 5.4 summiarizes the position in 2008 regarding the top 10 container shipping lines as measured by their fleet capacity (i.e.
14
Table 5.2 Estimated containerized cargo flows on major trade routes (million TEU)
Transpacific Europe-Asia Transatlantic
Year Asia-USA USA-Asia Asia-
Europe Europe-
Asia USA-
Europe Europe-
USA 2000 5.6 3.2 4.5 3.6 2.2 2.9
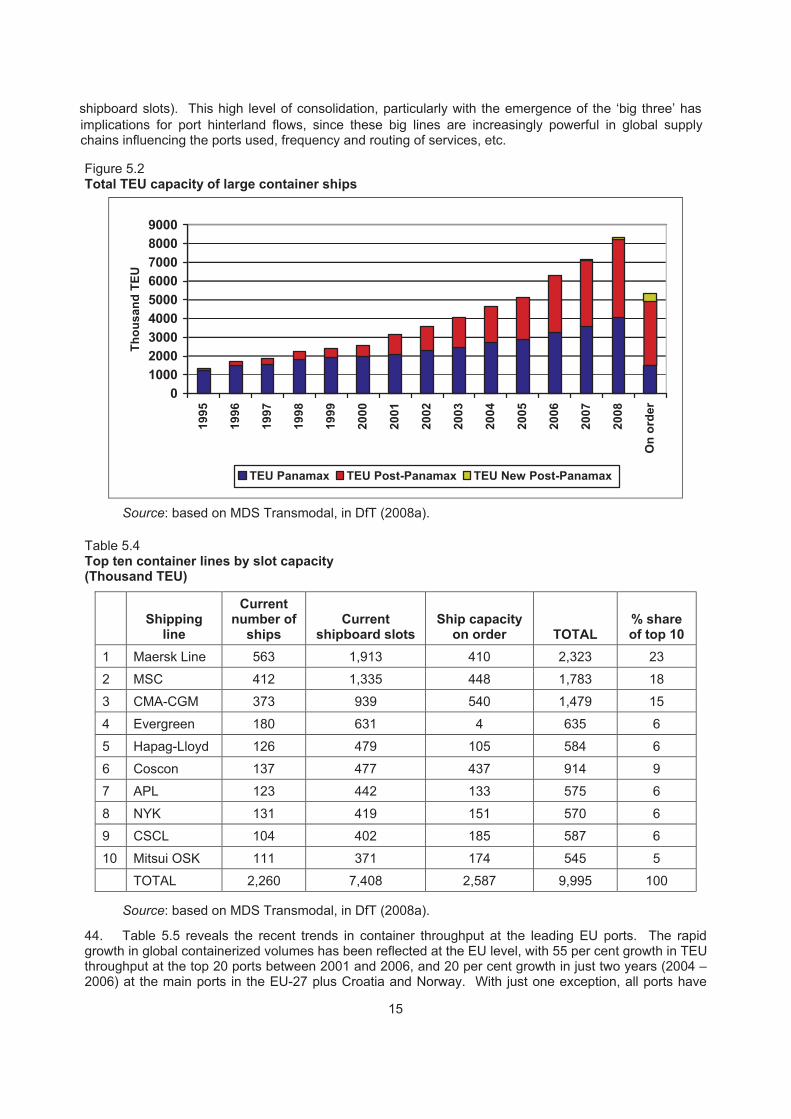
Figure 5.2 Total TEU capacity of large container ships
0100020003000400050006000700080009000
1995
1996
1997
1998
1999
2000
2001
2002
2003
2004
2005
2006
2007
2008
On
orde
r
Thou
sand
TEU
TEU Panamax TEU Post-Panamax TEU New Post-Panamax
Source: based on MDS Transmodal, in DfT (2008a).
Table 5.4 Top ten container lines by slot capacity (Thousand TEU)
Shipping line
Current number of
ships Current
shipboard slots Ship capacity
on order TOTAL % share of top 10
1 Maersk Line 563 1,913 410 2,323 23
2 MSC 412 1,335 448 1,783 18
3 CMA-CGM 373 939 540 1,479 15
4 Evergreen 180 631 4 635 6
5 Hapag-Lloyd 126 479 105 584 6
6 Coscon 137 477 437 914 9
7 APL 123 442 133 575 6
8 NYK 131 419 151 570 6
9 CSCL 104 402 185 587 6
10 Mitsui OSK 111 371 174 545 5
TOTAL 2,260 7,408 2,587 9,995 100
Source: based on MDS Transmodal, in DfT (2008a).
44. Table 5.5 reveals the recent trends in container throughput at the leading EU ports. The rapid growth in global containerized volumes has been reflected at the EU level, with 55 per cent growth in TEU throughput at the top 20 ports between 2001 and 2006, and 20 per cent growth in just two years (2004 – 2006) at the main ports in the EU-27 plus Croatia and Norway. With just one exception, all ports have
15
implications for port hinterland flows, since these big lines are increasingly powerful in global supply chains influencing the ports used, frequency and routing of services, etc.
shipboard slots). This high level of consolidation, particularly with the emergence of the ‘big three’ has
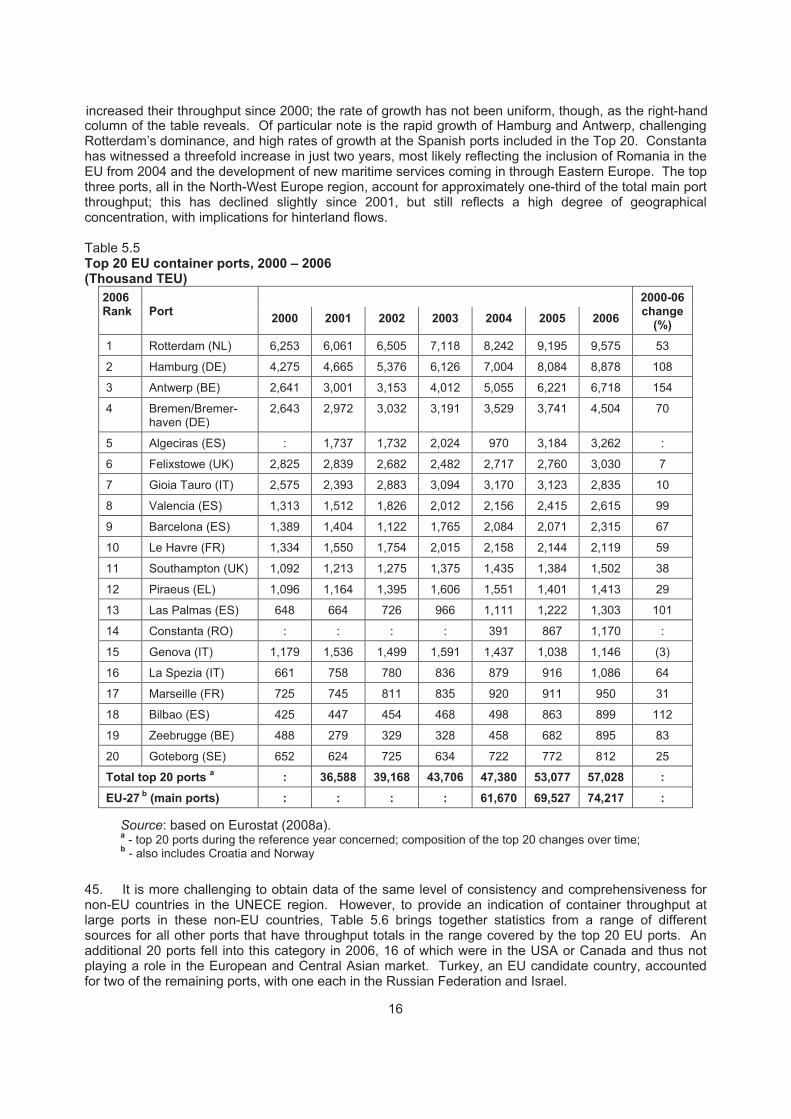
column of the table reveals. Of particular note is the rapid growth of Hamburg and Antwerp, challenging Rotterdam’s dominance, and high rates of growth at the Spanish ports included in the Top 20. Constanta has witnessed a threefold increase in just two years, most likely reflecting the inclusion of Romania in the EU from 2004 and the development of new maritime services coming in through Eastern Europe. The top three ports, all in the North-West Europe region, account for approximately one-third of the total main port throughput; this has declined slightly since 2001, but still reflects a high degree of geographical concentration, with implications for hinterland flows. Table 5.5 Top 20 EU container ports, 2000 – 2006 (Thousand TEU)
2006 Rank
Port 2000 2001 2002 2003 2004 2005 2006
2000-06 change
(%)
1 Rotterdam (NL) 6,253 6,061 6,505 7,118 8,242 9,195 9,575 53
2 Hamburg (DE) 4,275 4,665 5,376 6,126 7,004 8,084 8,878 108
3 Antwerp (BE) 2,641 3,001 3,153 4,012 5,055 6,221 6,718 154
4 Bremen/Bremer-haven (DE)
2,643 2,972 3,032 3,191 3,529 3,741 4,504 70
5 Algeciras (ES) : 1,737 1,732 2,024 970 3,184 3,262 :
6 Felixstowe (UK) 2,825 2,839 2,682 2,482 2,717 2,760 3,030 7
7 Gioia Tauro (IT) 2,575 2,393 2,883 3,094 3,170 3,123 2,835 10
8 Valencia (ES) 1,313 1,512 1,826 2,012 2,156 2,415 2,615 99
9 Barcelona (ES) 1,389 1,404 1,122 1,765 2,084 2,071 2,315 67
10 Le Havre (FR) 1,334 1,550 1,754 2,015 2,158 2,144 2,119 59
11 Southampton (UK) 1,092 1,213 1,275 1,375 1,435 1,384 1,502 38
12 Piraeus (EL) 1,096 1,164 1,395 1,606 1,551 1,401 1,413 29
13 Las Palmas (ES) 648 664 726 966 1,111 1,222 1,303 101
14 Constanta (RO) : : : : 391 867 1,170 :
15 Genova (IT) 1,179 1,536 1,499 1,591 1,437 1,038 1,146 (3)
16 La Spezia (IT) 661 758 780 836 879 916 1,086 64
17 Marseille (FR) 725 745 811 835 920 911 950 31
18 Bilbao (ES) 425 447 454 468 498 863 899 112
19 Zeebrugge (BE) 488 279 329 328 458 682 895 83
20 Goteborg (SE) 652 624 725 634 722 772 812 25
Total top 20 ports a : 36,588 39,168 43,706 47,380 53,077 57,028 :
EU-27 b (main ports) : : : : 61,670 69,527 74,217 :
Source: based on Eurostat (2008a). a - top 20 ports during the reference year concerned; composition of the top 20 changes over time; b - also includes Croatia and Norway
45. It is more challenging to obtain data of the same level of consistency and comprehensiveness for non-EU countries in the UNECE region. However, to provide an indication of container throughput at large ports in these non-EU countries, Table 5.6 brings together statistics from a range of different sources for all other ports that have throughput totals in the range covered by the top 20 EU ports. An additional 20 ports fell into this category in 2006, 16 of which were in the USA or Canada and thus not playing a role in the European and Central Asian market. Turkey, an EU candidate country, accounted for two of the remaining ports, with one each in the Russian Federation and Israel.
16
increased their throughput since 2000; the rate of growth has not been uniform, though, as the right-hand
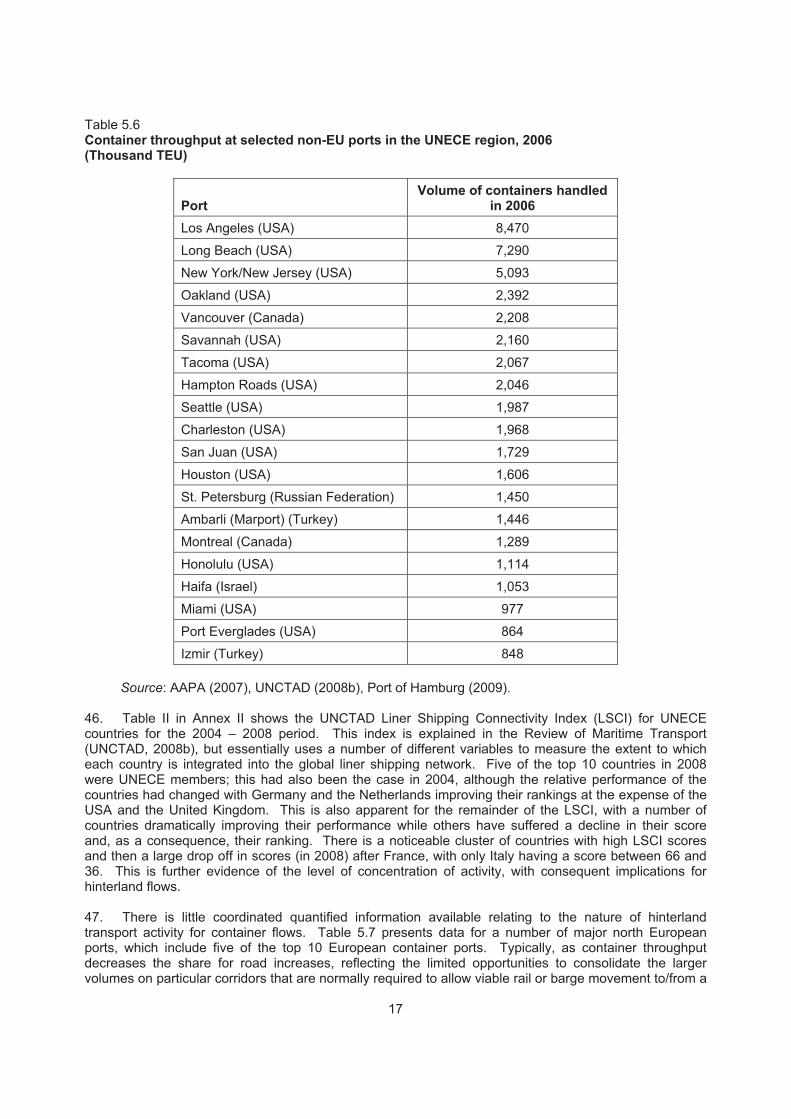
Table 5.6 Container throughput at selected non-EU ports in the UNECE region, 2006 (Thousand TEU)
Port
Volume of containers handled in 2006
Los Angeles (USA) 8,470
Long Beach (USA) 7,290
New York/New Jersey (USA) 5,093
Oakland (USA) 2,392
Vancouver (Canada) 2,208
Savannah (USA) 2,160
Tacoma (USA) 2,067
Hampton Roads (USA) 2,046
Seattle (USA) 1,987
Charleston (USA) 1,968
San Juan (USA) 1,729
Houston (USA) 1,606
St. Petersburg (Russian Federation) 1,450
Ambarli (Marport) (Turkey) 1,446
Montreal (Canada) 1,289
Honolulu (USA) 1,114
Haifa (Israel) 1,053
Miami (USA) 977
Port Everglades (USA) 864
Izmir (Turkey) 848
Source: AAPA (2007), UNCTAD (2008b), Port of Hamburg (2009). 46. Table II in Annex II shows the UNCTAD Liner Shipping Connectivity Index (LSCI) for UNECE countries for the 2004 – 2008 period. This index is explained in the Review of Maritime Transport (UNCTAD, 2008b), but essentially uses a number of different variables to measure the extent to which each country is integrated into the global liner shipping network. Five of the top 10 countries in 2008 were UNECE members; this had also been the case in 2004, although the relative performance of the countries had changed with Germany and the Netherlands improving their rankings at the expense of the USA and the United Kingdom. This is also apparent for the remainder of the LSCI, with a number of countries dramatically improving their performance while others have suffered a decline in their score and, as a consequence, their ranking. There is a noticeable cluster of countries with high LSCI scores and then a large drop off in scores (in 2008) after France, with only Italy having a score between 66 and 36. This is further evidence of the level of concentration of activity, with consequent implications for hinterland flows. 47. There is little coordinated quantified information available relating to the nature of hinterland transport activity for container flows. Table 5.7 presents data for a number of major north European ports, which include five of the top 10 European container ports. Typically, as container throughput decreases the share for road increases, reflecting the limited opportunities to consolidate the larger volumes on particular corridors that are normally required to allow viable rail or barge movement to/from a
17
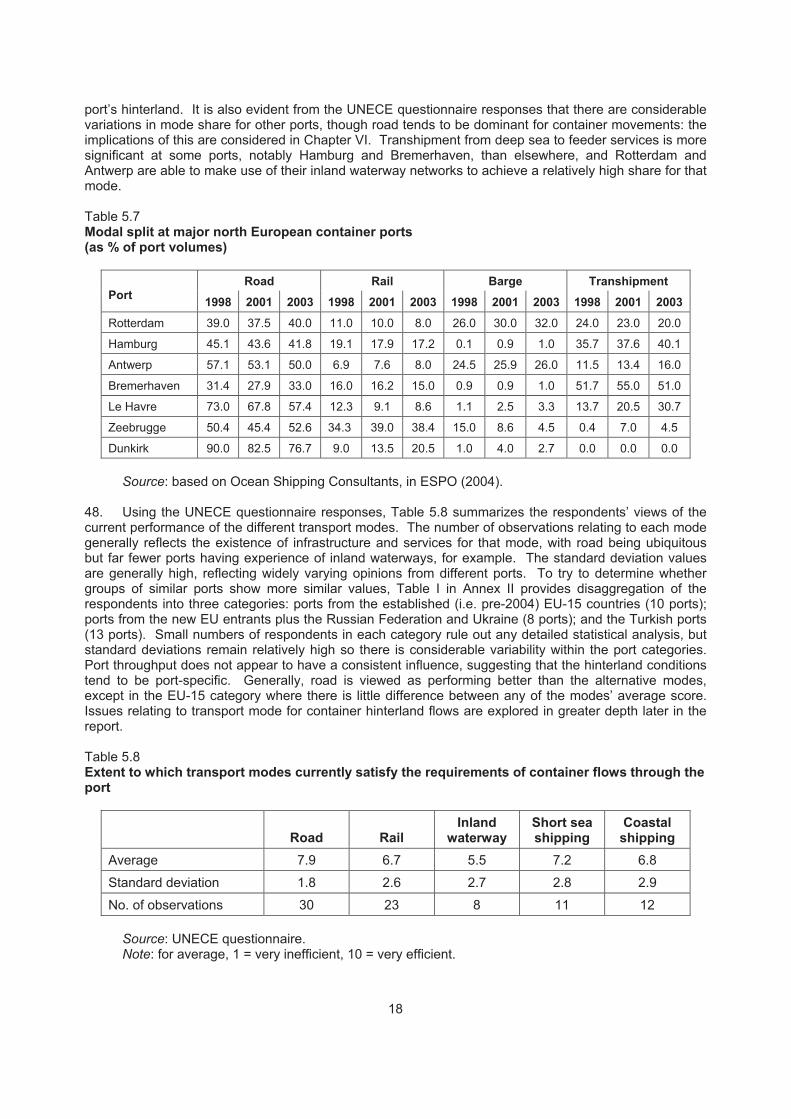
port’s hinterland. It is also evident from the UNECE questionnaire responses that there are considerable variations in mode share for other ports, though road tends to be dominant for container movements: the implications of this are considered in Chapter VI. Transhipment from deep sea to feeder services is more significant at some ports, notably Hamburg and Bremerhaven, than elsewhere, and Rotterdam and Antwerp are able to make use of their inland waterway networks to achieve a relatively high share for that mode. Table 5.7 Modal split at major north European container ports (as % of port volumes)
Road Rail Barge Transhipment Port 1998 2001 2003 1998 2001 2003 1998 2001 2003 1998 2001 2003
Rotterdam 39.0 37.5 40.0 11.0 10.0 8.0 26.0 30.0 32.0 24.0 23.0 20.0
Hamburg 45.1 43.6 41.8 19.1 17.9 17.2 0.1 0.9 1.0 35.7 37.6 40.1
Antwerp 57.1 53.1 50.0 6.9 7.6 8.0 24.5 25.9 26.0 11.5 13.4 16.0
Bremerhaven 31.4 27.9 33.0 16.0 16.2 15.0 0.9 0.9 1.0 51.7 55.0 51.0
Le Havre 73.0 67.8 57.4 12.3 9.1 8.6 1.1 2.5 3.3 13.7 20.5 30.7
Zeebrugge 50.4 45.4 52.6 34.3 39.0 38.4 15.0 8.6 4.5 0.4 7.0 4.5
Dunkirk 90.0 82.5 76.7 9.0 13.5 20.5 1.0 4.0 2.7 0.0 0.0 0.0
Source: based on Ocean Shipping Consultants, in ESPO (2004). 48. Using the UNECE questionnaire responses, Table 5.8 summarizes the respondents’ views of the current performance of the different transport modes. The number of observations relating to each mode generally reflects the existence of infrastructure and services for that mode, with road being ubiquitous but far fewer ports having experience of inland waterways, for example. The standard deviation values are generally high, reflecting widely varying opinions from different ports. To try to determine whether groups of similar ports show more similar values, Table I in Annex II provides disaggregation of the respondents into three categories: ports from the established (i.e. pre-2004) EU-15 countries (10 ports); ports from the new EU entrants plus the Russian Federation and Ukraine (8 ports); and the Turkish ports (13 ports). Small numbers of respondents in each category rule out any detailed statistical analysis, but standard deviations remain relatively high so there is considerable variability within the port categories. Port throughput does not appear to have a consistent influence, suggesting that the hinterland conditions tend to be port-specific. Generally, road is viewed as performing better than the alternative modes, except in the EU-15 category where there is little difference between any of the modes’ average score. Issues relating to transport mode for container hinterland flows are explored in greater depth later in the report. Table 5.8 Extent to which transport modes currently satisfy the requirements of container flows through the port
Road Rail Inland
waterway Short sea shipping
Coastal shipping
Average 7.9 6.7 5.5 7.2 6.8
Standard deviation 1.8 2.6 2.7 2.8 2.9
No. of observations 30 23 8 11 12
Source: UNECE questionnaire. Note: for average, 1 = very inefficient, 10 = very efficient.
18
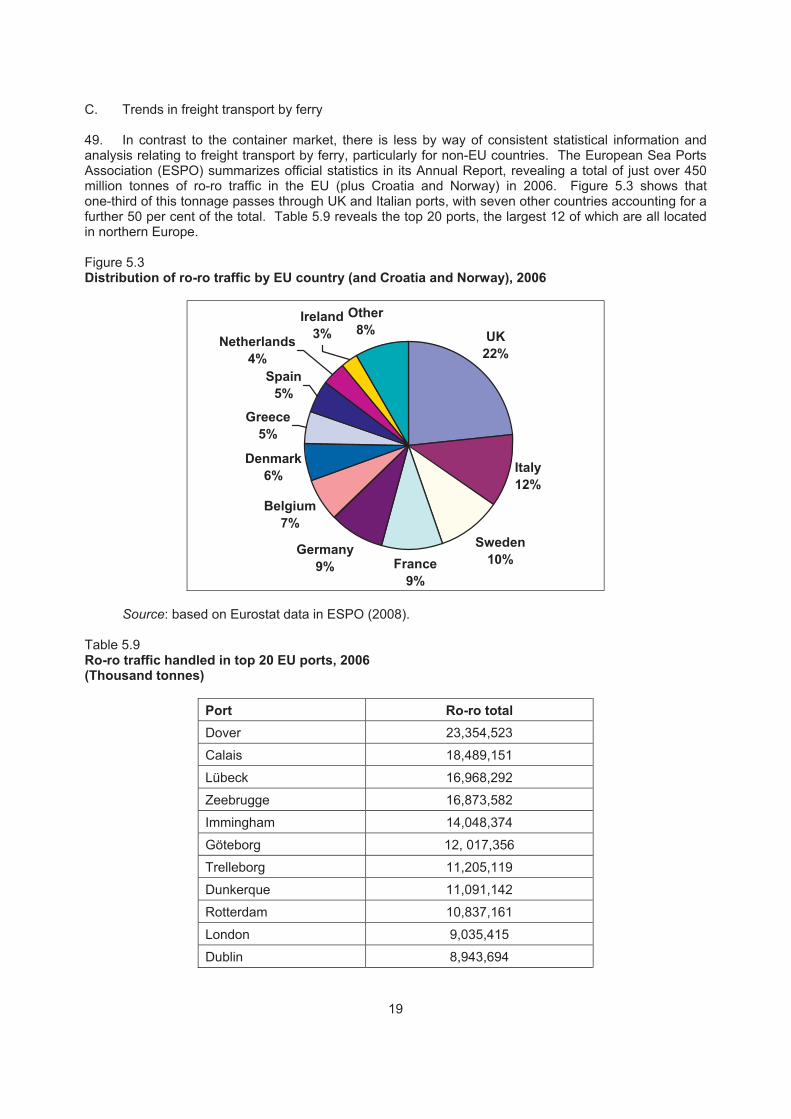
C. Trends in freight transport by ferry
49. In contrast to the container market, there is less by way of consistent statistical information and analysis relating to freight transport by ferry, particularly for non-EU countries. The European Sea Ports Association (ESPO) summarizes official statistics in its Annual Report, revealing a total of just over 450 million tonnes of ro-ro traffic in the EU (plus Croatia and Norway) in 2006. Figure 5.3 shows that one-third of this tonnage passes through UK and Italian ports, with seven other countries accounting for a further 50 per cent of the total. Table 5.9 reveals the top 20 ports, the largest 12 of which are all located in northern Europe.
Figure 5.3 Distribution of ro-ro traffic by EU country (and Croatia and Norway), 2006
UK22%
Italy12%
Sweden10%France
9%
Germany9%
Belgium7%
Denmark6%
Greece5%
Spain5%
Other8%
Netherlands4%
Ireland3%
Source: based on Eurostat data in ESPO (2008).
Table 5.9 Ro-ro traffic handled in top 20 EU ports, 2006 (Thousand tonnes)
Port Ro-ro total Dover 23,354,523
Calais 18,489,151
Lübeck 16,968,292
Zeebrugge 16,873,582
Immingham 14,048,374
Göteborg 12, 017,356
Trelleborg 11,205,119
Dunkerque 11,091,142
Rotterdam 10,837,161
London 9,035,415
Dublin 8,943,694
19
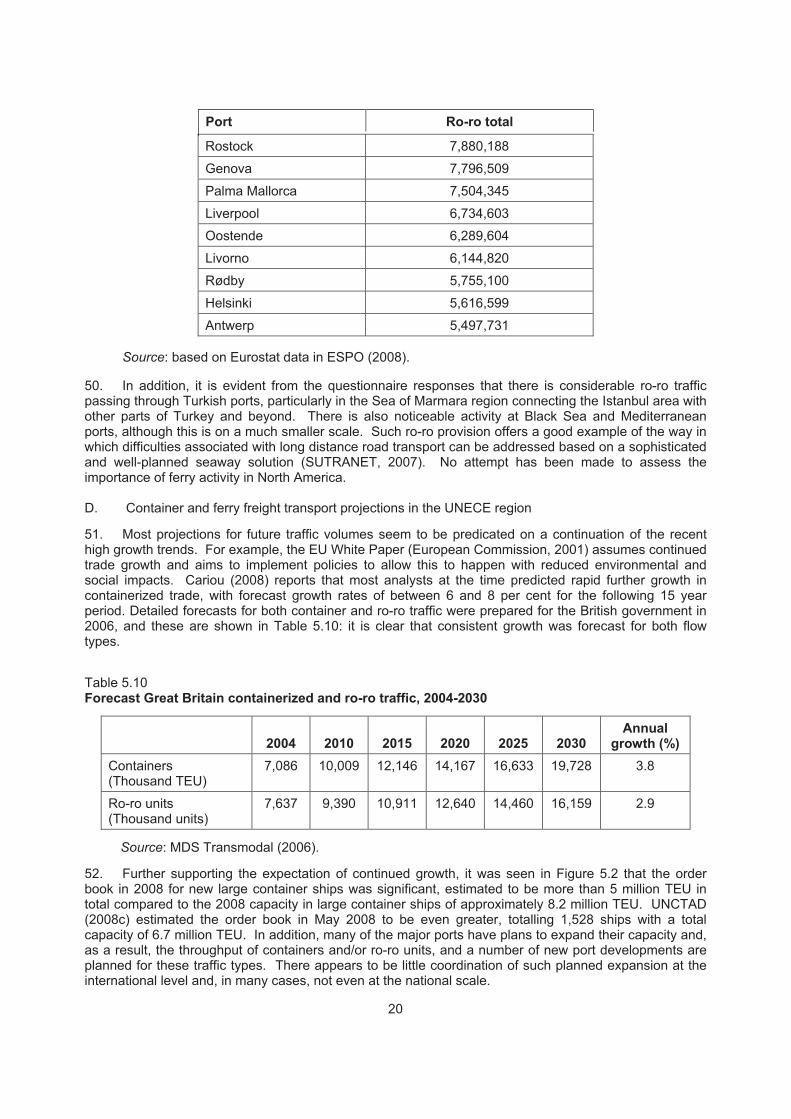
Rostock 7,880,188
Genova 7,796,509
Palma Mallorca 7,504,345
Liverpool 6,734,603
Oostende 6,289,604
Livorno 6,144,820
Rødby 5,755,100
Helsinki 5,616,599
Antwerp 5,497,731
Source: based on Eurostat data in ESPO (2008).
50. In addition, it is evident from the questionnaire responses that there is considerable ro-ro traffic passing through Turkish ports, particularly in the Sea of Marmara region connecting the Istanbul area with other parts of Turkey and beyond. There is also noticeable activity at Black Sea and Mediterranean ports, although this is on a much smaller scale. Such ro-ro provision offers a good example of the way in which difficulties associated with long distance road transport can be addressed based on a sophisticated and well-planned seaway solution (SUTRANET, 2007). No attempt has been made to assess the importance of ferry activity in North America. D. Container and ferry freight transport projections in the UNECE region 51. Most projections for future traffic volumes seem to be predicated on a continuation of the recent high growth trends. For example, the EU White Paper (European Commission, 2001) assumes continued trade growth and aims to implement policies to allow this to happen with reduced environmental and social impacts. Cariou (2008) reports that most analysts at the time predicted rapid further growth in containerized trade, with forecast growth rates of between 6 and 8 per cent for the following 15 year period. Detailed forecasts for both container and ro-ro traffic were prepared for the British government in 2006, and these are shown in Table 5.10: it is clear that consistent growth was forecast for both flow types.
Table 5.10 Forecast Great Britain containerized and ro-ro traffic, 2004-2030
2004 2010 2015 2020 2025 2030 Annual
growth (%) Containers (Thousand TEU)
7,086 10,009 12,146 14,167 16,633 19,728 3.8
Ro-ro units (Thousand units)
7,637 9,390 10,911 12,640 14,460 16,159 2.9
Source: MDS Transmodal (2006).
52. Further supporting the expectation of continued growth, it was seen in Figure 5.2 that the order book in 2008 for new large container ships was significant, estimated to be more than 5 million TEU in total compared to the 2008 capacity in large container ships of approximately 8.2 million TEU. UNCTAD (2008c) estimated the order book in May 2008 to be even greater, totalling 1,528 ships with a total capacity of 6.7 million TEU. In addition, many of the major ports have plans to expand their capacity and, as a result, the throughput of containers and/or ro-ro units, and a number of new port developments are planned for these traffic types. There appears to be little coordination of such planned expansion at the international level and, in many cases, not even at the national scale.
20
Port Ro-ro total
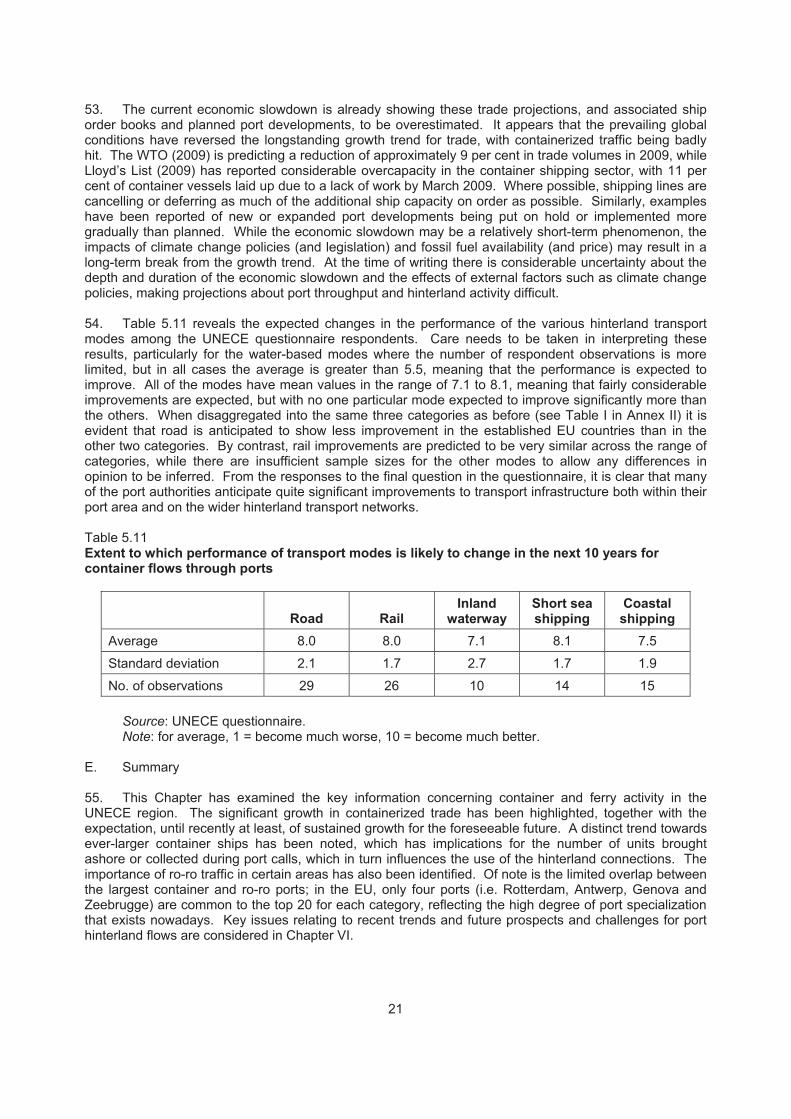
53. The current economic slowdown is already showing these trade projections, and associated ship order books and planned port developments, to be overestimated. It appears that the prevailing global conditions have reversed the longstanding growth trend for trade, with containerized traffic being badly hit. The WTO (2009) is predicting a reduction of approximately 9 per cent in trade volumes in 2009, while Lloyd’s List (2009) has reported considerable overcapacity in the container shipping sector, with 11 per cent of container vessels laid up due to a lack of work by March 2009. Where possible, shipping lines are cancelling or deferring as much of the additional ship capacity on order as possible. Similarly, examples have been reported of new or expanded port developments being put on hold or implemented more gradually than planned. While the economic slowdown may be a relatively short-term phenomenon, the impacts of climate change policies (and legislation) and fossil fuel availability (and price) may result in a long-term break from the growth trend. At the time of writing there is considerable uncertainty about the depth and duration of the economic slowdown and the effects of external factors such as climate change policies, making projections about port throughput and hinterland activity difficult. 54. Table 5.11 reveals the expected changes in the performance of the various hinterland transport modes among the UNECE questionnaire respondents. Care needs to be taken in interpreting these results, particularly for the water-based modes where the number of respondent observations is more limited, but in all cases the average is greater than 5.5, meaning that the performance is expected to improve. All of the modes have mean values in the range of 7.1 to 8.1, meaning that fairly considerable improvements are expected, but with no one particular mode expected to improve significantly more than the others. When disaggregated into the same three categories as before (see Table I in Annex II) it is evident that road is anticipated to show less improvement in the established EU countries than in the other two categories. By contrast, rail improvements are predicted to be very similar across the range of categories, while there are insufficient sample sizes for the other modes to allow any differences in opinion to be inferred. From the responses to the final question in the questionnaire, it is clear that many of the port authorities anticipate quite significant improvements to transport infrastructure both within their port area and on the wider hinterland transport networks. Table 5.11 Extent to which performance of transport modes is likely to change in the next 10 years for container flows through ports
Road Rail Inland
waterway Short sea shipping
Coastal shipping
Average 8.0 8.0 7.1 8.1 7.5
Standard deviation 2.1 1.7 2.7 1.7 1.9
No. of observations 29 26 10 14 15
Source: UNECE questionnaire. Note: for average, 1 = become much worse, 10 = become much better.
E. Summary 55. This Chapter has examined the key information concerning container and ferry activity in the UNECE region. The significant growth in containerized trade has been highlighted, together with the expectation, until recently at least, of sustained growth for the foreseeable future. A distinct trend towards ever-larger container ships has been noted, which has implications for the number of units brought ashore or collected during port calls, which in turn influences the use of the hinterland connections. The importance of ro-ro traffic in certain areas has also been identified. Of note is the limited overlap between the largest container and ro-ro ports; in the EU, only four ports (i.e. Rotterdam, Antwerp, Genova and Zeebrugge) are common to the top 20 for each category, reflecting the high degree of port specialization that exists nowadays. Key issues relating to recent trends and future prospects and challenges for port hinterland flows are considered in Chapter VI.
21
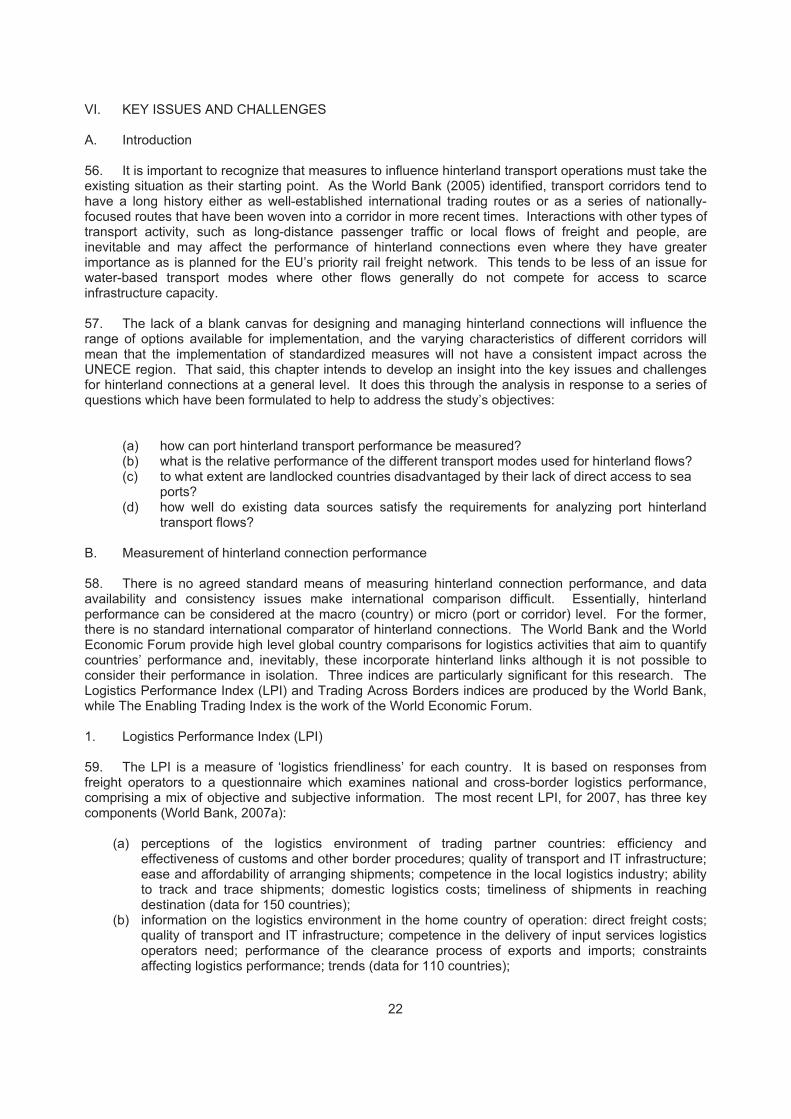
VI. KEY ISSUES AND CHALLENGES A. Introduction 56. It is important to recognize that measures to influence hinterland transport operations must take the existing situation as their starting point. As the World Bank (2005) identified, transport corridors tend to have a long history either as well-established international trading routes or as a series of nationally-focused routes that have been woven into a corridor in more recent times. Interactions with other types of transport activity, such as long-distance passenger traffic or local flows of freight and people, are inevitable and may affect the performance of hinterland connections even where they have greater importance as is planned for the EU’s priority rail freight network. This tends to be less of an issue for water-based transport modes where other flows generally do not compete for access to scarce infrastructure capacity. 57. The lack of a blank canvas for designing and managing hinterland connections will influence the range of options available for implementation, and the varying characteristics of different corridors will mean that the implementation of standardized measures will not have a consistent impact across the UNECE region. That said, this chapter intends to develop an insight into the key issues and challenges for hinterland connections at a general level. It does this through the analysis in response to a series of questions which have been formulated to help to address the study’s objectives:
(a) how can port hinterland transport performance be measured? (b) what is the relative performance of the different transport modes used for hinterland flows? (c) to what extent are landlocked countries disadvantaged by their lack of direct access to sea
ports? (d) how well do existing data sources satisfy the requirements for analyzing port hinterland
transport flows?
B. Measurement of hinterland connection performance 58. There is no agreed standard means of measuring hinterland connection performance, and data availability and consistency issues make international comparison difficult. Essentially, hinterland performance can be considered at the macro (country) or micro (port or corridor) level. For the former, there is no standard international comparator of hinterland connections. The World Bank and the World Economic Forum provide high level global country comparisons for logistics activities that aim to quantify countries’ performance and, inevitably, these incorporate hinterland links although it is not possible to consider their performance in isolation. Three indices are particularly significant for this research. The Logistics Performance Index (LPI) and Trading Across Borders indices are produced by the World Bank, while The Enabling Trading Index is the work of the World Economic Forum. 1. Logistics Performance Index (LPI) 59. The LPI is a measure of ‘logistics friendliness’ for each country. It is based on responses from freight operators to a questionnaire which examines national and cross-border logistics performance, comprising a mix of objective and subjective information. The most recent LPI, for 2007, has three key components (World Bank, 2007a):
(a) perceptions of the logistics environment of trading partner countries: efficiency and effectiveness of customs and other border procedures; quality of transport and IT infrastructure; ease and affordability of arranging shipments; competence in the local logistics industry; ability to track and trace shipments; domestic logistics costs; timeliness of shipments in reaching destination (data for 150 countries);
(b) information on the logistics environment in the home country of operation: direct freight costs; quality of transport and IT infrastructure; competence in the delivery of input services logistics operators need; performance of the clearance process of exports and imports; constraints affecting logistics performance; trends (data for 110 countries);
22
(c) real time-cost performance data for country of operation: number of border agencies; customs performance indicators; percentage of damaged shipments; lead times to export and import (data for 100 countries).
60. The LPI outputs are expressed using scores for seven key factors; the scores for the UNECE countries are presented in Table III in Annex II, where the countries are listed according to their global ranking (see left hand column) for their overall LPI score. Forty-eight of the 56 UNECE countries are included in the LPI, with certain Central Asian and small European countries omitted. 61. While the results are informative and reveal considerable differences between countries in the overall LPI scores, together with variability in specific factors, the methodology involves a certain degree of subjectivity. Of the seven factors, all potentially can be linked in some way to hinterland transport and it is difficult to clearly identify the role of each one. There is generally a high correlation between the set of factors, with scores gradually decreasing down the rankings. The ‘domestic logistics costs’ factor is somewhat an anomaly, with a more erratic pattern and less overall variability than for the other factors. In broad terms, the rankings are as expected with the traditional EU countries, plus other long established developed countries such as the Austria, Canada, Norway, Switzerland and USA scoring more highly than the emerging economies further east in the UNECE region. 2. Trading Across Borders 62. As its name suggests, Trading Across Borders focuses specifically on the procedures necessary for exporting and importing goods (World Bank, 2008b). The database covers 181 economies, including 49 UNECE countries, and adopts a standardized methodology for identifying the cost and time associated with transporting a loaded standard 20’ container from factory to port of exit for exports and from port of entry to distribution centre for imports, together with the official documentation necessary to meet all customs requirements. Table IV in Annex II shows the results for each UNECE country included in the database. 3. Enabling Trade Index 63. The Enabling Trade Index 2008 (World Economic Forum, 2008) has a similar intention, includes 118 countries and comprises four sub-indexes which cover market access, border administration, transport and communications infrastructure and business environment. Forty-five UNECE countries are represented in the index. The data in the report are sourced from approximately 25 different sources (national authorities, international agencies and private sources), together with an Executive Opinion Survey. Table V in Annex II presents the rankings and scores for the UNECE countries. As with the LPI, the established economies tend to perform much better in these indices than do the emerging economies in the EECCA region. 4. Evidence gap 64. There is no consistent analysis of hinterland connections at the individual port or corridor level. Individual ports typically measure their hinterland performance in terms of their connectivity to inland locations through measures relating to the number of inland terminals served and the frequencies, journey times and/or quantities of goods flowing to these terminals or geographical areas. The World Bank (2005) has attempted to define a Corridor Service Analysis, based on three key perspectives: infrastructure, service quality and goods movement. Cost and time factors can be represented graphically for ease of comprehension. However, none of these measures provides an integrated assessment of supply chain performance reflecting the importance of hinterland connections. 65. In considering port hinterland connections, it is imperative to consider more than just the existence of physical infrastructure. Infrastructure attributes, such as speed, capacity and quality, are important, as are the wider transport performance measures that affect supply chain decision making, such as transit time variability and in-transit risk. Measures relating to environmental performance are increasingly important. The development of a new tool based on analysis of both supply and demand side factors
23
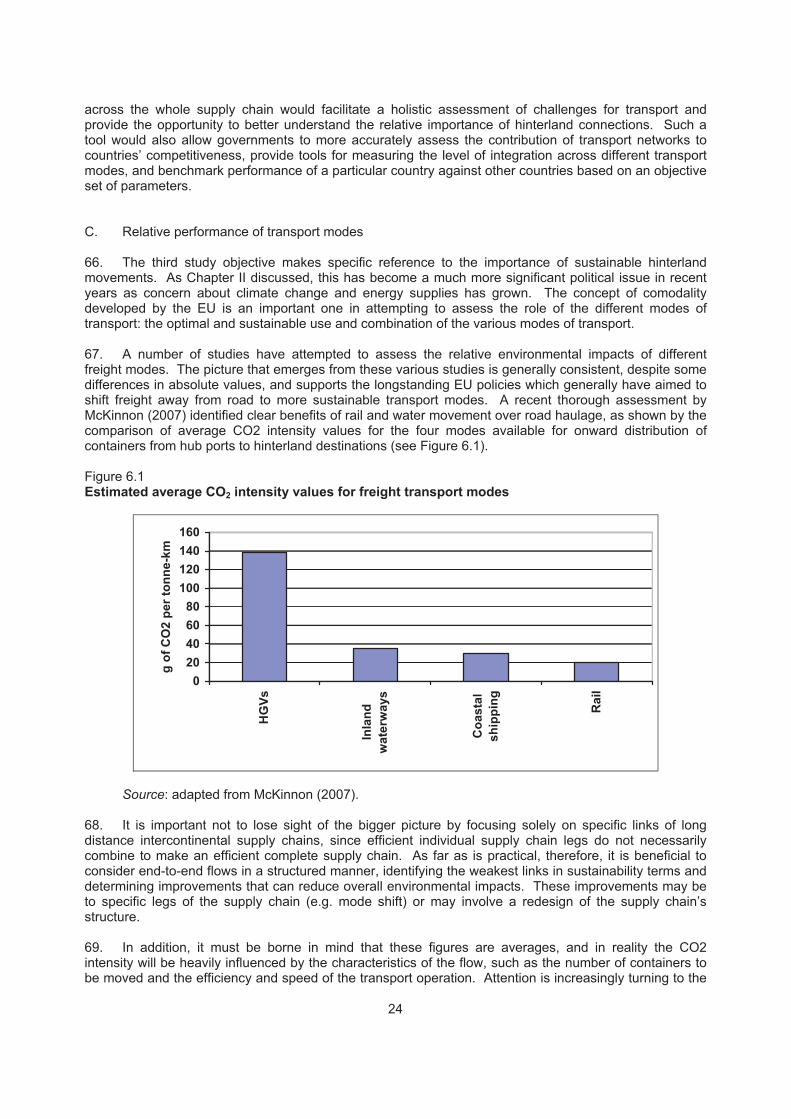
across the whole supply chain would facilitate a holistic assessment of challenges for transport and provide the opportunity to better understand the relative importance of hinterland connections. Such a tool would also allow governments to more accurately assess the contribution of transport networks to countries’ competitiveness, provide tools for measuring the level of integration across different transport modes, and benchmark performance of a particular country against other countries based on an objective set of parameters.
C. Relative performance of transport modes
66. The third study objective makes specific reference to the importance of sustainable hinterland movements. As Chapter II discussed, this has become a much more significant political issue in recent years as concern about climate change and energy supplies has grown. The concept of comodality developed by the EU is an important one in attempting to assess the role of the different modes of transport: the optimal and sustainable use and combination of the various modes of transport.
67. A number of studies have attempted to assess the relative environmental impacts of different freight modes. The picture that emerges from these various studies is generally consistent, despite some differences in absolute values, and supports the longstanding EU policies which generally have aimed to shift freight away from road to more sustainable transport modes. A recent thorough assessment by McKinnon (2007) identified clear benefits of rail and water movement over road haulage, as shown by the comparison of average CO2 intensity values for the four modes available for onward distribution of containers from hub ports to hinterland destinations (see Figure 6.1).
Figure 6.1 Estimated average CO2 intensity values for freight transport modes
020406080
100120140160
HG
Vs
Inla
ndw
ater
way
s
Coa
stal
ship
ping Rai
l
g of
CO
2 pe
r ton
ne-k
m
Source: adapted from McKinnon (2007).
68. It is important not to lose sight of the bigger picture by focusing solely on specific links of long distance intercontinental supply chains, since efficient individual supply chain legs do not necessarily combine to make an efficient complete supply chain. As far as is practical, therefore, it is beneficial to consider end-to-end flows in a structured manner, identifying the weakest links in sustainability terms and determining improvements that can reduce overall environmental impacts. These improvements may be to specific legs of the supply chain (e.g. mode shift) or may involve a redesign of the supply chain’s structure.
69. In addition, it must be borne in mind that these figures are averages, and in reality the CO2 intensity will be heavily influenced by the characteristics of the flow, such as the number of containers to be moved and the efficiency and speed of the transport operation. Attention is increasingly turning to the
24
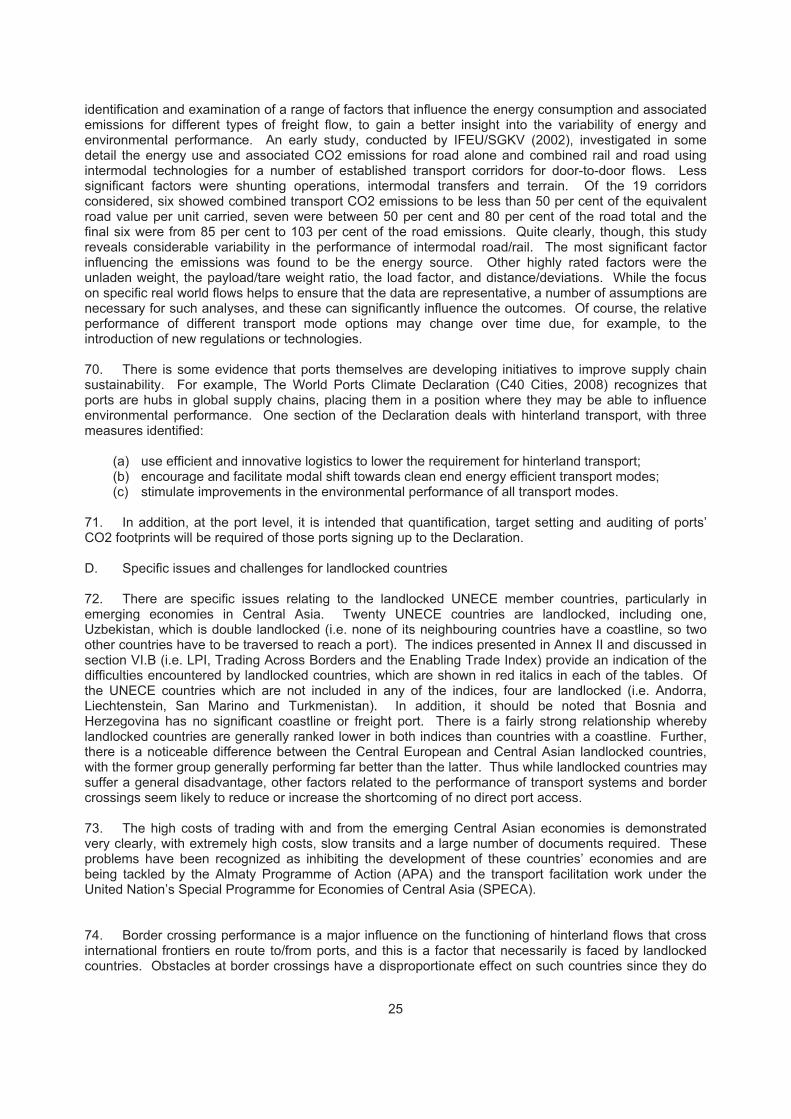
identification and examination of a range of factors that influence the energy consumption and associated emissions for different types of freight flow, to gain a better insight into the variability of energy and environmental performance. An early study, conducted by IFEU/SGKV (2002), investigated in some detail the energy use and associated CO2 emissions for road alone and combined rail and road using intermodal technologies for a number of established transport corridors for door-to-door flows. Less significant factors were shunting operations, intermodal transfers and terrain. Of the 19 corridors considered, six showed combined transport CO2 emissions to be less than 50 per cent of the equivalent road value per unit carried, seven were between 50 per cent and 80 per cent of the road total and the final six were from 85 per cent to 103 per cent of the road emissions. Quite clearly, though, this study reveals considerable variability in the performance of intermodal road/rail. The most significant factor influencing the emissions was found to be the energy source. Other highly rated factors were the unladen weight, the payload/tare weight ratio, the load factor, and distance/deviations. While the focus on specific real world flows helps to ensure that the data are representative, a number of assumptions are necessary for such analyses, and these can significantly influence the outcomes. Of course, the relative performance of different transport mode options may change over time due, for example, to the introduction of new regulations or technologies. 70. There is some evidence that ports themselves are developing initiatives to improve supply chain sustainability. For example, The World Ports Climate Declaration (C40 Cities, 2008) recognizes that ports are hubs in global supply chains, placing them in a position where they may be able to influence environmental performance. One section of the Declaration deals with hinterland transport, with three measures identified:
(a) use efficient and innovative logistics to lower the requirement for hinterland transport; (b) encourage and facilitate modal shift towards clean end energy efficient transport modes; (c) stimulate improvements in the environmental performance of all transport modes.
71. In addition, at the port level, it is intended that quantification, target setting and auditing of ports’ CO2 footprints will be required of those ports signing up to the Declaration. D. Specific issues and challenges for landlocked countries 72. There are specific issues relating to the landlocked UNECE member countries, particularly in emerging economies in Central Asia. Twenty UNECE countries are landlocked, including one, Uzbekistan, which is double landlocked (i.e. none of its neighbouring countries have a coastline, so two other countries have to be traversed to reach a port). The indices presented in Annex II and discussed in section VI.B (i.e. LPI, Trading Across Borders and the Enabling Trade Index) provide an indication of the difficulties encountered by landlocked countries, which are shown in red italics in each of the tables. Of the UNECE countries which are not included in any of the indices, four are landlocked (i.e. Andorra, Liechtenstein, San Marino and Turkmenistan). In addition, it should be noted that Bosnia and Herzegovina has no significant coastline or freight port. There is a fairly strong relationship whereby landlocked countries are generally ranked lower in both indices than countries with a coastline. Further, there is a noticeable difference between the Central European and Central Asian landlocked countries, with the former group generally performing far better than the latter. Thus while landlocked countries may suffer a general disadvantage, other factors related to the performance of transport systems and border crossings seem likely to reduce or increase the shortcoming of no direct port access. 73. The high costs of trading with and from the emerging Central Asian economies is demonstrated very clearly, with extremely high costs, slow transits and a large number of documents required. These problems have been recognized as inhibiting the development of these countries’ economies and are being tackled by the Almaty Programme of Action (APA) and the transport facilitation work under the United Nation’s Special Programme for Economies of Central Asia (SPECA). 74. Border crossing performance is a major influence on the functioning of hinterland flows that cross international frontiers en route to/from ports, and this is a factor that necessarily is faced by landlocked countries. Obstacles at border crossings have a disproportionate effect on such countries since they do
25
not have direct access to one or more seaports without crossing a land frontier, whereas countries with a coastline have the opportunity to develop direct shipping services in theory at least. A number of institutions, including the World Bank (2008b) and the World Economic Forum (2008), have focused their attention on this issue, attempting to quantify the issues and rank country performance: this will be discussed later in the report. Many of the problems are administrative (Ranger, 2009), relating to the efficiency and transparency of procedures, but others relate to transport infrastructure and service capabilities (e.g. lack of interoperability of rail infrastructure and operating systems). While many administrative obstacles have now been resolved within the EU, significant problems remain at other border crossings, with regular delays of 12-24 hours (or more) at road crossings to/from Russia, for example. Pekalis (2009) reported average queue lengths of 700 goods vehicles at one Latvian-Russian border crossing in 2007, though this had been reduced to 410 vehicles in 2008. Such delays can have significant impacts on the reliability of supply chains, not least because of the unpredictability of the extent of crossing delays. In general terms, however, road border crossings appear to be less problematic than rail ones, where there are inherently greater obstacles to international interoperability. Examples of initiatives that reduce border crossing delays and uncertainty are identified in Chapter VII. E. Data availability and quality 75. The continued expansion of the EU has led to a greater number of UNECE countries adopting the standardized Eurostat data collection methods. Table 6.1 summarizes the range of relevant data that are currently collected by Eurostat. Table 6.1 What EU data are currently collected?
Mode Legal basis Data on port hinterland? Sea freight Dir. 95/64/EC Goods loaded and unloaded in ports, by type of
cargo, origin/destination overseas
Road freight Reg. 1172/98 Goods loaded and unloaded in NUTS-3 regions, by type of goods and cargo (sample)
Rail freight Reg. 91/2003 Goods loaded and unloaded in NUTS-2 regions every 5 years; country level type of goods and cargo
Inland waterways freight
Reg. 1365/2006 Goods loaded and unloaded in NUTS-2 regions; type of goods and container
Air freight Reg. 437/2003 Goods and mail loaded and unloaded at airports; origin/destination airports
Source: Eurostat (2009a).
76. According to Eurostat, the following information relating to intermodal transport activity is missing on a coordinated basis:
(a) previous or next mode of transport for intermodal units (i.e. containers, swap bodies and semi-trailers), which would allow flow visibility along the transport chain rather than on an individual leg by leg basis;
(b) transhipment terminal performance (e.g. waiting times); (c) criteria related to mode choice, allowing informed decision making about ways in which rail,
inland waterway and sea transport can be made more attractive to complement road haulage.
77. Despite these shortcomings, Eurostat periodically publishes a statistics document focusing on the unitization of freight transport in the EU (Eurostat, 2008b). Data availability issues mean that an incomplete picture is provided, even for basic measures such as mode share (Eurostat, 2008b). For example, data for inland waterways are not available at all, and a number of countries are unable to
26
provide unitized transport statistics for road and rail. Where comprehensive national statistics do exist, the methodologies often differ, which makes international comparison difficult.
78. Figure 6.2 shows the strategy that Eurostat has developed to further improve knowledge of intermodal transport movements, building on the data that come from the legal acts mentioned previously. In addition to work on harmonizing commodity flow surveys within the EU area, efforts are being made in conjunction with DG TREN to identify ways in which additional data can be collected from businesses. Eurostat is also working with various other organizations (including UNECE) to research the possibilities for making further improvements. The ultimate aim is to move towards the collection of logistics and comodality indicators rather than intermodal transport statistics, with the former being designed to provide a better understanding of goods flows rather than transport activity alone. To do this, it is hoped that agreement can be reached about the needs for and uses of additional statistical data.
Figure 6.2 Eurostat’s strategy for intermodal transport statistics
Source: Eurostat (2009a).
79. Of course, individual UNECE countries, both in the EU and elsewhere, collect and publish their own data. For example, a number of countries (e.g. Sweden, France, United States) conduct commodity flow surveys or shippers surveys in addition to publishing modally based transport statistics, thus enriching the understanding of goods flows. However, such surveys are typically burdensome, with Eurostat (2009a) estimating that the United States survey requires approximately 805,000 hours of input. A key issue relating to country-specific datasets is the difficulty in undertaking country comparisons due to the lack of consistency over methodology, time period, data coverage, etc.
F. Summary
80. Through the consideration of the four questions posed at the start of this Chapter, the discussion has identified and discussed a number of issues that are key to the understanding of port hinterland performance. In particular, the lack of consistent, good quality data hinders the detailed understanding of the effects of different factors on the performance of hinterland transport and an evidence-based
With NSIs
With DG TREN Pilot Group
Re- Re-search search
Data Exchange with businesses
Harmonization of Harmonization of Commodity Flow Commodity Flow
SurveSurveyss
Data from legal acts:Data from legal acts:road, rail, IWW, maritime androad, rail, IWW, maritime and
air transport statistics; trade & businessair transport statistics; trade & business
27

assessment of policy priorities for intervention. There is a need for the development of an integrated assessment tool which will adequately evaluate transport’s role in supply chains and its contribution to countries’ competitiveness. In the next section, examples of good practice in hinterland transport efficiency and sustainability are identified.
28
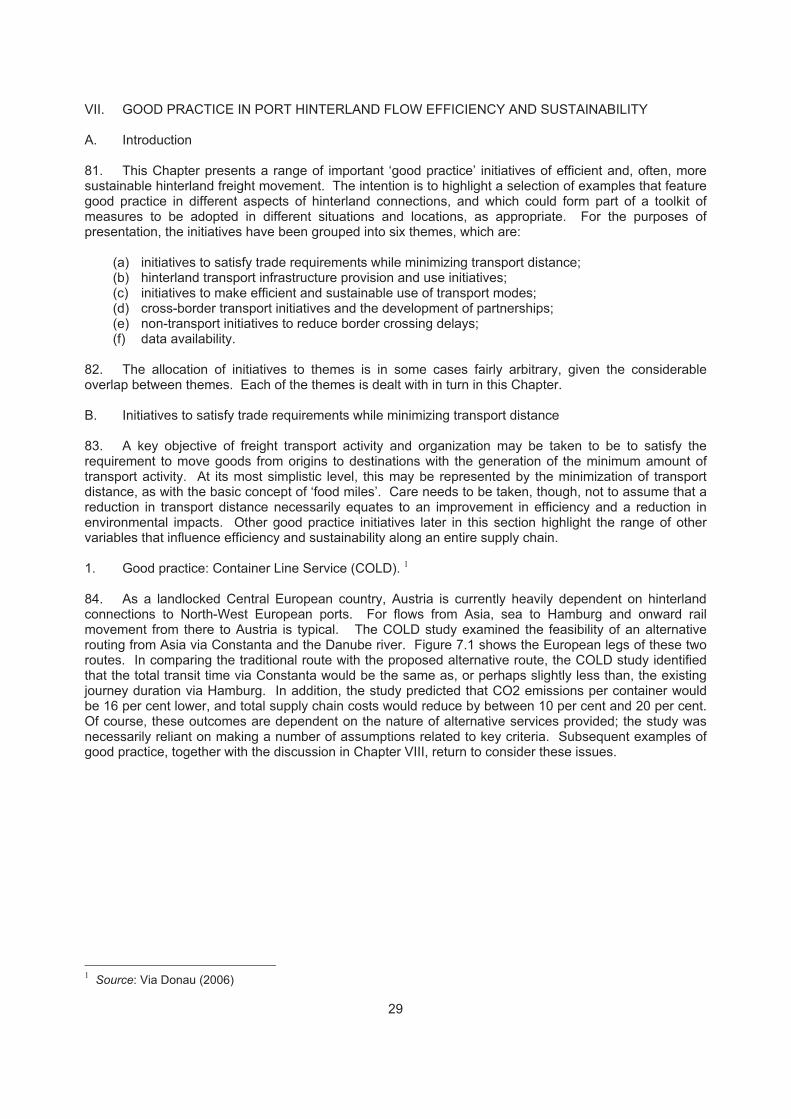
VII. GOOD PRACTICE IN PORT HINTERLAND FLOW EFFICIENCY AND SUSTAINABILITY A. Introduction 81. This Chapter presents a range of important ‘good practice’ initiatives of efficient and, often, more sustainable hinterland freight movement. The intention is to highlight a selection of examples that feature good practice in different aspects of hinterland connections, and which could form part of a toolkit of measures to be adopted in different situations and locations, as appropriate. For the purposes of presentation, the initiatives have been grouped into six themes, which are:
(a) initiatives to satisfy trade requirements while minimizing transport distance; (b) hinterland transport infrastructure provision and use initiatives; (c) initiatives to make efficient and sustainable use of transport modes; (d) cross-border transport initiatives and the development of partnerships; (e) non-transport initiatives to reduce border crossing delays; (f) data availability.
82. The allocation of initiatives to themes is in some cases fairly arbitrary, given the considerable overlap between themes. Each of the themes is dealt with in turn in this Chapter. B. Initiatives to satisfy trade requirements while minimizing transport distance 83. A key objective of freight transport activity and organization may be taken to be to satisfy the requirement to move goods from origins to destinations with the generation of the minimum amount of transport activity. At its most simplistic level, this may be represented by the minimization of transport distance, as with the basic concept of ‘food miles’. Care needs to be taken, though, not to assume that a reduction in transport distance necessarily equates to an improvement in efficiency and a reduction in environmental impacts. Other good practice initiatives later in this section highlight the range of other variables that influence efficiency and sustainability along an entire supply chain. 1. Good practice: Container Line Service (COLD). 1 84. As a landlocked Central European country, Austria is currently heavily dependent on hinterland connections to North-West European ports. For flows from Asia, sea to Hamburg and onward rail movement from there to Austria is typical. The COLD study examined the feasibility of an alternative routing from Asia via Constanta and the Danube river. Figure 7.1 shows the European legs of these two routes. In comparing the traditional route with the proposed alternative route, the COLD study identified that the total transit time via Constanta would be the same as, or perhaps slightly less than, the existing journey duration via Hamburg. In addition, the study predicted that CO2 emissions per container would be 16 per cent lower, and total supply chain costs would reduce by between 10 per cent and 20 per cent. Of course, these outcomes are dependent on the nature of alternative services provided; the study was necessarily reliant on making a number of assumptions related to key criteria. Subsequent examples of good practice, together with the discussion in Chapter VIII, return to consider these issues.
1 Source: Via Donau (2006)
29
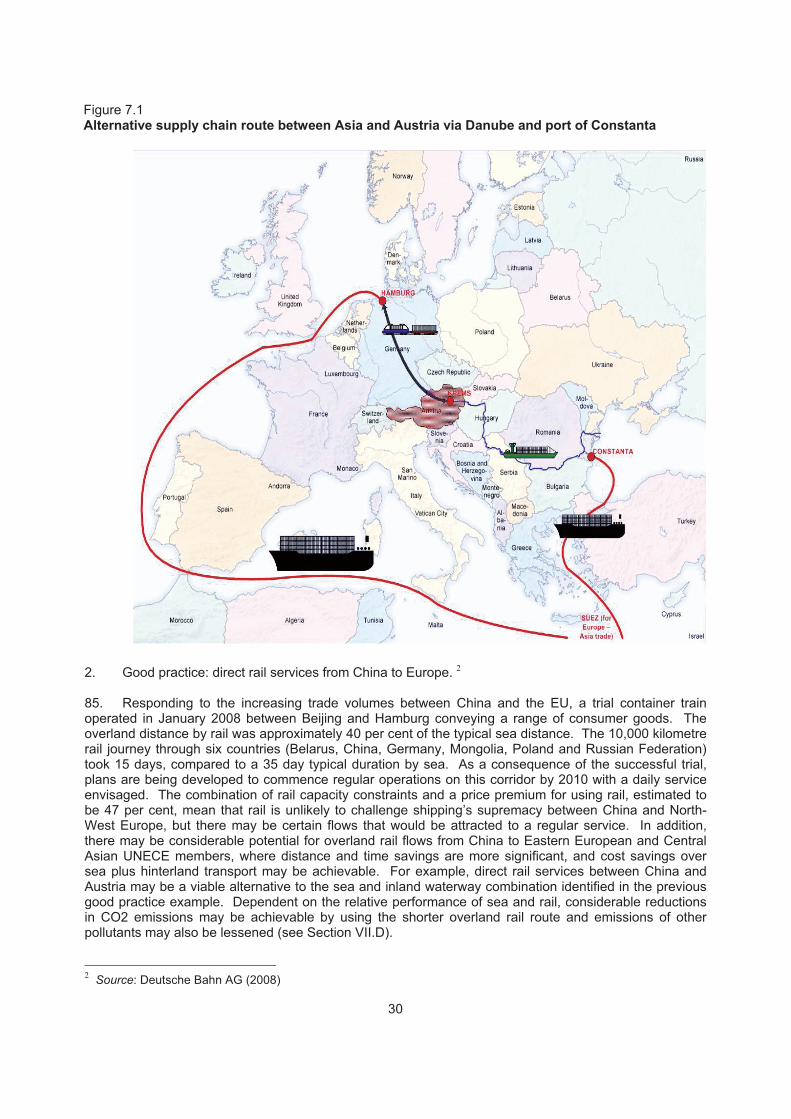
2. Good practice: direct rail services from China to Europe. 2
85. Responding to the increasing trade volumes between China and the EU, a trial container train operated in January 2008 between Beijing and Hamburg conveying a range of consumer goods. The overland distance by rail was approximately 40 per cent of the typical sea distance. The 10,000 kilometre rail journey through six countries (Belarus, China, Germany, Mongolia, Poland and Russian Federation) took 15 days, compared to a 35 day typical duration by sea. As a consequence of the successful trial, plans are being developed to commence regular operations on this corridor by 2010 with a daily service envisaged. The combination of rail capacity constraints and a price premium for using rail, estimated to be 47 per cent, mean that rail is unlikely to challenge shipping’s supremacy between China and North-West Europe, but there may be certain flows that would be attracted to a regular service. In addition, there may be considerable potential for overland rail flows from China to Eastern European and Central Asian UNECE members, where distance and time savings are more significant, and cost savings over sea plus hinterland transport may be achievable. For example, direct rail services between China and Austria may be a viable alternative to the sea and inland waterway combination identified in the previous good practice example. Dependent on the relative performance of sea and rail, considerable reductions in CO2 emissions may be achievable by using the shorter overland rail route and emissions of other pollutants may also be lessened (see Section VII.D).
2 Source: Deutsche Bahn AG (2008)
30
Figure 7.1 Alternative supply chain route between Asia and Austria via Danube and port of Constanta
86. Traditionally, hinterland transport requirements have not been separately considered at a strategic level or, where this has been done, it has typically been done on a port-specific or a mode-specific basis. There is evidence that this is starting to change, and hinterland flows are increasingly being considered across the different transport modes, either for countries/regions or on a corridor basis. In order to achieve greater efficiency and sustainability, it is important to think holistically about transport infrastructure provision and its use. 1. Good practice: coordinated rail infrastructure improvements to serve Russian ports. 3 87. Given the geographical size of the Russian Federation, with significant seaports in the North-Western, Southern and Far Eastern regions, there are considerable challenges in connecting these disparate regions to the key hinterland areas. Russian Railways, a state-owned enterprise, has developed extensive investment proposals which are expected to lead to 2.5 times more cargo travelling to/from Russian ports by rail in 2020 compared to 2007; it is not clear how much of this anticipated growth is of containerized goods. Taking the Southern (i.e. Azov-Black Sea and North Caucasus) region as an example, the proposals include the following infrastructure initiatives:
(a) new railway links, particularly to bypass bottlenecks; (b) provision of double track on existing single track sections; (c) route electrification; (d) new or reconstructed freight terminals and yards.
2. Good practice: German Freight Transport and Logistics Masterplan. 4 88. Seaport hinterland transport in Germany is forecast to grow by 131 per cent by 2025, almost double the projected growth for freight transport as a whole. In 2008, the government produced a detailed Masterplan for freight transport and logistics, which follows the principles of the EU Action Plan for Freight Transport and Logistics. The German plan has six main objectives:
(a) making optimum use of transport infrastructure; (b) avoiding unnecessary journeys; (c) shifting more traffic to railways and inland waterways; (d) upgrading more transport arteries and hubs; (e) environmentally friendly and climate friendly transport; (f) good working conditions and good training in the freight transport industry.
89. The overarching aim of the plan is to provide leadership and structure within the logistics sector, to ensure that sustainable mobility is achieved. The German government is to implement a national ports strategy, a key aspect of which will be coordinated investment in schemes that are important at the macroeconomic scale. Included in this will be priority treatment for key port hinterland links that are reaching saturation, with new and upgraded infrastructure being one possible solution where capacity is critical. However, the Masterplan adopts a holistic approach which also considers, for example, the redistribution of flows to alternative modes and corridors, the greater adoption of IT solutions to better utilize the existing infrastructure, collaboration between seaports and logistics providers to reduce inefficiencies, and the use of measures to internalize the external costs of transport activity. Another proposed measure, consistent with EU policy, is to segregate freight and passenger transport activity, so that core routes can be developed that give priority to freight flows. In addition, the concept of comodality (and the associated importance of the integration of the different transport modes) is embodied in the Masterplan, with a focus on freight villages or logistics centres, the intention being that their consolidation and break-bulk activities will lead to more efficient transport utilization for the various legs of supply chains, and with the use of the most appropriate mode of transport for each leg. 3. Good practice: English strategic transport corridors and end-to-end journeys. 5 3 Source: Russian Railways (2009). 4 Source: BMVBS (2008). 5 Source: HM Treasury (2006a); DfT (2008b).
31
C. Hinterland transport infrastructure provision and use initiatives
90. The UK government has identified 14 strategic national corridors for England (see Figure 7.2) that connect the main international gateways with key urban and industrial areas.
91. The two largest container ports (i.e. Felixstowe and Southampton) and the busiest ferry port (i.e. Dover), together with other key ports such as Liverpool, Bristol and those on the Humber and Tees, are all linked to the corridors. The corridors identified are seen as being crucial to the economic success of the UK, and investment decisions taken to enhance the corridors have the potential to reduce environmental impacts through the consideration of measures at a strategic level across the various transport modes.
92. The UK policy approach to transport has evolved since the Eddington Study in 2006. There is growing recognition of the importance of focusing policy on the whole journey rather than the more traditional, mode-centric approach to policy development. The importance of reliable, efficient, resilient and sustainable international end-to-end journeys has been identified as critical to supporting competitiveness and productivity. Improving the movement of freight throughout end-to-end journeys and understanding where bottlenecks exist is essential to ensuring that interventions are targeted at those measures which will be most effective in delivering improvements for transport users. To explore this hypothesis further, the UK is developing a systematic understanding of the journeys of freight from a supply chain perspective by creating an evidence base that enables analysis of the end-to-end, multi-
Figure 7.2 Strategic national freight corridors for England
32

modal journey of freight (and passengers) through the United Kingdom’s key inter-national gateways. To date, three end-to-end analyses have been published: containerized freight (December 2008); roll-on roll-off freight (December 2008); and air freight (April 2009).
D. Initiatives to make efficient and sustainable use of transport modes
93. Following on from the previous section, examples where the efficiency and sustainability of transport operations for hinterland flows have been improved are now identified.
1. Good practice: achieving comodality through the development of an ‘inland port’. 6
94. The port of Duisburg provides a good example of the ‘inland port’ concept, which demonstrates the applicability of the comodality concept (see section II.B). In this case, containers are moved inland from seaports using the River Rhine to the Port of Duisburg in the Rhine-Ruhr area of Germany. Duisburg has been successful in attracting sea-going short-sea vessels as well as inland waterway barges, considerably expanding the range of locations connected by waterborne transport modes. According to the port’s website (http://www.duisport.de), there are short-sea container shipping line links to a number of UK ports, as well as barge services to both Rotterdam and Antwerp. Figure 7.3 demonstrates that almost 300,000 TEU (two-way) were moved by water to/from Duisburg in 2005. Two-thirds of this volume used feeder rail services, meaning that road had a relatively low modal share.
2. Good practice: encouraging rail freight growth through market liberalization. 7
95. The EU sees the growth of international rail freight activity as a political objective, for economic, environmental and social reasons. Over the last decade, it has enacted a series of railway packages
6 Source: HM Treasury (2006a); DfT (2008b). 7 Source: IBM Global Business Services (2007); Eurostat (2009b).
Figure 7.3 Duisburg port traffic flows in 1000 TEU, 2005
33
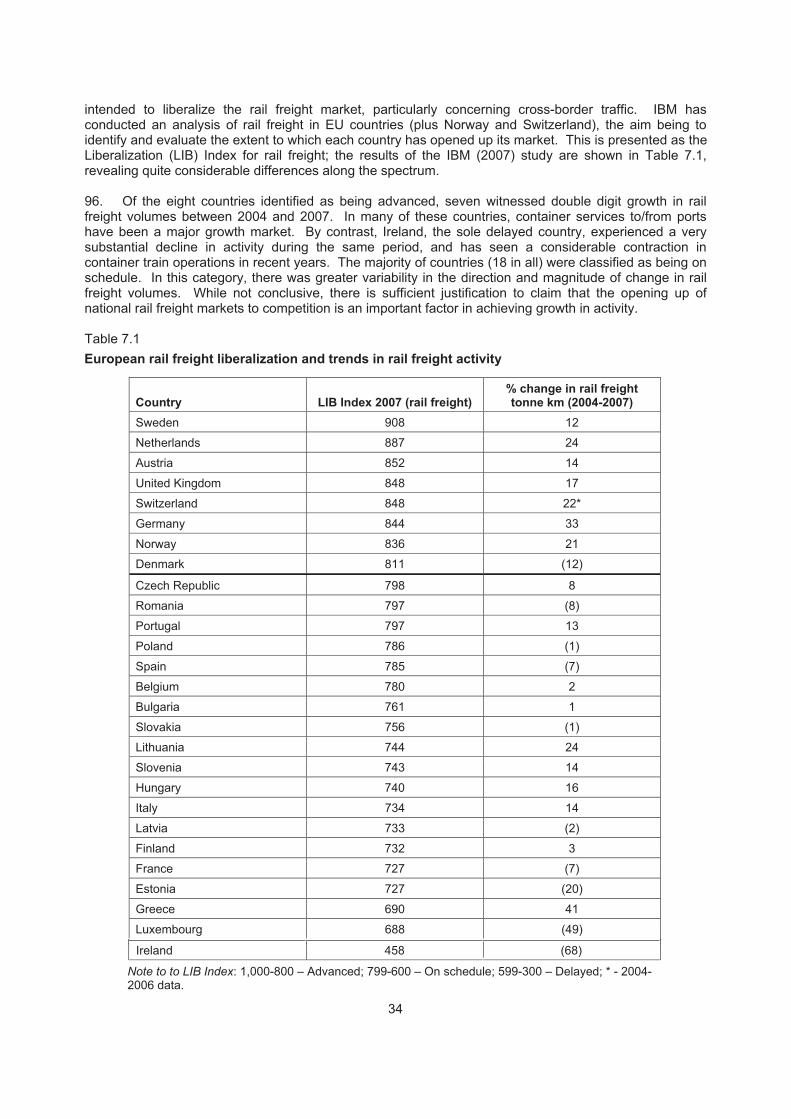
intended to liberalize the rail freight market, particularly concerning cross-border traffic. IBM has conducted an analysis of rail freight in EU countries (plus Norway and Switzerland), the aim being to identify and evaluate the extent to which each country has opened up its market. This is presented as the Liberalization (LIB) Index for rail freight; the results of the IBM (2007) study are shown in Table 7.1, revealing quite considerable differences along the spectrum. 96. Of the eight countries identified as being advanced, seven witnessed double digit growth in rail freight volumes between 2004 and 2007. In many of these countries, container services to/from ports have been a major growth market. By contrast, Ireland, the sole delayed country, experienced a very substantial decline in activity during the same period, and has seen a considerable contraction in container train operations in recent years. The majority of countries (18 in all) were classified as being on schedule. In this category, there was greater variability in the direction and magnitude of change in rail freight volumes. While not conclusive, there is sufficient justification to claim that the opening up of national rail freight markets to competition is an important factor in achieving growth in activity. Table 7.1 European rail freight liberalization and trends in rail freight activity
Country
LIB Index 2007 (rail freight)
% change in rail freight tonne km (2004-2007)
Sweden 908 12
Netherlands 887 24
Austria 852 14
United Kingdom 848 17
Switzerland 848 22*
Germany 844 33
Norway 836 21
Denmark 811 (12)
Czech Republic 798 8
Romania 797 (8)
Portugal 797 13
Poland 786 (1)
Spain 785 (7)
Belgium 780 2
Bulgaria 761 1
Slovakia 756 (1)
Lithuania 744 24
Slovenia 743 14
Hungary 740 16
Italy 734 14
Latvia 733 (2)
Finland 732 3
France 727 (7)
Estonia 727 (20)
Greece 690 41
Luxembourg 688 (49)
34
Ireland 458 (68)
Note to to LIB Index: 1,000-800 – Advanced; 799-600 – On schedule; 599-300 – Delayed; * - 2004-2006 data.
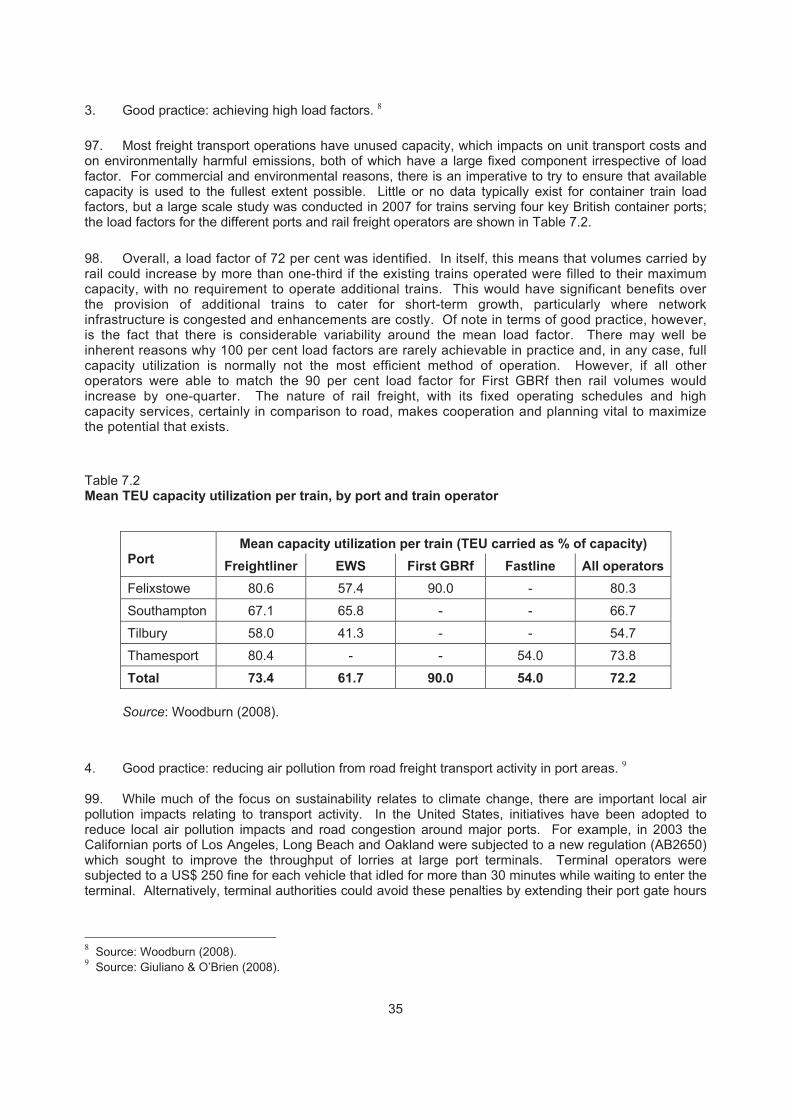
3. Good practice: achieving high load factors. 8 97. Most freight transport operations have unused capacity, which impacts on unit transport costs and on environmentally harmful emissions, both of which have a large fixed component irrespective of load factor. For commercial and environmental reasons, there is an imperative to try to ensure that available capacity is used to the fullest extent possible. Little or no data typically exist for container train load factors, but a large scale study was conducted in 2007 for trains serving four key British container ports; the load factors for the different ports and rail freight operators are shown in Table 7.2. 98. Overall, a load factor of 72 per cent was identified. In itself, this means that volumes carried by rail could increase by more than one-third if the existing trains operated were filled to their maximum capacity, with no requirement to operate additional trains. This would have significant benefits over the provision of additional trains to cater for short-term growth, particularly where network infrastructure is congested and enhancements are costly. Of note in terms of good practice, however, is the fact that there is considerable variability around the mean load factor. There may well be inherent reasons why 100 per cent load factors are rarely achievable in practice and, in any case, full capacity utilization is normally not the most efficient method of operation. However, if all other operators were able to match the 90 per cent load factor for First GBRf then rail volumes would increase by one-quarter. The nature of rail freight, with its fixed operating schedules and high capacity services, certainly in comparison to road, makes cooperation and planning vital to maximize the potential that exists.
Table 7.2 Mean TEU capacity utilization per train, by port and train operator
Mean capacity utilization per train (TEU carried as % of capacity)
Port Freightliner EWS First GBRf Fastline All operatorsFelixstowe 80.6 57.4 90.0 - 80.3
Southampton 67.1 65.8 - - 66.7
Tilbury 58.0 41.3 - - 54.7
Thamesport 80.4 - - 54.0 73.8
Total 73.4 61.7 90.0 54.0 72.2 Source: Woodburn (2008).
4. Good practice: reducing air pollution from road freight transport activity in port areas. 9 99. While much of the focus on sustainability relates to climate change, there are important local air pollution impacts relating to transport activity. In the United States, initiatives have been adopted to reduce local air pollution impacts and road congestion around major ports. For example, in 2003 the Californian ports of Los Angeles, Long Beach and Oakland were subjected to a new regulation (AB2650) which sought to improve the throughput of lorries at large port terminals. Terminal operators were subjected to a US$ 250 fine for each vehicle that idled for more than 30 minutes while waiting to enter the terminal. Alternatively, terminal authorities could avoid these penalties by extending their port gate hours
8 Source: Woodburn (2008). 9 Source: Giuliano & O’Brien (2008).
35

to 65 or 70 hours per week (depending on the terminal) to reduce congestion at the terminal gates, or by implementing a gate appointment system to spread vehicle arrival times. To be more effective, however, the regulations should be extended to cover vehicle idling times within the port area, since this is perceived to be a bigger contributor to local air pollution impacts. 100. A more successful initiative has been OFFPeak, which was implemented in 2005. The purpose of OFFPeak was to spread the flows of lorries travelling to/from the major ports across a greater part of the 24-hour period. Excepting some exemptions for specific types of movement, a US $40 (later US $50) Traffic Mitigation Fee was imposed on all vehicles using the port between 08:00 and 17:00 from Monday to Thursday. The impact was greater than expected, with around 22 per cent to 30 per cent of eligible vehicle movements switching to the off-peak period in the first 14 months of operation. This led to a reduction in port-based vehicle movements during the busy daytime periods, with the greater off-peak use of the road networks surrounding the key ports leading to reductions in emissions per vehicle. 101. One reason for the particular problem at the United States ports is the limited operating periods for terminals. In many other UNECE countries the port operating times are far more extensive so there is not the same degree of peaking in vehicles arriving at the terminal. That said, many ports elsewhere do experience road transport congestion around the port area, with consequent air pollution effects. For implementation of a similar system elsewhere in the UNECE, clearly the operating periods of such initiatives designed to tackle local congestion and air pollution could be tailored to suit the port operating times and the periods of congestion on the surrounding road networks. 5. Good practice: reducing air pollution from waterborne freight transport activity. 10 102. In March 2009, the United States Environmental Protection Authority (EPA) announced radical plans to drastically reduce the emissions of harmful pollutants from ships. The intention is to establish an Emissions Control Area (ECA), effectively a 230 mile buffer zone around the United States coastline. It is estimated that as many as 8,300 lives would be saved annually in the United States and Canada by 2020. While the proposals have not yet been ratified by the International Maritime Organization (IMO), it is anticipated that new fuel quality and emission control technologies will apply from 2015/16. When compared to the existing global standards, the expected reductions in pollutants are:
(a) 98 per cent in the sulphur content of diesel fuel; (b) 85 per cent of particulate matter emissions; (c) 80 per cent of nitrogen dioxide emissions.
103. Given the lengthy coastlines in the rest of the UNECE region, it is likely that the introduction of a similar ECA initiative would have considerable air pollution benefits for coastal areas and, consequently, result in the saving of large numbers of lives. E. Cross-border transport initiatives and the development of partnerships 104. Given the particular problems for international rail freight operations, considerable emphasis has been placed on improving transit times and service quality. Much of the attention has focused on container train services, since they tend to be more time-sensitive than bulk flows, and suffer from greater modal competition. 1. Good practice example: Bosphorus Europe Express. 11 105. AdriaKombi and Kombiverkehr have operated a weekly container train from Ljubljana (Slovenia) to Istanbul (Turkey) since early-2008. This is a complex route, traversing Croatia, Serbia, and Bulgaria en route from Slovenia to Turkey; it therefore includes a mix of EU and non-EU countries, so border crossings are a particular issue. Many of the other issues are similar to those for internal EU flows,
10 Source: EPA (2009). 11 Source: Slovenske železnice (2009); Anon (2009).
36
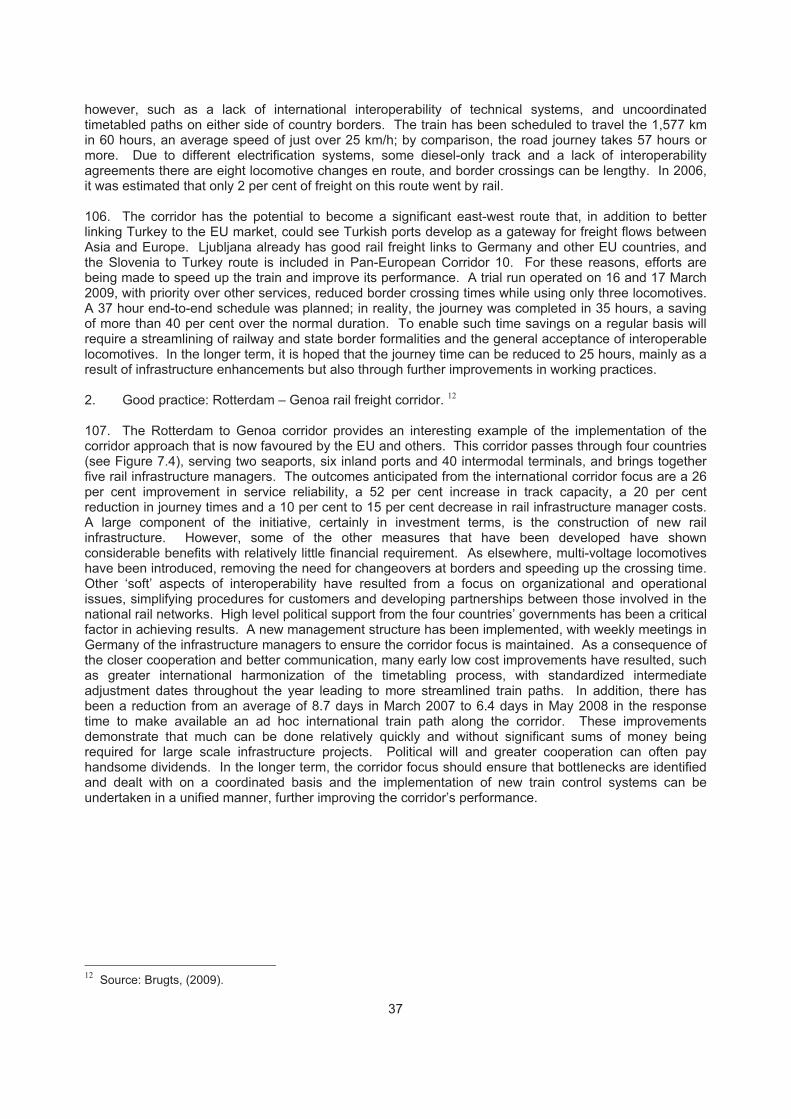
however, such as a lack of international interoperability of technical systems, and uncoordinated timetabled paths on either side of country borders. The train has been scheduled to travel the 1,577 km in 60 hours, an average speed of just over 25 km/h; by comparison, the road journey takes 57 hours or more. Due to different electrification systems, some diesel-only track and a lack of interoperability agreements there are eight locomotive changes en route, and border crossings can be lengthy. In 2006, it was estimated that only 2 per cent of freight on this route went by rail. 106. The corridor has the potential to become a significant east-west route that, in addition to better linking Turkey to the EU market, could see Turkish ports develop as a gateway for freight flows between Asia and Europe. Ljubljana already has good rail freight links to Germany and other EU countries, and the Slovenia to Turkey route is included in Pan-European Corridor 10. For these reasons, efforts are being made to speed up the train and improve its performance. A trial run operated on 16 and 17 March 2009, with priority over other services, reduced border crossing times while using only three locomotives. A 37 hour end-to-end schedule was planned; in reality, the journey was completed in 35 hours, a saving of more than 40 per cent over the normal duration. To enable such time savings on a regular basis will require a streamlining of railway and state border formalities and the general acceptance of interoperable locomotives. In the longer term, it is hoped that the journey time can be reduced to 25 hours, mainly as a result of infrastructure enhancements but also through further improvements in working practices. 2. Good practice: Rotterdam – Genoa rail freight corridor. 12 107. The Rotterdam to Genoa corridor provides an interesting example of the implementation of the corridor approach that is now favoured by the EU and others. This corridor passes through four countries (see Figure 7.4), serving two seaports, six inland ports and 40 intermodal terminals, and brings together five rail infrastructure managers. The outcomes anticipated from the international corridor focus are a 26 per cent improvement in service reliability, a 52 per cent increase in track capacity, a 20 per cent reduction in journey times and a 10 per cent to 15 per cent decrease in rail infrastructure manager costs. A large component of the initiative, certainly in investment terms, is the construction of new rail infrastructure. However, some of the other measures that have been developed have shown considerable benefits with relatively little financial requirement. As elsewhere, multi-voltage locomotives have been introduced, removing the need for changeovers at borders and speeding up the crossing time. Other ‘soft’ aspects of interoperability have resulted from a focus on organizational and operational issues, simplifying procedures for customers and developing partnerships between those involved in the national rail networks. High level political support from the four countries’ governments has been a critical factor in achieving results. A new management structure has been implemented, with weekly meetings in Germany of the infrastructure managers to ensure the corridor focus is maintained. As a consequence of the closer cooperation and better communication, many early low cost improvements have resulted, such as greater international harmonization of the timetabling process, with standardized intermediate adjustment dates throughout the year leading to more streamlined train paths. In addition, there has been a reduction from an average of 8.7 days in March 2007 to 6.4 days in May 2008 in the response time to make available an ad hoc international train path along the corridor. These improvements demonstrate that much can be done relatively quickly and without significant sums of money being required for large scale infrastructure projects. Political will and greater cooperation can often pay handsome dividends. In the longer term, the corridor focus should ensure that bottlenecks are identified and dealt with on a coordinated basis and the implementation of new train control systems can be undertaken in a unified manner, further improving the corridor’s performance.
12 Source: Brugts, (2009).
37
F. Non–transport initiatives to reduce border crossing delays
108. In Chapter VI, the often considerable obstacles relating to border crossings were highlighted. This is a general problem, but it particularly affects borders where one or both countries are non-EU members. In broad terms, the liberalization of trade in the EU provides a template by which border crossing delays can be reduced or eliminated, particularly those related to state border formalities. Previous good practice examples in this section have incorporated measures to reduce border delays through, for instance, interoperability agreements for locomotives that can operate with different electrical voltages. While this report focuses primarily on the transport issues, it is important to recognize the impacts of other factors (e.g. customs requirements) on hinterland transport performance.
1. Good practice: Principles for reducing delays due to border and customs regulations. 13
109. With member countries being responsible for more than 95 per cent of world trade, the WCO is in a strong position to identify and disseminate good practice relating to customs issues at border crossings. As such, the WCO has produced a set of key principles designed to simplify procedures and reduce crossing delays caused by customs requirements. Where these have been applied, customs clearance at border crossings has become faster and, crucially, more predictable and transparent, leading to greater transport efficiency and lower overall business costs. The principles are as follows:
13 Source: WCO (2009); OSCE (forthcoming). 38
Figure 7.4 Rotterdam-Genoa corridor
(b) standardization and simplification of goods declaration and supporting documents; (c) ‘fast track’ procedures for authorized persons with good compliance records; (d) maximum use of information technology; (e) minimum control necessary to ensure compliance; (f) adoption of risk management, based on intelligence and targeted checks; (g) audit-based controls; (h) coordinated intervention where other border agencies are involved; (i) partnership with the trade; (j) pre-arrival processing, with prior lodgement of documentation.
110. The focus on border crossing best practice is also being addressed by the Organization for Security and Cooperation in Europe (OSCE), with a particular focus on improving conditions for landlocked countries within the UNECE region. A Handbook of Best Practices at Borders is in development and expected to be published shortly, with practical advice and examples of how to improve the efficiency of cross-border trade while maintaining the necessary levels of customs and security. Many of the examples are expected to come from the landlocked countries in the Central Asian region. G. Data availability 111. Chapter VI highlighted the difficulties involved in developing a thorough understanding of the nature of intermodal hinterland flows due to the traditional focus on individual modes and transport legs in official statistics, and the burdensome nature of more detailed commodity-based surveys. This section highlights two good practice examples where knowledge is enhanced with relatively limited resource requirements. 1. Case study: Contents of containers passing through Netherlands ports. 14 112. A pilot study in the Netherlands has considered ways in which knowledge of container transport chains can be enhanced, together with a better understanding of the commodity types being carried, by combining and analysing a number of existing data sources. Unique container identification numbers are recorded by a number of different data sources: customs data for maritime transport; barge information and communication system for inland waterways; and in data provided by railway companies. In combination, this allows the tracking of individual containers that are being moved intermodally. Additionally, the contents of containers are recorded for customs requirements, although this is in free text rather than against a pre-defined commodity classification. 113. The pilot study has shown some promising results, particularly related to the coding of the commodity text where 60 per cent to 75 per cent of containers were coded automatically with a high degree of accuracy. In itself, this provides considerable information for little input, but also allows attention to be focused on sampling the remaining uncoded containers to further improve coverage. For the analysis of transport chains, problems with data quality (e.g. lack of recording the container check digit in almost half of the railway records analysed; double counting of some inland waterway journeys) have so far limited the ability to identify the modal transfers. Given that this was a pilot study, the outcomes have been promising, and it is likely that targeted improvements to data quality would considerably enhance the accuracy of the statistics and allow decision making to be based on a more detailed and accurate understanding of goods flows. 2. Case study: German method. 15 114. The German approach intends to improve understanding of intermodal transport flows on a port-by-port basis without the considerable burden typically associated with commodity flow surveys. Through the combination of existing mode-based transport statistics for shipping, rail, inland waterway and road, supported by expert interviews in ports, more detailed information about mode share and flow origins and destinations can be obtained. This example provides less detailed information than the Dutch one presented previously, but requires even less resource input and may be an appropriate model to follow to
14 Source: Smeets (2008). 15 Source: Eurostat, 2009a.
39
(a) transparency and predictability;

obtain standardized information on an international basis while limiting the cost and time required to collect the data. H. Summary 115. These ‘good practice’ initiatives demonstrate the importance of a coordinated approach, frequently requiring multimodal and cross-border cooperation to overcome the traditional barriers that result in inefficient hinterland transport activity. Many of the good practice initiatives identified have related to rail transport, since this is where the greatest operational and political barriers tend to exist. A number of the other initiatives have been non-mode specific, focusing on practices that affect hinterland flows by different modes. The next Chapter identifies and develops a number of key issues that result from this identification of good practice examples, and highlights some of the key principles that are often transferable.
40
VIII. DISCUSSION: WHAT SHOULD THE NEXT STEPS BE? A. Introduction 116. This study has been conducted at a time of considerable uncertainty, both in terms of the global economic situation and with regard to the sustainability agenda relating to climate change and fossil fuel supply. At the holistic level, it would perhaps be appropriate to consider measures that actively reduced the global extent of supply chains and instead focused upon ways in which more local sourcing and consumption patterns could be re-established. This is a much bigger consideration than the scope of this report, and it is not taken forward any further; it would, however, certainly be prudent to consider this in future, particularly if fossil fuel supplies become scarce or prohibitively expensive, or if adopted climate change targets are clearly incompatible with the continued globalization of supply chains. The study had five objectives:
(a) To determine the key issues in the existing literature relating to the performance of seaports and their hinterland connections;
(b) To assess the key trends in the container and ferry markets in the UNECE region, including port hinterland flows;
(c) To identify good practice in achieving efficient and sustainable hinterland goods movements; (d) To consider ways in which the specific problems faced by landlocked emerging economies can
be overcome; (e) To recommend ways in which the connectivity of seaports and their hinterlands can be
improved.
117. The first four objectives are dealt with in turn in this section. These findings are then developed into a series of recommendations in Section IX, thus satisfying the final objective. B. Key issues relating to the performance of seaports and their hinterland connections 118. From both the review of academic literature and the overview of the contemporary policy framework it is clear that port hinterland connections are becoming significant concerns within supply chains and for policy makers. The huge growth in container (and ferry) trade through key UNECE ports has put considerable pressure on landward connections. Given that hinterland areas are rarely captive now, but are instead contestable with two or more ports competing to serve the inland areas, port authorities are becoming increasingly interested in hinterland transport performance. Logistics chain decision makers are now more concerned about the attributes of entire chains rather than specific legs, and ports with poor connections risk losing business to competitors who can offer better performing transport links. Evidence is mounting that hinterland connections are frequently the weakest link of the logistics chain. Public policy makers, while concerned about the economic impacts of inefficient transport operations, are now contending with the growing sustainability agenda and the challenges that this poses for international supply chains. The traditional focus in the EU on the development of the Single European Market, with similar liberalization processes also taking place in certain other UNECE countries, is now joined by concerns over climate change. There is now a stronger focus on cost internalization and the appropriate use of the range of transport modes. The balancing of economic development and sustainability objectives is one that remains unresolved, given the many conflicts that still exist. The likelihood of increasingly stringent national and international targets for greenhouse gas emissions, and the associated development of carbon budgets and caps, seems likely to fundamentally influence decision making, the aim being to improve supply chain efficiency and sustainability. 119. In many cases, imperfect knowledge and the lack of consistent, good quality data hinder the detailed understanding of the effects of different factors on the performance of hinterland transport. The importance of a more balanced and integrated approach to the transport modes has been highlighted, particularly in the context of developing solutions that are more sustainable as well as more efficient. It is vital that recent efforts to improve supply chain sustainability are not sacrificed as a consequence of the global economic downturn. The current economic situation provides a platform for a new approach to dealing with hinterland connections that both encourages greater operational efficiency and leads to lower environmental impacts.
41
C. Key trends in the container and ferry markets in the UNECE region 120. Chapter V presented the key trends in the container and ferry markets. When analysing the trends, there are considerable data constraints that hinder the detailed understanding of trends in volumes and, particularly, the nature of the hinterland transport activity that results. Where good quality data exist, they are often inconsistent spatially and/or over time. Despite this, the study has identified a number of trends that are important in the understanding of port hinterland performance, and has discussed the effects of the currently imperfect knowledge of the situation. Further, the sustained growth in activity over recent decades seems to have halted since 2008 as a result of the global economic downturn. It is too early to judge the likely extent of the downturn or the effects that it will have on port throughput in the UNECE region, but there may be opportunities to improve efficiency and sustainability in the responses that will be taken to the economic circumstances. D. Good practice in achieving efficient and sustainable hinterland goods movements 121. Chapter VII identified considerable evidence of good practice for port hinterland freight transport activity, grouped into a number of categories of initiatives:
(a) Initiatives to satisfy trade requirements while minimizing transport distance; (b) Hinterland transport infrastructure provision and use initiatives; (c) Initiatives to make efficient and sustainable use of transport modes; (d) Cross-border transport initiatives and the development of partnerships; (e) Non-transport initiatives to reduce border crossing delays; (f) Data availability.
122. A key theme that emerged from the ‘good practice’ initiatives identified is the importance of a coordinated approach, frequently requiring multimodal and cross-border cooperation to overcome the traditional barriers that result in inefficient hinterland transport activity. Hinterland flows are increasingly being considered on a more holistic basis across the different transport modes, either for countries/regions or with a corridor focus. While this report has focused primarily on transport issues, it is important to recognize the impacts of other factors (e.g. customs requirements) on hinterland transport performance, and some examples of such ‘non-transport’ good practice were highlighted. E. Overcoming specific problems faced by landlocked emerging economies 123. As highlighted in Section VI.D, there are specific issues relating to the landlocked UNECE member countries, particularly the emerging economies in Central Asia. The logistics and trade indices presented in Annex II and discussed in Section VI.B provided an indication of the difficulties encountered by landlocked countries. There is a fairly strong relationship whereby landlocked countries are generally ranked lower in both indices than countries with direct sea access. Further, there is a noticeable difference between the Central European and Central Asian landlocked countries, with the former group generally performing far better than the latter. The high costs of trading with and from the emerging Central Asian economies is demonstrated very clearly, with extremely high costs, slow transits and a large number of documents required. These problems have been recognized as inhibiting the development of these countries’ economies. Landlocked economies in particular stand to benefit from the greater adoption of good practice initiatives that improve hinterland efficiency. 124. Border crossing performance is a major influence on the functioning of hinterland flows that cross international frontiers en route to/from ports, and this is a factor that necessarily is faced by landlocked countries. Obstacles at border crossings have a disproportionate effect on such countries since they do not have direct access to one or more seaports without crossing a land frontier, whereas countries with a coastline have the opportunity to develop direct shipping services in theory at least. Many of the problems are administrative, relating to the efficiency and transparency of procedures, but others relate to transport infrastructure and service capabilities (e.g. lack of interoperability of rail infrastructure and operating systems). While many administrative obstacles have now been resolved within the EU, significant problems remain at other border crossings.
42
IX. CONCLUSIONS A. Introduction 125. This section is structured as follows. First, a set of key principles for decision making is developed based on the analysis of main issues that has come before. This is followed by suggested short- and long-term measures to improve the performance of port hinterland flows. The section finishes by highlighting the importance of achieving international solutions to overcome traditional nationalistic tendencies to achieve the highest levels of coordination in policy responses from all parties involved. Throughout the discussion in this section recommendations for the future direction of policies relating to port hinterland connections are discussed. Specific policy recommendations and issues for further consideration are shown in bold italics. In the main, these recommendations are focused on improving the efficiency and sustainability of hinterland movements within the existing paradigm of international supply chains. The discussion in this section is focused in the main on the European, Caucasus and Central Asian parts of the UNECE region; North America has not focused strongly in the study as a result of its geographical separation from the rest of the UNECE countries and the different transport operating environment that pertains in the United States and Canada. However, some recent research of patterns and hinterland development models used in North America has been taken into account. B. Key principles 1. Interrelationships with existing policies 126. It is important to remember that hinterland connections to seaports do not exist in isolation. Cargo flows to and from ports share the same transport infrastructure as other transport activity, and are subject to the same policies and regulatory framework that influence the ways in which goods flows materialize across the infrastructure. Therefore, the efficiency and sustainability of hinterland connections is fundamentally affected by the performance of the transport system as a whole. In many respects, it is an artificial distinction to treat hinterlands as a separate issue, although it does help to focus attention on specific features that affect transport chains involving ports. Recommendation: to ensure that hinterland connections of seaports are well integrated into transport development strategic plans at national and international levels 2. Evidence-based policy making 127. A consistent approach towards ports and their hinterland connections across the UNECE region is important, in order to allow competitive markets to function well and on a fair basis and to ensure that decision making is based upon sound evidence about the likely outcomes. A key issue that has been raised in this report is that the available statistics are generally poorly suited to the analysis of intermodal transport flows. EU countries already account for broadly half of the UNECE membership, and a number of other UNECE members are EU candidate countries, so a prudent approach would be to support the ongoing development of appropriate Eurostat statistical measures and methodological approaches and their subsequent use in non-EU countries. This could be done incrementally, both in terms of specific countries and approaches, as individual countries are able to provide data that conform to the standard methods, so as not to overly burden individual countries with significant data collection requirements. Ideally, though, a realistic target date for compliance with the standard methods should be set so as to encourage action. Recommendation: UNECE to continue its participation in Eurostat’s intermodal and maritime task forces with a view to developing intermodal statistical measures and methodological approaches that would be adopted by both EU and non-EU countries 128. In addition, the report has highlighted the shortcomings of existing mode-based statistics in providing detailed information about intermodal transport chains involving hinterland flows to/from ports. Informed policy making requires a more developed understanding of the nature of transport chains that should be based on comprehensive and comparable data. The UNECE questionnaire on hinterland
43
connections of seaports, annexed to the report, provides a low-cost model for obtaining standardized information on containerized and ro-ro (including ro-pax) ferry traffic flows as well as the quality of service on modal links (rail, road, barge, short sea and coastal shipping) while combining available transport statistics with the qualitative information provided by experts. This methodology can be used to describe and analyse relevant hinterland connections in both coastal and landlocked countries. Recommendation: based on the UNECE questionnaire on hinterland connections of seaports, the Working Party on Transport Statistics (WP.6) to collect and process harmonized statistics on annual port-hinterland container and ro-ro ferry (including ro-pax) traffic flows in UNECE member countries that would help to inform policy making for hinterland transport 129. In addition to data gaps, this and other studies have also identified the need for development of an integrated methodology for assessing the importance of transport’s contribution to national competitiveness and for identifying pinch points across the whole transport chain. Recommendation: UNECE to launch the development of a new evaluation tool for identifying key pinch points and points of weakness/failure in transport systems, and benchmarking performance of transport and logistics systems against peer economies 3. An agreed set of policy objectives 130. As has been seen from this report, the private sector has an important role in port hinterland connections. To ensure fairness and consistency, it is necessary to ensure that a coherent set of policy objectives is in place, so that private sector companies can make decisions that may have long-term consequences. An overall framework within which the policy objectives can be pursued should be formulated to relate both to the ways in which the private sector is encouraged to operate in a competitive and efficient manner and the minimization of the negative impacts of port hinterland flows, not least CO2 emissions. From the evidence presented in this report, an appropriate set of policy objectives could be based on the following approach, at least in the short term (see Section IX.D for discussion of a possible long-term approach), ranging from the strategic down to the operational:
(a) measures to promote an efficient and sustainable network of hub and feeder ports for flows by sea to/from the UNECE region;
(b) the encouragement of the comodality concept to ensure that hinterland transport is organized efficiently and sustainably, with greater emphasis on rail and waterborne modes;
(c) actions to enhance the efficiency of utilization and operation of each mode of transport for hinterland flows.
Issue for further consideration: to explore frameworks within which port managers could be encouraged to minimize the negative impacts of port hinterland flows by making use of a network of hub and feeder ports, promoting comodality and placing greater emphasis on rail and waterborne modes, as well as enhance the efficiency of utilization and operation of each transport mode for hinterland flows 131. Logistics chains are highly complex and ever evolving. The evolution of competitive markets in a liberalized operating environment has brought many benefits, but also considerable negative consequences. Policy objectives should be based on principles of fairness and transparency. In a practical sense, policy makers should set an appropriate framework within which decisions regarding goods flows can be made by actors within logistics chains. The imperfect knowledge of the transport system leads to uncertainty in the outcomes of policy interventions, with the risk of perverse decision making by those involved in supply chains. 4. Adoption of policies and initiatives appropriate to the situation 132. It is important to recognize the varying characteristics, and therefore the appropriateness of potential solutions, for different parts of the UNECE region. The provision of suitable transport infrastructure to cater for port hinterland (and other) transport flows is clearly important and, in some
44
cases, new and improved infrastructure will be appropriate (i.e. ‘hard’ measures). Transport infrastructure capabilities vary considerably across the UNECE region, and constraints particularly apply within the lesser developed countries, and to cross-border routes in general. However, there is not a one-size-fits-all solution, or solution package, so different hinterland problems need to be analysed within the context of the overall objectives but with sufficient flexibility to allow the adoption of the most appropriate measures. In many cases, considerable improvement can be achieved through the application of good practice ‘soft’ measures (see Section IX.C). In general, the comodality and corridor concepts together form a sound basis on which to evaluate initiatives to improve hinterland connections. D. The short term: measures to improve efficiency and reduce environmental impacts 133. Considerable progress towards greater efficiency and sustainability seems possible in the short term and at little cost through focusing on ‘soft’ measures. The need for improved intermodal transport statistics was discussed in Section IX.B, to better understand the existing transport chains connected to seaports. In conjunction with this, though, it is evident that a stronger understanding of the factors that affect CO2 emissions for different types of transport operations is required, in order that appropriate transport options can be encouraged through policy making and chosen by those responsible for making freight transport decisions. At present, sustainability issues are frequently not considered in any great detail when transport routes and modes are evaluated but, where they are, decisions taken in the interests of reducing CO2 emissions may actually have the opposite effect. While rail and waterborne modes generally do have lower CO2 emissions than road per unit carried, this is not universally true and it is important to develop a better understanding of the situations when it may be beneficial to use road transport. That said, it is clear that road is currently used for many flows for which it is not best suited, either for efficiency or sustainability. 134. Many of the good practice examples identified in Section VII could be more widely adopted in the short term. There is the potential to generate many quick wins from a range of ‘soft’ measures that are relatively cheap to implement in comparison to investment in new infrastructure. The Duisburg ‘inland port’ example showed what can be done by better integration of terminals within the hinterland. Measures to use the transport system more intelligently should also be considered (e.g. to smooth peaks and troughs in demand to make better use of resources), and often this can be achieved through better information systems and partnerships. Greater international coordination is a particularly important issue, and this is considered in more depth in Section IX.V. There is a clear need, though, to focus specifically on initiatives to improve cross-border coordination and remove barriers to freight flows so as to improve supply chain efficiency and reduce uncertainty over transit times. Recommendation: to encourage better coordination of increases of container ships’ carrying capacities with seaports infrastructure and their hinterland connections Recommendation: to continue to encourage good practice adoption for border crossings; this will improve hinterland efficiency in general terms, but most particularly for landlocked non-EU countries 135. Sustainability is a key factor that needs to be considered when influencing the ways in which transport flows materialize. Within the current orthodoxy, measures that assist in the aggregation of volume along particular corridors provide a stronger chance of efficient transport operations using rail or waterborne modes. Such measures have a tendency to perpetuate the dominance of existing port connections, which may lead to longer distance land-based hinterland legs. If operated efficiently, this may be a relatively sustainable solution, but in the longer term it may be beneficial to consider an alternative hinterland model, not least because physical limits to port or hinterland throughput may be reached. Issue for further consideration: to assess the relative merits of the continued development of hub ports or an alternative regional approach, together with the desirability of a hierarchical sea-based network with shorter hinterland routes 136. Overall, significant improvements in the efficiency and sustainability of port hinterland connections
45
are likely to be achievable in the short term, and with little by way of resource requirements, through a focus on ‘soft’ measures that relate to better policy implementation, use of regulations and improved cooperation between actors in what is often a fragmented system. Of course, there will be cases (especially in EECCA and SEE landlocked countries) where significant capital is required, and more time is needed for development and implementation, dependent on the nature of the problem. It should not be assumed, however, that big infrastructure projects are always the most appropriate solutions. D. The long term: challenging the orthodoxy - a new hinterland model? 137. In the longer term, there is the potential, and perhaps the need, to encourage or force the development of an ‘ideal’ port hinterland system which would ensure that decision making focused on enhancing efficiency and sustainability. On the one hand, an interventionist approach could be adopted, with the public sector significantly influencing the nature of port hinterland flows through direct intervention in port and hinterland infrastructure development, regulations relating to transport modes or distances permissible for certain flows, etc. Alternatively, a framework could be established that encouraged companies to make ‘sensible’ (i.e. efficient and, crucially, sustainable) supply chain choices relating to ports and hinterland connections. This would require the full development of a robust regulatory and pricing framework that internalized the externalities associated with transport activity, applied on a consistent basis internationally. The second of these approaches is likely to be favourable, since it fits better with the dominant philosophy of market competition and choice, but within a framework that takes full account of the impacts of decisions made regarding routes and transport modes. Increasingly, it is likely that companies will need to focus on a ‘carbon budget’ in addition to a financial one, so there will be incentives to consider ways of reducing CO2 emissions resulting from logistics activity. The unsustainable use of fossil fuels also points towards a need for major changes in the way in which transport activity is organized. Particularly where ‘hard’ measures are proposed, usually at considerable expense, care should be taken to ensure that their lifespan will not be compromised by future events that will fundamentally change the nature of freight flows. For example, in the absence of the widespread adoption of alternative fuel sources for HGVs, the dominance of road freight may be reduced. It seems prudent, therefore, that when major transport infrastructure investment is deemed necessary due attention is devoted to the long-term sustainability issues. E. The need for a coordinated international approach 138. There are considerable challenges involved in achieving coordination between many countries and with the involvement of lots of private sector actors. The global scale of the climate change problem means that pan-national agreements need to be promoted so that solutions can be realized; in this respect, the greater the international scale the better. The good practice cross-border and international corridor initiatives identified in Section VII should help to avoid repeating past mistakes whereby a lack of joined up thinking limited the extent to which initiatives achieved their potential. For example, the Netherlands now has a new rail freight line (the Betuwe line) from the Port of Rotterdam to the German border, which provides significant additional dedicated freight capacity capable of handling more than 10 trains per hour in each direction. Once over the German border, however, the new line feeds in to the existing German rail network, which has a considerable number of bottlenecks. By contrast, the specific corridor initiatives under development, such as the Rotterdam to Genoa corridor presented in Section VII, sensibly seek to maximize the performance of strategic corridors and, in time, have the potential to develop in to a strategic network across the UNECE Europe and Central Asia region. Therefore, the new EU policy of focusing on long distance corridors (e.g. through TEN-T and the proposed rail freight network) and considering them in their entirety, with attention focused on bottleneck locations or inefficient procedures, should be more successful at the international level. 139. As outlined earlier, improved coordination is likely to yield significant improvements in port hinterland connections in the short term and with little by way of resource requirements through a focus on ‘soft’ measures that relate to better policy implementation, use of regulations and improved cooperation between actors in what is often a fragmented system. Of course, there will be cases where significant capital is required to provide now or enhanced infrastructure, and more time is needed for development and implementation, dependent on the nature of the problem. It should not be assumed, however, that big infrastructure projects are the most appropriate solutions in all circumstances and,
46
where they are, they should be developed in a coordinated manner to ensure that national boundaries or modal barriers do not unduly limit the extent to which improvements can be made. 140. A well coordinated development of port-hinterland routes would be particularly important in Southern Europe where the quality of port services as well as rail and road connections remain underdeveloped in comparison to Northern Europe. Given the large magnitude of international trade flows that pass through dominant Northern range seaports and associated congestion problems, a rebalancing of such flows in favour of the Meditarrenean seaports and their hinterland links would be desirable for sustainable development in Europe, providing that the quality of service gap can be overcome. 141. Overall, within the existing structures, the EU has a significant role to play and should be encouraged to focus on the strategic transport network through its TEN-T programme. Many internal cross-border EU projects seem to be gaining momentum, but progress on developing the axes to neighbouring countries (including EU candidate countries) has been slower and the future direction lacks clarity, particularly at a time when budgetary constraints may be more significant as a result of the global economic downturn. As such, it is important that a structured and rigorous approach, using Transport Infrastructure Needs Assessment (TINA) studies or Master Plans, is adopted to determine investment priorities in transport corridors; given the disparity in transport infrastructure quality, this is likely to favour the development of infrastructure links between the EU and the non-EU countries to the east. The recent TINA studies were conducted to align entire candidate countries’ transport networks with the TEN-T initiative. For example, in the TINA-Turkey study special emphasis was placed on the development of north-south and east-west intermodal corridors (European Commission/Ministry of Transport Turkey, 2007). In this context, the links to Mediterranean and Aegean maritime corridors with their wider railway connections to wider hinterland areas were developed by taking account of the projected increases in maritime traffic. 142. In addition, the UNECE TEM and TER projects and the UNECE-UNESCAP project on developing Euro-Asian transport links are good examples of coordinated efforts for the identification of main international transport routes, prioritization of investment projects along these routes and amelioration of border crossing obstacles. Such initiatives deserve to be further encouraged and strengthened. Recommendation: UNECE TEM and TER projects and the UNECE-UNESCAP project on developing Euro-Asian transport links should be supported and strengthened by UNECE countries concerned 143. Chapters VI and VII discussed the considerable obstacles associated with many border crossings and identified examples of good practice where such obstacles have been mitigated or removed through the implementation of different initiatives. Clearly there is great potential for such good practice to be disseminated far more widely, and this should be encouraged. Recommendation: to encourage the EU to maintain a clear focus on improving transport infrastructure and operations with neighbouring UNECE countries, particularly EU candidate countries 144. From a longer-term perspective, it does not seem sensible for international agencies to routinely become involved in detailed proposals for port hinterland infrastructure development or specific initiatives related to particular locations or corridors. Instead, attention should be focused on the development of a set of principles relating to both the ‘hard’ and ‘soft’ measures, to ensure that decision making is coordinated and consistent. For example, the internalization of external transport costs (such as those related to CO2 emissions) should be pursued as a priority to allow the comodality concept to develop in a true sense. 145. In the light of this analysis, there appears to be considerable scope for an international agency to lead the way in encouraging further international cooperation and in raising awareness about good practices that could be adopted more widely. This agency would also be in a strong position to bring together the wide range of national and modal organizations that are often working with less coordination than is ideal. At present, it is unclear whether an appropriate existing agency is equipped to take on this
47
role, since many have specific modal-, spatial- or topic-based remits. The UNECE itself may provide an appropriate forum for this. Given that port hinterlands are ever changing and overlapping it is probably appropriate that the agency has a more general focus on strategic international corridors which connect ports and other major areas of transport activity, rather than a specific port hinterland remit. Recommendation: in conjunction with others, UNECE to consider what would be the most appropriate form of international agency to promote strategic hinterland transport connections, and to determine the most appropriate forum in which to continue the development of policies for hinterland connections to seaports Issue for further consideration: to identify areas in which modifications to current United Nation international conventions and agreements administered by UNECE may be necessary and make relevant proposals. Possible areas for action could include:
(a) amendments to the WP.30 Harmonization Convention (with a new annex on border crossing procedures);
(b) amendments to the WP.24 AGTC Agreement (an update of the list of seaports mentioned in Annex D of the Agreement and a specification of minimum infrastructure and operational standards in such seaports);
(c) amendments to AGR and AGC Agreements (minimum infrastructure and operational standards for efficient connection of seaports with the international road and rail networks).
146. In light of the Piraeus conference conclusion that hinterland connections of seaports are the weakest link in global supply chains and the apparent need for further work in this area, UNECE governments may consider the extension of the mandate of the Expert Group for a further two years. However, it is deemed necessary to explore opportunities for extra-budgetary funding that would guarantee the successful development of the Group’s work during the period from March 2010 to February 2012.
48
BIBLIOGRAPHY
AAPA (2007), Port industry statistics, American Association of Port Authorities (AAPA). Anderson, J. and van Wincoop, E. (2004), “Trade costs”, Journal of Economic Literature, 42, pp.691-751. Anon (2009), “Bosphorus Europe Express test”, Today’s Railways, 161 (May), p.40. Arvis, J-F., Mustra, M. A., Panzer, J., Ojala, L. and Naula, T. (2007), Connecting to compete – trade
logistics in the global economy: the Logistics Performance Index and its indicators, The World Bank, Washington DC.
Baird, A. (2007), “The development of global container transhipment terminals”, in: Wang, J. et al. (eds.),
Ports, cities and global supply chains, Ashgate, Aldershot, pp.69-87. Bauer, K. (2008), “Is there a market for a container train China – Western Europe”, Railway Market
Central and Eastern European Review, 1, pp.4-6. BMVBS (2008), Freight Transport and Logistics Masterplan, Bundesministerium für Verkehr, Bau und
Stadtentwicklung (BMVBS) (Federal Ministry of Transport, Building and Urban Affairs), Berlin. Brugts, P. (2009), Rail freight corridor: Rotterdam to Genoa, 3rd session of the UNECE Group of Experts
on Hinterland Connections to Seaports, 23 January, Geneva. C40 Cities (2008), World Ports Climate Declaration, C40 Cities/C40 World Ports Climate Change
Conference Rotterdam 2008. Cariou, P. (2008), “Liner shipping strategies: an overview”, International Journal of Ocean Systems
Management, 1, 1, pp.2-13. Cuadrado, M., Frasquet, M. & Cervera, A. (2004), “Benchmarking the port services: a customer oriented
proposal”, Benchmarking: An International Journal, 11, 3, pp.320-330. De Langen, P. (2008), “Ensuring hinterland access: the role of port authorities”, Discussion paper no.
2008-11, March, OECD/ITF, Paris. Deardorff, A. (2005), “The importance of the cost and time of transport for international trade”, in Time
and Transport, Round Table 127, ECMT, Paris. Deutsche Bahn AG (2008), Beijing-Hamburg container express manages 10,000 kilometres in only 15
days, press release, 24 January, Deutsche Bahn, Berlin. DfT (2008a), The container freight end-to-end journey: an analysis of the end-to-end journey of
containerised freight through UK international gateways, Department for Transport (DfT), London. _______ (2008b), Delivering a sustainable transport system: the logistics perspective, Department for
Transport (DfT), London. ECMT (2005), Transport and International Trade, Conclusions of Round Table 131, European
Conference of Ministers of Transport (ECMT), Paris. _______ (2006), Transport links between Europe and Asia, European Conference of Ministers of
Transport (ECMT), Paris. EEA (2008), Climate for a transport change – TERM 2007: indicators tracking transport and environment
in the European Union, European Environment Agency (EEA), Copenhagen. EPA (2009), US proposes to slash harmful ship emissions along the nation’s coastlines to save lives,
49
Press release, 30 March, United States Environmental Protection Agency (EPA), Washington DC.
ESPO (2004), Factual report on the European port sector, European Sea Ports Organisation (ESPO),
Brussels. _______ (2008), Annual Report 2007-08, European Sea Ports Organisation (ESPO), Brussels. European Commission (1997), Green Paper for Sea Ports and Maritime Infrastructure, COM (97) 687
final. _______ (2001), European Transport Policy for 2010: Time to Decide, White Paper, European
Commission, Luxembourg. _______ (2005), Trans-European Transport Network: TEN-T Priority Axes and Projects, European
Commission, Luxembourg. _______ (2006a), “Keep Europe moving - Sustainable mobility for our continent”, Mid-term review of the
European Commission’s 2001 Transport White Paper, European Commission, Luxembourg. _______ (2006b), Motorways of the sea: shifting freight off Europe’s roads, European Commission,
Luxembourg. _______ (2007a), Communication on an Integrated Maritime Policy for the European Union, COM (2007)
575 provisional version, European Commission, Brussels. _______ (2007b), Communication on a European Ports Policy, COM (2007) yyy final, European
Commission, Brussels. _______ (2007c), Freight Transport Logistics Action Plan, Communication from the Commission,
COM(2007) 607 final, European Commission, Brussels. _______ (2008), Proposal for a regulation of the European Parliament and of the Council concerning a
European rail network for competitive freight, COM (2008) 852 final, European Commission, Brussels.
_______ (2009), TEN-T: a policy review – towards a better integrated Transeuropean transport network
at the service of the Common Transport Policy, Green Paper, COM (2009) 44 final, European Commission, Brussels.
European Commission/Ministry of Transport Turkey (2007), Transport Infrastructure Needs Assessment
(TINA) for Turkey, Final Report (on-line at: http://op.ubak.gov.tr/doc/TINA_Turkey-Final_Report.pdf)
Eurostat (2007), Intermodal transport: synthetic report on data availability and quality, Eurostat,
Luxembourg. _______ (2008a), Maritime transport of goods and passengers 1997-2006, 62/2008, Eurostat,
Luxembourg. _______ (2008b), Current data availability on intermodal freight transport from the official EU statistics,
Meeting of the task force on intermodal transport statistics and logistics indicators, 22 October, Eurostat, Luxembourg.
_______ (2008c), Unitisation of freight transport in Europe 2005, 20/2008, Eurostat, Luxembourg. _______ (2009a), Statistical initiatives: Eurostat’s intermodal and maritime statistics task forces 2008, 3rd
50
session of the UNECE Group of Experts on Hinterland Connections to Seaports, 23 January, Geneva.
_______ (2009b), Inland freight and passenger transport in the EU-27 up to 2007, 11/2009, Eurostat,
Luxembourg. Giuliano, G. and O’Brien, T. (2008), Responding to increasing port-related freight volumes: lessons from
Los Angeles/Long Beach and other US ports and hinterlands, Discussion paper no. 2008-12, March, OECD/ITF, Paris.
Gouvernal, E., Debrie, J. and Slack, B. (2005), “Dynamics of change in the port system of the western
Mediterranean”, Maritime Policy and Management, 32, 2, pp.107 121. Grigoriou, C. (2007), “Landlockedness, infrastructure and trade: new estimates for Central Asian
countries”, Policy Research Working Paper 4335, World Bank. HM Treasury (2006a), The Eddington Transport Study: the case for action, HM Treasury/Department for
Transport. _______ (2006b), Stern Review on the Economics of Climate Change, HM Treasury/Cabinet Office. IBM Global Business Services (2007), Rail Liberalisation Index 2007. IFEU/SGKV (2002), Comparative analysis of energy consumption and CO2 emissions of road transport
and combined transport road/rail, Institüt für Energie- und Umweltforschung Heidelberg GmbH (IFEU)/Studiengesellschaft für den kombinierten Verkehr e.V. (SGKV).
Konings, R. (2007), “Opportunities to improve container barge handling in the port of Rotterdam from a
transport network perspective”, Journal of Transport Geography, 15, 6, pp.443-454. Leachman, R. (2008), “Port and modal allocation of waterborne containerized imports from Asia to the
United States”, Transportation Research Part E, 44, pp.313-331. Lloyd’s List (2009), Just over 11 per cent of global containership fleet unemployed, 18 March, Lloyd’s List,
London. McKinnon, A. (2007), CO2 Emissions from Freight Transport in the UK, Report Prepared for the Climate
Change Working Group of the Commission for Integrated Transport. MDS Transmodal (2006), UK port demand forecasts to 2030, MDS Transmodal, Chester. Notteboom, T. (2008), The relationship between seaports and the intermodal hinterland in light of global
supply chains: European challenges, Discussion paper no. 2008-10, March, OECD/ITF, Paris. OECD/ITF (2009), Port competition and hinterland connections, Round Table 143, Organisation for
Economic Cooperation and Development (OECD) / International Transport Forum (ITF), Paris. OSCE (forthcoming), Handbook – border crossing best practices, Secretariat – Office of the Coordinator
of OSCE Economic and Environmental Activities, Organisation for Security and Cooperation in Europe (OSCE), Vienna.
Pando, J., Araujo, A. and Javier Maqueda, F. (2005), “Marketing management at the world’s major ports”,
Martime Policy and Management, 32, 2, pp.67-87. Parola, F. and Veenstra, A. (2008), “The spatial coverage of shipping lines and container terminal
operators”, Journal of Transport Geography, 16, 4, pp.292-299.
51
Pekalis, M. (2009), Border crossings impediments: how they affect a country, UNECE/ITF/World Bank
Seminar on Overcoming Border Crossing Obstacles, Paris, 5-6 March. Pilsbury, S. and Meaney, A. (2009), Are horizontal mergers and vertical integration a problem? Analysis
of the rail freight market in Europe, Discussion paper no. 2009-4, February, Organisation for Economic Cooperation and Development (OECD)/International Transport Forum (ITF), Paris.
Port of Hamburg (2009), Container throughput in the world-wide most important container ports,
http://www.hafen-hamburg.de/content/view/34/33/lang,en/ Ranger, P. (2009), ITF survey on border crossing obstacles: seminar background report (part 1),
UNECE/ITF/World Bank Seminar on Overcoming Border Crossing Obstacles, Paris, 5-6 March. Roso, V., Woxenius, J. and Lumsden, K. (2008), “The dry port concept: connecting container seaports
with the hinterland”, Journal of Transport Geography, article in press. Russian Railways (2008), Railway infrastructure development on the track to Russian ports, UNECE
Inland Transport Committee, 71st Session, Geneva, 24 26 February. Slovenske železnice (2009), Project Ljubljana - Istanbul/Halkali, Press release, 11 March 2009,
http://www.slo-zeleznice.si/en/press_centre/ news_and_notifications/618/ Smeets, P. (2008), Container transport chains and codification of commodities, 2nd session of the
UNECE Group of Experts on Hinterland Connections to Seaports, 28 October, Geneva. SUTRANET (2007), “A project within the Interreg IIIB North Sea Programme”, Motorways of the Sea:
Economic Barriers, Weaknesses and Challenges, Napier University, Edinburgh. UIC (2008a), DIOMIS: Agenda 2015 for combined transport in Europe, UIC, Paris. _______ (2008b), TEMA Terminal Management: Final Report, UIC, Paris. UNCTAD (2006), Report of the expert meeting on ICT solutions to facilitate trade at border crossings and
ports, TD/B/COM.3/EM.27/3, UNCTAD, Geneva. _______ (2007), Note by the UNCTAD secretariat for the expert meeting on regional cooperation in
transit transport: solutions for landlocked and transit developing countries, 27-28 September, UNCTAD, Geneva.
_______ (2008a), Trade and Development Report 2008, UNCTAD, Geneva. _______ (2008b), Review of Maritime Transport 2008, UNCTAD, Geneva. _______ (2008c), Recent development in maritime transport and challenges ahead for ports,
Presentation to UNECE Conference on Hinterland Connections of Seaports, Piraeus, Greece, 18 September.
UNECE (2006), The Millennium Development Goals – the way ahead: a pan-European perspective,
UNECE, Geneva. _______ (2008), Hinterland connections of seaports: the role of seaports as a link between inland and
maritime transport, Conference in Piraeus, Greece, 17-18 September (see http://www.unece.org/trans/main/wp5/wp5_ge1_SPC.html# conclusions for full details).
UNESCAP (2003), Transit transport issues in landlocked and transit developing countries, Note by the
secretariat, E/ESCAP/1282, UNESCAP, Bangkok.
52
Van de Voorde, E. and Vanelslander, T. (2009), Market power and vertical and horizontal integration in
the maritime shipping and port industry, Discussion paper no. 2009-2, OECD/ITF, Paris. Via Donau (2006), COLD (Container Liner Service Danube): an assessment of the opportunities and risks
of container transport on the Danube river between Austria and the Black Sea, Final Report, Via Donau, Vienna.
WCO (2009), Customs responses for facilitating the cross-border movement of goods and conveyances,
Joint ITF/UNECE/World Bank Seminar on Overcoming Border Crossing Obstacles, Paris, 5-6 March.
Wiegmans, B., van der Hoest, A. and Notteboom, T. (2008), “Port and terminal selection by deep-sea
container operators”, Maritime Policy and Management, 35, 6, pp. 517 534. Woodburn, A. (2008), An investigation of container train service provision and load factors in Great
Britain, UTSG, Southampton, January 2008. World Bank (2005), Best practices in corridor management, World Bank, Washington DC. World Bank (2007a), Connecting to compete: trade logistics in the global economy, World Bank,
Washington DC. _______ (2007b), Global economic prospects: managing the next wave of globalization, World Bank,
Washington DC. _______ (2008b), Trading across borders, World Bank Group, Washington DC (on-line at:
http://www.doingbusiness.org/ExploreTopics/TradingAcrossBorders) _______ (2008a), Transport Business Strategy for 2008-2012, World Bank, Washington DC. World Economic Forum (2008), The Global Enabling Trade Report 2008, World Economic Forum,
Geneva. WTO (2008), International Trade Statistics 2008, World Trade Organization (WTO), Geneva. _______ (2009), WTO sees 9% global trade decline as recession strikes, Press release (PRESS/554), 24
March, World Trade Organization (WTO), Geneva. Zhang, A. (2008), The impact of hinterland access conditions on rivalry between ports, Discussion paper
no. 2008-8, February, OECD/ITF, Paris.
53
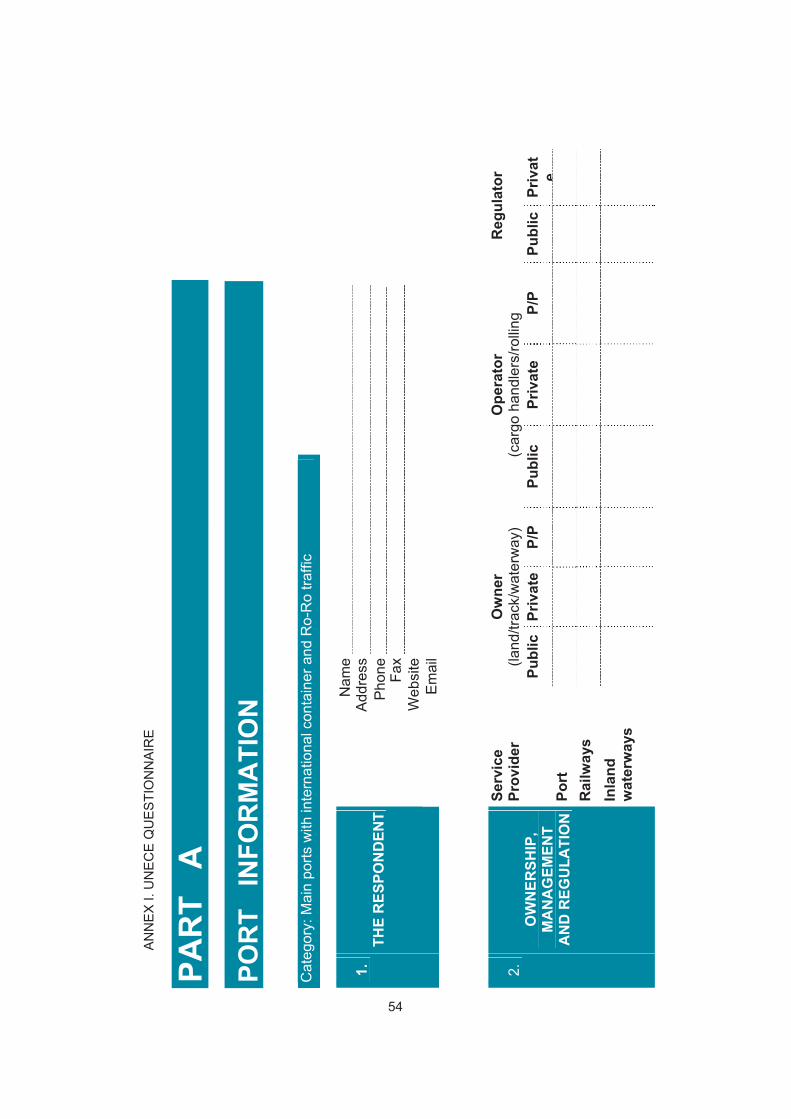
AN
NE
X I.
UN
EC
E Q
UE
STI
ON
NA
IRE
PAR
T A
POR
T I
NFO
RM
ATI
ON
Cat
egor
y: M
ain
ports
with
inte
rnat
iona
l con
tain
er a
nd R
o-R
o tra
ffic
Nam
eA
ddre
ssP
hone Fa
xW
ebsi
te
1.
THE
RES
PON
DEN
T
Em
ail
Serv
ice
Prov
ider
O
wne
r (la
nd/tr
ack/
wat
erw
ay)
Ope
rato
r (c
argo
han
dler
s/ro
lling
R
egul
ator
Publ
icPr
ivat
eP/
P Pu
blic
Pr
ivat
e P/
P Pu
blic
Priv
ate
Port
R
ailw
ays
2.
OW
NER
SHIP
, M
AN
AG
EMEN
T A
ND
REG
ULA
TIO
N
Inla
nd
wat
erw
ays
54

Term
inal
Qua
y(s)
Size
Le
ngth
(m) o
r are
a (m
²)D
epth
alo
ngsi
de
(m)
Ann
ual t
raffi
c
(tonn
es/T
EU
/veh
icle
s)
Con
tain
er b
erth
s
Ro-
Ro
Bul
k te
rmin
al
Gen
eral
car
go
3.
TER
MIN
AL
SIZE
A
ND
TH
RO
UG
HPU
T
Con
tain
er y
ard
Yea
r D
ry
Bul
k M
etric
to
nnes
Liqu
id
Bul
k M
etric
to
nnes
Gen
eral
C
argo
M
etric
to
nnes
Con
tain
ers
TEU
Ro-
Ro
Frei
ght
vehi
cles
2009
(pro
ject
ed)*
20
08 (e
stim
ate)
20
07
4.
TOTA
L C
AR
GO
H
AN
DLI
NG
2006
*P
leas
e pr
ovid
e al
so lo
nger
term
pro
ject
ions
to 2
010,
201
5 an
d 20
20, i
f ava
ilabl
e
Equ
ipm
ent
C
apac
ity
(tonn
es)
Cap
acity
re
ach
(TE
U)
Num
ber
Ave
rage
ag
e (yea
rs)
Gan
try C
rane
s
Q
uay
Cra
nes
Mob
ile C
rane
s
R
each
Sta
cker
s
5.
HA
ND
LIN
G E
QU
IPM
ENT
AN
D
CA
PAC
ITY
OF
CO
NTA
INER
TE
RM
INA
LS
Stra
ddle
car
riers
55
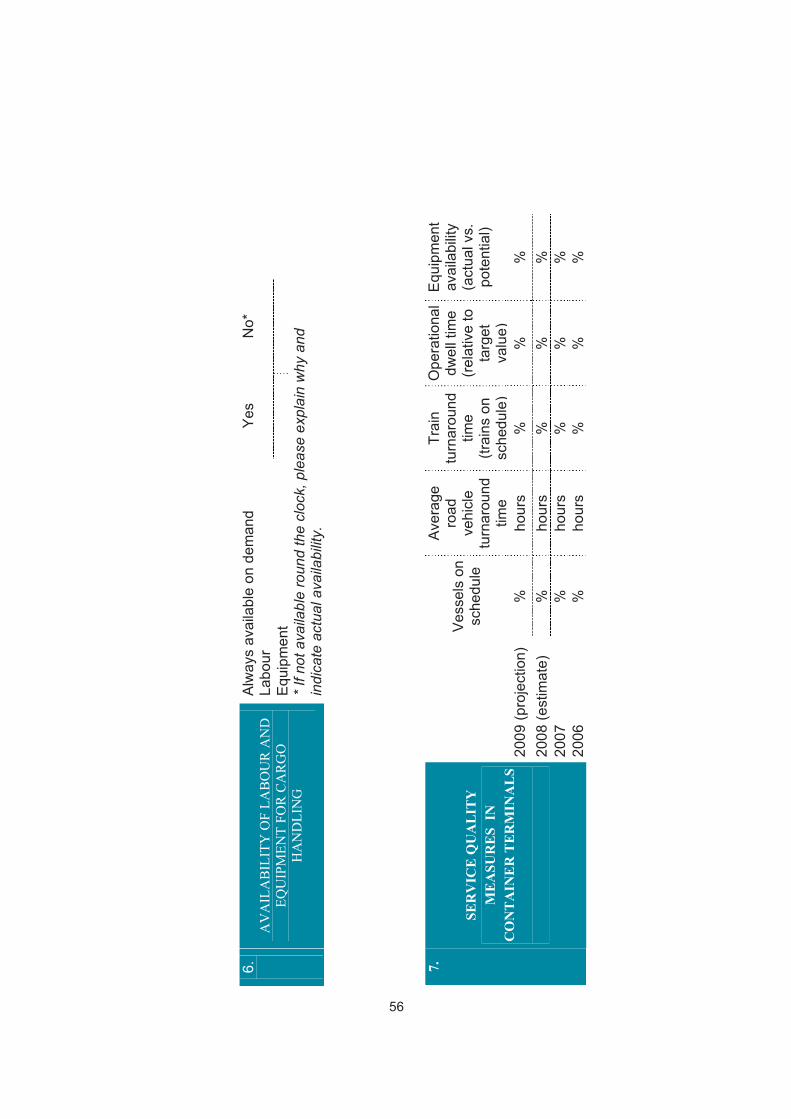
Alw
ays
avai
labl
e on
dem
and
Yes
N
o*
Labo
ur
Equ
ipm
ent
6.
AV
AIL
AB
ILIT
Y O
F LA
BO
UR
AN
D
EQU
IPM
ENT
FOR
CA
RG
O
HA
ND
LIN
G*
If no
t ava
ilabl
e ro
und
the
cloc
k, p
leas
e ex
plai
n w
hy a
nd
indi
cate
act
ual a
vaila
bilit
y.
Ves
sels
on
sche
dule
Ave
rage
ro
ad
vehi
cle
turn
arou
nd
time
Trai
n tu
rnar
ound
tim
e (tr
ains
on
sche
dule
)
Ope
ratio
nal
dwel
l tim
e (r
elat
ive
to
targ
et
valu
e)
Equ
ipm
ent
avai
labi
lity
(act
ual v
s.
pote
ntia
l)
2009
(pro
ject
ion)
%
ho
urs
%
%
%
2008
(est
imat
e)
%
hour
s %
%
%
20
07
%
hour
s %
%
%
7.
SER
VIC
E Q
UA
LIT
Y
ME
ASU
RE
S IN
C
ON
TA
INE
R T
ER
MIN
AL
S
2006
%
ho
urs
%
%
%
56
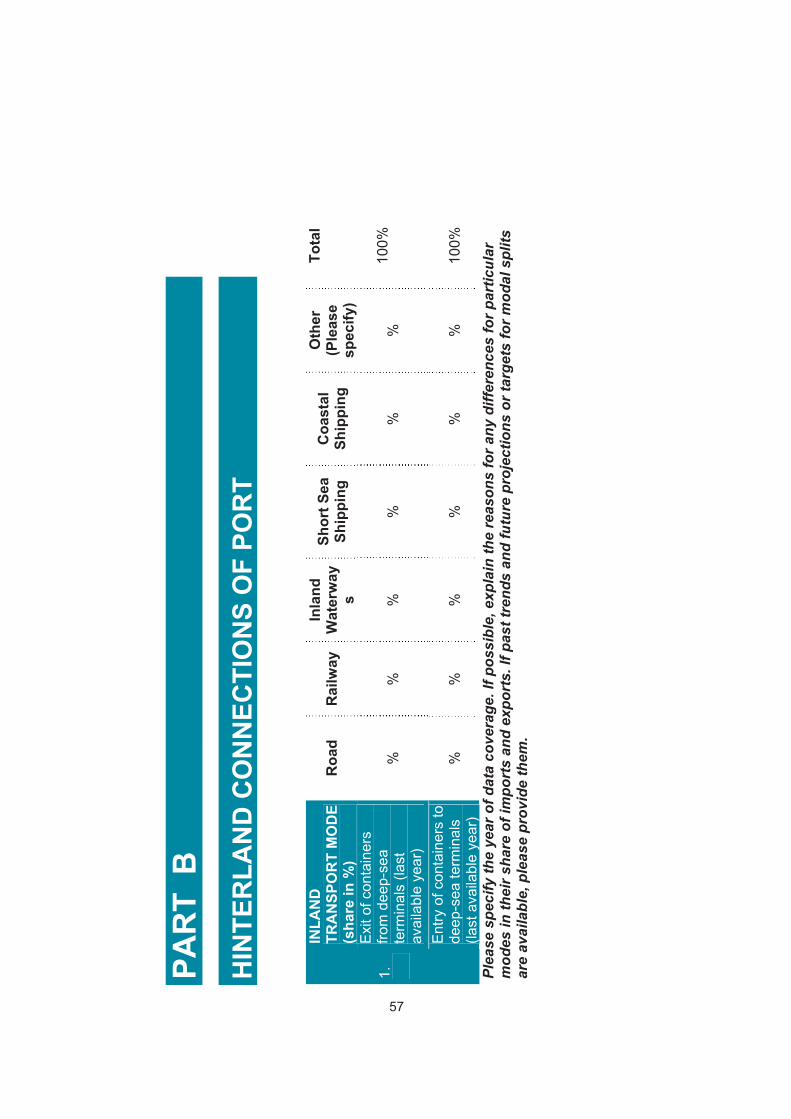
PAR
T B
HIN
TER
LAN
D C
ON
NEC
TIO
NS
OF
POR
T
INLA
ND
TR
AN
SPO
RT
MO
DE
(sha
re in
%)
Roa
d R
ailw
ay
Inla
nd
Wat
erw
ays
Shor
t Sea
Sh
ippi
ng
Coa
stal
Sh
ippi
ng
Oth
er
(Ple
ase
spec
ify)
Tota
l
Exi
t of c
onta
iner
s fro
m d
eep-
sea
term
inal
s (la
st
avai
labl
e ye
ar)
%
%
%
%
%
%
100%
1.
Ent
ry o
f con
tain
ers
to
deep
-sea
term
inal
s (la
st a
vaila
ble
year
) %
%
%
%
%
%
10
0%
Plea
se s
peci
fy th
e ye
ar o
f dat
a co
vera
ge. I
f pos
sibl
e, e
xpla
in th
e re
ason
s fo
r any
diff
eren
ces
for p
artic
ular
m
odes
in th
eir s
hare
of i
mpo
rts
and
expo
rts.
If p
ast t
rend
s an
d fu
ture
pro
ject
ions
or t
arge
ts fo
r mod
al s
plits
ar
e av
aila
ble,
ple
ase
prov
ide
them
.
57
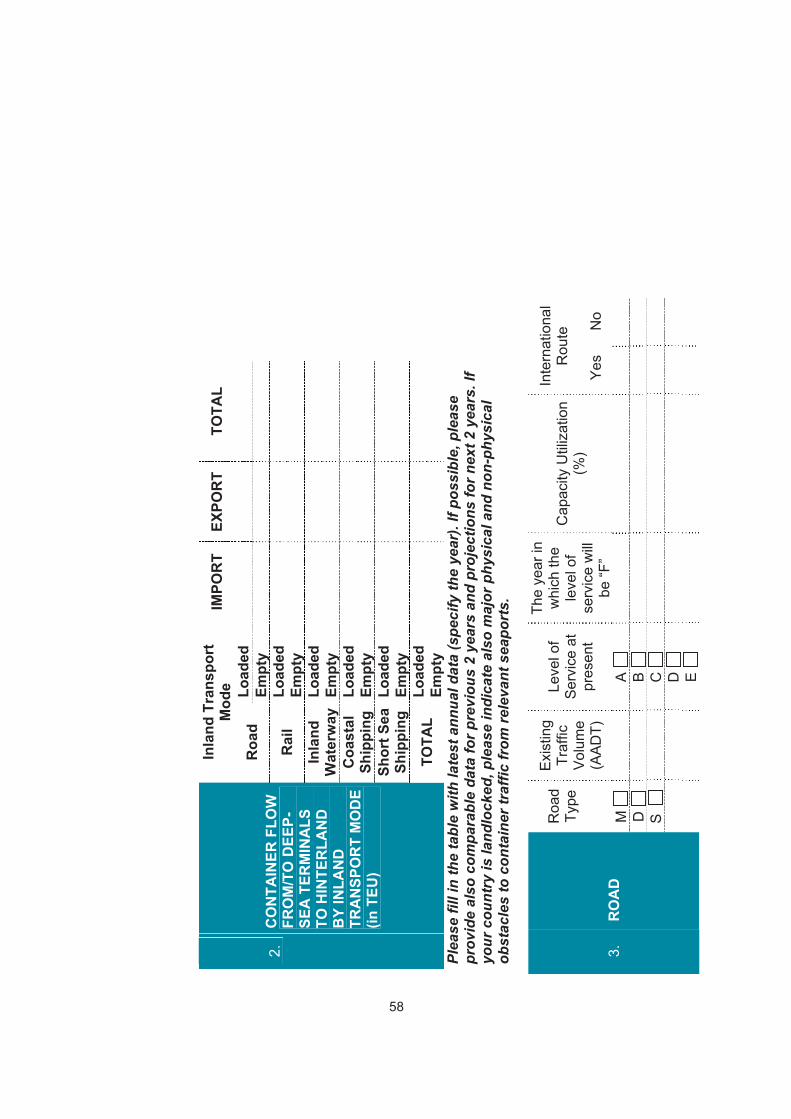
Inla
nd T
rans
port
M
ode
IMPO
RT
EXPO
RT
TOTA
L
Load
ed
Roa
d Em
pty
Load
ed
Rai
l Em
pty
Load
ed
Inla
nd
Wat
erw
ayEm
pty
Load
ed
Coa
stal
Sh
ippi
ng
Empt
y Lo
aded
Sh
ort S
ea
Ship
ping
Em
pty
Load
ed
2.
CO
NTA
INER
FLO
W
FRO
M/T
O D
EEP-
SEA
TER
MIN
ALS
TO
HIN
TER
LAN
D
BY
INLA
ND
TR
AN
SPO
RT
MO
DE
(in
TEU
)
TOTA
L Em
pty
Plea
se fi
ll in
the
tabl
e w
ith la
test
ann
ual d
ata
(spe
cify
the
year
). If
poss
ible
, ple
ase
prov
ide
also
com
para
ble
data
for p
revi
ous
2 ye
ars
and
proj
ectio
ns fo
r nex
t 2 y
ears
. If
your
cou
ntry
is la
ndlo
cked
, ple
ase
indi
cate
als
o m
ajor
phy
sica
l and
non
-phy
sica
l ob
stac
les
to c
onta
iner
traf
fic fr
om re
leva
nt s
eapo
rts.
Roa
d Ty
pe
Exi
stin
g Tr
affic
V
olum
e (A
AD
T)
Leve
l of
Ser
vice
at
pres
ent
The
year
in
whi
ch th
e le
vel o
f se
rvic
e w
ill
be “F
”
Cap
acity
Util
izat
ion
(%)
Inte
rnat
iona
l R
oute
Yes
No
M
A
D
B
S
C
D
3.
RO
AD
E
58
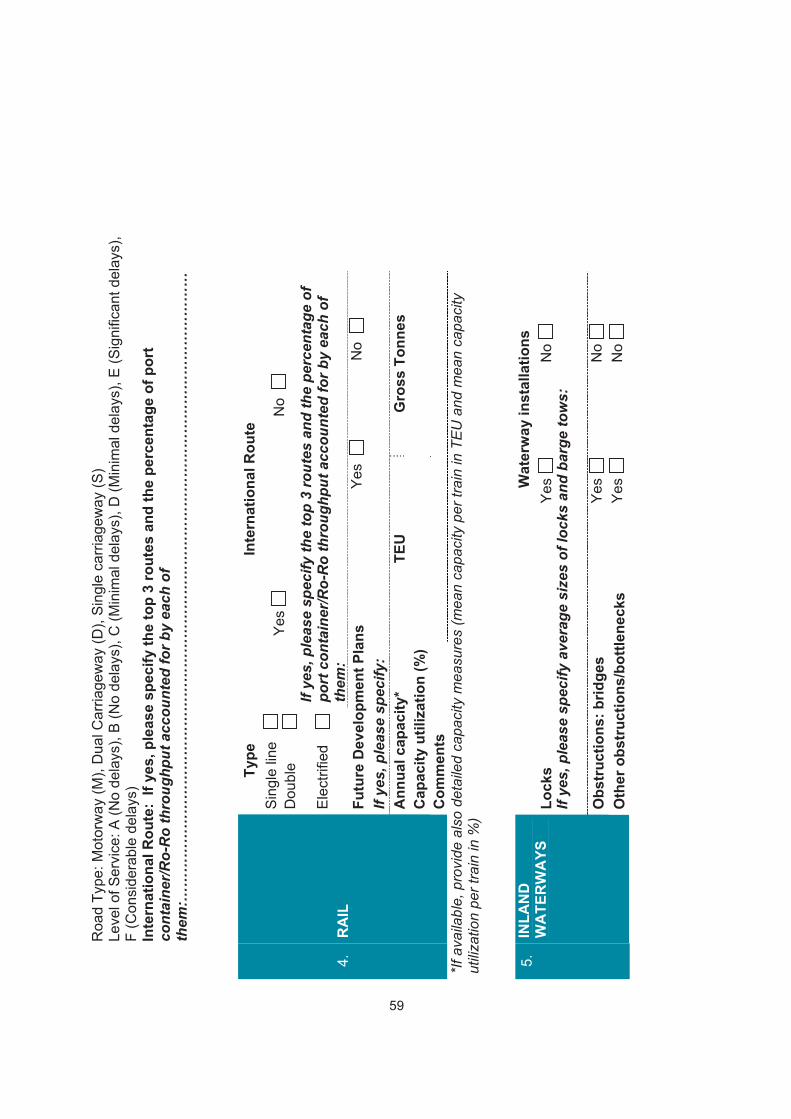
Roa
d Ty
pe: M
otor
way
(M),
Dua
l Car
riage
way
(D),
Sin
gle
carr
iage
way
(S)
Leve
l of S
ervi
ce: A
(No
dela
ys),
B (N
o de
lays
), C
(Min
imal
del
ays)
, D (M
inim
al d
elay
s), E
(Sig
nific
ant d
elay
s),
F (C
onsi
dera
ble
dela
ys)
Inte
rnat
iona
l Rou
te:
If ye
s, p
leas
e sp
ecify
the
top
3 ro
utes
and
the
perc
enta
ge o
f por
t co
ntai
ner/R
o-R
o th
roug
hput
acc
ount
ed fo
r by
each
of
them
:……
……
……
……
……
……
……
……
……
……
……
……
……
……
……
……
……
……
……
……
……
…
Type
In
tern
atio
nal R
oute
S
ingl
e lin
eD
oubl
e Y
es
No
Ele
ctrif
ied
If ye
s, p
leas
e sp
ecify
the
top
3 ro
utes
and
the
perc
enta
ge o
f po
rt c
onta
iner
/Ro-
Ro
thro
ughp
ut a
ccou
nted
for b
y ea
ch o
f th
em:
Futu
re D
evel
opm
ent P
lans
Y
es
No
If
yes,
ple
ase
spec
ify:
Ann
ual c
apac
ity*
TEU
G
ross
Ton
nes
C
apac
ity u
tiliz
atio
n (%
)
4.
RA
IL
Com
men
ts
*If a
vaila
ble,
pro
vide
als
o de
taile
d ca
paci
ty m
easu
res
(mea
n ca
paci
ty p
er tr
ain
in T
EU a
nd m
ean
capa
city
ut
iliza
tion
per t
rain
in %
)
Wat
erw
ay in
stal
latio
ns
Lock
s Y
es
No
If ye
s, p
leas
e sp
ecify
ave
rage
siz
es o
f loc
ks a
nd b
arge
tow
s:
Obs
truc
tions
: brid
ges
Yes
N
o
5.
INLA
ND
W
ATE
RW
AYS
Oth
er o
bstr
uctio
ns/b
ottle
neck
s Y
es
No
59
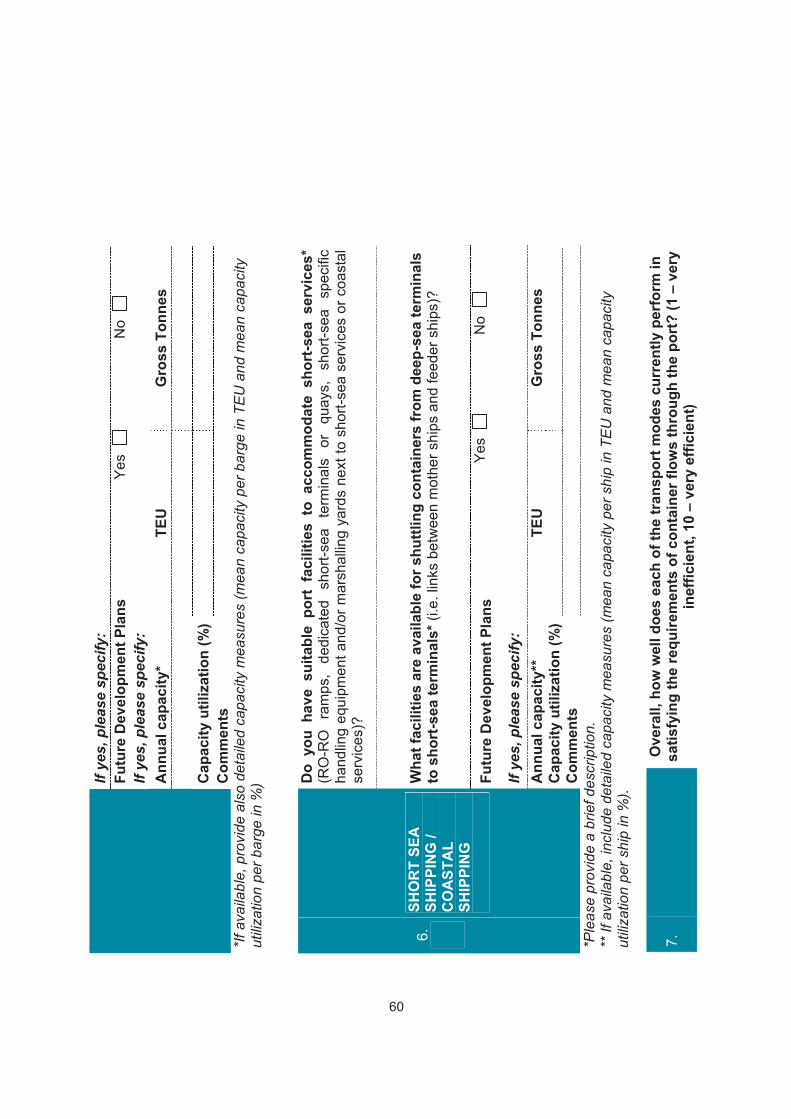
If ye
s, p
leas
e sp
ecify
:Fu
ture
Dev
elop
men
t Pla
ns
Yes
N
o
If ye
s, p
leas
e sp
ecify
: A
nnua
l cap
acity
* TE
U
Gro
ss T
onne
s
Cap
acity
util
izat
ion
(%)
Com
men
ts
*If a
vaila
ble,
pro
vide
als
o de
taile
d ca
paci
ty m
easu
res
(mea
n ca
paci
ty p
er b
arge
in T
EU
and
mea
n ca
paci
ty
utili
zatio
n pe
r bar
ge in
%) D
o yo
u ha
ve s
uita
ble
port
fac
ilitie
s to
acc
omm
odat
e sh
ort-s
ea s
ervi
ces*
(RO
-RO
ra
mps
, de
dica
ted
shor
t-sea
te
rmin
als
or
quay
s,
shor
t-sea
sp
ecifi
c ha
ndlin
g eq
uipm
ent a
nd/o
r mar
shal
ling
yard
s ne
xt to
sho
rt-se
a se
rvic
es o
r coa
stal
se
rvic
es)?
Wha
t fac
ilitie
s ar
e av
aila
ble
for s
huttl
ing
cont
aine
rs fr
om d
eep-
sea
term
inal
s to
sho
rt-s
ea te
rmin
als*
(i.e
. lin
ks b
etw
een
mot
her s
hips
and
feed
er s
hips
)?
Futu
re D
evel
opm
ent P
lans
Y
es
No
If ye
s, p
leas
e sp
ecify
: A
nnua
l cap
acity
**
TEU
G
ross
Ton
nes
C
apac
ity u
tiliz
atio
n (%
)
6.
SHO
RT
SEA
SH
IPPI
NG
/ C
OA
STA
L SH
IPPI
NG
Com
men
ts
*Ple
ase
prov
ide
a br
ief d
escr
iptio
n.
** If
ava
ilabl
e, in
clud
e de
taile
d ca
paci
ty m
easu
res
(mea
n ca
paci
ty p
er s
hip
in T
EU
and
mea
n ca
paci
ty
utili
zatio
n pe
r shi
p in
%).
7.
Ove
rall,
how
wel
l doe
s ea
ch o
f the
tran
spor
t mod
es c
urre
ntly
per
form
in
satis
fyin
g th
e re
quire
men
ts o
f con
tain
er fl
ows
thro
ugh
the
port
? (1
– v
ery
inef
ficie
nt, 1
0 –
very
effi
cien
t)
60
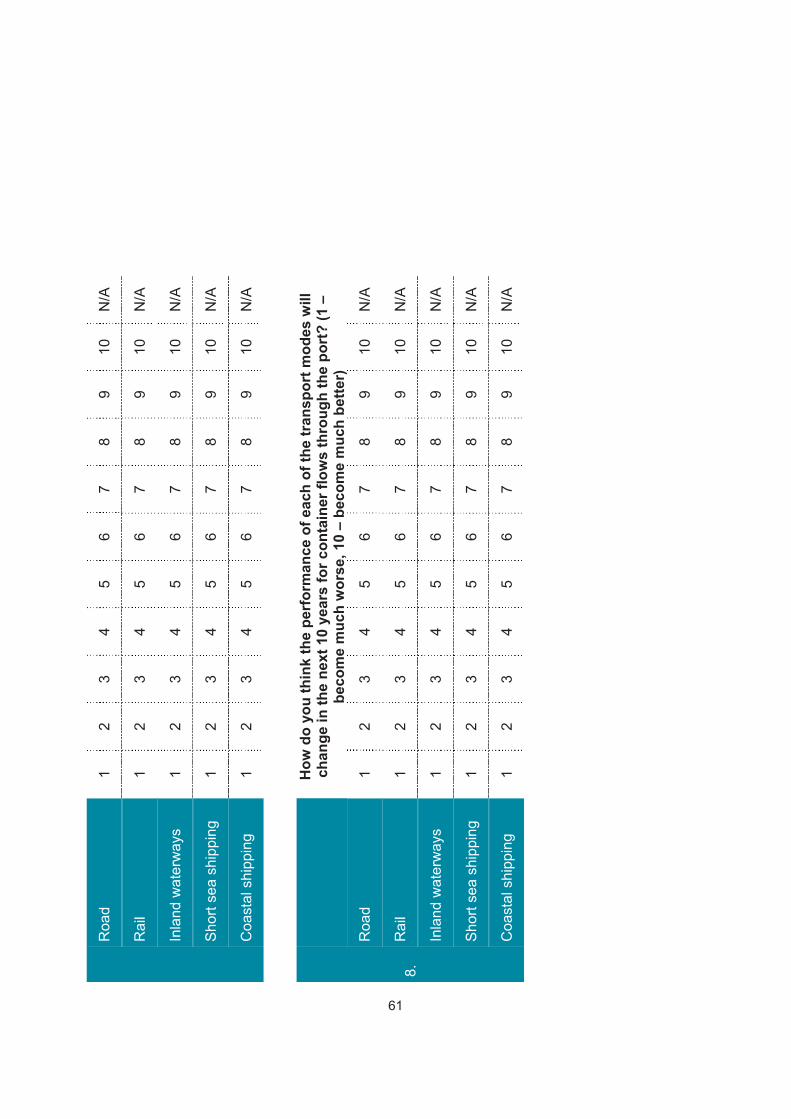
Roa
d 1
2 3
4 5
6 7
8 9
10
N/A
Rai
l 1
2 3
4 5
6 7
8 9
10
N/A
Inla
nd w
ater
way
s 1
2 3
4 5
6 7
8 9
10
N/A
Sho
rt se
a sh
ippi
ng
1 2
3 4
5 6
7 8
9 10
N
/A
Coa
stal
shi
ppin
g 1
2 3
4 5
6 7
8 9
10
N/A
How
do
you
thin
k th
e pe
rfor
man
ce o
f eac
h of
the
tran
spor
t mod
es w
ill
chan
ge in
the
next
10
year
s fo
r con
tain
er fl
ows
thro
ugh
the
port
? (1
–
beco
me
muc
h w
orse
, 10
– be
com
e m
uch
bette
r)
Roa
d 1
2 3
4 5
6 7
8 9
10
N/A
Rai
l 1
2 3
4 5
6 7
8 9
10
N/A
Inla
nd w
ater
way
s 1
2 3
4 5
6 7
8 9
10
N/A
Sho
rt se
a sh
ippi
ng
1 2
3 4
5 6
7 8
9 10
N
/A
8.
Coa
stal
shi
ppin
g 1
2 3
4 5
6 7
8 9
10
N/A
61

Wha
t are
the
thre
e m
ost s
igni
fican
t cha
nges
(e.g
. rel
atin
g to
in
fras
truc
ture
, ope
ratio
ns, a
nd re
gula
tions
) tha
t cou
ld b
e m
ade
to
impr
ove
the
perf
orm
ance
of h
inte
rland
flow
s of
con
tain
ers
to/fr
om th
e po
rt?
1. M
ode:
D
etai
ls:
2. M
ode:
D
etai
ls:
9.
3. M
ode:
D
etai
ls:
62

ANNEX II. STATISTICAL INFORMATION Table I: Analysis of responses to questions B7 and B8 B7: Overall, how well does each of the transport modes currently perform in satisfying the requirements of container flows through the port? (1 – very inefficient, 10 – very efficient)
Full sample (n = 33) Road Rail IWW Short sea Coastal Average 7.9 6.7 5.5 7.2 6.8 St. dev. 1.83 2.62 2.73 2.82 2.90 No. of observations 30 23 8 11 12 Turkey (n = 13) Average 8.8 6.9 1.0 5.3 7.3 St. dev. 1.34 3.67 - 4.04 3.77 No. of observations 13 7 1 3 4 EU-15 (n = 10) Average 7.1 7.4 6.6 7.5 6.5 St. dev. 2.20 1.85 1.34 2.43 2.62 No. of observations 9 8 5 6 8 New EU countries + Russian Federation + Ukraine (n = 8) Average 6.8 5.3 - 9.0 - St. dev. 1.47 2.16 - 0.00 - No. of observations 6 6 - 2 -
B8: How do you think the performance of each of the transport modes will change in the next 10 years for container flows through the port? (1 – become much worse, 10 – become much better)
Full sample (n = 33) Road Rail IWW Short sea Coastal Average 8.0 8.0 7.1 8.1 7.5 St. dev. 2.07 1.67 2.73 1.69 1.92 No. of observations 29 26 10 14 15 Turkey (n = 13) Average 9.3 7.8 6.0 7.6 7.8 St. dev. 1.60 2.15 2.83 2.30 2.71 No. of observations 12 10 2 5 6 EU-15 (n = 10) Average 6.3 8.2 7.8 8.0 7.3 St. dev. 2.00 1.09 2.56 1.29 1.32 No. of observations 10 9 6 7 9 New EU countries + Russian Federation + Ukraine (n = 8) Average 8.5 7.7 3.0 9.5 - St. dev. 1.05 1.63 - 0.71 - No. of observations 6 6 1 2 -
63
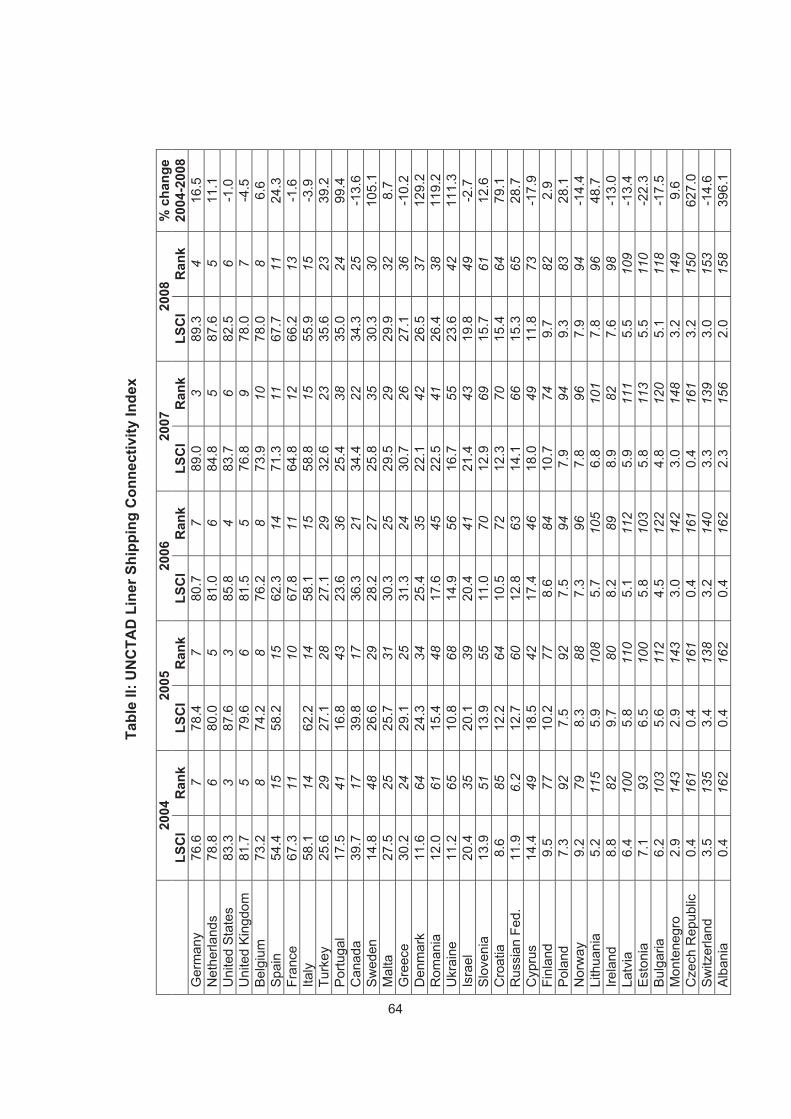
Tabl
e II:
UN
CTA
D L
iner
Shi
ppin
g C
onne
ctiv
ity In
dex
20
04
2005
20
06
2007
20
08
% c
hang
e
LSC
I R
ank
LSC
I R
ank
LSC
I R
ank
LSC
I R
ank
LSC
I R
ank
2004
-200
8 G
erm
any
76.6
7
78.4
7
80.7
7
89.0
3
89.3
4
16.5
N
ethe
rland
s 78
.8
6 80
.0
5 81
.0
6 84
.8
5 87
.6
5 11
.1
Uni
ted
Sta
tes
83.3
3
87.6
3
85.8
4
83.7
6
82.5
6
-1.0
U
nite
d K
ingd
om
81.7
5
79.6
6
81.5
5
76.8
9
78.0
7
-4.5
B
elgi
um
73.2
8
74.2
8
76.2
8
73.9
10
78
.0
8 6.
6 S
pain
54
.4
15
58.2
15
62
.3
14
71.3
11
67
.7
11
24.3
Fr
ance
67
.3
11
10
67
.8
11
64.8
12
66
.2
13
-1.6
Ita
ly
58.1
14
62
.2
14
58.1
15
58
.8
15
55.9
15
-3
.9
Turk
ey
25.6
29
27
.1
28
27.1
29
32
.6
23
35.6
23
39
.2
Por
tuga
l 17
.5
41
16.8
43
23
.6
36
25.4
38
35
.0
24
99.4
C
anad
a 39
.7
17
39.8
17
36
.3
21
34.4
22
34
.3
25
-13.
6 S
wed
en
14.8
48
26
.6
29
28.2
27
25
.8
35
30.3
30
10
5.1
Mal
ta
27.5
25
25
.7
31
30.3
25
29
.5
29
29.9
32
8.
7 G
reec
e 30
.2
24
29.1
25
31
.3
24
30.7
26
27
.1
36
-10.
2 D
enm
ark
11.6
64
24
.3
34
25.4
35
22
.1
42
26.5
37
12
9.2
Rom
ania
12
.0
61
15.4
48
17
.6
45
22.5
41
26
.4
38
119.
2 U
krai
ne
11.2
65
10
.8
68
14.9
56
16
.7
55
23.6
42
11
1.3
Isra
el
20.4
35
20
.1
39
20.4
41
21
.4
43
19.8
49
-2
.7
Slo
veni
a 13
.9
51
13.9
55
11
.0
70
12.9
69
15
.7
61
12.6
C
roat
ia
8.6
85
12.2
64
10
.5
72
12.3
70
15
.4
64
79.1
R
ussi
an F
ed.
11.9
6.
2 12
.7
60
12.8
63
14
.1
66
15.3
65
28
.7
Cyp
rus
14.4
49
18
.5
42
17.4
46
18
.0
49
11.8
73
-1
7.9
Finl
and
9.5
77
10.2
77
8.
6 84
10
.7
74
9.7
82
2.9
Pol
and
7.3
92
7.5
92
7.5
94
7.9
94
9.3
83
28.1
N
orw
ay
9.2
79
8.3
88
7.3
96
7.8
96
7.9
94
-14.
4 Li
thua
nia
5.2
115
5.9
108
5.7
105
6.8
101
7.8
96
48.7
Ire
land
8.
8 82
9.
7 80
8.
2 89
8.
9 82
7.
6 98
-1
3.0
Latv
ia
6.4
100
5.8
110
5.1
112
5.9
111
5.5
109
-13.
4 E
ston
ia
7.1
93
6.5
100
5.8
103
5.8
113
5.5
110
-22.
3 B
ulga
ria
6.2
103
5.6
112
4.5
122
4.8
120
5.1
118
-17.
5 M
onte
negr
o 2.
9 14
3 2.
9 14
3 3.
0 14
2 3.
0 14
8 3.
2 14
9 9.
6 C
zech
Rep
ublic
0.
4 16
1 0.
4 16
1 0.
4 16
1 0.
4 16
1 3.
2 15
0 62
7.0
Sw
itzer
land
3.
5 13
5 3.
4 13
8 3.
2 14
0 3.
3 13
9 3.
0 15
3 -1
4.6
Alb
ania
0.
4 16
2 0.
4 16
2 0.
4 16
2 2.
3 15
6 2.
0 15
8 39
6.1
64
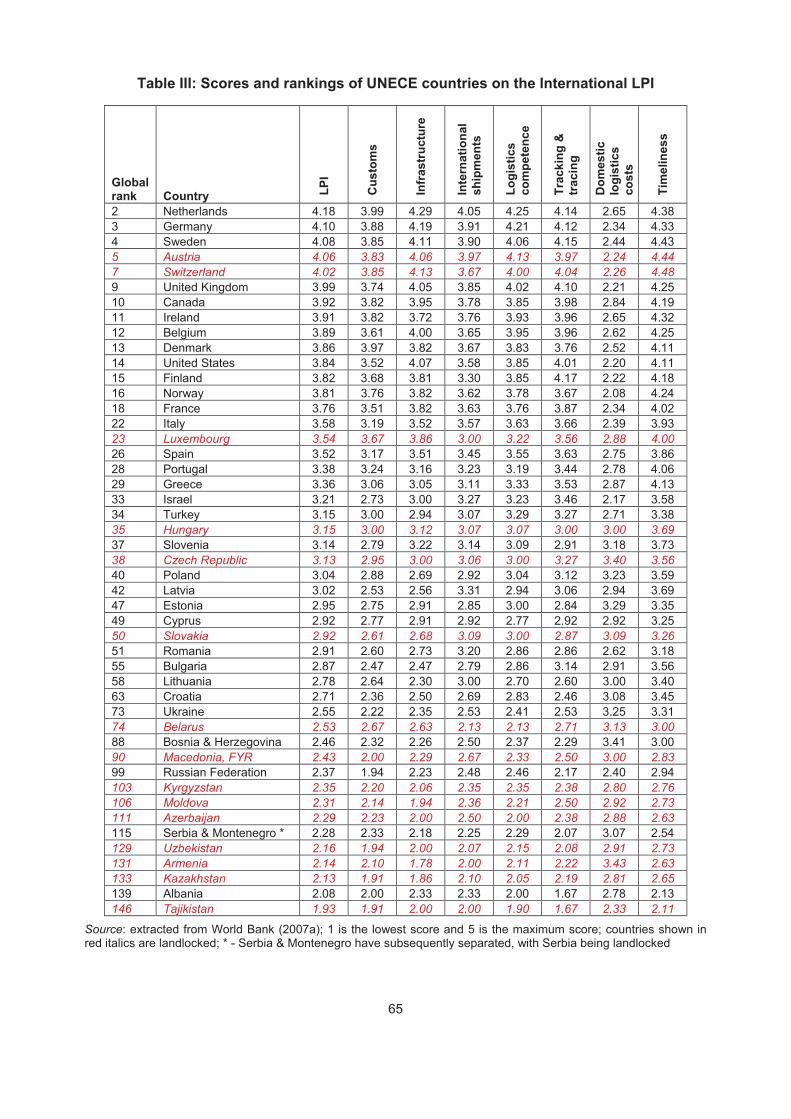
Table III: Scores and rankings of UNECE countries on the International LPI
Global rank Country LP
I
Cus
tom
s
Infr
astr
uctu
re
Inte
rnat
iona
l sh
ipm
ents
Logi
stic
s co
mpe
tenc
e
Trac
king
&
trac
ing
Dom
estic
lo
gist
ics
cost
s
Tim
elin
ess
2 Netherlands 4.18 3.99 4.29 4.05 4.25 4.14 2.65 4.38 3 Germany 4.10 3.88 4.19 3.91 4.21 4.12 2.34 4.33 4 Sweden 4.08 3.85 4.11 3.90 4.06 4.15 2.44 4.43 5 Austria 4.06 3.83 4.06 3.97 4.13 3.97 2.24 4.44 7 Switzerland 4.02 3.85 4.13 3.67 4.00 4.04 2.26 4.48 9 United Kingdom 3.99 3.74 4.05 3.85 4.02 4.10 2.21 4.25 10 Canada 3.92 3.82 3.95 3.78 3.85 3.98 2.84 4.19 11 Ireland 3.91 3.82 3.72 3.76 3.93 3.96 2.65 4.32 12 Belgium 3.89 3.61 4.00 3.65 3.95 3.96 2.62 4.25 13 Denmark 3.86 3.97 3.82 3.67 3.83 3.76 2.52 4.11 14 United States 3.84 3.52 4.07 3.58 3.85 4.01 2.20 4.11 15 Finland 3.82 3.68 3.81 3.30 3.85 4.17 2.22 4.18 16 Norway 3.81 3.76 3.82 3.62 3.78 3.67 2.08 4.24 18 France 3.76 3.51 3.82 3.63 3.76 3.87 2.34 4.02 22 Italy 3.58 3.19 3.52 3.57 3.63 3.66 2.39 3.93 23 Luxembourg 3.54 3.67 3.86 3.00 3.22 3.56 2.88 4.00 26 Spain 3.52 3.17 3.51 3.45 3.55 3.63 2.75 3.86 28 Portugal 3.38 3.24 3.16 3.23 3.19 3.44 2.78 4.06 29 Greece 3.36 3.06 3.05 3.11 3.33 3.53 2.87 4.13 33 Israel 3.21 2.73 3.00 3.27 3.23 3.46 2.17 3.58 34 Turkey 3.15 3.00 2.94 3.07 3.29 3.27 2.71 3.38 35 Hungary 3.15 3.00 3.12 3.07 3.07 3.00 3.00 3.69 37 Slovenia 3.14 2.79 3.22 3.14 3.09 2.91 3.18 3.73 38 Czech Republic 3.13 2.95 3.00 3.06 3.00 3.27 3.40 3.56 40 Poland 3.04 2.88 2.69 2.92 3.04 3.12 3.23 3.59 42 Latvia 3.02 2.53 2.56 3.31 2.94 3.06 2.94 3.69 47 Estonia 2.95 2.75 2.91 2.85 3.00 2.84 3.29 3.35 49 Cyprus 2.92 2.77 2.91 2.92 2.77 2.92 2.92 3.25 50 Slovakia 2.92 2.61 2.68 3.09 3.00 2.87 3.09 3.26 51 Romania 2.91 2.60 2.73 3.20 2.86 2.86 2.62 3.18 55 Bulgaria 2.87 2.47 2.47 2.79 2.86 3.14 2.91 3.56 58 Lithuania 2.78 2.64 2.30 3.00 2.70 2.60 3.00 3.40 63 Croatia 2.71 2.36 2.50 2.69 2.83 2.46 3.08 3.45 73 Ukraine 2.55 2.22 2.35 2.53 2.41 2.53 3.25 3.31 74 Belarus 2.53 2.67 2.63 2.13 2.13 2.71 3.13 3.00 88 Bosnia & Herzegovina 2.46 2.32 2.26 2.50 2.37 2.29 3.41 3.00 90 Macedonia, FYR 2.43 2.00 2.29 2.67 2.33 2.50 3.00 2.83 99 Russian Federation 2.37 1.94 2.23 2.48 2.46 2.17 2.40 2.94 103 Kyrgyzstan 2.35 2.20 2.06 2.35 2.35 2.38 2.80 2.76 106 Moldova 2.31 2.14 1.94 2.36 2.21 2.50 2.92 2.73 111 Azerbaijan 2.29 2.23 2.00 2.50 2.00 2.38 2.88 2.63 115 Serbia & Montenegro * 2.28 2.33 2.18 2.25 2.29 2.07 3.07 2.54 129 Uzbekistan 2.16 1.94 2.00 2.07 2.15 2.08 2.91 2.73 131 Armenia 2.14 2.10 1.78 2.00 2.11 2.22 3.43 2.63 133 Kazakhstan 2.13 1.91 1.86 2.10 2.05 2.19 2.81 2.65 139 Albania 2.08 2.00 2.33 2.33 2.00 1.67 2.78 2.13 146 Tajikistan 1.93 1.91 2.00 2.00 1.90 1.67 2.33 2.11
Source: extracted from World Bank (2007a); 1 is the lowest score and 5 is the maximum score; countries shown in red italics are landlocked; * - Serbia & Montenegro have subsequently separated, with Serbia being landlocked
65
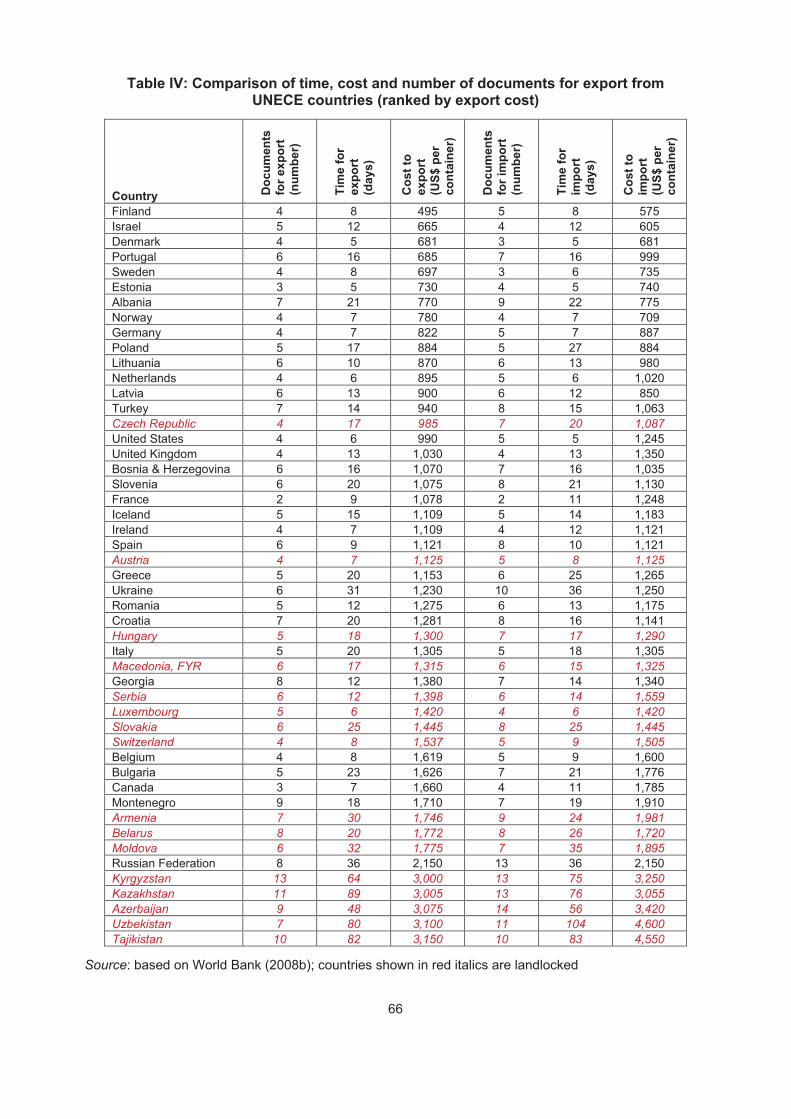
Table IV: Comparison of time, cost and number of documents for export from UNECE countries (ranked by export cost)
Country Doc
umen
ts
for e
xpor
t (n
umbe
r)
Tim
e fo
r ex
port
(d
ays)
Cos
t to
expo
rt
(US$
per
co
ntai
ner)
Doc
umen
ts
for i
mpo
rt
(num
ber)
Tim
e fo
r im
port
(d
ays)
Cos
t to
impo
rt
(US$
per
co
ntai
ner)
Finland 4 8 495 5 8 575 Israel 5 12 665 4 12 605 Denmark 4 5 681 3 5 681 Portugal 6 16 685 7 16 999 Sweden 4 8 697 3 6 735 Estonia 3 5 730 4 5 740 Albania 7 21 770 9 22 775 Norway 4 7 780 4 7 709 Germany 4 7 822 5 7 887 Poland 5 17 884 5 27 884 Lithuania 6 10 870 6 13 980 Netherlands 4 6 895 5 6 1,020 Latvia 6 13 900 6 12 850 Turkey 7 14 940 8 15 1,063 Czech Republic 4 17 985 7 20 1,087 United States 4 6 990 5 5 1,245 United Kingdom 4 13 1,030 4 13 1,350 Bosnia & Herzegovina 6 16 1,070 7 16 1,035 Slovenia 6 20 1,075 8 21 1,130 France 2 9 1,078 2 11 1,248 Iceland 5 15 1,109 5 14 1,183 Ireland 4 7 1,109 4 12 1,121 Spain 6 9 1,121 8 10 1,121 Austria 4 7 1,125 5 8 1,125 Greece 5 20 1,153 6 25 1,265 Ukraine 6 31 1,230 10 36 1,250 Romania 5 12 1,275 6 13 1,175 Croatia 7 20 1,281 8 16 1,141 Hungary 5 18 1,300 7 17 1,290 Italy 5 20 1,305 5 18 1,305 Macedonia, FYR 6 17 1,315 6 15 1,325 Georgia 8 12 1,380 7 14 1,340 Serbia 6 12 1,398 6 14 1,559 Luxembourg 5 6 1,420 4 6 1,420 Slovakia 6 25 1,445 8 25 1,445 Switzerland 4 8 1,537 5 9 1,505 Belgium 4 8 1,619 5 9 1,600 Bulgaria 5 23 1,626 7 21 1,776 Canada 3 7 1,660 4 11 1,785 Montenegro 9 18 1,710 7 19 1,910 Armenia 7 30 1,746 9 24 1,981 Belarus 8 20 1,772 8 26 1,720 Moldova 6 32 1,775 7 35 1,895 Russian Federation 8 36 2,150 13 36 2,150 Kyrgyzstan 13 64 3,000 13 75 3,250 Kazakhstan 11 89 3,005 13 76 3,055 Azerbaijan 9 48 3,075 14 56 3,420 Uzbekistan 7 80 3,100 11 104 4,600 Tajikistan 10 82 3,150 10 83 4,550
Source: based on World Bank (2008b); countries shown in red italics are landlocked
66
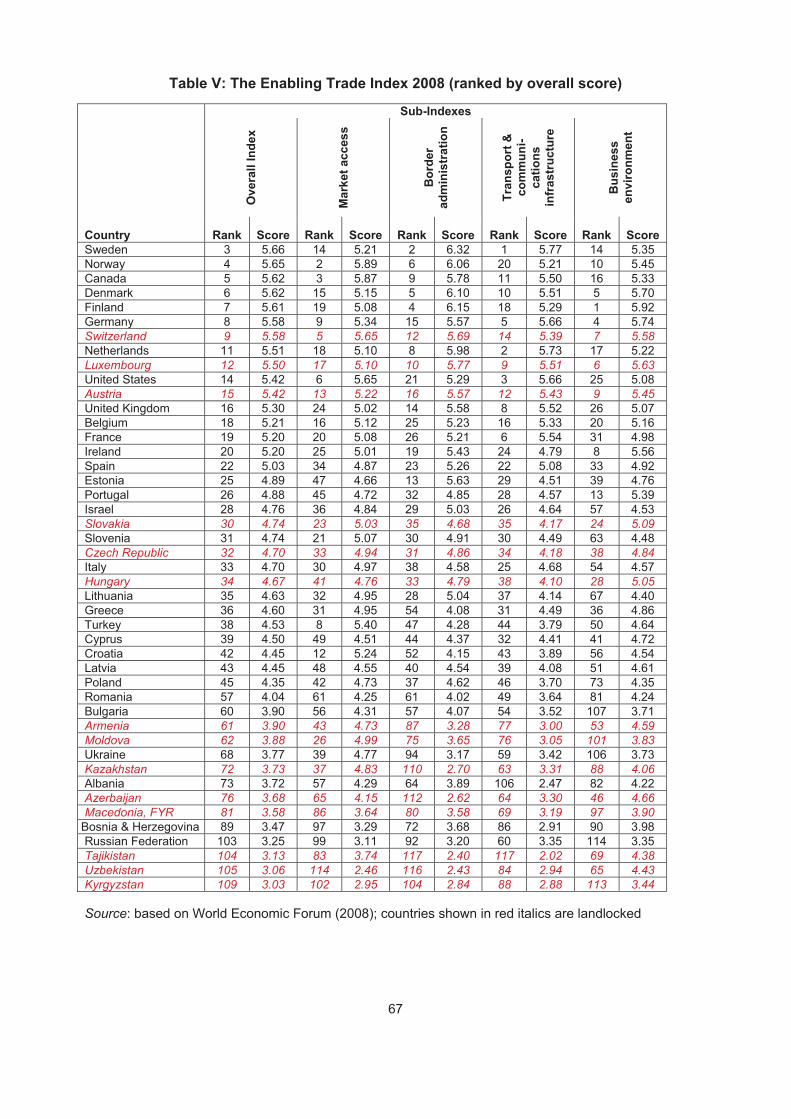
Table V: The Enabling Trade Index 2008 (ranked by overall score)
Sub-Indexes
Ove
rall
Inde
x
Mar
ket a
cces
s
Bor
der
adm
inis
trat
ion
Tran
spor
t &
com
mun
i-ca
tions
in
fras
truc
ture
Bus
ines
s en
viro
nmen
t
Country Rank Score Rank Score Rank Score Rank Score Rank Score Sweden 3 5.66 14 5.21 2 6.32 1 5.77 14 5.35 Norway 4 5.65 2 5.89 6 6.06 20 5.21 10 5.45 Canada 5 5.62 3 5.87 9 5.78 11 5.50 16 5.33 Denmark 6 5.62 15 5.15 5 6.10 10 5.51 5 5.70 Finland 7 5.61 19 5.08 4 6.15 18 5.29 1 5.92 Germany 8 5.58 9 5.34 15 5.57 5 5.66 4 5.74 Switzerland 9 5.58 5 5.65 12 5.69 14 5.39 7 5.58 Netherlands 11 5.51 18 5.10 8 5.98 2 5.73 17 5.22 Luxembourg 12 5.50 17 5.10 10 5.77 9 5.51 6 5.63 United States 14 5.42 6 5.65 21 5.29 3 5.66 25 5.08 Austria 15 5.42 13 5.22 16 5.57 12 5.43 9 5.45 United Kingdom 16 5.30 24 5.02 14 5.58 8 5.52 26 5.07 Belgium 18 5.21 16 5.12 25 5.23 16 5.33 20 5.16 France 19 5.20 20 5.08 26 5.21 6 5.54 31 4.98 Ireland 20 5.20 25 5.01 19 5.43 24 4.79 8 5.56 Spain 22 5.03 34 4.87 23 5.26 22 5.08 33 4.92 Estonia 25 4.89 47 4.66 13 5.63 29 4.51 39 4.76 Portugal 26 4.88 45 4.72 32 4.85 28 4.57 13 5.39 Israel 28 4.76 36 4.84 29 5.03 26 4.64 57 4.53 Slovakia 30 4.74 23 5.03 35 4.68 35 4.17 24 5.09 Slovenia 31 4.74 21 5.07 30 4.91 30 4.49 63 4.48 Czech Republic 32 4.70 33 4.94 31 4.86 34 4.18 38 4.84 Italy 33 4.70 30 4.97 38 4.58 25 4.68 54 4.57 Hungary 34 4.67 41 4.76 33 4.79 38 4.10 28 5.05 Lithuania 35 4.63 32 4.95 28 5.04 37 4.14 67 4.40 Greece 36 4.60 31 4.95 54 4.08 31 4.49 36 4.86 Turkey 38 4.53 8 5.40 47 4.28 44 3.79 50 4.64 Cyprus 39 4.50 49 4.51 44 4.37 32 4.41 41 4.72 Croatia 42 4.45 12 5.24 52 4.15 43 3.89 56 4.54 Latvia 43 4.45 48 4.55 40 4.54 39 4.08 51 4.61 Poland 45 4.35 42 4.73 37 4.62 46 3.70 73 4.35 Romania 57 4.04 61 4.25 61 4.02 49 3.64 81 4.24 Bulgaria 60 3.90 56 4.31 57 4.07 54 3.52 107 3.71 Armenia 61 3.90 43 4.73 87 3.28 77 3.00 53 4.59 Moldova 62 3.88 26 4.99 75 3.65 76 3.05 101 3.83 Ukraine 68 3.77 39 4.77 94 3.17 59 3.42 106 3.73 Kazakhstan 72 3.73 37 4.83 110 2.70 63 3.31 88 4.06 Albania 73 3.72 57 4.29 64 3.89 106 2.47 82 4.22 Azerbaijan 76 3.68 65 4.15 112 2.62 64 3.30 46 4.66 Macedonia, FYR 81 3.58 86 3.64 80 3.58 69 3.19 97 3.90
Bosnia & Herzegovina 89 3.47 97 3.29 72 3.68 86 2.91 90 3.98 Russian Federation 103 3.25 99 3.11 92 3.20 60 3.35 114 3.35 Tajikistan 104 3.13 83 3.74 117 2.40 117 2.02 69 4.38 Uzbekistan 105 3.06 114 2.46 116 2.43 84 2.94 65 4.43 Kyrgyzstan 109 3.03 102 2.95 104 2.84 88 2.88 113 3.44
Source: based on World Economic Forum (2008); countries shown in red italics are landlocked
67
ANNEX III. LIST OF PARTICIPANTS
PARTICIPANTS IN THE WORK OF THE EXPERT GROUP ON HINTERLAND CONNECTIONS OF SEAPORTS AND SPEAKERS AT THE UNECE PIRAEUS CONFERENCE
Mr. Saki ACIMAN Director General, CETMO, Barcelona, Spain
Mr. Michalis ADAMANTIADIS Chief of Section, UNECE, Geneva, Switzerland
Mr. Joan AMOROS Secretary General, FERRMED, Brussels, Belgium
Mr. Uwe BAKOSCH Executive Vice President, Network Management of Corridors, DB Schenker, Berlin, Germany
Mr. Gildas BRANELLEC Deputy Head of the Intermodality Unit, Transport Services Directorate, Ministry for Ecology, Energy and Sustainable Development, Paris, France
Dr. Mary R. BROOKS Professor, Dalhousie University, Halifax, Canada
Mr. Peter BRUGTS Senior Policy Advisor, Ministry of Transport, Public Works and Water Management, The Hague, Netherlands
Dr. Jaromir CEKOTA Economic Affairs Officer, UNECE, Geneva, Switzerland
Mr. David COCKROFT Secretary General, International Transport Workers’ Federation, London, United Kingdom
Mr. Ronald DAELMAN Freight Director, P&O Ferries, Dover, United Kingdom
Mr. Gerard DALTON Department Director, International Union of Railways (UIC), Paris, France
Mr. Arif DAVRAN Deputy Chairman, International Freight Forwarders Association Turkey (UTIKAD), Istanbul, Turkey
Mr. Julio DE LA CUEVA National Expert, European Commission, Brussels, Belgium
68
69
Dr. Peter DE LANGEN Economist, Corporate Development, Port of Rotterdam and Assistant Professor, Erasmus University Rotterdam, Rotterdam, Netherlands
Mr. Emre DINÇER Maritime Expert, Undersecretariat of Maritime Affairs, Prime Ministry, Ankara, Turkey
Mr. Hakan ERDOGAN Expert, Turkish State Railways, Ankara, Turkey
Mr. Vladimir ERYGIN Harbour Master, Maritime Port Administration, Novorossiysk, Russian Federation
Dr. Erik EVTIMOV Legal Advisor, Committee for International Rail Transport (CIT), Berne, Switzerland
Mr. Elmar FARAJOV Head of TRACEA & International Projects Unit, Ministry of Transport, Baku, Azerbaijan
Mr. John FAULKNER Head of International Networks, Department for Transport, London, United Kingdom
Prof. Georgios GIANNOPOULOS, Aristotle University, Thessaloniki, Greece
Antonio GÓNGORA Head, Department of Land Access Transport and Logistics, Spanish Ports System, Ministry of Public Works, Madrid, Spain
Dr. Hercules HARALAMBIDES Professor, Erasmus University Rotterdam, Rotterdam, Netherlands
Dr. Trevor HEAVER Professor Emeritus, Sauder School of Business, University of British Columbia, Vancouver, Canada
Mr. Jens HÜGEL Head - Sustainable Development, International Road Transport Union (IRU), Geneva, Switzerland
Mr. Roel JANSSENS Economic and Environmental Adviser, OSCE, Vienna, Austria
Mr. Ralph KELLERMANN Transport Counsellor, Permanent Mission of Germany, Geneva Switzerland
Mr. Yiannakis KOKKINOS General Manager, Cyprus Port Authority, Nicosia, Cyprus
69
Director, Hellenic Institute of Transport,
Mr. Yevgen KOZIY Executive Manager, Black Sea Economic Cooperation (BSEC), Istanbul, Turkey
Mr. Bert KRUK Lead Port Specialist, World Bank, Washington, D.C., United States
Mr. Martin MAGOLD Chief of Section, UNECE, Geneva, Switzerland
Mr. Graham MAPPLEBECK Head Facilitation Section, International Martitime Organization, London, United Kingdom
Ms. Lieselot MARINUS Policy Advisor, European Sea Ports Organization, Brussels, Belgium
Dr. Helmut MEELICH Project Manager, Trans European Railway (TER) project, Bratislava, Slovakia
Mr. Mario MELETIOU Technical Specialist (Ports and Transport), ILO, Geneva, Switzerland
Ms. Janina MENTRAK Director, Ministry of Infrastructure, Warsaw, Poland
Ms. Eva MOLNAR Director, Transport Division, UNECE, Geneva, Switzerland
Mr. Björn NECKMAN Head of Public Affairs, Ports of Stockholm and representative of the Baltic Sea Organization, Stockholm, Sweden
Mr. Ernest NOKA Deputy Minister, Ministry of Public Works, Transport and Telecommunications, Tirana, Albania
Mr. Robert NOWAK Economic Affairs Officer, UNECE, Geneva, Switzerland
Ms. Isabelle OBERSON Legal Advisor, Committee for International Rail Transport (CIT), Berne, Switzerland
Mr. Bogdan OLDAKOWSKI Secretary General, Baltic Ports Organization, Gdynia, Poland
Mr. Nick PANK Business Development Manager, P&O Ferries, Dover, United Kingdom
70
71
Mr. Anastassis PAPALIGOURAS Minister, Ministry of Mercantile Marine, The Aegean and Island Policy, Athens, Greece
Mr. Andreas PAPASTAMOU First Secretary, Trade and Economic Affairs, Permanent Mission of Greece to the United Nations Office and other International Organizations in Geneva, Geneva, Switzerland
Mr. Simo PASI Process Manager of Road Freight Statistics, European Commission, Eurostat, Luxembourg
Mr. Stephen PERKINS Director, Joint Transport Research Centre, International Transport Forum (ITF), Paris, France
Mr. Misha PESUT Economic Affairs Officer, UNECE, Geneva, Switzerland
Mr. Ioannis PROTOPAPAS Director of Ports and Ports Policy, Ministry of Mercantile Marine, The Aegean and Island Policy, Athens, Greece
Ms. Cristiana RACAUTANU Head of International Affairs, Maritime Port Administration, Constanta, Romania
Dr. Wlodzimierz RYDZKOWSKI Professor, University of Gdansk, Sopot, Poland
Mr. Nabil SAFWAT Chief of Transport Section, UNESCWA, Beirut, Lebanon
Ms. Goedele SANNEN Consultant, Strategy and Development, Port of Antwerp, Antwerp, Belgium
Mr. Ould Khou SID’AHMED Economic Affairs Officer, UNECE, Geneva, Switzerland
Mr. Gennadiy P. SKVORTSOV General Director of the Ilyichevsk Port and President of the Association of Black and Azov Sea Ports, Ilyichevsk, Ukraine
Mr. Peter SMEETS Senior Statistical Researcher, Statistics Netherlands, Heerlen, Netherlands
Mr. Bernard SNOY Co-ordinator of Economic and Environmental Activities, OSCE, Vienna, Austria
Mr. Dexing SONG Director, Ministry of Transport, Beijing, China
71
Mr. Bulent SÖNMEZ Maritime Expert, Undersecretariat for Maritime Affairs, Prime Ministry, Ankara, Turkey
Ms. Leila SUJETA Chief Specialist, Water Transport Infrastructure Division, Ministry of Transport and Communications, Vilnius, Lithuania
Mr. Ad J. TOET Director, Koninklijk Nederlands Vervoer, The Hague, Netherlands
Dr. Dimitrios TSAMBOULAS Professor, National Technical University of Athens, Athens, Greece
Dr. Eddy VAN DE VOORDE Professor, University of Antwerp, Antwerp, Belgium
Mr. Vincent VALENTINE Economic Affairs Officer, UNCTAD, Geneva, Switzerland
Mr. Kurt VAN DENDER Chief Economist, Joint Transport Research Centre, International Transport Forum (ITF), Paris, France
Mr. Michel VIARDOT Expert - Intermodal Transport and Logistics, Transport Services Directorate, Ministry for Ecology, Energy and Sustainable Development, Paris, France
Mr. Georgios VLACHOS General Secretary, Ministry of Mercantile Marine, The Aegean and Island Policy, Athens, Greece
Dr. Tengfei WANG Economic Affairs Officer, UNESCAP, Bangkok, Thailand
Mr. James WILTSHIRE Lead Economist, International Networks, Department for Transport, London, United Kingdom
Dr. Allan WOODBURN Senior Lecturer, University of Westminster, London, United Kingdom
Mr. Jinkun WU President, Ningbo Port Limited Company, Ningbo, China
Ms. Anna WYPICH-NAMIOTKO Vice Minister, Ministry of Infrastructure, Warsaw, Poland
Mr. Zuyuan XU Vice Minister, Ministry of Transport, Beijing, China
72

73
Ms. Sevinc YAMAN EU Expert on Transport and TEN-T Policies, Secretariat General for EU Affairs, Ankara, Turkey
Mr. Emir Salim YÜKSEL First Secretary, Permanent Mission of Turkey to the United Nations Office and other International Organizations in Geneva, Geneva, Switzerland
Mr. Rolf ZIMMERMANN Deputy Head of Section, Federal Transport Office, Berne, Switzerland
73