
HINO MOTORS, LTD. ANNUAL REPORT 1999 · earnings recovery. The merger of Hino Motors with Hino...
32
HINO MOTORS, LTD. ANNUAL REPORT 1999 For The Year Ended March 31, 1999
Transcript of HINO MOTORS, LTD. ANNUAL REPORT 1999 · earnings recovery. The merger of Hino Motors with Hino...

HINO MOTORS, LTD. ANNUAL REPORT 1999For The Year Ended March 31, 1999
䜀匀
This pdf annual report originates from the AR-DDS section of the www.gcis.com web site operated by General Solutions, Inc.
CONTENTS
Message from the Management .......................................2Our Basic Approach .........................................................4Review of Operations .......................................................8Diesel Trucks for the Domestic Market .........................9Diesel Buses for the Domestic Market .........................10Commissioned Vehicles ...............................................11Other Divisions ............................................................12Overseas Markets .........................................................12
Financial Section............................................................14Directors and Auditors ...................................................26Hino Motors International Network ...............................27Corporate Data ...............................................................28
With a focus on medium- and heavy-duty diesel trucks, Hino Motors, Ltd. develops andmanufactures diesel trucks, buses and industrial diesel engines. The Company has held thetop position in the domestic market for medium- and heavy-duty diesel trucks* for 26 con-secutive years. During the fiscal year under review, Hino Motors made a full-scale entry intothe light-duty truck* market with the release of a new 2-ton payload truck developed jointlywith Toyota Motor Corporation.
On October 1, 1999, Hino Motors will merge with Hino Motors Sales, Ltd., the Company’sdomestic sales affiliate.
*Light-duty trucks have payloads from 2.0 to less than 4.0 tons; medium-duty trucks have payloads from 4.0 to less than 5.0 tons; heavy-duty trucks have
payloads of 5.0 tons and over.
PROFILE
CONTENTS
Consolidated Financial Highlights ...................................1Message from the Management .......................................2Entering the Light-Duty Truck Market ............................4Review of Operations .......................................................6Diesel Trucks for the Domestic Market .........................6Diesel Buses for the Domestic Market ...........................8Commissioned Vehicles .................................................8Other Divisions ..............................................................8Overseas Markets .........................................................10
Developing Environmentally Friendly Products ............12Financial Section............................................................14Directors and Auditors/Executive Officers .....................26Hino Motors International Network ...............................27Corporate Data ...............................................................28Preparations for the Year 2000 Issue ..............................29

1
Thousands ofMillions of Yen U.S. Dollars
1998 1999 1999
Net sales ............................................................................................ ¥589,209¥432,284 $3,585,933Income (loss) before income taxes .................................................... 001,502 (34,870) (289,259)Net income (loss) .............................................................................. 031,649 (36,659) (304,100)Property, plant and equipment—net ..................................................0186,356 190,859 1,583,234Total assets ........................................................................................0421,363 392,601 3,256,745Shareholders’ equity ..........................................................................0142,452 104,056 863,1740863,174........................................................................................................................................................................ Yen U.S. Dollars
Per share amounts:Net income .................................................................................... ¥4.55¥(101.16) $(0.84)Cash dividends .............................................................................. 6.00 — —
Note 1: U.S. dollar amounts here and elsewhere in this Annual Report are translated, for convenience only, at the rate of ¥120.55=$1.Note 2: The years stated in the text are fiscal years which run from April 1 of the previous year through March 31 of the following year.Note 3: Net income per share is computed based on the weighted average number of shares of common stock outstanding during each year.Note 4: Cash dividends per share represents the cash dividends declared as applicable to the respective year.
CONSOLIDATED FINANCIAL HIGHLIGHTSYEARS ENDED OR AS OF MARCH 31, 1998 AND 1999
Net Sales(millions of yen)
Net Income (Loss)(millions of yen)
Total Assets(millions of yen)
’95 ’96 ’97 ’98 ’99’95 ’96 ’97 ’98 ’99
650,
832
596,
791
632,
716
589,
209
432,
284
401,
766
397,
789
398,
959
421,
363
392,
601
’95 ’96 ’97 ’98 ’99
5,44
1
10,7
36
7,23
7
1,64
9
(36,
659)

2
MESSAGE FROM THE MANAGEMENT
Toshimi Onishi, Chairman of the Board (left) andHiroshi Yuasa, President
In fiscal year 1999, ended March 31, 1999, domesticdemand for medium- and heavy-duty trucks declinedto a level last recorded in the mid-1960s. In Asian mar-kets, our largest overseas demand source, the effects ofeconomic turmoil arising from the currency crisis in theregion continued, and truck demand weakened further.With severe pressure on the two main engines of de-mand supporting our operations, corporate performancedeteriorated. Net sales recorded a year-on-year decline,and management regrets to announce the first net losssince Hino Motors was listed on the Tokyo Stock Ex-change in 1949.
RESULTSIn the fiscal year under review, consolidated net salesdeclined 26.6% to ¥432,284 million. Hino Motorsadopted such unprecedented countermeasures as tem-porarily halting portions of our medium- and heavy-duty truck operations, and took resolute steps to reducemanufacturing costs and strengthen earnings power.However, these efforts were unable to offset the adverseimpact of the sharp decline in sales, and Hino Motorsrecorded an operating loss of ¥37,593 million, comparedwith operating income of ¥710 million in the previousfiscal year, and a net loss of ¥36,659 million, comparedwith net income of ¥1,649 million a year earlier. Dur-ing the fiscal year, the number of consolidated subsid-iaries increased by three to a total of 10, of which sixposted profits and four reported losses. At the same time,the number of affiliated companies accounted for bythe equity method rose by two for a total of 19, of whichfive recorded profits and 14 posted losses.
In view of these results, management suspended cashdividends for the year. As we make concerted efforts torealize a rapid earnings recovery and resume dividendpayments, we ask for the support of our shareholders.
MARKETS AND PERFORMANCEOperating conditions in the domestic automobile indus-try remained depressed by the protracted downturn in
the Japanese economy, and extremely weak demand pre-vailed in Asian countries affected by the economic cri-sis in the region. The only positive sign was a firmincrease in demand in the North American and Euro-pean markets.
In recent years, the domestic market for our coremedium- and heavy-duty trucks has been affected by anunprecedented slump in demand. Despite governmentmeasures to stimulate the domestic economy, the futureeconomic outlook remains uncertain. Weak demand forconstruction and cargo trucks led to a decline in thedomestic truck market from approximately 112,000 unitsin the previous term to 81,000 units, the lowest levelsince the market first exceeded 100,000 units in 1967.
In response to intense competition resulting from themarket contraction, Hino Motors expanded its lineup ofmedium- and heavy-duty trucks and bolstered market-ing capabilities. In developing new products, we arefocused on the key issues of environmental conserva-tion, economy and safety. Since it is no longer possiblefor a company to differentiate its trucks on the basis
Strategic Focus in a HarshBusiness Environment

3
of load-carrying function alone, Hino Motors has con-tinuously introduced products backed by leading-edge de-velopment concepts. For example, in 1995 we adoptedthe world’s first common rail, electronically controlled,high-pressure fuel injection system for our RISINGRANGER series of medium-duty trucks, and extendedits application to heavy-duty trucks during fiscal year1999. Through such achievements, we were able to main-tain a 28.8% share of the domestic medium- and heavy-duty truck market, marking our 26th consecutive year asthe market leader based on the number of medium- andheavy-duty truck registrations in Japan.
During the fiscal year under review, the domestic die-sel bus market also remained in a downturn. Total de-mand declined from 11,500 units in the previous term to10,200 units. In response, we aimed to stimulate demandby launching new medium- and small buses and by add-ing a low-floor bus to our lineup of large city buses. Theseefforts helped maintain a 22.0% share of the domesticmarket, a level comparable with previous years.
Overseas, demand collapsed in Southeast Asia, ourprincipal export market, and our total export volumeplunged to approximately half the level of the previousterm. Such harsh business conditions were unprec-edented, and we took urgent steps to restructure and re-inforce our operating base in several Asian countrieswhile stepping up marketing activities in the Americas,where sales have generally been robust.
In commissioned production for Toyota MotorCorporation, production of the T100 pickup truck wastransferred to Toyota’s new plant in the United States,and commissioned production of the 4Runner (HiluxSurf in Japan) declined in volume. As a result, unit pro-duction fell 7.4% from the previous term.
OUTLOOK AND STRATEGYWe do not expect the operating environment in the cur-rent and future fiscal years to deteriorate much furthercompared with the fiscal year under review. However,we do not foresee an imminent recovery in either thedomestic medium- and heavy-duty truck market or inexport demand to Southeast Asia.
Consequently, our current mission is to generate thebest possible performance under adverse conditions, and
we will strive to build a sound earnings structure able togenerate profits—even in an operating environment asinhospitable as the fiscal year under review. Our goalsare to maintain the top position we have held for thepast 26 years in the medium- and heavy-duty truck mar-ket, and to expand efforts in bus operations.
To create a new source of rapid growth as an inte-grated manufacturer of trucks and buses, Hino Motorsmade a full-fledged entry into the light-duty truck mar-ket in May 1999 with the domestic launch of the 2-tonpayload truck DUTRO, jointly developed with Toyota.Our aim is to raise our share of this market from 3.1%in fiscal 1999, to 10% as rapidly as possible to cultivatethis business into one of the forces that will drive ourearnings recovery.
The merger of Hino Motors with Hino Motor Sales,Ltd., our domestic sales affiliate, effective October 1,1999, was approved at the Company’s general share-holders’ meeting on June 24, 1999. The objective of themerger is to combine the management resources of bothcompanies to enhance competitiveness. As this will in-crease our ability to rapidly develop, manufacture andmarket vehicles that respond to customer demand bystaying in close touch with market trends, we believe itis the best strategy to respond to the difficult corporateenvironment faced in fiscal year 1999.
A new executive officer system was also approved atthe general shareholders’ meeting. This system is de-signed to accelerate the decision-making process, en-sure an appropriate number of directors and strengthenstrategic execution.
We ask for the continued support of our shareholdersas we rebuild profitability for future growth and valuecreation.
Toshimi Onishi, Chairman of the Board
Hiroshi Yuasa, President

4
ENTERING THE LIGHT-DUTY TRUCK MARKET
1 23
The DUTRO features a stylish design with a flash surface for im-proved aerodynamics.
A spectacular debut at the May 20, 1999 launching ceremony
The DUTRO is an ideal light-duty truck offered by Hino Motors.

5
HINO MOTORS leaps ontoa new stage —light-duty trucks.In May 1999, Hino Motors introduced thenew light-duty truck DUTRO, marking theCompany’s full-fledged entry into the light-
duty truck market. The new truck completes our fulllineup of heavy-, medium- and light-duty trucks, af-firming Hino Motors’ reputation as a comprehensivetruck manufacturer.
The new light-duty truck, jointly developed withToyota, crystallizes the strong product developmentcapabilities and technologies of both companies.Based on data from detailed market surveys, devel-opment started by taking into account the distribu-tion trends and features that would benefit customersmost. As a result, we created an ideal light-duty truckto satisfy future distribution needs while featuringeasy operation.
DUTRO is an entirely new concept light-duty truckthat embodies the full meaning of economy. Improve-ments include higher overall vehicle endurance
through the employment of a stiff frame andhighly durable suspension, enhanced fuel andpayload efficiency and diverse engine variet-ies. As a high-value-added product,DUTRO is expected to receivepositive market valuation anddevelop into a mainstayvehicle for Hino Motors.
Total Domestic Demand forLight-Duty Trucks (thousand units)
’95 ’96 ’97 ’98 ’99
172
172 18
6
146
111
2
3
REVIEW OF OPERATIONS
6
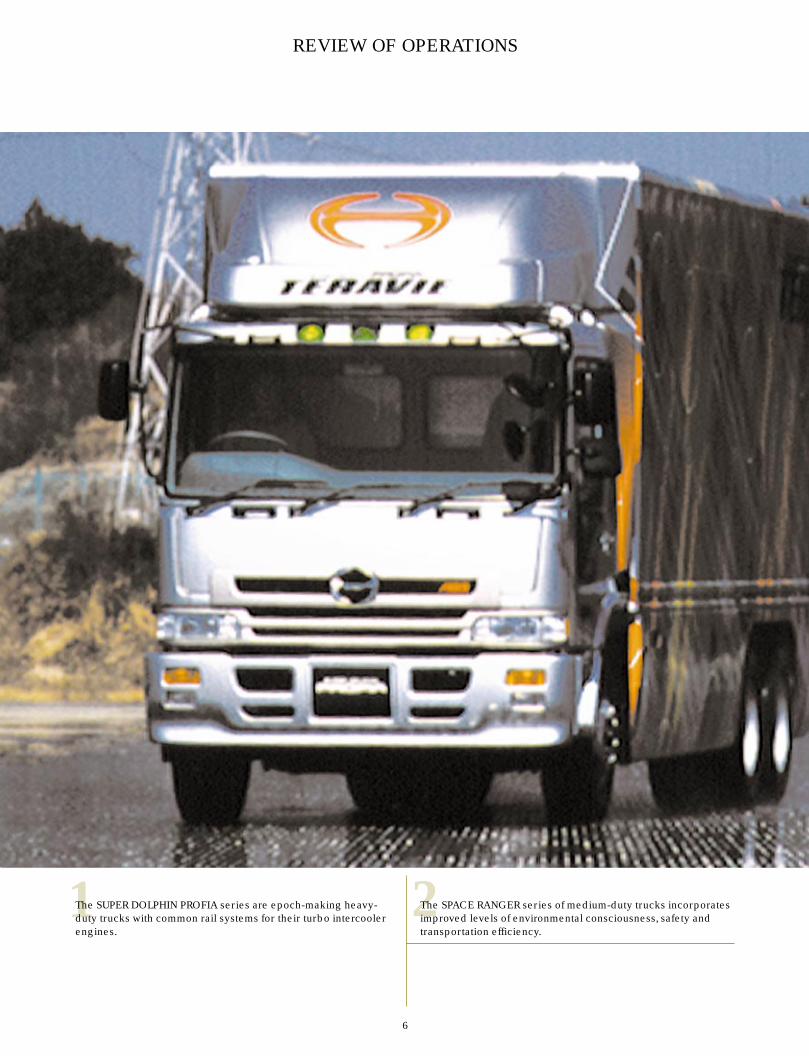
1 2The SUPER DOLPHIN PROFIA series are epoch-making heavy-duty trucks with common rail systems for their turbo intercoolerengines.
The SPACE RANGER series of medium-duty trucks incorporatesimproved levels of environmental consciousness, safety andtransportation efficiency.

DIESEL TRUCKS FOR
THE DOMESTIC MARKETDomestic sales of medium- and heavy-duty trucks, HinoMotors’ main product category, recorded a decline ex-ceeding that of the previous term amid a downturn indomestic demand unprecedented in recent years.
During the fiscal year under review, overall demandfor medium- and heavy-duty trucks fell sharply belowexpectations to 81,000 units, a 27.0% drop from the pre-vious term to a level last seen in the mid-1960s. Despitesuch measures by the Japanese government to stimulatethe economy as front-loading of public investment, con-sumer spending, private capital investment and buildingand housing starts continued to decline. As a result, de-mand fell significantly for construction and cargo trucks.
Owing to this steep decline in overall demand, vol-ume in the segment decreased 56.3% to 19,073 units, withsales down 54.0% to ¥84,597 million.
Despite the sharp decrease of both units and sales,Hino Motors made strong efforts to spur sales throughproduct development. In May 1998, we completely re-newed our SUPER DOLPHIN PROFIA series of heavy-duty trucks by releasing new models developed with theenvironment and economic efficiency as primary con-cerns. These new models are the world’s first heavy-dutytrucks with common rail,electronically controlled,high-pressure fuel injec-tion systems for in-line sixcylinder turbo intercoolerengines, raising fuel effi-ciency while reducing ex-haust emissions, noise andvibration.
To improve the transportation efficiency of heavy-dutytrucks, we launched the Short-Cab series in August 1998,featuring Japan’s first cargo hold with an internal loadingspace of more than 10 meters. This series symbolizes ourdevelopment philosophy of integrating transportation ef-ficiency, as well as low fuel consumption and safety.
In the medium-duty class, we launched the newSPACE RANGER series in March 1999, which was aheadof competitors in meeting 1998 Japanese emission stan-dards. With an attractive new style, the SPACE RANGERseries provides new levels of comfort, convenience, trans-portation efficiency, safety and environmental friendli-ness.
Hino Motors maintained its strong market presenceas number one in the industry for the 26th consecutiveyear with a 28.8% share of the domestic market for me-dium- and heavy-duty trucks. We attribute this continuedsuccess to the overall strength of our product lineup andconcerted efforts to strengthen sales capabilities.
Marking further progress in the joint development oflight-duty trucks with Toyota Motor Corporation, in May1999 we made a full-fledged entry into the light-duty truckmarket by launching the 2-ton payload truck DUTRO. In
the fiscal year under re-view, Hino Motors held a3.1% share of the domes-tic light-duty truck market.With the launch of the newDUTRO, our goal is toquickly raise our marketshare to 10%.
Total Domestic Demand forMedium- and Heavy-Duty Trucks (thousand units)
’95 ’96 ’97 ’98 ’99
153
148
149
112
81
Hino Motors’ Sales of Trucks in the Domestic Market (units)
’95 ’96 ’97 ’98 ’99
46,2
85
48,0
38
47,8
89
43,6
73
19,0
73
7
2
HINO MOTORS leads the market inintroducing new products one step ahead
of the competition.

88
2Hino Motors’ low-floor buses allow easy access for all passen-gers and incorporate the latest environmental measures.1The MELPHA 9 is our latest medium-sized bus. Complete design
changes in this year’s model improve safety and reduce emis-sions and noise.

9
Total Domestic Demand forBuses (thousand units)
’95 ’96 ’97 ’98 ’99
13.0
12.8
12.9
11.5
10.2
DIESEL BUSES FOR THE DOMESTIC
MARKET
The domestic market for diesel buses also shrank as a
result of the recession, with total demand down 11.3%
to 10,200 units. Although this decrease in demand was
not as pronounced as that of medium- and heavy-duty
trucks, it represented a level of demand for diesel buses
comparable with the mid-1970s. In the fiscal year under
review, sales volume of diesel buses slid 16.9% to 2,276
units, and sales fell 12.6% to ¥25,405 million.
To increase sales and strengthen its product lineup,
Hino Motors introduced new medium-sized and small
buses to the market. In June 1998, we launched the wide-
body, small-sized bus MELPHA 7 and in March 1999,
the MELPHA 9 medium-sized bus. Each of the new
models is a leader in its class for providing interior width
and height, and have seats as comfortable as those found
in large tour buses. The MELPHA 7 won a 1998 Good
Design Award from the Japan Industrial Design Promo-
tion Organization for the fiscal year under review, and
the MELPHA 9 met stringent 1998 Japanese standards
for both emissions and noise.
In October 1998, the Company added a low-floor
bus to its BLUE RIBBON series of large city buses.
This model not only realizes the goal of normalizing
9
Hino Motors’ Sales of Busesin the Domestic Market (units)
’95 ’96 ’97 ’98 ’99
2,81
4
2,59
6
2,82
3
2,73
9
2,27
6
transportation for the physically impaired by allowing
easy access and comfort for all passengers, but it also
incorporates the latest advances in environmental pro-
tection, safety and easy maintenance.
COMMISSIONED VEHICLES
Hino Motors produces vehicles on commission for
Toyota Motor Corporation. A strong marketing effort
through Toyota’s sales network resulted in healthy
growth in sales of commissioned vehicles in the Middle
East and Australia. However, Toyota shifted production
of its T100 pickup for the North American market to a
new plant in the United States, and commissioned pro-
duction of 4Runner (Hilux Surf) sports utility vehicles
declined. As a result, production of commissioned ve-
hicles decreased 7.4% to 229,687 units. Sales in this
category, including sales of parts, declined 4.7% to
¥210,383 million.
OTHER DIVISIONS
Directly affected by a drop in private capital investment,
domestic sales of industrial diesel engines fell 37.5% in
volume to 5,866 units and 35.3% in value to ¥4,298 mil-
lion. Domestic sales of parts dropped 14.3% to ¥27,055
million, with overall sales of other divisions down 15.2%
to ¥52,686 million.
2
10
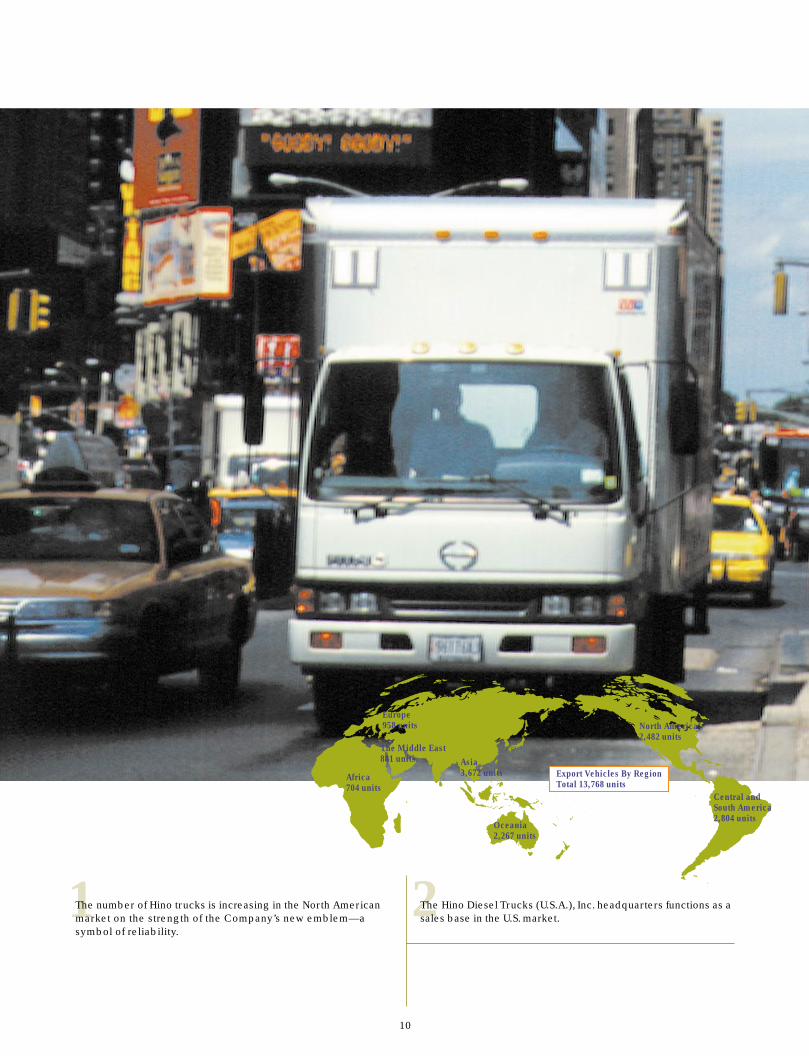
1 2The number of Hino trucks is increasing in the North Americanmarket on the strength of the Company’s new emblem—asymbol of reliability.
The Hino Diesel Trucks (U.S.A.), Inc. headquarters functions as asales base in the U.S. market.
Europe958 units
Africa704 units
The Middle East881 units
North America2,482 units
Central andSouth America2,804 units
Oceania2,267 units
Asia3,672 units Export Vehicles By Region
Total 13,768 units
11
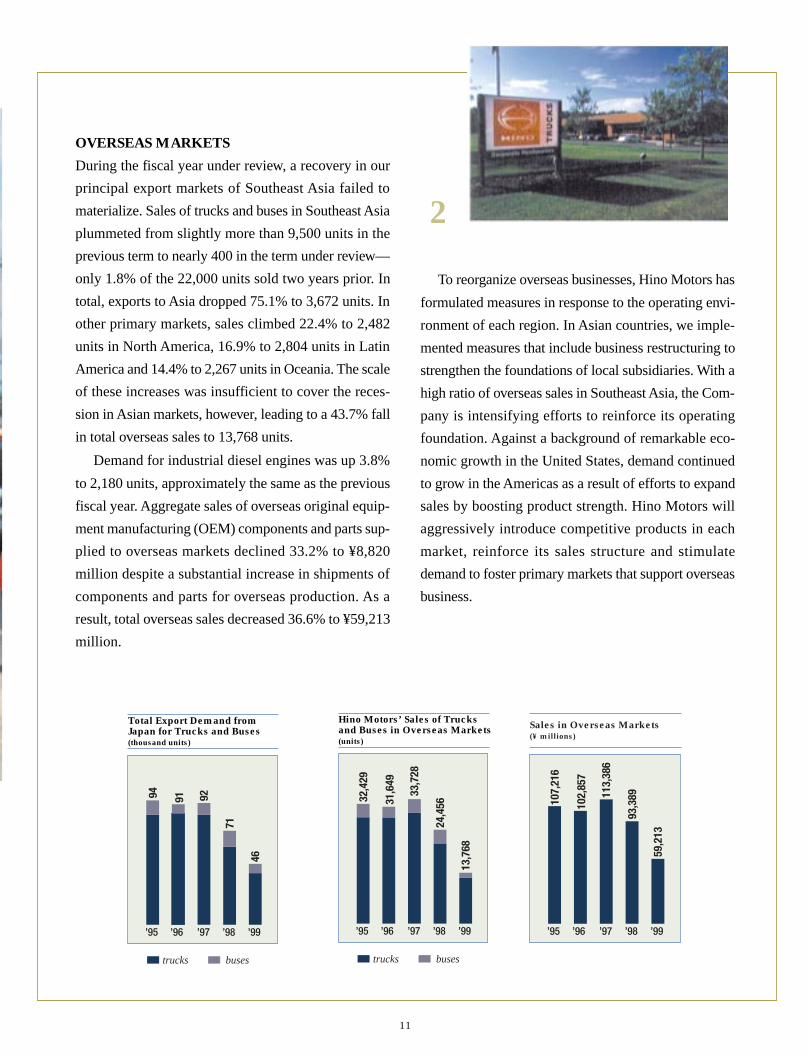
OVERSEAS MARKETS
During the fiscal year under review, a recovery in our
principal export markets of Southeast Asia failed to
materialize. Sales of trucks and buses in Southeast Asia
plummeted from slightly more than 9,500 units in the
previous term to nearly 400 in the term under review—
only 1.8% of the 22,000 units sold two years prior. In
total, exports to Asia dropped 75.1% to 3,672 units. In
other primary markets, sales climbed 22.4% to 2,482
units in North America, 16.9% to 2,804 units in Latin
America and 14.4% to 2,267 units in Oceania. The scale
of these increases was insufficient to cover the reces-
sion in Asian markets, however, leading to a 43.7% fall
in total overseas sales to 13,768 units.
Demand for industrial diesel engines was up 3.8%
to 2,180 units, approximately the same as the previous
fiscal year. Aggregate sales of overseas original equip-
ment manufacturing (OEM) components and parts sup-
plied to overseas markets declined 33.2% to ¥8,820
million despite a substantial increase in shipments of
components and parts for overseas production. As a
result, total overseas sales decreased 36.6% to ¥59,213
million.
Hino Motors’ Sales of Trucks and Buses in Overseas Markets(units)
’95 ’96 ’97 ’98 ’99
32,4
29
31,6
49
33,7
28
24,4
56
13,7
68
trucks buses
Total Export Demand fromJapan for Trucks and Buses(thousand units)
’95 ’96 ’97 ’98 ’99
94 91 92
71
46
trucks buses
Sales in Overseas Markets(¥ millions)
’95 ’96 ’97 ’98 ’99
107,
216
102,
857
113,
386
93,3
89
59,2
13
To reorganize overseas businesses, Hino Motors has
formulated measures in response to the operating envi-
ronment of each region. In Asian countries, we imple-
mented measures that include business restructuring to
strengthen the foundations of local subsidiaries. With a
high ratio of overseas sales in Southeast Asia, the Com-
pany is intensifying efforts to reinforce its operating
foundation. Against a background of remarkable eco-
nomic growth in the United States, demand continued
to grow in the Americas as a result of efforts to expand
sales by boosting product strength. Hino Motors will
aggressively introduce competitive products in each
market, reinforce its sales structure and stimulate
demand to foster primary markets that support overseas
business.
2

12
DEVELOPING ENVIRONMENTALLY FRIENDLY PRODUCTS
1 23
A Hino truck drives through Capilano Canyon in Canada. TheCompany places a high priority on harmony with nature.
The HIMR diesel/electric hybrid bus provides environmentallyfriendly transportation in Chubu Mountains National Park, Japan.
Hino Motors played a pioneering role in the employment ofcommon rail systems, now found in engines around the world.

13
HINO MOTORS developsleading technologies
to preserve the environment.
2
As a manufacturer of diesel trucks and buses, Hino
Motors develops technology and products for future
markets and works to upgrade the quality of its product
lineup. The Company places the highest priority on har-
mony with the environment in product development.
Ten years have passed since the announcement of
the hybrid inverter-controlled motor and retarder
(HIMR) system, recognized for its superior environmen-
tal attributes for vehicles operating in large cities. With
the development of a high-power engine, introduction
of the system is foreseen in vehicles for sightseeing at
national parks in mountainous regions, city buses and
delivery trucks in urban districts.
Hino Motors pioneered the use of common rail, elec-
tronically controlled, high-pressure fuel injection sys-
tems in engines for medium-duty trucks in 1995. The
systems dramatically improve fuel efficiency, leading
to reductions in fuel costs, engine noise and exhaust
emissions. Hino Motors promptly applies such advanced
technologies to improve product quality, a prime
example of the Company’s efforts to coexist with the
environment and receive high market appraisal.
While promoting vehicles with engines that employ
common rail systems, Hino Motors will step up efforts
to develop engines that use such alternative fuels as natu-
ral gas and methanol in addition to the HIMR system.
Electronic Control Unit
Common RailConsolidates and accumulateshigh-pressure fuel for all cylinders
InjectorInjects an optimalfuel quantity withperfect timing byopening and closingthe electromagneticvalves
Fuel PumpCreates high-pressure fuel
3
14
FINANCIAL SECTION
MANAGEMENT’S DISCUSSION AND ANALYSIS
SCOPE OF CONSOLIDATION AND EQUITY
METHOD
In accordance with generally accepted accounting prin-
ciples in Japan, the consolidated financial statements in-
clude the accounts of Hino Motors, Ltd. and 10
consolidated subsidiaries, compared with seven subsid-
iaries during the previous term. In addition, 19 affili-
ated companies were accounted for using the equity
method, compared with 17 companies during the previ-
ous term.
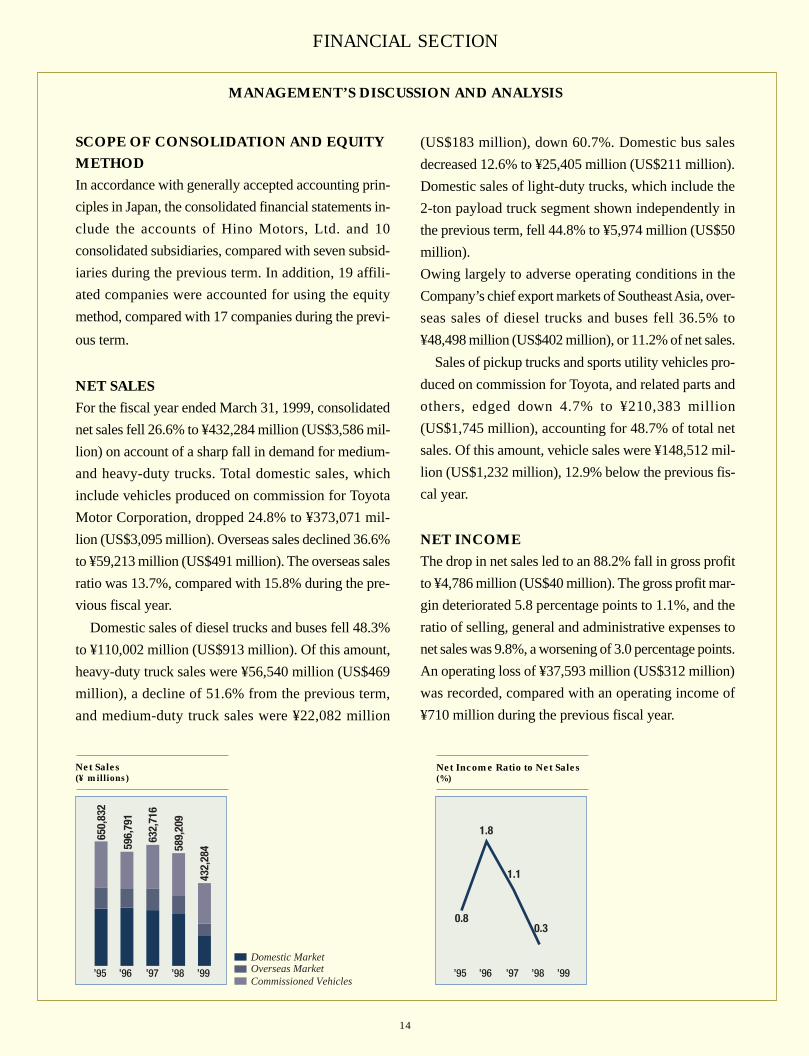
NET SALES
For the fiscal year ended March 31, 1999, consolidated
net sales fell 26.6% to ¥432,284 million (US$3,586 mil-
lion) on account of a sharp fall in demand for medium-
and heavy-duty trucks. Total domestic sales, which
include vehicles produced on commission for Toyota
Motor Corporation, dropped 24.8% to ¥373,071 mil-
lion (US$3,095 million). Overseas sales declined 36.6%
to ¥59,213 million (US$491 million). The overseas sales
ratio was 13.7%, compared with 15.8% during the pre-
vious fiscal year.
Domestic sales of diesel trucks and buses fell 48.3%
to ¥110,002 million (US$913 million). Of this amount,
heavy-duty truck sales were ¥56,540 million (US$469
million), a decline of 51.6% from the previous term,
and medium-duty truck sales were ¥22,082 million
(US$183 million), down 60.7%. Domestic bus sales
decreased 12.6% to ¥25,405 million (US$211 million).
Domestic sales of light-duty trucks, which include the
2-ton payload truck segment shown independently in
the previous term, fell 44.8% to ¥5,974 million (US$50
million).
Owing largely to adverse operating conditions in the
Company’s chief export markets of Southeast Asia, over-
seas sales of diesel trucks and buses fell 36.5% to
¥48,498 million (US$402 million), or 11.2% of net sales.
Sales of pickup trucks and sports utility vehicles pro-
duced on commission for Toyota, and related parts and
others, edged down 4.7% to ¥210,383 million
(US$1,745 million), accounting for 48.7% of total net
sales. Of this amount, vehicle sales were ¥148,512 mil-
lion (US$1,232 million), 12.9% below the previous fis-
cal year.
NET INCOME
The drop in net sales led to an 88.2% fall in gross profit
to ¥4,786 million (US$40 million). The gross profit mar-
gin deteriorated 5.8 percentage points to 1.1%, and the
ratio of selling, general and administrative expenses to
net sales was 9.8%, a worsening of 3.0 percentage points.
An operating loss of ¥37,593 million (US$312 million)
was recorded, compared with an operating income of
¥710 million during the previous fiscal year.
Net Sales(¥ millions)
’95 ’96 ’97 ’98 ’99
650,
832
596,
791
632,
716
589,
209
432,
284
Domestic MarketOverseas MarketCommissioned Vehicles
Net Income Ratio to Net Sales(%)
’95 ’96 ’97 ’98 ’99
0.8
1.8
1.1
0.3

15
Interest expenses net of interest and dividend income
was ¥1,370 million (US$11 million), compared with ¥37
million a year earlier. However, with other income, net
of ¥8,088 million (US$67 million), the Company re-
corded other income, net of other expenses, of ¥2,723
million (US$23 million), compared with ¥792 million
in the previous term.
The above factors resulted in loss before income taxes
of ¥34,870 million (US$289 million), compared with
income before income taxes of ¥1,502 million a year
earlier. A net loss of ¥36,659 million (US$304 million)
was recorded, compared with net income of ¥1,649 mil-
lion in the previous term. Net loss per share was ¥101.16
(US$0.84). Cash dividends were suspended.
CASH FLOWS AND FINANCIAL POSITION
Net cash provided by operating activities was ¥9,666
million (US$80 million), compared with net cash used
in operating activities of ¥4,914 million during the
previous term. Although the total of net loss and notes
and accounts payable was ¥70,535 million (US$585
million), this was offset by other factors, especially
depreciation and amortization and notes and accounts
receivable, which totaled ¥80,112 million (US$665
million).
Net cash used in investing activities was ¥29,485
million (US$245 million), down 31.5% from the
previous term. The largest reason behind this decline
was a substantial decrease in use of cash of addition to
property, plant and equipment to ¥36,038 million
(US$299 million).
Net cash provided by financing activities was ¥44,630
million (US$370 million), up 4.9% from the previous
term. The largest source of cash in this category was
proceeds from long-term debt of ¥51,159 million
(US$424 million), followed by a net increase in short-
term loans of ¥8,633 million (US$72 million).
In aggregate, cash and cash equivalents at end of year
increased ¥24,811 million to ¥61,084 million (US$507
million).
Interest-bearing debt (short-term bank loans, the cur-
rent portion of long-term debt and long-term debt) in-
creased ¥48,758 million to ¥173,911 million (US$1,443
million). Long-term debt increased ¥5,634 million to
¥79,564 million (US$660 million), including bond is-
suances of ¥10,000 million (US$83 million) and ¥20,000
million (US$166 million) at 2.0% and 2.5%, respec-
tively. The current portion of long-term debt increased
¥31,624 million to ¥45,030 million (US$374 million).
Total assets decreased ¥28,762 million to ¥392,601
million (US$3,257 million). The equity ratio was 26.5%,
compared with 33.8% a year earlier.
Interest-Bearing Debt(¥ millions)
’95 ’96 ’97 ’98 ’99
100,
956
102,
498
80,3
07
125,
153 17
3,91
1
Shareholders’ Equity Ratio(%)
’95 ’96 ’97 ’98 ’99
32.5
35.0 35.5 33.8
26.5
16
Thousands ofU.S. Dollars
Millions of Yen (Note 1)
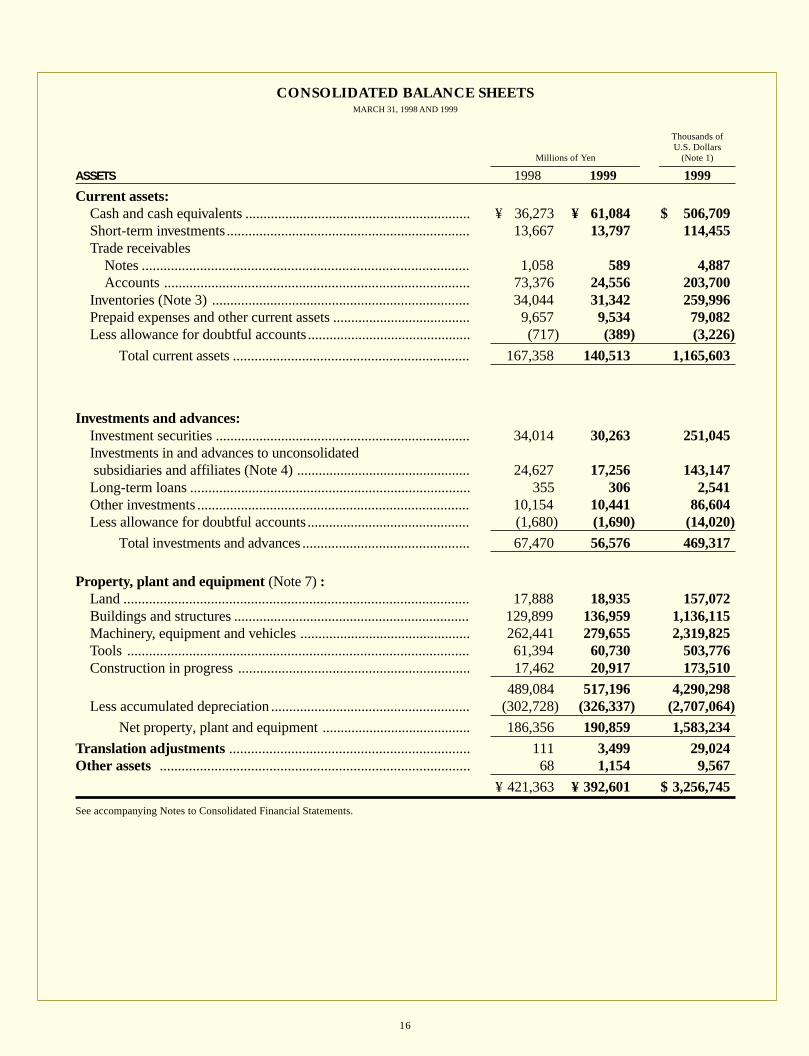
ASSETS 1998 1999 1999
Current assets:Cash and cash equivalents .............................................................. ¥(036,273 ¥(061,084 $(0,506,709Short-term investments................................................................... 13,66713,797 114,455Trade receivables
Notes .......................................................................................... 1,058 589 4,887Accounts .................................................................................... 73,37624,556 203,700
Inventories (Note 3) ....................................................................... 34,04431,342 259,996Prepaid expenses and other current assets ...................................... 9,6579,534 79,082Less allowance for doubtful accounts............................................. (717) (389) (3,226)
Total current assets................................................................. 167,358140,513 1,165,603
Investments and advances:Investment securities ...................................................................... 34,01430,263 251,045Investments in and advances to unconsolidatedsubsidiaries and affiliates (Note 4) ................................................ 24,62717,256 143,147Long-term loans ............................................................................. 355 306 2,541Other investments ........................................................................... 10,15410,441 86,604Less allowance for doubtful accounts............................................. (1,680)(1,690) (14,020)
Total investments and advances.............................................. 67,470 56,576 469,317
Property, plant and equipment (Note 7) :Land ............................................................................................... 17,88818,935 157,072Buildings and structures ................................................................. 129,899136,959 1,136,115Machinery, equipment and vehicles ............................................... 262,441279,655 2,319,825Tools .............................................................................................. 61,39460,730 503,776Construction in progress ................................................................ 17,46220,917 173,510
...........................................................................................................489,084 517,196 4,290,298Less accumulated depreciation ....................................................... (302,728)(326,337) (2,707,064)
Net property, plant and equipment ......................................... 186,356190,859 1,583,234Translation adjustments .................................................................. 111 3,499 29,024Other assets ..................................................................................... 68 1,154 9,567
...........................................................................................................¥(421,363 ¥(392,601 $(3,256,745
See accompanying Notes to Consolidated Financial Statements.
CONSOLIDATED BALANCE SHEETSMARCH 31, 1998 AND 1999

17
Thousands ofU.S. Dollars
Millions of Yen (Note 1)
LIABILITIES AND SHAREHOLDERS’ EQUITY 1998 1999 1999
Current liabilities:Short-term bank loans (Note 5) ...................................................... ¥037,817 ¥ 49,317 $ 409,097Current portion of long-term debt (Note 5) .................................... 13,40645,030 373,535Trade payables
Notes .......................................................................................... 5,6663,141 26,056Accounts .................................................................................... 91,95260,983 505,872
Accrued income taxes (Note 9) ...................................................... 433 550 4,562Accrued expenses ........................................................................... 11,5749,569 79,382Other current liabilities................................................................... 28,23223,767 197,158
Total current liabilities............................................................ 189,080192,357 1,595,662
Long-term liabilities:Long-term debt (Note 5) ................................................................ 73,93079,564 660,010Accrued severance indemnities (Note 6) ........................................ 15,52315,426 127,959Other .............................................................................................. 24 31 260
Total long-term liabilities ....................................................... 89,477 95,021 788,229Minority interests in consolidated subsidiaries............................. 354 1,167 9,680
Shareholders’ equity:Common stock, par value ¥50 per shareAuthorized—1,000,000,000 sharesIssued—362,391,898 shares in 1998 and 1999 ............................. 26,41226,412 219,099Additional paid-in capital ............................................................... 17,78717,787 147,546Retained earnings (Note 11) ........................................................... 98,25459,858 496,537Less
Treasury common stock, at cost:1,770 shares in 1998 and 2,010 shares in 1999 .......................... (1) (1) (8)
Total shareholders’ equity....................................................... 142,452104,056 863,174...........................................................................................................¥421,363 ¥392,601 $3,256,745
18
Thousands ofU.S. Dollars
Millions of Yen (Note 1)
1998 1999 1999
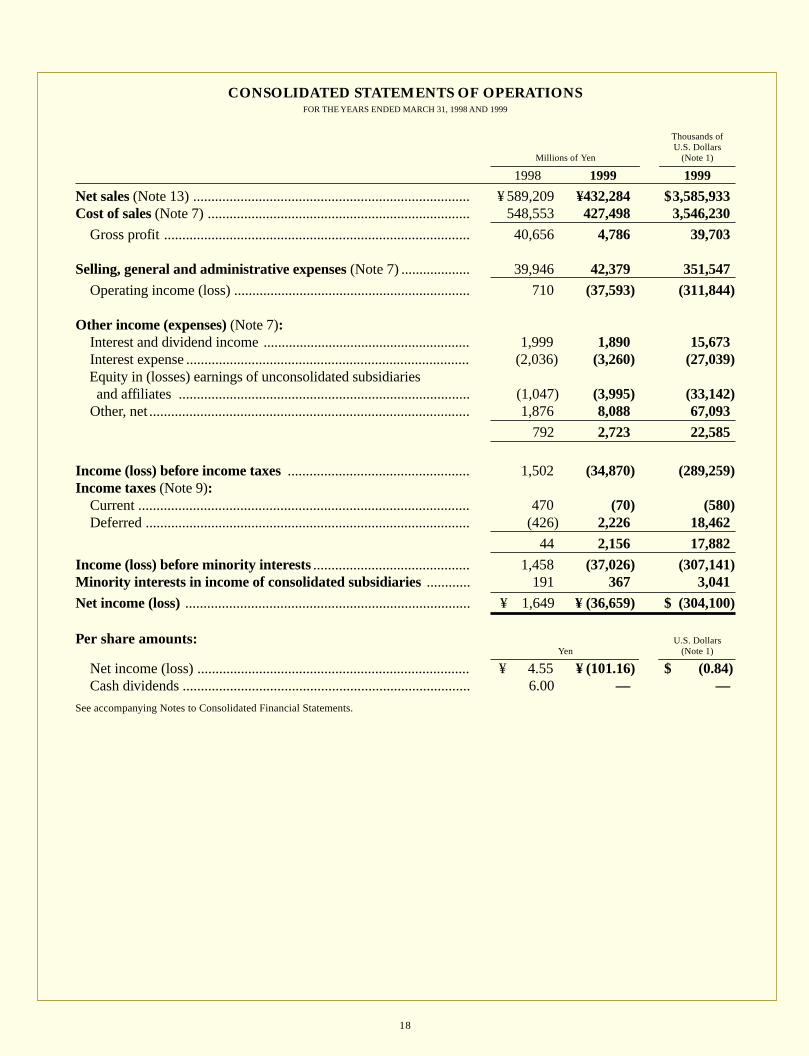
Net sales (Note 13) ............................................................................ ¥ 589,209¥432,284 $3,585,933Cost of sales (Note 7) ........................................................................ 548,553427,498 3,546,230
Gross profit .................................................................................... 40,6564,786 39,703
Selling, general and administrative expenses (Note 7) ................... 39,946 42,379 351,547Operating income (loss) ................................................................. 710(37,593) (311,844)
Other income (expenses) (Note 7):Interest and dividend income ......................................................... 1,9991,890 15,673Interest expense .............................................................................. (2,036)(3,260) (27,039)
Equity in (losses) earnings of unconsolidated subsidiaries and affiliates ................................................................................ (1,047)(3,995) (33,142)
Other, net ........................................................................................ 1,8768,088 67,093........................................................................................................... 792 2,723 22,585
Income (loss) before income taxes.................................................. 1,502 (34,870) (289,259)Income taxes (Note 9):
Current ........................................................................................... 470 (70) (580)Deferred ......................................................................................... (426)2,226 18,462
........................................................................................................... 44 2,156 17,882Income (loss) before minority interests........................................... 1,458 (37,026) (307,141)Minority interests in income of consolidated subsidiaries............ 191 367 3,041Net income (loss).............................................................................. ¥ 1,649¥ (36,659) $0(304,100)
Per share amounts: U.S. DollarsYen (Note 1)
Net income (loss) ........................................................................... ¥ 4.55¥ (101.16) $ (0.84)Cash dividends ............................................................................... 6.00 — —
See accompanying Notes to Consolidated Financial Statements.
CONSOLIDATED STATEMENTS OF OPERATIONSFOR THE YEARS ENDED MARCH 31, 1998 AND 1999

19
Millions of YenNumber of Number ofshares of shares ofcommon Additional Treasury
stock Common paid-in Retained common(Thousands) stock capital earnings stock
Balance at March 31, 1997................................ 362,392 ¥ 26,412 ¥ 17,787 ¥ 97,449 (176)Net income ........................................................ — — — 1,649 —Cash dividends paid........................................... — — — (2,174) —Directors’ and statutory auditors’ bonuses ........ — — — (140) —Increase due to the addition of an affiliateaccounted for by the equity method ................. — — — 1,470 —Other .................................................................. — — — — (1,594)
Balance at March 31, 1998................................ 362,392 26,412 17,787 98,254 (1,770)Net loss .............................................................. — — — (36,659) —Cash dividends paid........................................... — — — (1,087) —Directors’ and statutory auditors’ bonuses ........ — — — (70) —Decrease due to the addition of an affiliateaccounted for by the equity method ................. — — — (580) —Other .................................................................. — — — — (240)
Balance at March 31, 1999................................ 362,392 ¥ 26,412 ¥ 17,787 ¥ 59,858 (2,010)
Thousands of U.S. Dollars (Note 1)
AdditionalCommon paid-in Retained
stock capital earnings
Balance at March 31, 1998.............................................. $219,099 $147,546 $ 815,042Net loss ............................................................................ — — (304,100)Cash dividends paid......................................................... — — (9,018)Directors’ and statutory auditors’ bonuses ...................... — — (581)Decrease due to the addition of an affiliateaccounted for by the equity method ............................... — — (4,806)
Balance at March 31, 1999.............................................. $219,099 $147,546 $ 496,537See accompanying Notes to Consolidated Financial Statements.
CONSOLIDATED STATEMENTS OF SHAREHOLDERS’ EQUITYFOR THE YEARS ENDED MARCH 31, 1998 AND 1999

20
CONSOLIDATED STATEMENTS OF CASH FLOWSFOR THE YEARS ENDED MARCH 31, 1998 AND 1999
Thousands ofU.S. Dollars
Millions of Yen (Note 1)
1998 1999 1999
Operating activities:Net income (loss) ........................................................................... ¥(01,649 ¥(36,659) $(304,100)Adjustments to reconcile net income to net cashprovided by (used in) operating activities:
Depreciation and amortization ................................................... 27,69730,346 251,730Provision for doubtful accounts.................................................. (102) (351) (2,912)Provision for severance indemnities less payments .................... (226) (97) (805)Loss on sales and disposal of property, plant and equipment ..... 625 996 8,262Decrease in minority interests .................................................... (14) (204) (1,692)
Changes in operating assets and liabilities:Notes and accounts receivable .................................................... (1,983)49,766 412,825Inventories.................................................................................. (6,665) 6,327 52,484Prepaid expenses and other current assets .................................. (2,889)863 7,159Notes and accounts payable ....................................................... (17,956)(33,876) (281,012)Accrued income taxes ................................................................ (3,555) 9 75Accrued expenses and other current liabilities ........................... (1,495)(7,454) (61,833)
Net cash (used in) provided by operating activities ............ (4,914) 9,666 80,181Investing activities:
Increase in short-term investments ................................................. (2,150)(130) (1,078)Net decrease in investments inunconsolidated subsidiaries and affiliates ...................................... 2,8333,571 29,623Net decrease (increase) in investment securities ............................. (61)3,751 31,116Net decrease in long-term loans ..................................................... 75 70 581Addition to property, plant and equipment ..................................... (50,668)(36,038) (298,946)Proceeds from sales and disposal of property, plantand equipment ............................................................................... 4,4781,479 12,269Payment for purchase of subsidiaries, net of cash acquired ............ — (595) (4,936)Other .............................................................................................. 2,472(1,593) (13,214)
Net cash used in investing activities ................................... (43,021)(29,485) (244,585)Financing activities:
Net increase in short-term loans ..................................................... 14,5618,633 71,613Proceeds from long-term debt ........................................................ 32,84351,159 424,380Repayments of long-term debt ....................................................... (2,558)(14,005) (116,176)Cash dividends paid and directors’ and statutoryauditors’ bonuses........................................................................... (2,314)(1,157) (9,598)
Net cash provided by financing activities ........................... 42,53244,630 370,219
Net increase (decrease) in cash and cash equivalents............... (5,403) 24,811 205,815Cash and cash equivalents at beginning of year....................... 41,676 36,273 300,894Cash and cash equivalents at end of year.................................. ¥(36,273 ¥ 61,084 $ 506,709
Supplemental disclosures of cash flow information:Cash paid during the year for:
Interest expense .......................................................................... ¥(01,971 ¥ 3,310 $ 27,454Income taxes .............................................................................. ¥(04,170 ¥ 439 $ 3,645
See accompanying Notes to Consolidated Financial Statements.

21
NOTES TO CONSOLIDATED FINANCIAL STATEMENTS
Note 1: Basis of Consolidated Financial Statements’ PresentationThe accompanying consolidated financial statements of HINOMOTORS, LTD. (the “Company”) and its consolidated subsid-iaries have been prepared in accordance with accounting prin-ciples and practices generally accepted in Japan. Accordingly, theaccompanying consolidated financial statements are not intendedto present the consolidated financial position, results of opera-tions and cash flows in accordance with accounting principlesand practices generally accepted in countries and jurisdictionsother than Japan.
In preparing these statements, certain reclassifications and re-arrangements have been made to the accompanying consoli-dated financial statements prepared domestically in Japan in orderto present these statements in a format which is more familiar toreaders outside Japan. In addition, the accompanying notes in-clude additional information, which is not required under ac-counting principles and practices generally accepted in Japan.Certain reclassifications have been made in the 1998 consoli-dated financial statements to conform to the classifications usedin 1999.
The U.S. dollar amounts included herein are solely for theconvenience of readers outside Japan and have been translatedfrom the Japanese yen amounts at the rate of ¥120.55=$1, theapproximate exchange rate prevailing as of March 31, 1999.
Note 2: Summary of Significant Accounting Policies(1) ConsolidationThe accompanying consolidated financial statements include theaccounts of the Company and its significant subsidiaries. Invest-ments in unconsolidated subsidiaries and affiliates are stated atcost and certain unconsolidated affiliates are accounted for bythe equity method.(2) Foreign Currency TranslationForeign currency translation of the accounts of the Companyand its subsidiaries are as follows:
Current receivables and payables in foreign currencies aretranslated at the rate of exchange in effect at the balance sheetdate or at the rates of any applicable forward exchange contract.Non-current receivables and payables are translated at historicalexchange rates.
Assets and liabilities, and income and expenses in the finan-cial statements of the consolidated foreign subsidiary are trans-lated into yen at the rate of exchange in effect at the balancesheet date.(3) Statements of Cash FlowsFor the presentation of the statements of cash flows, the Com-pany considers cash, time deposits and all other highly liquidinvestments with an original maturity of three months or less tobe cash equivalents.
(4) InventoriesThe Company:Finished products are stated at cost, which is determined by theidentified cost method. Work in process, raw materials and sup-plies are stated at cost, which is determined by the moving aver-age cost method.Subsidiaries:Inventories are principally stated at cost, which is determined bythe moving average method or at the latest purchase price.(5) Marketable Securities and Investment SecuritiesMarketable securities and investment securities are carried atcost, which is determined by the moving average cost method.(6) Property, Plant and Equipment and DepreciationProperty, plant and equipment are stated at cost. Depreciation iscomputed principally by the declining balance method basedon the estimated useful lives of the respective assets.
The range of useful lives is as follows:Buildings and structures 5 to 75 yearsMachinery, equipment and vehicles 3 to 17 yearsTools 2 to 15 years
(7) Severance Indemnities and Pension PlansEmployees who terminate their services with the Company andits subsidiaries are entitled to a lump-sum severance paymentdetermined by reference to their current basic rate of pay andlength of service. The Company and its subsidiaries generallyprovide for this liability to the extent of 40 per cent. of theamount which would be required to be paid if allemployees voluntarily terminated their services at the balancesheet date.
The Company has a non-contributory pension plan for em-ployees. An employee who terminates employment with theCompany at age 50 or more receives 10 per cent. (mandatoryretirement at age 60 entitles an employee to receive 100 percent.) of such retirement benefits by a lump-sum payment or byannuity payments from this pension plan, and the remainder bya lump-sum payment from the unfunded retirement plan (asdescribed above). Payments to the pension fund are charged toincome when made. The past service costs relating to the pen-sion plan are being funded over a period of 8 years and 3 months.
The consolidated subsidiaries have various kinds of pensionplans.(8) Allowance for Doubtful AccountsThe allowance for doubtful accounts is provided based on theestimated amount of probable bad debts and the maximumamount which can be charged to income under Japaneseincome tax laws.(9) Research and Development CostsResearch and development costs are charged to income asincurred.

22
(10) Income TaxesIncome taxes are provided for based on amounts currently payablefor each year. No tax effect is recognized by the Company andits domestic subsidiaries for timing differences which arise as aresult of the differences in the recognition of certain incomeand expenses for tax and for financial reporting purposes.
The foreign consolidated subsidiaries recognizes deferredincome tax for such timing differences.(11) Revenue RecognitionSales of products are recognized in the accounts upon shipmentto customers.(12) Net Income per ShareThe computation of net income per share is based on theweighted average number of shares outstanding during theperiod.(13) LeasesFinance leases, other than those lease agreements which stipu-late the transfer of ownership of the leased property, areaccounted for as operating leases.
Note 3: InventoriesInventories at March 31, 1998 and 1999 consisted of thefollowing:
Thousands ofMillions of Yen U.S. Dollars
1998 1999 1999
Finished products ................. ¥17,341 ¥16,654 $138,154Work in process .................... 13,377 9,241 76,660Raw materialsand supplies ......................... 3,326 5,447 45,182
¥34,044 ¥31,342 $259,996
Note 4: Advances to Unconsolidated Subsidiaries and AffiliatesLoans to unconsolidated subsidiaries and affiliates at March31, 1998 and 1999, consisted of the following:
Thousands ofMillions of Yen U.S. Dollars
1998 1999 1999
Short-term loans: Affiliates ............................ ¥ — ¥0,320 $02,655Long-term loans:
Unconsolidatedsubsidiaries ...................... ¥940 ¥0,925 $07,673Affiliates ........................... 0 1,170 9,706
............................................ ¥940 ¥2,095 $17,379
Note 5: Short-Term Bank Loans and Long-Term DebtThe annual interest rates applicable to short-term bank loansoutstanding at March 31, 1998 and 1999 were principally 1.5per cent.
Long-term debt at March 31, consisted of the following:Thousands of
Millions of Yen U.S. Dollars
1998 1999 1999
Loans, principally frombanks, insurancecompanies and otherinstitutions, due 1999to 2026 withinterest rates rangingfrom 1.15% to 5.6%
Secured ............................ ¥04,830 ¥ 6,512 $054,016Unsecured ........................ 8,506 18,082 149,997
Less amount duewithin one year ................... (9,406) (5,030) (41,722)............................................ 3,930 19,564 162,2917.0% bonds due 1998 ........... 4,000 — —3.45% bonds due 1999 ......... 15,000 15,000 124,430Floating-rate bondsdue 1999 ............................. 25,000 25,000 207,3832.0% bonds due 2001 ........... — 10,000 82,9532.2% bonds due 2002 ........... 10,000 10,000 82,9532.5% bonds due 2002 ........... — 20,000 165,9062.6% bonds due 2003 ........... 20,000 20,000 165,906Less amount duewithin one year ................... (4,000) (40,000) (331,812)............................................ 70,000 60,000 497,719
¥73,930 ¥79,564 $660,010
The aggregate annual maturities of long-term debt outstand-ing at March 31, 1999, were as follows:
Thousands ofYear ending March 31 Millions of Yen U.S. Dollars
2000 ........................................ ¥ 45,030 $0,373,5352001 ........................................0 4,593 38,0992002 ........................................0 27,069 224,5502003 and thereafter .................. 47,902 397,361
............................................... ¥124,594 $1,033,545
As is customary in Japan, short-term and long-term bank loansare made under general agreements which provide that collat-eral and guarantees for present and future indebtedness will begiven upon request of the bank with reasonable and probablecause, and that the bank shall have the right to offset cash depos-ited with it against any obligation that has become due or, in theevent of default, against all obligations due to the bank. TheCompany has never been requested to give any additional col-lateral or guarantee.

23
Note 9: Income TaxesThe Company and its domestic subsidiaries are subject to cor-porate income tax, enterprise tax and prefectural and municipalinhabitants taxes, based on income, which in the aggregate resultin statutory tax rates of approximately 52 per cent. for 1998 and46.4 per cent. for 1999. However, the effective tax rates in theaccompanying statements of operations differ from the above-mentioned income tax rates. The principal reasons for such dif-ferences are (a) the accounting policy of not providing fordeferred income taxes arising from timing differences betweenfinancial and tax reporting, and (b) certain expenses which arenot deductible for income tax purposes.
Note 10: Contingent LiabilitiesContingent liabilities at March 31, 1998 and 1999 were as follows:
Thousands ofMillions of Yen U.S. Dollars
1998 1999 1999
Trade notes receivable discounted with banks ......... ¥00,643 ¥00,406 $003,366Guarantees of housing loans of employees andfor indebtedness ofunconsolidated subsidiariesand affiliates ......................... 14,866 14,006 116,188
Note 6: Accrued Severance Indemnities and Pension CostsThe charges to income for accrued severance indemnities andpension costs for the years ended March 31, 1998 and 1999were as follows:
Thousands ofMillions of Yen U.S. Dollars
1998 1999 1999
Accrued severanceindemnities .......................... ¥3,729 ¥3,256 $27,506Pension costs ........................ 1,621 2,640 21,901
Note 7: DepreciationDepreciation charges of property, plant and equipment for theyears ended March 31, 1998 and 1999 were as follows:
Thousands ofMillions of Yen U.S. Dollars
1998 1999 1999
Selling, general andadministrative expenses ........ ¥01,296 ¥01,478 $012,261Cost of sales ......................... 24,859 27,390 227,209Other ................................... 397 272 2,258
Note 8: LeasesLease expenses in respect of finance leases, other than those leaseagreements which stipulate the transfer of ownership of the leasedproperty at March 31, 1998 and 1999, were as follows:
Thousands ofMillions of Yen U.S. Dollars
Class of property 1998 1999 1999
Machinery, equipment and vehicles ........................ ¥5,915 ¥06,009 $049,851Tools .................................... 11,908 12,725 105,555
............................................ 17,823 18,734 155,406Less accumulated depreciation . (6,887) (9,384) (77,841)
Net ...................................... 10,936 9,350 77,565
Future minimum paymentsDue within one year ............. 2,921 2,767 22,953Due after one year ................ 8,015 6,583 59,611
............................................ 10,936 9,350 77,564
Lease expenses for the year ... 2,070 3,013 24,996Accumulated depreciation .... 2,070 3,013 24,996

24
Note 11: Retained Earnings and DividendsThe amount of retained earnings available for dividends underthe Commercial Code of Japan is based on the amount stated inthe statutory financial statements of the Company.
Dividends are approved by the shareholders at a meeting heldsubsequent to the fiscal year to which the dividend is applicable.In addition, a semi-annual interim dividend payment may bemade by resolution of the Board of Directors subject to certainlimitations imposed by the Commercial Code.
Note 12: Subsequent EventOn February 10, 1999, the Company entered into an agree-ment of the merger with Hino Motor Sales, Ltd., a general salesagent of the Company in Japan, as of October 1, 1999 and suchagreement has been approved at the general shareholdersmeeting of the Company held on June 24, 1999.
Note 13: Segment InformationThe Company and its consolidated subsidiaries are primarilyengaged in the manufacture and sale of automobiles, particularlydiesel trucks and buses.
Business segment information is not required to be disclosedas both sales and operating income of the automobile businessexceed 90 per cent. of total sales and of operating income of allsegments not incurring an operating loss.
Geographical segment information is not required to be dis-closed as sales outside Japan are less than 10 per cent. of consoli-dated net sales.
Year ended March 31, 1999
Millions of Yen
Overseas Overseas Consolidatedsales sales(A) sales(B) (A)/(B)
Asia .......................... ¥17,385 — 4.0%Oceania .................... ¥12,192 — 2.8%Other areas ............... ¥29,636 — 6.9%Total ......................... ¥59,213 ¥432,284 13.7%
Thousands of U.S. Dollars
Total ......................... $491,187 $3,585,933
Year ended March 31, 1998
Millions of Yen
Overseas Overseas Consolidatedsales sales(A) sales(B) (A)/(B)
Asia .......................... ¥53,844 — 9.1%Oceania .................... ¥11,740 — 4.7%Other areas ............... ¥27,805 — 2.0%Total ......................... ¥93,389 ¥589,209 15.8%

25
REPORT OF INDEPENDENT CERTIFIED PUBLIC ACCOUNTANTS
To the Board of Directors ofHINO MOTORS, LTD.
We have examined the consolidated balance sheets of Hino Motors, Ltd. and its consolidated subsidiaries as ofMarch 31, 1998 and 1999 and the related consolidated statements of operations, shareholders’ equity and cashflows for the years then ended, all expressed in Japanese yen. Our examinations were made in accordance withauditing standards, procedures and practices generally accepted and applied in Japan and, accordingly, includedsuch tests of the accounting records and such other auditing procedures as we considered necessary in thecircumstances.
In our opinion, the consolidated financial statements referred to above, expressed in Japanese yen, present fairlythe consolidated financial position of Hino Motors, Ltd. at March 31, 1998 and 1999, and the consolidated resultsof their operations and their cash flows for the years then ended in conformity with accounting principles andpractices generally accepted in Japan applied on a consistent basis.
The U.S. dollar amounts in the accompanying consolidated financial statements with respect to the year endedMarch 31, 1999 are presented solely for convenience. Our examination also included the translation of yenamounts into U.S. dollar amounts and, in our opinion, such translation has been made on the basis described inNote 1 to the consolidated financial statements.
Tokyo, Japan SHOWA OTA & CO.June 24, 1999 Certified Public Accountants

26
Toshimi Onishi Hiroshi Yuasa Toshiki Amano Masashi Shigemori
Chairman of the Board President,Member of the Board
DIRECTORS AND AUDITORS/EXECUTIVE OFFICERS
Executive Vice-Presidents, Members of the Board
Directors and Auditors
Chairman of the BoardToshimi Onishi
President, Member of the BoardHiroshi Yuasa
Executive Vice Presidents, Mem-bers of the BoardToshiki AmanoMasashi Shigemori
Senior Managing Directors,Members of the BoardYoshio YoshizawaMasahiro IshikawaMasamichi YoshimizuShouhei KakizoeKazuhiko Chiba
Tadayoshi NakaneShinichi FunakuboTadashi Shimizu
Director, Member of the BoardIwao Okijima
Standing AuditorsKazuyoshi OsakiKazuo UesugiKazuo Kadokura
AuditorsYoshinori UeyamaFujio Cho
Executive Officers
Senior Executive OfficersIsao JokoYoshitaka NakamuraHideaki TobitaTakayuki SuzukiHisanobu FujitaKunihiko KanekoHiromitsu TanakaYutaka KobayashiTsuyoshi Osumi
Exectuive OfficersKijiro OnishiMasataka MatsukataMasaharu ItoMasaharu ShibataHisaaki UgaMasayoshi HaraMitsuo KikuchiHiroyoshi KakoBunji HagiwaraTaro YoshimuraTakeshi IidaShinichiro SugisakiHideo MoriKunihiko SusukiKanji Fujimoto
Director,Member of the Board
Tadayoshi Nakane Shinichi Funakubo Tadashi Shimizu
Yoshio Yoshizawa Masahiro Ishikawa Masamichi Yoshimizu Shouhei Kakizoe
Senior Managing Directors, Members of the Board
Kazuhiko Chiba Iwao Okijima

27
DOMESTIC OFFICES AND PLANTS
Head Office & Hino Plant:
1-1, Hinodai 3-chome, Hino-shi, Tokyo
191-8660
Tamachi Office (Overseas Business):
11-3, Shiba 4-chome, Minato-ku, Tokyo
108-0014
Hamura Plant:
1-1, Midorigaoka 3-chome, Hamura-shi,
Tokyo 205-8660
Nitta Plant:
10-1, Hayakawa, Nitta-machi,
Nitta-gun, Gunma 370-0344
OVERSEAS SUBSIDIARIES
Marketing
HINO DIESEL TRUCKS (CANADA) LTD.
7040 Davand Drive, Mississauga, Ontario L5T
1J5
HINO MOTOR SALES AUSTRALIA PTY
LTD
2-10 Parraweena Road, Taren Point, NSW
2229
Manufacturing and Marketing
HINO MOTORS (THAILAND) LIMITED
No. 212, Moo 4, Vibhavadi-Rangsit Road,
Kwaeng Talard Banghken, Khet, Laksi
Bangkok 10210
Marketing
HINO MOTORS (MALAYSIA) SDN. BHD.
Lot P.T. 24, Jalan 223, Section 51A, Petaling
Jaya, Selangor
HINO DIESEL TRUCKS (U.S.A.), INC.
■ 25 Corporate Drive, Orangeburg, N.Y.
10962
■ 1802 Kettering Street, Irvine, California
92714
HINO ENGINE SERVICE (U.S.A.)
CORPORATION
25 Corporate Drive, Orangeburg,
N.Y. 10962
For further information, please contact
Public Relations Division
11-3, Shiba 4-chome, Minato-ku, Tokyo
108-0014, Japan
Telephone: 3-5419-9320
Facsimile: 3-5419-9363
Asia, Oceaniaand the Middle East
Europe and Africa The Americas
HINO MOTORS INTERNATIONAL NETWORK
Parts Depots
HINO MOTORS (EUROPE) N.V.
Blarenberglaan 2800 Mechelen, Belgium
HINO MOTORS INTERNATIONAL
(U.S.A.), INC.
451B North Cota Street, Corona, California
91720
Manufacturing and Marketing
P.T. HINO INDONESIA
MANUFACTURING
Jl. Raya Bekasi Km18 Kawasan, Industri
Pulogadung, Jakarta Timur
HINOPAK MOTORS LIMITED
D-2, S.I.T.E. Manghopir Road, Karachi 75700
P.O. Box 10714, Pakistan
HINO MOTORS VIETNAM, LTD.
Hoang Liet Hamlet, Thanh Tri District, Hanoi
OVERSEAS AFFILIATES
Holding Company
THAI HINO MOTOR CORPORATION
LTD.
99 Moo 3, Teparak Road, Tambol Teparak,
Amphur-Muang, Samutprakarn 10270
● Sales outlets ▲ Parts depots ■ Production plants

28
Breakdown by Shareholder Category(Unit: Thousand shares)
Hino Motors’ Stock Price on the Tokyo StockExchange(Unit: Yen) (Face value: ¥50)
Private Individuals andOthers 26,076 7.2%
Securities Companies564 0.2%
Banks and OtherFinancial Institutions162,911 45.2%
Other DomesticCorporations140,434 39.0%
Foreigners 30,391 8.4%
300
200
100
400
0
500
600
700
41998
5 6 7 8 9 10 11 12 11999
2 3
315
439410
311
429
375
462
406
268
445
292
385
290
415
335
395
344
404
344
455
374
439
378
615
Number of Shares:Authorized: 1,000,000,000Outstanding: 362,391,898
Paid-in Capital: ¥26,412 million
Number of Shareholders: 11,798
Major Shareholders (Unit: Thousand shares)
Name Number of shares
Toyota Motor Corporation ..................................... 72,764Nippon Life Insurance Company ........................... 19,079Asahi Mutual Life Insurance Company ................. 18,648The Sakura Bank, Ltd. ........................................... 13,319The Fuji Bank, Ltd. ................................................11,606The Dai-Ichi Kangyo Bank, Ltd. ...........................11,547The Mitsui Trust and Banking Co., Ltd. ................ 10,146The Tokio Marine and Fire Insurance Co., Ltd. ....... 6,800The Asahi Bank, Ltd. ............................................... 5,761The Bank of Yokohama, Ltd. ................................... 5,662
CORPORATE DATA

PREPARATIONS FOR THE YEAR 2000 ISSUE
1) Progress ReportManagement at Hino Motors recognizes the importance ofthe Year 2000 (Y2K) issue and is advancing preparations ona Companywide basis. The Company established the Year2000 Issue Committee in February 1999, which is chaired bythe director in charge of the Information Systems Division.The committee conducts inspections, confirms progress andreports to management.At present, examinations of core information systems, pri-mary products, production facilities and suppliers are nearlyfinished. Work is proceeding smoothly on measures to copewith the Y2K issue, including tests of information systemsthat simulate the year 2000. Testing is scheduled for comple-
tion during the first half of fiscal year 2000.
2) ExpendituresAlthough total expenditures cannot be clearly identified forrestructuring information systems in preparing for Y2K, theCompany does not foresee a serious impact on future perfor-mance resulting from related expenses.
3) Contingency PlanTo prevent potential risks, Hino Motors plans to implement acontingency plan by the end of September 1999.
29
Printed in Japan/Code No.2022-E0 ’99-8-2,000(LP)
1-1, Hinodai 3-chome, Hino-shi, Tokyo 191-8660
Printed on recycled paper


![Untitled-5 [137.59.126.118]137.59.126.118/wp-content/uploads/...spare-part-hino-asli-vs-palsu.pdf · Hino Genuine Oil HMSI Original Parts Untuk Silahkan hubungi Hino Motors Dealer](https://static.fdocuments.in/doc/165x107/5cad5f2288c99358488de8af/untitled-5-1375912611813759126118wp-contentuploadsspare-part-hino-asli-vs-palsupdf.jpg)


