Hindustan National Glass & Industries Ltd - V-Guard
23
V-Guard Industries Q2 & H1 FY2014 Earnings Presentation
Transcript of Hindustan National Glass & Industries Ltd - V-Guard

V-Guard Industries Q2 & H1 FY2014 Earnings Presentation

Certain statements in this communication may be „forward looking statements‟ within the
meaning of applicable laws and regulations. These forward-looking statements involve a
number of risks, uncertainties and other factors that could cause actual results to differ
materially from those suggested by the forward-looking statements. Important developments
that could affect the Company‟s operations include changes in the industry structure,
significant changes in political and economic environment in India and overseas, tax laws,
import duties, litigation and labour relations.
V-Guard Industries Limited (V-Guard) will not be in any way responsible for any action
taken based on such statements and undertakes no obligation to publicly update these
forward-looking statements to reflect subsequent events or circumstances.
Disclaimer
2

Table of Contents
Company Overview
MD’s Message
Financial Highlights – Q2 & H1 FY2014
Segment-wise/Geographical Breakup of Revenues
Outlook
About V-Guard Industries
Strong Financial Performance (FY08 – FY13)
Broad-based Growth across Segments (FY08 – FY13)
Market Share Across Product Segments
• Electronics - Stabilizers, UPS and Digital UPS • Electricals - Pumps, House Wiring and Industrial Cables, Electric Water Heaters, Fans • Other launches include Solar Water Heaters, Induction cooktops, Switchgears • Household consumption market will continue to grow at a significant pace over the next five years
• Spread over 28 branches nationwide • Network of over 301 distributors, 3,548 channel partners and 15,000 retailers
• Follows an asset light model outsourcing ~60% of its products from a range of vendors • Tie-ups with SSIs/self-help groups spread across southern India help derive excise benefit • Blended manufacturing policy helps optimize capex and working capital requirements
• Leadership position in its flagship product, voltage stabilizers, with over 51% market share • Successfully gained market share in all of its product categories • Rapidly expanding market share in the non-South markets
Comprehensive portfolio catering to the mass consumption market
Strong Brand Equity
Invested in a strong
distribution network
Mix of in-house and outsourcing production
model provides flexibility
• Aggressive ad spends and sales promotions have created a strong equity and brand recall • Strong established player in South India with leadership in the Voltage Stabilizer segment
• Significant investments committed towards aggressive expansion in non-South markets • Doubling house-wiring factory and setting up second manufacturing unit for solar water heaters
• Revenues and PAT have grown at a CAGR of 37% and 34% between FY08-FY13 • Significant expansion in return ratios over the last five years; ROE at 24% and ROCE at 23% for
FY2013
Strong Financial
Performance
Company Overview
4
Expanding towards a pan India presence
Increasing market share across all product lines

Commenting on the performance for Q2 FY2014, Mr. Mithun Chittilappilly, Managing
Director – V-Guard Industries Limited said,
“We have reported a subdued performance this quarter. Seasonality is a part of our business and
sales of certain products were affected due to the extended monsoon season. To add to this, our
performance has to be measured against a high base last year in Q2, when an extended summer
season boosted sales of our products. Further, an improvement in the power scenario this quarter,
especially in South India, affected sales of inverters, a high growth driver last year.
We believe demand growth is stable with weather related quarterly swings. However, we marginally
revise our outlook in terms of topline growth to 20% for FY14 and expect EBITDA margins to be in
the range of 9-9.5% for the full year.
Non-south geographies continue to grow at a strong pace, up 34% YoY and accounted for 28% of
the total sales in Q2. After the high ad spend last quarter on the IPL season (5.3% of sales), as per
our stated plan we have cut down the ad expenditure this quarter to 3.3% of sales as compared to a
mere 2.1% in Q2 FY13. For the full year, however, ad spends will be maintained between 3.5-4% of
our revenues with the objective of penetrating the non-South markets, establishing V-Guard as a
pan-India brand and increasing our pricing power.”
Managing Director’s Message
5

Key Highlights - Q2 & H1 FY14
• Revenue growth of 7% YoY in Q2 FY14
– Improved power situation in South India and the extended monsoon season impacted sales
of Digital UPS and Pumps
– Further, performance has to be measured against a high base in Q2 FY13, when an extended
summer season boosted sales of our products
• EBITDA margins at 8.4% in Q2 FY14
– 150 bps YoY impact on account of 120 bps increase in ad expenditure, 120 bps increase in
staff costs and 170 bps increase in other expenditure
– COGS/Sales improved by 270 bps
• Working capital cycle at 69 days in H1 FY14
– Improved by 4 days YoY led by 13 days reduction in debtors and expansion of 2 days in
creditors
– Inventory days were higher on account of weak demand environment
• Strong cash generation in H1 FY14
– Cash from operations at Rs. 87 crore in H1 FY14 as compared to Rs. 21 crore in H1 FY13
6

Financial Highlights (Q2 FY2014)
314
334
Q2 FY13 Q2 FY14
Total Income (Rs. crore)
286
310
Q2 FY13 Q2 FY14
Expenditure (Rs. crore)
31
28
Q2 FY13 Q2 FY14
EBITDA (Rs. crore) 18
15
Q2 FY13 Q2 FY14
PAT (Rs. crore)
Key ratios (%) Q2 FY14 Q2 FY13
EBITDA Margin 8.4% 9.9%
Net Margin 4.3% 5.7%
COGS/ Total Operating Income 72.4% 75.1%
Ad Expenditure (incl. promotions)/Total Revenues 3.3% 2.1%
Staff Cost/ Total Operating Income 6.6% 5.4%
Other Expenditure/ Total Operating Income 7.4% 5.7%
EPS (Rs.) 4.9 6.0 7
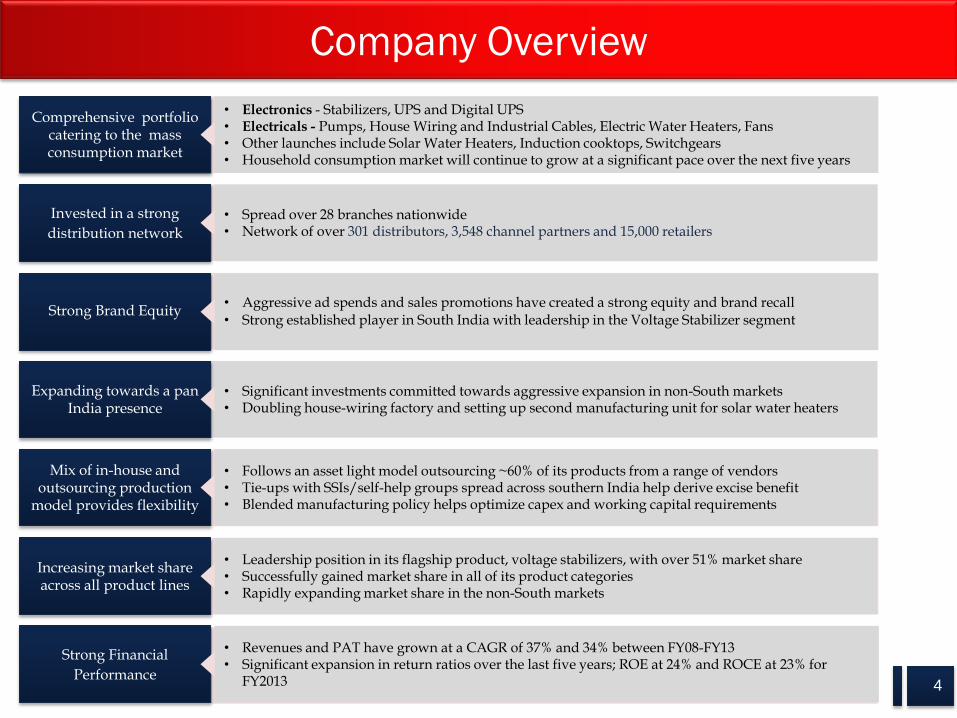
Financial Highlights (H1 FY2014)
633
742
H1 FY13 H1 FY14
Total Income (Rs. crore)
574 690
H1 FY13 H1 FY14
Expenditure (Rs. crore)
66 60
H1 FY13 H1 FY14
EBITDA (Rs. crore)
39 32
H1 FY13 H1 FY14
PAT (Rs. crore)
Key ratios (%) H1 FY14 H1FY13
EBITDA Margin 8.1% 10.4%
Net Margin 4.3% 6.1%
COGS/ Total Operating Income 73.4% 74.1%
Ad Expenditure (incl. promotions)/Total Revenues 4.4% 2.9%
Staff Cost/ Total Operating Income 5.9% 5.2%
Other Expenditure/ Total Operating Income 6.3% 5.7%
EPS (Rs.) 10.8 12.9 8

Financial Highlights – B/S Perspective
Key Ratios H1 FY14 H1 FY13
Inventory (days) 81 70
Debtor (days) 40 53
Creditor (days) 52 50
Working Capital Turnover (days) 69 73
RoE (%) 19% 28%
RoCE (%) 22% 29%
Debt / Equity (x) 0.4 0.5
Balance Sheet Snapshot (Rs. crore) 30 September 2013 30 June 2013 30 September 2012
Net worth 294.5 279.2 249.3
Total debt 107.7 114.9 121.9
o Working capital 71.4 76.9 100.1
o Term loan 36.3 38.0 21.8
Acceptances 80.3 62.0 31.2
Fixed Assets 164.0 161.1 136.9
Please note ROE, ROCE calculations are based on a TTM basis
9
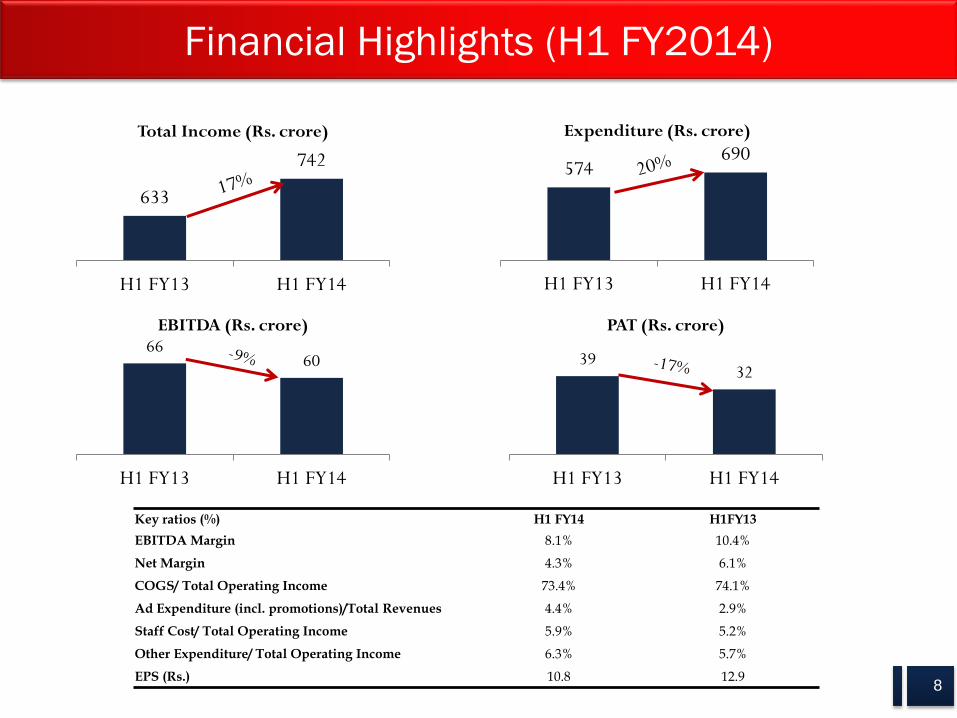
Segment-wise Breakup of Revenues - Q2 FY14 vs Q2 FY13
10
Segment Products Q2 FY2014
(Rs. cr.)
Contribution
(%)
Q2 FY2013
(Rs. cr.)
Contribution
(%)
YoY growth
(%)
Ele
ctr
on
ics
Stabilizers 54.3 16.2% 50.3 16.1% 7.8%
Standalone UPS 11.0 3.3% 15.1 4.8% -27.2%
Digital UPS 19.4 5.8% 37.4 11.9% -48.2%
Segment Total 84.6 25.3% 102.8 32.8% -17.7%
Ele
ctr
ical
s
Pumps 33.8 10.1% 43.1 13.8% -21.6%
House wiring cable 117.2 35.1% 89.0 28.4% 31.7%
LT cable 19.8 5.9% 20.0 6.4% -1.0%
Electric water heater 42.2 12.6% 29.2 9.3% 44.6%
Fan 15.4 4.6% 15.0 4.8% 2.5%
Other Products 12.6 3.8% 7.5 2.4% 67.8%
Segment Total 241.0 72.1% 203.8 65.0% 18.3%
Oth
ers
Solar water heater 8.4 2.5% 6.9 2.2% 22.5%
Segment Total 8.4 2.5% 6.9 2.2% 22.5%
GRAND TOTAL 334.1 100.0% 313.5 100.0% 6.6%
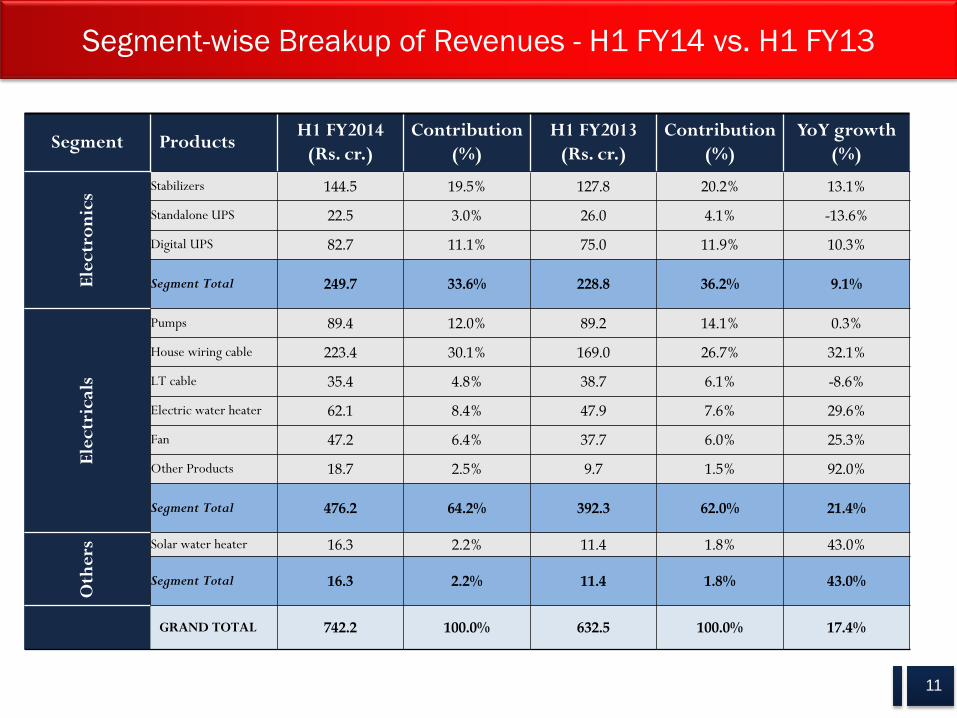
Segment-wise Breakup of Revenues - H1 FY14 vs. H1 FY13
11
Segment Products H1 FY2014
(Rs. cr.)
Contribution
(%)
H1 FY2013
(Rs. cr.)
Contribution
(%)
YoY growth
(%)
Ele
ctr
on
ics
Stabilizers 144.5 19.5% 127.8 20.2% 13.1%
Standalone UPS 22.5 3.0% 26.0 4.1% -13.6%
Digital UPS 82.7 11.1% 75.0 11.9% 10.3%
Segment Total 249.7 33.6% 228.8 36.2% 9.1%
Ele
ctr
ical
s
Pumps 89.4 12.0% 89.2 14.1% 0.3%
House wiring cable 223.4 30.1% 169.0 26.7% 32.1%
LT cable 35.4 4.8% 38.7 6.1% -8.6%
Electric water heater 62.1 8.4% 47.9 7.6% 29.6%
Fan 47.2 6.4% 37.7 6.0% 25.3%
Other Products 18.7 2.5% 9.7 1.5% 92.0%
Segment Total 476.2 64.2% 392.3 62.0% 21.4%
Oth
ers
Solar water heater 16.3 2.2% 11.4 1.8% 43.0%
Segment Total 16.3 2.2% 11.4 1.8% 43.0%
GRAND TOTAL 742.2 100.0% 632.5 100.0% 17.4%

Geographical Breakup of Gross Revenues
12
Region Q2 FY2014 Contribution Q2 FY2013 Contribution YoY growth
(Rs. cr.) (%) (Rs. cr.) (%) (%)
South 243.1 72% 247.2 77% -2%
Non-South 96.4 28% 71.8 23% 34%
Gross Revenues 339.6 100% 319.0 100% 6%
Region H1 FY2014 Contribution H1 FY2013 Contribution YoY growth
(Rs. cr.) (%) (Rs. cr.) (%) (%)
South 530.2 70% 481.5 75% 10%
Non-South 223.6 30% 162.2 25% 38%
Gross Revenues 753.9 100% 643.7 100% 17%
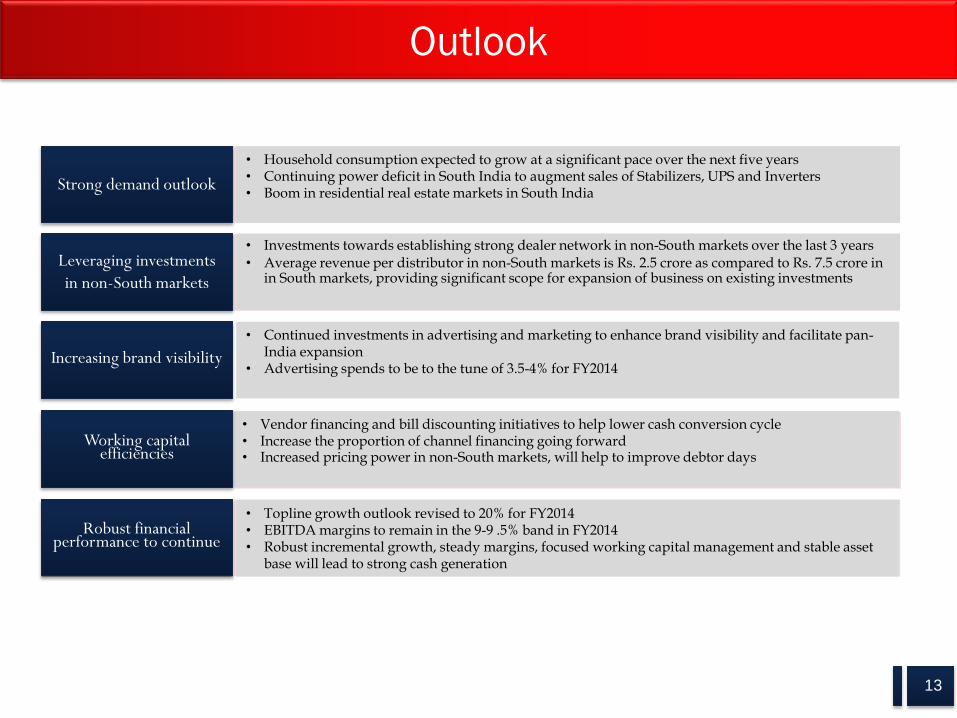
Outlook
• Vendor financing and bill discounting initiatives to help lower cash conversion cycle • Increase the proportion of channel financing going forward • Increased pricing power in non-South markets, will help to improve debtor days
• Household consumption expected to grow at a significant pace over the next five years • Continuing power deficit in South India to augment sales of Stabilizers, UPS and Inverters • Boom in residential real estate markets in South India
• Topline growth outlook revised to 20% for FY2014 • EBITDA margins to remain in the 9-9 .5% band in FY2014 • Robust incremental growth, steady margins, focused working capital management and stable asset
base will lead to strong cash generation
Strong demand outlook
Leveraging investments
in non-South markets
Robust financial performance to continue
• Investments towards establishing strong dealer network in non-South markets over the last 3 years • Average revenue per distributor in non-South markets is Rs. 2.5 crore as compared to Rs. 7.5 crore in
in South markets, providing significant scope for expansion of business on existing investments
13
Working capital efficiencies
• Continued investments in advertising and marketing to enhance brand visibility and facilitate pan-India expansion
• Advertising spends to be to the tune of 3.5-4% for FY2014
Increasing brand visibility

Shiv Muttoo/Varun Divadkar
Citigate Dewe Rogerson
Tel: +91 22 6645 1207 / 1222
Email: [email protected] / [email protected]
Jacob Kuruvilla (VP & Chief Financial Officer)
V-Guard Industries Limited
Tel: +91 484 300 5602
Email: [email protected]
For further information, please contact:
V-Guard Industries Limited (BSE:532953, NSE: VGUARD) is a Kochi based company, incepted in 1977 by Kochouseph Chittilapilly to manufacture and market Voltage stabilizers. The Company has since then established a strong brand name and aggressively diversified to become a multi-product Company catering to the Light Electricals sector manufacturing Voltage stabilizers, Invertors & Digital UPS systems, Pumps, House wiring/LT cables, Electric water heaters, Fans, Solar water heaters and has also recently forayed into Induction cooktops and Switchgears. V-Guard outsources 60% of its product profile while the rest are manufactured in – house while keeping a strong control in designs and quality. It has manufacturing facilities at Coimbatore (Tamil Nadu), Kashipur (Uttaranchal) and Kala Amb (Himachal Pradesh). V-Guard has been a dominant player in the South market, though the last five years have also seen the Company expanding rapidly in the non-South geographies with their contribution increasing from 5% of total revenues in FY08 to around 25% of total revenues in FY13. Significant investments continue to be made to expand its distributor base in the non-South geographies, and become a dominant pan-India player. V-Guard has a diversified client base and an extensive marketing & distribution network. Its client base differs from product to product and includes direct marketing agents, distributors and retailers. The Company today has a strong network of 28 branches, over 230 distributors, 3,000 channel partners and 15,000 retailers across the country.
About V-Guard Industries
14
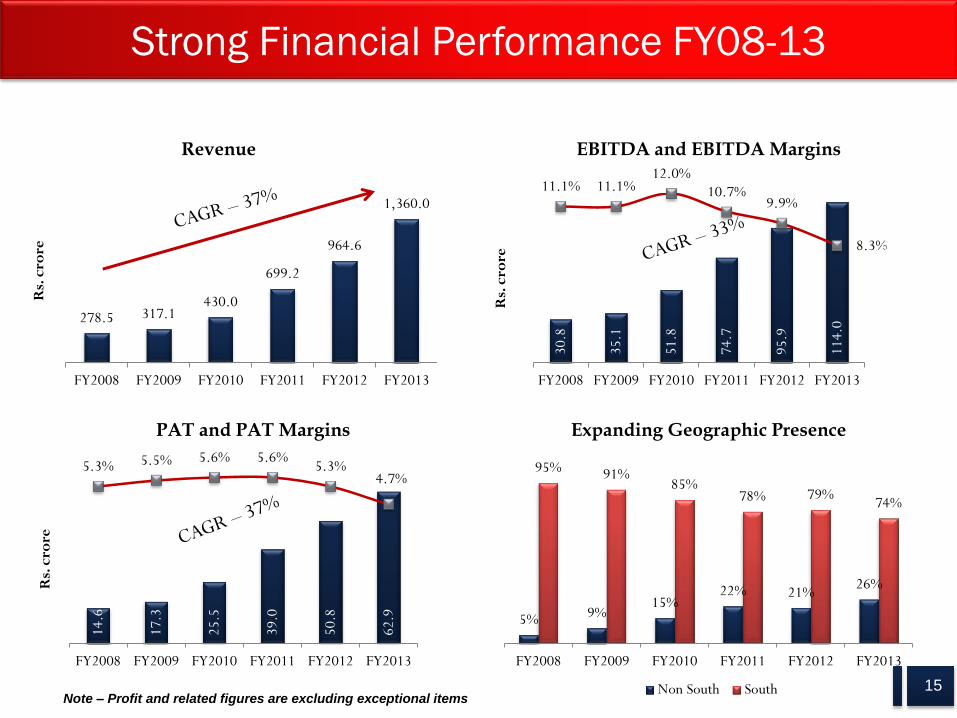
30.8
35.1
51.8
74.7
95.9
114.
0
11.1% 11.1% 12.0%
10.7% 9.9%
8.3%
0.0%1.0%2.0%3.0%4.0%5.0%6.0%7.0%8.0%9.0%10.0%11.0%12.0%
0
20
40
60
80
100
120
FY2008 FY2009 FY2010 FY2011 FY2012 FY2013
Rs.
cro
re
EBITDA and EBITDA Margins
Note – Profit and related figures are excluding exceptional items
Strong Financial Performance FY08-13
15
14.6
17.3
25.5
39.0
50.8
62.9
5.3% 5.5% 5.6% 5.6% 5.3%
4.7%
0.0%
0.9%
1.8%
2.7%
3.6%
4.5%
5.4%
0
10
20
30
40
50
60
70
FY2008 FY2009 FY2010 FY2011 FY2012 FY2013
Rs.
cro
re
PAT and PAT Margins
5% 9% 15%
22% 21% 26%
95% 91% 85%
78% 79% 74%
FY2008 FY2009 FY2010 FY2011 FY2012 FY2013
Expanding Geographic Presence
Non South South
278.5 317.1 430.0
699.2
964.6
1,360.0
0.0200.0400.0600.0800.0
1000.01200.01400.01600.0
FY2008 FY2009 FY2010 FY2011 FY2012 FY2013
Revenue
Rs.
cro
re

Strong Financial Performance FY08-13
16
12.4 13.7
18.0
23.1
24.1
24.0
16.9 17.6 19.1
20.0
25.9
23.0
FY20
08
FY20
09
FY20
10
FY20
11
FY20
12
FY20
13
ROE ROCE
117.
8
126.
5
141.
5
172.
0
210.
6
261.
3
0.30 0.20
0.60
0.80
0.50
0.60
0.000.100.200.300.400.500.600.700.800.90
0
50
100
150
200
250
300
FY20
08
FY20
09
FY20
10
FY20
11
FY20
12
FY20
13
Rs.
cro
re
Net Worth D/E

Broad-based Growth across Segments FY08-13
17
Segment Products FY08 Contribution (%) FY13 Contribution (%) CAGR(%)
Ele
ctr
on
ics
Stabilizers 93.7 35.3% 237.8 17.5% 20.5%
Standalone UPS 16.9 6.4% 48.3 3.6% 23.4%
Digital UPS 0.0 0.0% 173.3 12.7% NA
Segment Total 110.6 41.6% 459.4 33.8% 32.9%
Ele
ctr
ical
s
Pumps 56.1 21.1% 205.3 15.1% 29.6%
House wiring cable 60.0 22.6% 373.5 27.5% 44.1%
LT cable 1.0 0.4% 72.8 5.4% 135.8%
Electric water heater 27.2 10.3% 110.3 8.1% 32.3%
Fan 8.6 3.2% 79.7 5.9% 56.0%
Other Products 0.0 0.0% 26.8 2.0% #DIV/0!
Segment Total 153.0 57.6% 868.4 63.8% 41.5%
Oth
ers
Solar water heater 2.0 0.8% 32.5 2.4% 74.5%
Others - - - - -
Segment Total 2.0 0.8% 32.5 2.4% 74.5%
GRAND TOTAL 265.6 100.0% 1360.2 100.0% 38.6%
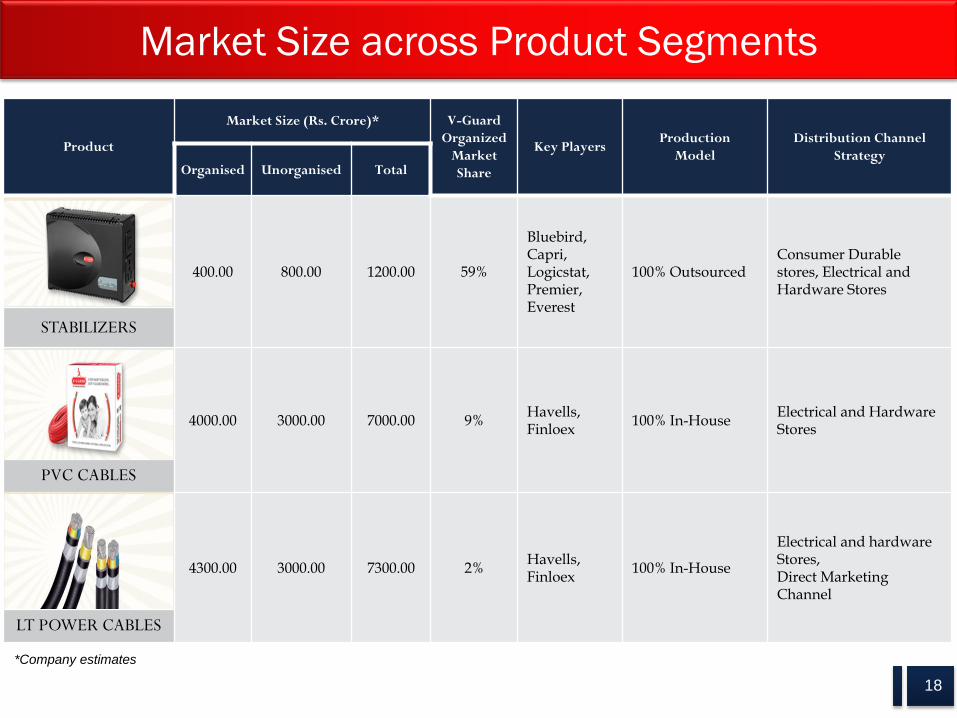
Market Size across Product Segments
Product
Market Size (Rs. Crore)* V-Guard
Organized
Market
Share
Key Players Production
Model
Distribution Channel
Strategy Organised Unorganised Total
400.00 800.00 1200.00 59%
Bluebird, Capri, Logicstat, Premier, Everest
100% Outsourced Consumer Durable stores, Electrical and Hardware Stores
STABILIZERS
4000.00 3000.00 7000.00 9% Havells, Finloex
100% In-House Electrical and Hardware Stores
PVC CABLES
4300.00 3000.00 7300.00 2% Havells, Finloex
100% In-House
Electrical and hardware Stores, Direct Marketing Channel
LT POWER CABLES
18
*Company estimates
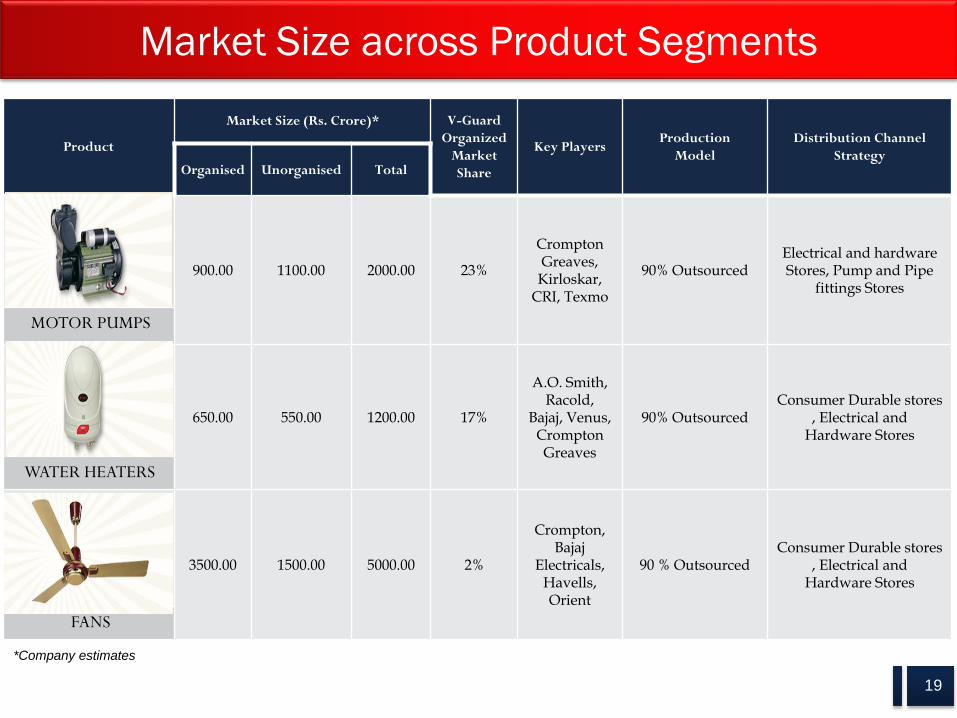
Market Size across Product Segments
Product
Market Size (Rs. Crore)* V-Guard
Organized
Market
Share
Key Players Production
Model
Distribution Channel
Strategy Organised Unorganised Total
900.00 1100.00 2000.00 23%
Crompton Greaves,
Kirloskar, CRI, Texmo
90% Outsourced Electrical and hardware Stores, Pump and Pipe
fittings Stores
MOTOR PUMPS
650.00 550.00 1200.00 17%
A.O. Smith, Racold,
Bajaj, Venus, Crompton Greaves
90% Outsourced Consumer Durable stores
, Electrical and Hardware Stores
WATER HEATERS
3500.00 1500.00 5000.00 2%
Crompton, Bajaj
Electricals, Havells, Orient
90 % Outsourced Consumer Durable stores
, Electrical and Hardware Stores
FANS
19
*Company estimates

Market Size across Product Segments
Product
Market Size (Rs. Crore)* V-Guard
Organized
Market
Share
Key Players Production
Model
Distribution Channel
Strategy Organised Unorganised Total
160.00 240.00 400.00 30% Numeric,
APC, Emerson
Outsourced Consumer Durable stores
UPS
6500.00 1000.00 7500.00 3% Microtek,
Luminous, Su-Kam
Outsourced
Consumer Durable stores, Electrical and
Hardware stores, Battery Retail stores
Digital UPS
425.00 225.00 650.00 8% Tata BP
Solar 100% In-House
Direct Marketing Channel
SOLAR WATER HEATER
20
*Company estimates
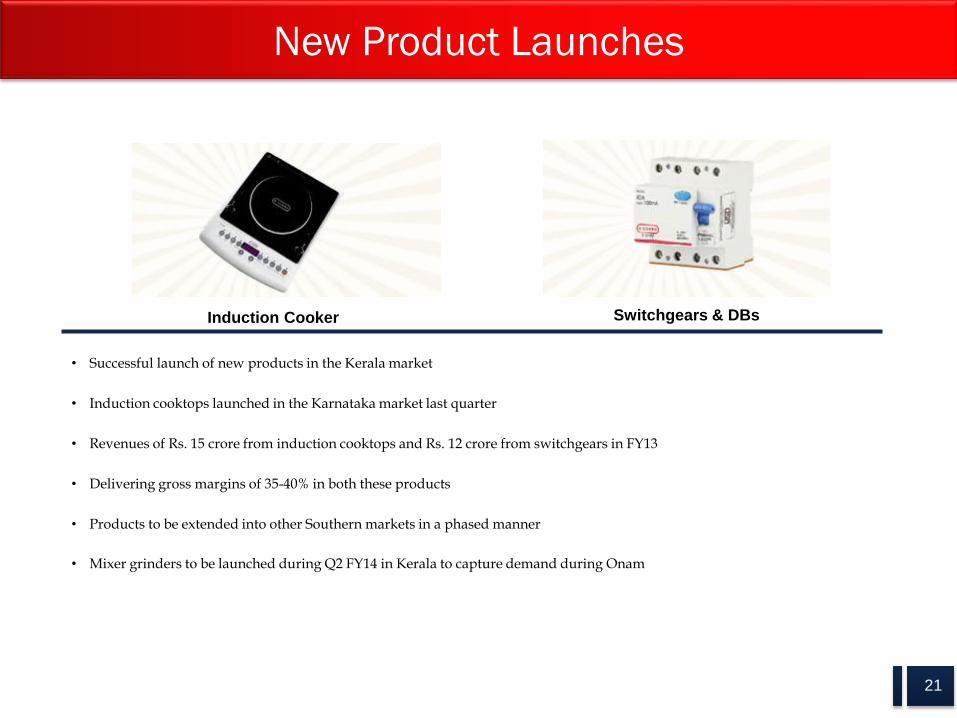
New Product Launches
21
Switchgears & DBs Induction Cooker
• Successful launch of new products in the Kerala market
• Induction cooktops launched in the Karnataka market last quarter
• Revenues of Rs. 15 crore from induction cooktops and Rs. 12 crore from switchgears in FY13
• Delivering gross margins of 35-40% in both these products
• Products to be extended into other Southern markets in a phased manner
• Mixer grinders to be launched during Q2 FY14 in Kerala to capture demand during Onam
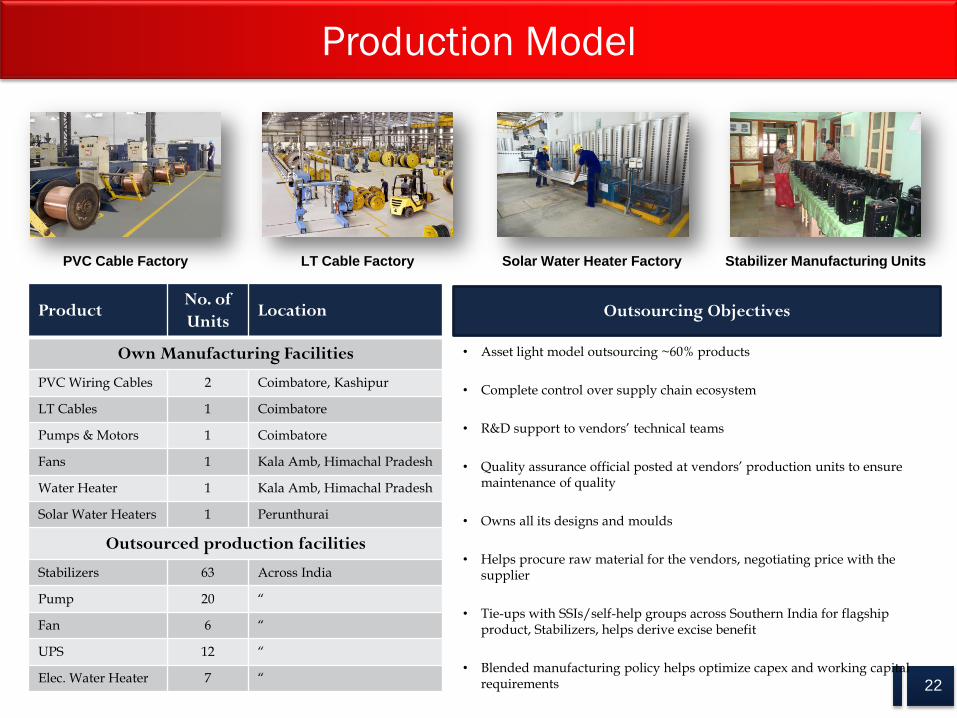
Production Model
• Asset light model outsourcing ~60% products
• Complete control over supply chain ecosystem
• R&D support to vendors’ technical teams
• Quality assurance official posted at vendors’ production units to ensure maintenance of quality
• Owns all its designs and moulds
• Helps procure raw material for the vendors, negotiating price with the supplier
• Tie-ups with SSIs/self-help groups across Southern India for flagship product, Stabilizers, helps derive excise benefit
• Blended manufacturing policy helps optimize capex and working capital requirements
22
Product No. of
Units Location
Own Manufacturing Facilities
PVC Wiring Cables 2 Coimbatore, Kashipur
LT Cables 1 Coimbatore
Pumps & Motors 1 Coimbatore
Fans 1 Kala Amb, Himachal Pradesh
Water Heater 1 Kala Amb, Himachal Pradesh
Solar Water Heaters 1 Perunthurai
Outsourced production facilities
Stabilizers 63 Across India
Pump 20 “
Fan 6 “
UPS 12 “
Elec. Water Heater 7 “
PVC Cable Factory LT Cable Factory Solar Water Heater Factory Stabilizer Manufacturing Units
Outsourcing Objectives

THANK YOU