Hindustan Insecticides Limited (HIL) A Government of India ...
57
STUDY REPORT ON THE SURVEY OF FARMERS ON VALUE CHAIN ANALYSIS IN BHARUCH DISTRICT OF GUJARAT Submitted by Hindustan Insecticides Limited (HIL) A Government of India Enterprise Scope Complex,2 nd Floor, Core-6 7,Lodhi Road, New Delhi-110003
Transcript of Hindustan Insecticides Limited (HIL) A Government of India ...
STUDY REPORT ON THE SURVEY OF FARMERS
ON VALUE CHAIN ANALYSIS IN BHARUCH
DISTRICT OF
GUJARAT
Submitted by
Hindustan Insecticides Limited (HIL)
A Government of India Enterprise
Scope Complex,2nd Floor, Core-6
7,Lodhi Road, New Delhi-110003
PREFACE
Bananas (Musa indica) are among the world’s most commonly consumed fruits.
They are primarily composed of carbohydrates and contain decent amounts of several
vitamins, minerals and antioxidants, potassium, vitamin C, catechin and resistant starch
are among the healthy nutrients in bananas. These may contribute to improved heart
and digestive health when consumed regularly as a part of a healthy life style. The
glycemic value of unripe banana is about 30, while ripe banana rank at about 60
meaning thereby that bananas may not cause major sugar spike in blood sugar in
healthy individual instead unripe bananas may improve insulin sensitivity in type 2
diabetes. Also banana may likely improve kidney functions in the healthy individuals. In
the muscle cramps arose due to exercise banana may help to relieve.
Gujarat is the second major banana producing state in the country and accounts
for 13.4% of the total production of banana in the country. In Gujarat, during the year
2013-14 banana crop is cultivated in an area of about 66496 ha. & having production of
42.25 lakhs tons with productivity of 63.55 MT/ha., which is highest in the country.
Precision farming technology has been adopted to ensure good quality and highest
productivity in the country, about 34 tissue culture laboratories has been established in
the state that provides good planting materials. Efficient use of water and fertilizer with
drip irrigation becoming popular among the farmers of Gujarat.
Mission mode horticulture development program is being implemented in all the
districts of the state. The ultimate strategy is development of crop clusters and adopts
end-to-end approach. More emphases has been made on the availability of genuine
planting materials, capacity building, post-harvest management and protected cultivation,
post-harvest management and marketing. Integrated pack houses, cold storages, Banana
ripening chambers, cold chain are the key elements of the Horticulture Development
Program of the Government. Huge investment is being made for establishment of such
infrastructures to enhance internal and overseas trade of horticulture commodities.
Couple of good integrated pack houses, air cargo complex and Gama irradiation projects
has been established by Gujarat Agro Industries Corporation. Support of Government has
facilitated establishment of considerable post-harvest infrastructures for perishable fruits
and vegetable crops in the state. 500+ on farm pack houses, 15 Minimal Processing
units, 15 Pre cooling units, 40 Ripening Chambers, 125 Cold Storages, 90 Grading,
Sorting & Packing Units, 8 refer Vans has been supported.
About 40 ripening units have been established in last 3 years in Gujarat with ripening
capacity of 500 Mt/Day. Post-harvest losses were reduced considerably because of

proper ripening and handling. Handling process of Banana is completely changed, now
crates are being filled up at farmers’ fields than transported it to the ripening chambers,
ripened and further transported to the markets as such in the crates. The products are
getting premium prices because of good quality and health consciousness.
The present survey embodies an exhaustive proforma containing substantial
queries from the banana growers. Major aspects are the factors affecting quantum of
banana production and its quality in terms of physical likeness by the consumers and
inherent quality content of the fruit. The other important aspect studied are the
marketing constraints that lead to de track fruit growers from getting the reasonable
price of their produce. This is hoped that Government of India would like to take up
these important issues on priority in the interest of fruit growers through National
Horticulture Mission (NHM) under the umbrella of the Mission for Integrated
Development of Horticulture (MIDH). This is emphasized that MIDH may like to offer a
greater attention for promotion of Farmer Producer Organizations (FPOs) in order to
eliminate intermediaries from the marketing chain so as to enable fruit grower farmers
to fetch reasonable prices of their produce leading up gradation of their income profile.

INDEX
1. Introduction …………………………………………………………….……………………………………………………1
2. Bharuch District Profile…………………………………………..…………………………………………………….6
3. Objectives of the Survey ………………………………………….…………………………………………………...8
4. Survey Materials and parameters …………………………….……………………………………………………9
5. Approach and Modus Operandi …………………………………………………………………………………..10
6. Detailed Analysis Report
a. Farmer Profile …………………………………………………………………………………………….12-15
b. Orchard Details …………………………………………….……………………………………….……16-22
c. Production Statistics ……………………………………………….......………………………………...23
d. Crop Marketing ……………………………………………..……………………………………………24-30
e. Opinion of Farmers on current year Price & Production …….……………………….31-35
f. Production & Marketing Constraints ………………………………….……………………….36-38
7. Major Finding of Survey …………….……………………………………………………..…………………...39-41
8. Projected Support – Recommendations ………………………………………………………………...42-45
9. Interaction with the Farmers ………………………………………………………………………………………46
10. Annexure 1: Survey Questionnaire ………………………………………………………..…………………….47
11. Annexure 2: List Figures and Tables ………………………………………………………..…………………..51
1
Introduction
Banana (Musa sp.) is a large perennial herb with leaf sheaths that form trunk like
pseudostem. Banana has its origin in tropical region of South East Asia. Banana is a nutritious
gold mine. They are high in vitamin B6, which helps fight infection and is essential for the
synthesis of heme, the iron containing part of hemoglobin. They are also rich in potassium and
are a great source of fibre. Banana is a rich source of carbohydrate and is rich in vitamins
particularly vitamin B. It is also a good source of potassium, phosphorus, calcium and
magnesium. The fruit is easy to digest, free from fat and cholesterol. Banana powder is used as
the first baby food. It helps in reducing the risk of heart diseases when used regularly and is
recommended for patients suffering from high blood pressure, arthritis, ulcer, gastroenteritis
and kidney disorders. Processed products, such as chips, banana puree, jam, jelly, juice, wine
and halwa can be made from the fruit. The tender stem, which bears the inflorescence is
extracted by removing the leaf sheaths of the harvested pseudostem and used as vegetable.
Plantains or cooking bananas are rich in starch and have a chemical composition similar to that
of potato. Banana fibre is used to make items like bags, pots and wall hangers. Rope and good
quality paper can be prepared from banana waste. Banana leaves are used as healthy and
hygienic eating plates
Bananas are the fifth largest agricultural commodity in world trade after cereals, sugar, coffee
and cocoa.
Bananas are grown in more than 150 countries, producing 105 million tonnes of fruit per year
of which India contributes 29.19% which is highest in the world. An extent of 99.95% of
this production is consumed within the country itself and only 0.05% production is
exported.
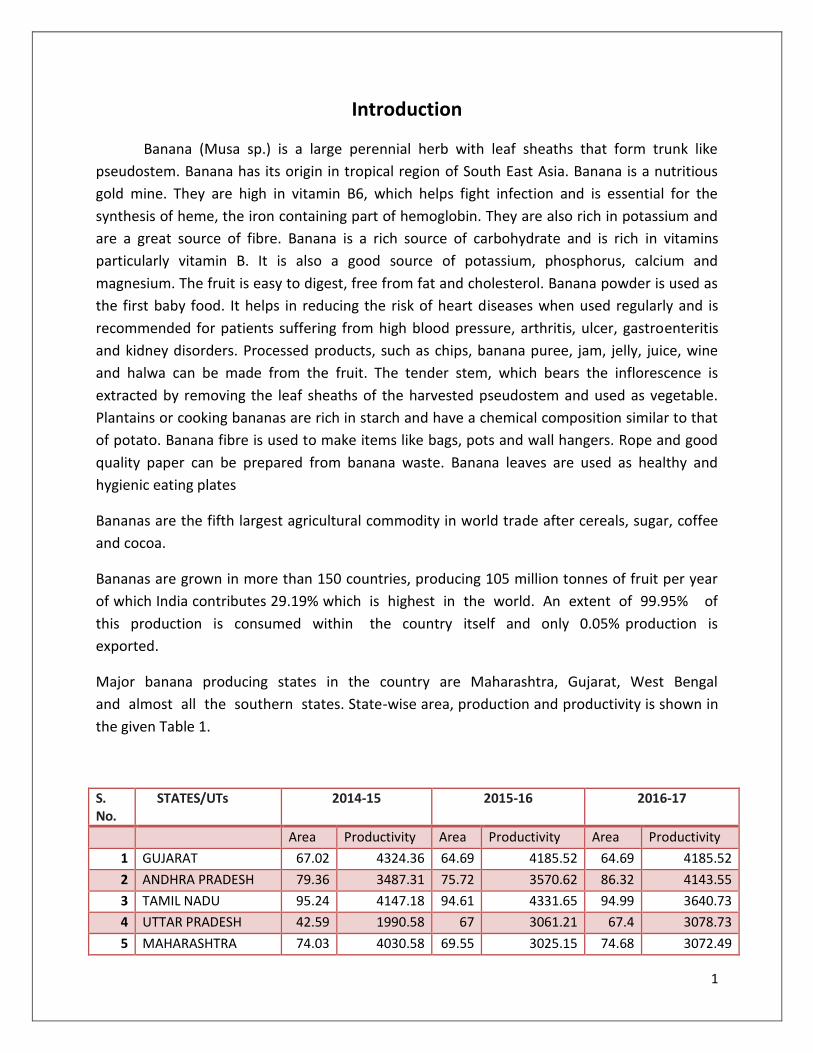
Major banana producing states in the country are Maharashtra, Gujarat, West Bengal
and almost all the southern states. State-wise area, production and productivity is shown in
the given Table 1.
S. No.
STATES/UTs 2014-15 2015-16 2016-17
Area Productivity Area Productivity Area Productivity
1 GUJARAT 67.02 4324.36 64.69 4185.52 64.69 4185.52
2 ANDHRA PRADESH 79.36 3487.31 75.72 3570.62 86.32 4143.55
3 TAMIL NADU 95.24 4147.18 94.61 4331.65 94.99 3640.73
4 UTTAR PRADESH 42.59 1990.58 67 3061.21 67.4 3078.73
5 MAHARASHTRA 74.03 4030.58 69.55 3025.15 74.68 3072.49

2
6 KARNATAKA 102.89 2593.33 96.63 2370.95 101.53 2489.5
7 MADHYA PRADESH 27.8 1836 28.35 1758.05 24.31 1646.89
8 BIHAR 35 1535 34.8 1535.3 35.15 1550.65
9 KERALA 83.98 1270.57 84.56 1292.41 81.51 1224.13
10 WEST BENGAL 46.6 1124 48.07 1172.34 49 1195.6
11 ASSAM 51.28 865.67 51.1 882.71 55.42 979.34
12 CHHATISGARH 23.87 564.43 25.76 587.42 27.06 618.92
13 ODISHA 24.76 469.25 24.47 462.71 24.49 466.62
14 TRIPURA 13.99 141.31 14.62 153.62 14.47 152.08
15 TELANGANA 8.95 325.52 4.65 183.7 3.88 143.88
16 MIZORAM 10.87 141 10.91 141.03 10.94 141.04
17 NAGALAND 7.32 109.8 7.25 108.51 7.34 116.72
18 MEGHALAYA 7.06 88.7 7.11 88.71 7.24 94.32
19 MANIPUR 6.99 94.22 6.95 93.95 6.65 89.86
20 ARUNACHAL PRADESH
6.5 20 5.42 31.64 5.48 31.96
21 JHARKHAND 0.54 1.3 12.53 33.28 9.02 31.47
22 PUNJAB 0.13 7.51 0.11 6.43 0.12 6.72
23 SIKKIM 0 0 1.15 3.56 1.2 3.87
24 RAJASTHAN 0.03 0.25 0.03 0.41 0.04 0.41
25 HIMACHAL PRADESH 0.09 0.29 0.09 0.42 0.09 0.35
26 OTHERS 4.92 53.31 5.03 53.55 5.08 57.19
SOURCE: DEPARTMENT OF HORTICULTURE COOPERATION AND FARMERS WELFARE; AREA IN ‘000HA, PRODUCTION IN ‘000MT
Table1: State-wise production of Banana in India
The geography & climate of Gujarat is very unique and blessed with various natural resources. Gujarat is located on the west coast of India with longest sea coast of 1600 km of the Arabian Sea. It is situated between 20°1’& 24°7’ North Latitude and 68°4’to 74°4’East Longitude covering geographical area of 196 lakh hectares, which is six percent of the country. State comprised of 33 Districts having 246 Taluka and 18569 villages. Gujarat has tropical & sub-tropical climate, with temperature ranging from a minimum of 13°C to 27°C in January and maximum of 45°C in May- June. The normal annual rainfall of Gujarat State is 852mm, however there is a wide annual variation in rainfall, affecting the productivity of the crops. The climate favours for development of fresh fruits like; Kesar- alphanso mangoes, Sapota, Banana, Aonla and Dates. The vegetables like; Okra, Beans, Cucurbits, Onion, Potato, the spices like cumin, Fennel, Chilly, Coriander, Garlic and Flowers like Rose, Lily, Marigold, Jasmine and Tuberose. Grape, Cashewnut, Medicinal & Aromatic crops like Aloevera, Palmarosa are emerging as potential new crops in suitable areas of the state.

3
The agro-climate can be categorized as very heterogeneous as the State constitutes about 24.94 per cent of arid and 33.66 per cent of semi-arid areas of the country (Next to Rajasthan). Vast area of Saurashtra and Kutch falls under arid to semi-arid (potential evapo-transpiration 1873 mm) and rainfall is low (761 mm) and erratic (co-efficient of variation 55 per cent). Agro climate of the state divided in to eight sub regions in respect of rainfall, temperature, humidity and geographical situation. There are about 47.38 lakh operational holders operating about 99.79 lakh ha. land as per the agri-census report. According to holding classification, 34.01 lakhs are marginal (Less than 1 ha.) 28.86 lakhs are small (1 to 2 ha.) 35.67 lakhs are semi medium and medium and 1.45 lakhs are large farmers respectively.
Horticulture is a priority sector in agriculture by virtue of it’s vast potential in improving the socio economic condition of the farmers. Considerable growth in area coverage and production has been observed. Area and production of horticultural crops has increased by 220 % and 330 % respectively from the year 2001-02 up to year 2013-14 after intensification of Horticulture Development program in the state. An average 20.89 % annual production growth was achieved during this period. State contributes 10.19% share in national fruit production and 6.49 % in national vegetable production (NHB data of Year 2012-13) that has been increased from 6.20 % and 3.70 % respectively in comparison to year 2001-02. State is second leading state in spice crop production, fourth leading state in the fruit production and sixth leading state in the vegetable production in the country. Production of spices is about 8.82 lakh MT/ Annum, fruit crops is about 77.63 Lakh MT/Annum and production of vegetables crops is 100.50 Lakh MT/Annum. Gujarat state is 1st in the production of Cumin, Fennel and Date palm, 2nd in production of Banana, Papaya and lime. Productivity of Onion, Potato is highest in the country where productivity of Banana, pomegranate and sapota is 2nd highest in country. About 12% area is covered under horticultural crops in the state. However horticultural crops contribute 25-30 % in the total farm income (Including Animal husbandry). Role of Horticulture sector is remarkable in the overall agriculture growth of the state. In Gujarat, during the year
2013-14 banana crop is cultivated in an area of about 66496 ha. & having production of 42.25
Lakhs tons with productivity of 63.55 MT/Ha. which is highest in the country. Precision farming
technology has been adopted to ensure good quality and highest productivity in the country,
about 34 tissue culture laboratories has been established in the state that provides good planting
materials. Efficient use of water and fertilizer with drip irrigation, becoming popular among the
farmers of Gujarat.

4
District Profile of Bharuch Bharuch district is an important district in South Gujarat region and one of the major industrialized zone of the Gujarat. It is flanked by the Arabian Sea on the west, new district Narmada in East, Vadodara in North and in South Surat district of the state.
The total geographical area of the district is 6527 km2. For administrative convenience, the district has been divided into 8 talukas and 543 gram panchayats with 663 villages. Agriculture is still the main source of livelihood for the rural people of the district. The district lies between 21.30° to 22.00° N latitude and 72.45° to 73.15° E longitudes situated at 16.5 m above sea level and bounded by Arabic sea in the west. The district has semi-arid climate with three distinguished seasons i.e. kharif (June to September), winter (October to January) and summer (February to May). The district receives the rainfall through South-West monsoon which normally starts from middle of July, August and September are the months of heavy rainfall. The average rainfall varies from 900 mm to 1100 mm. however, scanty and uneven rainfall pattern is also common. The temperature varies from 8.9°C to 43.2°C. The average minimum temperature is 10.7°C and maximum temperature 41.4°C. The December and January are the coldest months while April and May are the hottest months of the year. Relative humidity is higher in coastal areas. The wind velocity varies from 5.35 km/hr to 7.28 km/hr. The summers are very hot when temperature ranges from 38° to 44°C for couple of days. Table 1 shows the weather of different taluka places of the Bharuch district, whereas Table 2 shows distribution of rainfall during monsoon, which mainly impacts kharif and rabi cropping seasons.

5
Physiography & Soils Bharuch district can be divided into three regions geographically, topographically and economically as well as from the resources point of view. The three regions are as under: (1) Eastern Region:- This portion of the district comprise of Jhagadia (AES - III) and Valia (AES - I) talukas. The region is partly covered with forests and has also a mountain range. It is inhabited by scheduled tribes and is declared as tribal areas. The region is having good agriculture potential. (2) Western Region:- The western Region known as “BHARAVIBHAG” consists of Jambusar (AES - IV), Vagra (AES - V) and Amod (AES - V) talukas. This Region has 54 miles coastal line at the Gulf of Cambay. (3) Central Region:- The central Region of the district covers Ankleshwar (AES - III), Bharuch (Dahej as a chemical zone) (AES-V) taluka which are industrially well developed. The oil fields of Ankleshwar (AES - III) and Vagara (Gandhar) (AES-V) have put Gujarat on the oil map of India. The black soil of this region is very fertile and is conducive to cotton and pigeonpea crop production. According to climate, topography, soil characteristics and cropping pattern Bharuch district lies in South Gujarat Agro Climatic Zone II, the zone is further classified into four Agro Ecological situations, mainly on the basis of Physiography and soil texture.
District at a Glance
No. of blocks 08
Total villages 663
No. of gram Panchayats 543
Total Population 1370656
Male population 713676
Female population 655957
SC/ST population 505534
SC./ST male population 272431
SC/ST Female population 233103
Total literacy (%) 74.05
Male (%) 83.00
Female (%) 65.10
Total geographical area (ha) 524683
Net cultivated area (ha) 287263
Gross cropped area (ha) 301213
Cropping intensity (%) 112
6
No. of farm families 126053
Marginal farmers (0-1 ha) 39828
Small farmers (1-2 ha) 32475
Semi medium to Large farmers 53750
The cropping intensity of the district is 112% that appears to be less because large portion of cultivable area is under rainfed farming. Appendix 1 and 2 depict maps of wasteland and watershed activities respectively of the district. The area under forests in the district is around 4.7 % that is mostly on the western parts of the district.
There is ample scope for increase of production levels further as the adoption of
scientific production technology and post harvest methodology and marketing appeared to
show large gaps as evident from a study done in a sampled pocket of the country. The
technology gaps showed an extent of 98.33% in the use of micronutrients, 89% in
growth regulators and 80% in intercropping, The mean over gaps estimated was about
30%. Market analysis showed that domestic marketing was largely in the unorganized
sector till recently. To understand these gaps in the entire process, the study and analysis of
entire value chain for banana crop is required.
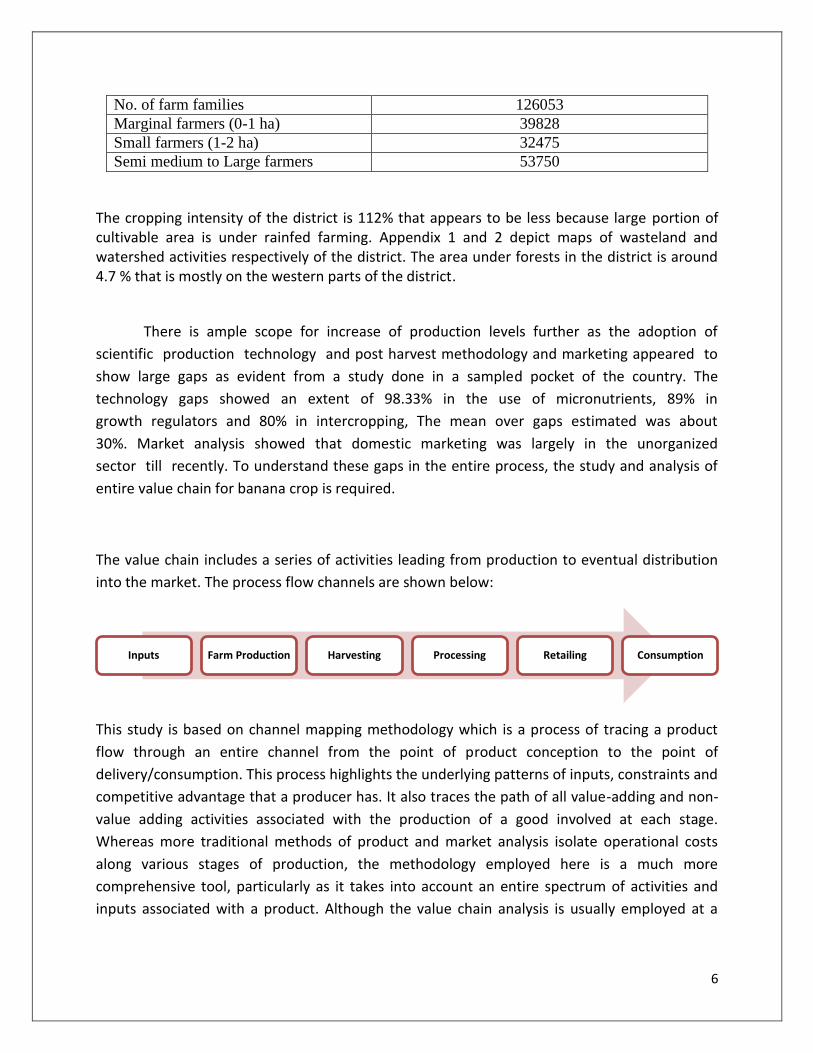
The value chain includes a series of activities leading from production to eventual distribution
into the market. The process flow channels are shown below:
This study is based on channel mapping methodology which is a process of tracing a product
flow through an entire channel from the point of product conception to the point of
delivery/consumption. This process highlights the underlying patterns of inputs, constraints and
competitive advantage that a producer has. It also traces the path of all value-adding and non-
value adding activities associated with the production of a good involved at each stage.
Whereas more traditional methods of product and market analysis isolate operational costs
along various stages of production, the methodology employed here is a much more
comprehensive tool, particularly as it takes into account an entire spectrum of activities and
inputs associated with a product. Although the value chain analysis is usually employed at a
Inputs Farm Production Harvesting Processing Retailing Consumption

7
product level, output from the analysis provides useful indicative data on production and
operational costs associated with a specific market.
National Horticulture Mission (NHM) has set forth major activities to be undertaken by
itself in the interest of intensifying production and improving quality of banana fruit
which includes production and distribution of planting material (modal and small
nurseries, tissue culture units), area expansion (through establishment of new gardens),
rejuvenation of existing old and senile gardens, production of vegetable seeds, seed
infrastructure, protected cultivation,
IPM/INM, organic farming, pollination support through bee keeping, development of
marketing infrastructure (wholesale markets, rural markets and 2 functional
infrastructure), Post Harvest Management (pack houses, cold storages, refrigerated vans,
mobile/primary processing units) and human resource development.
A proper supply chain management in fruits and vegetable other horticulture crops is required
to improve all the stages of the supply by adopting best global practices in storage packaging,
handling, transportation, value added service etc to meet the country’s demand of fruits and
vegetable. Due to drawbacks in current supply chain, high level of wastage, quality degradation,
poor infrastructural facilities and high cost. Government and private operators have to join
hands to improve the physical infrastructure, information sharing and the service required for
quality improvement of the supply chain.
Therefore, Govt. of India MIDH Division has directed HIL to carry out survey of various channels
in the supply chain and put up the report indicating the current practices adopted by the these
channels. The purpose of the study is to know the gaps between the agricultural produce till it
is reaching to end consumer.

8
Objectives of Survey
The main objectives of the studies are as follows:-
To understand on-farm and off-farm constraints.
To identify the factors affecting supply chain of Fruits & Vegetables.
Maximize growers gains/income.
Minimize processing loses and value addition in supply chain of Fruits & Vegetables.
Reducing the number of intermediaries in the supply chain of Fruits & Vegetables.
To suggest mitigation strategies for the identified challenges in Supply Chain of Fruits &
Vegetables.

9
Survey Materials and Parameters
A survey with the aforementioned objectives was under taken by us under the directives of
Hindustan Insecticides Limited (HIL). The survey was based in Bharuch District of Gujarat.
Banana was selected as the commodity for studying value chain analysis in Bharuch, Gujarat as
it is one of the major banana producing district of the state.
A total of 3088 surveys of farmers and traders were conducted in Bharuch district of Gujarat.
The distribution is given below.
State District Commodity No. of Farmers Surveyed
No. of Traders Surveyed
Total Surveys
Gujarat Bharuch Banana 2863 125 3088
A total of 15 villages were selected in consultation with State Agriculture Department, Gujarat
for conducting this survey based on the average number of banana farmers in the villages.
Surveyors with marketing and agricultural background and experience were selected for this
survey.
Frequency of answer to a particular question in the questionnaire was computed and the
percentage of frequency out of persons interrogated was also computed in order to present the
result of the survey. Calculation of frequency and percentage as mentioned above was done on
all India basis and the results and conclusion are given.

10
Approach and Execution
Approach:
Controlling Mechanism:
SELECTION CRITERIA ON LOCATION & ROUTE MAPPING
Identification of the villages in consultation with state horticulture department
Selection of villages showing substantial banana production
To collect a survey of different farmers in a village
IDENTIFICATION & TRAINING
Identification of local team
Providing them a day training
Educating them what is the importance of the questionnaire and how it is to be filledMandates post filling up the survey( complete form filled by the farmer, attestation by the farmer( Signature /thumb impression), ID Proof, Photograph
EXECUTION & MONITORING
Placement of Supervisors to check the execution of the field team
Field Monitors/ back checkers on the quality check of the filled forms
Train the team if additional training is required
PROJECT MANAGER
Responsible in project planning & control & bridge between field team & client
SUPERVISORS
To check on the field Execution
SURVEYORSTo get the forms filled from the farmers & educating the farmers on the importance of the survey and to collect the necessary document
post survey
BACK CHEKERS
To check on the quality of Job &
provide field training if required
MIS TEAM
Data Compilation & Report analysis
generation
AGRICULTURE SPECIALIST
Training the field team on the technicalities & final report submission analysis

11

12
FARMERS’ PROFILE

13
Farmers’ Profile
Education Profile of the Farmers
Education Education Profile of Farmers
%
Post Graduate 9 0
Graduate 87 3
Primary 513 18
Secondary 577 20
No Schooling 757 26
Higher Secondary
920 32
Total 2863 100
Figure 1: Education Profile of Farmers Table 3: Education Profile of Farmers
Results for education profile of the farmers engaged in banana cultivation indicated that
frequency and percentage of higher secondary school qualified farmers were greater
than any one standard of education. This indicated a gradual step up in education in
agricultural sector since the beginning of the independent era.
Age Profile of the Farmers
Figure 2: Age Profile of the Farmers surveyed
3%
32%
20%18%
26%
0
200
400
600
800
1000
1200
Graduate HigherSecondary
Secondary Primary NoSchooling
Education Profile of Farmers
0% 5%
17%
24%
20%
34%
Age Profile of Farmers (Years)
25-35
35-45
45-55
55-65
65-75
14
Age Post Graduate
Graduate Primary Secondary No Schooling
Higher Secondary
Total
25-35 0 34 123 176 150 248 731
35-45 6 21 125 165 236 248 801
45-55 1 17 133 134 196 230 711
55-65 1 11 92 75 128 141 448
65-75 1 4 40 27 47 53 172
Total 9 87 513 577 757 920 2863
Table 4: Age group – Education profile of the farmers
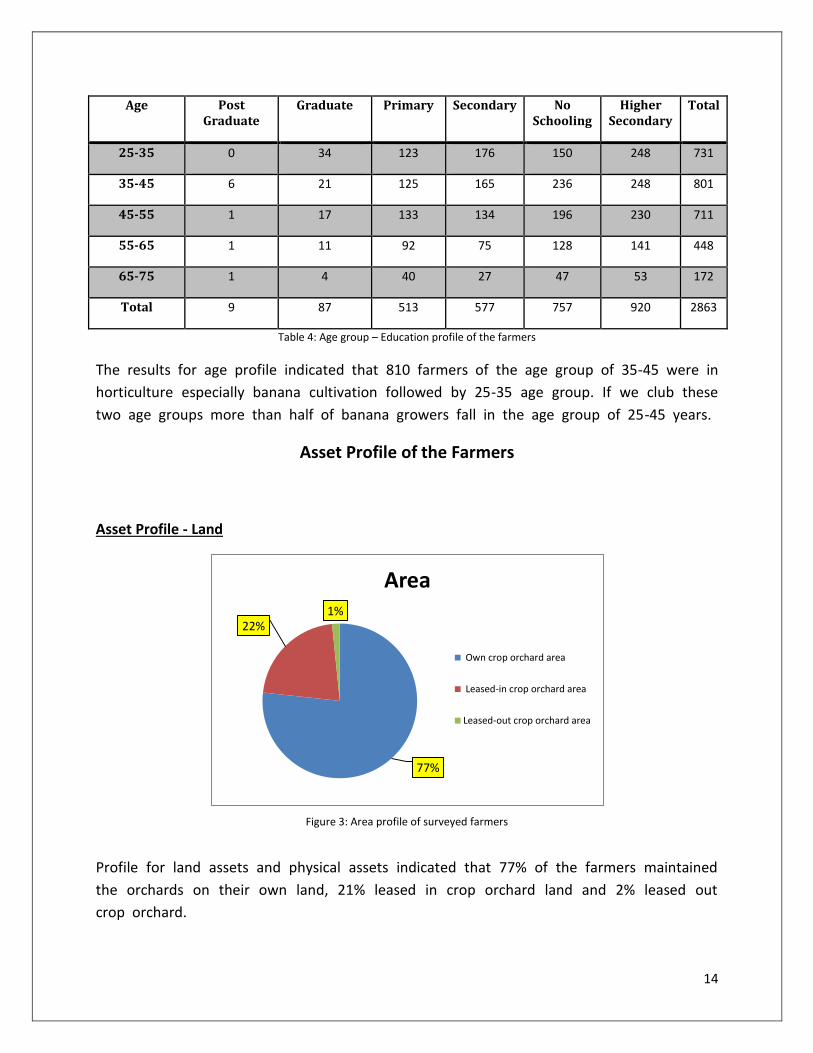
The results for age profile indicated that 810 farmers of the age group of 35-45 were in
horticulture especially banana cultivation followed by 25-35 age group. If we club these
two age groups more than half of banana growers fall in the age group of 25-45 years.
Asset Profile of the Farmers
Asset Profile - Land
Figure 3: Area profile of surveyed farmers
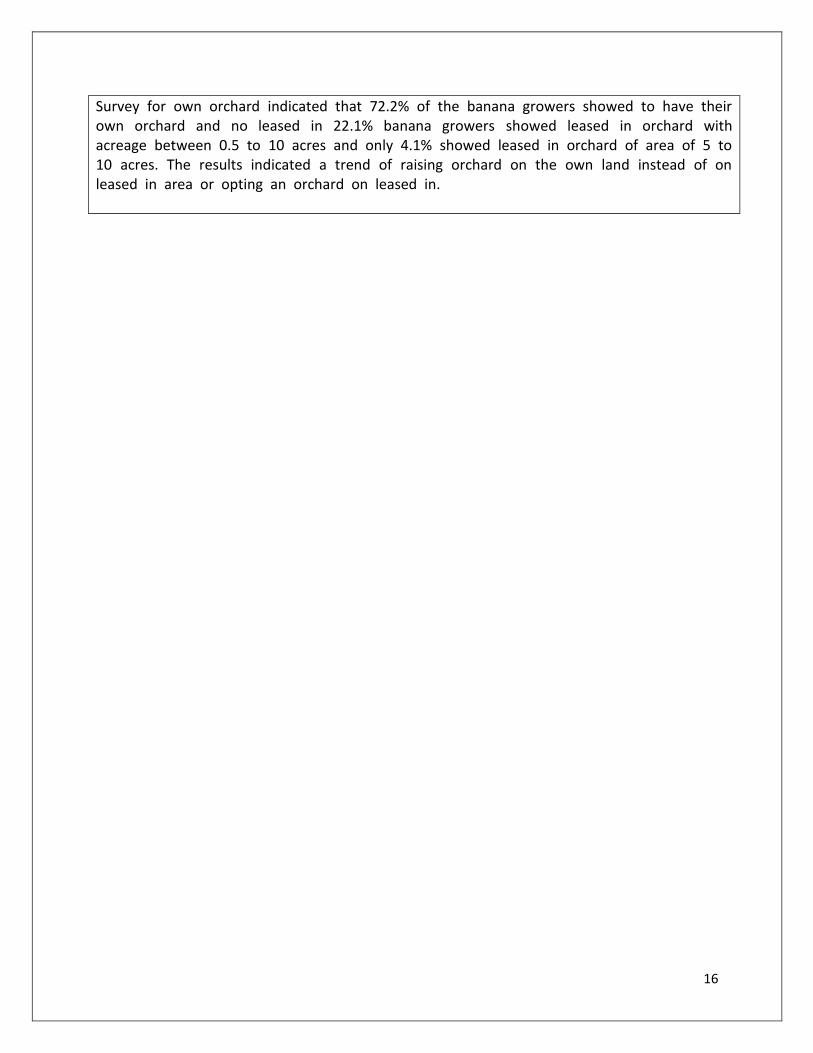
Profile for land assets and physical assets indicated that 77% of the farmers maintained
the orchards on their own land, 21% leased in crop orchard land and 2% leased out
crop orchard.
77%
22%1%
Area
Own crop orchard area
Leased-in crop orchard area
Leased-out crop orchard area

15
Asset Profile - Physical
Figure 4: Asset profile of surveyed farmers
As shown in above diagram, Profile for physical assets indicated that only 5% farmers showed having pick up van with them and none of the farmers could show to have tractors for cultural operations. Reason could be insufficient affordability due to financial stress.
Land Profile of the Farmers
Figure 5: Distribution of farmers under different land holding groups
Figure 6: Farmers under different groups of leased-in orchard area
Results for area under cultivation possessed by the farmers indicated that large percentage of farmers were found to be small to marginal farmers as area under cultivation to be 0.5 to 10 acre showed by 92.5% of the growers. This was followed by 5.1% farmers holding 10 to 20 acres cultivated land.
5%0%
95%
Physical Asset Profile
Tractor
Pick-up van/truck
None
82.1%
10.3% 5.1% 2.4%0
500
1000
1500
2000
2500
Below 5Acres
5 to 10 Acres 10 to 20Acres
Above 20Acres
Area Under Cultivation
72.2%
22.1%
4.1% 1.3% 0.3%0
500
1000
1500
2000
2500
No LeasedIn
Below 5Acre
5 to 10Acre
10 to 20Acre
Above 20Acre
Leased in crop orchard area
16
Survey for own orchard indicated that 72.2% of the banana growers showed to have their own orchard and no leased in 22.1% banana growers showed leased in orchard with acreage between 0.5 to 10 acres and only 4.1% showed leased in orchard of area of 5 to 10 acres. The results indicated a trend of raising orchard on the own land instead of on leased in area or opting an orchard on leased in.

17
ORCHARD DETAILS

18
Orchard Details
Figure 7: Type of Orchard planted by farmer Figure 8: Year of Plantation of Orchard
Results on orchard types indicated 86% having their own, leased in orchard followed by
16% shared orchard. The trend indicated that banana growers, in general, do not like
orchards in sharing. Year of orchard plantation indicated 62.6% growers planted their
orchard in 2017 only, 32.8% in 2016 and 1.9% in 2015 and so on.
Figure 9: Plantation cost of the orchard Figure 10: Current Value of Orchard
Looking into the figure is very clear that there is very good uprising trend in farmers to turn into banana growers. This is also evident by the figure 9 that 37.1% farmers spent Rs. 50,000 to Rs. 1,00,000 each to raise their orchard followed by 31.3% who spent between Rs. 30,000 to 50,000. This trend indicated that farmers were convinced that banana cultivation was a good remunerative cultivation. Current value of orchard figure 10 indicated that there were 39.9% banana growers whose orchards’ value was between Rs. 20,000 to Rs. 50,000 followed by 37.1% with value of orchard Rs. 50,000 to 1 lakh. This indicated that a majority of banana growers were having small to medium valued orchard. The whole orchard details are indicative of rising prosperity of farmers.
86%
14% 0%
Type of orchard
Own
Own, Leased In
Share
62.6%
32.8%
1.9% 0.9% 1.7%0
500
1000
1500
2000
2017 2016 2015 2014 2013
Year of Plantation
3.9% 1.2%
11.6%
31.3%37.1%
14.9%
0
200
400
600
800
1000
1200
Below Rs.5,000
BetweenRs. 5,000
to Rs.10,000
BetweenRs. 10,000
to Rs.30,000
BetweenRs. 30,000
to Rs.50,000
BetweenRs. 50,000
to Rs. 1Lac
Avove Rs.1 Lac
Planting Cost
5.3%
39.9%37.1%
17.0%
0.7%
Below Rs.20,000
Between Rs.20,000 to Rs.
50,000
Between Rs.50,000 to Rs.
1 Lac
Between Rs.1 Lac to Rs. 5
Lac
Above Rs. 5Lac
Current Value of Orchard
19
Trees and Production
Figure 11: Number of total trees planted in orchard by the farmers
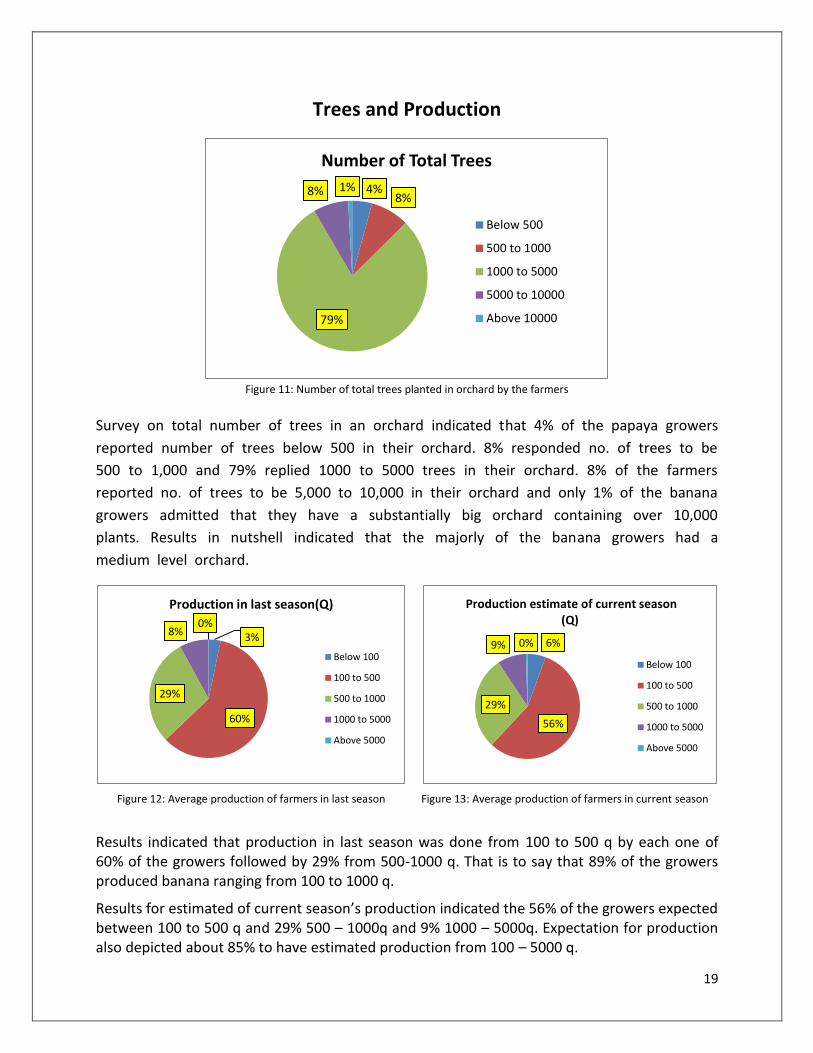
Survey on total number of trees in an orchard indicated that 4% of the papaya growers
reported number of trees below 500 in their orchard. 8% responded no. of trees to be
500 to 1,000 and 79% replied 1000 to 5000 trees in their orchard. 8% of the farmers
reported no. of trees to be 5,000 to 10,000 in their orchard and only 1% of the banana
growers admitted that they have a substantially big orchard containing over 10,000
plants. Results in nutshell indicated that the majorly of the banana growers had a
medium level orchard.
Figure 12: Average production of farmers in last season Figure 13: Average production of farmers in current season
Results indicated that production in last season was done from 100 to 500 q by each one of 60% of the growers followed by 29% from 500-1000 q. That is to say that 89% of the growers produced banana ranging from 100 to 1000 q.
Results for estimated of current season’s production indicated the 56% of the growers expected between 100 to 500 q and 29% 500 – 1000q and 9% 1000 – 5000q. Expectation for production also depicted about 85% to have estimated production from 100 – 5000 q.
4%8%
79%
8% 1%
Number of Total Trees
Below 500
500 to 1000
1000 to 5000
5000 to 10000
Above 10000
3%
60%
29%
8%0%
Production in last season(Q)
Below 100
100 to 500
500 to 1000
1000 to 5000
Above 5000
6%
56%
29%
9% 0%
Production estimate of current season (Q)
Below 100
100 to 500
500 to 1000
1000 to 5000
Above 5000
20
Orchard Maintenance
Figure 14: Various factors under orchard maintenance practiced by surveyed farmers
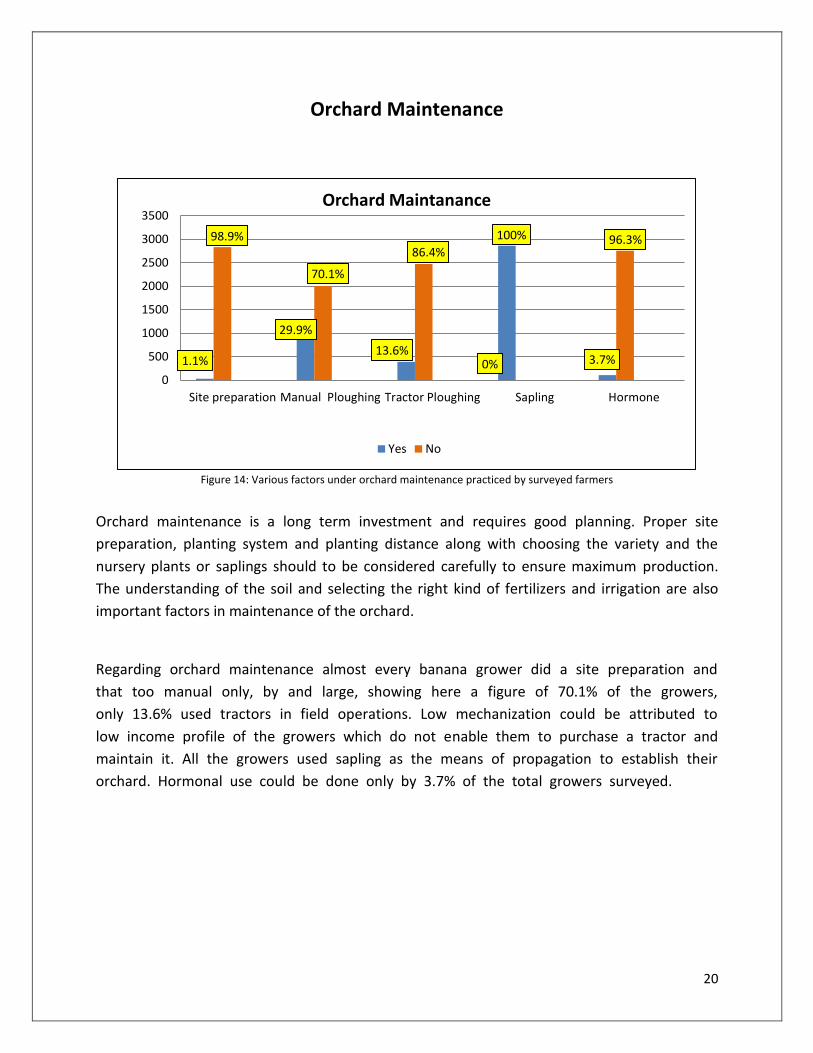
Orchard maintenance is a long term investment and requires good planning. Proper site
preparation, planting system and planting distance along with choosing the variety and the
nursery plants or saplings should to be considered carefully to ensure maximum production.
The understanding of the soil and selecting the right kind of fertilizers and irrigation are also
important factors in maintenance of the orchard.
Regarding orchard maintenance almost every banana grower did a site preparation and
that too manual only, by and large, showing here a figure of 70.1% of the growers,
only 13.6% used tractors in field operations. Low mechanization could be attributed to
low income profile of the growers which do not enable them to purchase a tractor and
maintain it. All the growers used sapling as the means of propagation to establish their
orchard. Hormonal use could be done only by 3.7% of the total growers surveyed.
1.1%
29.9%
13.6%
100%
3.7%
98.9%
70.1%
86.4%
0%
96.3%
0
500
1000
1500
2000
2500
3000
3500
Site preparation Manual Ploughing Tractor Ploughing Sapling Hormone
Orchard Maintanance
Yes No

21
Figure 15: Different types of fertilizers and spray used by the farmers
As far as the use of fertilizers is concerned, all the surveyed farmers used fertilizers.
Results for fertilizer/spray usages by the farmers indicated that about 80% of the banana
growers used chemical fertilizers for example urea and DAP and non-chemical organic
manures were applied by about 20% only. Chemical pesticides were used by 77% of the
banana growers and only 23% did not use chemical pesticides. This is important to
mention here that in general, there is a need of creating awareness in the growers
regarding hazards of chemical fertilizers and pesticides and promoting INM and IPM
packages.
Irrigation Methods Adopted by Farmers
Figure 16: Different types of Irrigation method used by the surveyed farmers
79.57%
20.43%
76.95%
23.05%
0
500
1000
1500
2000
2500
3000
3500
Urea, DAP, Zinc Others Chemical Non Chemical
Fertilzer Spraying
Fertilizer & Spray Usage of Farmers
79%
17%
3%1%
0%
Irrigation Methods Adopted by Farmers
Electric Tubewell
Diesel tubewell
Drip
Well
Sprinkler

22
The total water requirement of banana plants is about 900-1200 mm for its entire life cycle and
this can be met both through natural precipitation (rainfall) as well as supplementary irrigation.
Maintaining optimum moisture at all stages of growth is very critical and providing good
drainage facility to drain out excess water from the root zone equally important to promote
better growth and enhance the productivity.
Results for type of irrigation indicated that a large proportion of banana growers used
electric tube well to an extent of 79% of the total farmers surveyed followed by diesel
tube well opted by 17% then 3% by drip irrigation, 1% by well and nobody used
sprinkler irrigation. This is to note in this context that electricity and diesel consumption
may be much expensive as banana is a water loving fruit, requires frequent and greater
quantity of water for irrigation. This is, therefore, suggested that a drip irrigation may
be popularized so as to reduce quantity of water per irrigation which would economise
the use of electricity/diesel and would reduce cost of production.
Usage of Labour
Figure 17: Different types of labour used by the farmers on their farms
Labour is an important input entering the production process. Agriculture also provides a lot of
employment to labour in our country. But extensive use of labour in production process also
increases the time and cost of production. Machineries such as tractor can reduce the time and
cost of the production and thus improve profit margins for the farmers.
41%
41%
18%
Labour
Family Labour
Casual Labour
Permanent Labour

23
As regards use of labour permanent labours were employed by a short section (18%) of
the banana growers surveyed. Casual labours and own family used as family labours
contributed equally, 41% each on the cultivation and disposal of banana crop. This
implies that by nature a banana grower want to economise production cost, therefore,
almost all family members residing together in the village like to work in their own
fields. Casual labours are employed need based fewer or more as per requirement of
the crop at a particular stage.

24
Production & Consumption
Figure 18: Production of Banana
This could be evident from the survey that 100 to 500 quintals banana producers were
in greater proportion to an extent of 56% followed by 500 to 1000 quintal producers,
29%. On summing these two categories it is very much clear that 85% banana growers
produced banana ranging from 100 to 1000 quintals. We may say that a large
proportion of banana growers fall into lower middle class famer to upper middle class
farmer as regards quantum production of banana only.
Figure 19: Production Statistics
Results for production statistics indicated that 93.9% of the total production is sold,
meaning thereby, they use it as cash crop. Since, banana production is localized in some
parts of the country and self consumption is very less by the growers as 0.3% only in
Gujarat, the production, therefore, is available well for distributive sale in different parts
of the country for consumption. The protection of the produce, therefore, is very much
important issue in order to save it from decay due to fungal/bacterial infection.
6%
56%
29%
9%
0%
Production of Banana
Below 100
100 to 500
500 to 1000
1000 to 5000
Above 5000
100%93.9%
5.8%0.3%
Total Production Total Sold Wastage Self Consumption
Production and Consumption

25
CROP MARKETING
26
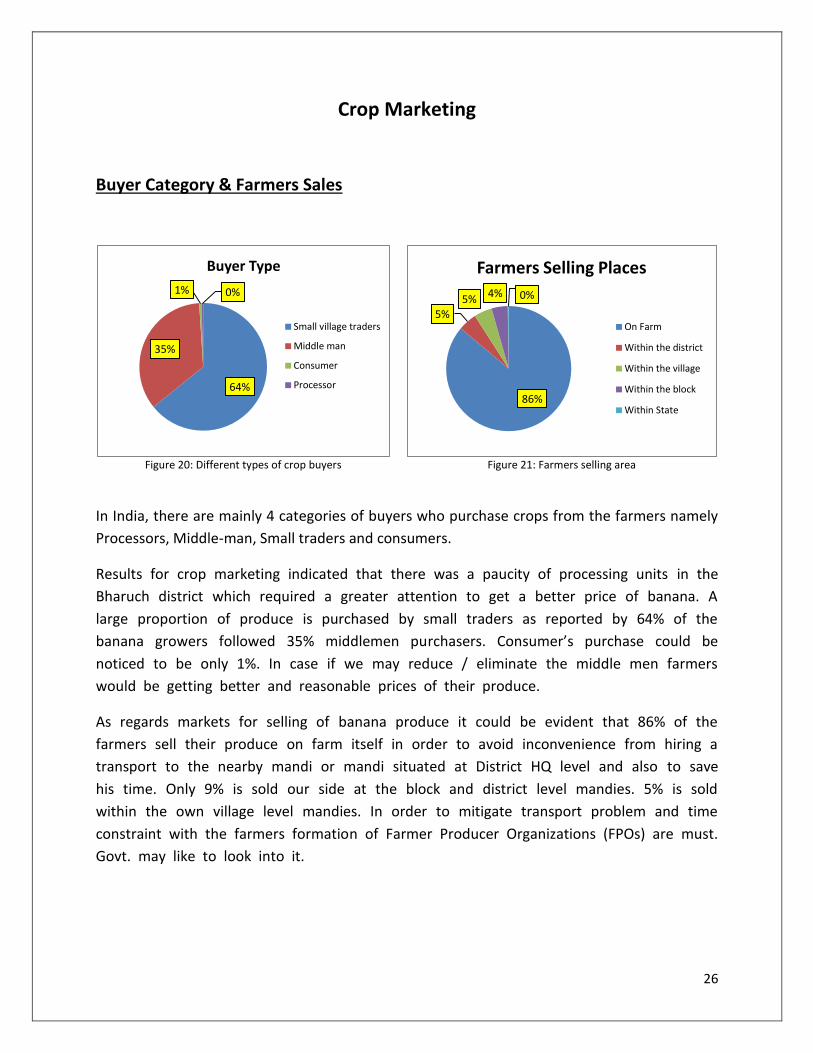
Crop Marketing
Buyer Category & Farmers Sales
Figure 20: Different types of crop buyers Figure 21: Farmers selling area
In India, there are mainly 4 categories of buyers who purchase crops from the farmers namely
Processors, Middle-man, Small traders and consumers.
Results for crop marketing indicated that there was a paucity of processing units in the
Bharuch district which required a greater attention to get a better price of banana. A
large proportion of produce is purchased by small traders as reported by 64% of the
banana growers followed 35% middlemen purchasers. Consumer’s purchase could be
noticed to be only 1%. In case if we may reduce / eliminate the middle men farmers
would be getting better and reasonable prices of their produce.
As regards markets for selling of banana produce it could be evident that 86% of the
farmers sell their produce on farm itself in order to avoid inconvenience from hiring a
transport to the nearby mandi or mandi situated at District HQ level and also to save
his time. Only 9% is sold our side at the block and district level mandies. 5% is sold
within the own village level mandies. In order to mitigate transport problem and time
constraint with the farmers formation of Farmer Producer Organizations (FPOs) are must.
Govt. may like to look into it.
64%
35%
1% 0%
Buyer Type
Small village traders
Middle man
Consumer
Processor
86%
5%5% 4% 0%
Farmers Selling Places
On Farm
Within the district
Within the village
Within the block
Within State

27
Transportation
Survey regarding mode of transportation indicated 86.3% transport on foot only, 6.6% by
private pickup and 6.3% by tractor. With the objective of economise the cost of
production farmers, by and large, use himself / casual labour as a means of
transportation. Consequently, farmers avoid long distance markets. Govt. may like to look
into it as the formation of FPOs is the best out of the promising answers.
Figure 22: Different modes of transportation used by farmers Figure 23: Farmer’s travelling distance to selling point
Results regarding travelling distance to selling point indicated that 91% of the banana
producers like to sell their produce within 5 km of distance on account of primitive
means of transport ie. his own feet and or at the most by hiring local van. Only 9% of
the farmers sell somehow in the markets situated within 10 km distance. Govt’s help in
purchase of vans may be rendered to farmers.
Packaging
Packaging is defined as a mean or system by which a fresh produce travel between buyers in a
safe and sound condition minimizing the wastage and damages and the quality of the products.
Packaging of fresh fruits is one of the most important step in the long and complicated journey
from grower to consumer. Various bags, baskets and other packaging materials are used for
handling, transporting and marketing fresh produce.
The use of properly designed containers for transporting and marketing of vegetables can
significantly reduce their losses and maintain their freshness succulence and quality for longer
period. Packaging also provides protection from mechanical damage and undesirable
86.3%
6.6% 6.3%0.7%
0
500
1000
1500
2000
2500
On-foot PrivatePickup
Van/Truck
Tractor Others
Transportation Mode
91%
9%
0% 0% 0%
Travelling Distance to Selling Point (in km)
Less than 5 kms
More than 10 kms
More than 50 Kms
More than 100 Kms
More than 50kms

28
physiological changes and pathological deterioration during storage, transportation and
marketing.
Figure 24: Types of packaging baskets used by the farmers
Most of the farmers, 42%, leave the banana bundle without any kind of packaging.
Plastic (food grade) baskets and bamboo baskets were used by 23% and 13% of the
farmers respectively. Jute bags were used by 7% of the farmers. Unsafe means i.e.
recycled plastic baskets were used in packing by 15% of the farmers. Recycled plastic
baskets lead to readily decay/rotting of the packed banana. Farmers may be financially
helped by offering subsidy to purchase food grade plastic baskets, bamboo baskets and
jute bags.
How is the Price Fixed?
Figure 25: Who decides the price of the produce?
42%
23%
15%
13%
7%
0%
Type of Packaging Baskets Used by Farmers
Open bundle
Plastic(foodgrade)
Plastic(recycled)
Bamboo
Jute Bag
Metal
75%
15%
10%
How is price fixed ?
Buyer Decides
As per Mandi Price
Seller decides

29
The prices of the farm produce are mostly fixed by middleman or traders who buy and sell the
commodities in mandis.
As far as price is concerned, Fixation of price part of the horticultural produce by buyers is
a very shameful issue. It has to be addressed by the Govt. very sincerely and very
seriously. Glaring results may be looked in this survey as the 76% respondents of
Bharuch districts reported that buyers are price fixers. In this context formation, and
establishment of functional FPOs is one of the potent replies.
Government of India can play an important role of being a regulatory authority in these mandis
so that the buyers/middle men are bound to purchase farmers produce at a reasonable price.
Farmers Difficulties in Selling Crop
Figure 26: Did farmers have difficulties selling your crop
during last season? Figure 27: Did the farmers search for new crop buyers in this
season?
Regarding difficulties in selling the crop produce in the last season 79% reported no
difficulties as the farmers, by and large, opted to sell on farm itself to the small traders
as explained earlier. However, 53% of the farmers tried to search new buyers in order
to fetch a better price.
79%
21%
Farmers difficulty in selling crop
No
Yes47%
53%
Did the farmers search for new crop buyers in this season?
No
Yes

30
Crop Production Expansion
Increase in Crop Production in Last 5 Years
Figure 28: Increase in production of banana crop in last 5 years
Almost 44% of the farmers have increased their banana production in last 5 Years.
Figure 29: Reasons for increase in production Figure 30: Reasons for decrease in production
Results for increasing trend of in the production during last 5 years indicated the 56%
of the respondents admitted an increase. This increase in production trend is in
conformity with increase of banana production trend at the country level.
44%
56%
Increment in Production in last 5 Years
No
Yes
57.77%
25.74%
16.49%
0
200
400
600
800
1000
Better Orchardmainteanance
New Orchard Others
Reasons for Increase in Production
54.63%
17.97% 15.86%
5.57% 5.97%0
200
400
600
800
Lack ofCapital
Lowerprices of
crop
Scarcity ofLabour
Lack ofAssuredMarket
Others
Reasons for Decrease in Production

31
Planning for expansion of Crop Production
Figure 31: Number of farmers planning to expand their crop production
Almost 48% of the farmers are planning to increase their banana production
Figure 32: How are farmers planning to expand crop
production Figure 33: Why are farmers not planning to expand crop
production
As per the survey it could be evident that developing new orchard and better maintenance of
existing orchard were the major means to increase the production of banana.
As 52% of the growers did not plan an increase of banana production as they were facing
difficulties due to lack of capital, lower price of the crop and to a certain extent lack of assured
market and unforeseen factors.
52%
48%
Do you plan to expand scale of crop production?
No
Yes
58.9%
38.5%
1.8% 0.8%
Develop newOrchard
Better orchardmaintenance
Application ofbetter technical
know-how
Others
If yes,how do you plan to do it?
39.7%34.7%
14.4%11.2%
Lack of Capital Lower prices ofcrop
Lack of Assuredmarket
Others
If No Why ?

32
OPINION OF FARMERS ON
CURRENT YEAR PRICE &
PRODUCTION

33
Opinion of Farmers
Change in Current Year Crop Production
Figure 34: Opinion of farmers about current year production
Expectations for current year’s production revealed that 62% admitted an expected
increase in production, 30% were in the opinion that the production would remain
unchanged. However 8% expected decrease also.
Figure 35: Reasons for increase in production Figure 36: Reasons for no change in production
The expectation for increase may be attributed to 30.8% due to favorable weather as
reported by banana growers and 20.9% opined that a little increase in area may lead an
increase in production and 1.4% replied the technological change could have worked in
increase of production. Decrease in yield was also attributed at large to bad weather
condition by 52% of the respondents and 46% opined probable decrease in area.
62%
30%
8%
What is your opinion about current year production?
Remain Unchanged
Increase
Decrease
30.8%
20.9%
1.4% 0.9%
WeatherCondition
Area TechnologyChange
Others
Reasons for Increase in Production
51%37%
6%
3% 2% 1%
Reasons for No Change in Production
Weather Condition
Area
Technology Change
Price
Fund Availability
Others

34
Change in Current Year Price
Figure 37: Opinion of farmers about current year price
Figure 38: Reasons for increase in price
Figure 39: Reasons for decrease in price Figure 40: Reasons for no change in price
Results for expected change in current price indicated that 61% of the banana growers
were of the opinion that prices could be increased, 19% expected a decrease. However,
20% of the farmers opined that there would hardly be and change in the price. Reason
for increase in price may be, perhaps, due to increase in demand as the people, in
general, may like to include banana in their daily diet looking into its health benefits. Or
else new buyers may offer some increase in price.
Opinion about increase in current year’s price is based on favorable weather condition and
demand as important factors as corroborated by the survey itself. An expected decrease also
depends on bad weather and marketing constraints and reasonably on diminishing demand.
61%20%
19%
What is your opinion about current year price
Increase
Remain Unchanged
Decrease
36.40% 34.20%
22.82%
4.85% 1.73%0
100
200
300
400
500
600
700
Demand WeatherCondition
Market Production Others
Reasons for Increase in Price
43.53%
26.59%
18.58%
11.29%
0
50
100
150
200
250
300
WeatherCondition
Market Demand Others
Reasons for Decrease in Price
36.36% 34.65%
21.61%
5.49% 1.89%0
50
100
150
200
250
Market WeatherCondition
Demand Production Others
Remain Unchanged

35
Price Determining Factors
Figure 40: Basis for price determination
Results to find out basis for price determination of quality banana producers indicated that
the banana size is most important factor followed by appearance, colour and variety
respectively. In case, size is substantially good price increases upward with moderate
contribution of appearance and colour and variety.
Post Harvest Loss Factors
Figure 41: Factors responsible for post harvest losses
Results for factors responsible for post harvest loss indicated that the maximum loss
occurred in packaging followed by losses in, storage, harvesting injury and transportation,
Size Appearance Colour Variety Others
Basis for Price Determination (Ranking)
35.86%
26.25%
14.66%
10.12%7.57%
5.54%
Packing loss Storage loss Transportationloss
De-topping Drying Harvesting injury
Reasons for losses and loss in percentage

36
de-topping, drying and harvesting injury . Transportation vans may be subsidized by the
Govt. to facilitate transportation. Pack houses are recommended to be strengthened.
Improvement Measures for Quality & Safety of Crop
Figure 42: Improvement measures of quality and safety of crop
Survey results to identify factors influencing improvement in quality and safety of crop
indicated that the plant material purchase source has to be reliable for establishing an
orchard as 87% of the farmers spoke in positive that a good quality orchard may only
be set up using reliable plant materials. Almost all parameters exemplified as more organic
manure/biopesticide, replacement of chemical pesticide, maintaining hygenic conditions of
workers and keeping produce away from infected materials were proved to be important
factors that may lead a safe production of banana.
87.6% 90.2%
77.0%
46.5%
89.8%
47.3%
81.9%
12.4% 9.8%
23.0%
53.5%
10.2%
52.7%
18.1%
0
500
1000
1500
2000
2500
3000
Buying Inputfrom a reliable
Source
Using moreorganic manureor bio-pesticides
Replacingchemicalpesticides
Use ofrecommended
ripeningMaterrial
Maintaininghygiesne
coditions of theworker
Using goodpacking material
Keep Produseaway from
infected material
Improvement of Quality & Safety of Crop
Yes
No

37
PRODUCTION AND MARKETING
CONSTRAINTS

38
Production & Marketing Constraints
Production Constraints
Figure 43: Major production constraints faced by the farmers
In the Bharuch district of Gujarat the very important and major production constraint
was observed to be wild animals 63% and 28% felt electric tube well a major
production constraint followed by transport problem as reported by 16% of the farmers.
A viable problem of labour shortage as experienced by 9% of the farmers was also
found to be a production constraint in this district in the chronological order.
Marketing Constraints
Figure 44: Major marketing constraints faced by the farmers
1%
9%
16%
28%
63%
Bad Weather
Labour Shortage
Transport Problem
Shortage of Electricity Supply
Wild Animal Problem
Major Production Constraints
12%
14%
14%
14%
35%
Lack of Buyers
Lack of Capital
Low Market Value
Transport Problem
Low Price Issue
Major Marketing Constraints
39
As regards marketing constraints low price issue was a major constraint (35%). This is a
chronic problem not only of farmers of Bharuch district but a country wide prevailing in
almost all the crops. The formation and establishment of functional FPOs as per SFAC
guide lines lead a successful reply to this. This was followed by transport problem and
low market value as reported by 145 of the farmers for each factor. Transport problems
may be tackled by providing subsidized transport vans by the MIDH and low market
value may be taken care of by improving quality of the product adopting INM/IPM
packages and by good plant materials at the time of orchard planting. Lack of capital as
experienced by 14% farmers and lack of buyers as sensed by 12% of the farmers were
also found to be the constraints of marketing. Loans are available with the banks for
solving capital problem. However, lack of buyers may be addressed through FPOs.
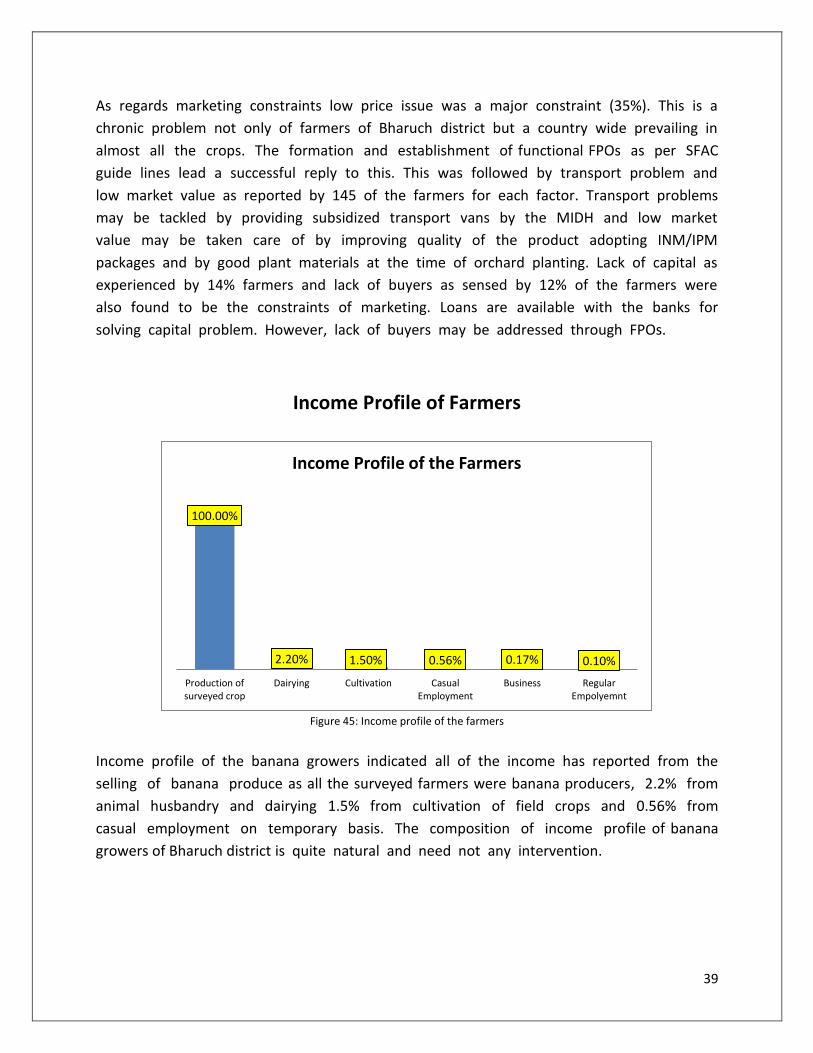
Income Profile of Farmers
Figure 45: Income profile of the farmers
Income profile of the banana growers indicated all of the income has reported from the
selling of banana produce as all the surveyed farmers were banana producers, 2.2% from
animal husbandry and dairying 1.5% from cultivation of field crops and 0.56% from
casual employment on temporary basis. The composition of income profile of banana
growers of Bharuch district is quite natural and need not any intervention.
100.00%
2.20% 1.50% 0.56% 0.17% 0.10%
Production ofsurveyed crop
Dairying Cultivation CasualEmployment
Business RegularEmpolyemnt
Income Profile of the Farmers

40
MAJOR FINDINGS OF SURVEY

41
Major Findings of the Survey
Inferences of the survey read as under:
It could be evident that a large chunk of the banana growers fell in the age group of 35-
45 years and predominantly they were educated to a higher secondary school level.
A large proportion of banana growers in Bharuch district established orchard on their
own land and about 95% of the farmers are facing transport problems and they do not
have on efficient means of transportation of their own.
Large percentage of farmers appeared to be marginal to small farmers group as regards
cultivated area under banana.
There had been a rising trend in the expansion of area under banana orchard
establishment indicating banana to have appeared much remunerative as compared
traditional crops in Bharuch. That too shared orchard is not in the liking of the banana
growers.
Frequency of established orchards with capital investment from Rs 50,000 to 2,00,000
was observed to be higher among the farmers surveyed.
A majority of banana growers maintained 1,000 to 5,000 banana plants in their orchards
i,e orchard size approximately to a maximum of about 1.7ha.
Adoption of mechanisation appeared scanty . This may be due to lower purchasing
power of the banana growers.
Majority of the banana growers , over 75%,were found using chemical fertilizers and
chemical pesticides. There is a need to educate them about the hazards of using such
fertilizers and pesticides. Adoption of INM and IPM package need to be promoted by the
Govt. through extension division of SAU’s and state Horticulture Deptt.
Electric tube wells for irrigation are common means of irrigation .Promotion of drip
irrigation appears a task for the Govt. in order to save undue wastage of water.

42
Majority of banana growers produces 100 quintals to 500 quintals, meaning thereby ,
that majority falls in marginal to small farmers group as regards production as well.
Results for marketing of banana indicated that 86% of the growers sell their produce on
farm in order to avoid inconvenient transportation.
Transport facilities in the control of the banana growers are lacking, therefore, farmers
do not get good price of their produce and , largely, they sell their produce on farm only
on low price.
Growers do not have the liberty to fix price of their own banana produce. Since, the fruit
crop produce, in general, has low keeping quality , therefore, growers are bound to
accept the low price fixed by the traders and intermediaries in order to avoid a storage
loss. Formation of FPO’s is strongly recommended to address this situation.
Wild animals have been reported to be major production constraint as they damage
orchard in the hours of absence of growers during night. Watchman with false guns may
prove helpful. A fixed amount to banana growers may be remitted by the Govt. per
watchman per month.
Predominanantly , low price is a production constraint and also a marketing constraint
which need to be taken care of as indicated above.
43
PROJECTED SUPPORT -
RECOMMENDATIONS

44
Projected Support from Govt. / MIDH
A substantial support is required from Mission for Integrated Development of
Horticulture to banana growers of Bharuch district of West Bengal so as to increase the
quality production of banana and streamline the marketing chain in order to enhance
the income of growers. The support category is detailed hereunder.
Sl. No.
Item Pattern of Support/Assistance
1. PLANTATION INFRASTRUCTURE DEVELOPMENT
1(a). Production of Planting Materials
(i) Hi Tech Nursery Public sector owned Hi-Tech Nursery is required to be established.
(ii) Small Nursery Small nurseries in the private sector have to be established. Financial support in terms of credit linked back ended subsidy of cost may be awarded.
(iii) Setting up New Tissue Culture (TC) units New Public sector owned Tissue Culture units are required to be established.
(iv) Strengthening of existing Tissue Culture (TC) units Already existing Public sector owned TC units may be strengthened. In case of private sector owned existing TC units 50% subsidy credit linked back ended to the cost of strengthening may be awarded.
1(b) Establishment of New Orchard (Area expansion – for a maximum area of 4 ha. per beneficiary) Banana (suckers)
(i) Integrated package with drip irrigation Fruit growers may be awarded financial support for meeting expenditure on planting material, drip irrigation and cost of material for INM / IPM as per Govt. norms.
(ii) Without integration with drip irrigation Fruit growers unable to afford drip irrigation may be provided finances for meeting expenditure on planting materials and cost incurred for INM / IPM.
Banana (TC)
(iii) Integrated package with drip irrigation Financial support to banana growers may be awarded as per Govt. norms for meeting expenditure on planting materials cost of material for drip irrigation system and INM / IPM

45
package adoptions.
(iv) Without integration with drip irrigation Financial support for meeting expenditure on planting materials and cost of INM / IPM.
1(c) Creation of Water Resources
(i) Community tanks/on farm ponds / on farm water reservoirs with use of plastic / RCC lining
Financial aids may be awarded to banana growers for creating such water resources with plastic / RCC lining or without plastic / RCC linings as the case may be in accordance to the Govt. norms.
(ii) Water harvesting system for individuals – for storage of water in (20m x 20m x 3m) ponds/tube well/dug wells
Financial assistance is required to be awarded to banana growers by the Govt. for creating defined water harvesting system as per Govt. norms.
1(d) Promotion of INM and IPM
(i) Promotion of Integrated Nutrient Management (INM) and Integrated Pest Management (IPM)
Financial assistance to banana growers as per area coverage according to Govt. norms may be awarded.
(ii) Plant Health Clinic Public sector controlled / or Public private partnership owned 4 clinics may be awarded to Bharuch districts.
1(e) Organic farming
(i) Adoption of organic farming Financial assistance to banana growers as per Govt. norms may be awarded.
(ii) Organic Certification Project based and area based assistance to banana growers is required as per Govt. norms.
1(f) Horticulture Mechanization
(i) Tractor Banana growers are required to award financial support in terms of subsidy to purchase a tractor.
(ii) Land Development tillage and seed bed preparation equipments
Banana growers may be awarded financial assistance as per Govt. norms.
(iii) Plastic mulch laying machine Banana growers may be awarded financial assistance to purchase the machine.
(iv) Plant protection equipments
Manual Sprayer
Knapsack/Foot operated sprayer
Since large no. of banana growers are small to marginal farmers, therefore, these two types of sprayer would suffice the need for which financial assistance may be awarded as per Govt. norms.
2. INTEGRATED POST HARVEST MANAGEMENT

46
2(a) Pack Houses Financial assistance for new pack houses of size 9M X 6M may be rendered as per norms detailed in SFAC operational guidelines.
2(b) Ripening Chamber Credit linked back ended subsidy in the capital cost of project as per norms of the Govt. may be awarded to the growers.
3. ESTABLISHMENT OF MARKETING INFRASTRUCTURE FOR HORTICULTURE PRODUCE
3(a) Rural Marketing/Apni Mandies/Direct markets Credit linked back ended subsidy in the capital cost of project is required to be awarded for banana growers.
3(b) Retail Markets/Outlets (environmentally controlled)
Credit linked back ended subsidy in the capital cost is required to be awarded to the banana growers.
4. MISSION MANAGEMENT
4(a) District level exhibition and Kisan Mela These are required to be organised by the Govt. / SAU sponsored by MIDH collectively both the events in one stroke two times in a year in Bharuch district.
4(b) Information dissemination through publicity, printed literature etc and local adventures
This information dissemination part may be clubbed with the above 4(a).
4(c) 7 Promotion of Farmer Producers Organisation (FPO) / Farmer Interest Groups (FIG) of 15-20 farmers / 20 ha. Growers Association and tie up with financial Institution and Agregators.
As per norms issued by SFAC finances are required to be provided.

47
Interaction with Farmers
48
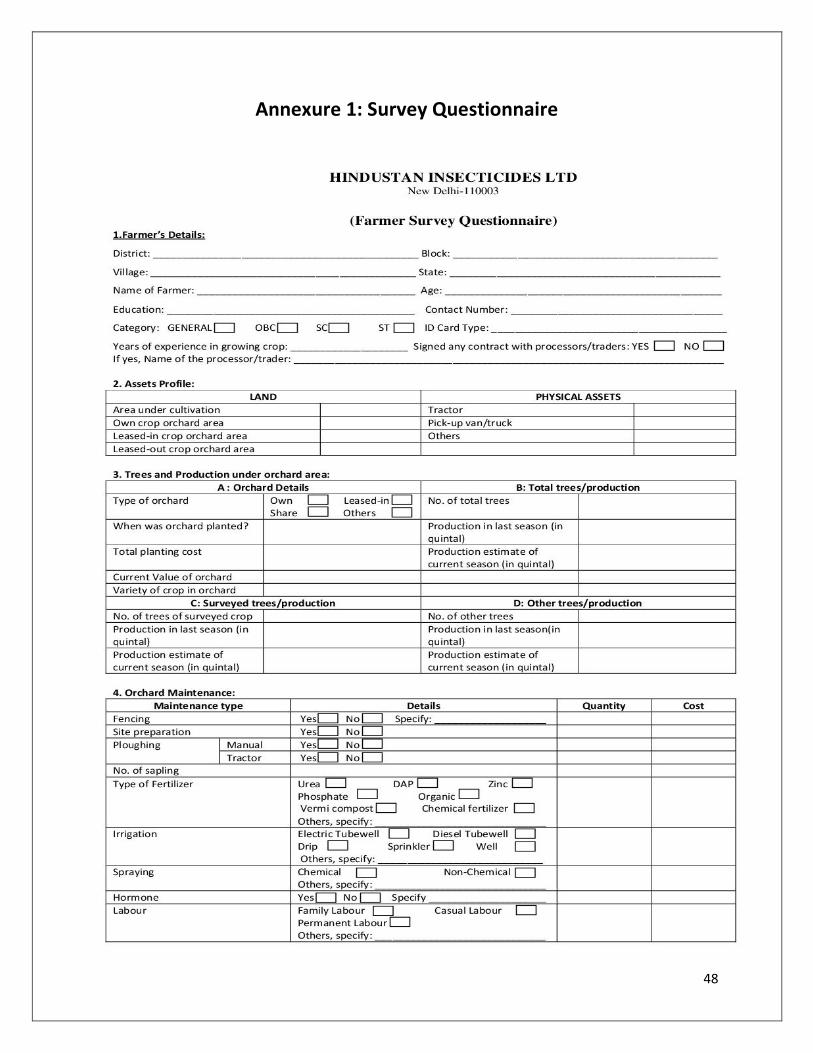
Annexure 1: Survey Questionnaire

49
50

51

52
Annexure 2: List of Figures and Tables
Figure 1 Education Profile of Farmers
Figure 2 Age Profile of the Farmers surveyed
Figure 3 Area profile of surveyed farmers
Figure 4 Asset profile of surveyed farmers
Figure 5 Distribution of farmers under different land holding groups
Figure 6 Farmers under different groups of leased-in orchard area
Figure 7 Type of Orchard planted by farmer
Figure 8 Year of Plantation of Orchard
Figure 9 Plantation cost of the orchard
Figure 10 Current Value of Orchard
Figure 11 Number of total trees planted in orchard by the farmers
Figure 12 Average production of farmers in last season
Figure 13 Average production of farmers in current season
Figure 14 Various factors under orchard maintenance practiced by surveyed farmers
Figure 15 Different types of fertilizers and spray used by the farmers
Figure 16 Different types of Irrigation method used by the surveyed farmers
Figure 17 Different types of labour used by the farmers on their farms
Figure 18 Production of Banana
Figure 19 Production Statistics
Figure 20 Different types of crop buyers
Figure 21 Farmers selling area
Figure 22 Different modes of transportation used by farmers
Figure 23 Farmer’s travelling distance to selling point
Figure 24 Types of packaging baskets used by the farmers
Figure 25 Who decides the price of the produce?
Figure 26 Did farmers have difficulties selling your crop during last season?
Figure 27 Did the farmers search for new crop buyers in this season?
Figure 28 Increase in production of banana crop in last 5 years
Figure 29 Reasons for increase in production
Figure 30 Reasons for decrease in production
Figure 31 Number of farmers planning to expand their crop production
Figure 32 How are farmers planning to expand crop production
Figure 33 Why are farmers not planning to expand crop production
Figure 34 Opinion of farmers about current year production
Figure 35 Reasons for increase in production
Figure 36 Reasons dor decrease in production
Figure 37 Opinion of farmers about current year price

53
Figure 38 Reasons for increase in price
Figure 39 Reasons dor decrease in price
Figure 40 Basis for price determination
Figure 41 Factors responsible for post harvest losses
Figure 42 Improvement measures of quality and safety of crop
Figure 43 Major production constraints faced by the farmers
Figure 44 Major marketing constraints faced by the farmers
Figure 45 Income profile of the farmers
Table 1 State-wise production of Banana in India
Table 2 District-wise production of Banana in West Bengal
Table 3 Education Profile of Farmers
Table 4 Age group – Education profile of the farmers