HINDUSTAN INKS & RESINS LTD Silvassa project. Becomes only the third in the world to produce Alkali...
54
Analyst Meet - 23 January 04 HINDUSTAN INKS & RESINS LTD
Transcript of HINDUSTAN INKS & RESINS LTD Silvassa project. Becomes only the third in the world to produce Alkali...

Analyst Meet - 23 January 04
HINDUSTAN INKS & RESINS LTD

“ World Without Inks ”

“ World With Inks ”

1. Milestones & Highlights
2. Understanding Inks
3. Hindustan Inks – Making a Mark on the World
4. The Inks Market
5. Challenges
6. Financial Performance
7. People Behind Hindustan Inks
Analyst Meet-January 2004

Except for the historical information contained herein, statements in this presentation and the subsequent discussions, which include words or phrases such as
“will”, “aim”, “will likely result”, “would”, “believe”, “may”, “expect”, “will
continue”, “anticipate”, “estimate”, “intend”, “plan”, “contemplate”, “seek to”, “future”, “objective”, “goal”, “likely”, “project”, “should”, “potential”, “will
pursue” and similar expressions or variations of such expressions may constitute
"forward-looking statements“ not limited to expected future business and financial performance of HIRL. These forward-looking statements are based on Managements
current expectations and are inherently subject to uncertainties & changes in
circumstances and involve a number of risks, uncertainties and other factors that could cause actual results to differ materially from those suggested by the forward-
looking statements. These risks and uncertainties include, but are not limited to our
ability to successfully implement our strategy, our growth and expansion plans, our provisioning policies, technological changes, investment and business income, cash
flow projections, our exposure to market risks as well as other risks. Investors are
advised to form their own judgments and conclusions before any investment related decision. HIRL does not undertake any obligation to update forward-looking
statements to reflect actual results or any change in events, conditions, assumptions
or other factors.`
Disclaimer
Journey towards Excellence

Ink operations begin as small family unit.
Initial success in Inks Business.
HIRL becomes National Company.
Develops Pigments and Flush Technology.
Milestones…
1986
1992
1994
1996
1998
Initial capital employed Rs.200,000.
Starts a small Ag. Chem intermediate unit – Mitsu. Maiden IPO of Rs.20 Mio. Sales cross Rs.100 Mio.
Diversifies into General inks. Daman plant commences operation.Commences International Business in Ag.Chem.
Group sales cross Rs.1000 Mio, exports USD 5 Mio.
Implements SAP/R3.Launches Deltamethrin – 2nd in the World.Ink sales cross Rs.1000 Mio, group sales cross Rs.3000 Mio

Emerges as Market Leader in India.
Launches Micro inks. Recruits key people.
Micro inks gets initial success. Monthly sales cross $2 Mio.
Micro bags R R DONNELLY contract in the USA.
Micro inks becomes 12th biggest company in USA.
Milestones…1999
2000
2001
2002
2003
Mitsu emerges as biggest exporter of Agrochemicals.Mitsu profits exceed Rs.1000 Mio in a year.Sells 51% stake in Mitsu to HOECHST AGREVO for total $100 Mio.
Completes Silvassa project.
Becomes only the third in the world to produce Alkali Blue.
Commissions fully integrated single stream seamless plant – the biggest and only one of its kind in the World.
Further 23% stake of Bilag sold to AVENTIS for $50 Mio. Ink Exports cross Rs.2000 Mio.
HIRL emerges in the top 15 Global Ink cos.Successful entry in around 50+ Countries spread across all Continents.

Key HighlightsØ 15th Largest ink company in the World.
Ø Largest Ink co. in India , 12th Largest in USA.
Ø One of the fastest growing Ink cos. in the World.
Ø Among the fastest growing cos in India – CAGR of sales exceeds 45%
in 10 years.
Ø Biggest and only fully backward integrated , seamless ink
manufacturing plant in the World.Ø Only the third producer in the world in last 50 years to develop
Alkali Blue and the second largest in the world.
Ø Presence in more than 50 countries in all continents including a
manufacturing facility in USA.
Ø International business grown from $1 Mio. to $100 Mio. in 3years.
Ø International revenues exceed 50% of total revenues.

Understanding InksUnderstanding Inks

Printing Ink… A Primer
PRINTING INK …
Ø Is a performance chemical and requires total solution support.
Ø Is at the end of the chemical value chain.
Ø Has to perform on large variety and variation of substrates like plastic, paper, HDPE, metals, BOPP, polyesters, bonded paper, coated paper etc.
Ø Has to perform on various printing machines having different speeds and other characteristics.
Ø Requires adaptation to various climatic conditions.
Ø Has a long product life cycle.

Chemical Products/
Intermediates
Pigments ResinsSolvents
/ Oils Additives
VarnishesFlushes
PrinterPress/End Customer
Ink cost
< 5-7 % of
Printing
CostPacking Materials
BOPP, Polyesters, BondedPaper, Coated Paper
4B Acid, Bon Acid, Carbon Black, CPC, IPA, Soya Oil, Linseed Oil,
Aniline, Phenol, ONCB,
More than 500 Raw Materials
Value ChainNatural
ProductsRosins, Oil & Petrochemicals,
Sulphur, Salts, Copper, Linseed/Soya etc..

Key Characteristics
Though ink constitutes < 5-7 % of the cost for the printers
- The most visible part of the end product.
- No branding or differentiation is possible without ink.
- The cost driver, since it determines the press
performance, consumption of other materials like paper,
fountain solution, rollers etc.

Robust Ink
Dispersion Fast setting & reduced set off. Less wastage / costs
Transfer of ink related to speed of printing machineViscosity
Yield Value Structure of ink’s ability to withstand for long runs For high tech speed machine.
Stickiness of inkTack
Strength Tinting property of pigment
Print Density Color depth of ink film transferred on the substrate
Reflection from the printGloss
Set off Setting property of the ink
Rub Resistance Abrasion resistance of inks film
Setting property of the inkPress Stability
Flow Controlled & continuous flow of inks. Ink/water balance
Water up take Water intake of the ink.
PROPERTIES MEASURES
Ink Quality Drivers…
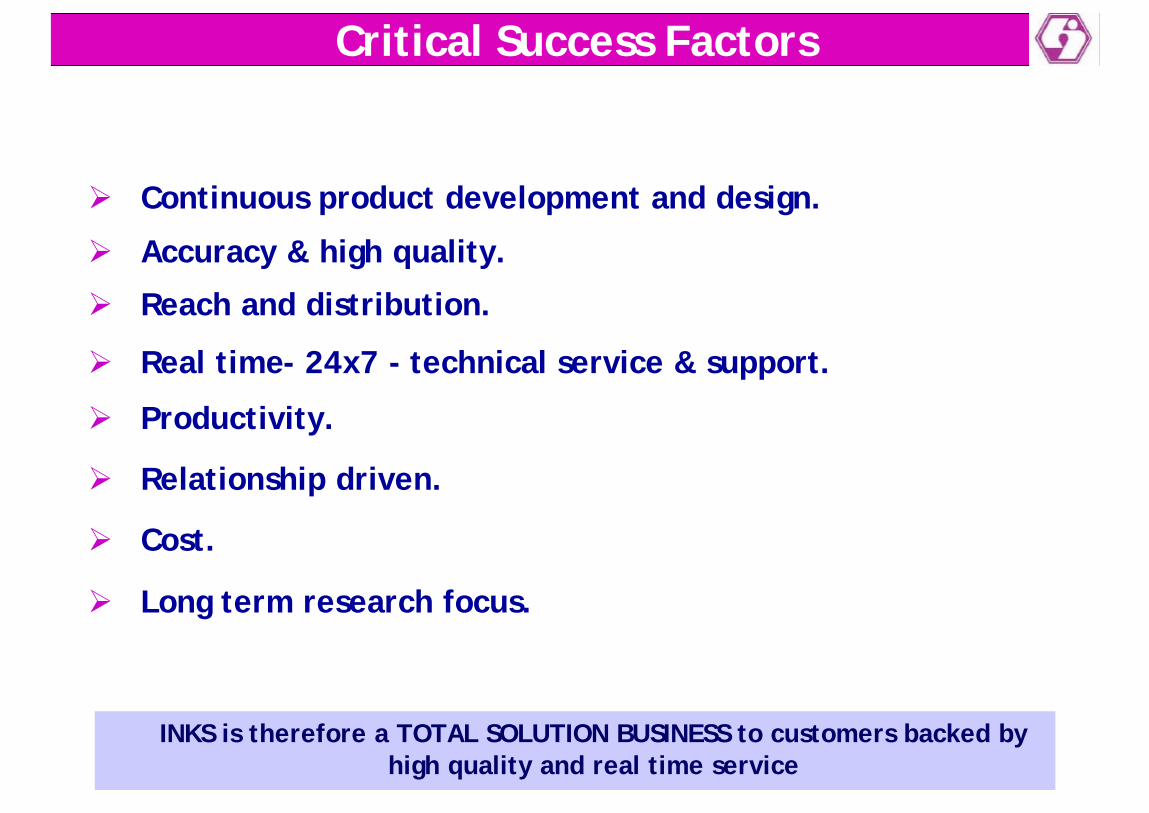
Critical Success Factors
Ø Continuous product development and design.
INKS is therefore a TOTAL SOLUTION BUSINESS to customers backed by high quality and real time service
Ø Accuracy & high quality.
Ø Reach and distribution.
Ø Real time- 24x7 - technical service & support.
Ø Productivity.
Ø Relationship driven.
Ø Cost.
Ø Long term research focus.

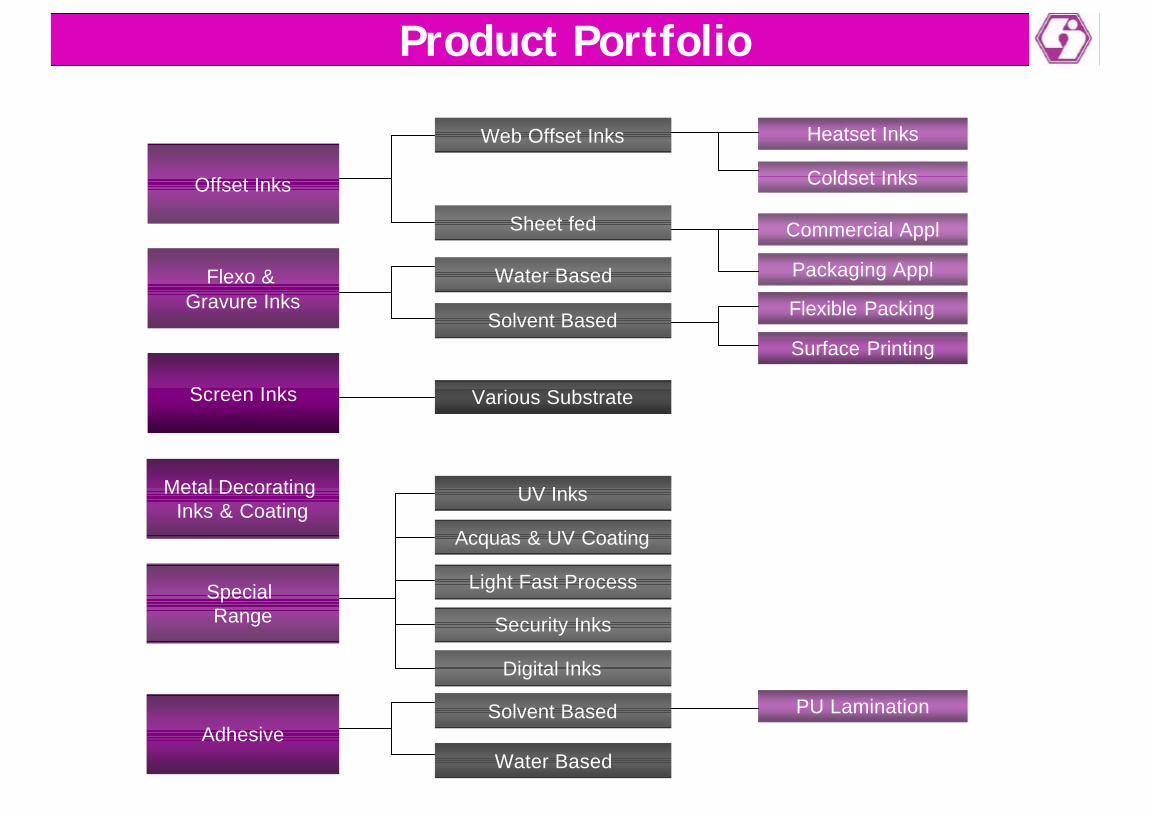
Offset Inks
Flexo & Gravure Inks
Screen Inks
Metal Decorating Inks & Coating
Special Range
Magazines & Books, News Papers, Yellow Pages,
Brochures, Calendars
Printing FMCG & Industrial Pkgon Substrates like Bottles,
Cans, Wrappers, LDP, BOPP& Flexible Pkg
Visiting Cards, Letter Heads, HDPE/PP bottles
Substrates like, Metal, AluminumFoils etc
Products & Applications
CD, DVD, Currency, Credit Card,Digital Printing, etc

Making our mark on the worldMaking our mark on the world
Offset Inks
Flexo & Gravure Inks
Adhesive
Screen Inks
Metal Decorating Inks & Coating
Special Range
Web Offset Inks
Sheet fed
Water Based
Solvent Based
Solvent Based
Water Based
Various Substrate
UV Inks
Acquas & UV Coating
Light Fast Process
Security Inks
Digital Inks
Coldset Inks
Heatset Inks
Commercial Appl
Packaging Appl
PU Lamination
Flexible Packing
Surface Printing
Product Portfolio


Quality drivers at Hindustan Inks
Ø Unique and unmatched technical expertise in Process Chemistry.
Ø Strong Research & Development with focus on new products and applications.
Ø In-house Design, Technology and Unique Process Flow.
Ø Full Vertical Integration and Seamless Process.

Integration…Key to Quality
Ø Hindustan inks has the only fully integrated plant in the world.
Ø Full control on all critical parameters ensures unmatched
product quality.
Ø High levels of customization possible thus satisfying varying
needs of clients.
Ø Enables rapid turnaround time for faster than normal customer
acquisition.
Ø Provides cost leadership.
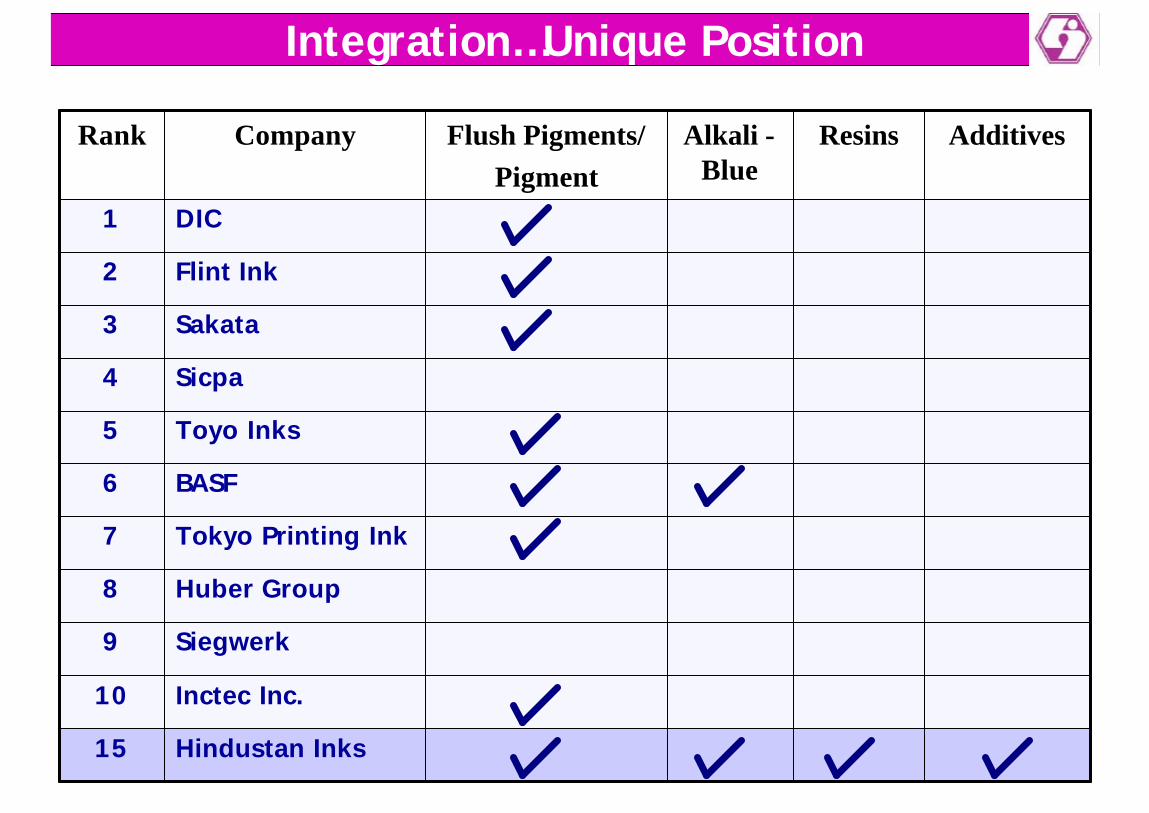
Flush Pigments/Pigment
Alkali -Blue
Resins AdditivesCompanyRank
Hindustan Inks 15
Inctec Inc.10
Siegwerk9
Huber Group8
Tokyo Printing Ink7
BASF6
Toyo Inks5
Sicpa4
Sakata3
Flint Ink2
DIC1
Integration…Unique Position

Production Capacities
40000Pigments & Flushed Colors
3000Wire Enamels
Adhesives
Resins
Printing Inks
CLASS OF GOODS
7800
45000
180000
M.T. Per Annum
M.T. Per Annum
CLASS OF GOODS
65000 Finishing Plant for paste inks
U. S. A.INDIA
Ø Current capacity utilization is about 35% and capable of generating revenue in excess of USD 450 Million at full capacity.
Ø Consolidated fixed cost including interest, depreciation is about INR 1850 Million (FY 2003).
Ø Sales growth will lead to significant expansion in margin post the inflexion point.

Markets

Global Ink Market
28%
24%7%
35%
6%Asia
Europe
Latin America
North America
Others
Global Market – USD 15 bnNorth America- USD 5 bnIndian Market – USD 200 mn.

The Global MarketØ Growth at 2 – 3 % in last decade
Approx. Market Share (%)Sales US$ MillionsCompanyRank
1.5145Hindustan Inks 15
3341Inctec Inc.10
3344Siegwerk Druckfarben9
3383Huber Group8
3429Tokyo Printing Ink7
4617BASF6
4662Toyo Inks5
5685Sicpa4
5781Sakata3
111600Flint Ink2
263850DIC / SUN1
Source : Ink World Magazine
Ø Eight countries – US, JAPAN, GERMANY, UK, FRANCE, ITALY, SPAIN and CHINA account for 80% of global market.
Ø Top 10 companies control more than 65% of the global market.

Present Across 50 Countries In The World.
Our Presence across the Globe
India 43%
Africa & Middle East 2%
USA 38%
Asia Pacific 6%
Europe 9%
Latin America 2%

US Market
Ø Growing at 3 – 4% during the last decade.
Ø Volume declined in last two years; market leaders have witnessed
negative growth.
Ø Top 10 companies account for 75% of the market.
157MICRO INKS 12
2110Sicpa5
2125Color Converting4
5250INX International3
18900Flint Ink2
552750Sun Chemicals1
Apprx Market Share (%)
Sales US$ MnCompanyRank
Source : Ink World Magazine April 2003

Our Presence in USA
Micro Inks (Office & Mfg Facility)Ware HouseSales RepresentativesTSR
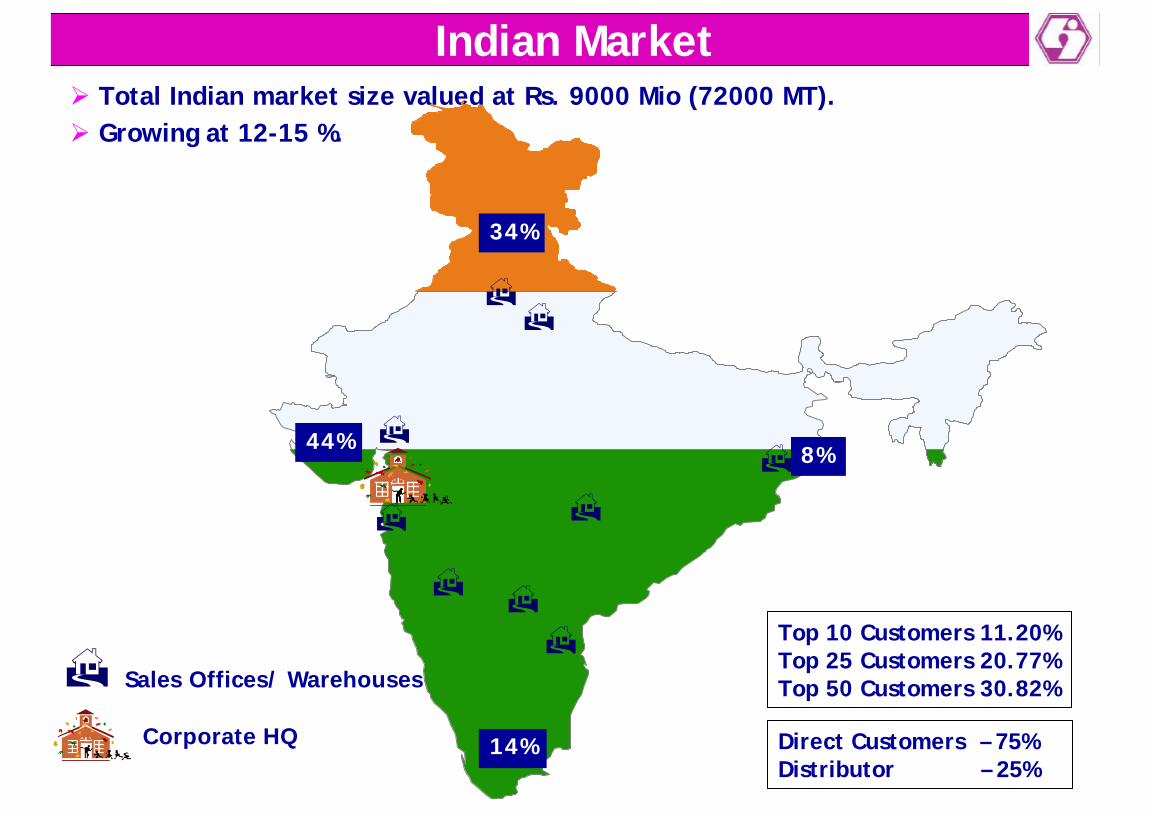
Indian MarketØ Total Indian market size valued at Rs. 9000 Mio (72000 MT).
Top 10 Customers 11.20%Top 25 Customers 20.77%Top 50 Customers 30.82%
Direct Customers – 75%Distributor – 25%
14%Corporate HQ
H Sales Offices/ Warehouses
HH
H H
H
H
HH
H
44%
34%
8%
Ø Growing at 12-15 %.

ChallengesChallenges

Image and Acceptability / Reach & Distribution- Initially less known in the international markets
- Over coming Customer Bias towards – India, Quality Issue, Distance issues etc.
- Service customers across the world.
+ Increasing corporate brand awareness
+ Tying up with local distributors and companies.
+ Private label sales/ OEM strategy
+ Create superior product performance.
Challenges
Increase people depth
- People strength and depth to service customers
+ CEO, marketing head and a marketing team of 40+ to service US. Further key
recruitments to increase penetration.
+ IBD team expanded from 2 to 12.
+ Continuous strengthening R&D and product chemistry related skills.
+ High focus on Training and HR.
Logistics
- Matching quality and delivery parameters of customers
+ Front-end model in US - to extend this model on a smaller scale to other countries.
+ Tying up with local companies and distributors.
+ Utilise information technology.

Market Related Risks :- Weakness in the US economy and new customer acquisition+ Revenues are diversified across geographies & customers. No concentration in
one market & going forward it will become more broad based.+ Developing superior product performance and providing value to customer.
Financial Risks :- Appreciation of Indian currency against dollar.+ Proactive Treasury Management.+ Started Billing in Euro to some Euro zone customers.+ Global sourcing of Raw Materials providing in natural hedge from exchange
fluctuation.+ Foreign currency loans to part finance long term requirement & export related
working capital.
Leverage :- Debt may go up in absence of sales growth due to economic slow down.+ Highly unlikely. However, Internal Generation & Long Term Fund raising shall
mitigate this risk.+ Tight control on Capital Employed.
Threats

Financial PerformanceFinancial Performance

Net Profit
Operating ProfitSales
POST INVESTMENT IN USA, COMPANY HAS ACHIEVED CONSOLIDATED PROFITS
410
162
331
663 709
0100200300400500600700800
99-0
0
00-0
1
01-0
2
02-0
3
03-0
4(9
Mth
s)
Rs.
Mio
201
(153)
(443)
(188)
118
-500-400-300-200-100
0100200300
Rs.
Mio
99-0
0
00-0
1
01-0
2
02-0
3
03-0
4(9
Mth
s)
Consolidated Financial Performance
0
1000
2000
3000
4000
5000
6000
700099
-00
00-0
1
01-0
2
02-0
3
03-0
4(9
Mon
ths)
Rs.
Mio CAGR – 53
% 6836
2194
3152
5181
6025

823887968485883887418741Capital Employed
559060356065601453375337Loan Funds
264827612420282434043404Networth
(153)15381140203373Cash Profit
(443)(188)(9)55115118PAT
(325)(76)2389181242PBT
71113131713(%)
331663208234339709EBIDTA
446561881626186519545477Sales (Net)
FY 2001-02
FY 2002-03
Q32002-03
Q22003-04
Q3 2003-04
9 months 2003-04
4 %2 %US
189 %1422 %PAT Growth
36 %64 %EBDITA Growth
21 %20 %Total Sales
135 %158 %Non-US
14 %10 %Domestic
Growth YTD (YoY)Growth Q3 (YoY)
Rs. MioConsolidated Key Financials

Sales
HIRL EBIDTA Trend
HIRL Profit Trend
HIRL Financial Performance
0500
1000150020002500300035004000450050005500600065007000
Rs.
Mio
92-93 94-95 96-97 98-99 00-01 02-03 03-04(9Mths)
101 4551039
1751
3843
6286
4256
CAGR – 51%
0
200
400
600
800
1000
1200
1400
Rs.
in M
io
92-93 94-95 96-97 98-99 00-01 02-03 03-04(9Mths)
9106
172324
1135
604
928
CAGR – 62%
050
Rs.
in M
io
100150
200
250300
350400450500
92-93 94-95 96-97 98-99 00-01 02-03 03-04(9Mths)
441
316
8475
5
235
458
CAGR – 57%

786885068597965396819681Capital Employed
380437224315457339533953Loan Funds
406447844282508057285728Networth
692681180225242632Cash Profit
483440116167182458PAT
601552147201248583PBT
232021222222(%)
11221135293307363928EBIDTA
492356391409142416344256Sales (Net)
FY 2001-02
FY 2002-03
Q32002-03
Q22003-04
Q3 2003-04
YTD Dec. 2003-04
44 %57 %PAT Growth
8 %24 %EBIDTA
10 %16 %Net Sales Growth
GROWTH YTD (YoY)Growth Q3 (YoY)
Rs. Mio
HIRL Financials

98
2
92
35
58
4
38
45
11
44
43
18
39
0%10%20%30%40%50%60%70%80%90%
100%
99-00 00-01 01-02 02-03 03-04(9Mths)
Domestic Non-USA USA
Consolidated Revenue by Geography%
Sha
re o
f R
even
ue

1206
19551865
13931518
1626 16521657
1000
1250
1500
1750
2000
Q4(01-0
2)
Q1(02-0
3)
Q2(02-0
3)
Q3(02-0
3)
Q4(02-0
3)
Q1(03-0
4)
Q2(03-0
4)
Q3(03-0
4)
Sale
s
Consolidated Revenue - Quarter wise
Rs Mio

Quarterly Net Sales
0
2
4
6
8
10
12
14
16
18
( USD
Mio
)
0
100
200
300
400
500
600
700
800
900 (R
s M
io)
050
100150
200250300
350400450
(Rs
Mio
)
Domestic Sales US Sales
Non - US SalesQ4
(01-0
2)
Q1(02
-03)
Q2(02
-03)
Q3(02
-03)
Q4(02
-03)
Q1(03
-04)
Q2(03
-04)
Q3(03
-04)
Q4(01
-02)
Q1(02
-03)
Q2(02
-03)
Q3(02
-03)
Q4(02
-03)
Q1(03
-04)
Q2(03
-04)
Q3(03
-04)
Q4(01
-02)
Q1(02
-03)
Q2(02
-03)
Q3(02
-03)
Q4(02
-03)
Q1(03
-04)
Q2(03
-04)
Q3(03
-04)

Quarterly Consolidated EBIDTA % Trend
4
10 1113
9 8
13
17
0
5
10
15
20
25
Q4(
01-0
2)
Q1(
02-0
3)
Q2(
02-0
3)
Q3(
02-0
3)
Q4(
02-0
3)
Q1(
03-0
4)
Q2(
03-0
4)
Q3(
03-0
4)
EB
IDT
A %

Quarterly PAT Trend
(191)
(78)(46)
(9)
(55) (52)
55
115
-200
-150
-100
-50
0
50
100
150(R
s M
io)
Q4(01
-02)
Q1(02
-03)
Q2(02
-03)
Q3(02
-03)
Q4(02
-03)
Q1(03
-04)
Q2(03
-04)
Q3(03
-04)

Sales Vs Capital Employed
820077508238
8796
4465
6188
0
1000
2000
3000
4000
5000
6000
7000
8000
9000
10000
2001-02 2002-03 Est(2003-04)
(Rs.
Mio
)
Capital Employed Sales

“Reach Top 5 in the world within next 5 years.”
Vision & Strategy
ü Increase presence significantly across geographies.ü Become the fastest growing and most profitable
company in the world in printing inks.ü Differentiate products and quality.ü Build image and increase reach and distribution.
ü Use acquisitions/JVs to fuel growth.ü Focus on R&D ,Technology and Product Development.
- New Technologies
- Colorants
- Digital Inks.

Other Inks
Packaging
200420042004News Color/Black
UV/EB Inks/Coatings
Sheetfed Inks
20042004Heat Set Inks
OthersEuropeLatin America
North America
AsiaIndia
Product Universe
Promoters & ManagementPromoters & Management

Mr. ZAKIR BILAKHIAMember of the Executive Board.Drives Research, Technology and Product Strategy
MR. ANJUM BILAKHIAManaging Director Member of the Board of Bilag.Drives Execution, Projects and Operations.
MR. YUNUS BILAKHIAChairman & Founder. Chairman of Bilag- a JV with Bayer, Bilakhia HoldingsDrives Vision and Strategy for the Group.
ABOUT THE PROMOTERS…

MR. YUNUS BILAKHIA, MR. YUNUS BILAKHIA,
CHAIRMAN
MR. ANJUM BILAKHIA, MR. ANJUM BILAKHIA,
MANAGING DIRECTOR.
MR. SHIVRAM ANGNE, MR. SHIVRAM ANGNE,
WHOLETIME DIRECTOR
MR.PRASHANT DESAI MR.PRASHANT DESAI
INTERNATIONAL BUSINESS STRATEGIST
MR. M.L.BHAKTA MR. M.L.BHAKTA
SR. PARTNER OF KANGA & CO.- SOLICITORS
MR. K.K.UNNI MR. K.K.UNNI
EX-VICE CHAIRMAN OF AVENTIS CROPSCIENCE, INDIA
MR. HASMUKH SHAH MR. HASMUKH SHAH
CHAIRMAN OF GUJARAT GAS LTD
EX CHAIRMAN OF IPCL
EX-VICE CHAIRMAN OF GE CAPITAL, INDIA
EX-JOINT SECRETARY TO THE PRIME MINISTER
MR. ANJUM BILAKHIA,MR. ANJUM BILAKHIA,
MANAGING DIRECTORMANAGING DIRECTOR
MR. ZAKIR BILAKHIA, MR. ZAKIR BILAKHIA,
DIRECTOR DIRECTOR –– RESEARCH, TECHNOLOGY & RESEARCH, TECHNOLOGY & PRODUCT STRATEGYPRODUCT STRATEGY
MR. SHIVRAM ANGNE, MR. SHIVRAM ANGNE,
DIRECTOR – QUALITY, SYSTEMS & HR.
MR. SANJAY SHAH, MR. SANJAY SHAH,
DIRECTOR DIRECTOR –– OPERATIONS & SUPPLY OPERATIONS & SUPPLY CHAINCHAIN
MR. RAMAKRISHNA KAMAT, MR. RAMAKRISHNA KAMAT,
DIRECTOR DIRECTOR -- DOMESTIC SALESDOMESTIC SALES
MR. VINAY PANDYA, MR. VINAY PANDYA,
DIRECTOR DIRECTOR –– FINANCE, CORPORATE COMMFINANCE, CORPORATE COMM
MR. SNEHAL SHAH, MR. SNEHAL SHAH,
DIRECTOR DIRECTOR –– INTERNATIONAL BUSINESS INTERNATIONAL BUSINESS DEVLOPMENTDEVLOPMENT
MR. ZAINUL LAKDAWALA, MR. ZAINUL LAKDAWALA,
DIRECTOR DIRECTOR -- TECH SERVICE & R & D (USA)TECH SERVICE & R & D (USA)
Board Of Directors Executive Board

Bilakhia Holdings Pvt. Ltd.USD 239 MIL
Hindustan Inks & Resins LtdUSD 146 MIL
Mitsu Ltd USD 10 MIL
Bilag Industries Ltd JV-Bayer Bilakhias
USD 83 MIL
BILAKHIA GROUP
BHPL holds 26% in Bilag presently.

BILAG TODAY IS….
v Largest generic pyrethroid player in the world.v Global market share exceeding 25% on active ingredient basis.v Manufacturer & largest exporter of agrochemicals.v Most profitable unlisted company in India (Source ET – “15/07/2002 “).v international revenues contribute > 80% to sales.v Present in more than 70 countries including market leadership in china.
v Bilakhias entered AG.Chem business under the name Mitsu.
BILAG
v Progressed from simple one step process to complex Chiral chemistry.
v Specialised in Pyrethroid chemistry and setup global scale mega plants with cost leadership and full vertical integration.
v Moved up the value chain from $1 per Kg product to $400 per Kg.
v Introduced two new products every year.
v Recipient of national R&D and safety awards for several years.
v Entered into a JV with Agrevo (is now Bayer) to form Bilag
v One of the most successful JVs of India.