Hindalco Industries Limited -...
30
Hindalco Industries Limited Q1 FY20 Earnings Presentation 09 th August, 2019
Transcript of Hindalco Industries Limited -...

Hindalco IndustriesLimited
Q1 FY20 Earnings Presentation09th August, 2019

EXCELLENCE BY DESIGNHindalco Industries Limited 2
SAFE HARBOUR
Certain statements in this report may be “forward looking statements” within the meaning of applicablesecurities laws and regulations. Actual results could differ materially from those expressed or implied.Important factors that could make a difference to the company’s operations include global and Indiandemand supply conditions, finished goods prices, feed stock availability and prices, cyclical demand andpricing in the company’s principal markets, changes in Government regulations, tax regimes, economicdevelopments within India and the countries within which the company conducts business and other factorssuch as litigation and labour negotiations. The company assume no responsibility to publicly amend, modifyor revise any forward looking statement, on the basis of any subsequent development, information orevents, or otherwise.

EXCELLENCE BY DESIGNHindalco Industries Limited
Table of Content
3
Key Highlights – Q1 FY20
07
12Business Performance Highlights : Operational & Financial – Q1 FY20
Economy & Industry Updates – Global & Domestic
04
Appendix 27
• Novelis
• Aluminium
(India)
• Copper
EXCELLENCE BY DESIGNHindalco Industries Limited
Key Highlights – Q1 FY20
4
EXCELLENCE BY DESIGNHindalco Industries Limited 5
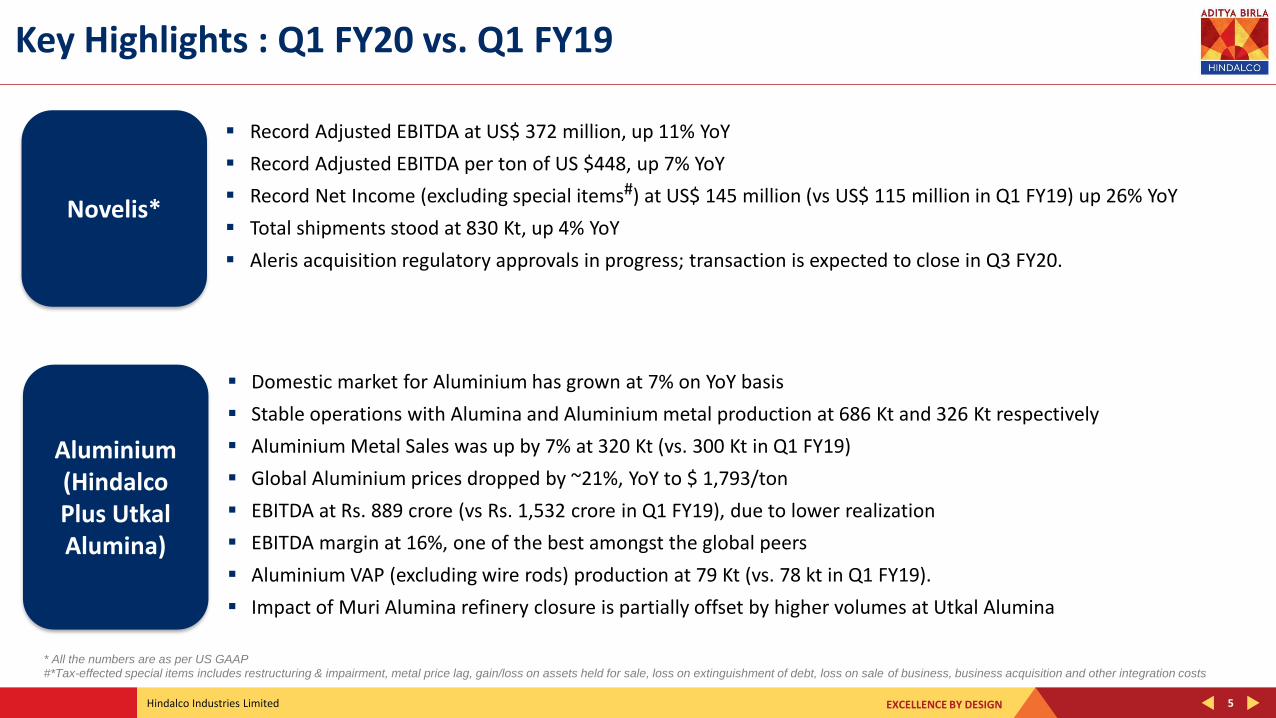
Key Highlights : Q1 FY20 vs. Q1 FY19
Record Adjusted EBITDA at US$ 372 million, up 11% YoY
Record Adjusted EBITDA per ton of US $448, up 7% YoY
Record Net Income (excluding special items#) at US$ 145 million (vs US$ 115 million in Q1 FY19) up 26% YoY
Total shipments stood at 830 Kt, up 4% YoY
Aleris acquisition regulatory approvals in progress; transaction is expected to close in Q3 FY20.
Novelis*
* All the numbers are as per US GAAP
#*Tax-effected special items includes restructuring & impairment, metal price lag, gain/loss on assets held for sale, loss on extinguishment of debt, loss on sale of business, business acquisition and other integration costs
Aluminium (Hindalco Plus Utkal Alumina)
Domestic market for Aluminium has grown at 7% on YoY basis
Stable operations with Alumina and Aluminium metal production at 686 Kt and 326 Kt respectively
Aluminium Metal Sales was up by 7% at 320 Kt (vs. 300 Kt in Q1 FY19)
Global Aluminium prices dropped by ~21%, YoY to $ 1,793/ton
EBITDA at Rs. 889 crore (vs Rs. 1,532 crore in Q1 FY19), due to lower realization
EBITDA margin at 16%, one of the best amongst the global peers
Aluminium VAP (excluding wire rods) production at 79 Kt (vs. 78 kt in Q1 FY19).
Impact of Muri Alumina refinery closure is partially offset by higher volumes at Utkal Alumina

EXCELLENCE BY DESIGNHindalco Industries Limited 6
Key Highlights : Q1 FY20 vs. Q1 FY19 ..Contd.
Domestic Copper market grew 9% YoY
Highest ever quarterly VAP production (CC Rod) at 66 Kt, up 2% (vs. 65 Kt in Q1 FY19)
VAP Sales (CC Rods) were up by 3% at 63kt (vs. 61 Kt in Q1 FY19)
Smooth ramp-up of smelter-3 post planned maintenance shutdown
EBITDA at Rs. 267 crore (vs Rs. 347 crore in Q1 FY19), due to lower volumes and realizations
Copper
Consolidated EBITDA at Rs. 3,769 crore (vs 4,334 crore in Q1 FY19)
Consolidated PBT (Before Exceptional Items) at Rs. 1,578 crore ( vs. Rs. 2,275 crore in Q1 FY19)
Consolidated PAT at Rs. 1,063 crore, ( vs. Rs. 1,475 crore in Q1 FY19)
Long term loans remained unchanged from FY19 end
Consolidated Net Debt to EBITDA at 2.69x (vs. 2.48x as at March 31, 2019)
Hindalco (Consolidated)

EXCELLENCE BY DESIGNHindalco Industries Limited
Economy & Industry : Global & Domestic
7
EXCELLENCE BY DESIGNHindalco Industries Limited 8
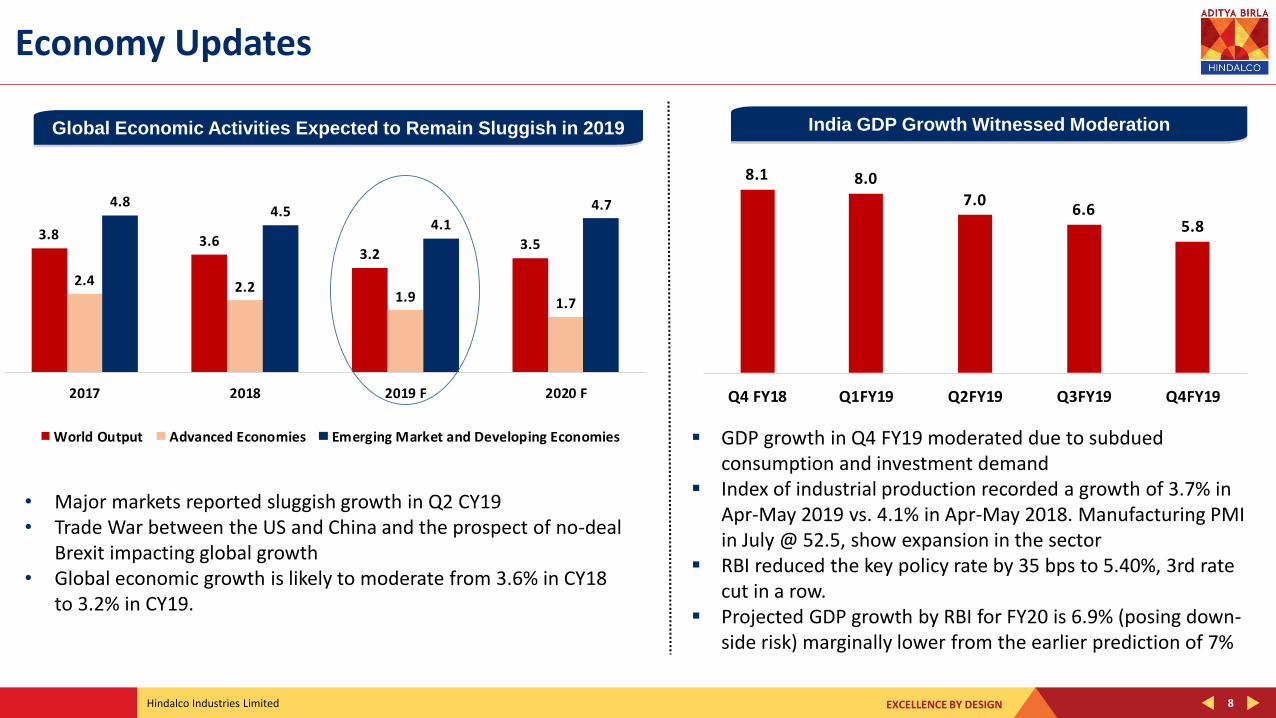
Economy Updates
3.8 3.63.2
3.5
2.4 2.21.9 1.7
4.84.5
4.1
4.7
2017 2018 2019 F 2020 F
World Output Advanced Economies Emerging Market and Developing Economies
• Major markets reported sluggish growth in Q2 CY19• Trade War between the US and China and the prospect of no-deal
Brexit impacting global growth• Global economic growth is likely to moderate from 3.6% in CY18
to 3.2% in CY19.
8.1 8.0
7.06.6
5.8
Q4 FY18 Q1FY19 Q2FY19 Q3FY19 Q4FY19
GDP growth in Q4 FY19 moderated due to subdued consumption and investment demand
Index of industrial production recorded a growth of 3.7% in Apr-May 2019 vs. 4.1% in Apr-May 2018. Manufacturing PMI in July @ 52.5, show expansion in the sector
RBI reduced the key policy rate by 35 bps to 5.40%, 3rd rate cut in a row.
Projected GDP growth by RBI for FY20 is 6.9% (posing down-side risk) marginally lower from the earlier prediction of 7%
Global Economic Activities Expected to Remain Sluggish in 2019 India GDP Growth Witnessed Moderation

EXCELLENCE BY DESIGNHindalco Industries Limited 9
Aluminium Industry
63 64 6563 65 66
0.1
-1.5 -1.3
2017 2018 2019
World production World consumption Market Balance
376 463 413
555 552 585
931 1016 998
Q1FY19 Q4 FY19 Q1 FY20
Domestic Sales Imports inc Scrap Total Demand
The US-China trade tensions continue to impact commodity market
Subdued global economic and industrial activities resulted in lowdemand growth.
China domestic demand expected to pick up with economicstimulus introduced
The market deficit is likely to be around 1.2 Mt to 1.5 Mt in 2019but LME expected to remain depressed due negative marketsentiments in the short term.
Domestic demand grew by 7% YoY in Q1 FY20. However, consumption growth moderated in certain user industries due to tight liquidity conditions.
Domestic market share of imports (including scrap) at around 60% which grew 5%
Scrap imports grew at 8% YoY.
Domestic Demand (Kt)Global Demand & Supply Balance (Mt)

EXCELLENCE BY DESIGNHindalco Industries Limited 10
FRP Industry
In CY19, the Global FRP demand continued to grow at a steady pace of around 3%
In CY19, Global Can Stock market has started to show growth with demand from continuous shift from glass tothe Cans, new can sizes, new end-use segments like energy drinks, sparkling water & crafted beer in aluminiumpackaging. This has resulted in a strong mid to long term growth of 3% in the beverage can market
Global adoption of strong, lightweight, formable aluminium in vehicle parts and structures, has led to continuousgrowth in the Automotive Body Sheet demand. This is expected to grow at a CAGR of 12% (between CY18-CY25E)
Domestic FRP demand is currently growing at steady pace of 4% YoY in Q1 FY20, primarily driven byconstruction and packaging segments. This is expected to grow at a CAGR of ~7% (between CY18-CY22E) .

EXCELLENCE BY DESIGNHindalco Industries Limited 11
Copper Industry
Key Macro Drivers (Q1 FY20 vs Q1 FY19)TC/RC (USDc/lb) S. Acid Price (Rs./MT) DAP Realization (Rs./MT)
23.0 23.6 23.722.8 23.6 23.8
0.2 0.1
-0.1
2017 2018 2019
Refined copper production Refined copper consumption Market balance
102 121 109
71 73 79
173194 188
Q1 FY19 Q4 FY19 Q1 FY20
Domestic Sales Imports Total
Global copper demand weaker than expected in H1 CY19.
Smelters profitability under pressure due to moderation in TC/RC and sulphuric acid prices.
Copper concentrate market is expected to be in a marginal deficit of around 100 Kt in 2019.
New smelter capacity of ~ 1.3 Mt has came-up in China in H1 CY19
Copper consumption increased by around 9% YoY, driven by electrical sector (power, cables and transformer)
Imports constituted 42% of domestic market share which grew is around 11% YoY.
Strong Domestic Demand (Kt)Global Demand & Supply Balance (in Mt)
EXCELLENCE BY DESIGNHindalco Industries Limited
Business Performance Highlights : Q1 FY20
12

EXCELLENCE BY DESIGNHindalco Industries Limited
Novelis
13

EXCELLENCE BY DESIGNHindalco Industries Limited 14
Operational Performance - Novelis
Overall Shipments (KT)
797 870 830
Q1 FY19 Q4 FY19 Q1 FY20
Strong operating performance with favorable market conditions driving
financial growth
Global demand for Aluminium Flat Rolled Product (FRP) was strong with
overall shipments up 4% YoY :
Organic Expansion projects in US, China and Brazil are progressing on
time and budget :
200 Kt greenfield automotive finishing lines in the U.S. to begin customer
qualification in late FY20
100 Kt automotive finishing expansion in China commissioning in FY21
100 Kt rolling and 60 Kt recycling expansion in Brazil commissioning in FY21
Aleris acquisition regulatory approvals in progress; transaction is
expected to close in Q3 FY20.

EXCELLENCE BY DESIGNHindalco Industries Limited 15
Financial Performance - Novelis
Revenue (USD Billion) Adjusted EBITDA (USD Million) Adjusted EBITDA (USD/tonne)
Record Adjusted EBITDA per ton up
by 7% at US$ 448 in Q1 FY20.
3.1 3.12.9
Q1 FY19 Q4 FY19 Q1 FY20
334 357 372
Q1 FY19 Q4 FY19 Q1 FY20
419 410 448
Q1 FY19 Q4 FY19 Q1 FY20
Revenues at US$ 2.9 billion, down
6%, on account of decrease in
average base aluminium prices,
partially offset by higher total
shipments and favorable product
price and mix.
Note: All above numbers are as per the US GAAP
Record quarterly adjusted EBITDA up
by 11% at US$ 372 million on
account of higher shipments in both
Beverage Cans and Automotive body
sheets, favorable price and product
mix, partially offset by less favorable
recycling benefits due to lower
aluminium prices
EXCELLENCE BY DESIGNHindalco Industries Limited
Aluminium Business
(Hindalco Aluminium including Utkal)
16
EXCELLENCE BY DESIGNHindalco Industries Limited 17
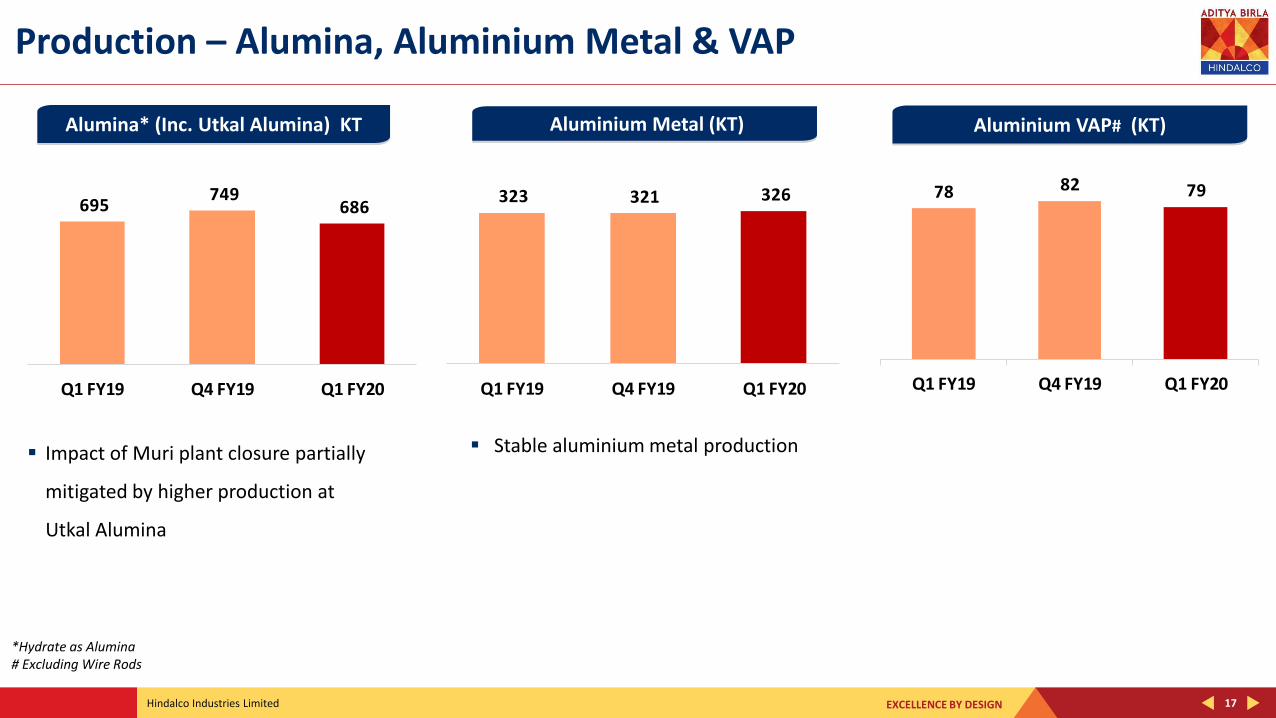
Production – Alumina, Aluminium Metal & VAP
Stable aluminium metal production
Aluminium Metal (KT) Aluminium VAP# (KT)Alumina* (Inc. Utkal Alumina) KT
Impact of Muri plant closure partially
mitigated by higher production at
Utkal Alumina
*Hydrate as Alumina# Excluding Wire Rods
695 749
686
Q1 FY19 Q4 FY19 Q1 FY20
323 321 326
Q1 FY19 Q4 FY19 Q1 FY20
78 82 79
Q1 FY19 Q4 FY19 Q1 FY20

EXCELLENCE BY DESIGNHindalco Industries Limited 18
Sales Volume – Aluminium Metal & VAP
Aluminium Metal Sales in all forms (KT) Aluminium VAP# (KT)
Aluminium VAP shipments has grown 13% YoY
Aluminium VAP was 24% of total metal sales
(Vs 23% in Q1 FY19)
# Excluding Wire Rods
Aluminium Metal Sales higher by 7% YoY
300 325 320
Q1 FY19 Q4 FY19 Q1 FY20
68
83 77
Q1 FY19 Q4 FY19 Q1 FY20

EXCELLENCE BY DESIGNHindalco Industries Limited 19
Financial Performance - Hindalco Aluminium including Utkal Alumina
Revenue (Rs. Crore) EBITDA (Rs. Crore)
EBITDA margins at 16%, one of the best
amongst global peers
Aluminium revenue down due to lower
realisations
5,668 5,953 5,472
Q1 FY19 Q4 FY19 Q1 FY20
1,532
1,057 889
Q1 FY19 Q4 FY19 Q1 FY20

EXCELLENCE BY DESIGNHindalco Industries Limited
Copper Business
20

EXCELLENCE BY DESIGNHindalco Industries Limited 21
Production – Copper & VAP
Cathode production impacted due to
the planned maintenance shutdown in
Q1 FY20
Cathode (KT) CC Rod (KT) DAP (KT)
Highest ever CC Rod production in
Q1 FY20.
DAP production down due to
planned maintenance shutdown and
operational issues
8189
76
Q1 FY19 Q4 FY19 Q1 FY20
65 6266
Q1 FY19 Q4 FY19 Q1 FY20
70 69
36
Q1 FY19 Q4 FY19 Q1 FY20

EXCELLENCE BY DESIGNHindalco Industries Limited 22
Sales Volume – Copper & VAP
CC Rods (KT)Copper Metal Sales in All Forms (KT)
Copper Continuous Cast Rods sales volumes were
higher by 3% YoY
82
100
82
Q1 FY19 Q4 FY19 Q1 FY20
6170
63
Q1 FY19 Q4 FY19 Q1 FY20

EXCELLENCE BY DESIGNHindalco Industries Limited 23
Copper Business – Financial Performance
Revenue (Rs. Crore) EBITDA (Rs. Crore)
Revenues were marginally lower YoY on
account of lower realizations and impact of
planned maintenance shutdown
EBITDA was down YoY due to lower by-
product volumes and realizations in Q1
FY20
5,012
6,513
4,593
Q1 FY19 Q4 FY19 Q1 FY20
347 325
267
Q1 FY19 Q4 FY19 Q1 FY20

EXCELLENCE BY DESIGNHindalco Industries Limited 24
Quarterly Financial Trend - Consolidated
Revenue (Rs. Crore) EBITDA (Rs. Crore)
PBT (Before Exceptional Items) (Rs. Crore) Profit After Tax (Rs. Crore)
31,078 33,746
29,972
Q1 FY19 Q4 FY19 Q1 FY20
4,334 3,938 3,769
Q1 FY19 Q4 FY19 Q1 FY20
2,275
1,725 1,578
Q1 FY19 Q4 FY19 Q1 FY20
1,475
1,178 1,063
Q1 FY19 Q4 FY19 Q1 FY20

EXCELLENCE BY DESIGNHindalco Industries Limited
A Sustainable Business Model
Strong Balance Sheet Consolidated Net Debt
to EBITDA at 2.69x as on 30th June 19
Deleveraging providing strength to the Balance Sheet
Operations Steady operational performance in India Novelis’ continued focus on optimizing
manufacturing operations and product mix to maximize its capacity in favorable market conditions
To Summarise
25
Balanced Product Portfolio (LME v/s Non LME linked) 79% EBITDA (Rs. 2,995 crore) of the total business is non-
LME linked in Q1 FY20
Resource Security Fully integrated aluminium business
model is providing support in low commodity cycles
Long term supply contracts with miners assures uninterrupted supply of copper concentrate

Thank You

EXCELLENCE BY DESIGNHindalco Industries Limited
Appendix
27

EXCELLENCE BY DESIGNHindalco Industries Limited 28
Quarterly Financials – Hindalco Consolidated
(Rs. Crore)
Particulars Q1 FY19 Q4 FY19 Q1 FY20YOY
Change %
Revenue from Operations 31,078 33,746 29,972 -4%
Earning Before Interest, Tax, Depreciation & Amortisation (EBITDA)
Aluminium (including Utkal) 1,532 1,057 889 -42%
Copper 347 325 267 -23%
Novelis* 2,416 2,228 2,538 5%
All Other Segments (19) (34) (14) 29%
Unallocable Income/ (Expense) (Net) 58 361 88 52%
Total EBITDA 4,334 3,938 3,769 -13%
Finance Costs 913 975 957 -5%
PBDT 3,421 2,962 2,812 -18%
Depreciation (including impairment) 1,147 1,236 1,235 -8%
PBT before Exceptional Items and Tax 2,274 1,726 1,577 -31%
Share in Profit/ (Loss) in Equity Accounted Investments (Net of Tax) 1 (1) 1
Exceptional Income/ (Expenses) (Net) - - (22)
Profit Before Tax (After Exceptional Item) 2,275 1,725 1,556 -32%
Profit/ (Loss) After Tax 1,475 1,178 1,063 -28%*As per Ind-AS

EXCELLENCE BY DESIGNHindalco Industries Limited 29
Financial Key Figures – Hindalco Standalone including Utkal Alumina
(Rs. Crore)
Particulars Q1 FY19 Q4 FY19 Q1 FY20YOY
Change %
Revenue from Operations 10,667 12,455 10,055 -6%
Earning Before Interest, Tax, Depreciation & Amortisation (EBITDA)
Aluminium (including Utkal) 1,532 1,057 889 -42%
Copper 335 315 253 -24%
Unallocable Income/ (Expense) (Net) 83 361 133 60%
Total EBITDA 1,951 1,733 1,275 -35%
Finance Costs 464 458 493 -6%
PBDT 1,486 1,275 781 -47%
Depreciation 480 535 494 -3%
PBT before Exceptional Items and Tax 1,007 740 287 -71%
Exceptional Income/ (Expenses) (Net) - - (22)
Profit Before Tax (After Exceptional Item) 1,007 740 266 -74%
Profit/ (Loss) After Tax 734 506 167 -77%

Registered Office Ahura Centre, 1st Floor, B WingMahakali Caves Road Andheri (East), Mumbai 400 093 Telephone- +91 22 6691 7000Website: www.hindalco.comE mail: [email protected] Identity No. L27020MH1958PLC011238
For Futher Queries Please Contact : Subir Sen, Investor RelationsTelephone- +91 22 6662 6666E mail: [email protected]: www.hindalco.com