Hindalco Industries Ltd Hirakud Power Hindalco Industries ...
Key company data: See page 2 for company data and detailed price/index chart.
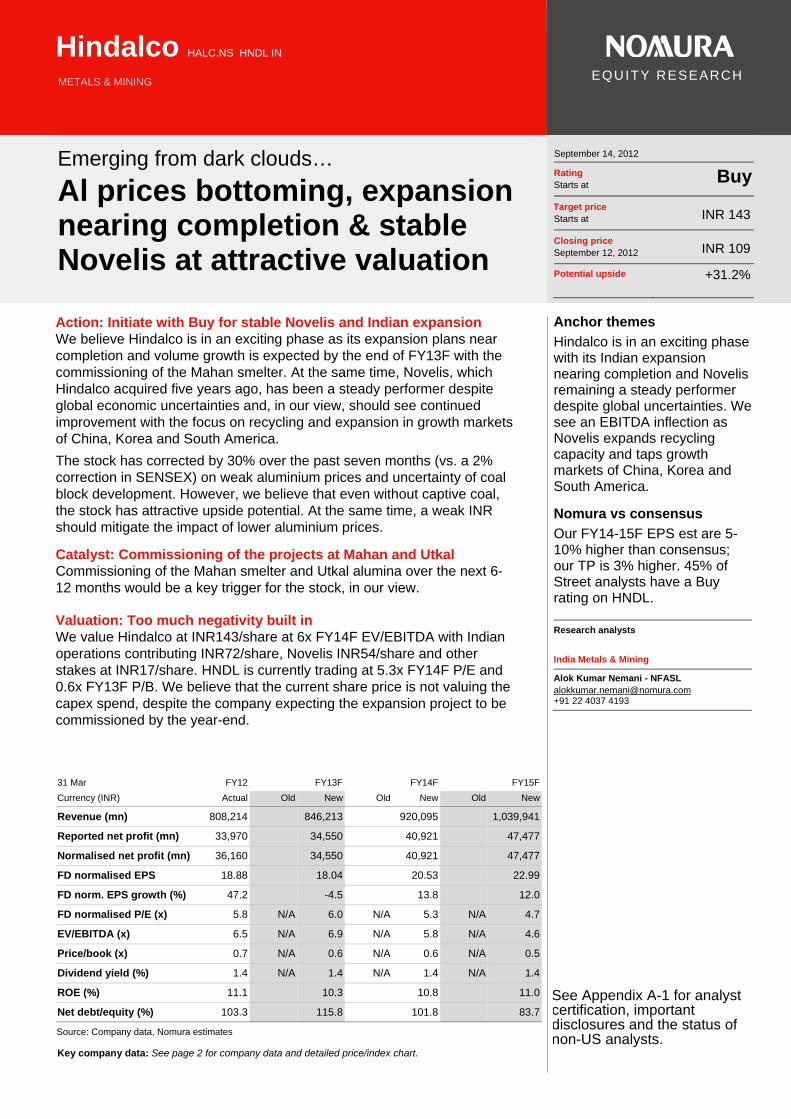
Hindalco HALC.NS HNDL IN
METALS & MINING
EQUITY RESEARCH
Emerging from dark clouds…
Al prices bottoming, expansion nearing completion & stable Novelis at attractive valuation
September 14, 2012
Rating Starts at
Buy
Target price Starts at INR 143
Closing price September 12, 2012 INR 109
Potential upside +31.2%
Action: Initiate with Buy for stable Novelis and Indian expansion We believe Hindalco is in an exciting phase as its expansion plans near completion and volume growth is expected by the end of FY13F with the commissioning of the Mahan smelter. At the same time, Novelis, which Hindalco acquired five years ago, has been a steady performer despite global economic uncertainties and, in our view, should see continued improvement with the focus on recycling and expansion in growth markets of China, Korea and South America.
The stock has corrected by 30% over the past seven months (vs. a 2% correction in SENSEX) on weak aluminium prices and uncertainty of coal block development. However, we believe that even without captive coal, the stock has attractive upside potential. At the same time, a weak INR should mitigate the impact of lower aluminium prices.
Catalyst: Commissioning of the projects at Mahan and Utkal Commissioning of the Mahan smelter and Utkal alumina over the next 6-12 months would be a key trigger for the stock, in our view.
Valuation: Too much negativity built in We value Hindalco at INR143/share at 6x FY14F EV/EBITDA with Indian operations contributing INR72/share, Novelis INR54/share and other stakes at INR17/share. HNDL is currently trading at 5.3x FY14F P/E and 0.6x FY13F P/B. We believe that the current share price is not valuing the capex spend, despite the company expecting the expansion project to be commissioned by the year-end.
31 Mar FY12 FY13F FY14F FY15F
Currency (INR) Actual Old New Old New Old New
Revenue (mn) 808,214 846,213 920,095 1,039,941
Reported net profit (mn) 33,970 34,550 40,921 47,477
Normalised net profit (mn) 36,160 34,550 40,921 47,477
FD normalised EPS 18.88 18.04 20.53 22.99
FD norm. EPS growth (%) 47.2 -4.5 13.8 12.0
FD normalised P/E (x) 5.8 N/A 6.0 N/A 5.3 N/A 4.7
EV/EBITDA (x) 6.5 N/A 6.9 N/A 5.8 N/A 4.6
Price/book (x) 0.7 N/A 0.6 N/A 0.6 N/A 0.5
Dividend yield (%) 1.4 N/A 1.4 N/A 1.4 N/A 1.4
ROE (%) 11.1 10.3 10.8 11.0
Net debt/equity (%) 103.3 115.8 101.8 83.7
Source: Company data, Nomura estimates
Anchor themes
Hindalco is in an exciting phase with its Indian expansion nearing completion and Novelis remaining a steady performer despite global uncertainties. We see an EBITDA inflection as Novelis expands recycling capacity and taps growth markets of China, Korea and South America.
Nomura vs consensus
Our FY14-15F EPS est are 5-10% higher than consensus; our TP is 3% higher. 45% of Street analysts have a Buy rating on HNDL.
Research analysts
India Metals & Mining
Alok Kumar Nemani - NFASL [email protected] +91 22 4037 4193
See Appendix A-1 for analyst certification, important disclosures and the status of non-US analysts.

Nomura | Hindalco September 14, 2012
2
Key data on Hindalco Income statement (INRmn) Year-end 31 Mar FY11 FY12 FY13F FY14F FY15FRevenue 720,779 808,214 846,213 920,095 1,039,941Cost of goods sold -612,329 -690,337 -723,038 -780,327 -878,953Gross profit 108,450 117,877 123,175 139,768 160,988SG&A
Employee share expense -55,933 -62,489 -64,692 -69,233 -79,194Operating profit 52,517 55,389 58,483 70,534 81,794
EBITDA 80,017 81,894 88,726 107,313 126,345Depreciation -27,500 -26,506 -30,243 -36,779 -44,551Amortisation
EBIT 52,517 55,389 58,483 70,534 81,794Net interest expense -18,393 -17,580 -19,373 -23,181 -26,181Associates & JCEs -571 496 496 496 496Other income 4,309 7,831 8,173 8,173 9,173Earnings before tax 37,861 46,135 47,779 56,022 65,281Income tax -9,638 -7,862 -11,115 -12,988 -15,691Net profit after tax 28,222 38,273 36,664 43,034 49,590Minority interests -3,659 -2,113 -2,113 -2,113 -2,113Other items
Preferred dividends
Normalised NPAT 24,564 36,160 34,550 40,921 47,477Extraordinary items 0 -2,190 0 0 0Reported NPAT 24,564 33,970 34,550 40,921 47,477Dividends -3,338 -3,352 -3,347 -3,609 -3,609Transfer to reserves 21,226 30,618 31,203 37,311 43,868
Valuation and ratio analysis
Reported P/E (x) 8.5 6.2 6.0 5.3 4.7Normalised P/E (x) 8.5 5.8 6.0 5.3 4.7FD normalised P/E (x) 8.5 5.8 6.0 5.3 4.7FD normalised P/E at price target (x) 11.1 7.6 7.9 7.0 6.2Dividend yield (%) 1.4 1.4 1.4 1.4 1.4Price/cashflow (x) 4.7 6.9 3.8 2.8 2.6Price/book (x) 0.7 0.7 0.6 0.6 0.5EV/EBITDA (x) 5.1 6.5 6.9 5.8 4.6EV/EBIT (x) 7.9 9.6 10.5 8.8 7.2Gross margin (%) 15.0 14.6 14.6 15.2 15.5EBITDA margin (%) 11.1 10.1 10.5 11.7 12.1EBIT margin (%) 7.3 6.9 6.9 7.7 7.9Net margin (%) 3.4 4.2 4.1 4.4 4.6Effective tax rate (%) 25.5 17.0 23.3 23.2 24.0Dividend payout (%) 13.6 9.9 9.7 8.8 7.6Capex to sales (%) 12.5 16.5 16.9 10.9 4.9Capex to depreciation (x) 3.3 5.0 4.7 2.7 1.2ROE (%) 9.7 11.1 10.3 10.8 11.0ROA (pretax %) 7.5 6.6 5.9 6.5 7.1
Growth (%)
Revenue 18.7 12.1 4.7 8.7 13.0EBITDA -17.9 2.3 8.3 20.9 17.7EBIT -24.6 5.5 5.6 20.6 16.0Normalised EPS -37.4 47.2 -4.5 13.8 12.0Normalised FDEPS -37.4 47.2 -4.5 13.8 12.0
Per share
Reported EPS (INR) 12.83 17.74 18.04 20.53 22.99Norm EPS (INR) 12.83 18.88 18.04 20.53 22.99Fully diluted norm EPS (INR) 12.83 18.88 18.04 20.53 22.99Book value per share (INR) 151.56 166.63 184.03 197.62 219.88DPS (INR) 1.50 1.55 1.55 1.55 1.55Source: Company data, Nomura estimates
Relative performance chart (one year)
Source: ThomsonReuters, Nomura research
(%) 1M 3M 12M
Absolute (INR) -11.3 -11.4 -23.7
Absolute (USD) -11.1 -10.2 -34.7
Relative to index -13.7 -17.7 -32.3
Market cap (USDmn) 3,786.8
Estimated free float (%) 65.0
52-week range (INR) 164.9/100
3-mth avg daily turnover (USDmn)
13.91
Major shareholders (%)
Promoter 35.0
LIC 10.0
Source: Thomson Reuters, Nomura research
Notes
While EBITDA should see strong growth during next 2 years, net profit growth to be muted on account of high
depreciation and interest expenditure.

Nomura | Hindalco September 14, 2012
3
Cashflow (INRmn) Year-end 31 Mar FY11 FY12 FY13F FY14F FY15FEBITDA 80,017 81,894 88,726 107,313 126,345Change in working capital -7,680 -30,133 -9,449 128 -3,902Other operating cashflow -27,953 -21,419 -23,932 -29,614 -34,317Cashflow from operations 44,384 30,342 55,344 77,828 88,126Capital expenditure -90,039 -132,965 -143,131 -99,960 -51,352Free cashflow -45,655 -102,622 -87,786 -22,132 36,774Reduction in investments 3,907 -5,370 0 0 0Net acquisitions
Reduction in other LT assets 0 0 0Addition in other LT liabilities -1,786 13,055 0 0 0Adjustments 5,779 -40,902 9,545 -1,363 -1,363Cashflow after investing acts -37,756 -135,840 -78,241 -23,495 35,411Cash dividends
Equity issue 100 5,434 0 16,239 0Debt issue 36,933 131,666 80,796 20,000 -20,000Convertible debt issue
Others
Cashflow from financial acts 37,032 137,099 80,796 36,239 -20,000Net cashflow -724 1,260 2,554 12,744 15,411Beginning cash 78,258 77,534 78,794 81,348 94,093Ending cash 77,534 78,794 81,348 94,092 109,504Ending net debt 199,385 329,792 408,033 415,289 379,878Source: Company data, Nomura estimates
Balance sheet (INRmn) As at 31 Mar FY11 FY12 FY13F FY14F FY15FCash & equivalents 77,534 78,794 81,348 94,093 109,503Marketable securities 0 0 0 0 0Accounts receivable 79,996 80,172 83,644 90,222 102,884Inventories 140,956 132,460 140,579 147,006 157,323Other current assets 33,334 73,529 81,373 82,681 85,794Total current assets 331,819 364,955 386,944 414,002 455,504LT investments 56,578 68,085 68,085 68,085 68,085Fixed assets 365,947 470,319 574,540 639,702 648,483Goodwill 89,414 110,665 110,665 110,665 110,665Other intangible assets 0 0 0 0 0Other LT assets 0 0 0 0 0Total assets 843,758 1,014,023 1,140,234 1,232,453 1,282,736Short-term debt
Accounts payable 164,692 151,925 161,911 176,353 198,542Other current liabilities 52,149 66,659 66,659 66,659 66,659Total current liabilities 216,840 218,583 228,570 243,011 265,200Long-term debt 276,920 408,586 489,381 509,381 489,381Convertible debt
Other LT liabilities 37,596 50,650 50,650 50,650 50,650Total liabilities 531,356 677,819 768,601 803,043 805,232Minority interest 22,169 17,091 19,204 21,317 23,430Preferred stock 0 0 0 0 0Common stock 1,915 1,915 1,915 2,065 2,065Retained earnings 21,226 30,618 31,203 37,311 43,868Proposed dividends 3,338 3,352 3,347 3,609 3,609Other equity and reserves 263,755 283,229 315,964 365,108 404,532Total shareholders' equity 290,233 319,113 352,430 408,093 454,074Total equity & liabilities 843,758 1,014,023 1,140,235 1,232,453 1,282,736
Liquidity (x)
Current ratio 1.53 1.67 1.69 1.70 1.72Interest cover 2.9 3.2 3.0 3.0 3.1
Leverage
Net debt/EBITDA (x) 2.49 4.03 4.60 3.87 3.01Net debt/equity (%) 68.7 103.3 115.8 101.8 83.7
Activity (days)
Days receivable 36.8 36.3 35.3 34.5 33.9Days inventory 75.6 72.5 68.9 67.3 63.2Days payable 88.1 83.9 79.2 79.1 77.8Cash cycle 24.3 24.8 25.0 22.6 19.2Source: Company data, Nomura estimates
Notes
Cash includes current investments in debentures, bonds and debt funds
Notes
Debt should peak in FY14F and D/E ratio should remain under control at close to 1

Nomura | Hindalco September 14, 2012
4
Contents
5 Executive summary
7 We capture recent challenges in our estimates…
9 Hindalco: A brief introduction
12 Valuation methodology
14 Novelis: A steady performer
19 Financial performance–Indian operations
26 Aluminium – prices bottoming out
30 India: one of the best locations globally for aluminium production
35 Cost dynamics of aluminium production in India
38 Appendix A-1

Nomura | Hindalco September 14, 2012
5
Executive summary Hindalco is the largest aluminium company in India with a capacity of 0.5mtpa and has a worldwide presence through Novelis (which it acquired in May 2007). Hindalco is also present in the copper smelting business with a capacity of 0.5mtpa.
Hindalco has large expansion plans to triple its capacity from the current level and is at an exciting phase with its expansion plans nearing completion and volume growth expected to start by the end of FY13 with the commissioning of the 0.36mtpa Mahan smelter. At the same time, Novelis has been a steady performer despite global economic uncertainties and should see continued improvement with focus on recycling and expansion in growth markets of China, Korea and South America.
Initiate coverage with BUY rating and target price of INR143
We initiate coverage of Hindalco with a BUY rating and target price of INR143.
• We expect Novelis to continue to record robust performance driven by efficient operations and judicious capex plans. The company is investing in growing markets of Asia and South America and is focusing on expanding recycling capacity across the regions. These two factors should lead to another inflection in Novelis EBITDA by FY15, we believe.
• Its Indian expansion is nearing completion and even without captive coal blocks, the projects would be profitable, in our view. With a captive bauxite mine, Hindalco will have an advantage of USD200/tonne in cost of production which should keep it in a much better shape than peers such as Vedanta Aluminium (not listed), which is a loss-making entity.
Recent stock price correction provides attractive opportunity
Hindalco’s stock price has corrected by 30% over the last seven months (vs 2% correction in SENSEX and 18% correction in the BSE metals index) primarily on account of: 1) weak global macroeconomic conditions; 2) concerns about coal block development – development of coal blocks had been stuck for various government approvals, and now with the CAG report questioning the methodology of allocating coal blocks, there are concerns that it might be delayed further; and 3) temporary power-related issues –the power plant had to be shut down temporarily, which affected aluminium production in Q1FY13.
We believe the recent correction provides an attractive entry point given our view that: 1) Novelis remains a pillar of strength and should see continued strong profitability with higher recycling and strategic investment; and 2) Indian operations should see strong EBITDA growth despite a delay in coal block development as we expect Hindalco’s cost of production to remain less than USD1,700/tonne despite external coal usage.
Aluminium prices bottoming, weak INR a tailwind
Aluminium prices on the London Metal Exchange are down sharply to USD1,900/tone, (down 20% over last six months) primarily on weaker European outlook and fears of slowdown in China. While we believe aluminium prices have bottomed out, we don’t expect significant recovery in aluminium prices as 1) aluminium remains in surplus despite production cuts in effect; and 2) global macro conditions remain sluggish.
At the same time, we believe close to 50% of global aluminium smelters have turned unprofitable at current aluminium prices. This should provide a floor to aluminium prices. However realizations in terms of rupees have been helped by weak currency (INR has depreciated by 12% over last six months), and blended realizations for HNDL should remain flat to marginally positive YoY. Since most of the costs are in INR, we expect profitability to remain intact for Hindalco.

Nomura | Hindalco September 14, 2012
6
Novelis has been a successful acquisition…
Novelis has been a remarkable success for Hindalco as EBITDA has doubled to USD1bn in FY10 and has maintained an annual run rate of USD0.9-1bn consistently for the past 2-3 years. At the same time, Novelis has paid back cash of USD1.7bn to Hindalco in FY11. Novelis is largely a converter with very stable margins (as its margins are not impacted by the volatility of aluminium prices). The company has also been able to operate at full capacity despite the weak economic environment as 60% of its deliveries are in beverage cans for which there is very stable demand.
Focus on recycling, growth projects: expect 2nd EBITDA inflection in FY15-16F
Novelis experienced an inflection in its EBITDA in FY10, when EBITDA doubled to around the USD1bn level. We expect another inflection in EBITDA from FY15F as the company is investing heavily in: 1) expansion in Asian and South American markets; and 2) expanding its recycling capacity at most of its facilities which should improve the use of recycled aluminium by Novelis to 50% in FY16F from the current rate of 37.5%.
The FY10 inflection in EBITDA was on account of: 1) an increased focus on profitable business segments – ie, beverage cans; 2) higher conversion margin; and 3) restructuring of operations. We believe the inflection in FY15F will be more internally driven by judicious and focused capex.
Indian operations: expansion nearing completion
Hindalco plans to increase aluminium smelting capacity to 1.64mn tonnes (from 0.5mn tonnes currently) and alumina refining capacity to 4.5mn tonnes (from 1.5mn tonnes currently) by FY15-16F. This would make Hindalco amongst the largest integrated aluminium companies in the world. Hindalco is also expanding captive power capacity to 4000MW from close to 1100MW currently, which would be sufficient to meet its 100% energy requirement.
While Indian companies in general have faced major hindrances in their expansion plans, with Hindalco also having its shares of problems, we believe the projects now have improved visibility of getting commissioned.
Hindalco’s projects are viable even without captive coal...
All of Hindalco’s expansion plans have been allocated bauxite mines as well as coal blocks by the government. While development of coal blocks has been lagging due to various approval issues, bauxite mine development is going on as per schedule.
While coal block would boost the profitability of the Mahan smelter, we believe that even without it, the cost of aluminium production would be ~USD1,650/tonne. Balco (not listed) and Vedanta Alumina (not listed) have aluminium cost of production of USD1,900-1,950/tonne. Hindalco, owing to its captive bauxite mine, should have an advantage of USD200-250/tonne. Therefore, we estimate the Mahan smelter can generate EBITDA/tonne of USD600- USD650, which would be enough to meet the interest/debt obligation.
Phase wise commissioning to keep leverage under control
Hindalco has a capex plan of USD3.5bn over the next 3 years in India and close to USD1.5bn at Novelis. As a result, we expect standalone net debt to increase to USD3bn in FY14F from USD1.7bn in FY12, and on a consolidated basis, net debt should be close to USD7.5bn in FY14F from USD6bn in FY12.
However, we believe D/E should remain at around 1:1 on a consolidated basis and interest coverage ratio should be at a healthy 4.5-5x. Novelis has debt of USD4bn (out of total consolidated net debt of USD7bn), and it should have sufficient cash flows to meet all its capex and interest servicing needs.

Nomura | Hindalco September 14, 2012
7
We capture recent challenges in our estimates… As discussed above there has been a series of challenging developments affecting the sector and stock performance. We also acknowledge that coal block development will take time and don’t expect it to be operational for another two years. At the same time we have built in benchmark aluminium prices at USD1950/t in FY13F and USD2000/t from FY14F onwards, largely in line with current prices.
Despite improved visibility, we are not going overboard on expansion…
While we believe the visibility on the commissioning of projects has improved, we have not assumed aggressive production from new plants in our forecasts. We expect the Mahan aluminium smelter to gradually ramp up production over the next two years. The table below shows our production forecasts.
We have built in higher costs in the initial phase, and we do not assume any benefit from the Mahan coal block built until FY15.
Fig. 1: Production estimates at Indian operations
Source: Company data, Nomura estimates
Still expect strong EBITDA growth over FY12-16F
We expect Hindalco to record 15% consolidated EBITDA CAGR over FY12-FY14F and 22% CAGR over FY14F-16F on the back of expansion in India and investments in Novelis. Forecast EBITDA growth during FY12-14F is primarily on account of the Mahan smelter coming on line (without coal block development and running on external coal).
We expect the Mahan coal block to be operational by FY15 and hence the EBITDA CAGR post FY14F should be driven by: 1) coal block development; and 2) inflection in Novelis’ profitability driven by expansion and higher recycling. We expect consolidated EBITDA of USD1.96bn in FY14F, up from USD1.5bn in FY12.
Fig. 2: EBITDA growth driven by stable Novelis and expanding Indian ops
Source: Company data, Nomura estimates
FY12 FY13F FY14F FY15F FY16FAlumina
Utkal alumina 400,000 1,050,000 1,350,000
Aditya Aluminium 750,000
Total alumina 1,354,970 1,422,719 1,822,719 2,472,719 3,522,719
Aluminium
Hirakud 35,700 35,879 36,058
Mahan Smelter 143,600 251,300 287,200
Aditya Aluminium 35,900 251,300
Total Aluminium 573,935 573,935 753,235 897,014 1,148,493
FY10 FY11 FY12 FY13E FY14E FY15E
Indian operations (INRmn) 29,499 31,854 31,048 33,356 46,971 54,488
% contribution 30.3% 39.8% 37.9% 37.6% 43.8% 43.1%
Novelis (USDmn) 1,071 971 932 895 985 1,194
% contribution 52.1% 55.3% 54.6% 55.5% 50.5% 52.0%
Others (INRmn) 17,193 3,914 6,167 6,167 6,167 6,167
Total EBITDA (INRmn) 97,458 80,017 81,894 88,726 107,313 126,345

Nomura | Hindalco September 14, 2012
8
The stock has significant option value not built in our TP
We have valued Hindalco at 6x FY14F EBITDA. This means we have not factored in benefits of either the Mahan coal block or the inflection in Novelis EBITDA which we expect from FY15.
The stock has significantly higher intrinsic value as exemplified by the fact that it can have consolidated EBITDA of USD2.9bn in FY16F, up from USD1.96bn in FY14F and USD1.5bn in FY12. On FY16x estimates the stock will have a value of INR240/share (at 6x EV/EBITDA).
Therefore the stock has option value of close to INR100/share which is not yet built in our forecasts. This would be driven by 1) inflection of Novelis EBITDA from USD1bn to USD1.4bn and 2) Indian operations’ EBITDA to USD1.4bn in FY16F from USD650mn in FY12.
Consensus estimates are incorporating most of the recent negatives...
In our view, consensus earnings forecasts are incorporating most of evolving challenges related to coal block issues as well as near-term operational issues. FY13-14 consensus earnings estimates have been revised downwards 10-12% over past six months. We believe current consensus estimates are now in a range easily achievable by the company and can actually have some upside.
Fig. 3: Stock performance vs consensus earnings revision
Source: Bloomberg, Nomura research
The recent stock price correction (30% since February 15, 2012) looks disproportionate to us relative to the 10-12% cut in consensus earnings forecasts. We attribute this de-rating of the stock to sector-related developments over the last few months.
Novelis should generate surplus cash flows despite continuing capex
Novelis has plans to spend USD400mn/year on capex for the next 2-3 years, which would take care of most of the expansion plans discussed above.
We forecast Novelis will generate USD550-600mn of operating cash during FY13F-15F. With capex of USD600mn in FY13F and USD400-500mn thereafter, Novelis should have surplus cash of USD200mn in FY14F-15F and increasing thereafter.
Novelis should generate free cash flow of USD600mn from FY16F, once the majority of its capex plans are completed.
100
110
120
130
140
150
160
15
16
17
18
19
20
Feb-12 Mar-12 Apr-12 May-12 Jun-12 Jul-12 Aug-12 Sep-12
FY13 consensus EPS (LHS)
FY14 consensus EPS (LHS)
HNDL stock price (RHS)

Nomura | Hindalco September 14, 2012
9
Hindalco: A brief introduction
Part of Aditya Birla group, amongst the largest business groups in India
Hindalco is part of the Aditya Birla group, which is amongst the oldest and most prestigious business groups in India. The Aditya Birla group has a presence in a wide range of businesses such as telecom, cement, insurance and finance, fertilisers, retail and metals.
The Aditya Birla group is amongst the largest corporates of India and is part of the Fortune 500 companies with a total size of USD40bn. The leadership of the company has consistently figured amongst the best as per Fortune magazine.
Experienced management team
Hindalco has an experienced management team which in our view has a good track record of focusing on shareholder value.
The Novelis acquisition was generally expected to be a bad business move, but the company has been able to stage a remarkable turnaround at Novelis, in our view, doubling its EBITDA within 3 years of acquiring it. Likewise, its approach towards expansion in India has also turned out to be sensible. Earlier the company was perceived to be too slow and passive compared with peers like Vedanta Group. However, Hindalco’s approach of first getting all necessary approvals and committing big money only after satisfactory progress on all aspects of expansion has helped the company avoid situations of stuck capex like Vedanta Alumina (which has close to USD3bn of capex stuck for want of bauxite mines and necessary approvals).
Key management profile
Mr Kumar Mangalam Birla, Chairman Mr Kumar Mangalam Birla became the chairman of Aditya Birla Group in 1995 and has overseen the group’s growth from USD2bn turnover in 1995 to USD40bn at present.
He has focused on making all the group companies more professional and aggressive, which has resulted in the company attaining a leadership position in its various businesses. Mr Birla has also been instrumental in simplifying the group structure by reducing crossholding (like merging all cement businesses in Ultratech and focused on growth both through the organic route (expansion at aluminium and cement business) and inorganic route (acquisitions of Novelis, Columbian Chemicals, etc).
Mr Debu Bhattacharya, Managing Director Mr Bhattacharya joined Aditya Birla Group in 1998 and has been the Managing Director of Hindalco and on its board since 2003. Prior to joining Aditya Birla Group, Mr Bhattacharya worked for various subsidiaries of Unilever Ltd and was inducted on the board of directors for Hindustan Unilever (HUVR IN, Reduce) in 1991.
Largest aluminium and copper producer in India
Hindalco is the largest aluminium and copper producer in India and has the largest aluminium rolling operations globally through its fully owned subsidiary Novelis, which it acquired in May 2007.
Hindalco’s total aluminium capacity is 0.5mn tonnes currently, which it plans to raise to 1.6mn tonnes by FY15-16F. It has a copper smelting capacity of 0.5mn tonnes as well. At the same time, Hindalco has 3mtpa of rolling capacity through Novelis and also holds copper mines in Australia (though not significant).

Nomura | Hindalco September 14, 2012
10
Fig. 4: Hindalco product mix – Indian aluminium (FY12)
Source: Company data
Around 60% of the company’s total aluminium production is sold in value-added form.
Novelis provides HNDL with global footprint
With the acquisition of Novelis, the largest aluminium-rolling company in the world, Hindalco extended its presence in 11 countries across North America, Europe, Asia and South America. At the same time, the company is now present in downstream facilities with high value-added products.
Hindalco acquired Novelis in May 2007 for a total enterprise value of USD6.2bn and equity value of USD3.4bn. We believe this has been a successful acquisition for Hindalco, given that Novelis has already paid back half the equity invested in cash and has been able to double its EBITDA over the past 4-5 years.
Hindalco has access to captive bauxite and cheaper power
Hindalco has alumina capacity of 1.5mn tonnes and sources all of its bauxite requirement from captive mines. While it operates most of the mines itself, it also operates some mines on a contract basis. Possessing bauxite gives Hindalco an advantage by saving USD200-250/tonne in aluminium production costs.
At the same time, all its current power plants operate either on captive coal or linkage coal; hence it can produce power at INR1.6/kWh. This too gives Hindalco an advantage in terms of saving USD300/tonne in power costs.
Large aluminium expansion plans in India
Hindalco plans to increase its aluminium smelting capacity to 1.64mn tonnes (from 0.5mn tonnes currently) and alumina refining capacity to 4.5mn tonnes (from 1.5mn tonnes currently) by FY15-16F. This would place Hindalco amongst the largest integrated aluminium companies in the world. Hindalco is also expanding captive power capacity to 4,000MW from close to 1,100MW currently, which would be sufficient to meet its full energy requirement, we estimate.
While Indian metal companies, in general, have faced major hindrances in their expansion plans, with Hindalco also having its share of problems, we believe there is improved visibility now on the projects being commissioned.
Extrusion, 5.2%
Rolled products, 31.1%
Wire rods, 16.8%Foils, 3.1%
Ingots, 43.7%

Nomura | Hindalco September 14, 2012
11
Fig. 5: Schedule of projects being commissioned
Source: Company data, Nomura estimates
Shareholding pattern: Well-distributed holdings
The Aditya Birla Group holds a 35% stake in Hindalco and the remaining 65% is held by a mix of institutional and individual investors. 45% of the shares are held by institutional investors, of which 28% are held by FIIs (Foreign Institutional Investors).
Fig. 6: Hindalco – shareholding pattern
Source: Company data (as of June 2012)
LocationAlumina
(ktpa)Aluminium
(ktpa)Power plant
(MW)Total capex
(INRbn)Capex spent
(INRbn) Start date
Hirakud expansion 51 100 10 7 Q4FY13
Mahan smelter (MP) 325 900 105 80 Q4FY13
Utkal Alumina (Orissa) 1,500 73 40 mid FY14
Aditya Aluminium (Orissa) 1,500 325 900 152 40 H2FY15
Latehar (Jharkhand) 325 900 100 - FY16
Promoter holding, 35.0%
DIIs, 16.6%
FIIs, 28.2%
Non institutions, 20.2%

Nomura | Hindalco September 14, 2012
12
Valuation methodology We value Hindalco at 6x FY14F EV/EBITDA – its Indian operations at INR72/share, Novelis at INR54/share and INR17 from its holdings in non-core listed companies. Our TP for Hindalco is INR143. Hindalco’s Indian operations are valued at an EV of INR281.4bn (USD5.2bn) – at 6x FY14F EBITDA of INR47.2bn (USD860mn). We value Novelis at an EV of USD5.9bn – 6x FY14F EBITDA of USD985mn.
Hindalco's peers are trading in the range of 4.5-6.2x EV/EBITDA; we believe HNDL has better earnings growth potential on account of its expansion plans in India and hence ascribe a multiple of 6x. This is also in line with Hindalco's average historic trading multiple.
We value Hindalco at a discount to the average multiple of 6.8x at which global peers are currently trading.
Since we value the stock on FY14F EBITDA not including the benefits of either its coal blocks or inflection in Novelis’ EBITDA, we have not ascribed any value to these in our TP calculation.
Fig. 7: Hindalco – consolidated valuation
Source: Company data, Nomura estimates
We are ascribing just about INR39bn (14% of total India EV) to the new Mahan smelter, as we have assumed INR6.5bn of EBITDA from the new smelter in FY14. This is against the asset size of INR100bn. Therefore, we value just the Mahan smelter in our estimates and that, too, at 40% of the total value. We have not built in any value from other expansions where it has already spent close to INR80bn.
Fig. 8: Valuation of stakes in listed non-core assets
Source: Company data, Bloomberg
Fig. 9: Relative valuation
Bloomberg consensus estimates for Not rated stocks. Pricing as of 12 September. Prices are in local currency.
Source: Bloomberg, Nomura estimates
Entity EV (INRmn)Equity value
(INRmn)Per share
(INR) Valuation methodology
Indian operations 281,358 138,191 72 6x FY14F EBITDA
Novelis 325,050 103,176 54 6x FY14F EBITDA
Other stakes 40,068 17 17% holding co discount
Target price 143
Ticker No of shares CMP (INR)Stake value
(INRmn)
Aditya Birla Chemicals ABCH IN 12,004,987 81 972
Nalco NACL IN 28,667,404 52 1,491
Aditya Birla Nuvo ABNL IN 8,650,412 771 6,669
Grasim GRASIM IN 2,299,059 2,650 6,093
Ultratech UTCEM IN 1,313,748 1,762 2,314
ABML ABY AU 159,820,001 27 4,261
IDEA IDEA IN 228,340,226 80 18,267
Total value 40,068
PriceMkt cap
(USDmn) RatingP/E
(CY13F/FY14F)EV/EBITDA
(CY13F/FY14F)P/B
(CY12F/FY13F)ROE
(CY12F/FY13F)EBITDA margin (CY12F/FY13F)
Rio Tinto RIO AU 55.1 81,495 BUY 7.9 4.5 1.42 17.8% 40.7%
United Co Rusal 486 HK 4.1 8,032 Not rated 61.2 15.7 5.00 8.2% 13.8%
Norsk Hydro NHY NO 27.3 9,816 NEUTRAL 18.5 5.4 0.70 3.8% 10.9%
Alcoa AA US 9.3 9,954 NEUTRAL 12.2 6.2 0.69 5.6% 13.2%
Nalco NACL IN 52.3 2,440 Not rated 13.1 5.5 1.04 7.9% 18.4%
Hindalco Industries HNDL IN 109.1 3,782 BUY 5.3 5.7 0.59 11.1% 11.6%
Sterlite Industries STLT IN 95.1 5,786 BUY 4.8 3.8 0.63 13.2% 26.1%
Hindustan zinc HZ IN 132.4 10,128 BUY 9.4 5.5 1.74 18.6% 50.5%
Average 17.8 6.8 1.5 9.8%

Nomura | Hindalco September 14, 2012
13
Sensitivity analysis
The profitability of Hindalco’s Indian aluminium operations largely depends on aluminium realizations, which are a factor of LME aluminium prices and the USDINR exchange rate.
On our estimates, Hindalco’s FY14F EBITDA would increase by INR4.0-4.5bn (8-10%) for every USD100/tonne increase in aluminium prices. At the same time, with a depreciation of INR1 to the USD, EBITDA would increase by INR1.8-2.1bn (4-5%).
Fig. 10: FY14F standalone EBITDA sensitivity to LME aluminium prices
Source: Company data, Nomura estimates
On our estimates, Hindalco’s FY14F EPS would increase by INR1.6-1.8 (12-15%) for every USD100/tonne increase in aluminium prices. At the same time, with a depreciation of INR1 to the USD, EBITDA would increase by INR0.7-0.8 (5-6%).
Fig. 11: FY14F standalone EPS sensitivity to LME aluminium prices
Source: Company data, Nomura estimates
(INRmn) 1,700 1,800 1,900 2,000 2,100 2,200
50 24,834 28,822 32,810 36,799 40,787 44,775
52 28,425 32,572 36,720 40,868 45,015 49,163
54 32,015 36,322 40,630 44,937 49,244 53,551
56 35,606 40,072 44,539 49,006 53,473 57,939
58 39,196 43,823 48,449 53,075 57,701 62,328
60 42,787 47,573 52,358 57,144 61,930 66,716
LME aluminium prices (USD/t)
US
D/I
NR
ex
chn
age
rate
(INR) 1,700 1,800 1,900 2,000 2,100 2,200
50 4.6 6.1 7.7 9.3 10.8 12.4
52 6.0 7.6 9.2 10.9 12.5 14.1
54 7.4 9.1 10.8 12.5 14.1 15.8
56 8.8 10.6 12.3 14.1 15.8 17.6
58 10.2 12.0 13.8 15.7 17.5 19.3
60 11.6 13.5 15.4 17.2 19.1 21.0
US
DIN
R
exch
nag
e ra
te
LME aluminium prices (USD/t)

Nomura | Hindalco September 14, 2012
14
Novelis: A steady performer Novelis (not listed) is amongst the largest aluminium rolling company in the world and produces sheets which are used in the beverages/food cans, automotive, construction and packaging sectors. It has a rolling capacity of 3.3mt in 11 countries across the world. Hindalco acquired Novelis in May 2007 for an EV of USD6.2bn.
Novelis has been a consistent performer for Hindalco over the past 2-3 years despite a challenging operating environment in western countries. Although 65-70% of Novelis’ deliveries are in North America and Europe (economies with the most challenging outlook as per the company), Novelis has seen stable EBITDA performance.
Novelis currently generates EBITDA of close to USD1bn and we expect EBITDA to remain at the same level in FY13-FY14F. With the benefits of new capex starting, we estimate strong EBITDA growth over FY15-16F to USD1.2-1.4bn.
Novelis has been a successful acquisition for Hindalco
We believe Novelis has proved to be a commendable success for Hindalco both operationally as well as financially.
Hindalco paid a total EV of USD6.2bn and equity value of USD3.4bn to acquire Novelis. Novelis has already paid USD1.7bn of equity to Hindalco. At the same time, even operationally, Novelis has been able to register significant improvement, with EBITDA doubling to USD1bn in FY10, within three years of Hindalco acquisition. We attribute the EBITDA improvement to: 1) the company’s focus on profitable products such as beverage and food cans; 2) higher recycling which has helped lower costs; and 3) industry-wide improvement in conversion margins.
A remarkable turnaround in FY10…
Novelis staged a remarkable turnaround in FY10, when it reported EBITDA/tonne of USD375/tonne and total EBITDA of more than USD1bn for the first time. This, we note, was a sharp jump from EBITDA of nearly USD0.5bn which Novelis had been generating over the previous 7-8 years. This turnaround was driven by a combination of factors such as: 1) increased focus on profitable products – ie, beverage cans; 2) increased focus on recycling; 3) higher conversion margins; and 4) restructuring of non-core assets.
Fig. 12: Novelis – remarkable turnaround from FY10 (USDmn)
Source: Company data
(200)
(100)
0
100
200
300
100
300
500
700
900
1,100
CY04 CY05 FY07 FY08 FY09 FY10 FY11 FY12
EBITDA (LHS)
Adjusted net profit (RHS)

Nomura | Hindalco September 14, 2012
15
The company has concentrated on the profitable can segment
Novelis has increased its focus on high-margin products such as beverage cans, with the share of beverage cans in the total product mix having increased to 61% in FY12 from 51% in FY08. Demand for beverage cans is much more stable than demand in the construction sector, which has been weak due to slower economic growth and fixed asset investments. At the same time, the possibility of recycling leads to potential higher margins in the beverage can business.
Fig. 13: % of cans in the product mix has steadily increased
Source: Company data
Recycling has been another focus area
Novelis is focusing on the higher usage of recycled metal which, in our view, should be a key driver of profitability going forward. We believe the use of recycled aluminium gives an advantage of USD150/tonne (over new aluminium). Please see our calculation in the table below (Fig. 15):
At the current LME aluminium price of USD1,950/ tonne, Novelis pays close to USD2,100/tonne for new aluminium slabs, while the current price of used beverage cans (UBC) is close to USD1,500/ tonne. With a yield of close to 85%, the effective cost of recycled metal would be close to USD1950/tonne, we estimate. Novelis has a capital cost of close to USD650/tonne to set up a recycling plant, which can generate a ROIC of close to 18.1%, on our reading.
Fig. 14: Usage of recycled metal… on a steady increase
Source: Company data, Nomura estimates
51%
56%
58%
58%
61%
46%
48%
50%
52%
54%
56%
58%
60%
62%
FY08 FY09 FY10 FY11 FY12
Cans as a % of total delivery
30%
35%
40%
45%
50%
800
1,100
1,400
1,700
2,000
FY08 FY09 FY10 FY11 FY12 FY13F FY14F FY15F FY16F
Recycling volume (LHS)
% Recycling (RHS)
(Ktonnes)

Nomura | Hindalco September 14, 2012
16
Novelis is expanding its recycling capacity in all the regions it operates in, with a: 1) 400ktpa expansion in Germany; 2) 500ktpa expansion in Korea including recycling capacity; 3) 200ktpa expansion in North America along with recycling expansion, and; 4) 220ktpa expansion in SA with recycling expansion.
With all its expansions, we estimate Novelis would use nearly 50% of recycled metal by FY16F from the current level of 37.5%.
Fig. 15: Dynamics of recycling (USD/t)
Source: Industry data, Nomura estimates
Novelis also benefitted from improvement in industry dynamics
While its improving product mix and increased recycling have helped improve conversion margins, we believe Novelis has also benefitted from an increase in the conversion premium witnessed by the industry. Apart from Novelis, even Hydro and Alcoa witnessed a sharp increase in EBITDA/tonne in FY10.
Fig. 16: The aluminium rolling industry has seen margin improvement in FY10 (USD/t)
Source: Company data, * Novelis year end is March from CY08 – others Dec end
While costs have also increased on account of a hike in fuel prices and higher value added products, the increase in conversion premium has been higher for the aluminium rolling industry.
Novelis was able to bring down costs in FY10 with a fall in energy costs; however, post FY10 there has been a steady increase in conversion costs. However, as shown in the figure below, the increase in costs has been lower than the increase in conversion premium.
Dynamics of recycling
Purchase price of Aluminium Scrap 1,500
Energy cost of melting & conversion 57
Other conversion costs 100
Total cost of recycled Aluminium 1,657
Yield 0.85
Recycled aluminium cost 1,950
Cost of new Aluminium
LME Al price 1,950
Physical premium 150
Per tonne cost 2,100
Additional margin 150
Capex required for recycling plant 650
ROIC (%) 18.1%
0
50
100
150
200
250
300
350
400
CY06 CY07 CY08 CY09 CY10 CY11
Alcoa
Hydro
Novelis*

Nomura | Hindalco September 14, 2012
17
This has been a key driver of Novelis’ steady EBITDA. Going forward, we expect production costs to decline marginally primarily owing to operating leverage resulting from its expansion plans.
Fig. 17: Change in conversion premiums and cost of conversion for Novelis (USD/t)
Source: Company data, Nomura estimates
Fig. 18: Novelis: key financials
Source: Company data, Nomura estimates
A strategic capex plan – centred around recycling and expansion in growth markets
We believe Novelis has adopted a very calculated expansion plan which focuses on its growth markets of Asia and South America. At the same time, the company is also focusing on expanding its recycling capacity across all its regions of operation. The following figure shows key details of its expansion projects.
Fig. 19: Novelis – Major capacity expansion plans
Source: Company data, Nomura research
150
180
210
240
270
300
330
360
(40)
(20)
0
20
40
60
80
100
FY9 FY10 FY11 FY12 FY13F FY14F
Conversion premium change (LHS)
Conversion cost change/t (LHS)
Adjusted EBITDA/t (RHS)
FY10 FY11 FY12 FY13F FY14F FY15F FY16F
Total deliveries (ktonnes) 2,854 3,097 2,982 2,958 3,167 3,669 3,861
% of recycled materials 35.0% 33.6% 37.5% 39.0% 41.2% 42.4% 49.9%
EBITDA (USDmn) 1,071 971 932 895 985 1,194 1,418
EBITDA/t 375 314 313 302 311 326 367
Interest cost (USDmn) 175 207 305 291 291 291 291
Net profit (USDmn) 405 116 63 201 236 346 491
Gross debt (USDmn) 2,586 4,105 4,362 4,362 4,362 4,362 4,340
Net debt (USDmn) 2,149 3,794 4,045 4,034 3,846 3,550 2,801
Capex (USDmn) 206 274 413 600 372 361 161
Entity Expansion (ktpa) Timeline Details
Brazil 220 end 2012 Includes 190ktpa recycling
North America 200 Mid 2013 Largely for auto sheets
South Korea 350 end 2013 Includes 220ktpa recycling
China 120 end 2014 Automotive sheeet heat treatment
Germany 400 early CY15 Integrated recycling

Nomura | Hindalco September 14, 2012
18
Novelis may see another EBITDA inflection from FY15F on completion of capex plans
While Novelis saw its first EBITDA inflection in FY10, when EBITDA grew from close to USD500mn in FY08-09 to USD1bn, we expect another inflection in EBITDA from FY15F as the company is investing heavily in: 1) expansion in Asian and South American markets; and 2) expanding its recycling capacity across the regions which would increase Novelis’ usage of recycled aluminium to 50% in FY16F from the current 37.5%.
As a result of the above two factors, we estimate EBITDA to increase to USD1.2bn in FY15F and USD1.4bn in FY16F. However, since we value the stock at FY14F EV/EBITDA, these forecast upsides have not been captured in our valuations.
We estimate a flattish conversion premium going forward.
Fig. 20: Novelis should see another inflection in FY15F (USDmn)
Source: Company data, Nomura estimates
Novelis should continue to generate surplus cash despite significant capex plans
Novelis plans to spend USD400mn/year on capex over the next 2-3 years, as per management, which we estimate should take care of most of its expansion plans discussed above. On our estimates, Novelis would generate USD550-600mn of operating cash during FY13-15F. With capex of USD400mn per year, Novelis should have surplus cash of USD150-200mn over the next two years, increasing thereafter. On our reading, Novelis should generate free cash flow of USD600mn from FY16F, once majority of its capex plans are completed.
(100)
0
100
200
300
400
500
400
600
800
1,000
1,200
1,400
1,600
FY08 FY09 FY10 FY11 FY12 FY13F FY14F FY15F FY16F
EBITDA (LHS)
Adjusted net profit (RHS)
Nomura | Hindalco September 14, 2012
19
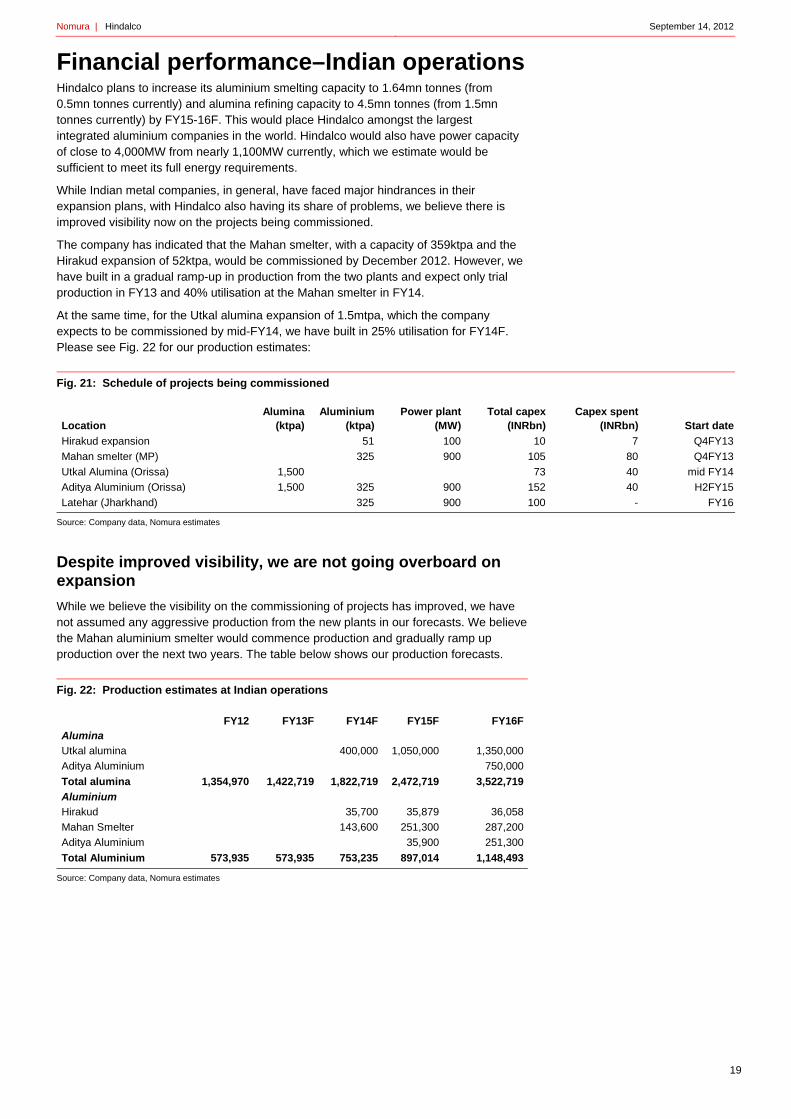
Financial performance–Indian operations Hindalco plans to increase its aluminium smelting capacity to 1.64mn tonnes (from 0.5mn tonnes currently) and alumina refining capacity to 4.5mn tonnes (from 1.5mn tonnes currently) by FY15-16F. This would place Hindalco amongst the largest integrated aluminium companies in the world. Hindalco would also have power capacity of close to 4,000MW from nearly 1,100MW currently, which we estimate would be sufficient to meet its full energy requirements.
While Indian metal companies, in general, have faced major hindrances in their expansion plans, with Hindalco also having its share of problems, we believe there is improved visibility now on the projects being commissioned.
The company has indicated that the Mahan smelter, with a capacity of 359ktpa and the Hirakud expansion of 52ktpa, would be commissioned by December 2012. However, we have built in a gradual ramp-up in production from the two plants and expect only trial production in FY13 and 40% utilisation at the Mahan smelter in FY14.
At the same time, for the Utkal alumina expansion of 1.5mtpa, which the company expects to be commissioned by mid-FY14, we have built in 25% utilisation for FY14F. Please see Fig. 22 for our production estimates:
Fig. 21: Schedule of projects being commissioned
Source: Company data, Nomura estimates
Despite improved visibility, we are not going overboard on expansion
While we believe the visibility on the commissioning of projects has improved, we have not assumed any aggressive production from the new plants in our forecasts. We believe the Mahan aluminium smelter would commence production and gradually ramp up production over the next two years. The table below shows our production forecasts.
Fig. 22: Production estimates at Indian operations
Source: Company data, Nomura estimates
LocationAlumina
(ktpa)Aluminium
(ktpa)Power plant
(MW)Total capex
(INRbn)Capex spent
(INRbn) Start date
Hirakud expansion 51 100 10 7 Q4FY13
Mahan smelter (MP) 325 900 105 80 Q4FY13
Utkal Alumina (Orissa) 1,500 73 40 mid FY14
Aditya Aluminium (Orissa) 1,500 325 900 152 40 H2FY15
Latehar (Jharkhand) 325 900 100 - FY16
FY12 FY13F FY14F FY15F FY16FAlumina
Utkal alumina 400,000 1,050,000 1,350,000
Aditya Aluminium 750,000
Total alumina 1,354,970 1,422,719 1,822,719 2,472,719 3,522,719
Aluminium
Hirakud 35,700 35,879 36,058
Mahan Smelter 143,600 251,300 287,200
Aditya Aluminium 35,900 251,300
Total Aluminium 573,935 573,935 753,235 897,014 1,148,493

Nomura | Hindalco September 14, 2012
20
Strong EBITDA growth despite assuming high cost of production in initial phase
We expect Hindalco to see standalone EBITDA growth of 7.4% in FY13F and 40.8% in FY14F primarily on account of Mahan and Utkal alumina expansion coming on line in FY14.
We estimate cash cost of production from the new smelter to remain close to USD1650/tonne in FY14F as Hindalco will be using external coal (through a mix of e-auction and imports). We expect the cash cost should come down to USD1200/tonne by FY16F, when the coal block allotted to them is operational.
Fig. 23: Standalone EBITDA should be strong, but net profit growth muted
Source: Company data, Nomura estimates
However EPS growth should remain muted on higher depreciation and interest cost
Despite expecting strong EBITDA growth in FY12-14F, we believe net profits will see only muted growth as depreciation and interest costs are likely to rise. We expect interest cost to increase from INR2.9bn in FY12 to INR7.1bn in FY14F and INR13.8bn in FY16F. Hindalco capitalized INR7.2bn of interest accrued on expansion projects in FY12, and this number should increase as the company goes for more capex.
Interest expense is recognised in the P&L account only when the capex is commissioned and during the development phase the interest on the CWIP (capital work in progress) is capitalised.
Fig. 24: Standalone interest cost calculation (INR mn)
Source: Company data, Nomura estimates
We expect flat net profit y-y in FY13F followed by a 10.6% increase in FY14F. This is primarily because in the initial phase of project commissioning, projects should be just about profitable given 1) lower capacity utilization; and 2) the high cost of production in the initial stage.
10
12
14
16
18
20
10,000
20,000
30,000
40,000
50,000
60,000
70,000
80,000
FY09 FY10 FY11 FY12 FY13F FY14F FY15F FY16F
EBITDA (LHS)
Net profit (LHS)
EPS (RHS)
(INRmn) (INR)
FY10 FY11 FY12 FY13E FY14E FY15E
Total ineterst cost 6,138 6,103 10,185 15,835 18,643 18,643
Interest capitalized 3,358 3,903 7,249 12,500 11,500 8,500
CWIP 37,028 94,641 162,569 140,069 116,569 45,069
Transferred to P&L 2,780 2,200 2,936 3,335 7,143 10,143

Nomura | Hindalco September 14, 2012
21
Fig. 25: Indian operations: Key financial details
Source: Company data, Nomura estimates *blended realizations including excise
The aluminium realizations in the table above are higher than base aluminium prices as 60% of Hindalco’s deliveries are in value-added segments. Gradually the proportion of valued-added products is coming down, and hence realizations going forward are softening.
Leverage ratio not concerning to us – phase-wise commissioning of projects should keep it under control
According to management, Hindalco has planned capex of USD3.5bn over next 3 years in India and close to USD1.5bn at Novelis. We expect Hindalco to generate operating cash of USD2.2bn over next 3 years – USD560mn in FY13F, USD770mn in FY14F and USD885mn in FY15F. Thus, we expect standalone net debt to increase to USD3bn in FY14F from USD1.7bn in FY12, and on a consolidated basis, we look for net debt close to USD7.5bn in FY14F from USD6bn in FY12.
We expect D/E to remain around 1:1 on a consolidated basis, and even interest coverage ratio should be at a healthy 4.5-5x. Note that Novelis has debt of USD4bn (out of total consolidated net debt of USD7bn), and it should have sufficient cash flows to meet all its capex and interest servicing needs, in our view.
Production volume (ktonnes) FY11 FY12 FY13F FY14F FY15F FY16F
Alumina 1,353 1,355 1,423 1,823 2,473 3,523
Aluminium 538 574 574 753 897 1,148
Copper cathode 336 331 335 350 360 370
Sales volume (ktonnes)
Alumina 310 319 309 361 733 1,295
Aluminium (total) 534 574 574 753 897 1,148
Copper cathode 208 189 191 206 215 225
CC Copper rods 142 143 146 146 146 146
LME aluminium price (USD/t) 2,250 2,200 1,950 2,000 2,000 2,000
Exchange rate 45.0 47.7 55.0 55.0 55.0 55.0
Actual Al realization* (INR/t) 128,533 154,693 153,266 155,361 152,720 149,207
Net sales (INRmn) 238,592 265,968 286,879 323,842 355,845 407,514
EBITDA (INRmn) 31,854 31,048 33,356 46,971 54,488 75,158
Interest cost (INRmn) 2,200 2,936 3,335 7,143 10,143 13,843
Depreciation (INRmn) 6,875 6,900 8,181 12,530 17,370 21,365
Net profit (INRmn) 21,369 22,372 22,956 27,376 27,924 38,275
EPS (INR) 11.2 11.7 12.0 13.3 13.5 18.5
Gross debt (INRmn) 72,715 145,719 195,719 215,719 195,719 175,719
Net debt (INRmn) 18,411 92,662 143,168 163,946 147,390 109,069
Capex (INRmn) 58,649 69,834 77,500 76,500 28,500 23,000

Nomura | Hindalco September 14, 2012
22
Fig. 26: Consolidated Hindalco leverage ratio
Source: Company data, Nomura estimates (interest on CWIP projects is capitalized)
Fig. 27: Standalone Hindalco leverage ratio
Source: Company data, Nomura estimates (interest on CWIP projects is capitalized)
Most of the debt in India is through project financing for expansion and is secured by the cash flows of the respective projects. Since we expect these projects to generate enough cash flow (even without coal blocks) to service debt, we do not expect cash flow pressure on Hindalco.
The company capitalizes interest costs on projects yet to be commissioned, and payments start only after commercial production starts.
Copper business contribution likely to shrink further
Hindalco also has copper smelting business with total capacity of 0.5mtpa. However, given that it is a custom smelter, the copper business contribution to Hindalco’s overall profit is low. Copper contributed close to 30% of total EBIT in FY12, and we expect it to gradually shrink to 15% by FY16F as incremental production from new aluminium projects start.
Fig. 28: Copper business contribution should shrink gradually
Source: Company data, Nomura estimates
0
1
2
3
4
5
6
0
100,000
200,000
300,000
400,000
500,000
FY11 FY12 FY13F FY14F FY15F FY16F
Net debt (LHS)
D/E (RHS)
Interest coverage ratio (RHS)
(x)(INRmn)
0
2
4
6
8
10
12
0
20,000
40,000
60,000
80,000
100,000
120,000
140,000
160,000
180,000
FY12 FY13F FY14F FY15F FY16F
Net debt (LHS)D/E (RHS)Interest coverage ratio (RHS)
(x)(INRmn)
0%
5%
10%
15%
20%
25%
30%
35%
0
5,000
10,000
15,000
20,000
25,000
30,000
35,000
40,000
45,000
50,000
FY10 FY11 FY12 FY13F FY14F FY15F FY16F
EBIT from al business (LHS)
EBIT from copper business (LHS)
% from copper business (RHS)

Nomura | Hindalco September 14, 2012
23
Access to captive bauxite keeps projects viable even without coal block…
Hindalco plans to increase its refining capacity by 3mtpa – 1.5mtpa each at Utkal Alumina and Aditya Aluminium. According to management, Utkal Alumina should be ready for commissioning by FY14 and Aditya Aluminium should start production by FY15-16.
Hindalco has been allocated the Baphlimali bauxite mine in Orissa (by the government) and has plans for production capacity of 8.5mtpa. We believe this should be sufficient to meet 100% of Hindalco’s bauxite needs for its refineries by the time refinery production starts.
Having access to a bauxite mine gives the company an advantage of close to USD15-20/tonne, as per management. The company can get captive bauxite at USD13-15/t, as against current market price in excess of USD35-40/t. Since 3 tonnes of bauxite is required per tonne of alumina, we calculate that it straightway gives Hindalco an advantage of USD60/tonne in cost of production.
Please see the table for cost of production expected at Utkal Alumina. Even for upcoming capacity at Aditya, we expect alumina costs should be around USD220/tonne.
Fig. 29: Contribution of new projects
Source: Company data, Nomura estimates
FY14F FY15F FY16FLME aluminium price (USD/t) 2,000 2,000 2,000
Freight + premium (USD/t) 200 200 200
Import duty (USD/t) 110 110 110
Total Al realization (USD/t) 2,310 2,310 2,310
Cost of production/t (USD/t) 1,648 1,534 1,193
EBITDA/t of AL (USD/t) 662 776 1,117
Total AL production (tonnes) 179,300 323,079 574,558
EBITDA from aluminium (USDmn) 119 251 642
Alumina realization (USD/t) 350 350
Alumina cost of production (USD/t) 245 238 217
Alumina - EBITDA/t (USD/t) 112 133
Total alumina produced (tonnes) 400,000 1,050,000 2,100,000
Excess Alumina (tonnes) 0 429,689 996,849
EBITDA from alumina (USDmn) 0 48 132
EBITDA (INRmn) 6,531 16,433 42,573
Depreciation (INRmn) 2,761 5,779 10,712
Interest cost (INRmn) 4,832 6,809 10,509
PBT (INRmn) -1,062 3,845 21,352
PAT (INRmn) -850 3,076 17,082

Nomura | Hindalco September 14, 2012
24
Fig. 30: Alumina cost of production at Utkal
Source: Company data, Nomura estimates
Mahan coal block on the fast track, however, progress may be hampered by recent controversy
Mahan coal block development has been the key roadblock for Hindalco’s first expansion project of 325ktpa in Madhya Pradesh. With increased focus on improving coal availability in India, Mahan coal block has seen increased attention from the government of India, and the EGOM (Empowered Group of Ministers) has expedited the process of approving this project. While final approvals are still pending, there is an improved visibility of the coal block starting in the near term, in our view.
The EGOM has approved Mahan coal block with the following conditions (as per management):
1) Hindalco needs to conduct reforestation on a land parcel equivalent to that used for mining
2) 5% of total mining profit must be used for local area development
3) The company must monitor the impact on the Rehan water reservoir
4) The mining plan has been revised to reduce the permitted mining area
However, with the recent roadblock on account of CAG reporting corruption issues related to the allotment of coal mines, the start-up of the block might be hampered, in our view. Though Hindalco has not been accused of any wrongdoing, often in such cases, the whole sector suffers from slow decision-making by the government.
Mahan smelter should start production from FY14 – initial production driven by E-Auction coal
Hindalco has indicated that it will start production at the Mahan smelter by the end of FY13. It plans just trial production in FY13, with commercial production starting from FY14. In the initial period (before coal block starts production i.e. late FY15), Hindalco would procure coal from E-Auction and imports to run its power plants to meet the energy requirements for aluminium production.
A power plant running on a mix of E-Auction and imported coal should produce power at the rate of INR2.5/kWh (as is the case for Sterlite Energy), as per our estimates – while with captive coal power generation cost would be close to INR1.1/kWh.
We expect 143,600 tonnes of aluminium production in FY14F – which would be totally dependent on power generated from external coal. Therefore, the cost of production during FY14F would be close to USD1700/tonne, based on our calculations.
In FY15F, we have built in costs improving to USD1,578/tonne with the stabilization of operations. We have built in the benefits of captive coal starting from late FY15F. Cost of production can come down to USD1,200/tonne by FY16 when coal block is fully operational.
(USD/t) Units/t Unit Captive coal External coal
Coal cost 650 Kg/t 12 35
Fuel oil 85 Lit/t 46 46
Power cost 500 KWH/t 10 23
Total power and fuel cost 68 105
Bauxite 3 Tonnes/t 39 39
Caustic soda 135 Kg/t 74 74
Total RM cost 113 113
Employee cost 27 27
Other overheads 9 9
Total cost/t (USD) 217 254

Nomura | Hindalco September 14, 2012
25
Fig. 31: Cost of production expected at Mahan smelter in different scenarios (expect captive coal to start by end FY15F)
Source: Company data, Nomura estimates
Utkal Alumina to provide alumina for aluminium production at Mahan
Since Hindalco already has access to a captive bauxite mine which the company indicated would be operational from FY14, we expect initial production of 350,000 tonnes (close to 23% utilization) in FY14F from Utkal Alumina, which would be sufficient to meet requirements at the Mahan smelter. We expect alumina cost of production at USD240/tonne in the initial year, which we estimate should come down to USD215/t gradually with ramp up of production and access to captive coal.
Expect similar costs for future expansion of Hindalco
Given that even other expansions at Hindalco such as Aditya Aluminium will have access to both captive bauxite and coal block (as and when they become operational), we expect the cost of production to be around the same level as that of Utkal Alumina (USD215/tonne in FY16) and the Mahan smelter (USD1,200/tonne in FY16). We have not built these expansions into our forecasts until FY15F.
Without captive coal With captive coal Consumption/t (Kg)
Alumina cost (USD/t) 490 434 2,000
CT Pitch (USD/t) 47 47 100
CP coke (USD/t) 160 160 350
Aluminium Floride (USD/t) 27 27 25
Raw material cost (USD/t) 725 669
Power & fuel cost (USD/t) 732 333 15,000
Staff cost (USD/t) 100 100
Overheads (USD/t) 91 91
Total cash cost (USD/t) 1,648 1,193

Nomura | Hindalco September 14, 2012
26
Aluminium – prices bottoming out Aluminium prices have come down sharply to USD1,900/tonne on LME (down 20% over last six months), primarily on the weaker European economic outlook and fears of slowdown in China. We had expected aluminium prices to be under continued pressure (see “Initiating Coverage of Americas Metals/Mining: Proceed with Caution”, by Nomura analysts Curt Woodworth and Tom Qiu, published 1 March 2012). However, the scale of the correction has been sharper than we expected.
We don’t expect significant recovery in aluminium prices in the near term as: 1) the aluminium market remains in surplus despite production cuts in effect; and 2) global macro conditions remain sluggish. However, we also don’t expect prices to fall significantly as we believe the cost of production remains elevated with close to 50% of global aluminium smelters unprofitable at current prices, which should support the downside. We are assuming aluminium prices of USD1,950/tonne in FY13F and USD2,000/tonne in FY14F for Hindalco.
Aluminium demand has slowed; production cuts announced
We expect global aluminium demand growth of 4% in 2012F and 7% in 2013F, down from 16% in 2010 and 7% in 2011. We see a sharp slowdown in European demand (-12% in 2012F from 11.5% growth in 2010 and 18.3% growth in 2011) and moderation in China (9% growth in 2012F from 22% in 2010 and 13.5% in 2011).
On the supply side, we expect production growth to moderate to 1.5% in 2012F and 8% in 2013F. Companies such as Alcoa and Rio Tinto have announced shutdowns of high-cost capacity which should reduce operational capacity by close to 0.8mn tonnes.
Fig. 32: Announced aluminium capacity cuts ('000 tonnes per annum)
Source: Brookhunt, Nomura research
Inventories remain high, though surplus is narrowing
With the production cuts announced by major smelters in light of lower aluminium prices and the weaker demand outlook, aluminium surplus has started to narrow. We expect aluminium production to outpace demand by 428kt in 2012F and 780kt in 2013F. There was surplus production of 7.2mn tonnes over 2008-11, or an average surplus of 1.8mn tonnes per year.
With narrowing surplus, global aluminium inventory has started to stabilize, and we expect it to peak near the current level around 110 days of consumption.
Widespread production cuts globally, but higher Chinese production undermines the effort
During the first half of 2012, aluminium production in the world excluding China declined by 2% YoY. However, global production was still 3% higher YoY due to 11% production growth in China. Some of the above production cuts have been on account of forced outages and these are expected to be back in production by the year-end. As a result, unless Chinese production comes down or global demand improves, we should start
Company SmelterOct 2011
rateReduced
rateEffective
dateCurrent
rate
Aluar Puerto Madryn, Arg. 460 375 Nov-11 420
Rio Tinto Alma, Canada 438 145 Dec-11 145
Rio Tinto Shawinigan, Canada 100 50 Jan-12 100
BHP Billiton Hillside, South Africa 715 465 Mar-12 525
CVG Alcasa, Venezuela 328 172 Jun-12 165
Sohar Aluminium Sohar, Oman 370 300 Jul-12 300
Total 2,411 1,507 1,655

Nomura | Hindalco September 14, 2012
27
seeing production surplus increasing. As can be seen in table below, we expect production surplus of 780kt in 2013F after surplus falls to 428kt in 2012F.
Fig. 33: Global aluminium demand supply scenario ('000 tonnes)
Source: Brookhunt, Nomura estimates
Higher physical premium has helped aluminium smelters…
While aluminium prices have come down sharply and costs remain elevated, there has been a respite for smelters’ profitability on account of increase in physical premium. Physical premium has increased due to restrained supply caused by various forced production cuts as well as continued high primary aluminium sourcing by China.
As a result, physical premium in the Asia Pacific region has increased to USD175/tonne primarily on account of force majeure declared by Rio Tinto at its Sohar smelter in Oman which had production capacity of 375ktpa. Current premiums for Q42012 aluminium supply are being negotiated at close to USD250/tonne.
Physical premium may moderate once smelters that had been forced to close start production again, in our view. We have assumed USD150/tonne of premium going forward.
Refined Consumption 2,008 2,009 2,010 2,011 2012F 2013F 2014FEmerging Economies
China 12,560 13,879 16,932 19,222 20,957 23,202 25,657
y-o-y % 1.7% 10.5% 22.0% 13.5% 9.0% 10.7% 10.6%
India 1,284 1,478 1,715 1,869 2,052 2,252 2,340
y-o-y % 6.4% 15.1% 16.0% 9.0% 9.8% 9.7% 3.9%
Russia 1,020 884 975 1,089 1,164 1,261 1,343
y-o-y % 0.0% -13.3% 10.3% 11.7% 6.9% 8.3% 6.5%
Brazil 860 799 1,026 1,109 1,157 1,218 1,390
y-o-y % 8.2% -7.1% 28.4% 8.1% 4.3% 5.3% 14.1%
Developed Economies
United States 5,364 4,141 4,627 4,803 5,044 5,266 5,468
y-o-y % -9.5% -22.8% 11.7% 3.8% 5.0% 4.4% 3.8%
Japan 2,250 1,711 1,793 1,704 1,905 1,874 1,821
y-o-y % 2.4% -24.0% 4.8% -5.0% 11.8% -1.6% -2.8%
Other Regions
Asia (ex-China, India, Japan) 4,014 3,992 4,559 3,311 3,468 3,698 5,751
y-o-y % -2.4% -0.5% 14.2% -27.4% 4.7% 6.6% 55.5%
North America (ex-US) 709 583 658 696 755 772 807
y-o-y % -10.6% -17.8% 12.9% 5.8% 8.5% 2.3% 4.5%
Latin America (ex-Brazil) 749 777 843 882 936 983 1,051
y-o-y % 15.6% 3.7% 8.5% 4.6% 6.1% 5.0% 6.9%
Europe (ex-Russia) 7,828 6,315 7,039 8,330 7,336 7,530 7,947
y-o-y % -3.2% -19.3% 11.5% 18.3% -11.9% 2.6% 5.5%
Oceania 462 438 468 464 496 511 521
y-o-y % 4.1% -5.2% 6.8% -0.9% 6.9% 3.0% 2.0%
Africa 468 424 531 548 573 604 637
y-o-y % -4.9% -9.4% 25.2% 3.2% 4.6% 5.4% 5.5%
Total Global Demand 37,568 35,421 41,166 44,027 45,843 49,171 54,733
-6% 16% 7% 4% 7% 7%
Estimated Global Supply 40,039 37,504 42,285 45,593 46,271 49,954 56,178
12.7% 7.8% 1.5% 8.0% 12.5%
Supply/Demand Surplus 2,471 2,083 1,119 1,566 428 783 1,445
Total inventory 7,718 10,208 12,041 13,372 13,800 14,584 16,029
Inventory (no of days) 75 105 107 111 110 108 107
Nomura | Hindalco September 14, 2012
28
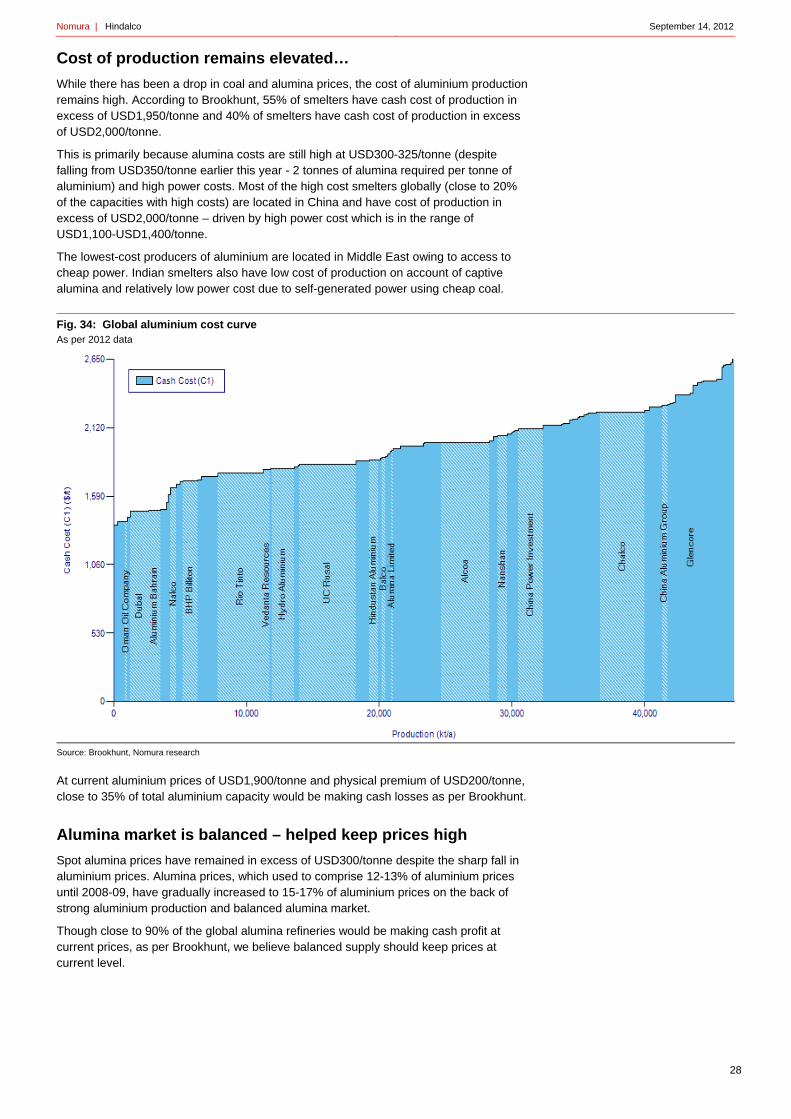
Cost of production remains elevated…
While there has been a drop in coal and alumina prices, the cost of aluminium production remains high. According to Brookhunt, 55% of smelters have cash cost of production in excess of USD1,950/tonne and 40% of smelters have cash cost of production in excess of USD2,000/tonne.
This is primarily because alumina costs are still high at USD300-325/tonne (despite falling from USD350/tonne earlier this year - 2 tonnes of alumina required per tonne of aluminium) and high power costs. Most of the high cost smelters globally (close to 20% of the capacities with high costs) are located in China and have cost of production in excess of USD2,000/tonne – driven by high power cost which is in the range of USD1,100-USD1,400/tonne.
The lowest-cost producers of aluminium are located in Middle East owing to access to cheap power. Indian smelters also have low cost of production on account of captive alumina and relatively low power cost due to self-generated power using cheap coal.
Fig. 34: Global aluminium cost curve As per 2012 data
Source: Brookhunt, Nomura research
At current aluminium prices of USD1,900/tonne and physical premium of USD200/tonne, close to 35% of total aluminium capacity would be making cash losses as per Brookhunt.
Alumina market is balanced – helped keep prices high
Spot alumina prices have remained in excess of USD300/tonne despite the sharp fall in aluminium prices. Alumina prices, which used to comprise 12-13% of aluminium prices until 2008-09, have gradually increased to 15-17% of aluminium prices on the back of strong aluminium production and balanced alumina market.
Though close to 90% of the global alumina refineries would be making cash profit at current prices, as per Brookhunt, we believe balanced supply should keep prices at current level.

Nomura | Hindalco September 14, 2012
29
While aluminium inventory has increased from 50 days of consumption in 2008 to 110 days of consumption now, alumina inventory has actually come down from 48 days of consumption to 45 days of consumption. Brookhunt expects alumina inventory to gradually increase and should stabilize at close to 55 days of consumption in 2014.
Alumina cost supported by high bauxite and raw material cost
Bauxite and caustic soda are key raw materials for making alumina and account for close to 45-50% of total cost of production. Power cost is close to USD60-100/tonne and accounts for 30% of total cost.
The average cost of producing alumina globally is around USD275/tonne according to Brookhunt, with most efficient capacities at USD190-195/tonne. At current alumina prices close to 90% of global capacity would be profitable, as per Brookhunt.
Fig. 35: Alumina cost curve As per 2012 data
Source: Brookhunt, Nomura research

Nomura | Hindalco September 14, 2012
30
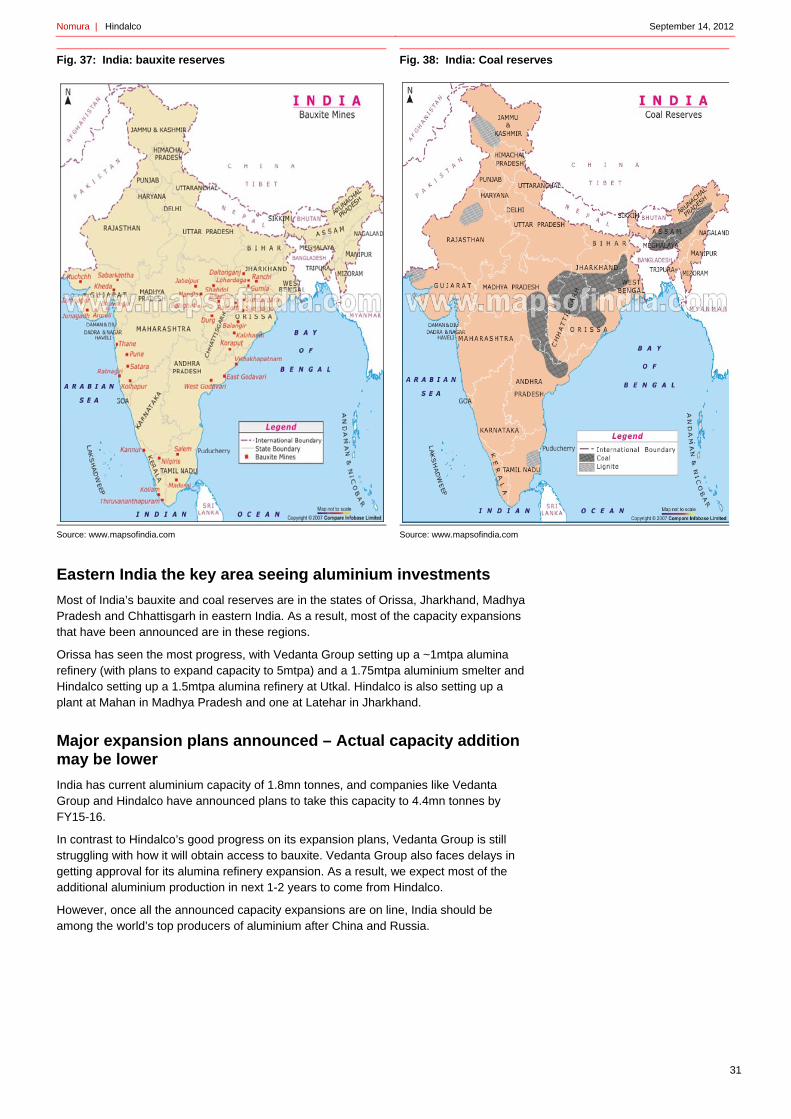
India: one of the best locations globally for aluminium production India should be one of the best locations in the world for making aluminium given its: 1) low cost of production owing to captive bauxite and coal; 2) availability of labour at relatively low cost; and 3) shortage of aluminium relative to local demand.
Despite these advantages, the industry has not seen the desired growth, as all the announced projects have seen delays associated with: 1) land acquisition; 2) mine development; and 3) various regulatory approvals. However, we expect the situation to improve, as there are signs of improved decision-making as reflected in the case of Hindalco’s Mahan block.
Coal and bauxite key to aluminium profitability
Alumina and power costs typically comprise 60-70% of total aluminium production cost, according to Brookhunt. To produce one tonne of aluminium, two tonnes of alumina and 15,000kWh of power are needed. Each tonne of alumina in turn requires 3 tonnes of bauxite. Therefore, the key raw materials for aluminium production are: 1) bauxite; and 2) power.
In India, since most of the aluminium smelters use power from coal-based captive power plants, coal becomes an important raw material for them. Therefore coal and bauxite are key raw materials for aluminium producers in India.
Typically smelting and refining capacities are in different locations…
Alumina refining and aluminium smelting are two key stages of production. Alumina refineries are located closer to bauxite mines, meaning that countries such as Australia, China, and Brazil which have large bauxite reserves are among the largest alumina producers.
Meanwhile, smelters are typically located in the regions with low cost of power, so countries in the Middle East, Russia and Canada, which have lower power cost owing to cheaper oil and hydro power respectively, are fast developing as major smelting hubs.
Indian has abundance of both – tapping the resources the key
India has the 6th largest bauxite reserves in the world of 1.1bn tonnes (including operational reserves of 400mn tonnes), and it has 267bn tonnes of coal reserves. India is among the few countries that both has these resources and enjoys a growing market for aluminium. However, despite possessing these huge reserves, actually tapping them has been a herculean task.
Indian companies with access to both captive coal and captive bauxite mines can produce aluminium at cash cost of USD1,200/tonne – among the lowest-cost globally.
Fig. 36: India has abundant bauxite reserves (mn tonnes)
Source: USGS, Nomura research
Country Total reserve Potential reserve Production
Australia 9500 5900 70
Brazil 8200 2000 32
China 2100 900 40
Guinea 14900 400 17
India 1600 400 18
Jamaica 1100 500 9
Nomura | Hindalco September 14, 2012
31
Fig. 37: India: bauxite reserves
Source: www.mapsofindia.com
Fig. 38: India: Coal reserves
Source: www.mapsofindia.com
Eastern India the key area seeing aluminium investments
Most of India’s bauxite and coal reserves are in the states of Orissa, Jharkhand, Madhya Pradesh and Chhattisgarh in eastern India. As a result, most of the capacity expansions that have been announced are in these regions.
Orissa has seen the most progress, with Vedanta Group setting up a ~1mtpa alumina refinery (with plans to expand capacity to 5mtpa) and a 1.75mtpa aluminium smelter and Hindalco setting up a 1.5mtpa alumina refinery at Utkal. Hindalco is also setting up a plant at Mahan in Madhya Pradesh and one at Latehar in Jharkhand.
Major expansion plans announced – Actual capacity addition may be lower
India has current aluminium capacity of 1.8mn tonnes, and companies like Vedanta Group and Hindalco have announced plans to take this capacity to 4.4mn tonnes by FY15-16.
In contrast to Hindalco’s good progress on its expansion plans, Vedanta Group is still struggling with how it will obtain access to bauxite. Vedanta Group also faces delays in getting approval for its alumina refinery expansion. As a result, we expect most of the additional aluminium production in next 1-2 years to come from Hindalco.
However, once all the announced capacity expansions are on line, India should be among the world’s top producers of aluminium after China and Russia.

Nomura | Hindalco September 14, 2012
32
Fig. 39: Indian aluminium capacity expansion plans Capacity by company
Source: Company data, Nomura research
Fig. 40: Indian aluminium demand/supply scenario (kilotonnes)
Source: Crisinfac, Nomura research
Robust demand growth driven by auto and power sector
Indian aluminium demand has been growing at 8.8% a year during FY07-12 driven primarily by growth in auto, power and construction segments. We expect Indian aluminium demand to grow at a CAGR of 8-10% over next 5 years as explained below.
Auto segment: India becoming an export hub should boost aluminium demand The auto sector has been a key contributor to aluminium demand growth in India and we expect the trend to continue despite short-term hiccups. We expect Indian auto demand growth to remain robust with CAGR of 8-10% for two-wheelers and commercial vehicles and 12-15% CAGR for passenger cars over FY13-17F.
Fig. 41: Aluminium consumption pattern in India (FY11)
Source: Crisinfac, Nomura research
Fig. 42: Demand growth by segment
Source: Industry data, Nomura estimates
India is fast developing as an export hub for various global car companies such as Suzuki, Nissan and Renault, and this should contribute to Indian aluminium demand growth as well, in our view.
Power segment: T&D is the key area of usage The power segment has been a key driver of aluminium demand in India. The main area of usage is in the transmission lines. During last five years, total investment in transmission lines was USD25bn, as per data from Ministry of Power, while we expect around USD35bn investments in coming five years as per 12th Five-Year Plan.
(KTPA) FY11 FY12 FY13E FY14E FY15E FY16E
Hindalco 506 506 506 917 1,276 1,635
Nalco 460 460 460 460 460 460
Balco 245 245 245 570 570 570
Vedanta Aluminium 500 500 500 500 1,125 1,750
Al smelter capacity 1,711 1,711 1,711 2,447 3,431 4,415
FY10 FY11 FY12 FY13E FY14E FY15E FY16E
Production 1,525 1,619 1,700 1,734 1,908 2,289 3,091
Imports 407 577 577 577 577 577 577
Exports 400 577 528 423 426 602 1,177
Consumption 1,532 1,619 1,749 1,889 2,059 2,265 2,491
Electricity38%
Transport22%
Machinery8%
Packaging7%
Consumer durable
6%
Others3%
Construction16%
FY07-12 CAGR FY13-17F CAGR
Power sector 8-9% 8-10%
Automotive sector 13-14% 10-12%
Construction demand 4-5% 4-5%
Consumer durables 12-13% 10-12%
Total Aluminium demand 8-9% 8-10%

Nomura | Hindalco September 14, 2012
33
We expect demand for aluminium from the power segment to grow at a CAGR of 8-10% over FY12-17F. Since the power sector has been a focus area for the government, we believe it will be a key growth segment going forward.
India to turn net exporter: cost benefits keep Indian smelters competitive
While we expect robust demand growth, we believe India still will have surplus capacity over the next 2-3 years given the significant capacity additions expected. Based on the planned addition of 2.7mn tonnes of aluminium smelting capacity by FY16, India’s aluminium production should exceed demand in FY16F by around 1.0-1.5mn tonnes, we expect.
However, we believe Indian companies should be able to export any surplus production as all the new capacity will be among the lowest-cost globally. As shown in chart below, Hindalco’s production using captive alumina is in the lowest-cost quartile, while even Vedanta, which lacks captive bauxite, is in the first half of the cost curve. On a steady state, when new capacities by Hindalco are operating with captive bauxite and coal, they would be amongst the 10% of the lowest cost producers globally, we believe.
On account of the lower cost of production, these capacities should be able to compete with major players globally, in our view.
Fig. 43: Global aluminium cost curve As per 2012 data
Source: Brookhunt, Nomura research

Nomura | Hindalco September 14, 2012
34
Regulatory hurdles improving but gradually
Regulatory hurdles have been a key factor behind the slower growth of the aluminium industry in India. While all the expansion plans announced by Vedanta Group and Hindalco have seen progress, they have been impacted by: 1) land acquisition issues; and 2) delay in getting approvals for bauxite/coal mines.
However, things are gradually improving, in our view. Hindalco’s projects are now in the last stage of completion, and its new capacity should start coming on line gradually from later this year. However, Vedanta Group has not been able to acquire the approvals to develop bauxite mines, nor have the approvals to expand alumina refinery capacity been coming through. The company is looking for alternate sources of bauxite, but it will likely need time before it can benefit from these initiatives, in our view.

Nomura | Hindalco September 14, 2012
35
Cost dynamics of aluminium production in India
Indian smelters are among the lowest-cost producers globally
We note two reasons why Indian smelters are among the lowest-cost producers in the world:
1) Most of the Indian smelters have captive bauxite. With captive bauxite, cost of alumina is close to USD210/tonne, compared with the current market price of alumina around USD300-325/tonne. Since 2 tonnes of alumina are required per tonne of aluminium, captive bauxite gives a cost advantage of USD200-250/tonne to Indian aluminium smelters.
2) Access to captive coal or coal sourced from Coal India at administered price is another advantage. With coal sourced more cheaply, Indian smelters can produce power at the rate of INR2/kWh, i.e. US cents 3.5/kWh, as against INR3/kWh or US cents 5-6/kWh for plants dependent upon external coal. So companies with cheaper coal have a cost advantage of USD300/tonne.
There are typically four types of smelters in India:
• Smelters with captive bauxite and coal: These are among the lowest-cost producers, able to make aluminium at USD1,300-1,400/tonne.
• Smelters with captive bauxite and able to source coal from Coal India at administered prices: Most Indian smelters are in this category. Their cost of production is around USD1,400-1,500/tonne.
• Smelters with captive bauxite that source coal from E-Auction/imports: Such smelters have aluminium cost of production around USD1,600-1,700/tonne.
• Smelters without captive bauxite or coal: Vedanta group falls in this category, with cost of production around USD1,800-1,900/tonne. They would be amongst the 3rd quartile costs globally.
Captive bauxite allows availability of cheap alumina
Most of the Indian aluminium companies have their own alumina refineries, along with captive bauxite, which allows them to produce alumina more cheaply. Indian producers with captive mines can get bauxite at USD10-15/tonne, compared with external bauxite costing USD40-45/tonne.
The companies which own bauxite mines and do the mining themselves have production cost of USD10-15/tonne. Hindalco will have bauxite cost of USD13/tonne for its mines in development. Some producers have outsourced mining operations to a 3rd party. For such mines cost of production is close to USD15-20/tonne.
Details on cost of production of alumina
The key costs for alumina production are: 1) bauxite; 2) caustic soda; and 3) fuel costs. For companies such as Nalco and Hindalco, which own captive bauxite mines, cost of producing alumina is close to USD225/tonne.
The following table shows cost of production for alumina:

Nomura | Hindalco September 14, 2012
36
Fig. 44: Alumina cost of production
Source: Company data, Nomura estimates *power requirement is in KWH/kg of alumina
The table shows the difference in cost between the two scenarios: 1) using captive bauxite and captive coal; and 2) using captive bauxite and external coal. In the first case, cost of production is close to USD230/tonne, while in the second case it is USD250/tonne. As power is not a significant cost during alumina production, there is not much of a difference between the two scenarios.
Power is another major cost in aluminium production: power costs too ultimately depend on sourcing of coal
15,000kWh of electricity is required to produce one tonne of aluminium. Therefore power is amongst the biggest costs of aluminium production. Power reliability is very important for aluminium smelters. If there is a power failure, it is very difficult to restart aluminium smelters, and can take 2-3 months to clean the frozen material in the pots, incurring production losses as well as significant maintenance costs. As a result, all the smelters in India have captive power plants.
Power plants based on captive coal can produce electricity at around INR1.0-INR1.1/kWh, while plants with linkage coal can produce power at around INR1.6/kWh. In comparison, plants dependent upon external coal (through a mix of E-Auction/ imports) have cost of production in the range of INR2.5-INR3.0/kWh.
Sterlite Energy, which uses a mix of imported and E-Auction coal, has cost of production of INR2.3-INR2.5/kWh. JSW Energy, which is dependent entirely on imported coal, has cost of production of INR3.0-INR3.2/kWh, according to the company.
Fig. 45: Details on cost of power production in India
Source: Industry data, Nomura estimates
Therefore, we find power costs for aluminium smelters can vary between USD300/tonne and USD825/tonne, depending on the coal sources.
Quantity* (Kg/t of alumina)
Per unit cost (USD)
Cost/t of alumina
Cost with captive coal
Bauxite 3,000 15 45 45
Caustic soda 135 455 61 61
Thermal coal 650 55 35 20
Fuel oil for calcination 80 500 40 40
Oil for steam 5 500 3 3
Power cost (US cents/KWH) 500 5.1 25 18
Staff cost 36 36
Other overheads 9 9
Total Alumina cost per ton 255 233
Captive coal Linkage coalMix of Auction
& imports 100% import
Coal cost (INR/t) 750 1,200 2,700 6,325
Fuel cost (INR/KWH) 0.6 0.9 2.0 2.5
Other costs (INR/KWH) 0.5 0.5 0.5 0.5
Total power cost (INR/KWH) 1.1 1.4 2.5 3.0

Nomura | Hindalco September 14, 2012
37
Fig. 46: Aluminium cost of production in different scenarios
Source: Company data, Nomura estimates
We assume Hindalco will use coal from E-Auction/imports in the initial stages
We assume Hindalco will be in the 3rd scenario (captive bauxite, E-Auction coal) for the first two years, after which it may move to a combination of 1st and 2nd scenarios. Accordingly, we estimate cost of production at the Mahan smelter at USD1,650/tonne until FY15F. In effect, we estimate that the Mahan coal block won’t be operational until about FY15; i.e. two and half years from now. Since we are valuing the stock at 6x FY14F EV/EBITDA, in effect we are not valuing benefits of the Mahan coal block.
(USD/t) Units (Kg/t)* Own bauxite & coalOwn bauxite, linkage coal
Own bauxite, E-Auction coal
Own bauxite, imported coal
Alumina - 2 tonnes/t of Al 2,000 434 471 490 507
Other raw materials
CT pitch (Kg/ton) 100 47 47 47 47
CP coke (Kg/ton) 400 160 160 160 160
Cryolite+Aluminium floride 25 27 27 27 27
Total raw material cost 669 705 725 742
Electricity charges 15,000 290 382 689 826
Other fuel charges 44 44 44 44
Total power & fuel costs 333 425 732 870
Employee cost 100 100 100 100
Other overheads 91 91 91 91
Total cost/t (USD) 1,193 1,322 1,648 1,803
Nomura | Hindalco September 14, 2012
38
Appendix A-1
Analyst Certification
I, Alok Kumar Nemani, hereby certify (1) that the views expressed in this Research report accurately reflect my personal views about any or all of the subject securities or issuers referred to in this Research report, (2) no part of my compensation was, is or will be directly or indirectly related to the specific recommendations or views expressed in this Research report and (3) no part of my compensation is tied to any specific investment banking transactions performed by Nomura Securities International, Inc., Nomura International plc or any other Nomura Group company.
Issuer Specific Regulatory Disclosures The term "Nomura Group Company" used herein refers to Nomura Holdings, Inc. or any affiliate or subsidiary of Nomura Holdings, Inc. Nomura Group Companies involved in the production of Research are detailed in the disclaimer below.
Issuer name Ticker Price Price date Stock rating Sector rating Disclosures Hindalco HNDL IN INR 109 12-Sep-2012 Buy Not rated
Previous Rating Issuer name Previous Rating Date of change Hindalco Not rated 13-Sep-2012
Hindalco (HNDL IN) INR 109 (12-Sep-2012)
Buy (Sector rating: Not rated) Chart Not Available
Valuation Methodology We value Hindalco at 6x FY14F EV/EBITDA – Indian operations are valued at INR72/share, Novelis at INR54/share and INR17 from its holdings in non-core listed companies. Our target price for Hindalco is INR143. Risks that may impede the achievement of the target price • Further fall in aluminium prices • Coal costs are higher than our estimates • Macro conditions worsen from here
Important Disclosures Online availability of research and conflict-of-interest disclosures Nomura research is available on www.nomuranow.com/research, Bloomberg, Capital IQ, Factset, MarkitHub, Reuters and ThomsonOne. Important disclosures may be read at http://go.nomuranow.com/research/globalresearchportal/pages/disclosures/disclosures.aspx or requested from Nomura Securities International, Inc., on 1-877-865-5752. If you have any difficulties with the website, please email [email protected] for help. The analysts responsible for preparing this report have received compensation based upon various factors including the firm's total revenues, a portion of which is generated by Investment Banking activities. Unless otherwise noted, the non-US analysts listed at the front of this report are not registered/qualified as research analysts under FINRA/NYSE rules, may not be associated persons of NSI, and may not be subject to FINRA Rule 2711 and NYSE Rule 472 restrictions on communications with covered companies, public appearances, and trading securities held by a research analyst account. Any authors named in this report are research analysts unless otherwise indicated. Industry Specialists identified in some Nomura International plc research reports are employees within the Firm who are responsible for the sales and trading effort in the sector for which they have coverage. Industry Specialists do not contribute in any manner to the content of research reports in which their names appear. Marketing Analysts identified in some Nomura research reports are research analysts employed by Nomura International plc who are primarily responsible for marketing Nomura’s Equity Research product in the sector for which they have coverage. Marketing Analysts may also contribute to research reports in which their names appear and publish research on their sector. Distribution of ratings (US) The distribution of all ratings published by Nomura US Equity Research is as follows: 43% have been assigned a Buy rating which, for purposes of mandatory disclosures, are classified as a Buy rating; 21% of companies with this rating are investment banking clients of the Nomura Group*. 51% have been assigned a Neutral rating which, for purposes of mandatory disclosures, is classified as a Hold rating; 9% of companies with this rating are investment banking clients of the Nomura Group*. 6% have been assigned a Reduce rating which, for purposes of mandatory disclosures, are classified as a Sell rating; 0% of companies with this rating are investment banking clients of the Nomura Group*. As at 30 June 2012. *The Nomura Group as defined in the Disclaimer section at the end of this report.

Nomura | Hindalco September 14, 2012
39
Distribution of ratings (Global) The distribution of all ratings published by Nomura Global Equity Research is as follows: 46% have been assigned a Buy rating which, for purposes of mandatory disclosures, are classified as a Buy rating; 40% of companies with this rating are investment banking clients of the Nomura Group*. 43% have been assigned a Neutral rating which, for purposes of mandatory disclosures, is classified as a Hold rating; 46% of companies with this rating are investment banking clients of the Nomura Group*. 11% have been assigned a Reduce rating which, for purposes of mandatory disclosures, are classified as a Sell rating; 21% of companies with this rating are investment banking clients of the Nomura Group*. As at 30 June 2012. *The Nomura Group as defined in the Disclaimer section at the end of this report. Explanation of Nomura's equity research rating system in Europe, Middle East and Africa, US and Latin America The rating system is a relative system indicating expected performance against a specific benchmark identified for each individual stock. Analysts may also indicate absolute upside to target price defined as (fair value - current price)/current price, subject to limited management discretion. In most cases, the fair value will equal the analyst's assessment of the current intrinsic fair value of the stock using an appropriate valuation methodology such as discounted cash flow or multiple analysis, etc. STOCKS A rating of 'Buy', indicates that the analyst expects the stock to outperform the Benchmark over the next 12 months. A rating of 'Neutral', indicates that the analyst expects the stock to perform in line with the Benchmark over the next 12 months. A rating of 'Reduce', indicates that the analyst expects the stock to underperform the Benchmark over the next 12 months. A rating of 'Suspended', indicates that the rating, target price and estimates have been suspended temporarily to comply with applicable regulations and/or firm policies in certain circumstances including, but not limited to, when Nomura is acting in an advisory capacity in a merger or strategic transaction involving the company. Benchmarks are as follows: United States/Europe: please see valuation methodologies for explanations of relevant benchmarks for stocks, which can be accessed at: http://go.nomuranow.com/research/globalresearchportal/pages/disclosures/disclosures.aspx; Global Emerging Markets (ex-Asia): MSCI Emerging Markets ex-Asia, unless otherwise stated in the valuation methodology. SECTORS A 'Bullish' stance, indicates that the analyst expects the sector to outperform the Benchmark during the next 12 months. A 'Neutral' stance, indicates that the analyst expects the sector to perform in line with the Benchmark during the next 12 months. A 'Bearish' stance, indicates that the analyst expects the sector to underperform the Benchmark during the next 12 months. Benchmarks are as follows: United States: S&P 500; Europe: Dow Jones STOXX 600; Global Emerging Markets (ex-Asia): MSCI Emerging Markets ex-Asia. Explanation of Nomura's equity research rating system in Japan and Asia ex-Japan STOCKS Stock recommendations are based on absolute valuation upside (downside), which is defined as (Target Price - Current Price) / Current Price, subject to limited management discretion. In most cases, the Target Price will equal the analyst's 12-month intrinsic valuation of the stock, based on an appropriate valuation methodology such as discounted cash flow, multiple analysis, etc. A 'Buy' recommendation indicates that potential upside is 15% or more. A 'Neutral' recommendation indicates that potential upside is less than 15% or downside is less than 5%. A 'Reduce' recommendation indicates that potential downside is 5% or more. A rating of 'Suspended' indicates that the rating and target price have been suspended temporarily to comply with applicable regulations and/or firm policies in certain circumstances including when Nomura is acting in an advisory capacity in a merger or strategic transaction involving the subject company. Securities and/or companies that are labelled as 'Not rated' or shown as 'No rating' are not in regular research coverage of the Nomura entity identified in the top banner. Investors should not expect continuing or additional information from Nomura relating to such securities and/or companies. SECTORS A 'Bullish' rating means most stocks in the sector have (or the weighted average recommendation of the stocks under coverage is) a positive absolute recommendation. A 'Neutral' rating means most stocks in the sector have (or the weighted average recommendation of the stocks under coverage is) a neutral absolute recommendation. A 'Bearish' rating means most stocks in the sector have (or the weighted average recommendation of the stocks under coverage is) a negative absolute recommendation. Target Price A Target Price, if discussed, reflect in part the analyst's estimates for the company's earnings. The achievement of any target price may be impeded by general market and macroeconomic trends, and by other risks related to the company or the market, and may not occur if the company's earnings differ from estimates.
Nomura | Hindalco September 14, 2012
40
Disclaimers This document contains material that has been prepared by the Nomura entity identified at the top or bottom of page 1 herein, if any, and/or, with the sole or joint contributions of one or more Nomura entities whose employees and their respective affiliations are specified on page 1 herein or identified elsewhere in the document. Affiliates and subsidiaries of Nomura Holdings, Inc. (collectively, the 'Nomura Group'), include: Nomura Securities Co., Ltd. ('NSC') Tokyo, Japan; Nomura International plc ('NIplc'), UK; Nomura Securities International, Inc. ('NSI'), New York, US; Nomura International (Hong Kong) Ltd. (‘NIHK’), Hong Kong; Nomura Financial Investment (Korea) Co., Ltd. (‘NFIK’), Korea (Information on Nomura analysts registered with the Korea Financial Investment Association ('KOFIA') can be found on the KOFIA Intranet at http://dis.kofia.or.kr); Nomura Singapore Ltd. (‘NSL’), Singapore (Registration number 197201440E, regulated by the Monetary Authority of Singapore); Capital Nomura Securities Public Company Limited (‘CNS’), Thailand; Nomura Australia Ltd. (‘NAL’), Australia (ABN 48 003 032 513), regulated by the Australian Securities and Investment Commission ('ASIC') and holder of an Australian financial services licence number 246412; P.T. Nomura Indonesia (‘PTNI’), Indonesia; Nomura Securities Malaysia Sdn. Bhd. (‘NSM’), Malaysia; Nomura International (Hong Kong) Ltd., Taipei Branch (‘NITB’), Taiwan; Nomura Financial Advisory and Securities (India) Private Limited (‘NFASL’), Mumbai, India (Registered Address: Ceejay House, Level 11, Plot F, Shivsagar Estate, Dr. Annie Besant Road, Worli, Mumbai- 400 018, India; Tel: +91 22 4037 4037, Fax: +91 22 4037 4111; SEBI Registration No: BSE INB011299030, NSE INB231299034, INF231299034, INE 231299034, MCX: INE261299034); NIplc, Dubai Branch (‘NIplc, Dubai’); NIplc, Madrid Branch (‘NIplc, Madrid’) and NIplc, Italian Branch (‘NIplc, Italy’). ‘CNS Thailand’ next to an analyst’s name on the front page of a research report indicates that the analyst is employed by Capital Nomura Securities Public Company Limited (‘CNS’) to provide research assistance services to NSL under a Research Assistance Agreement. CNS is not a Nomura entity. THIS MATERIAL IS: (I) FOR YOUR PRIVATE INFORMATION, AND WE ARE NOT SOLICITING ANY ACTION BASED UPON IT; (II) NOT TO BE CONSTRUED AS AN OFFER TO SELL OR A SOLICITATION OF AN OFFER TO BUY ANY SECURITY IN ANY JURISDICTION WHERE SUCH OFFER OR SOLICITATION WOULD BE ILLEGAL; AND (III) BASED UPON INFORMATION FROM SOURCES THAT WE CONSIDER RELIABLE, BUT HAS NOT BEEN INDEPENDENTLY VERIFIED BY NOMURA GROUP. Nomura Group does not warrant or represent that the document is accurate, complete, reliable, fit for any particular purpose or merchantable and does not accept liability for any act (or decision not to act) resulting from use of this document and related data. To the maximum extent permissible all warranties and other assurances by Nomura group are hereby excluded and Nomura Group shall have no liability for the use, misuse, or distribution of this information. Opinions or estimates expressed are current opinions as of the original publication date appearing on this material and the information, including the opinions and estimates contained herein, are subject to change without notice. Nomura Group is under no duty to update this document. Any comments or statements made herein are those of the author(s) and may differ from views held by other parties within Nomura Group. Clients should consider whether any advice or recommendation in this report is suitable for their particular circumstances and, if appropriate, seek professional advice, including tax advice. Nomura Group does not provide tax advice. Nomura Group, and/or its officers, directors and employees, may, to the extent permitted by applicable law and/or regulation, deal as principal, agent, or otherwise, or have long or short positions in, or buy or sell, the securities, commodities or instruments, or options or other derivative instruments based thereon, of issuers or securities mentioned herein. Nomura Group companies may also act as market maker or liquidity provider (as defined within Financial Services Authority (‘FSA’) rules in the UK) in the financial instruments of the issuer. Where the activity of market maker is carried out in accordance with the definition given to it by specific laws and regulations of the US or other jurisdictions, this will be separately disclosed within the specific issuer disclosures. This document may contain information obtained from third parties, including ratings from credit ratings agencies such as Standard & Poor’s. Reproduction and distribution of third party content in any form is prohibited except with the prior written permission of the related third party. Third party content providers do not guarantee the accuracy, completeness, timeliness or availability of any information, including ratings, and are not responsible for any errors or omissions (negligent or otherwise), regardless of the cause, or for the results obtained from the use of such content. Third party content providers give no express or implied warranties, including, but not limited to, any warranties of merchantability or fitness for a particular purpose or use. Third party content providers shall not be liable for any direct, indirect, incidental, exemplary, compensatory, punitive, special or consequential damages, costs, expenses, legal fees, or losses (including lost income or profits and opportunity costs) in connection with any use of their content, including ratings. Credit ratings are statements of opinions and are not statements of fact or recommendations to purchase hold or sell securities. They do not address the suitability of securities or the suitability of securities for investment purposes, and should not be relied on as investment advice. Any MSCI sourced information in this document is the exclusive property of MSCI Inc. (‘MSCI’). Without prior written permission of MSCI, this information and any other MSCI intellectual property may not be reproduced, re-disseminated or used to create any financial products, including any indices. This information is provided on an "as is" basis. The user assumes the entire risk of any use made of this information. MSCI, its affiliates and any third party involved in, or related to, computing or compiling the information hereby expressly disclaim all warranties of originality, accuracy, completeness, merchantability or fitness for a particular purpose with respect to any of this information. Without limiting any of the foregoing, in no event shall MSCI, any of its affiliates or any third party involved in, or related to, computing or compiling the information have any liability for any damages of any kind. MSCI and the MSCI indexes are services marks of MSCI and its affiliates. Investors should consider this document as only a single factor in making their investment decision and, as such, the report should not be viewed as identifying or suggesting all risks, direct or indirect, that may be associated with any investment decision. Nomura Group produces a number of different types of research product including, among others, fundamental analysis, quantitative analysis and short term trading ideas; recommendations contained in one type of research product may differ from recommendations contained in other types of research product, whether as a result of differing time horizons, methodologies or otherwise. Nomura Group publishes research product in a number of different ways including the posting of product on Nomura Group portals and/or distribution directly to clients. Different groups of clients may receive different products and services from the research department depending on their individual requirements. Clients outside of the US may access the Nomura Research Trading Ideas platform (Retina) at http://go.nomuranow.com/equities/tradingideas/retina/ Figures presented herein may refer to past performance or simulations based on past performance which are not reliable indicators of future performance. Where the information contains an indication of future performance, such forecasts may not be a reliable indicator of future performance. Moreover, simulations are based on models and simplifying assumptions which may oversimplify and not reflect the future distribution of returns. Certain securities are subject to fluctuations in exchange rates that could have an adverse effect on the value or price of, or income derived from, the investment. The securities described herein may not have been registered under the US Securities Act of 1933 (the ‘1933 Act’), and, in such case, may not be offered or sold in the US or to US persons unless they have been registered under the 1933 Act, or except in compliance with an exemption from the registration requirements of the 1933 Act. Unless governing law permits otherwise, any transaction should be executed via a Nomura entity in your home jurisdiction. This document has been approved for distribution in the UK and European Economic Area as investment research by NIplc, which is authorized and regulated by the FSA and is a member of the London Stock Exchange. It does not constitute a personal recommendation, as defined by the FSA, or take into account the particular investment objectives, financial situations, or needs of individual investors. It is intended only for investors who are 'eligible counterparties' or 'professional clients' as defined by the FSA, and may not, therefore, be redistributed to retail clients as defined by the FSA. This document has been approved by NIHK, which is regulated by the Hong Kong Securities and Futures Commission, for distribution in Hong Kong by NIHK. This document has been approved for distribution in Australia by NAL, which is authorized and regulated in Australia by the ASIC. This document has also been approved for distribution in Malaysia by NSM. In Singapore, this document has been distributed by NSL. NSL accepts legal responsibility for the content of this document, where it concerns securities, futures and foreign exchange, issued by their foreign affiliates in respect of recipients who are not accredited, expert or institutional investors as defined by the Securities and Futures Act (Chapter 289). Recipients of this document in Singapore should contact NSL in respect of matters arising from, or in connection with, this document. Unless prohibited by the provisions of Regulation S of the 1933 Act, this material is distributed in the US, by NSI, a US-registered broker-dealer, which accepts responsibility for its contents in accordance with the provisions of Rule 15a-6, under the US Securities Exchange Act of 1934. This document has not been approved for distribution in the Kingdom of Saudi Arabia (‘Saudi Arabia’) or to clients other than 'professional clients' in the United Arab Emirates (‘UAE’) by Nomura Saudi Arabia, NIplc or any other member of Nomura Group, as the case may be. Neither this document nor any copy thereof may be taken or transmitted or distributed, directly or indirectly, by any person other than those authorised to do so into Saudi Arabia or in the UAE or to any person located in Saudi Arabia or to clients other than 'professional clients' in the UAE. By accepting to receive this document, you represent that you are not located in Saudi Arabia or that you are a 'professional client' in the UAE and agree to comply with these restrictions. Any failure to comply with these restrictions may constitute a violation of the laws of the UAE or Saudi Arabia. NO PART OF THIS MATERIAL MAY BE (I) COPIED, PHOTOCOPIED, OR DUPLICATED IN ANY FORM, BY ANY MEANS; OR (II) REDISTRIBUTED WITHOUT THE PRIOR WRITTEN CONSENT OF A MEMBER OF NOMURA GROUP. If this document has been distributed by electronic transmission, such as e-mail, then such transmission cannot be guaranteed to be secure or error-free as information could be intercepted, corrupted, lost, destroyed, arrive late or incomplete, or contain viruses. The sender therefore does not accept liability for any errors or omissions in the contents of this document, which may arise as a result of electronic transmission. If verification is required, please request a hard-copy version. Nomura Group manages conflicts with respect to the production of research through its compliance policies and procedures (including, but not limited to, Conflicts of Interest, Chinese Wall and Confidentiality policies) as well as through the maintenance of Chinese walls and employee training. Additional information is available upon request and disclosure information is available at the Nomura Disclosure web page: http://go.nomuranow.com/research/globalresearchportal/pages/disclosures/disclosures.aspx Copyright © 2012 Nomura International (Hong Kong) Ltd. All rights reserved.