HIMSS Ambulatory DaviesAward - Amazon S3s3.amazonaws.com/rdcms-himss/files/production/... · Case...
8
Case Study Two Standardizing Individual and Collective Workflow Distribution and Accountability The mission of The Wright Center is to continuously improve education and patient care in a collaborative spirit to enhance outcomes, access and affordability. The Wright Center (TWC) 5 South Washington Avenue, Jermyn, PA 18433 HIMSS Ambulatory Davies Award: Independent Ambulatory Practice Executive Leadership Linda Thomas-Hemak, MD Jignesh Sheth, MD Brian Ebersole Teresa Lacey, RN Clinical Innovation Tiffany Jaskulski Courtney Dempsey Health Information Technology and Innovation John Janosky Edward Wargo Communications/Development Maria Montoro-Edwards, PhD Jennifer Hetro Kerri Price As our patient-centered, team-based transformation progressed, the Performance Assessment and Competency Evaluation (PACE) Card was developed as an enabling IT tool for organizational-wide performance reporting. The PACE Cards reflected an evolving culture of performance-based employment and commitment to continuous learning for improvement. Staff and providers could now connect their daily work to the greater goals of the organization, resulting in unified and aligned teams collectively delivering defined metrics of a Corporate Balanced Scorecard. PACE Cards proved to be a disruptive and initially challenging innovation that quickly invoked a spirit of healthy value-based competition. Corporate Balanced Scorecard results were communicated and recognized at the highest management and governance levels of the organization, generating intense alignment. We encourage any practice in its current state to introduce the replicable and scalable models outlined in this TWC case study compilation.
Transcript of HIMSS Ambulatory DaviesAward - Amazon S3s3.amazonaws.com/rdcms-himss/files/production/... · Case...

Case Study TwoStandardizing Individual and Collective Workflow
Distribution and Accountability
The mission of The Wright Centeris to continuously improveeducation and patient care
in a collaborative spiritto enhance outcomes,
access and affordability.
The Wright Center (TWC)5 South Washington Avenue, Jermyn, PA 18433
HIMSS Ambulatory Davies Award:Independent Ambulatory Practice
Executive LeadershipLinda Thomas-Hemak, MD
Jignesh Sheth, MDBrian Ebersole
Teresa Lacey, RN
Clinical InnovationTiffany Jaskulski
Courtney Dempsey
Health InformationTechnology and Innovation
John JanoskyEdward Wargo
Communications/DevelopmentMaria Montoro-Edwards, PhD
Jennifer HetroKerri Price
As our patient-centered, team-based transformation progressed, the Performance Assessment and Competency Evaluation (PACE) Card was developed as an enabling
IT tool for organizational-wide performance reporting. The PACE Cards reflected an evolving culture of performance-based employment and commitment to continuous
learning for improvement. Staff and providers could now connect their daily workto the greater goals of the organization, resulting in unified and aligned teamscollectively delivering defined metrics of a Corporate Balanced Scorecard.
PACE Cards proved to be a disruptive and initially challenging innovationthat quickly invoked a spirit of healthy value-based competition. Corporate
Balanced Scorecard results were communicated and recognized at the highest management and governance levels of the organization, generating intense alignment.
We encourage any practice in its current state to introduce the replicableand scalable models outlined in this TWC case study compilation.
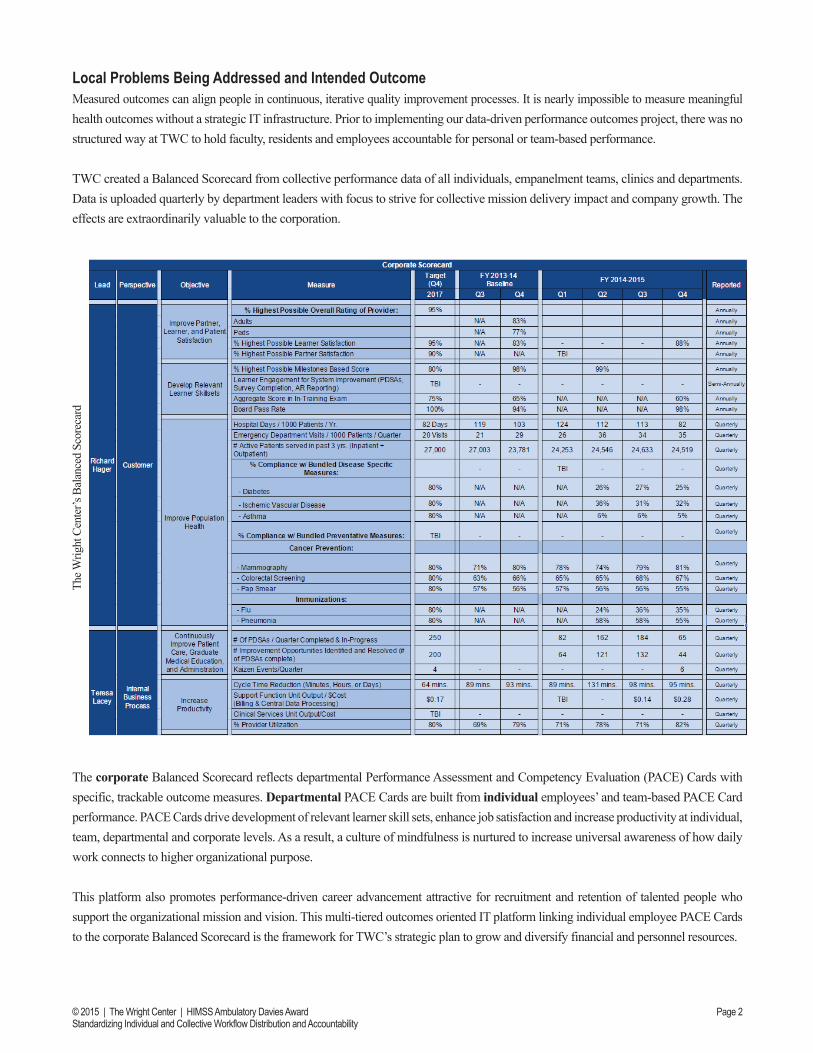
Local Problems Being Addressed and Intended OutcomeMeasured outcomes can align people in continuous, iterative quality improvement processes. It is nearly impossible to measure meaningful health outcomes without a strategic IT infrastructure. Prior to implementing our data-driven performance outcomes project, there was no structured way at TWC to hold faculty, residents and employees accountable for personal or team-based performance.
TWC created a Balanced Scorecard from collective performance data of all individuals, empanelment teams, clinics and departments. Data is uploaded quarterly by department leaders with focus to strive for collective mission delivery impact and company growth. The effects are extraordinarily valuable to the corporation.
The corporate Balanced Scorecard reflects departmental Performance Assessment and Competency Evaluation (PACE) Cards with specific, trackable outcome measures. Departmental PACE Cards are built from individual employees’ and team-based PACE Card performance. PACE Cards drive development of relevant learner skill sets, enhance job satisfaction and increase productivity at individual, team, departmental and corporate levels. As a result, a culture of mindfulness is nurtured to increase universal awareness of how daily work connects to higher organizational purpose.
This platform also promotes performance-driven career advancement attractive for recruitment and retention of talented people who support the organizational mission and vision. This multi-tiered outcomes oriented IT platform linking individual employee PACE Cards to the corporate Balanced Scorecard is the framework for TWC’s strategic plan to grow and diversify financial and personnel resources.
The W
right
Cen
ter’s
Bal
ance
d Sc
orec
ard
Page 2© 2015 | The Wright Center | HIMSS Ambulatory Davies AwardStandardizing Individual and Collective Workflow Distribution and Accountability

A performance-based culture of accountability requires standardization of workflow. This is achieved at TWC through an online, fluid Clinical Workflow Document (below) that integrates up-to-date, PDSA driven best practices for daily individual and team-based work distribution.This document provides a virtual walk through of the clinical visit and continuum of care through the eyes of a patient, highlighting staff responsibilities for collective clinical workflow (right).
Individual and team-based workflow compliance is achieved through effective utilization of PACE Cards and the aligned performance-based evaluation process. Specific activities are measured and reported monthly for individuals, empanelment teams and clinics. Individuals’ bi-annual performance evaluations and annual bonus distribution are guided by his or her PACE Card performance.
Design and ImplementationThe PACE Card was designed and implemented under the leadership of the IT department. Departmental performance measures that drive the Balanced Scorecard were selected to track performance and accurately assess outcomes. Measures were focused to reflect employee contributions, creating an individual level PACE Card. PACE Cards are circulated monthly to employees and reviewed regularly by the executive leadership. The web-based employee portal (screenshot below) is the gateway to view all PACE Cards with access selectively determined and role specific. Resident and fellow PACE Cards provide unique clinical relevance for patient-centered population management related to TWC educational outcomes.
Page 3© 2015 | The Wright Center | HIMSS Ambulatory Davies AwardStandardizing Individual and Collective Workflow Distribution and Accountability

How Was Health IT Utilized?Processes to add PACE Card measures are as follows:1. The physician leadership team come to a general consensus that the specific metric will add value for Balanced Scorecard
metrics and mission delivery of high-quality patient care and education.2. Based on the measures determined by the physicians, the EHR Specialist then contacts the EHR vendor to determine
if that particular type of data can be extracted in a trackable manner.3. The Senior Vice President for Mission Accountability sets the threshold for measures linked to bonus or low performance
outcomes requiring management intervention. For example, physicians who miss more than 75% of the coordinators’ monthly meetings will forfeit 1/12th of their annual bonus.
4. If reports can be generated, the EHR Specialist meets with the Applications and Solutions Developer to begin programming the newly defined metrics into the web-based platform. The Applications and Solutions Developer also programs PACE Card metrics to be color-coded and trackable by individuals and empanelment team. Missed thresholds appear in red.
5. The EHR Specialist then shares the PACE Card with users who should have access to view other employees’ measures. For instance, mid-level managers can only view the measures of those who report to them while the President/CEO can view every employee’s PACE Card. 6. Once the Applications and Solutions Developer has completed the programming, he meets regularly with the EHR Specialist to validate the data, refine usability and enhance visual appeal. 7. Once data validation is complete, the Applications and Solutions Developer takes the graphs out of test mode for the rest of the organization to view.8. Key individual, empanelment team and clinical performance measures are circulated and visibly posted in clinic venues monthly.
In order to produce the outcomes in the individual PACE Cards, the office must take the following steps:1. Determine the necessary data for the measures to be valid and meaningful. Some research may be needed to find where the
data is currently documented and how it can be accessed and extracted to feed the reporting.2. The EHR Specialist then contacts the EHR vendor and explains, in great detail, what exactly needs to be included in the given report. If the measure is clinical, a National Clinical Quality Measure (CQM), the EHR vendor transfers that
formula to our account and adds the specific field we document into the programming of the PACE Card. However, if it is not a CQM or other established quality metric, for example, a finance report, the EHR Specialist must collaborate
with the EHR vendor to develop that report.3. Once the reports are generated in an exception style, Yes/No format, they are shared with the Applications and Solutions
Developer to review in either an Excel or Notepad template. The EHR Specialist explains exactly what the physicians are trying to capture so programming can be done in a lean, systematic and meaningful way.
Page 4© 2015 | The Wright Center | HIMSS Ambulatory Davies AwardStandardizing Individual and Collective Workflow Distribution and Accountability

4. All exception reports must have the same basic template as seen below: account number, date of service, Yes/No for specific measure criteria, team color, physician seen, medical assistant who created the nurse note for that visit and the resident or non-physician who created the progress note. On a monthly basis, these reports are run and saved to a shared folder on the organization’s network. The Applications and Solutions Developer extracts the reports and conditions to be pushed into the programmed PACE Card platform.
5. The particular measure the report is searching determines the ownership of the employee’s PACE Card. For example, the medical assistant, the resident and physician are responsible for the completion of the diabetic foot exam during the visit.
If the medical assistant properly documents the foot exam for a visit, all involved will have that patient added to their numerator. However, if the medical assistant does not complete the foot exam, the engaged medical assistant, resident, non-physician provider and/or physician all lose credit for the measure. Higher level clinical measures, like attention to diabetic nephropathy, only apply to the resident, non-physician provider and/or physician, as the medical assistant has no real impact on the completion of that measure.
6. Once the data is uploaded into the web-based platform, the employees and faculty are encouraged to view their performance on a monthly basis. By clicking on the percentage associated with the measure, the providers and employees can view the specific patients not included in the percentage for care delivered. This avoids conversations and distracting disagreements about inaccurate data. The figures (right) show all diabetic patients seen by an individual provider who did not have a creatinine lab result, a diagnosis of chronic kidney disease or a note from a nephrologist documented in their charts within the last month when they were seen.
7. Providers are encouraged to proactively view the patients they overlooked for care delivery or those not meeting treatment goals. Providers can assign PDSAs to residents on their empanelment teams who can verify the accuracy of the report and also lead PDSAs for creation of processes so these measures will not go unnoticed or unaddressed in the future.
The individual employee’s performance is reviewed bi-annually in a performance review with his or her manager and is directly tied to his or her annual performance based bonus. TWC believes that improvements should primarily evolve from purely patient-centered intentions and performance-based incentives can be synergistic.
Page 5© 2015 | The Wright Center | HIMSS Ambulatory Davies AwardStandardizing Individual and Collective Workflow Distribution and Accountability

Lessons Learned1. Informatics is the true backbone of innovation and investing in it is absolutely necessary in order to inspire and ensure
staff accountability.2. Data is unemotional and crucial when having higher level conversations regarding individual and team performance. 3. Performance data can enlighten individuals, teams and departments about connection of their daily work to higher
purpose and collective outcomes.4. The ability to use data to track performance is invaluable for employees, departments and TWC as a whole. 5. Employees can view and improve their individual and team performance to become more productive and grow their careers. 6. With visible and transparent data, departments or business units can identify waste and improve processes in alignment
with corporate Balanced Scorecard performance.7. TWC employees are inspired by the culture of rapid cycle continuous transformation, transparency and accountability
to take the “wright” patient-centered actions in order to rediscover and augment their joy of practice. Employees work together enhancing internal business processes, which in turn, create sustainability and growth to poise TWC for value-based payment reform.
Financial Considerations1. PACE Card IT infrastructure development was most time consuming and financially stressful during the early
development phase when most of the IT department and clinical staff resources were used. PACE Card implementation improved employee, team and departmental performance, shedding light on waste and improving internal business processes inclusive of EHR Meaningful Use and PQRS provider attestation. PACE Cards have positively influenced patient care delivery and educational outcomes, as well as overall financial performance.
2. TWC hired a software programmer to develop and oversee the PACE Card in June 2014. Programming FTE time investment is estimated at $60,000/year. Additionally, a significant amount of departmental leaders’ time was dedicated to PACE Card metric development. This effort and its integration into Balanced Scorecard development required focused time investment of our executive team which is not integrated into the soft financial return on investment (below).
3. Annual bonuses are based on corporate and departmental Balanced Scorecards built by individual team and clinic PACE Card performance metrics. Timely circulation of accurate and valid measures is vital, removing subjectivity from data-driven performance-based bonus conversations.
Hardware -------------
Software/Licensing (MEDENT) 19,262.45$
Staffing (EHR Application Specialist) 50,820.00$
Total Operational Costs 70,082.45$
Increase in Revenue for Providers 4,032.12$
Meaningful Use 165,750.00$
Total Return on Investment PCMH-Associated Reimbursement -------------
(June 2014 - July 2015) CMS-PQRS Incentives 6,715.71$
Soft Return on Investment 176,497.83$
Return on Investment Calculation: Costs | June 2014 - July 2015
Capital Investment/Implementation
Revenue/Incentives (Examples Below)
$106,415.38
Page 6© 2015 | The Wright Center | HIMSS Ambulatory Davies AwardStandardizing Individual and Collective Workflow Distribution and Accountability

The following PACE Card generated line graphs include TWC’s site and provider specific clinical quality and financial performance measures from June 2014 to July 2015. These run charts are automatically updated monthly to depict individual, empanelment team and clinic performance to visually display progress over any desired time period.
Capturing Payment for What We Do and Our AR Challenge:Everyone at TWC Must “Own” It.
Visual Management Tools to Enlighten Provider Compliance Conversations and Internal Business ProcessesAccountable and Measurable Progress through Promotion of Shared Metrics on Performance Based Evaluations
CPT Compliance andRevenue Run ChartsThese line graphs compare total clinic CPT compliance and revenue over time. As all the providers’ CPT compliance decreases, revenue decreases approximately three months later. This three month lag is due to reimbursement time. An estimated 2% increase in overall CPT compliance overall equated to approximately $20,000.
CPT Compliance and Revenue Run ChartsThese line graphs compare individual provider CPT compli-ance and revenue over time. As the provider’s CPT compliance decreases, revenue decreases approximately three months later. This three month lag is due to reimbursement time.
CPT Charge Capture Compliance
Individual Provider Metrics
Whole Practice Metrics
Page 7© 2015 | The Wright Center | HIMSS Ambulatory Davies AwardStandardizing Individual and Collective Workflow Distribution and Accountability

Open Documents and Revenue Run ChartsThis comparison of clinic open documents and revenue run charts reveals a correlation between open documents and revenue. As the number of open documents for the practice increases, the revenue,approximately three months after, decreases by a significant amount.
Open Documents and Revenue Run ChartsThis comparison of one provider’s open documents and revenue reflect a similar correlation between open documents and individual revenue.
Individual Provider Metrics
Timely Document Closure to Promote Timely Billing
Whole Practice Metrics
Page 8© 2015 | The Wright Center | HIMSS Ambulatory Davies AwardStandardizing Individual and Collective Workflow Distribution and Accountability