Hilton Head Public Service District Comprehensive Annual ...h · PDF fileHilton Head Public...
95
Hilton Head Public Service District Comprehensive Annual Financial Report For Fiscal Years Ended June 30, 2014 and June 30, 2013
Transcript of Hilton Head Public Service District Comprehensive Annual ...h · PDF fileHilton Head Public...
Hilton Head Public Service District
Comprehensive Annual Financial Report
For Fiscal Years Ended June 30, 2014 and June 30, 2013
Hilton Head No.1 Public Service District Comprehensive Annual Financial Report
For Fiscal Years Ended June 30, 2014 and June 30, 2013
TABLE OF CONTENTS INTRODUCTION ................................................................................................................ 2 Board of Commissioners ................................................................................................ 4 Administrative Team ..................................................................................................... 6 Vision / Mission Statement and Strategic Goals .......................................................... 7 Management Letter of Transmittal .............................................................................. 9 Profile of the Government ...................................................................................... 9 Financial Information ......................................................................................... 13 FINANCIAL ....................................................................................................................... 21 Independent Auditor’s Report .................................................................................... 22 Management’s Discussion and Analysis ..................................................................... 24 Financial Highlights ............................................................................................ 24 Subsequent Events ........................................................................................ 26 Financial Analysis of the District ........................................................................ 27 Condensed Statements of Net Position ......................................................... 27 Net Position .................................................................................................. 28 Capital Assets ............................................................................................... 29 Non-current Liabilities and Debt Administration ........................................ 30 Statement of Revenues, Expenses and Changes in Net Assets ..................... 31 Audited Financial Statements ..................................................................................... 38 Notes to Financial Statements ..................................................................................... 45 SUPPLEMENTAL FINANCIAL INFORMATION ....................................................... 64 Budgetary Comparison Schedule ........................................................................... 65 Notes to Budgetary Comparison Schedule ............................................................. 66 Summary Schedule of Debt ..................................................................................... 68 Schedule of Bond Principal and Interest Payments .............................................. 69 Schedule of Note Principal and Interest Payments ................................................ 70 STATISTICAL ................................................................................................................... 71 Statistical Section Table of Contents .......................................................................... 72
On the cover: The PSD modeled the way in 2013-2014 by installing a water-efficient rain garden at our Water Resource Center. The garden is irrigated using a rain barrel and features native plants such as blue flag iris.
1
INTRODUCTION
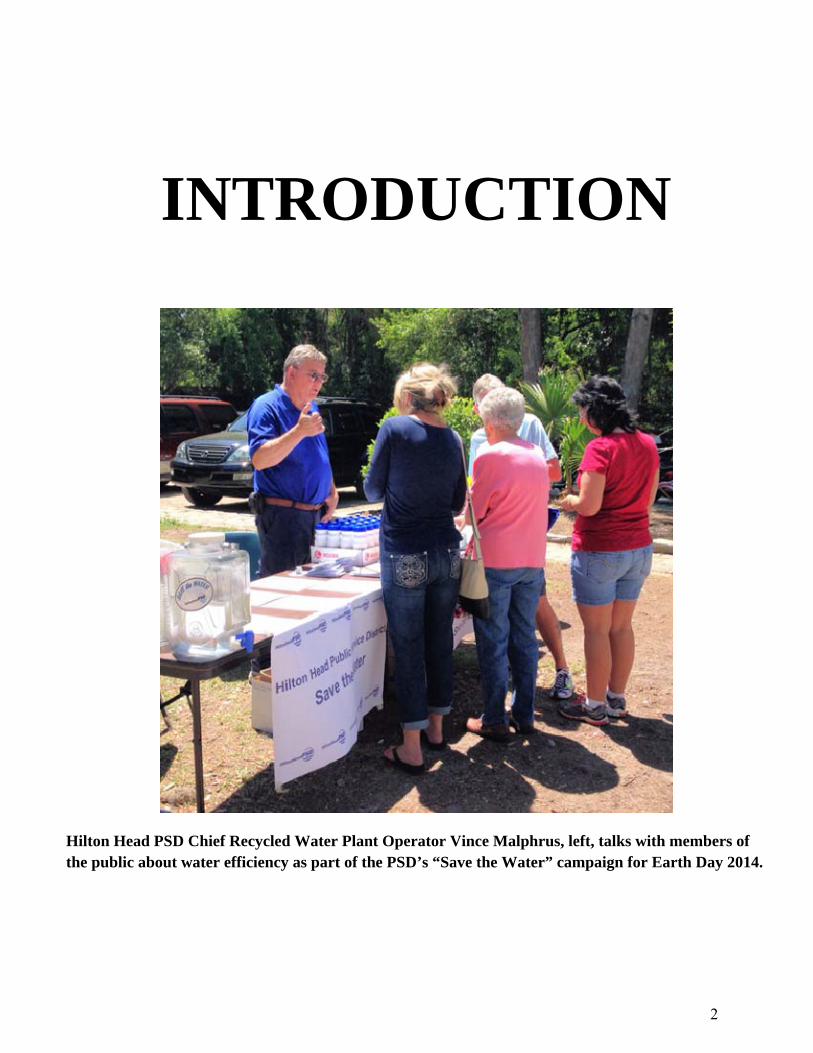
Hilton Head PSD Chief Recycled Water Plant Operator Vince Malphrus, left, talks with members of the public about water efficiency as part of the PSD’s “Save the Water” campaign for Earth Day 2014.
2
A Letter from the General Manager: PSD Succession Planning Pays Off
Richard C. Cyr, PSD General Manager The PSD during the past fiscal year underwent an extensive Succession Planning effort to identify its next general manager to suceed me upon my retirement from this position in June 2015. The process included our elected Commission’s review of the PSD’s current course and consideration of its future needs. As a result of this process, the Commission chose to pursue an internal candidate and selected our current Assistant General Manager, Pete Nardi, as the PSD’s next General Manager starting January 1, 2015. At that time, I will begin formally working with Mr. Nardi on the leadership transition and the completion of a number of vital projects that have been initiated. The PSD takes great pride in its staff development and the Succession Planning process paid great dividends to the utility in ensuring a seamless leadership transition and the continutation of this utility’s success in the years to come.
My tenure at the PSD, which began in June 2003, has been marked by significant improvements in our water supply and distribution and in the extension of our sanitary sewer system in many previously unserved areas. Important work on both of those fronts continued during the past fiscal year. We completed the planning for the addition of a fourth filter array at our Reverse Osmosis (RO) Water Treatment Facility. This project will provide an additional 1 million gallons of water a day from the RO facility, increasing its total capacity to 4 million gallons a day.
The PSD also worked with the Town of Hilton Head Island to install sewer in the Mid-Spanish Wells and Baygall neighborhoods, two traditonally Native Islander neighborhoods that had long desired sewer service. Our partnership with the Town is going strong as we prepare an update to the Master Sewer Plan that outlines the remaining infrastrucuture needed to complete access to the sewer system throughout the PSD’s service area.
It has been both my pleasure and honor to lead the PSD for the past 12 years. I want to thank the utility’s elected Commission, its staff members, our customers, and all of the organization’s stakeholders for their support during this critical time in the PSD’s history. I look forward to watching the organization continue its progress in the years to come. The team at Hilton Head PSD plays a vital role in our community’s quality of life and truly embodies the utility’s motto, We’re Always Working for You! All My Best,
Richard C. Cyr General Manager Hilton Head PSD
3
Board of Commissioners Hilton Head No.1 Public Service District (PSD) is governed by a seven-member Board of Commissioners. Commissioners are elected by registered voters during general elections. Commissioners serve four-year terms and represent four different voting districts within the PSD service area. The Commission establishes policies for the PSD and employs the General Manager. The Commission reviews and adopts the utility’s annual operating budget and conducts an annual Cost of Service Analysis in order to determine the utility’s consumption rates and user fees. The Commission normally meets on the fourth Tuesday of each month in the PSD Community Room at 21 Oak Park Drive off Mathews Drive on Hilton Head Island. Public comment is welcome at all Commission meetings.
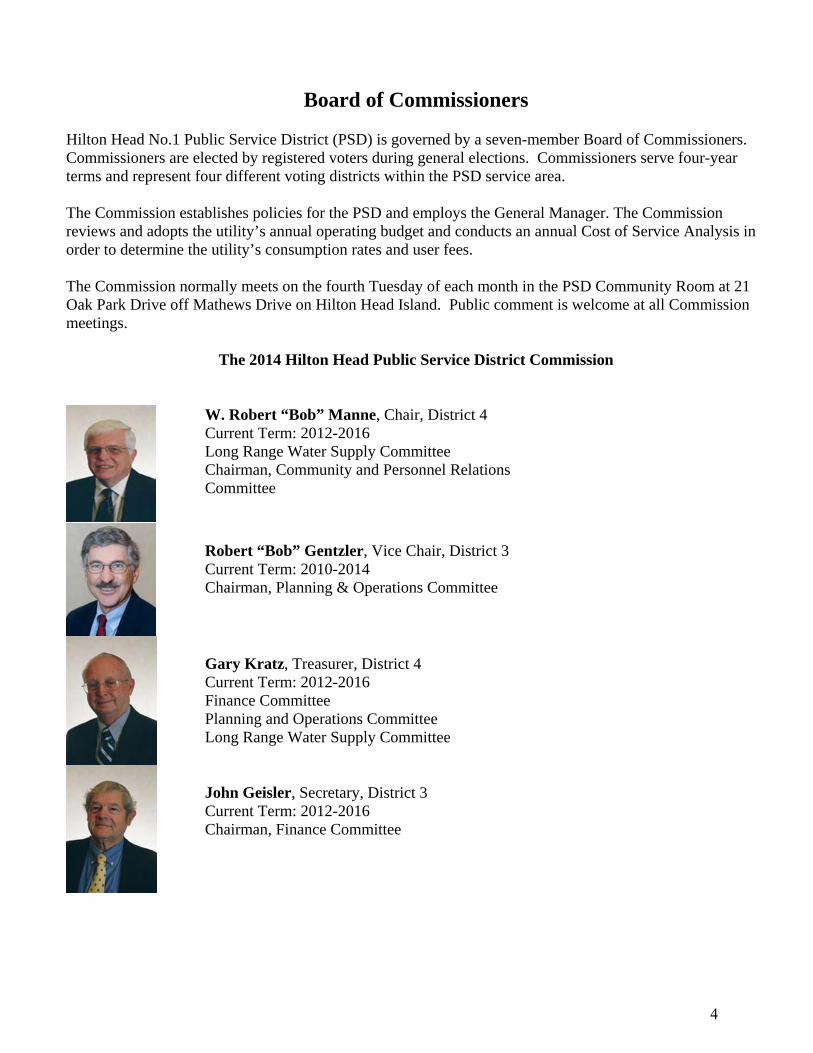
The 2014 Hilton Head Public Service District Commission
W. Robert “Bob” Manne, Chair, District 4 Current Term: 2012-2016 Long Range Water Supply Committee Chairman, Community and Personnel Relations Committee
Robert “Bob” Gentzler, Vice Chair, District 3 Current Term: 2010-2014 Chairman, Planning & Operations Committee
Gary Kratz, Treasurer, District 4 Current Term: 2012-2016 Finance Committee Planning and Operations Committee Long Range Water Supply Committee
John Geisler, Secretary, District 3 Current Term: 2012-2016 Chairman, Finance Committee
4

David McCoy, District 2 Current Term: 2012-2016 Finance Committee Community & Personnel Relations Committee
Frank Drehwing, District 4 Current Term: 2010-2014 Chairman, Long-Range Water Supply Committee Community and Personnel Relations Committee
Herbert Ford, District 1 Current Term: 2010-2014 Planning & Operations Committee
5
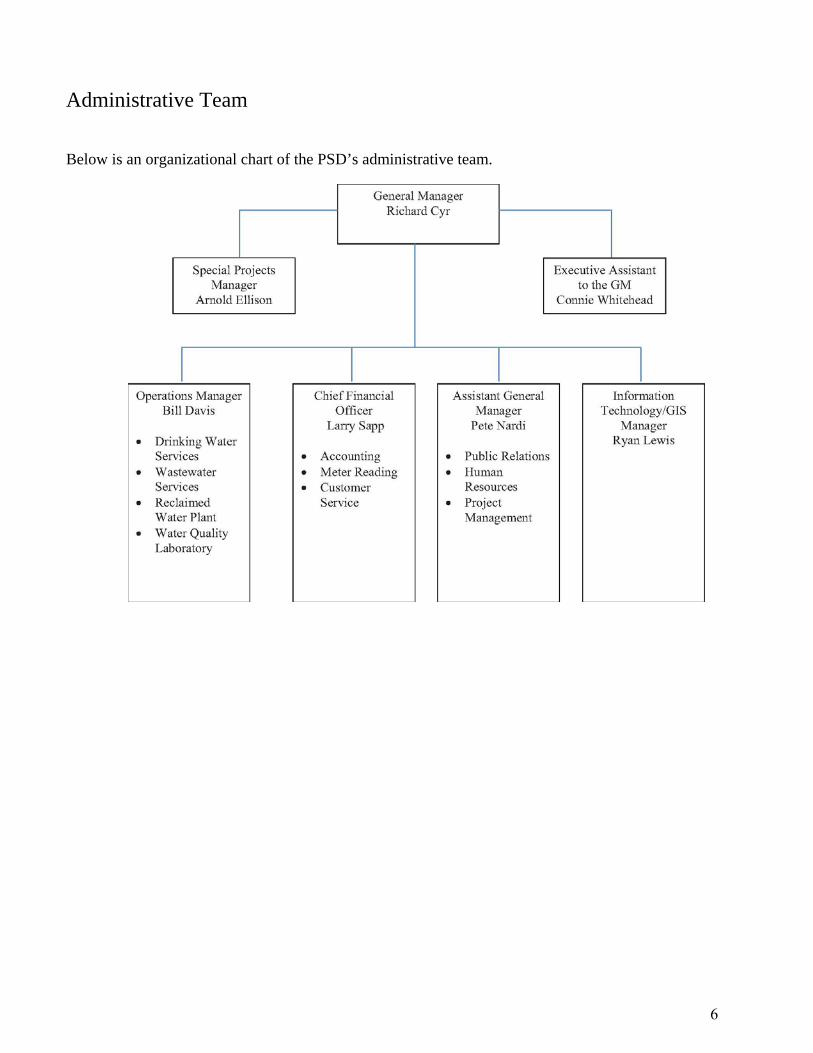
Administrative Team
Below is an organizational chart of the PSD’s administrative team.
6
HILTON HEAD PUBLIC SERVICE DISTRICT Vision, Mission & Strategic Goals
Vision Statement Our vision is to be a state of the art public utility, operated by an excellent, highly trained staff, providing the best practical levels of water and sewer customer service and satisfaction.
Mission Statement
Hilton Head Public Service District’s mission is to:
A. Provide high quality drinking water, wastewater treatment and recycled water services to customers within the District;
B. Deliver those services in a cost-effective and timely manner; C. Maintain sensitivity to the needs of the community; and D. Contribute to the improvement of public health and the environment of the District.
Strategic Goals
The PSD Commission conducts an annual Strategic Planning Session and conducts ongoing strategic planning activities throughout the year. Each Strategic Goal is accompanied by specific directives and staff work plan items. The directives and staff work plan also are updated annually. Below are the current Strategic Goals for the PSD as adopted by the PSD Commission.
Hilton Head PSD Strategic Goals Revised January 22, 2013
Goal No. 1 – Water Services: Meet all of our customers’ water supply needs with the highest quality water possible in a cost-effective manner. Goal No. 2 – Water Reclamation Services: Meet all of the District’s wastewater process and reclamation services in a cost-effective manner while enhancing and protecting the Island’s environment. Goal No. 3 – Environmental: Operate in a sustainable manner with high regard for protecting and improving the environment. Goal No. 4 – Customer Satisfaction: Direct all activities to achieve a consistently high level of customer satisfaction. Goal No. 5 – Financial Responsibility: Conduct all District activity in a fiscally responsible manner. Goal No. 6 – Organizational Excellence and Leadership: Achieve organizational excellence and leadership under the guidance of careful strategic planning.
7
Goal No. 7 – Asset Management: Improve, maintain and secure the District’s property, information, plant and equipment assets. Goal No. 8 – External Relations: Develop, expand and leverage the District’s positive relationships with external organizations, utilities and governments.
8
November 12, 2014
Management Letter of Transmittal The Commission and staff of the PSD are pleased to present the Comprehensive Annual Financial Report (CAFR) for the fiscal year ended June 30, 2014. This is the fifth report issued as a CAFR and it will be made available to the general public via the www.hhpsd.com web site. It also can be viewed in person at the PSD’s Customer Service Center at 21 Oak Park Drive off Mathews Drive, on Hilton Head Island. Management is responsible, in all material respects, for both the accuracy of the data included herein, and for the comprehensiveness of the presentation, including all disclosures. The data contained herein is being presented to fairly disclose the financial position and the results of operations of the PSD. All disclosures necessary to provide the reader with an understanding of the PSD’s financial and operational activities have been included. The CAFR is presented in three sections: Introduction; Financial; and Statistical. The Introduction contains an overview of the PSD’s mission and its operations, including management transmittal letters. The Financial section has a report of the independent auditor, management’s discussion and analysis, the PSD’s financial statements, and supplemental financial data. The Statistical section includes financial and demographic information, generally presented on a multi-year basis.
Profile of the Government The Hilton Head Public Service District (PSD) is a special purpose district created by the South Carolina General Assembly in 1969 to provide water and sewer services to Hilton Head Island. Residents of Hilton Head Island relied on private wells for their drinking water needs until 1957. At that time, a local development firm called the Hilton Head Water Company introduced a community waterworks system, installing water lines and drilling wells throughout the island. As the community expanded and development progressed, however, Hilton Head citizens became increasingly aware of the need for enhanced services, a need especially apparent in fire protection, water flow and sewer services. Ten separate utilities, both public and private, provided water and wastewater services to the residents of the island at the time of the District’s creation. Beginning in 1995, the District acquired the four utilities that now comprise its current service area, including Hilton Head Plantation Utilities, Hilton Head Island Rural Community Water District, Coastal Utilities and Hilton Head Utilities. In addition, the PSD acquired two small systems on the island previously served by the Beaufort-Jasper Water & Sewer Authority. Consolidation of the remaining island utilities formed the three public service districts currently serving Hilton Head Island – Hilton Head, Broad Creek, and South Island PSDs. Today, Hilton Head PSD serves more than 17,000 customers in the north- and mid-island areas of Hilton Head Island, from Jenkins Island to the Hilton Head Resort. The remainder of Hilton Head Island is served by either the Broad Creek PSD, which serves the Palmetto Dunes and Shelter Cove areas, or the South Island PSD, which serves all areas of the island south of Palmetto Dunes. The three island public service districts work together on an array of issues, from hurricane operations and recovery to future water supply planning.
9
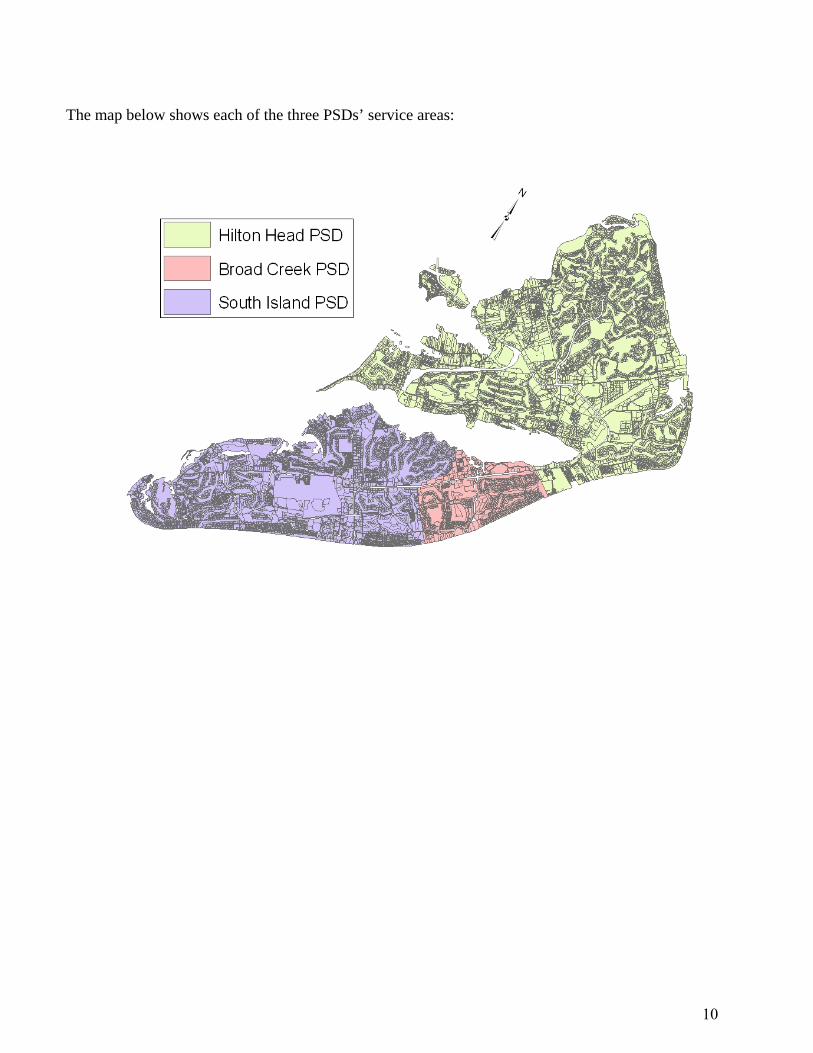
The map below shows each of the three PSDs’ service areas:
10
Fiscal Year ’14 Projects & Events
Hilton Head PSD completed a number of significant projects during Fiscal Year 2014, including:
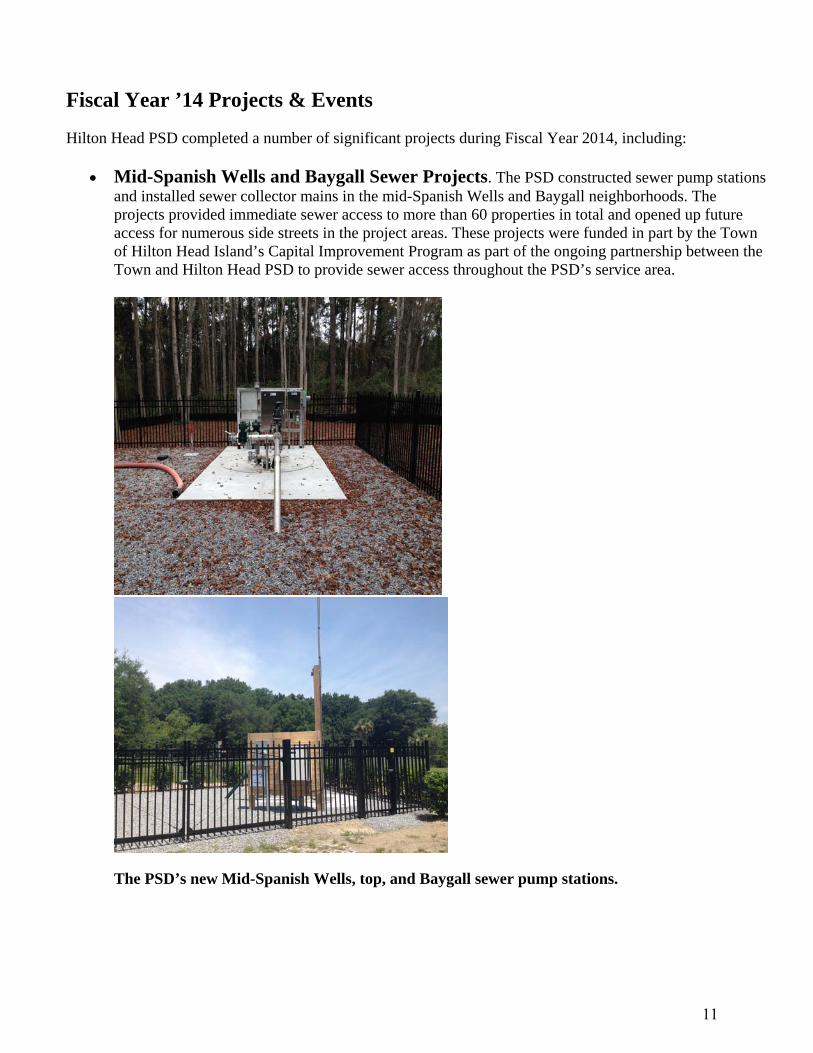
Mid-Spanish Wells and Baygall Sewer Projects. The PSD constructed sewer pump stations and installed sewer collector mains in the mid-Spanish Wells and Baygall neighborhoods. The projects provided immediate sewer access to more than 60 properties in total and opened up future access for numerous side streets in the project areas. These projects were funded in part by the Town of Hilton Head Island’s Capital Improvement Program as part of the ongoing partnership between the Town and Hilton Head PSD to provide sewer access throughout the PSD’s service area.
The PSD’s new Mid-Spanish Wells, top, and Baygall sewer pump stations.
11
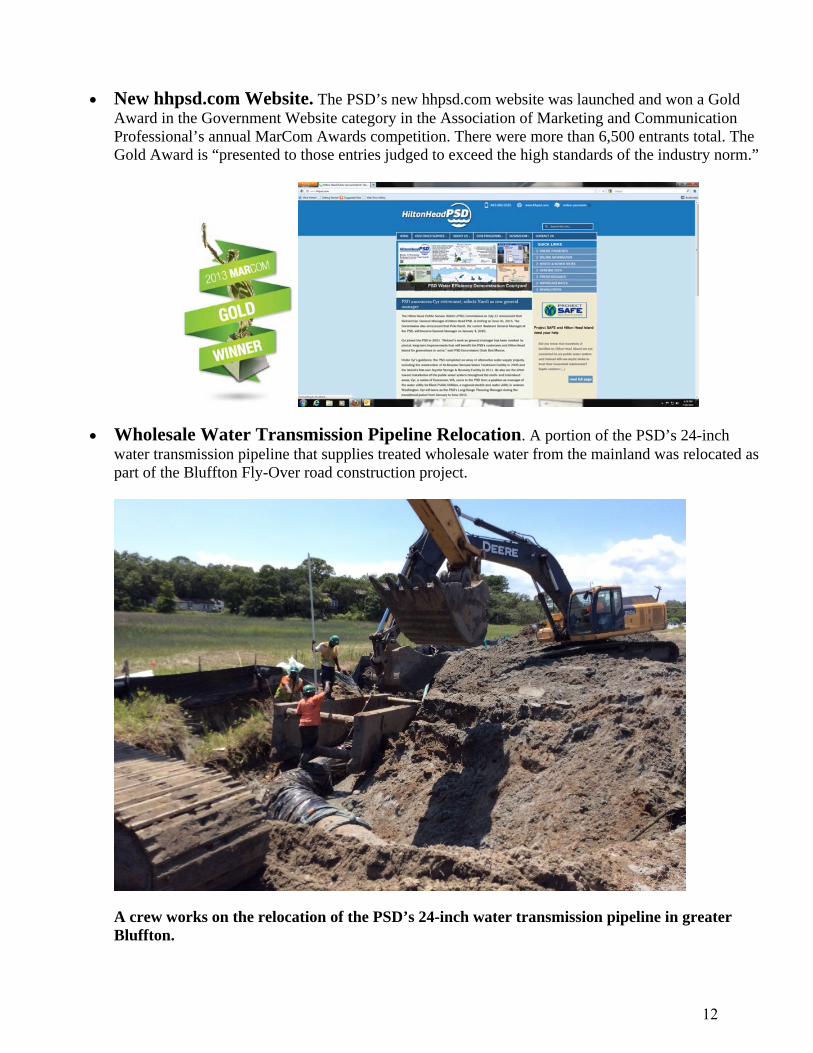
New hhpsd.com Website. The PSD’s new hhpsd.com website was launched and won a Gold Award in the Government Website category in the Association of Marketing and Communication Professional’s annual MarCom Awards competition. There were more than 6,500 entrants total. The Gold Award is “presented to those entries judged to exceed the high standards of the industry norm.”
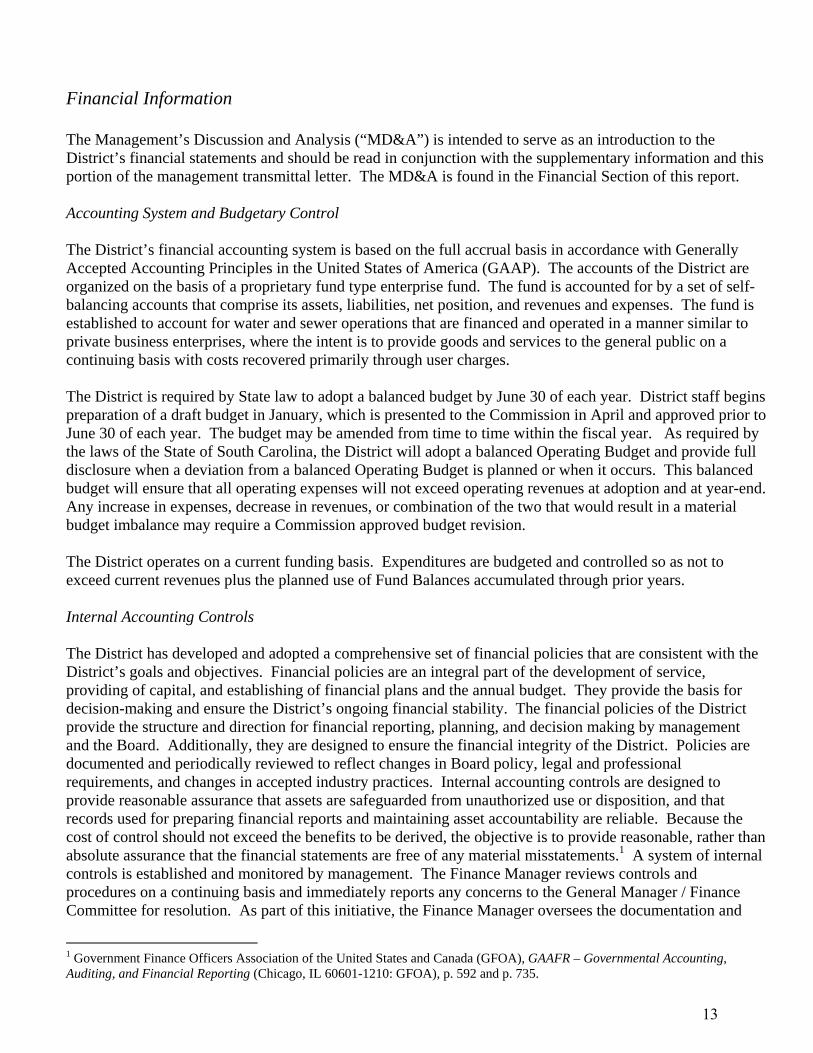
Wholesale Water Transmission Pipeline Relocation. A portion of the PSD’s 24-inch water transmission pipeline that supplies treated wholesale water from the mainland was relocated as part of the Bluffton Fly-Over road construction project.
A crew works on the relocation of the PSD’s 24-inch water transmission pipeline in greater Bluffton.
12
Financial Information The Management’s Discussion and Analysis (“MD&A”) is intended to serve as an introduction to the District’s financial statements and should be read in conjunction with the supplementary information and this portion of the management transmittal letter. The MD&A is found in the Financial Section of this report. Accounting System and Budgetary Control The District’s financial accounting system is based on the full accrual basis in accordance with Generally Accepted Accounting Principles in the United States of America (GAAP). The accounts of the District are organized on the basis of a proprietary fund type enterprise fund. The fund is accounted for by a set of self-balancing accounts that comprise its assets, liabilities, net position, and revenues and expenses. The fund is established to account for water and sewer operations that are financed and operated in a manner similar to private business enterprises, where the intent is to provide goods and services to the general public on a continuing basis with costs recovered primarily through user charges. The District is required by State law to adopt a balanced budget by June 30 of each year. District staff begins preparation of a draft budget in January, which is presented to the Commission in April and approved prior to June 30 of each year. The budget may be amended from time to time within the fiscal year. As required by the laws of the State of South Carolina, the District will adopt a balanced Operating Budget and provide full disclosure when a deviation from a balanced Operating Budget is planned or when it occurs. This balanced budget will ensure that all operating expenses will not exceed operating revenues at adoption and at year-end. Any increase in expenses, decrease in revenues, or combination of the two that would result in a material budget imbalance may require a Commission approved budget revision. The District operates on a current funding basis. Expenditures are budgeted and controlled so as not to exceed current revenues plus the planned use of Fund Balances accumulated through prior years. Internal Accounting Controls The District has developed and adopted a comprehensive set of financial policies that are consistent with the District’s goals and objectives. Financial policies are an integral part of the development of service, providing of capital, and establishing of financial plans and the annual budget. They provide the basis for decision-making and ensure the District’s ongoing financial stability. The financial policies of the District provide the structure and direction for financial reporting, planning, and decision making by management and the Board. Additionally, they are designed to ensure the financial integrity of the District. Policies are documented and periodically reviewed to reflect changes in Board policy, legal and professional requirements, and changes in accepted industry practices. Internal accounting controls are designed to provide reasonable assurance that assets are safeguarded from unauthorized use or disposition, and that records used for preparing financial reports and maintaining asset accountability are reliable. Because the cost of control should not exceed the benefits to be derived, the objective is to provide reasonable, rather than absolute assurance that the financial statements are free of any material misstatements.1 A system of internal controls is established and monitored by management. The Finance Manager reviews controls and procedures on a continuing basis and immediately reports any concerns to the General Manager / Finance Committee for resolution. As part of this initiative, the Finance Manager oversees the documentation and
1 Government Finance Officers Association of the United States and Canada (GFOA), GAAFR – Governmental Accounting, Auditing, and Financial Reporting (Chicago, IL 60601-1210: GFOA), p. 592 and p. 735.
13
periodic review of financial standard operating procedures to ensure that internal audit functions and professional skepticism are incorporated as part of the analytical and reporting function. Management of the District is further charged, through personnel policies, with providing the leadership that promotes ethical behavior. The Finance Committee of the Board of Commissioners serves as the Audit Committee of the District. It is composed of three members of the Board. Generally, this Committee meets with management regularly to review the financial status of the District. Additionally, the Committee meets with management and the independent external auditors to ensure that both parties are fulfilling their obligations with regard to auditing, controls, and other financial reporting factors. Rates and Charges The District maintains and administers a revenue system that assures a reliable, equitable and sufficient revenue stream to support the District services. Since the principal revenue stream for the District is composed of the fees and charges established by the Commission, the governing body of the District, it is important that the District adopts policies that identify the manner in which fees and charges are set and the extent to which they cover the cost of the service provided. As stated in the District’s financial policies, all user charges and fees are set at levels related to the costs (operating, direct, indirect and capital) of providing its services. The District reviews these fees and charges annually during the budget process and target rates that are expected to produce revenues sufficient to fully fund the costs of providing services – particularly in the District’s key businesses (water and wastewater). Cost of service includes direct and indirect costs such as operating and maintenance costs, overhead, and charges for use of capital. The District may choose not to recover all costs, but it must identify such costs. Reasons for not recovering full costs are identified and explained.
The District also examines rates and charges levied by other water and sewer systems for like services in establishing rates, fees and charges. These fees (water and sewer user fees, capacity fees, tap fees, tower revenues, etc.) are reviewed through the District’s annual cost of service process. An aggressive policy of seeking the collection of delinquent utility accounts is maintained and is outlined by specific procedures. In projecting revenues - and where judgment is required - conservatism is the rule. In compliance with the District’s financial policies, water and sewer rate increases are minimized whenever possible. However, both water and sewer rate increases have been necessary in the past to sustain necessary revenues to support related water and sewer expenses. The most recent rate increase was put into effect January 1, 2013 when both the water and sewer base rates were increased by $1.00. For a summary of the District’s historical and present water and sewer rates, please reference the Water and Sewer Rate Comparison Table in the Statistical Section on page 83.
14
Millage Pursuant to Act No. 596, the District is authorized to impose ad valorem property taxes not to exceed ten mills to defray a portion of its operational costs. The District’s operational ad valorem tax millage is fixed at 3 mills. As of July 1, 2007, millage rates for operations may increase only at a rate equal to the sum of (a) the increase in the consumer price index, plus (b) the rate of population growth of the political subdivision or school district. This limitation may be overridden by a vote of two-thirds of the governing body of the political subdivision, but only for the following purposes and only in a year in which such condition exists:
1. a deficiency of the preceding year;
2. any catastrophic event outside the control of the governing body such as a natural disaster, severe weather event, act of God, or act of terrorism, fire, war, or riot;
3. compliance with a court order or decree;
4. taxpayer closure due to circumstances outside the control of the governing body that decreases
by ten percent or more the amount of revenue payable to the taxing jurisdiction in the preceding year;
5. compliance with a regulation promulgated or statute enacted by the federal or state
government after the ratification date of this section for which an appropriation or a method for obtaining an appropriation is not provided by the federal or state government;
6. purchase by the local governing body of undeveloped real property or of the residential
development rights in undeveloped real property near an operating United States military base which property has been identified as suitable for residential development but which residential development would constitute undesirable residential encroachment upon the United States military base as determined by the local governing body. The local governing body shall enact an ordinance authorizing such purchase and the ordinance must state the nature and extent of the potential residential encroachment, how the purchased property or development rights would be used and specifically how and why this use would be beneficial to the United States military base, and what the impact would be to the United States military base if such purchase were not made. Millage rate increases for the purpose of such purchase must be separately stated on each tax bill and must specify the property, or the development rights to be purchased, the amount to be collected for such purchase, and the length of time that the millage rate increase will be in effect. The millage rate increase must reasonably relate to the purchase price and must be rescinded five years after it was placed in effect or when the amount specified to be collected is collected, whichever occurs first. The millage rate increase for such purchase may not be reinstated unless approved by a majority of the qualified voters of the governmental entity voting in a referendum. The cost of holding the referendum must be paid from the taxes collected due to the increased millage rate; or
7. to purchase capital equipment and make expenditures related to the installation, operation, and
purchase of the capital equipment including, but not limited to, taxes, duty, transportation, delivery, and transit insurance, in a county having a population of less than one hundred thousand persons and having at least forty thousand acres of state forest land. For purposes of this section, “capital equipment” means an article of nonexpendable, tangible, personal
15
property, to include communication software when purchased with a computer, having a useful life of more than one year and an acquisition cost of fifty thousand dollars or more for each unit.
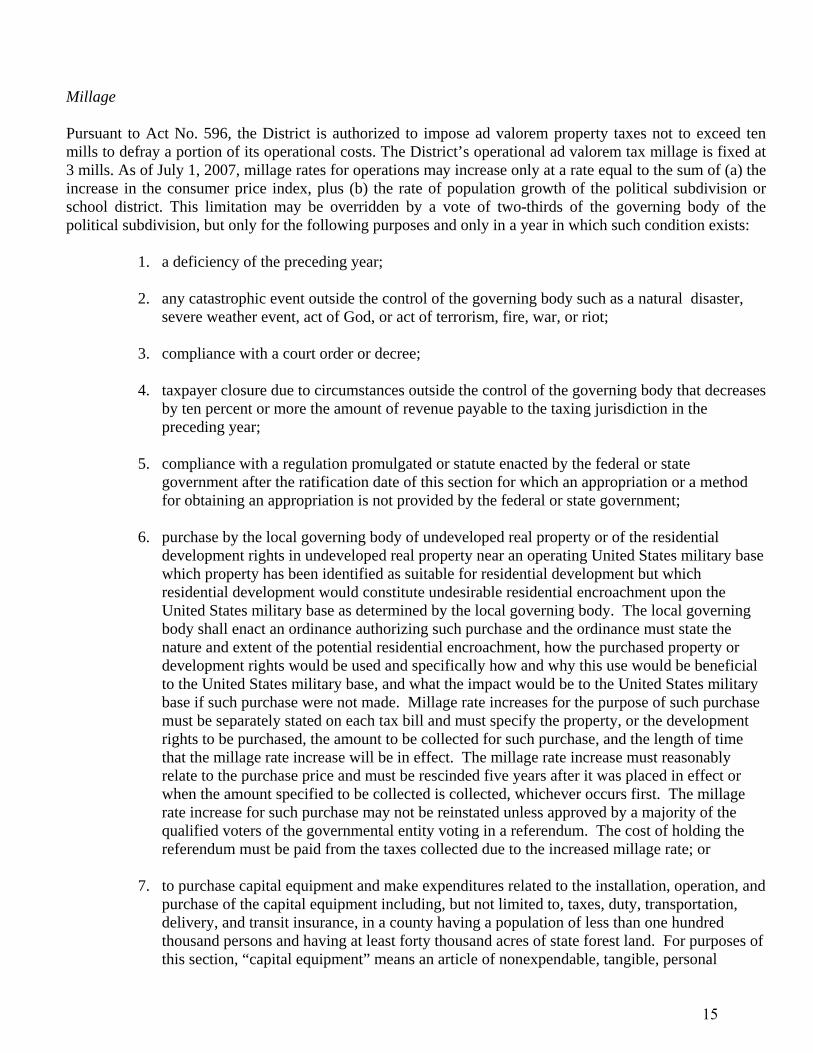
The limitations described above do not apply to the levy of debt service millage. Therefore, the District is also authorized to impose ad valorem property taxes in an amount not exceeding eight percent (8%) of the assessed value of all taxable property to defray the debt service on general obligation bonds of the District. All of such general obligation bonds are approved by the Beaufort County Council pursuant to South Carolina general law. Financial Condition Operating revenues, operating expenses (excluding depreciation), and revenue related debt service payments for the past ten fiscal years are summarized in the following graph.
Operating Revenues, Expense Excluding Depreciation and Revenue Debt Service (P&I)
$0
$2,000,000
$4,000,000
$6,000,000
$8,000,000
$10,000,000
$12,000,000
$14,000,000
2005 2006 2007 2008 2009 2010 2011 2012 2013 2014
Operating Revenues Operating Expenses Excluding Depreciation Revenue Debt Service Principal and Interest
Billed water consumption for fiscal year was down 130.0 million gallons or 6.7% less then fiscal year 2013 mainly due to cooler than usual weather conditions and increased rainfall. As such, water service revenues were down $173,940 or 2.9% compared to last fiscal year despite a $1.00 water base rate increase effective January 1, 2013. Despite lower water consumption, sewer revenues were up due to a rate increase which was effective as of January 1, 2013.2 Total operating revenues have decreased 0.2% or $25,525 compared fiscal year 2013, while departmental expenses decreased $33,714 or 0.4%. Departmental expenses are covered in more detail in the Management Discussion and Analysis section of this report on page 32.
2 Residential sewer service customers billed consumption is capped at 10,000 gallons per month. Therefore sewer service revenues are not necessarily as adversely affected by lower water consumption compared to water service revenues.
16
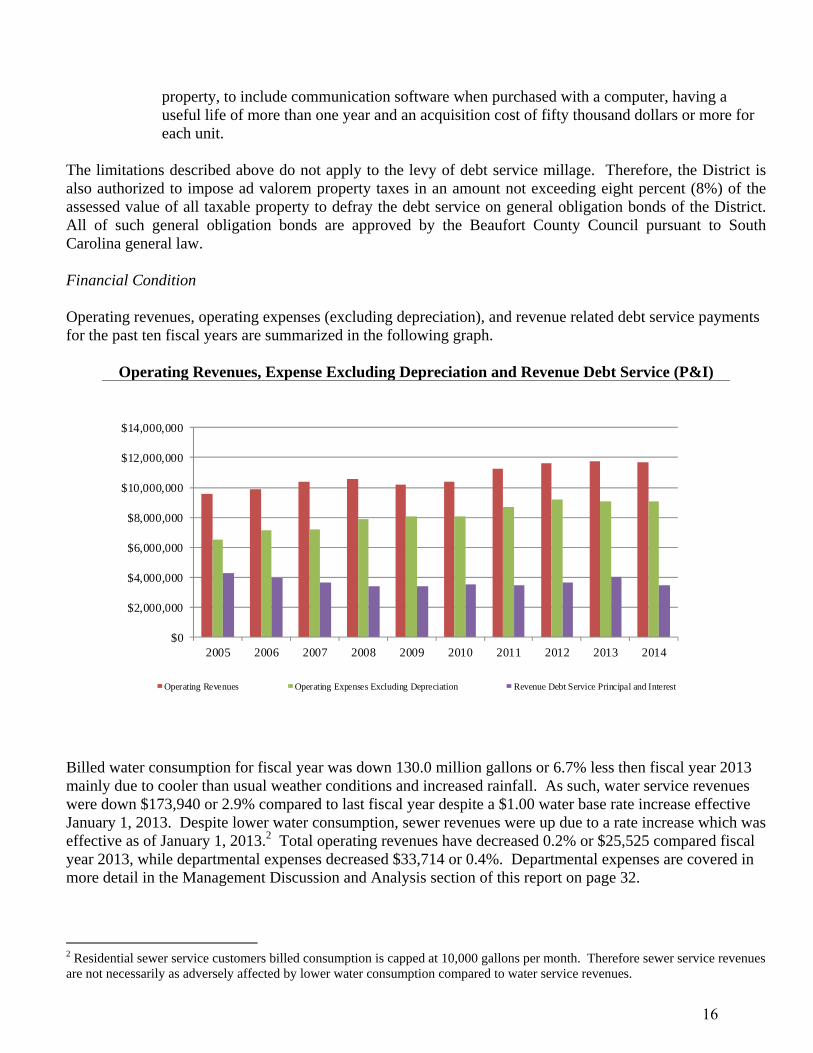
Billed water consumption for fiscal year 2013 was 50.9 million gallons or 2.6% less than fiscal year 2012, but combined water and sewer revenues increased by $102,825 or 1.0% due to the water and sewer rate increase put into effect on January 1, 2013 (See Water and Wastewater Rate Comparison Table, page 83). While operating revenues increased by $99,440 or 0.9% for fiscal year 2013, departmental expenses decreased $122,339 or 1.3%. Billed water consumption for fiscal year 2012 was just slightly higher than fiscal year 2011, but combined water and sewer revenues increased by $427,000 (rounded) or 4.2% due to a water and sewer rate increase put into effect on May 1, 2011. While operating revenues increased by $358,000 (rounded) or 3.2% for fiscal year 2012, departmental expenses increased $484,000 (rounded) or 5.6% mainly due to increased operations, payroll & related and professional fees expenses. The following table shows customer counts in relation to water and irrigation Kgal sales. While typically more customers equates to more water consumed, there is no evident direct relationship between the District’s customer counts and overall consumption levels due to the other variables that influence customer water consumption (e.g. weather, economy, conservation).
Water/Irrigation Customers vs. Water/Irrigation Kgal Sales
16,647 17,104 17,295 17,389 17,354 17,316 17,447 17,495 17,600 17,774
1,000,000
1,200,000
1,400,000
1,600,000
1,800,000
2,000,000
2,200,000
0
2,000
4,000
6,000
8,000
10,000
12,000
14,000
16,000
18,000
20,000
2005 2006 2007 2008 2009 2010 2011 2012 2013 2014
Kgals Sales Number of CustomersK
gals
Sale
s
Cus
tom
ers
17
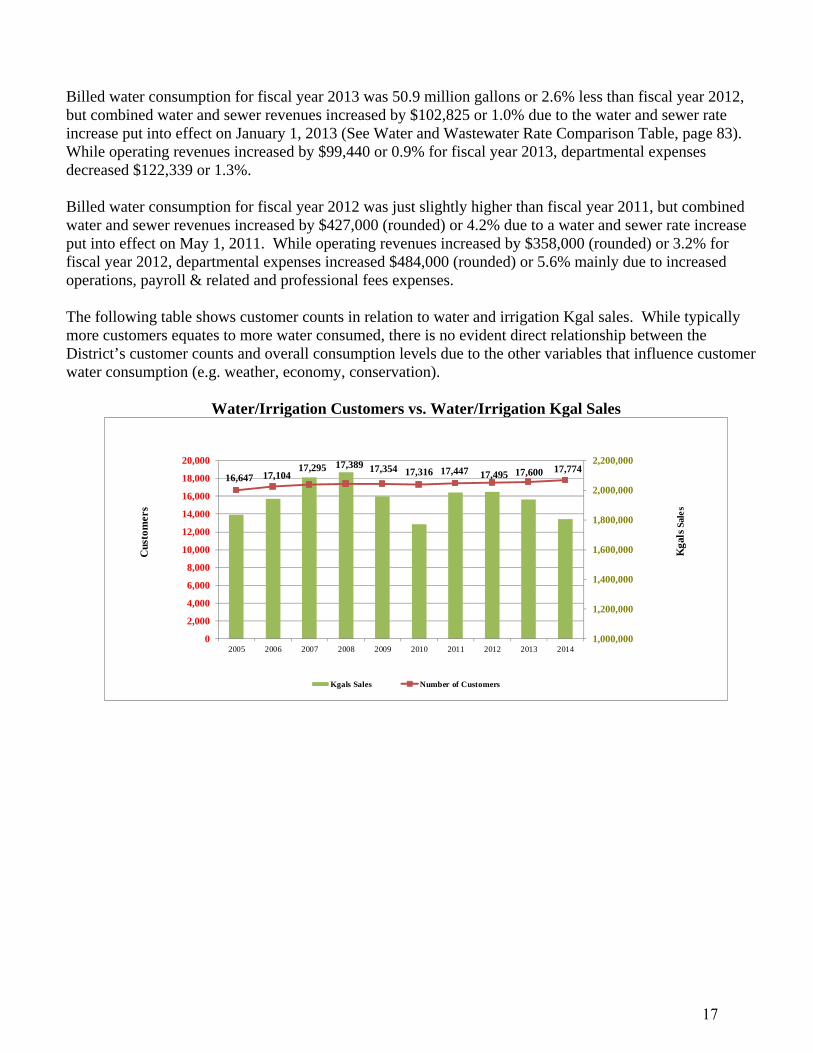
The following chart is a comparison of rainfall amounts in relation to water and irrigation Kgals sales.
Rainfall (Inches) vs. Water/Irrigation Kgal Sales
54.6 53.0
48.8 51.6
56.3
48.7
43.5
39.8
42.740.8
1,600,000
1,700,000
1,800,000
1,900,000
2,000,000
2,100,000
2,200,000
0
10
20
30
40
50
60
2005 2006 2007 2008 2009 2010 2011 2012 2013 2014
Kgal Sales Rainfall (inches)
Kga
ls S
ales
Rai
nfal
l (i
nces
)
Despite lower rainfall amounts for fiscal years 2010 through 2014, respective water consumption levels were also low when compared to past fiscal years with higher rainfall such as 2007 and 2008. As previously discussed, other seasonal factors such as temperature and economic influences such as new housing development, housing vacancies, and tourism occupancy levels also have a material effect on customer water consumption levels. Independent Audit The accompanying financial statements have been audited by the District’s independent auditors, Robinson Grant & Co., P.A., and their report on the financial statements resulting from their audit is included in the Financial Section of this report.
18
Certificate of Achievement for Excellence in Financial Reporting The Government Finance Officer Association of the United States and Canada (GFOA) awarded a Certificate of Achievement for Excellence in Financial Reporting to Hilton Head Public Service District for its comprehensive annual financial report for the fiscal year ended June 30, 2013 (Reference the following page). This was the fourth year that the District achieved this prestigious award. In order to be awarded a Certificate of Achievement, a government must establish an easily readable and efficiently organized comprehensive annual financial report. This report must satisfy both generally accepted accounting principles and applicable legal requirements. A Certificate of Achievement is valid for a period of one year only. Management believes that the current comprehensive annual financial report continues to meet the Certificate of Achievement Program’s requirements and is submitting it to the GFOA to determine its eligibility for another certificate. Final Comments Management has developed policies and procedures that direct personnel actions toward the Board’s adopted mission of providing high quality water and sewer service to all properties within the District and provide those services at a reasonable cost. Further, the Board has adopted the District’s Strategic Goals that support the District’s mission. These goals are reviewed annually during the early planning process of creating staff work plans for the upcoming fiscal budgeting process. We are thankful to all District employees for their hard work and dedication. Additionally, we would like to recognize the District’s General Manager and Board of Commissioners for their leadership, support, and continued commitment to excellence.
Larry Sapp, CGFO, Chief Financial Officer
Brian Cronin, Senior Accountant
19
20
FINANCIAL For Fiscal Years Ended June 30, 2014 and June 30, 2013
21
INDEPENDENT AUDITORS' REPORT
November 12, 2014 The Commissioners Hilton Head No. 1 Public Service District Hilton Head Island, South Carolina We have audited the accompanying financial statements of Hilton Head No. 1 Public Service District (the “District”), which comprise the statements of net position as of June 30, 2014 and 2013, and the related statements of revenues, expenses and changes in net position, and cash flows for the years then ended, and the related notes to the financial statements.
Management’s Responsibility for the Financial Statements
Management is responsible for the preparation and fair presentation of these financial statements in accordance with accounting principles generally accepted in the United States of America; this includes the design, implementation, and maintenance of internal control relevant to the preparation and fair presentation of financial statements that are free from material misstatement, whether due to fraud or error.
Auditor’s Responsibility
Our responsibility is to express opinions on these financial statements based on our audits. We conducted our audits in accordance with auditing standards generally accepted in the United States of America. Those standards require that we plan and perform the audits to obtain reasonable assurance about whether the financial statements are free from material misstatement. An audit involves performing procedures to obtain audit evidence about the amounts and disclosures in the financial statements. The procedures selected depend on the auditor’s judgment, including the assessment of the risks of material misstatement of the financial statements, whether due to fraud or error. In making those risk assessments, the auditor considers internal control relevant to the entity’s preparation and fair presentation of the financial statements in order to design audit procedures that are appropriate in the circumstances, but not for the purpose of expressing an opinion on the effectiveness of the entity’s internal control. Accordingly, we express no such opinion. An audit also includes evaluating the appropriateness of accounting policies used and the reasonableness of significant accounting estimates made by management, as well as evaluating the overall presentation of the financial statements. We believe that the audit evidence we have obtained is sufficient and appropriate to provide a basis for our audit opinions.
22
Opinions
In our opinion, the financial statements referred to above present fairly, in all material respects, the financial position of Hilton Head No. 1 Public Service District as of June 30, 2014 and 2013, and the changes in its financial position and its cash flows for the years then ended in conformity with accounting principles generally accepted in the United States of America.
Other Matters
Required Supplementary Information
Accounting principles generally accepted in the United States of America require that the management’s discussion and analysis, as listed in the table of contents, be presented to supplement the basic financial statements. Such information, although not a part of the basic financial statements, is required by the Governmental Accounting Standards Board, who considers it to be an essential part of financial reporting for placing the basic financial statements in an appropriate operational, economic, or historical context. We have applied certain limited procedures to the required supplementary information in accordance with auditing standards generally accepted in the United States of America, which consisted of inquiries of management about the methods of preparing the information and comparing the information for consistency with management’s responses to our inquiries, the basic financial statements, and other knowledge we obtained during our audit of the basic financial statements. We do not express an opinion or provide any assurance on the information because the limited procedures do not provide us with sufficient evidence to express an opinion or provide any assurance.
Other Information
Our audits were conducted for the purpose of forming opinions on the financial statements of Hilton Head No. 1 Public Service District taken as a whole. The introductory section, supplementary information, and statistical section, as listed in the table of contents, are presented for purposes of additional analysis and are not a required part of the basic financial statements.
The supplementary information is the responsibility of management and was derived from and relates directly to the underlying accounting and other records used to prepare the basic financial statements. Such information has been subjected to the auditing procedures applied in the audits of the basic financial statements and certain additional procedures, including comparing and reconciling such information directly to the underlying accounting and other records used to prepare the basic financial statements or to the basic financial statements themselves, and other additional procedures in accordance with auditing standards generally accepted in the United States of America. In our opinion, the supplementary information is fairly stated in all material respects in relation to the basic financial statements as a whole.
The introductory and statistical sections have not been subjected to the auditing procedures applied in the audit of the basic financial statements and, accordingly, we do not express an opinion or provide any assurance on them.
23
Management’s Discussion and Analysis This section of the Hilton Head No. 1 Public Service District’s (the “District”) annual financial statements presents our analysis of the District’s financial performance during the fiscal years ending June 30, 2014, 2013 and 2012. Please read it in conjunction with the unaudited financial statements contained in this section. Financial Highlights
Total assets at the end of the fiscal year 2014 were approximately $87.8 million (See Table A-1, Page 27). Total assets including deferred outflows of resources were $89.4 million, exceeding liabilities by $37.1 million.
On August 5, 2013, the District received three bids ranging from $228,966 to $306,661 for the
installation of a lift Station in the Baygall service area within the District. The bid was awarded in the amount of $228,966. This project was completed during fiscal year 2015.
On October 10, 2013, the District received three bids ranging from $497,378 to $846,597 for the installation of sewer mains in the Baygall service area within the District. The bid was awarded in the amount of $687,777. This project was completed during fiscal year 2015.
On November 5, 2013, Standard and Poor’s affirmed its ‘AA+’ rating, with a stable outlook on the District’s general obligation bonds. Standard and Poor’s also stated that they believe continued local economic growth and significant income improvement could lead them to consider raising the rating. However, they did not expect to change the rating within the outlook’s two-year period. In Standard and Poor’s opinion this rating reflected the District’s: Well-established tourism-centered local economy, resulting in very strong income and
extremely strong market value per capita; Very strong finances; and Low-to-moderate debt with manageable capital needs.
On June 27, 2014, the District received loan commitment letters from the South Carolina Water
Quality Revolving Fund Authority for the purpose of funding an Automated Meter Reading/Advanced Metering Infrastructure project.
On June 27, 2014, the District received loan commitment letters from the South Carolina Water Quality Revolving Fund Authority for the purpose of funding the Reverse Osmosis Treatment Plant Expansion, Windmill Harbour Booster Pump Station and our Bluffton Flyover Water Line Relocation projects.
Water Customer Growth: The District added 174 new water/irrigation taps to the system in fiscal year 2014. As of June 30, 2014, the District has a total of 17,774 equivalent dwelling units (EDUs). This is a 1.0% increase for FY’14. For FY’13 there was a 0.6% increase in total EDUs. The current EDUs consist of 16,705 water service units, 1,018 irrigation service units, and 51 miscellaneous water units such as dock meters, hydrants, pool meters, and golf course water coolers.
24
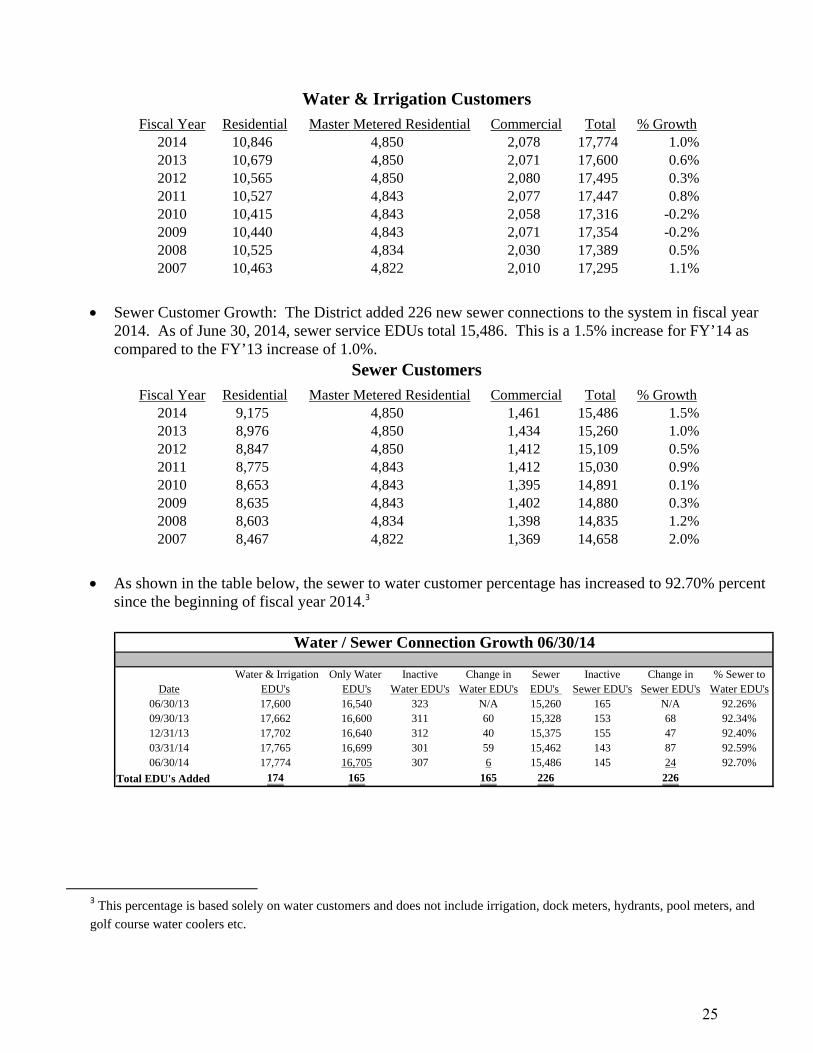
Fiscal Year Residential Master Metered Residential Commercial Total % Growth2014 10,846 4,850 2,078 17,774 1.0%2013 10,679 4,850 2,071 17,600 0.6%2012 10,565 4,850 2,080 17,495 0.3%2011 10,527 4,843 2,077 17,447 0.8%2010 10,415 4,843 2,058 17,316 -0.2%2009 10,440 4,843 2,071 17,354 -0.2%2008 10,525 4,834 2,030 17,389 0.5%2007 10,463 4,822 2,010 17,295 1.1%
Water & Irrigation Customers
Sewer Customer Growth: The District added 226 new sewer connections to the system in fiscal year 2014. As of June 30, 2014, sewer service EDUs total 15,486. This is a 1.5% increase for FY’14 as compared to the FY’13 increase of 1.0%.
Fiscal Year Residential Master Metered Residential Commercial Total % Growth2014 9,175 4,850 1,461 15,486 1.5%2013 8,976 4,850 1,434 15,260 1.0%2012 8,847 4,850 1,412 15,109 0.5%2011 8,775 4,843 1,412 15,030 0.9%2010 8,653 4,843 1,395 14,891 0.1%2009 8,635 4,843 1,402 14,880 0.3%2008 8,603 4,834 1,398 14,835 1.2%2007 8,467 4,822 1,369 14,658 2.0%
Sewer Customers
As shown in the table below, the sewer to water customer percentage has increased to 92.70% percent since the beginning of fiscal year 2014.3
Water & Irrigation Only Water Inactive Change in Sewer Inactive Change in % Sewer toDate EDU's EDU's Water EDU's Water EDU's EDU's Sewer EDU's Sewer EDU's Water EDU's
06/30/13 17,600 16,540 323 N/A 15,260 165 N/A 92.26%09/30/13 17,662 16,600 311 60 15,328 153 68 92.34%12/31/13 17,702 16,640 312 40 15,375 155 47 92.40%03/31/14 17,765 16,699 301 59 15,462 143 87 92.59%06/30/14 17,774 16,705 307 6 15,486 145 24 92.70%
Total EDU's Added 174 165 165 226 226
Water / Sewer Connection Growth 06/30/14
3 This percentage is based solely on water customers and does not include irrigation, dock meters, hydrants, pool meters, and golf course water coolers etc.
25
Subsequent Events
On July 28, 2014, the District paid off the series 2004B revenue bonds totaling $200,940 in full. There was no prepayment penalty.
On July 23, 2014, the District signed a promissory note to the South Carolina Water Quality Revolving Fund Authority in the amount of $2,902,255. Proceeds are to be used to defray the costs of installing and implementing an automatic meter reading system. The note bears interest at a rate of 1.00% per annum. Eighty quarterly principal and interest payments of $40,072 will be due beginning April 1, 2016. The notes are payable from revenues derived from operation of the District’s system, and are secured by a lien upon these revenues.
On September 10, 2014, the District signed a promissory note to the South Carolina Water Quality Revolving Fund Authority in the amount of $3,750,000. Proceeds are to be used to defray the cost expanding the existing reverse osmosis treatment plan, installing an additional booster pump station, and relocating a major water line within the district. The note bears interest at a rate of 2.00% per annum. Eighty quarterly principal and interest payments of $56,989 will be due beginning May 1, 2015. The notes are backed by general obligation debt.
26
Financial Analysis of the District
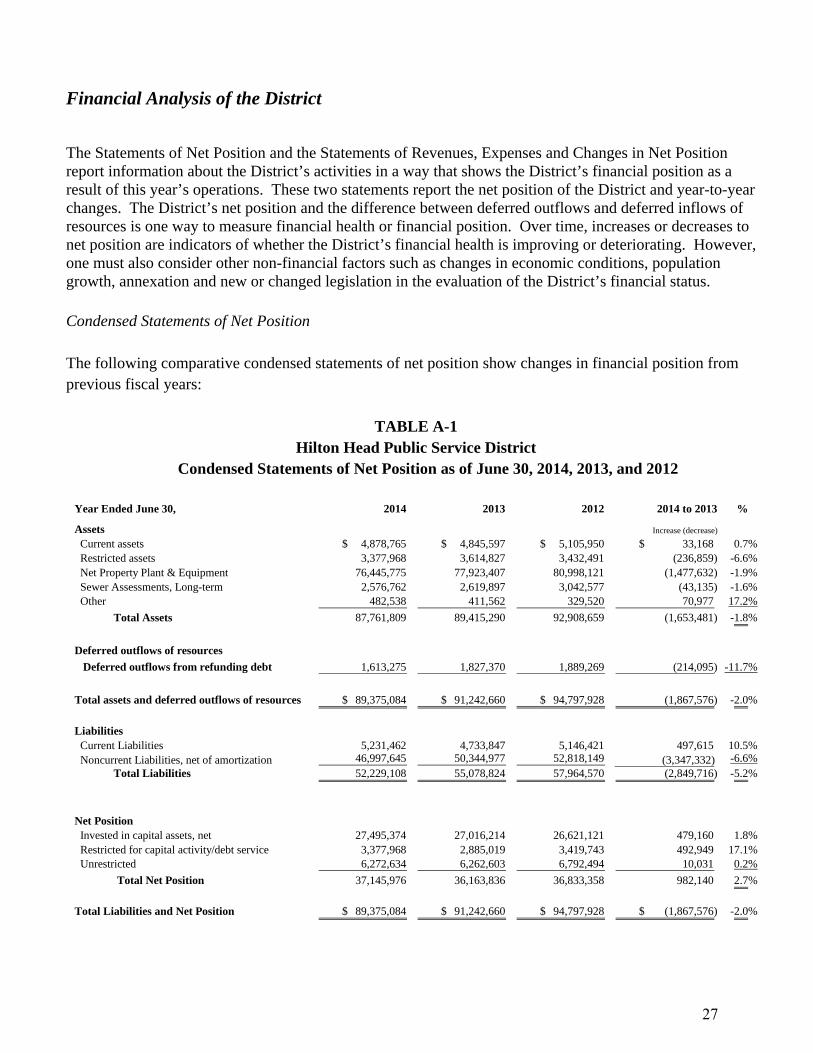
The Statements of Net Position and the Statements of Revenues, Expenses and Changes in Net Position report information about the District’s activities in a way that shows the District’s financial position as a result of this year’s operations. These two statements report the net position of the District and year-to-year changes. The District’s net position and the difference between deferred outflows and deferred inflows of resources is one way to measure financial health or financial position. Over time, increases or decreases to net position are indicators of whether the District’s financial health is improving or deteriorating. However, one must also consider other non-financial factors such as changes in economic conditions, population growth, annexation and new or changed legislation in the evaluation of the District’s financial status. Condensed Statements of Net Position The following comparative condensed statements of net position show changes in financial position from previous fiscal years:
TABLE A-1 Hilton Head Public Service District
Condensed Statements of Net Position as of June 30, 2014, 2013, and 2012
Year Ended June 30, 2014 2013 2012 2014 to 2013 %
Assets Current assets 4,878,765$ 4,845,597$ 5,105,950$ 33,168$ 0.7% Restricted assets 3,377,968 3,614,827 3,432,491 (236,859) -6.6% Net Property Plant & Equipment 76,445,775 77,923,407 80,998,121 (1,477,632) -1.9% Sewer Assessments, Long-term 2,576,762 2,619,897 3,042,577 (43,135) -1.6% Other 482,538 411,562 329,520 70,977 17.2%
Total Assets 87,761,809 89,415,290 92,908,659 (1,653,481) -1.8%
Deferred outflows of resources
Deferred outflows from refunding debt 1,613,275 1,827,370 1,889,269 (214,095) -11.7%
Total assets and deferred outflows of resources 89,375,084$ 91,242,660$ 94,797,928$ (1,867,576) -2.0%
Liabilities Current Liabilities 5,231,462 4,733,847 5,146,421 497,615 10.5% Noncurrent Liabilities, net of amortization 46,997,645 50,344,977 52,818,149 (3,347,332) -6.6%
Total Liabilities 52,229,108 55,078,824 57,964,570 (2,849,716) -5.2%
Net Position Invested in capital assets, net 27,495,374 27,016,214 26,621,121 479,160 1.8% Restricted for capital activity/debt service 3,377,968 2,885,019 3,419,743 492,949 17.1% Unrestricted 6,272,634 6,262,603 6,792,494 10,031 0.2%
Total Net Position 37,145,976 36,163,836 36,833,358 982,140 2.7%
Total Liabilities and Net Position 89,375,084$ 91,242,660$ 94,797,928$ (1,867,576)$ -2.0%
Increase (decrease)
27
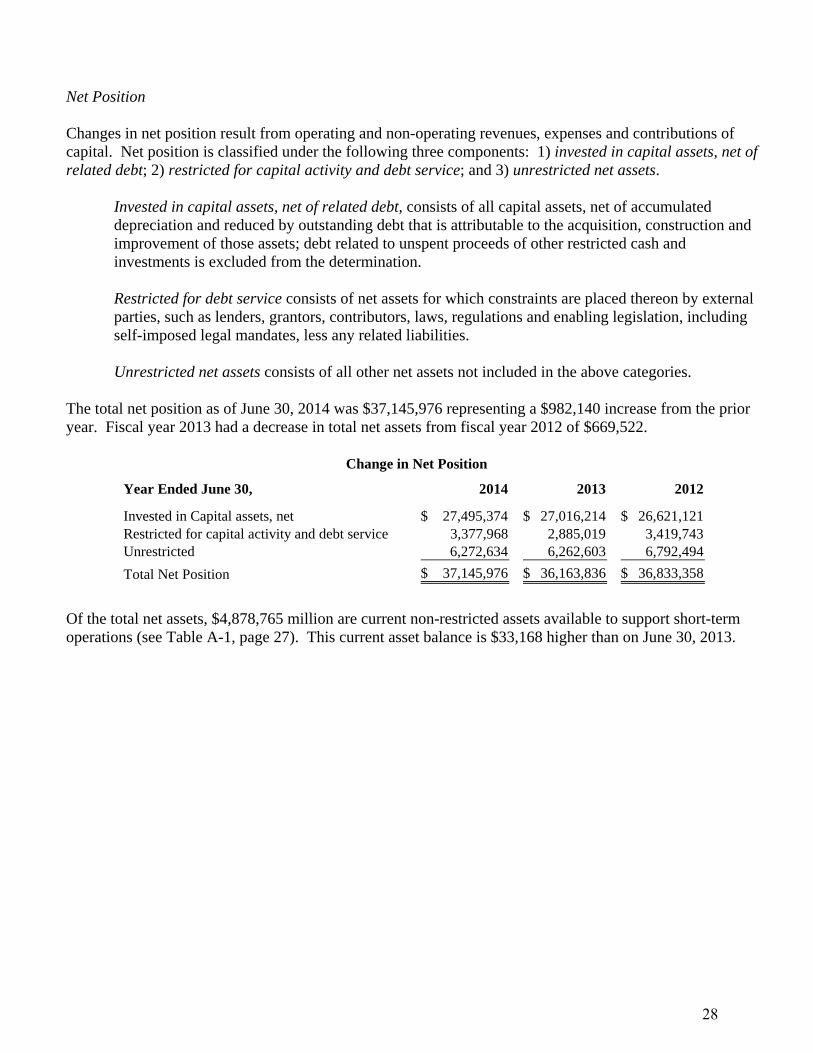
Net Position
Changes in net position result from operating and non-operating revenues, expenses and contributions of capital. Net position is classified under the following three components: 1) invested in capital assets, net of related debt; 2) restricted for capital activity and debt service; and 3) unrestricted net assets.
Invested in capital assets, net of related debt, consists of all capital assets, net of accumulated depreciation and reduced by outstanding debt that is attributable to the acquisition, construction and improvement of those assets; debt related to unspent proceeds of other restricted cash and investments is excluded from the determination.
Restricted for debt service consists of net assets for which constraints are placed thereon by external parties, such as lenders, grantors, contributors, laws, regulations and enabling legislation, including self-imposed legal mandates, less any related liabilities.
Unrestricted net assets consists of all other net assets not included in the above categories.
The total net position as of June 30, 2014 was $37,145,976 representing a $982,140 increase from the prior year. Fiscal year 2013 had a decrease in total net assets from fiscal year 2012 of $669,522.
Year Ended June 30, 2014 2013 2012
Invested in Capital assets, net 27,495,374$ 27,016,214$ 26,621,121$ Restricted for capital activity and debt service 3,377,968 2,885,019 3,419,743 Unrestricted 6,272,634 6,262,603 6,792,494
Total Net Position 37,145,976$ 36,163,836$ 36,833,358$
Change in Net Position
Of the total net assets, $4,878,765 million are current non-restricted assets available to support short-term operations (see Table A-1, page 27). This current asset balance is $33,168 higher than on June 30, 2013.
28
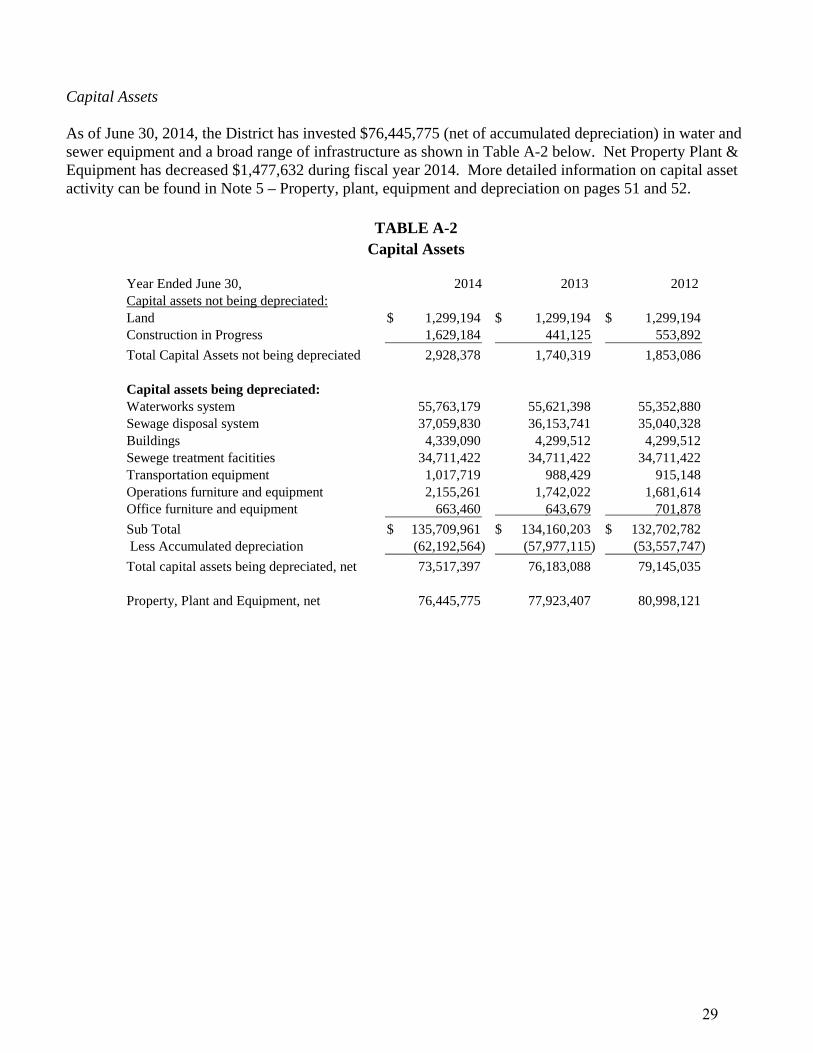
Capital Assets
As of June 30, 2014, the District has invested $76,445,775 (net of accumulated depreciation) in water and sewer equipment and a broad range of infrastructure as shown in Table A-2 below. Net Property Plant & Equipment has decreased $1,477,632 during fiscal year 2014. More detailed information on capital asset activity can be found in Note 5 – Property, plant, equipment and depreciation on pages 51 and 52.
TABLE A-2 Capital Assets
Year Ended June 30, 2014 2013 2012 Capital assets not being depreciated:Land 1,299,194$ 1,299,194$ 1,299,194$ Construction in Progress 1,629,184 441,125 553,892
Total Capital Assets not being depreciated 2,928,378 1,740,319 1,853,086
Capital assets being depreciated:Waterworks system 55,763,179 55,621,398 55,352,880 Sewage disposal system 37,059,830 36,153,741 35,040,328 Buildings 4,339,090 4,299,512 4,299,512 Sewege treatment facitities 34,711,422 34,711,422 34,711,422 Transportation equipment 1,017,719 988,429 915,148 Operations furniture and equipment 2,155,261 1,742,022 1,681,614 Office furniture and equipment 663,460 643,679 701,878
Sub Total 135,709,961$ 134,160,203$ 132,702,782$ Less Accumulated depreciation (62,192,564) (57,977,115) (53,557,747)
Total capital assets being depreciated, net 73,517,397 76,183,088 79,145,035
Property, Plant and Equipment, net 76,445,775 77,923,407 80,998,121
29
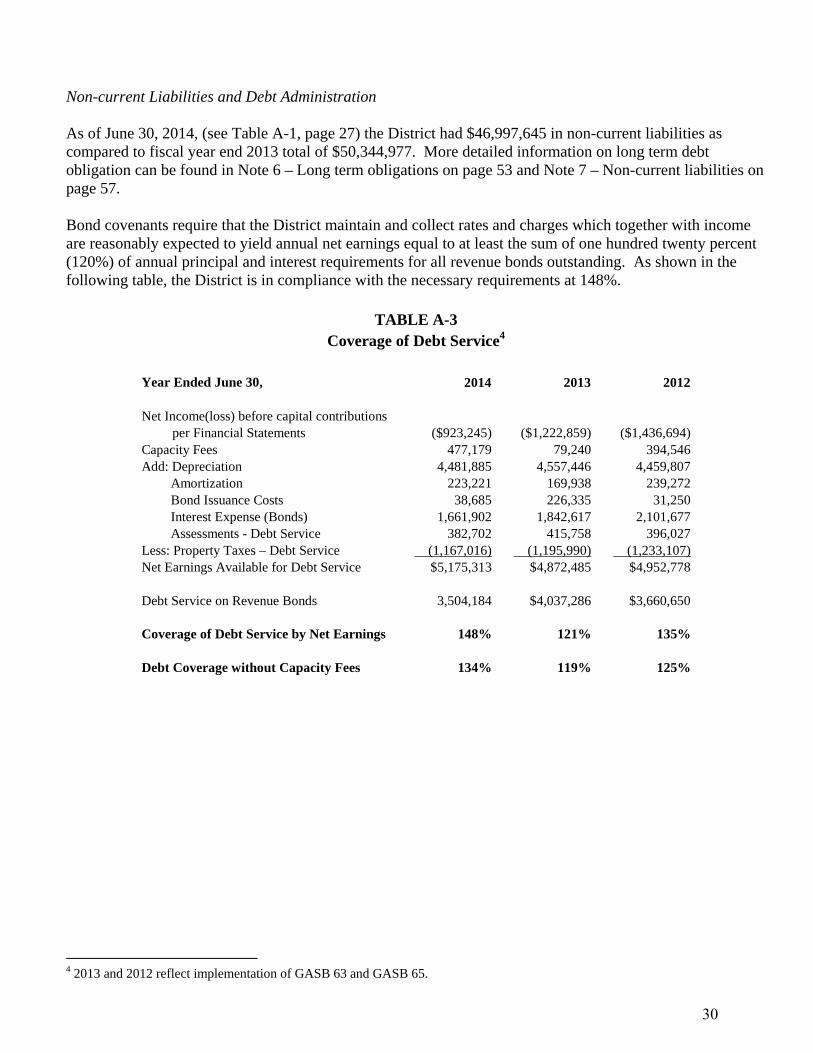
Non-current Liabilities and Debt Administration
As of June 30, 2014, (see Table A-1, page 27) the District had $46,997,645 in non-current liabilities as compared to fiscal year end 2013 total of $50,344,977. More detailed information on long term debt obligation can be found in Note 6 – Long term obligations on page 53 and Note 7 – Non-current liabilities on page 57. Bond covenants require that the District maintain and collect rates and charges which together with income are reasonably expected to yield annual net earnings equal to at least the sum of one hundred twenty percent (120%) of annual principal and interest requirements for all revenue bonds outstanding. As shown in the following table, the District is in compliance with the necessary requirements at 148%.
TABLE A-3 Coverage of Debt Service4
Year Ended June 30, 2014 2013 2012
Net Income(loss) before capital contributions per Financial Statements ($923,245) ($1,222,859) ($1,436,694)Capacity Fees 477,179 79,240 394,546 Add: Depreciation 4,481,885 4,557,446 4,459,807
Amortization 223,221 169,938 239,272 Bond Issuance Costs 38,685 226,335 31,250 Interest Expense (Bonds) 1,661,902 1,842,617 2,101,677 Assessments - Debt Service 382,702 415,758 396,027
Less: Property Taxes – Debt Service (1,167,016) (1,195,990) (1,233,107)Net Earnings Available for Debt Service $5,175,313 $4,872,485 $4,952,778
Debt Service on Revenue Bonds 3,504,184 $4,037,286 $3,660,650
Coverage of Debt Service by Net Earnings 148% 121% 135%
Debt Coverage without Capacity Fees 134% 119% 125%
4 2013 and 2012 reflect implementation of GASB 63 and GASB 65.
30
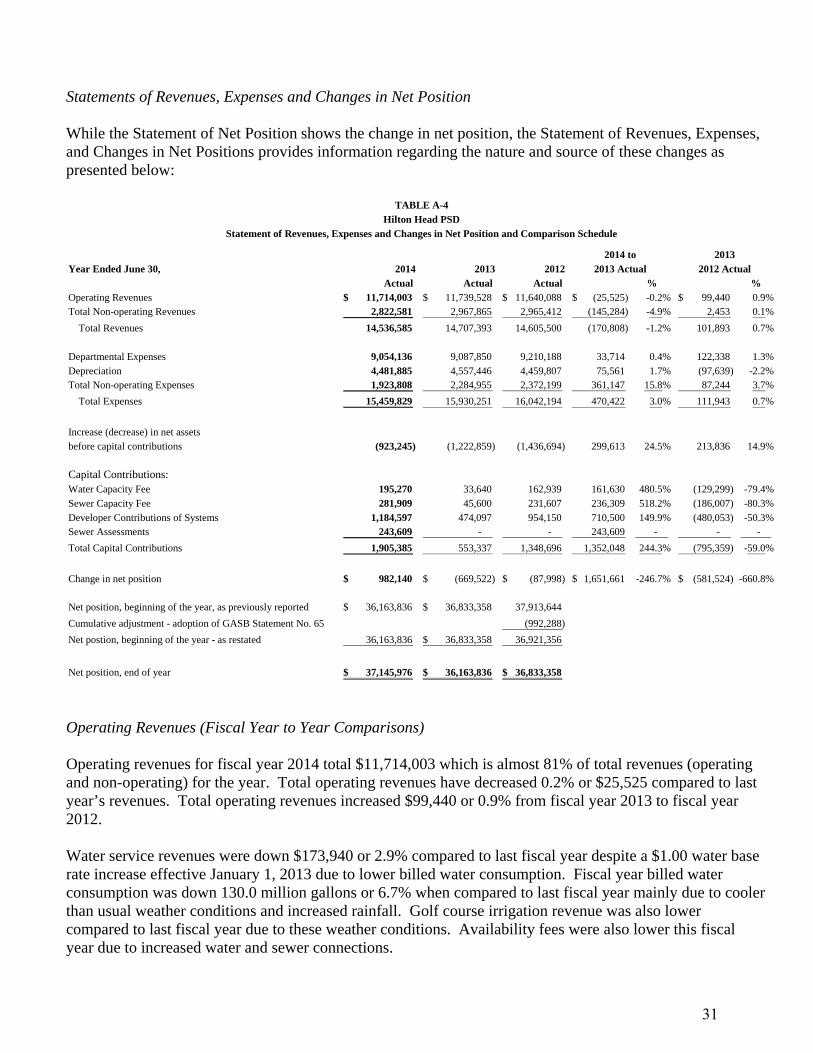
Statements of Revenues, Expenses and Changes in Net Position While the Statement of Net Position shows the change in net position, the Statement of Revenues, Expenses, and Changes in Net Positions provides information regarding the nature and source of these changes as presented below:
Year Ended June 30, 2014 2013 2012Actual Actual Actual % %
Operating Revenues 11,714,003$ 11,739,528$ 11,640,088$ (25,525)$ -0.2% 99,440$ 0.9%Total Non-operating Revenues 2,822,581 2,967,865 2,965,412 (145,284) -4.9% 2,453 0.1%
Total Revenues 14,536,585 14,707,393 14,605,500 (170,808) -1.2% 101,893 0.7%
Departmental Expenses 9,054,136 9,087,850 9,210,188 33,714 0.4% 122,338 1.3%Depreciation 4,481,885 4,557,446 4,459,807 75,561 1.7% (97,639) -2.2%Total Non-operating Expenses 1,923,808 2,284,955 2,372,199 361,147 15.8% 87,244 3.7%
Total Expenses 15,459,829 15,930,251 16,042,194 470,422 3.0% 111,943 0.7%
Increase (decrease) in net assetsbefore capital contributions (923,245) (1,222,859) (1,436,694) 299,613 24.5% 213,836 14.9%
Capital Contributions:Water Capacity Fee 195,270 33,640 162,939 161,630 480.5% (129,299) -79.4%Sewer Capacity Fee 281,909 45,600 231,607 236,309 518.2% (186,007) -80.3%Developer Contributions of Systems 1,184,597 474,097 954,150 710,500 149.9% (480,053) -50.3%Sewer Assessments 243,609 - - 243,609 - - -
Total Capital Contributions 1,905,385 553,337 1,348,696 1,352,048 244.3% (795,359) -59.0%
Change in net position 982,140$ (669,522)$ (87,998)$ 1,651,661$ -246.7% (581,524)$ -660.8%
Net position, beginning of the year, as previously reported 36,163,836$ 36,833,358$ 37,913,644
Cumulative adjustment - adoption of GASB Statement No. 65 (992,288)
Net postion, beginning of the year - as restated 36,163,836 36,833,358$ 36,921,356
Net position, end of year 37,145,976$ 36,163,836$ 36,833,358$
2014 to 2013
TABLE A-4Hilton Head PSD
Statement of Revenues, Expenses and Changes in Net Position and Comparison Schedule
2013 Actual 2012 Actual
Operating Revenues (Fiscal Year to Year Comparisons)
Operating revenues for fiscal year 2014 total $11,714,003 which is almost 81% of total revenues (operating and non-operating) for the year. Total operating revenues have decreased 0.2% or $25,525 compared to last year’s revenues. Total operating revenues increased $99,440 or 0.9% from fiscal year 2013 to fiscal year 2012. Water service revenues were down $173,940 or 2.9% compared to last fiscal year despite a $1.00 water base rate increase effective January 1, 2013 due to lower billed water consumption. Fiscal year billed water consumption was down 130.0 million gallons or 6.7% when compared to last fiscal year mainly due to cooler than usual weather conditions and increased rainfall. Golf course irrigation revenue was also lower compared to last fiscal year due to these weather conditions. Availability fees were also lower this fiscal year due to increased water and sewer connections.
31
Despite lower water consumption, sewer revenues were up due to a rate increase which was effective as of January 1, 2013.5 In addition to higher sewer service revenues, other line items that have increased include the following (see Table A-5, page 34):
Water Tap in fees increased $62,912 or 102% due to increased tap ins.
Sewer Connection Fees increased $8,030 or 7.3% due to increased sewer connections.
Service Fees increased by $7,529 or 21% due to an increased effort to collect on delinquent account.
Total non-operating revenues were equal to $2,822,581. The non-operating revenues received by the District were derived primarily from ad valorem property taxes, interest earnings, and tower leases. The District imposed an ad valorem tax of 3.00 mills for operational purposes and 3.52 mills for debt service. The Commission has the authority to set the rates charged for water and sewer services without approval of any other authority, although such rate-setting ability is subject to certain procedural requirements including the holding of public hearings and the posting of public notices. Departmental Expenses (Fiscal Year to Year Comparisons)
Total departmental expenses have decreased $33,714 or 0.4% compared to fiscal year 2013 (See Table A-5, page 34). For fiscal year 2013, departmental expenses increased $122,338 or 1.3% from fiscal year 2012. The following departmental expense items were decreased when compared to the same period last year.
Operations expenses have decreased $19,125 or 1.1% due to lower bio-solids disposal costs, operations chemical costs and fuel/power costs associated with lower water consumption.
Purchased water expense decreased by $194,812 or 24%. For fiscal year 2014 there has been decreased customer water consumption, increased RO Plant production and increased ASR-1 withdrawal. Although well production was down 151.8 million gallons for fiscal year 2014, the RO plant increased production by 91.5 million gallons and ASR-1 withdrawal increased by 80.5 million gallons. The aggregate net increase from these 3 sources for fiscal year 2014 is 20.2 million gallons when compared to the same period last fiscal year.
Despite higher RO plant production for fiscal year 2014, RO Plant expenses decreased $74,627 or
12%. The District has been able to reduce the amount of anti-scaling chemical that it uses which has reduced costs.
Professional Fees decreased by $28,604 or 11%.
Vehicle expenses decreased $615 or 0.5%.
The above decreased expenses were offset by the following increases for expense line items.
5 Residential sewer service customers billed consumption is capped at 10,000 gallons per month. Therefore sewer service revenues are not necessarily as adversely affected by lower water consumption compared to water service revenues.
32
Payroll and Related expenses increased $97,221 or 2.8% due to higher personal leave accrual and salaries.
Maintenance expenses increased by $87,189 or 8.4% due to increased meter, plant, SCADA, well and water/sewer system maintenance.
Water tap in expenses increased by $21,829 or 57% due to increased water tap ins. Note that
these expenses are offset by higher tap in fees revenues.
Sewer Connection expense has increased $1,257 or 1.5%. These expenses are also offset by higher sewer connection fee revenues.
ASR-1 water expense relates to water that has been drawn out of the ASR well for customer use. As stated previously ASR-1 withdrawal increased by 80.5 million gallons. As such, ASR water withdrawal expense increased $60,777 or 45%. ASR-1 O&M which relates to power and chemical costs increased by $9,880 or 32%.
33
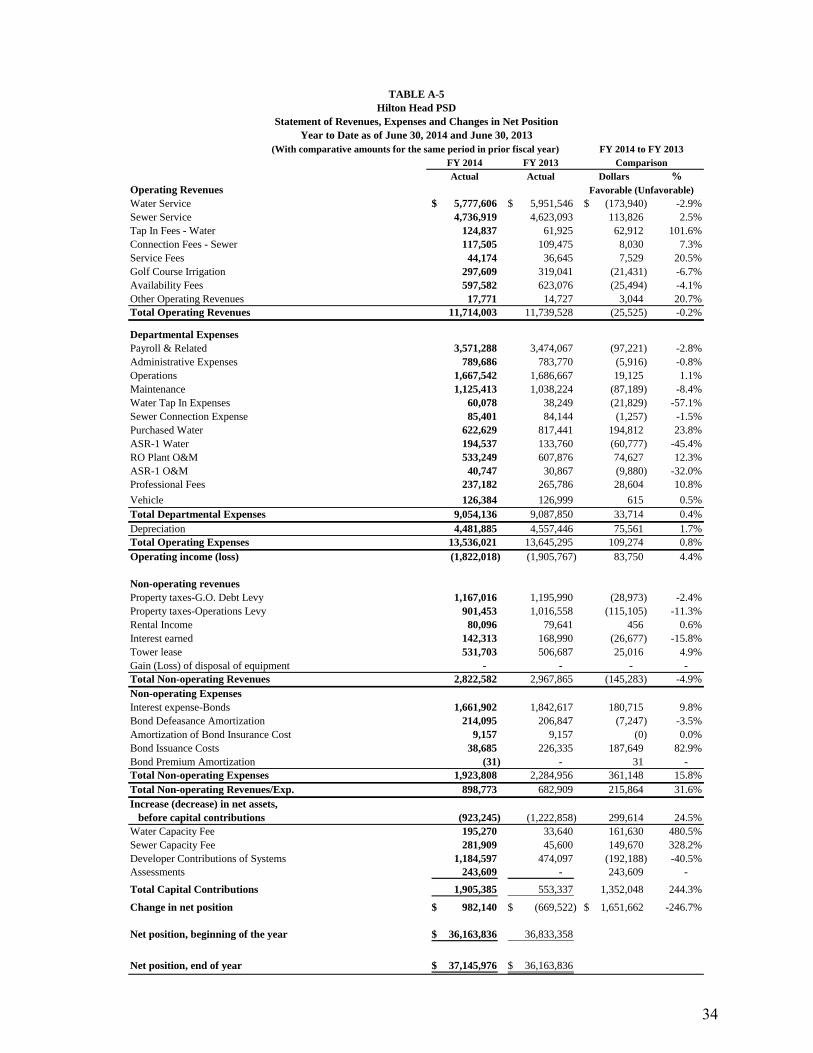
FY 2013Actual Actual Dollars %
Operating RevenuesWater Service 5,777,606$ 5,951,546$ (173,940)$ -2.9%Sewer Service 4,736,919 4,623,093 113,826 2.5%Tap In Fees - Water 124,837 61,925 62,912 101.6%Connection Fees - Sewer 117,505 109,475 8,030 7.3%Service Fees 44,174 36,645 7,529 20.5%Golf Course Irrigation 297,609 319,041 (21,431) -6.7%Availability Fees 597,582 623,076 (25,494) -4.1%Other Operating Revenues 17,771 14,727 3,044 20.7%Total Operating Revenues 11,714,003 11,739,528 (25,525) -0.2%
Departmental ExpensesPayroll & Related 3,571,288 3,474,067 (97,221) -2.8%Administrative Expenses 789,686 783,770 (5,916) -0.8%Operations 1,667,542 1,686,667 19,125 1.1%Maintenance 1,125,413 1,038,224 (87,189) -8.4%Water Tap In Expenses 60,078 38,249 (21,829) -57.1%Sewer Connection Expense 85,401 84,144 (1,257) -1.5%Purchased Water 622,629 817,441 194,812 23.8%ASR-1 Water 194,537 133,760 (60,777) -45.4%RO Plant O&M 533,249 607,876 74,627 12.3%ASR-1 O&M 40,747 30,867 (9,880) -32.0%Professional Fees 237,182 265,786 28,604 10.8%
Vehicle 126,384 126,999 615 0.5%Total Departmental Expenses 9,054,136 9,087,850 33,714 0.4%Depreciation 4,481,885 4,557,446 75,561 1.7%Total Operating Expenses 13,536,021 13,645,295 109,274 0.8%Operating income (loss) (1,822,018) (1,905,767) 83,750 4.4%
Non-operating revenuesProperty taxes-G.O. Debt Levy 1,167,016 1,195,990 (28,973) -2.4%Property taxes-Operations Levy 901,453 1,016,558 (115,105) -11.3%Rental Income 80,096 79,641 456 0.6%Interest earned 142,313 168,990 (26,677) -15.8%Tower lease 531,703 506,687 25,016 4.9%Gain (Loss) of disposal of equipment - - - - Total Non-operating Revenues 2,822,582 2,967,865 (145,283) -4.9%Non-operating ExpensesInterest expense-Bonds 1,661,902 1,842,617 180,715 9.8%Bond Defeasance Amortization 214,095 206,847 (7,247) -3.5%Amortization of Bond Insurance Cost 9,157 9,157 (0) 0.0%Bond Issuance Costs 38,685 226,335 187,649 82.9%Bond Premium Amortization (31) - 31 - Total Non-operating Expenses 1,923,808 2,284,956 361,148 15.8%Total Non-operating Revenues/Exp. 898,773 682,909 215,864 31.6%Increase (decrease) in net assets, before capital contributions (923,245) (1,222,858) 299,614 24.5%Water Capacity Fee 195,270 33,640 161,630 480.5%Sewer Capacity Fee 281,909 45,600 149,670 328.2%Developer Contributions of Systems 1,184,597 474,097 (192,188) -40.5%Assessments 243,609 - 243,609 -
Total Capital Contributions 1,905,385 553,337 1,352,048 244.3%
Change in net position 982,140$ (669,522)$ 1,651,662$ -246.7%
Net position, beginning of the year 36,163,836$ 36,833,358
Net position, end of year 37,145,976$ 36,163,836$
FY 2014 Comparison
Favorable (Unfavorable)
TABLE A-5Hilton Head PSD
Statement of Revenues, Expenses and Changes in Net PositionYear to Date as of June 30, 2014 and June 30, 2013
(With comparative amounts for the same period in prior fiscal year) FY 2014 to FY 2013
34
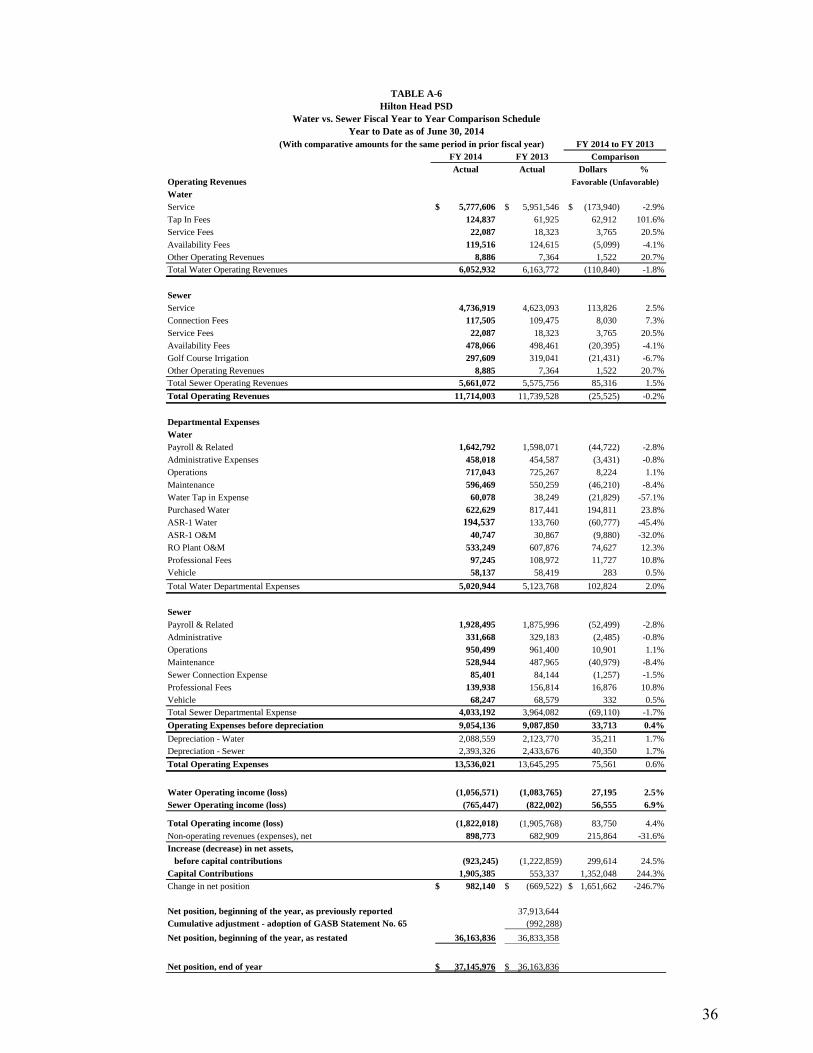
Water and Sewer Revenues/Expenses: Fiscal Year 2014 vs. Fiscal Year 2013. (Please reference Table A-6, page 36) Water Revenues and Related Expenses:
For FY’14, total water operating revenues have decreased $110,840 or 1.8% compared to FY’13 due to the previously mentioned lower customer water consumption.
Water departmental expenses decreased $102,824 or 2.0%. Departmental expense decreases are
explained in more detail on pages 32 and 33.
Water operating loss for fiscal year 2014 is $1,056,571 compared to the fiscal year 2013 loss of $1,083,765. An improvement of $27,195 or 2.5%.
Sewer Revenues and Related Expenses:
Total sewer and related operating revenues have increased $85,316 or 1.5% mainly due the previously discussed sewer rate increase which was put into effect January 1, 2013 and customer growth.
Sewer departmental expenses increased $69,110 or 1.7%. Departmental expenses are explained
in more detail on page 32 and 33. Sewer operating loss for fiscal year 2014 is $765,447 compared to the fiscal year 2013 loss of
$822,002, an improvement of $56,565 or 6.9%.
35
FY 2014 FY 2013
Actual Actual Dollars %Operating RevenuesWater
Service 5,777,606$ 5,951,546$ (173,940)$ -2.9%Tap In Fees 124,837 61,925 62,912 101.6%Service Fees 22,087 18,323 3,765 20.5%
Availability Fees 119,516 124,615 (5,099) -4.1%Other Operating Revenues 8,886 7,364 1,522 20.7%Total Water Operating Revenues 6,052,932 6,163,772 (110,840) -1.8%
Sewer
Service 4,736,919 4,623,093 113,826 2.5%Connection Fees 117,505 109,475 8,030 7.3%
Service Fees 22,087 18,323 3,765 20.5%Availability Fees 478,066 498,461 (20,395) -4.1%Golf Course Irrigation 297,609 319,041 (21,431) -6.7%Other Operating Revenues 8,885 7,364 1,522 20.7%Total Sewer Operating Revenues 5,661,072 5,575,756 85,316 1.5%
Total Operating Revenues 11,714,003 11,739,528 (25,525) -0.2%
Departmental ExpensesWater
Payroll & Related 1,642,792 1,598,071 (44,722) -2.8%Administrative Expenses 458,018 454,587 (3,431) -0.8%Operations 717,043 725,267 8,224 1.1%
Maintenance 596,469 550,259 (46,210) -8.4%Water Tap in Expense 60,078 38,249 (21,829) -57.1%Purchased Water 622,629 817,441 194,811 23.8%ASR-1 Water 194,537 133,760 (60,777) -45.4%
ASR-1 O&M 40,747 30,867 (9,880) -32.0%RO Plant O&M 533,249 607,876 74,627 12.3%Professional Fees 97,245 108,972 11,727 10.8%Vehicle 58,137 58,419 283 0.5%
Total Water Departmental Expenses 5,020,944 5,123,768 102,824 2.0%
Sewer
Payroll & Related 1,928,495 1,875,996 (52,499) -2.8%Administrative 331,668 329,183 (2,485) -0.8%Operations 950,499 961,400 10,901 1.1%Maintenance 528,944 487,965 (40,979) -8.4%
Sewer Connection Expense 85,401 84,144 (1,257) -1.5%Professional Fees 139,938 156,814 16,876 10.8%Vehicle 68,247 68,579 332 0.5%Total Sewer Departmental Expense 4,033,192 3,964,082 (69,110) -1.7%
Operating Expenses before depreciation 9,054,136 9,087,850 33,713 0.4%
Depreciation - Water 2,088,559 2,123,770 35,211 1.7%Depreciation - Sewer 2,393,326 2,433,676 40,350 1.7%
Total Operating Expenses 13,536,021 13,645,295 75,561 0.6%
Water Operating income (loss) (1,056,571) (1,083,765) 27,195 2.5%Sewer Operating income (loss) (765,447) (822,002) 56,555 6.9%
Total Operating income (loss) (1,822,018) (1,905,768) 83,750 4.4%Non-operating revenues (expenses), net 898,773 682,909 215,864 -31.6%Increase (decrease) in net assets, before capital contributions (923,245) (1,222,859) 299,614 24.5%Capital Contributions 1,905,385 553,337 1,352,048 244.3%Change in net position 982,140$ (669,522)$ 1,651,662$ -246.7%
Net position, beginning of the year, as previously reported 37,913,644 Cumulative adjustment - adoption of GASB Statement No. 65 (992,288)
Net position, beginning of the year, as restated 36,163,836 36,833,358
Net position, end of year 37,145,976$ 36,163,836$
Comparison
Favorable (Unfavorable)
TABLE A-6Hilton Head PSD
Water vs. Sewer Fiscal Year to Year Comparison ScheduleYear to Date as of June 30, 2014
(With comparative amounts for the same period in prior fiscal year) FY 2014 to FY 2013
36
CONTACTING THE DISTRICT’S FINANCE MANAGER This financial report is designed to provide our citizens, customers and creditors with a general overview of the District’s finances and to demonstrate the District’s accountability for the money it receives. If you have questions about this report or need additional financial information, contact the District’s Finance Manager, P.O. Box 21264, Hilton Head Island, SC 29925. The District’s website can be found at www.hhpsd.com.
37
AUDITED FINANCIAL STATEMENTS
For Fiscal Years Ended June 30, 2014 and June 30, 2013
38
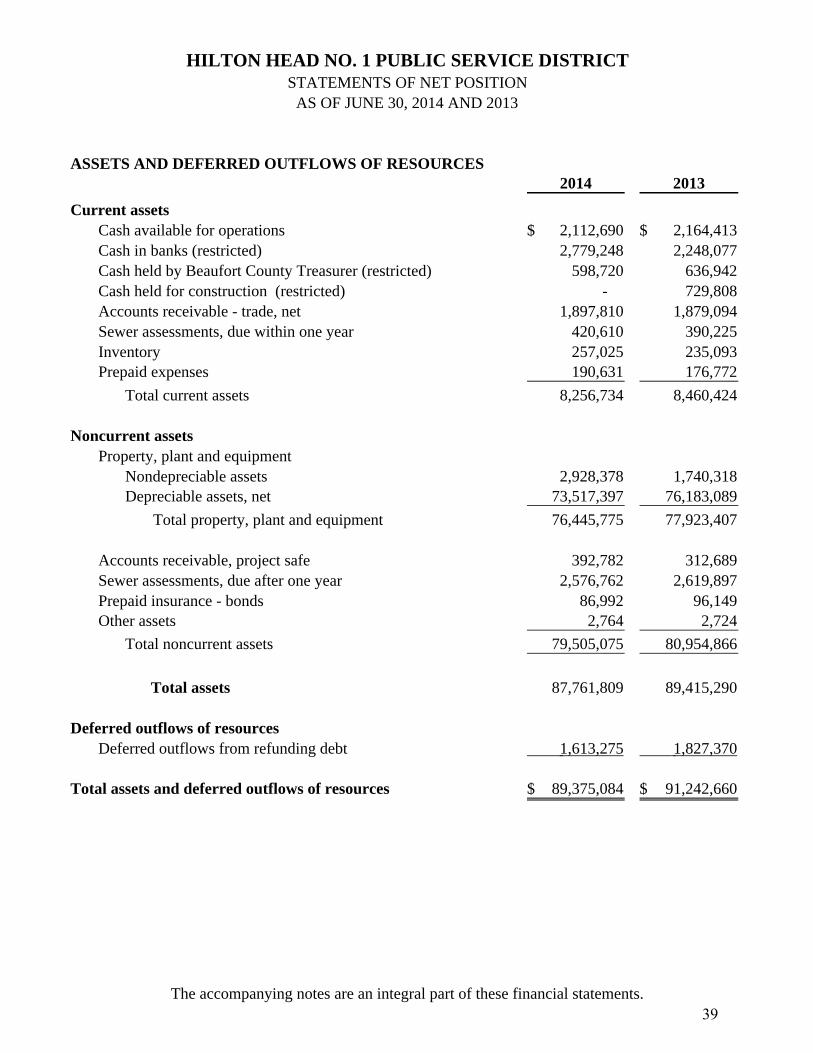
ASSETS AND DEFERRED OUTFLOWS OF RESOURCES2014 2013
Current assetsCash available for operations 2,112,690$ 2,164,413$ Cash in banks (restricted) 2,779,248 2,248,077 Cash held by Beaufort County Treasurer (restricted) 598,720 636,942 Cash held for construction (restricted) - 729,808Accounts receivable - trade, net 1,897,810 1,879,094 Sewer assessments, due within one year 420,610 390,225 Inventory 257,025 235,093 Prepaid expenses 190,631 176,772
Total current assets 8,256,734 8,460,424
Noncurrent assetsProperty, plant and equipment
Nondepreciable assets 2,928,378 1,740,318Depreciable assets, net 73,517,397 76,183,089
Total property, plant and equipment 76,445,775 77,923,407
Accounts receivable, project safe 392,782 312,689Sewer assessments, due after one year 2,576,762 2,619,897 Prepaid insurance - bonds 86,992 96,149 Other assets 2,764 2,724
Total noncurrent assets 79,505,075 80,954,866
Total assets 87,761,809 89,415,290
Deferred outflows of resourcesDeferred outflows from refunding debt 1,613,275 1,827,370
Total assets and deferred outflows of resources 89,375,084$ 91,242,660$
HILTON HEAD NO. 1 PUBLIC SERVICE DISTRICTSTATEMENTS OF NET POSITION
AS OF JUNE 30, 2014 AND 2013
The accompanying notes are an integral part of these financial statements.39
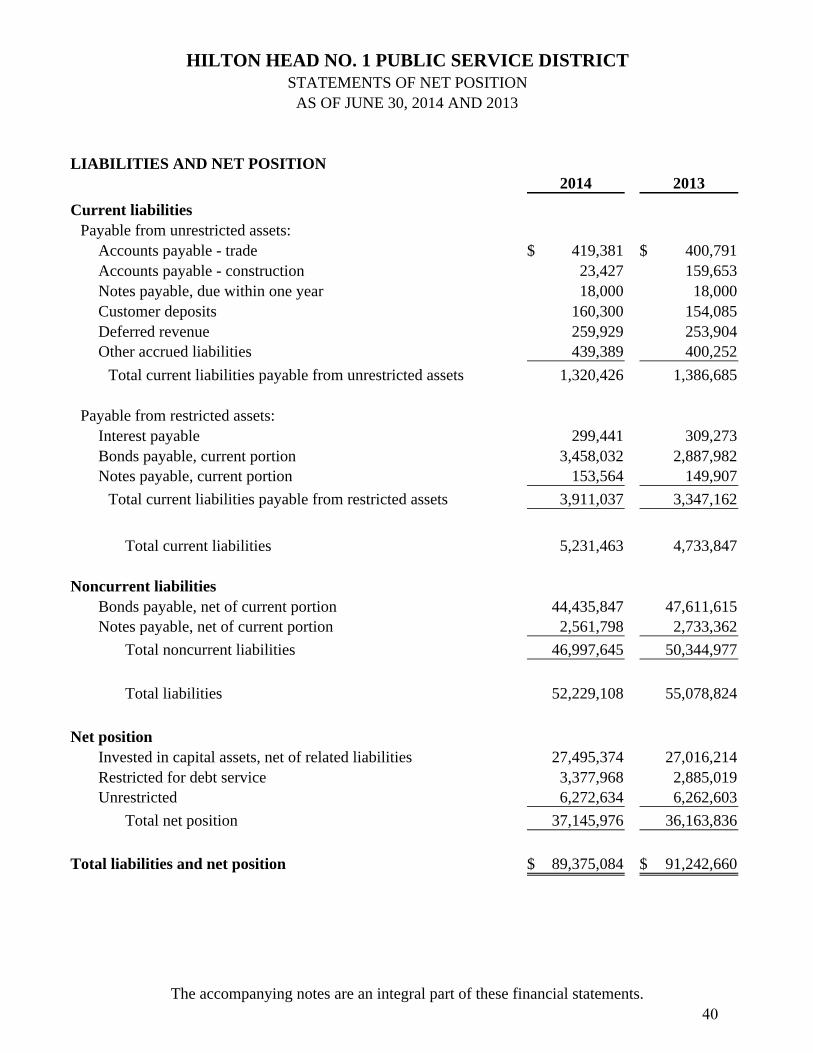
LIABILITIES AND NET POSITION2014 2013
Current liabilitiesPayable from unrestricted assets:
Accounts payable - trade 419,381$ 400,791$ Accounts payable - construction 23,427 159,653 Notes payable, due within one year 18,000 18,000 Customer deposits 160,300 154,085 Deferred revenue 259,929 253,904 Other accrued liabilities 439,389 400,252
Total current liabilities payable from unrestricted assets 1,320,426 1,386,685
Payable from restricted assets:Interest payable 299,441 309,273 Bonds payable, current portion 3,458,032 2,887,982 Notes payable, current portion 153,564 149,907
Total current liabilities payable from restricted assets 3,911,037 3,347,162
Total current liabilities 5,231,463 4,733,847
Noncurrent liabilitiesBonds payable, net of current portion 44,435,847 47,611,615Notes payable, net of current portion 2,561,798 2,733,362
Total noncurrent liabilities 46,997,645 50,344,977
Total liabilities 52,229,108 55,078,824
Net positionInvested in capital assets, net of related liabilities 27,495,374 27,016,214 Restricted for debt service 3,377,968 2,885,019 Unrestricted 6,272,634 6,262,603
Total net position 37,145,976 36,163,836
Total liabilities and net position 89,375,084$ 91,242,660$
HILTON HEAD NO. 1 PUBLIC SERVICE DISTRICTSTATEMENTS OF NET POSITION
AS OF JUNE 30, 2014 AND 2013
The accompanying notes are an integral part of these financial statements.40
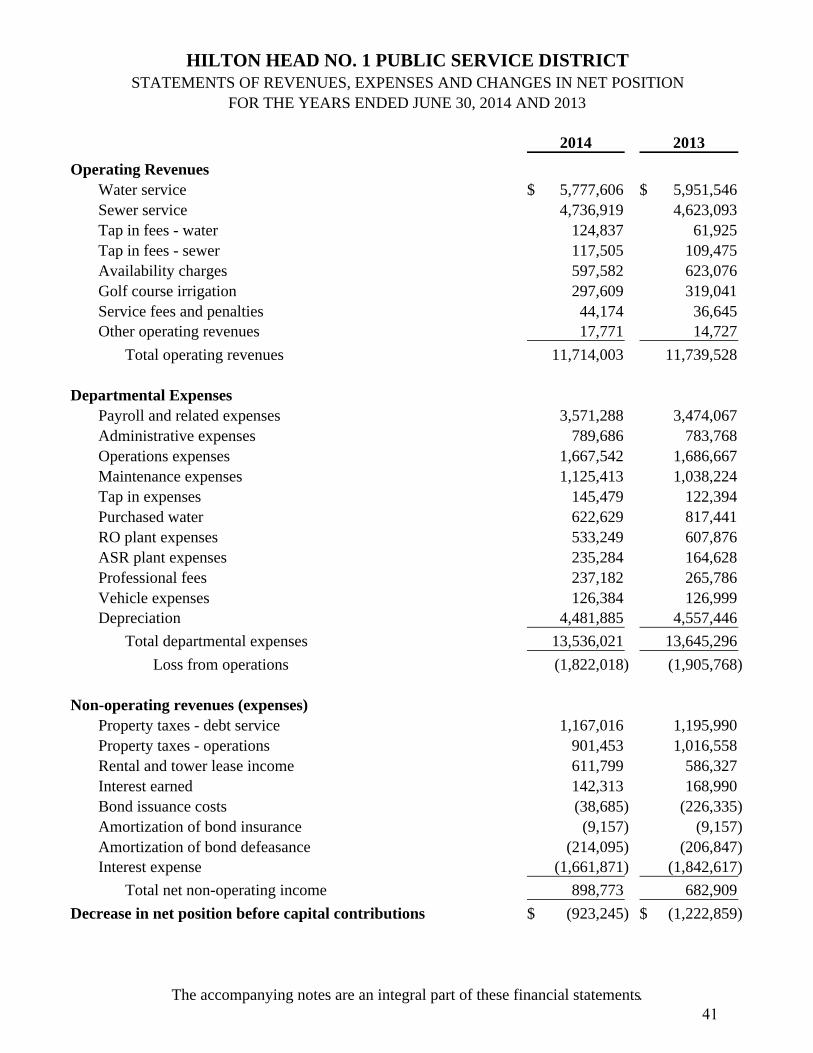
2014 2013
Operating RevenuesWater service 5,777,606$ 5,951,546$ Sewer service 4,736,919 4,623,093 Tap in fees - water 124,837 61,925 Tap in fees - sewer 117,505 109,475 Availability charges 597,582 623,076 Golf course irrigation 297,609 319,041 Service fees and penalties 44,174 36,645Other operating revenues 17,771 14,727
Total operating revenues 11,714,003 11,739,528
Departmental ExpensesPayroll and related expenses 3,571,288 3,474,067 Administrative expenses 789,686 783,768 Operations expenses 1,667,542 1,686,667 Maintenance expenses 1,125,413 1,038,224 Tap in expenses 145,479 122,394 Purchased water 622,629 817,441 RO plant expenses 533,249 607,876 ASR plant expenses 235,284 164,628 Professional fees 237,182 265,786 Vehicle expenses 126,384 126,999 Depreciation 4,481,885 4,557,446
Total departmental expenses 13,536,021 13,645,296
Loss from operations (1,822,018) (1,905,768)
Non-operating revenues (expenses)Property taxes - debt service 1,167,016 1,195,990 Property taxes - operations 901,453 1,016,558 Rental and tower lease income 611,799 586,327Interest earned 142,313 168,990 Bond issuance costs (38,685) (226,335) Amortization of bond insurance (9,157) (9,157) Amortization of bond defeasance (214,095) (206,847) Interest expense (1,661,871) (1,842,617)
Total net non-operating income 898,773 682,909
Decrease in net position before capital contributions (923,245)$ (1,222,859)$
HILTON HEAD NO. 1 PUBLIC SERVICE DISTRICTSTATEMENTS OF REVENUES, EXPENSES AND CHANGES IN NET POSITION
FOR THE YEARS ENDED JUNE 30, 2014 AND 2013
The accompanying notes are an integral part of these financial statements.41
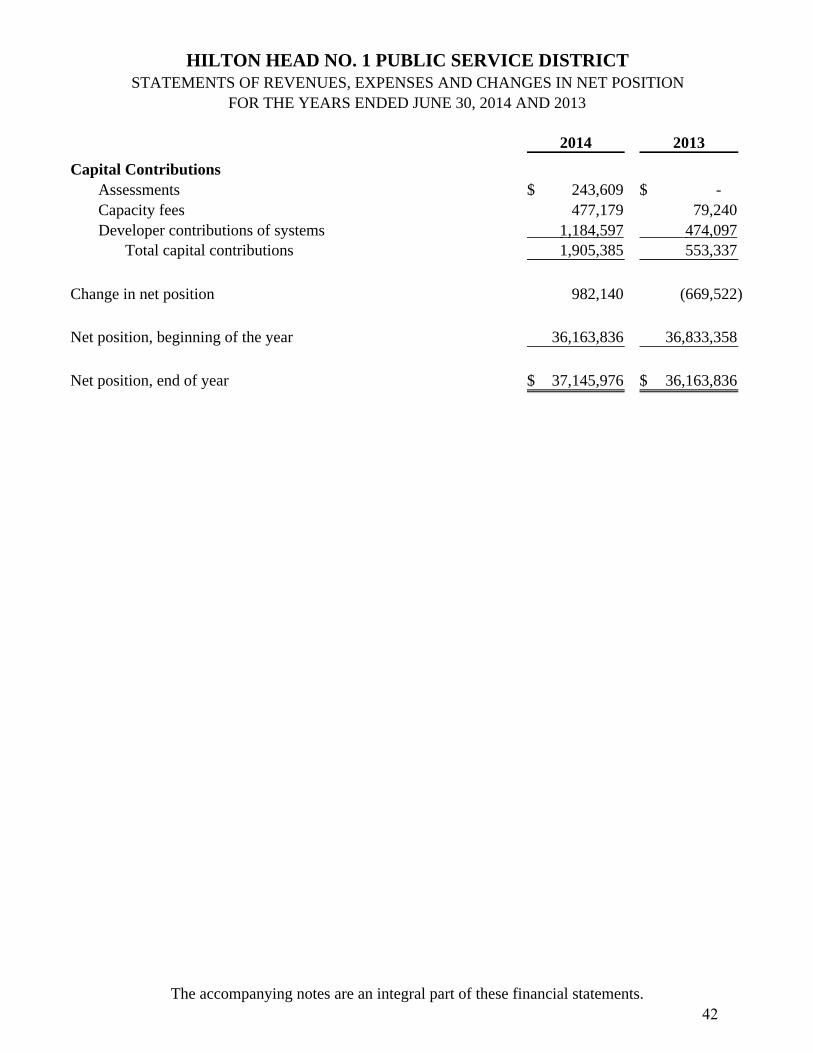
2014 2013
Capital ContributionsAssessments 243,609$ -$ Capacity fees 477,179 79,240 Developer contributions of systems 1,184,597 474,097
Total capital contributions 1,905,385 553,337
Change in net position 982,140 (669,522)
Net position, beginning of the year 36,163,836 36,833,358
Net position, end of year 37,145,976$ 36,163,836$
HILTON HEAD NO. 1 PUBLIC SERVICE DISTRICTSTATEMENTS OF REVENUES, EXPENSES AND CHANGES IN NET POSITION
FOR THE YEARS ENDED JUNE 30, 2014 AND 2013
The accompanying notes are an integral part of these financial statements.42
2014 2013
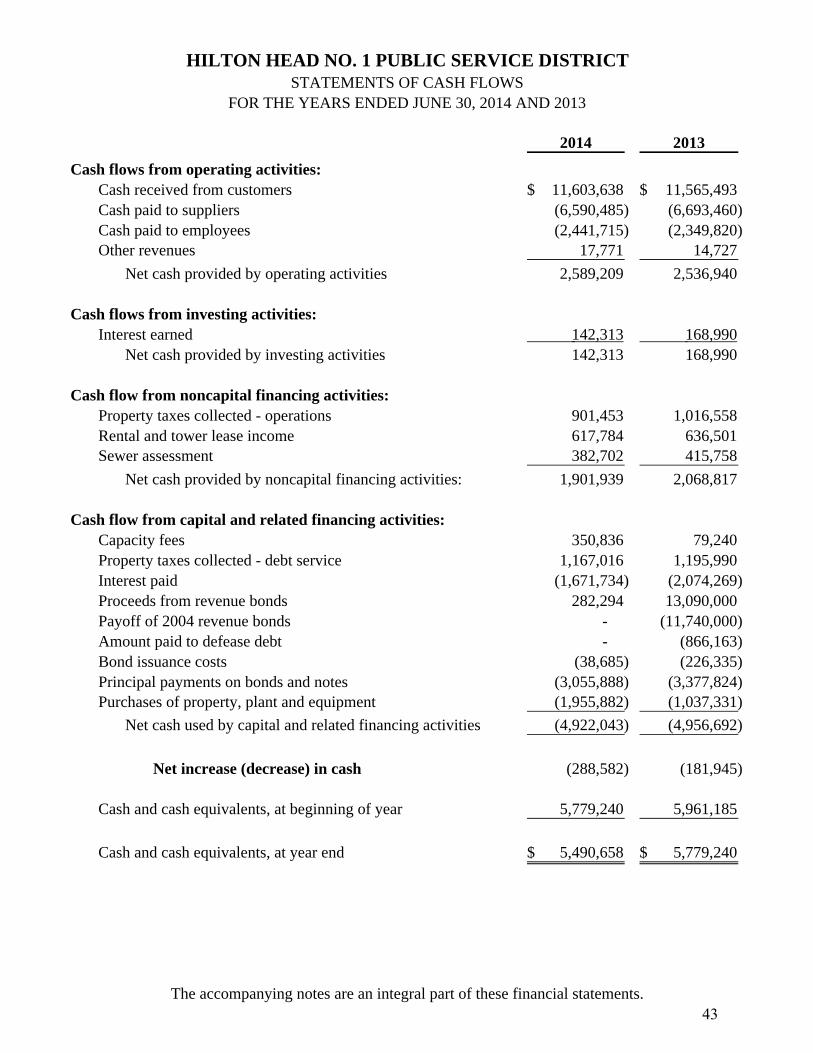
Cash flows from operating activities:Cash received from customers 11,603,638$ 11,565,493$ Cash paid to suppliers (6,590,485) (6,693,460) Cash paid to employees (2,441,715) (2,349,820) Other revenues 17,771 14,727
Net cash provided by operating activities 2,589,209 2,536,940
Cash flows from investing activities:Interest earned 142,313 168,990
Net cash provided by investing activities 142,313 168,990
Cash flow from noncapital financing activities:Property taxes collected - operations 901,453 1,016,558 Rental and tower lease income 617,784 636,501 Sewer assessment 382,702 415,758
Net cash provided by noncapital financing activities: 1,901,939 2,068,817
Cash flow from capital and related financing activities:Capacity fees 350,836 79,240 Property taxes collected - debt service 1,167,016 1,195,990 Interest paid (1,671,734) (2,074,269) Proceeds from revenue bonds 282,294 13,090,000 Payoff of 2004 revenue bonds - (11,740,000) Amount paid to defease debt - (866,163) Bond issuance costs (38,685) (226,335) Principal payments on bonds and notes (3,055,888) (3,377,824) Purchases of property, plant and equipment (1,955,882) (1,037,331)
Net cash used by capital and related financing activities (4,922,043) (4,956,692)
Net increase (decrease) in cash (288,582) (181,945)
Cash and cash equivalents, at beginning of year 5,779,240 5,961,185
Cash and cash equivalents, at year end 5,490,658$ 5,779,240$
HILTON HEAD NO. 1 PUBLIC SERVICE DISTRICTSTATEMENTS OF CASH FLOWS
FOR THE YEARS ENDED JUNE 30, 2014 AND 2013
The accompanying notes are an integral part of these financial statements.43
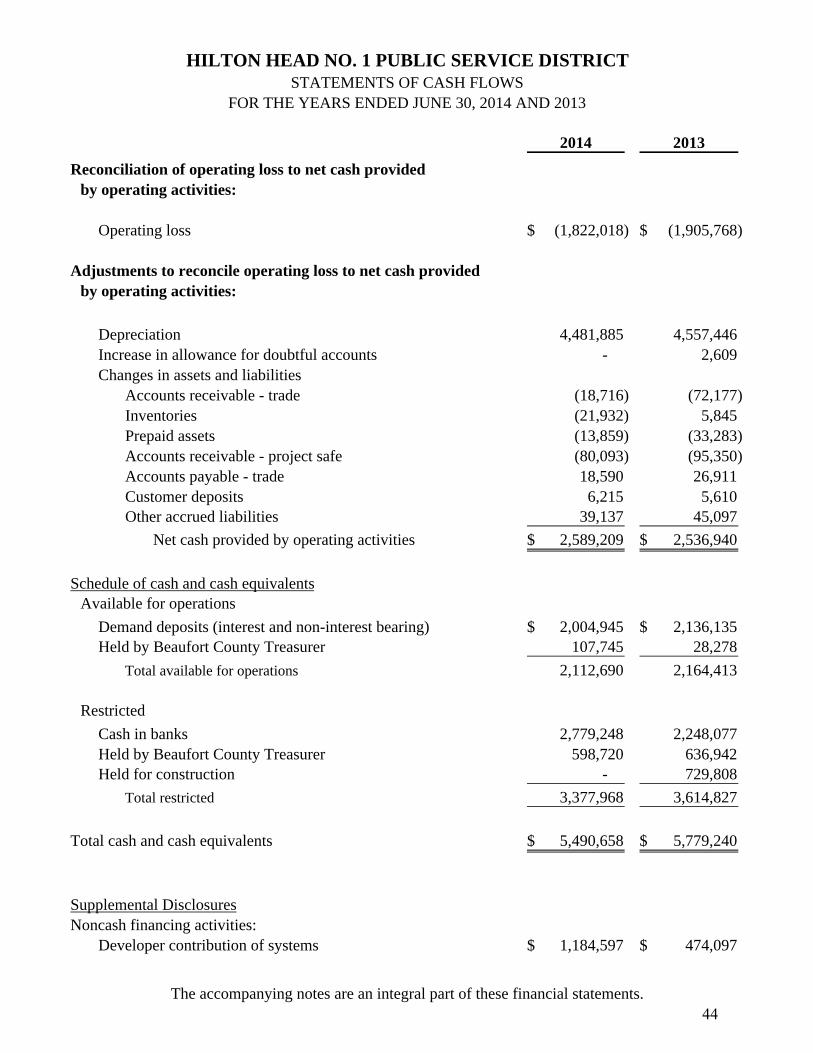
2014 2013
Reconciliation of operating loss to net cash provided by operating activities:
Operating loss (1,822,018)$ (1,905,768)$
Adjustments to reconcile operating loss to net cash providedby operating activities:
Depreciation 4,481,885 4,557,446 Increase in allowance for doubtful accounts - 2,609 Changes in assets and liabilities
Accounts receivable - trade (18,716) (72,177) Inventories (21,932) 5,845 Prepaid assets (13,859) (33,283) Accounts receivable - project safe (80,093) (95,350) Accounts payable - trade 18,590 26,911 Customer deposits 6,215 5,610 Other accrued liabilities 39,137 45,097
Net cash provided by operating activities 2,589,209$ 2,536,940$
Schedule of cash and cash equivalentsAvailable for operations
Demand deposits (interest and non-interest bearing) 2,004,945$ 2,136,135$ Held by Beaufort County Treasurer 107,745 28,278
Total available for operations 2,112,690 2,164,413
Restricted
Cash in banks 2,779,248 2,248,077 Held by Beaufort County Treasurer 598,720 636,942 Held for construction - 729,808
Total restricted 3,377,968 3,614,827
Total cash and cash equivalents 5,490,658$ 5,779,240$
Supplemental DisclosuresNoncash financing activities:
Developer contribution of systems 1,184,597$ 474,097$
HILTON HEAD NO. 1 PUBLIC SERVICE DISTRICTSTATEMENTS OF CASH FLOWS
FOR THE YEARS ENDED JUNE 30, 2014 AND 2013
The accompanying notes are an integral part of these financial statements.44
HILTON HEAD NO. 1 PUBLIC SERVICE DISTRICT
NOTES TO FINANCIAL STATEMENTS JUNE 30, 2014 AND 2013
Note 1 - Summary of significant accounting policies
General The Hilton Head No. 1 Public Service District was established in November of 1969. Its purpose is to provide water and sewer services to the public within designated boundaries.
The financial statements of the District have been prepared in conformity with U.S. generally accepted accounting principles (GAAP) as applicable to governmental units. The Governmental Accounting Standards Board (GASB) is the accepted standard setting body for establishing governmental accounting and financial reporting principles. The more significant of the government's accounting policies are described below:
The District has implemented the provisions of GASB Statement 62, Codification of Accounting and Financial Reporting Guidance Contained in Pre-November 30, 1989 FASB and AICPA Pronouncements and thus applied all applicable GASB pronouncements. These GASB statements require the presentation of Management's Discussion and Analysis which precedes the financial statements, in addition to several changes to the financial statements such as: 1) the classification of the Equity section of the statement of net position into net position with categories of invested in capital assets net of related debt, restricted, and unrestricted; 2) the statement of revenues, expenses and changes in net position formatted to report changes in net position in lieu of changes in retained earnings; and 3) additional note disclosures to the financial statements. In 2013, the District implemented GASB Statement No. 63, Financial Reporting of Deferred Outflows of Resources, Deferred Inflows of Resources, and Net Position and GASB Statement No. 65, Items Previously Reported as Assets and Liabilities. GASB 63 provides guidance for reporting deferred outflows of resources, deferred inflows of resources, and identifies net position as the residual of all other elements presented in a statement of financial position. GASB defines a deferred outflow of resources as a consumption of net assets by a government that is applicable to a future reporting period and a deferred inflow of resources as an acquisition of net assets by a government that is applicable to a future reporting period. Currently, deferred losses on bond refundings are the only financial statement item that meets the definition of a deferred outflow of resources and, accordingly, they have been presented as such in the statements of net position. The District does not have any financial statement items that meet the definition of a deferred inflow of resources. In 2013, the District implemented GASB Statement No. 65 which establishes accounting and financial reporting standards that require reclassification of certain items that, in prior years, were properly reported as assets and liabilities. The District’s only financial statement item that was affected by the implementation of GASB Statement No. 65 was its unamortized bond issuance costs. Under that Statement, all bond issuance costs, excluding those related to prepaid insurance costs, are to be expensed in the period incurred rather than capitalized. Any such unamortized bond issuance costs that were incurred and capitalized in a previous year were written off by a cumulative adjustment to beginning net position in the 2013 financial statements.
45
HILTON HEAD NO. 1 PUBLIC SERVICE DISTRICT
NOTES TO FINANCIAL STATEMENTS JUNE 30, 2014 AND 2013
Note 1 - Summary of significant accounting policies (continued) Fund accounting The accounts of the District are organized on the basis of a proprietary fund type - enterprise fund. The fund is accounted for by a set of self-balancing accounts that comprise its assets, deferred outflows of resources, liabilities, deferred inflows of resources, net position, and revenues and expenses. The fund is established to account for water and sewer operations that are financed and operated in a manner similar to private business enterprises, where the intent is to provide goods and services to the general public on a continuing basis, financed and recovered primarily through user charges. Proprietary funds distinguish operating revenues and expenses from nonoperating items. Operating revenues and expenses generally result from providing services and delivering goods in connection with the District’s principal ongoing operations. The principal operating revenues are charges to customers for sales and services provided to them. The District also recognizes as operating income tap fees, availability fees, and other revenues related to operations. Operating expenses include the costs of sales and services, administrative expenses, and depreciation on capital assets. All revenues and expenses not meeting this definition are reported as nonoperating revenues and expenses. Net position Net position comprises the various net earnings from operating and non-operating revenues, expenses and contributions of capital. Net position is classified in the following three components: invested in capital assets, net of related liabilities; restricted for debt service; and unrestricted.
Invested in capital assets, net of related debt, consists of all capital assets, net of accumulated depreciation and reduced by outstanding debt that is attributable to the acquisition, construction and improvement of those assets; debt related to unspent proceeds of other restricted cash and investments is excluded from the determination. Restricted for debt service consists of net position for which constraints are placed thereon by external parties, such as lenders, grantors, contributors, laws, regulations and enabling legislation, including self-imposed legal mandates, less any related liabilities. Unrestricted consists of all other net position not included in the above categories. When an expense is incurred that can be paid using either restricted or unrestricted resources, the District’s policy is to first apply the expense toward restricted resources and then toward unrestricted resources.
Basis of accounting The accounting and financial reporting treatment applied to a fund is determined by its measurement focus. The proprietary fund type is reported using the economic resources measurement focus and the accrual basis of accounting. Revenues are recognized when earned and expenses are recognized when the related liabilities are incurred. Property taxes and availability charges are recognized when collected by the Beaufort County Treasurer.
46
HILTON HEAD NO. 1 PUBLIC SERVICE DISTRICT
NOTES TO FINANCIAL STATEMENTS JUNE 30, 2014 AND 2013
Note 1 - Summary of significant accounting policies (continued)
Basis of Accounting (continued) Fees and payments due under developer contracts are treated as capital contributions and are recognized in the period received. Tap fees and connection fees are recognized as income in the period the customer connects to the system.
Cash and cash equivalents The District considers both restricted and unrestricted demand deposits and money market accounts to be cash equivalents. In addition, all highly liquid investments, including repurchase agreements, with original maturities of three months or less from the date of purchase are considered to be cash equivalents.
Accounts receivable, allowance for doubtful accounts and bad debt expense The District carries accounts receivable at cost less an allowance for doubtful accounts which is based on historical collection experience and approximates 0.5475% of budgeted water and sewer revenues. Management charges off to expense any balances that are determined to be uncollectible. At June 30, 2014 and 2013 the balance of the allowance for doubtful accounts was $59,944. Bad debt expense for the years ended June 30, 2014 and 2013 was $46,940 and $47,911, respectively.
Inventory Inventory is recorded at the lower of cost or market on a weighted average cost basis.
Property, plant and equipment Property, plant and equipment are recorded at cost when constructed or purchased. Assets contributed to the District by developers are capitalized at the developers' cost to construct the waterand sewer system. Betterments and improvements over $1,000 which extend the useful life of an asset are capitalized and depreciated over their estimated useful life. Depreciation of all property, plant and equipment is provided by the straight-line method and estimated useful lives of assets in service are as follows:
Estimated lifeDescription (in years)
Waterworks system 5-40Sewage disposal system 5-33Building 40Sewage treatment facilities 3-40Transportation equipment 5Operations furniture and equipment 3-7Office furniture and equipment 4-10
Repairs and maintenance are charged to expense as incurred. During the period of construction, construction period interest in excess of the interest earned on bond proceeds is capitalized into the project which is being financed from the debt proceeds. No interest was capitalized for the years ended June 30, 2014 and 2013.
47
HILTON HEAD NO. 1 PUBLIC SERVICE DISTRICT
NOTES TO FINANCIAL STATEMENTS JUNE 30, 2014 AND 2013
Note 1 - Summary of significant accounting policies (continued)
Prepaid insurance - bonds Prepaid insurance costs connected to bond issuances are capitalized and amortized using the straight-line method over the life of the bonds commencing at the date of issuance. Amortization expense on prepaid bond insurance costs was $9,157 for the years ended June 30, 2014 and 2013.
Bond discount and premium The issue price of the 2004 revenue bonds exceeded its par value resulting in a bond premium of $1,669,539. The bond premium was being amortized over the 17-year life of the 2004 revenue bonds. The unamortized portion of the premium was written off as a part of deferred outflows of debt refunding when the bonds were refunded in November 2012. The 2006 revenue bonds included two series of bonds, one issued at a premium of $40,990 and one issued at a discount of $197,849. The 2007 general obligation bonds included two series of bonds, one issued at a premium of $108,661 and one issued at a discount of $8,471. The 2010 revenue bonds included two series of bonds, one issued at a premium of $126,097 and one issued at a discount of $66,931. The 2010 general obligation bonds included two series of bonds, one issued at a premium of $53,282 and one issued at a discount of $36,097. The net unamortized bond premium at June 30, 2014 and 2013 was $45,019 and $45,050, respectively, which is included as a direct deduction from bonds payable, net of current portion on the balance sheets. Bond discount and premium amortization totaled $31 and $46,066 for the years ended June 30, 2014 and 2013, respectively, and is included as a reduction in interest expense on the statements of revenues, expenses and changes in net position.
Compensated absences The District accounts for compensated absences by accruing a liability for future absences according to the guidelines of GASB Statement No. 16, Accounting for Compensated Absences, which amounted to $303,410 and $273,278 at June 30, 2014 and 2013, respectively.
Use of estimates The preparation of financial statements in conformity with accounting principles generally accepted in the United States of America requires management to make estimates and assumptions that affect the reported amounts of assets and liabilities and disclosure of contingent assets and liabilities at the date of the financial statements and the reported amounts of revenues and expenses during the reporting period. Actual results could differ from those estimates.
Reclassification Certain accounts and amounts in the June 30, 2013 financial statements have been reclassified in order to conform to the June 30, 2014 presentation. Date of Management’s Review In preparing the financial statements, the District has evaluated events and transactions for potential recognition or disclosure through November 12, 2014, the date that the financial statements were available to be issued.
48
HILTON HEAD NO. 1 PUBLIC SERVICE DISTRICT
NOTES TO FINANCIAL STATEMENTS JUNE 30, 2014 AND 2013
Note 2 – Cash, cash equivalents and investments At June 30, 2014, the bank balances of unrestricted and restricted accounts totaled $5,014,095 and had a carrying balance totaling $4,783,994. A sum of $200 is held in petty cash funds of the District.
Custodial credit risk is the risk that, in the event of failure of a financial institution, the District will not be able to recover deposits or will not be able to recover collateral securities that are in the possession of an outside party. As of June 30, 2014, none of the District’s deposits or investments were exposed to custodial credit risk. The amounts covered by federal depository insurance (FDIC), invested in money market accounts and collateralized were as follows:
Restricted underUnrestricted bond covenants Total
FDIC insured 211,007$ -$ 211,007$ Collateralized 2,023,840 2,779,248 4,803,088
Balance per bank at 06/30/14 2,234,847$ 2,779,248$ 5,014,095$ Credit risk is the risk that an issuer or other counterparty to an investment will not fulfill its obligations to the holder of the investment. This is measured by the assignment of a rating by a nationallyrecognized rating organization. The District’s investment policy limits investments to those that are very creditworthy. At June 30, 2014, the District’s investments were all in a Standard and Poor’s AAAm rated money market account that is collateralized by U.S. Treasury obligations. As of June 30, 2014 and 2013, all investments of the District were redeemable on demand without penalty and are, therefore, classified as cash and cash equivalents. Concentration of credit risk is the risk of loss attributed to the magnitude of an entity’s investment in a single issuer. The District’s investment policy does not address this risk. Investment Policy The District’s cash management program seeks to achieve three objectives with regards to investments: safety of principal, adequate liquidity to meet daily cash needs, and a reasonable yield commensurate with the preservation of principal and liquidity. The following investment strategy has been designed to accomplish these objectives:
1. The District will invest in very creditworthy, highly liquid investments with maturities of one year or less and in intermediate-term securities of high credit quality with maturities no greater than five years. The District will only invest in those securities specified under South Carolina Code Section 6-5-10. These include collateralized money market accounts and certificates of deposits, U.S. Treasury Bills and Notes, high quality obligations of certain U.S. agencies and instrumentalities, and the local government investment pool.
2. The primary objective of all District investment activity is the preservation of capital and
safety of principal. Each investment transaction shall ensure that capital losses are avoided, whether from security default, sale of instruments prior to maturity or erosion of market value.
49
HILTON HEAD NO. 1 PUBLIC SERVICE DISTRICT
NOTES TO FINANCIAL STATEMENTS JUNE 30, 2014 AND 2013
Note 2 – Cash, cash equivalents and investments (continued)
3. At all times, the District shall remain sufficiently liquid to meet cash flow requirements by matching investment maturities with forecasted cash flow requirements, investing in securities with active secondary markets, and maintaining appropriate portfolio diversification.
Interest rate risk is the risk that changes in interest rates will adversely affect the fair value of investments. There may be times when the District has more or less of its funds in particular investment vehicles due to cash flow needs, prevailing market conditions, and other factors. Analyzing monthly financial reports in conjunction with prevailing market conditions serve as a general guideline for making investment decisions. In this way, the portfolio will be able to take advantage of rising interest rates by re-investing maturing securities at higher yields. In falling rate environments, it will profit from having investments that were made at higher rates. Following this discipline ensures that the District will always have sufficient cash available for daily needs, preserve its principal, and earn a competitive yield without assuming unacceptable risks.
Note 3 - Cash held by the Beaufort County Treasurer Cash held by the Beaufort County Treasurer includes the remaining proceeds of the general obligation bond issues, property tax collections and interest earned on monies held by the Treasurer. The funds will be used as follows:
2014 2013
Unrestricted cash - Available for general operating purposes 107,745$ 28,278$ Restricted cash - Bond principal retirement and interest payments 598,720 636,942
Total 706,465$ 665,220$
As of June 30,
The deposits are a pool of funds invested by the pool for the entities which receive property taxes from the County Treasurer. As such, collateral is not identified for each deposit, but rather for the fund as a whole. These deposits are collateralized by cash or governmental agency securities, which are fully guaranteed as to principal and interest by the federal government. Note 4 - Accounts receivable Current trade accounts receivable include the following:
2014 2013
Receivables from customers 945,303$ 1,026,230$ Unbilled receivables from customers 874,953 849,369 Other receivables 77,554 3,495
Total 1,897,810$ 1,879,094$
As of June 30,
50
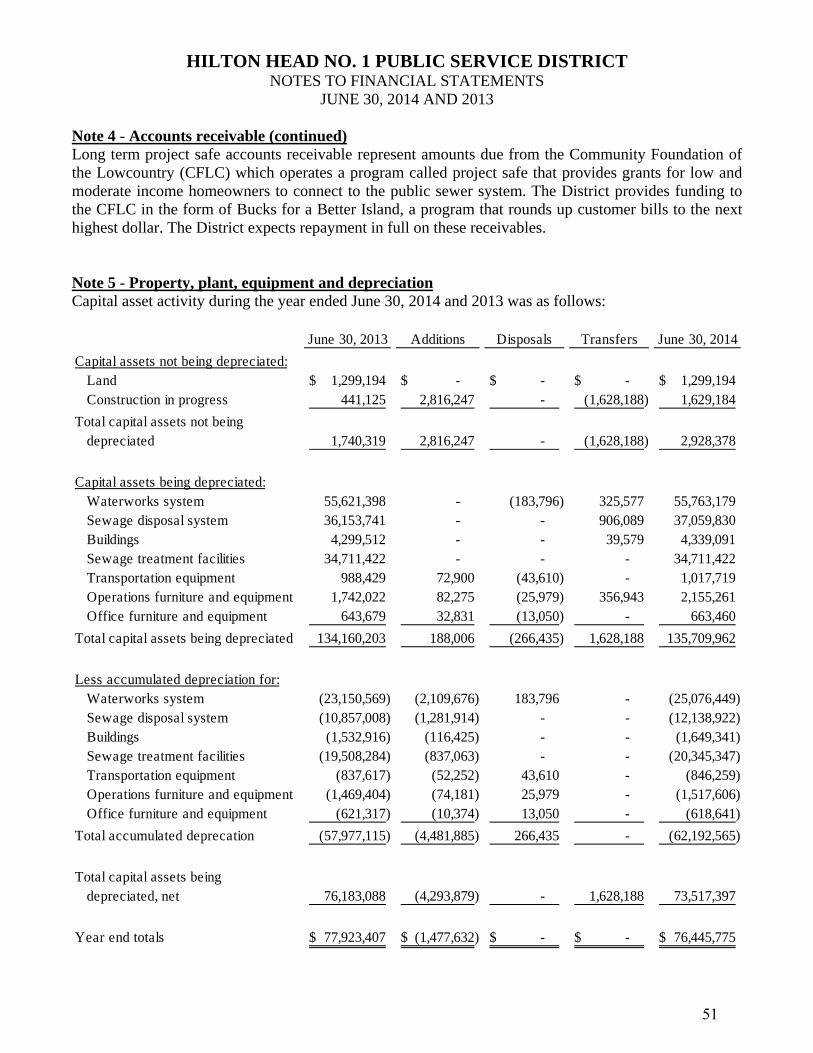
HILTON HEAD NO. 1 PUBLIC SERVICE DISTRICT
NOTES TO FINANCIAL STATEMENTS JUNE 30, 2014 AND 2013
Note 4 - Accounts receivable (continued) Long term project safe accounts receivable represent amounts due from the Community Foundation of the Lowcountry (CFLC) which operates a program called project safe that provides grants for low and moderate income homeowners to connect to the public sewer system. The District provides funding to the CFLC in the form of Bucks for a Better Island, a program that rounds up customer bills to the next highest dollar. The District expects repayment in full on these receivables. Note 5 - Property, plant, equipment and depreciation Capital asset activity during the year ended June 30, 2014 and 2013 was as follows:
June 30, 2013 Additions Disposals Transfers June 30, 2014
Capital assets not being depreciated:Land 1,299,194$ -$ -$ -$ 1,299,194$ Construction in progress 441,125 2,816,247 - (1,628,188) 1,629,184
Total capital assets not being depreciated 1,740,319 2,816,247 - (1,628,188) 2,928,378
Capital assets being depreciated:Waterworks system 55,621,398 - (183,796) 325,577 55,763,179 Sewage disposal system 36,153,741 - - 906,089 37,059,830 Buildings 4,299,512 - - 39,579 4,339,091 Sewage treatment facilities 34,711,422 - - - 34,711,422 Transportation equipment 988,429 72,900 (43,610) - 1,017,719 Operations furniture and equipment 1,742,022 82,275 (25,979) 356,943 2,155,261 Office furniture and equipment 643,679 32,831 (13,050) - 663,460
Total capital assets being depreciated 134,160,203 188,006 (266,435) 1,628,188 135,709,962
Less accumulated depreciation for:Waterworks system (23,150,569) (2,109,676) 183,796 - (25,076,449) Sewage disposal system (10,857,008) (1,281,914) - - (12,138,922) Buildings (1,532,916) (116,425) - - (1,649,341) Sewage treatment facilities (19,508,284) (837,063) - - (20,345,347) Transportation equipment (837,617) (52,252) 43,610 - (846,259) Operations furniture and equipment (1,469,404) (74,181) 25,979 - (1,517,606) Office furniture and equipment (621,317) (10,374) 13,050 - (618,641)
Total accumulated deprecation (57,977,115) (4,481,885) 266,435 - (62,192,565)
Total capital assets being depreciated, net 76,183,088 (4,293,879) - 1,628,188 73,517,397
Year end totals 77,923,407$ (1,477,632)$ -$ -$ 76,445,775$
51
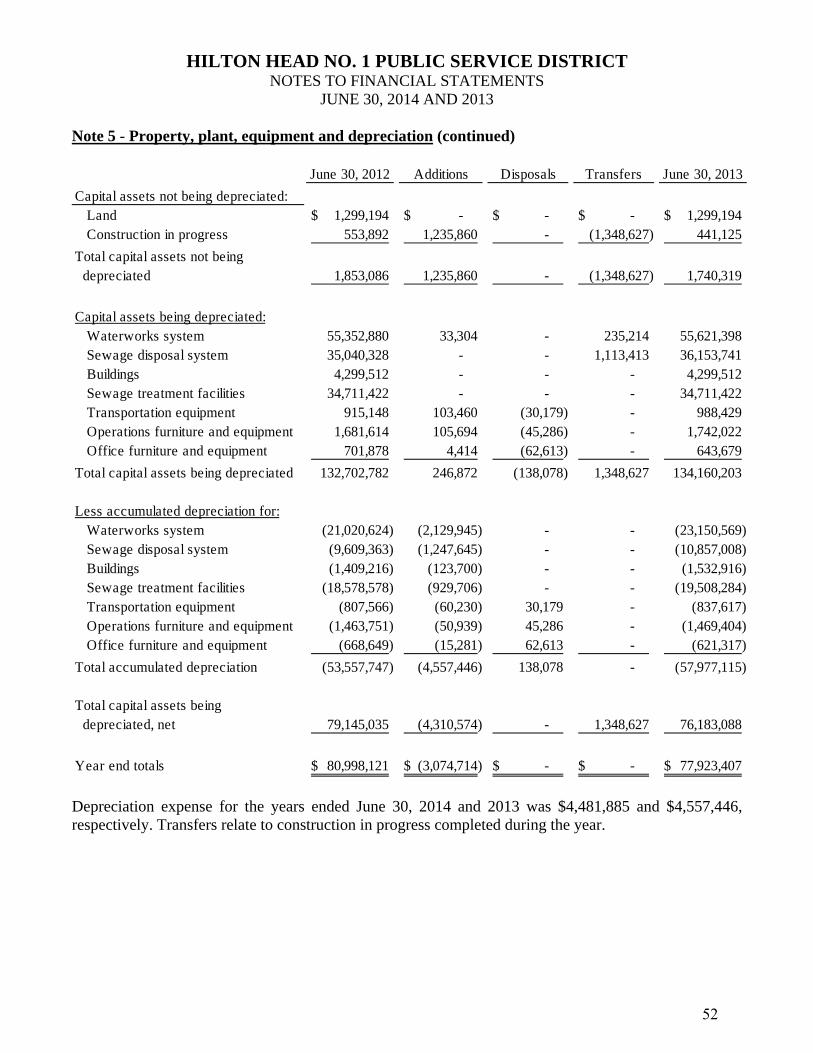
HILTON HEAD NO. 1 PUBLIC SERVICE DISTRICT
NOTES TO FINANCIAL STATEMENTS JUNE 30, 2014 AND 2013
Note 5 - Property, plant, equipment and depreciation (continued)
June 30, 2012 Additions Disposals Transfers June 30, 2013
Capital assets not being depreciated:Land 1,299,194$ -$ -$ -$ 1,299,194$ Construction in progress 553,892 1,235,860 - (1,348,627) 441,125
Total capital assets not being depreciated 1,853,086 1,235,860 - (1,348,627) 1,740,319
Capital assets being depreciated:Waterworks system 55,352,880 33,304 - 235,214 55,621,398 Sewage disposal system 35,040,328 - - 1,113,413 36,153,741 Buildings 4,299,512 - - - 4,299,512 Sewage treatment facilities 34,711,422 - - - 34,711,422 Transportation equipment 915,148 103,460 (30,179) - 988,429 Operations furniture and equipment 1,681,614 105,694 (45,286) - 1,742,022 Office furniture and equipment 701,878 4,414 (62,613) - 643,679
Total capital assets being depreciated 132,702,782 246,872 (138,078) 1,348,627 134,160,203
Less accumulated depreciation for:Waterworks system (21,020,624) (2,129,945) - - (23,150,569) Sewage disposal system (9,609,363) (1,247,645) - - (10,857,008) Buildings (1,409,216) (123,700) - - (1,532,916) Sewage treatment facilities (18,578,578) (929,706) - - (19,508,284) Transportation equipment (807,566) (60,230) 30,179 - (837,617) Operations furniture and equipment (1,463,751) (50,939) 45,286 - (1,469,404) Office furniture and equipment (668,649) (15,281) 62,613 - (621,317)
Total accumulated depreciation (53,557,747) (4,557,446) 138,078 - (57,977,115)
Total capital assets being depreciated, net 79,145,035 (4,310,574) - 1,348,627 76,183,088
Year end totals 80,998,121$ (3,074,714)$ -$ -$ 77,923,407$
Depreciation expense for the years ended June 30, 2014 and 2013 was $4,481,885 and $4,557,446, respectively. Transfers relate to construction in progress completed during the year.
52
HILTON HEAD NO. 1 PUBLIC SERVICE DISTRICT
NOTES TO FINANCIAL STATEMENTS JUNE 30, 2014 AND 2013
Note 6 – Long-term obligations The District has financed its acquisitions of property, plant and equipment though bond issuances and notes payable as follows: Notes payable The District is obligated under a note dated November 30, 1988, with a balance of $151,939 and $169,939 at June 30, 2014 and 2013, respectively, payable to the South Carolina Jobs-Economic Authority (Authority). The proceeds of the note were for expansion of water lines within the District. The note is without interest, payable at $1,500 per month. Since this obligation was acquired pursuant to the purchase of an existing utility system, the Authority may have the right to renegotiate the terms of the note, including the interest rate and maturity date.
On April 14, 2008 the District executed a loan with the South Carolina State Infrastructure Revolving Loan Fund (SIRF) in the amount of $481,080 at an interest rate of 3.50% per annum. The proceeds of this loan were used only to pay the costs of constructing new water wells. Principal and interest of $8,387 are payable quarterly beginning January 1, 2009 through October 1, 2028. The SIRF loan balance outstanding at June 30, 2014 and 2013 amounted to $375,155 and $395,134, respectively.
On October 3, 2008, the District finalized a State Revolving Fund (SRF) loan in the amount of $2,887,826 at an interest rate of 3.0% per annum. These funds were used as part of the financing for the new reverse osmosis plant. Principal and interest of $48,135 were payable quarterly beginning January 1, 2009 through October 1, 2011. Effective November 21, 2011, the interest rate was reduced to 2.25% resulting in reduced principal and interest payments of $45,350 to be paid quarterly from January 1, 2012 through October 1, 2028. The SRF loan balance outstanding at June 30, 2014 and 2013 amounted to $2,206,268 and $2,336,196, respectively. Bonds payable In May 2000, the District issued $530,000 of Series 2000B revenue bonds for purposes of funding certain improvements within the District. The bonds were an obligation of the District, bore interest at the rate of 6.172% and were payable annually through May 2020 in the amount of $46,856, which included interest. The bonds will be repaid by annual assessments to the owners in the Burkes Beach area over a 20 year period and will be collected by the county treasurer. In June 2010, the District made a $342,069 payment to pay off these bonds. After the pay off, $190,722 of these bonds were refinanced as series 2010A revenue bonds. The series 2010A bonds bear interest at a rate of 3.85% per annum. The first payment of principal and interest in the amount of $23,219 was due May 26, 2011. Nine additional payments of principal and interest of $23,301 are payable on May 26th of each year beginning in 2012 and continuing until 2020. The 2010A revenue bonds outstanding amounted to $122,744 and $140,630 at June 30, 2014 and 2013, respectively.
In April 2004, the District determined that a debt service savings could be achieved by issuing a series of 2004 revenue bonds in the amount of $17,575,000 and applying the proceeds thereof to refund a portion of the callable maturities of the 1995 revenue bonds and all of the callable maturities of the 1996 revenue bonds. The 2004 revenue bonds bore varying interest rates of between 2% to 5%, and were payable semi-annually beginning August 1, 2004 through August 1, 2021. In November 2012, these bonds were advance refunded to achieve a debt service savings by the issuance of series 2012A revenue
53
HILTON HEAD NO. 1 PUBLIC SERVICE DISTRICT
NOTES TO FINANCIAL STATEMENTS JUNE 30, 2014 AND 2013
Note 6 – Long-term obligations (continued) Bonds payable(continued) bonds in the amount of $12,275,000. Interest on the bonds is payable semi-annual at interest rates of between 0.542% and 2.839% per annum. Principal payments are due annually on August 1st of each year beginning in 2013 and continuing through 2024. The 2012A revenue bonds outstanding amounted to $11,275,000 and $12,275,000 at June 30, 2014 and 2013, respectively.
In August 2004, the District completed the issuance of series 2004B revenue bonds for $430,000. The proceeds of the bonds are to be used first for funding the debt service requirement and the issuance costs of the bond. Proceeds are then to be used to reimburse the District for the cost of system improvements. A one time principal payment was made in September 2004 of $103,978. Beginning May 2, 2005, the remaining balance of $326,022 will be paid with 19 annual payments of $26,275 which includes interest at a rate of 5.19% per annum. A final payment of $26,126, including interest, is due on May 2, 2024. The bonds are payable from revenues derived from operation of the District’s system, and are secured by a lien upon these revenues. The 2004B bonds outstanding amounted to $200,940 and $216,004 at June 30, 2014 and 2013, respectively.
On February 2, 2006 the District issued $18,770,000 of Series 2006 revenue bonds to refund the series 1998 revenue bonds in order to achieve savings on debt service. Interest on the bonds is payable semi-annually at varying interest rates of between 3.50% and 4.125% per annum. Principal payments are due annually on December 1st of each year beginning in 2006 and continuing until 2023. The bonds are payable from revenues derived from operation of the District’s system, and are secured by a lien upon these revenues. The 2006 bonds outstanding amounted to $16,235,000 and $16,725,000 at June 30, 2014 and 2013, respectively.
In June 2007, the District issued $930,000 of series 2007 revenue bonds. Proceeds are to be used to defray the costs of system improvements. The series 2007 bond bears interest at a rate of 4.22% per annum. Principal and interest of $69,771 are payable on June 20th of each year beginning in 2008 and continuing until 2027. The bonds are payable from revenues derived from operation of the District’s system, and are secured by a lien upon these revenues. The 2007 revenue bonds outstanding amounted to $687,292 and $726,407 at June 30, 2014 and 2013, respectively.
On October 3, 2007 the District issued $7,350,000 of general obligation bonds. Proceeds are to be used to defray the cost of constructing, furnishing and equipping a new water well and reverse osmosis plant. Interest on the bonds is payable semi-annually beginning March 1, 2008 at varying interest rates of between 4.50% and 4.00% per annum. Principal payments on the bonds are due annually beginning March 1, 2009 through March 1, 2027. The 2007 general obligation bonds outstanding amounted to $5,585,000 and $5,910,000 at June 30, 2014 and 2013, respectively.
In July 2009, the District issued $355,902 of series 2009A revenue bonds. Proceeds are to be used to defray the costs of system improvements. The series 2009A bond bears interest at a rate of 4.55% per annum. Principal and interest of $33,254 are payable on July 30th of each year beginning in 2010 and continuing until 2024. The bonds are payable from revenues derived from operation of the District’s
54
HILTON HEAD NO. 1 PUBLIC SERVICE DISTRICT
NOTES TO FINANCIAL STATEMENTS JUNE 30, 2014 AND 2013
Note 6 – Long-term obligations (continued)
Bonds payable (continued) system, and are secured by a lien upon these revenues. The 2009A revenue bonds outstanding amounted to $282,862 and $302,358 at June 30, 2014 and 2013, respectively.
In July 2009, the District issued $1,781,694 of general obligation bonds. Proceeds are to be used to defray the cost of constructing, furnishing and equipping a new water well and reverse osmosis plant. The bonds bear interest at a rate of 4.219% per annum. The first payment of principal and interest in the amount of $159,413 was due March 1, 2010. Fourteen additional payments of principal and interest of $160,040 are payable on March 1st of each year beginning in 2011 and continuing until 2024. The 2009 general obligation bonds outstanding amounted to $1,284,029 and $1,385,610 at June 30, 2014 and 2013, respectively. On August 24, 2010, the District issued $3,400,000 of series 2010B revenue bonds. Proceeds are to be used to defray the costs of system improvements. Interest on the bonds is payable semi-annually beginning December 1, 2010 at varying interest rates of between 2.00% and 4.00% per annum. Principal payments on the bonds are due annually beginning December 1, 2011 through December 1, 2029. The bonds are payable from revenues derived from operation of the District’s system, and are secured by a lien upon these revenues. The 2010B revenue bonds outstanding amounted to $3,005,000 and $3,140,000 at June 30, 2014 and 2013, respectively.
On September 28, 2010 the District issued $3,970,000 of general obligation bonds. Proceeds are to be used to defray the cost of constructing, furnishing and equipping a new Aquifer Storage and Recovery well. Interest on the bonds is payable semi-annually beginning March 1, 2011 at varying interest rates of between 2.00% and 3.375% per annum. Principal payments on the bonds are due annually beginning March 1, 2011 through March 1, 2029. The 2010 general obligation bonds outstanding amounted to $3,275,000 and $3,445,000 at June 30, 2014 and 2013, respectively.
On April 27, 2011, the District issued $384,402 of series 2011 revenue bonds. Proceeds are to be used to defray the costs of system improvements. The series 2011 bond bears interest at a rate of 3.91% per annum. Principal and interest of $34,356 are payable on April 27th of each year beginning in 2012 and continuing until 2026. The bonds are payable from revenues derived from operation of the District’s system, and are secured by a lien upon these revenues. The 2011 revenue bonds outstanding amounted to $324,126 and $344,994 at June 30, 2014 and 2013, respectively. On August 24, 2011, the District issued $6,003,544 of series 2011B refunding revenue bonds. Proceeds were used to refund the May 2000 loan agreement with the South Carolina Water Quality Revolving Fund Authority; the purpose of the original loan agreement was to fund the expansion of the wastewater treatment plant capacity by 3,200,000 gallons per day. The series 2011B bond bears interest at a rate of 2.89% per annum. Principal and interest of $57,666 are payable on the 24th of each month beginning in September 2011 and continuing until August 2021. The bonds are payable from revenues derived from operation of the District’s system, and are secured by a lien upon these revenues. The 2011 revenue bonds outstanding amounted to $4,474,573 and $5,028,544 at June 30, 2014, and 2013, respectively.
55
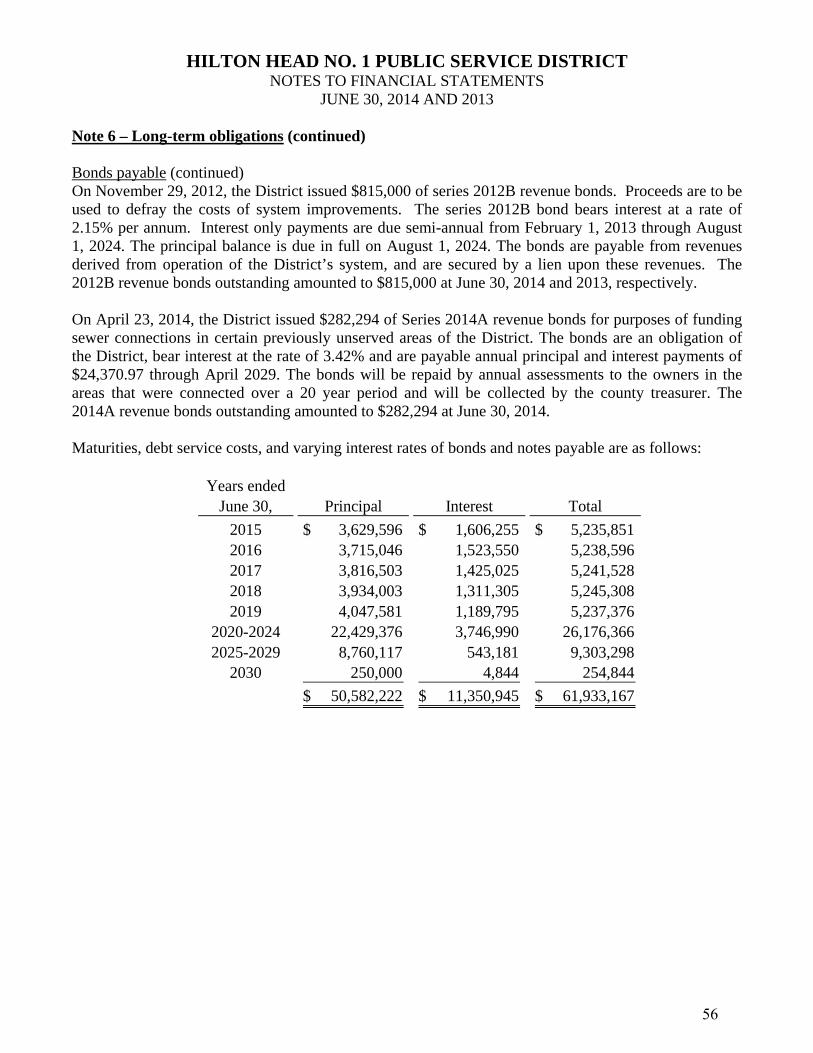
HILTON HEAD NO. 1 PUBLIC SERVICE DISTRICT
NOTES TO FINANCIAL STATEMENTS JUNE 30, 2014 AND 2013
Note 6 – Long-term obligations (continued)
Bonds payable (continued) On November 29, 2012, the District issued $815,000 of series 2012B revenue bonds. Proceeds are to be used to defray the costs of system improvements. The series 2012B bond bears interest at a rate of 2.15% per annum. Interest only payments are due semi-annual from February 1, 2013 through August 1, 2024. The principal balance is due in full on August 1, 2024. The bonds are payable from revenues derived from operation of the District’s system, and are secured by a lien upon these revenues. The 2012B revenue bonds outstanding amounted to $815,000 at June 30, 2014 and 2013, respectively. On April 23, 2014, the District issued $282,294 of Series 2014A revenue bonds for purposes of funding sewer connections in certain previously unserved areas of the District. The bonds are an obligation of the District, bear interest at the rate of 3.42% and are payable annual principal and interest payments of $24,370.97 through April 2029. The bonds will be repaid by annual assessments to the owners in the areas that were connected over a 20 year period and will be collected by the county treasurer. The 2014A revenue bonds outstanding amounted to $282,294 at June 30, 2014.
Maturities, debt service costs, and varying interest rates of bonds and notes payable are as follows:
Years ended
June 30, Principal Interest Total
2015 3,629,596$ 1,606,255$ 5,235,851$ 2016 3,715,046 1,523,550 5,238,596 2017 3,816,503 1,425,025 5,241,528 2018 3,934,003 1,311,305 5,245,308 2019 4,047,581 1,189,795 5,237,376
2020-2024 22,429,376 3,746,990 26,176,366 2025-2029 8,760,117 543,181 9,303,298
2030 250,000 4,844 254,844
50,582,222$ 11,350,945$ 61,933,167$
56
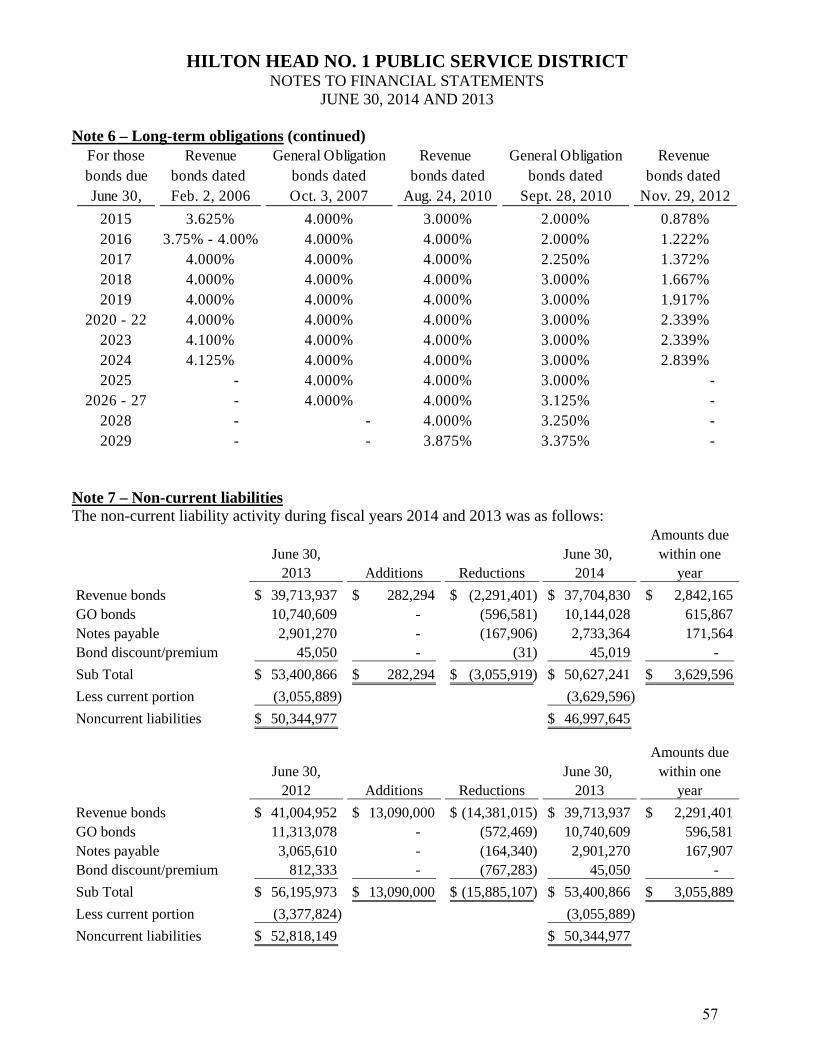
HILTON HEAD NO. 1 PUBLIC SERVICE DISTRICT
NOTES TO FINANCIAL STATEMENTS JUNE 30, 2014 AND 2013
Note 6 – Long-term obligations (continued)
For those Revenue General Obligation Revenue General Obligation Revenue bonds due bonds dated bonds dated bonds dated bonds dated bonds dated June 30, Feb. 2, 2006 Oct. 3, 2007 Aug. 24, 2010 Sept. 28, 2010 Nov. 29, 2012
2015 3.625% 4.000% 3.000% 2.000% 0.878%2016 3.75% - 4.00% 4.000% 4.000% 2.000% 1.222%2017 4.000% 4.000% 4.000% 2.250% 1.372%2018 4.000% 4.000% 4.000% 3.000% 1.667%2019 4.000% 4.000% 4.000% 3.000% 1.917%
2020 - 22 4.000% 4.000% 4.000% 3.000% 2.339%2023 4.100% 4.000% 4.000% 3.000% 2.339%2024 4.125% 4.000% 4.000% 3.000% 2.839%2025 - 4.000% 4.000% 3.000% -
2026 - 27 - 4.000% 4.000% 3.125% - 2028 - - 4.000% 3.250% - 2029 - - 3.875% 3.375% -
Note 7 – Non-current liabilities The non-current liability activity during fiscal years 2014 and 2013 was as follows:
Amounts dueJune 30, June 30, within one
2013 Additions Reductions 2014 year
Revenue bonds 39,713,937$ 282,294$ (2,291,401)$ 37,704,830$ 2,842,165$ GO bonds 10,740,609 - (596,581) 10,144,028 615,867 Notes payable 2,901,270 - (167,906) 2,733,364 171,564 Bond discount/premium 45,050 - (31) 45,019 -
Sub Total 53,400,866$ 282,294$ (3,055,919)$ 50,627,241$ 3,629,596$
Less current portion (3,055,889) (3,629,596)
Noncurrent liabilities 50,344,977$ 46,997,645$
Amounts dueJune 30, June 30, within one
2012 Additions Reductions 2013 year
Revenue bonds 41,004,952$ 13,090,000$ (14,381,015)$ 39,713,937$ 2,291,401$ GO bonds 11,313,078 - (572,469) 10,740,609 596,581 Notes payable 3,065,610 - (164,340) 2,901,270 167,907 Bond discount/premium 812,333 - (767,283) 45,050 -
Sub Total 56,195,973$ 13,090,000$ (15,885,107)$ 53,400,866$ 3,055,889$
Less current portion (3,377,824) (3,055,889)
Noncurrent liabilities 52,818,149$ 50,344,977$
57
HILTON HEAD NO. 1 PUBLIC SERVICE DISTRICT
NOTES TO FINANCIAL STATEMENTS JUNE 30, 2014 AND 2013
Note 8 – Deferred amount on refunding On February 2, 2006 the District issued revenue bonds amounting to $18,770,000 with varying interest rates to advance refund series 1998 revenue bonds amounting to $17,825,000 of principal which were to mature in 2024. Part of the proceeds of the new revenue bond issuance was used to purchase funds within an irrevocable trust with an escrow agent to provide debt service payments on the previously existing debt issues. The 2006 advance refunding met the requirements of an in-substance debt defeasance, and those bonds were removed from the books of the District. As a result of the advance refunding, the District reduced its total debt service requirements by $1.28 million, which resulted in an economic gain (difference between the present value of the debt service payments on the old and new debt) of $886,805. The District is amortizing the deferred loss on early retirement of $1,133,015 over the 18-year life of the refunded bonds. The unamortized balance at June 30, 2014 and 2013 was $598,273 and $661,806, respectively.
In June 2010, the District issued revenue bonds amounting to $190,722 with varying interest rates to advance refund series 2000B revenue bonds amounting to $530,000 of principal which were to mature in 2020. Part of the proceeds of the new revenue bond issuance was used to purchase funds within an irrevocable trust with an escrow agent to provide debt service payments on the previously existing debt issues. The 2010 advance refunding met the requirements of an in-substance debt defeasance, and those bonds were removed from the books of the District. As a result of the advance refunding, the District reduced its total debt service requirements by $84,295, which resulted in an economic gain (difference between the present value of the debt service payments on the old and new debt) of $35,268. The District is amortizing the deferred amount on early retirement of $17,137 over the 10-year life of the refunded bonds. The unamortized balance at June 30, 2014 and 2013 was $10,282 and $11,996, respectively. In November 2012, the District issued revenue bonds amounting to $12,275,000 with varying interest rates to advance refund series 2004 revenue bonds amounting to $17,575,000 which had varying interest rates and a balance of $11,740,000 at the time of the refunding. The 2004 bonds previously refunded revenue bonds totaling $18,110,000. The 2004 revenue bonds were set to mature in 2021. The proceeds of the new revenue bond issue were used to purchase funds within an irrevocable trust with an escrow agent to provide debt service payments on the previously existing debt issues. The 2012A advance refunding met the requirements of an in-substance debt defeasance, and those bonds were removed from the books of the District. As a result of the advance refunding, the District reduced its total debt service requirements by $527,149, which resulted in an economic gain (difference between the present value of the debt service payments on the old and new debt) of $206,473. The District is amortizing the deferred amount on early retirement of $1,240,395 over the 8.33 year remaining life of the refunded bonds. The unamortized balance at June 30, 2014 and 2013 was $1,004,720 and $1,153,568, respectively.
Note 9 – Restricted Assets A reserve fund for debt service is mandated by bond covenants. At June 30, 2014 and 2013 the debt service reserves totaled $3,377,968 and $2,885,019, respectively.
58
HILTON HEAD NO. 1 PUBLIC SERVICE DISTRICT
NOTES TO FINANCIAL STATEMENTS JUNE 30, 2014 AND 2013
Note 9 – Restricted Assets (continued) The District also has funds established, as mandated by bond covenants, for operation and maintenance, and depreciation and contingencies. The operating and maintenance fund is intended to provide for the payment of the operations and maintenance expenses. The depreciation and contingency fund is intended to provide a reasonable reserve for the depreciation of the system, for contingencies and for improvements, betterment and extensions of the system.
At June 30, 2014 and 2013, the District had $-0- and $729,808, respectively, held by US Bank relating to the November 29, 2012 series 2012B revenue bond issuance. Use of these funds is restricted for waterworks and sewer system improvement. Note 10 - Lease arrangements The District is currently leasing office space, land use and space on its water tower facilities to various cellular phone companies for attachment of antennae. Original lease terms range from one to five year periods, with renewal options. Rental income in connection with these leases was $591,203 and $565,751 for the years ended June 30, 2014 and 2013, respectively.
The future minimum lease income is as follows:
Years endedJune 30, Amount
2015 470,326$ 2016 296,191 2017 187,517 2018 63,405 2019 -
Thereafter -
Total 1,017,439$
Note 11 - Economic dependence The District has a service area that is located within the geographic boundaries of Hilton Head Island, South Carolina. A change in the overall economic conditions of this geographic area may have a significant influence upon the operating results of the District. Note 12 – Insurance recoveries The District records insurance recoveries as an offset to the related expense. The District received $-0- and $57,911 for insurance recoveries during the years ended June 30, 2014 and 2013, respectively.
59
HILTON HEAD NO. 1 PUBLIC SERVICE DISTRICT
NOTES TO FINANCIAL STATEMENTS JUNE 30, 2014 AND 2013
Note 13 - Construction and development commitments Policy The District has financed a portion of its expansion through direct charges to developers and through governmental grants. Developers basically install the systems within a given area and/or contribute toward treatment plant or water production facilities in exchange for a portion of the capacity. All systems contributed must be approved by the District and are contributed, generally without cost to the District, once they are completed and acceptable for use.
Regulatory mandates The District, as well as some other water authorities on Hilton Head Island, South Carolina, has entered into contracts for additional water supply sources to meet its future needs due to restrictions placed on the District by the South Carolina Department of Health and Environmental Control. The restrictions and contract for water supply have a significant financial impact on the District. During the years ended June 30, 1998 and June 30, 2003, the District signed agreements with Beaufort Jasper Water & Sewer Authority (BJWSA) to provide an additional water supply for the District's service area. Since completion of the water supply construction, the District is required under the agreement to purchase a minimum amount of water per day, based upon BJWSA's operation and maintenance cost for providing the water. Purchases from BJWSA amounted to $817,167 and $951,201 for the years ended June 30, 2014 and 2013, respectively.
Expansion As part of an overall funding plan for expansion of the District's present facilities, the District has entered into various contracts with developers and others. Under these contracts, contributions of capital assets valued at $1,184,597 and $474,097 and payments of capacity fees totaling $477,179 and $79,240 were collected during the fiscal years ended June 30, 2014 and 2013, respectively. All developer contract commitments entered into prior to the current expansion program have been substantially met. The District extended its boundaries to include those undeveloped areas on the northern part of the island under developer contracts. The cost of expansion is allocated to the developers based upon capacity requested. The infrastructure necessary to connect or serve the developers' property will be constructed by the developers and contributed to the District at no cost to the District. Construction commitments The District had outstanding construction contract commitments of $3,896,804 and $676,261 at June 30, 2014 and 2013, respectively.
Note 14 - Sewer assessments The District has constructed various sewer collection systems, the cost of which is to be repaid by annual sewer assessments collected by the Beaufort County treasurer from the property owners that benefited from these systems. These assessments are being collected annually and are expected to be paid in full beginning 2016 through 2034. Assessments receivable totaled $2,997,372 and $3,010,122 as of June 30, 2014 and 2013, respectively. A portion of the annual receipts is recognized as interest income each year. For the years ended June 30, 2014 and 2013, $132,960 and $159,149, respectively, of the assessments collected was recognized as interest income.
60
HILTON HEAD NO. 1 PUBLIC SERVICE DISTRICT
NOTES TO FINANCIAL STATEMENTS JUNE 30, 2014 AND 2013
Note 15 - Deferred compensation plans Section 457/401(k) Plan In April 2004, the District reactivated its Internal Revenue Code Section 457 retirement plan. All persons employed by the District on March 31, 2004 became eligible employees. In May 2012, the District also adopted a 401(k) Plan option. Under the Plan, all participants may make an elective deferral up to 100% of their annual compensation subject to Internal Revenue Code maximum contribution limitations. The District makes a 6% matching contribution to each eligible participant’s account who has not chosen to also participate in the South Carolina Retirement Plan. Employee contributions for the years ended June 30, 2014 and 2013 were $197,903 and $187,626, respectively. The matching contribution for the years ended June 30, 2014 and 2013 was $8,876 and $8,598, respectively.
South Carolina Retirement System Effective April 2004, the District joined the South Carolina Retirement System (SCRS). SCRS is a cost sharing multiple employer defined benefit retirement plan for employees of the state and its public school districts, counties, cities, and other political subdivisions that elect participation. SCRS provides members a guaranteed monthly pension based on a formula that includes the member's average final compensation, years of service, and a benefit multiplier. As a condition of employment, all employees are required to become members of the SCRS and contribute 7.5%, 7.0%, and 6.5% of compensation for the years ended June 30, 2014, 2013, and 2012, respectively. However, employees who worked for the District on the date of its admission into the Retirement System could elect non-membership within six-months. The District's required contributions for the years ended June 30, 2014, 2013 and 2012 were 10.45%, 10.45%, and 9.385%, respectively. The District's required contribution for the years ended June 30, 2014, 2013 and 2012 were $230,630, $222,189 and $193,454, respectively. For each of the years, the District contributed 100% of the required contribution to the SCRS.
For the years ended June 30, 2014, 2013 and 2012, $2,206,988, $2,126,201, and $2,061,190, respectively, of wages were subject to retirement. During the years ended June 30, 2014, 2013 and 2012, $165,524, $148,834, and $133,978, respectively, were contributed to the system for the employees’ share.
Employees are vested after 5 years and are entitled to a deferred annuity commencing at age 60. Employees who retire at age 65 with 5 years of service and have twenty-eight years of credited service are entitled to a retirement benefit, payable monthly for life equal to 1.82% of average finalcompensation times years of credited service. Employees who retire between the ages of 55 and 60 with 25 years of service receive an annuity reduced by 4% for each year of service under twenty-eight. Employees who retire at age 60 receive an annuity reduced by 5% for each year under the age of 65.
The System also provides disability benefits, group life insurance benefits and survivor benefits. Cost of living adjustments are granted on an ad hoc basis, subject to approval by the State Budget and Control Board.
61
HILTON HEAD NO. 1 PUBLIC SERVICE DISTRICT
NOTES TO FINANCIAL STATEMENTS JUNE 30, 2014 AND 2013
Note 15 - Deferred compensation plans (continued) South Carolina Retirement System (continued) A comprehensive annual financial report containing financial statements and required supplementary information for the South Carolina Retirement System is publicly available on its website at www.retirement.sc.gov or by submitting a request to South Carolina Retirement System, P.O. Box 11960, Columbia, SC 29211-1960.
For each plan the maximum employee contributions are as follows:
Plan year 2014 2013
Under 50 years of age 17,500$ 17,500$ 50 years of age and over 23,000$ 23,000$
Note 16 - Other commitments and contingencies The District is subject to various claims and contingencies arising out of the normal course of business. Management of the District believes that the ultimate liability, if any, from such claims or contingencies will be covered by the District’s insurance policies and are not likely to have a material adverse effect on the District’s operating results, financial condition or liquidity. Currently there are no material outstanding issues being addressed by legal counsel.
Note 17 - Net position Net position represents the difference between assets, deferred inflows of resources, liabilities and deferred outflows of liabilities. The net position amounts were as follows:
2014 2013
Invested in capital assets, net of related liabilitiesNet property, plant and equipment in service 76,445,775$ 77,923,407$ Less: Debt as disclosed in Notes 6 & 7 (50,582,222) (53,355,817)
Cash for construction - 729,808 Bond premium, net (45,019) (45,050) Deferred amount on refunding, net 1,613,275 1,827,370 Prepaid insurance - bonds 86,992 96,149 Accounts payable for capital assets (23,427) (159,653)
27,495,374 27,016,214
Restricted for debt service 3,377,968 2,885,019
Unrestricted 6,272,634 6,262,603
Total net position 37,145,976$ 36,163,836$
As of June 30,
62
HILTON HEAD NO. 1 PUBLIC SERVICE DISTRICT
NOTES TO FINANCIAL STATEMENTS JUNE 30, 2014 AND 2013
Note 18 – Subsequent Events On July 28, 2014, the District paid off the series 2004B revenue bonds totaling $200,940 in full. There was no prepayment penalty. On July 23, 2014, the District signed a promissory note to the South Carolina Water Quality Revolving Fund Authority in the amount of $2,902,255. Proceeds are to be used to defray the costs of installing and implementing an automatic meter reading system. The note bears interest at a rate of 1.00% per annum. Eighty quarterly principal and interest payments of $40,072 will be due beginning April 1, 2016. The notes are payable from revenues derived from operation of the District’s system, and are secured by a lien upon these revenues. On September 10, 2014, the District signed a promissory note to the South Carolina Water Quality Revolving Fund Authority in the amount of $3,750,000. Proceeds are to be used to defray the cost expanding the existing reverse osmosis treatment plan, installing an additional booster pump station, and relocating a major water line within the district. The note bears interest at a rate of 2.00% per annum. Eighty quarterly principal and interest payments of $56,989 will be due beginning May 1, 2015. The notes are backed by general obligation debt.
63
SUPPLEMENTAL FINANCIAL INFORMATION
64
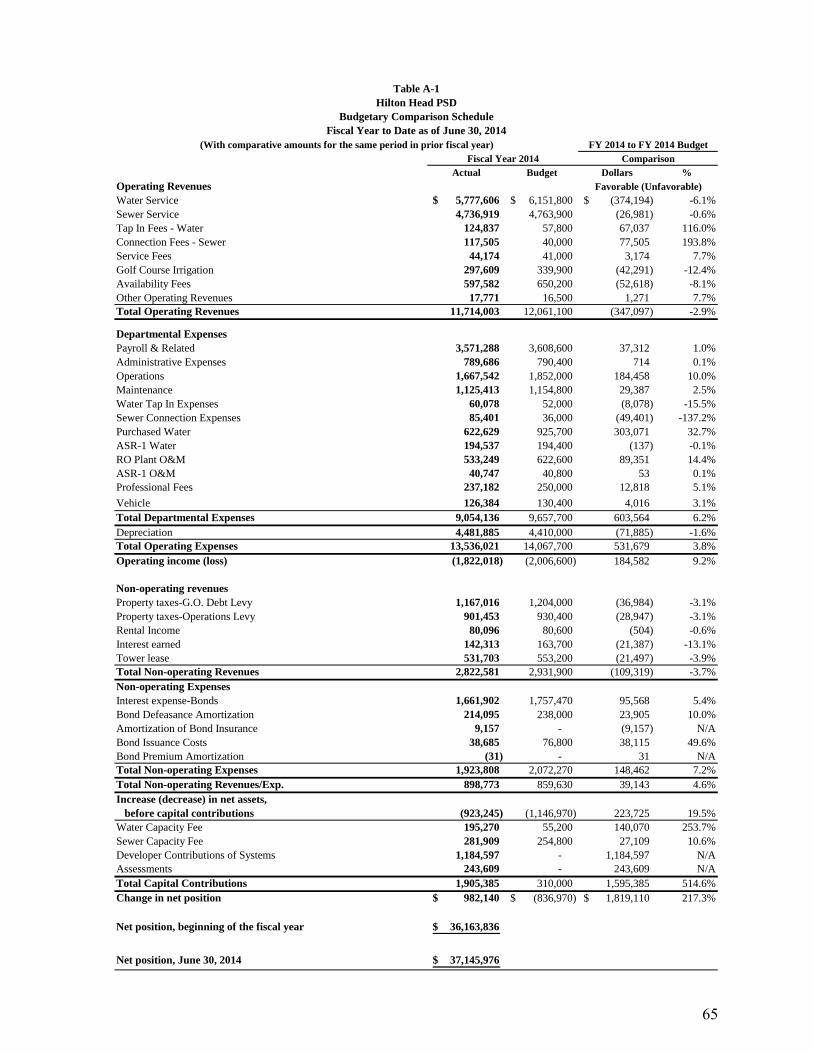
Actual Budget Dollars %Operating RevenuesWater Service 5,777,606$ 6,151,800$ (374,194)$ -6.1%Sewer Service 4,736,919 4,763,900 (26,981) -0.6%Tap In Fees - Water 124,837 57,800 67,037 116.0%Connection Fees - Sewer 117,505 40,000 77,505 193.8%Service Fees 44,174 41,000 3,174 7.7%Golf Course Irrigation 297,609 339,900 (42,291) -12.4%Availability Fees 597,582 650,200 (52,618) -8.1%Other Operating Revenues 17,771 16,500 1,271 7.7%Total Operating Revenues 11,714,003 12,061,100 (347,097) -2.9%
Departmental ExpensesPayroll & Related 3,571,288 3,608,600 37,312 1.0%Administrative Expenses 789,686 790,400 714 0.1%Operations 1,667,542 1,852,000 184,458 10.0%Maintenance 1,125,413 1,154,800 29,387 2.5%Water Tap In Expenses 60,078 52,000 (8,078) -15.5%Sewer Connection Expenses 85,401 36,000 (49,401) -137.2%Purchased Water 622,629 925,700 303,071 32.7%ASR-1 Water 194,537 194,400 (137) -0.1%RO Plant O&M 533,249 622,600 89,351 14.4%ASR-1 O&M 40,747 40,800 53 0.1%Professional Fees 237,182 250,000 12,818 5.1%
Vehicle 126,384 130,400 4,016 3.1%Total Departmental Expenses 9,054,136 9,657,700 603,564 6.2%Depreciation 4,481,885 4,410,000 (71,885) -1.6%Total Operating Expenses 13,536,021 14,067,700 531,679 3.8%Operating income (loss) (1,822,018) (2,006,600) 184,582 9.2%
Non-operating revenuesProperty taxes-G.O. Debt Levy 1,167,016 1,204,000 (36,984) -3.1%Property taxes-Operations Levy 901,453 930,400 (28,947) -3.1%Rental Income 80,096 80,600 (504) -0.6%Interest earned 142,313 163,700 (21,387) -13.1%Tower lease 531,703 553,200 (21,497) -3.9%Total Non-operating Revenues 2,822,581 2,931,900 (109,319) -3.7%Non-operating ExpensesInterest expense-Bonds 1,661,902 1,757,470 95,568 5.4%Bond Defeasance Amortization 214,095 238,000 23,905 10.0%Amortization of Bond Insurance 9,157 - (9,157) N/ABond Issuance Costs 38,685 76,800 38,115 49.6%Bond Premium Amortization (31) - 31 N/ATotal Non-operating Expenses 1,923,808 2,072,270 148,462 7.2%Total Non-operating Revenues/Exp. 898,773 859,630 39,143 4.6%Increase (decrease) in net assets, before capital contributions (923,245) (1,146,970) 223,725 19.5%Water Capacity Fee 195,270 55,200 140,070 253.7%Sewer Capacity Fee 281,909 254,800 27,109 10.6%Developer Contributions of Systems 1,184,597 - 1,184,597 N/AAssessments 243,609 - 243,609 N/ATotal Capital Contributions 1,905,385 310,000 1,595,385 514.6%Change in net position 982,140$ (836,970)$ 1,819,110$ 217.3%
Net position, beginning of the fiscal year 36,163,836$
Net position, June 30, 2014 37,145,976$
Fiscal Year 2014 Comparison
Favorable (Unfavorable)
Table A-1Hilton Head PSD
Budgetary Comparison ScheduleFiscal Year to Date as of June 30, 2014
(With comparative amounts for the same period in prior fiscal year) FY 2014 to FY 2014 Budget
65
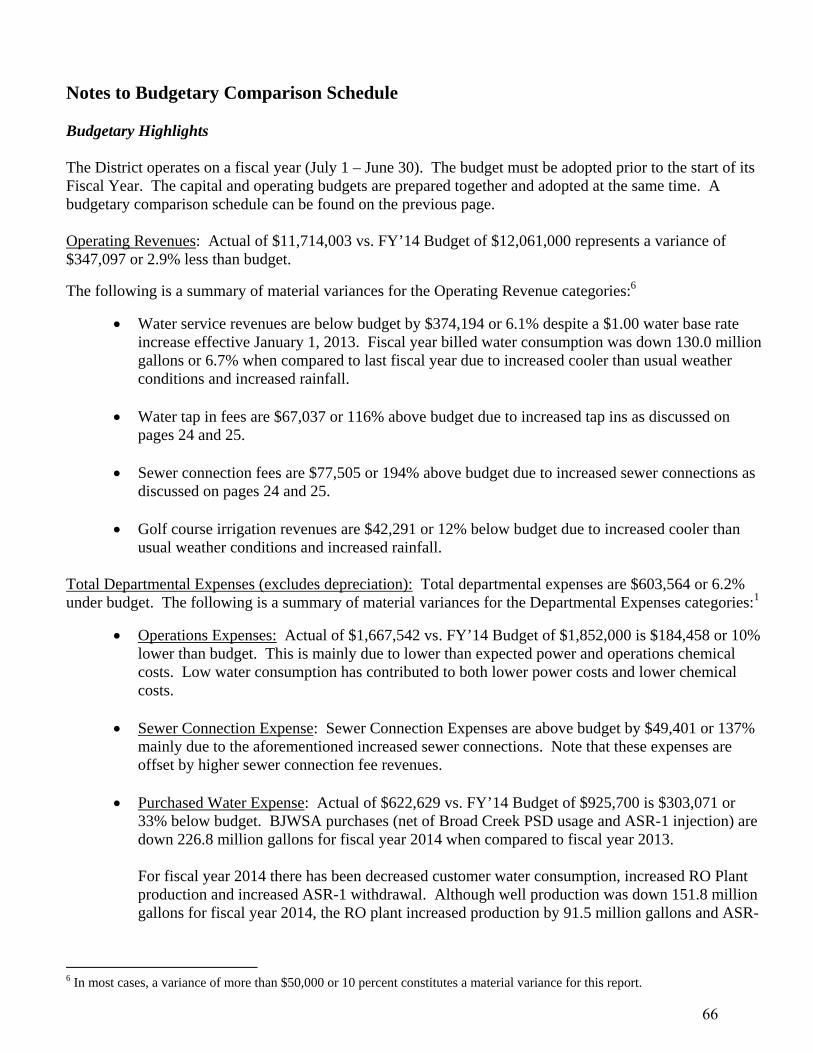
Notes to Budgetary Comparison Schedule Budgetary Highlights The District operates on a fiscal year (July 1 – June 30). The budget must be adopted prior to the start of its Fiscal Year. The capital and operating budgets are prepared together and adopted at the same time. A budgetary comparison schedule can be found on the previous page.
Operating Revenues: Actual of $11,714,003 vs. FY’14 Budget of $12,061,000 represents a variance of $347,097 or 2.9% less than budget.
The following is a summary of material variances for the Operating Revenue categories:6
Water service revenues are below budget by $374,194 or 6.1% despite a $1.00 water base rate increase effective January 1, 2013. Fiscal year billed water consumption was down 130.0 million gallons or 6.7% when compared to last fiscal year due to increased cooler than usual weather conditions and increased rainfall.
Water tap in fees are $67,037 or 116% above budget due to increased tap ins as discussed on pages 24 and 25.
Sewer connection fees are $77,505 or 194% above budget due to increased sewer connections as
discussed on pages 24 and 25. Golf course irrigation revenues are $42,291 or 12% below budget due to increased cooler than
usual weather conditions and increased rainfall.
Total Departmental Expenses (excludes depreciation): Total departmental expenses are $603,564 or 6.2% under budget. The following is a summary of material variances for the Departmental Expenses categories:1
Operations Expenses: Actual of $1,667,542 vs. FY’14 Budget of $1,852,000 is $184,458 or 10% lower than budget. This is mainly due to lower than expected power and operations chemical costs. Low water consumption has contributed to both lower power costs and lower chemical costs.
Sewer Connection Expense: Sewer Connection Expenses are above budget by $49,401 or 137% mainly due to the aforementioned increased sewer connections. Note that these expenses are offset by higher sewer connection fee revenues.
Purchased Water Expense: Actual of $622,629 vs. FY’14 Budget of $925,700 is $303,071 or
33% below budget. BJWSA purchases (net of Broad Creek PSD usage and ASR-1 injection) are down 226.8 million gallons for fiscal year 2014 when compared to fiscal year 2013.
For fiscal year 2014 there has been decreased customer water consumption, increased RO Plant production and increased ASR-1 withdrawal. Although well production was down 151.8 million gallons for fiscal year 2014, the RO plant increased production by 91.5 million gallons and ASR-
6 In most cases, a variance of more than $50,000 or 10 percent constitutes a material variance for this report.
66
1 withdrawal increased by 80.5 million gallons. The aggregate net increase from these 3 sources for fiscal year 2014 is 20.2 million gallons when compared to the same period last fiscal year.
RO Plant O&M: Actual of $533,249 vs. FY’14 Budget of $622,600 is $89,351 or 14% below
budget. The District has been able to reduce the amount of anti-scaling chemical that it uses which has reduced costs.
Total Non-Operating Revenues: Actual of $2,822,581 vs. FY’14 Budget of $2,931,900 represents a variance of $109,319 or 3.7% below budget.
Total Non-Operating Expenses: Actual of $1,923,808 vs. FY’14 Budget of $2,072,270 represents a variance of $148,462 or 7.2% below budget. This variance is mainly due to lower than budgeted bond issuance costs. Bond issuance costs that were being amortized over the life of the bonds were written off with the implementation of GASB 65 which required bond issuance costs to be expensed.
Capital Contributions: Actual Capacity Fees of $477,178 vs. FY’14 Budget of $310,000 represents a variance of $167,178 above budget. Developer contributions of systems total $1,184,597 and are a non-budgeted item. Assessments total $243,609 and are also a non-budgeted item.
Bond Disclosure: The debt service calculation is in compliance with necessary requirements and is equal to 148% as of June 30, 2014.
Fiscal year 2014’s net position was $982,140 vs. FY’14 Budget deficit of $836,970 which represents a variance of $1,819,110 above budget.
67
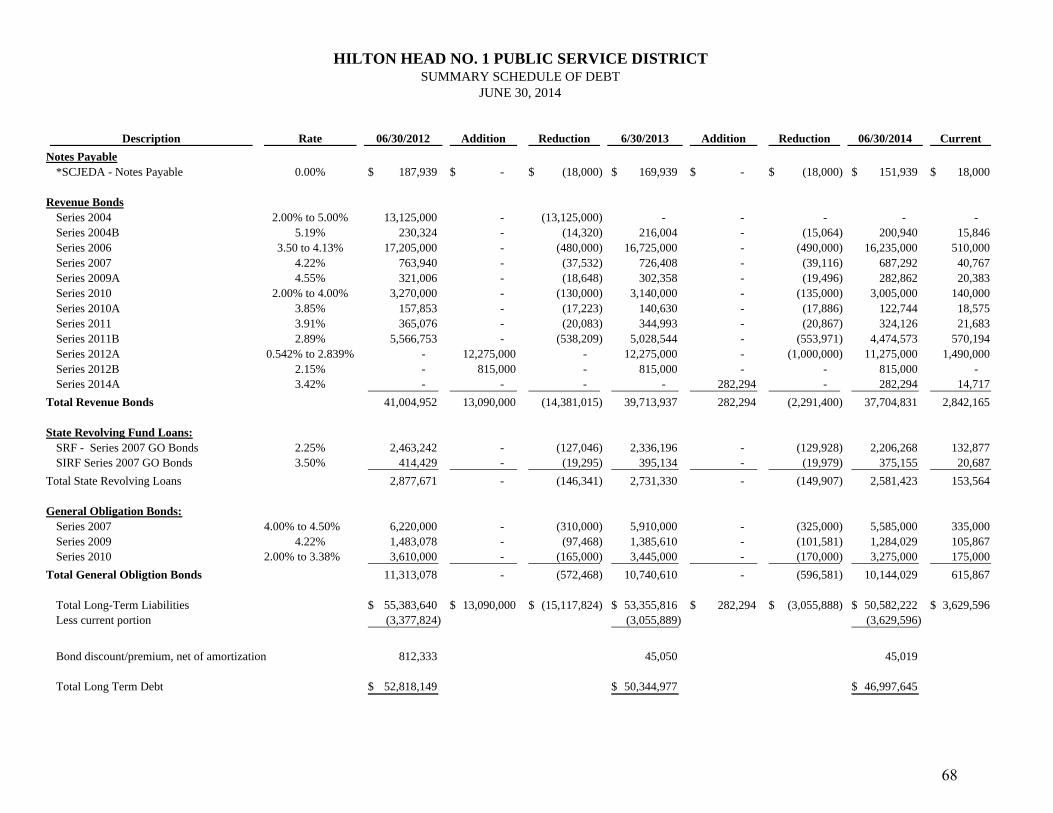
Description Rate 06/30/2012 Addition Reduction 6/30/2013 Addition Reduction 06/30/2014 Current
Notes Payable*SCJEDA - Notes Payable 0.00% 187,939$ -$ (18,000)$ 169,939$ -$ (18,000)$ 151,939$ 18,000$
Revenue BondsSeries 2004 2.00% to 5.00% 13,125,000 - (13,125,000) - - - - - Series 2004B 5.19% 230,324 - (14,320) 216,004 - (15,064) 200,940 15,846 Series 2006 3.50 to 4.13% 17,205,000 - (480,000) 16,725,000 - (490,000) 16,235,000 510,000 Series 2007 4.22% 763,940 - (37,532) 726,408 - (39,116) 687,292 40,767 Series 2009A 4.55% 321,006 - (18,648) 302,358 - (19,496) 282,862 20,383 Series 2010 2.00% to 4.00% 3,270,000 - (130,000) 3,140,000 - (135,000) 3,005,000 140,000 Series 2010A 3.85% 157,853 - (17,223) 140,630 - (17,886) 122,744 18,575 Series 2011 3.91% 365,076 - (20,083) 344,993 - (20,867) 324,126 21,683 Series 2011B 2.89% 5,566,753 - (538,209) 5,028,544 - (553,971) 4,474,573 570,194 Series 2012A 0.542% to 2.839% - 12,275,000 - 12,275,000 - (1,000,000) 11,275,000 1,490,000 Series 2012B 2.15% - 815,000 - 815,000 - - 815,000 - Series 2014A 3.42% - - - - 282,294 - 282,294 14,717
Total Revenue Bonds 41,004,952 13,090,000 (14,381,015) 39,713,937 282,294 (2,291,400) 37,704,831 2,842,165
State Revolving Fund Loans:SRF - Series 2007 GO Bonds 2.25% 2,463,242 - (127,046) 2,336,196 - (129,928) 2,206,268 132,877 SIRF Series 2007 GO Bonds 3.50% 414,429 - (19,295) 395,134 - (19,979) 375,155 20,687
Total State Revolving Loans 2,877,671 - (146,341) 2,731,330 - (149,907) 2,581,423 153,564
General Obligation Bonds:Series 2007 4.00% to 4.50% 6,220,000 - (310,000) 5,910,000 - (325,000) 5,585,000 335,000 Series 2009 4.22% 1,483,078 - (97,468) 1,385,610 - (101,581) 1,284,029 105,867 Series 2010 2.00% to 3.38% 3,610,000 - (165,000) 3,445,000 - (170,000) 3,275,000 175,000
Total General Obligtion Bonds 11,313,078 - (572,468) 10,740,610 - (596,581) 10,144,029 615,867
Total Long-Term Liabilities 55,383,640$ 13,090,000$ (15,117,824)$ 53,355,816$ 282,294$ (3,055,888)$ 50,582,222$ 3,629,596$ Less current portion (3,377,824) (3,055,889) (3,629,596)
Bond discount/premium, net of amortization 812,333 45,050 45,019
Total Long Term Debt 52,818,149$ 50,344,977$ 46,997,645$
HILTON HEAD NO. 1 PUBLIC SERVICE DISTRICTSUMMARY SCHEDULE OF DEBT
JUNE 30, 2014
68
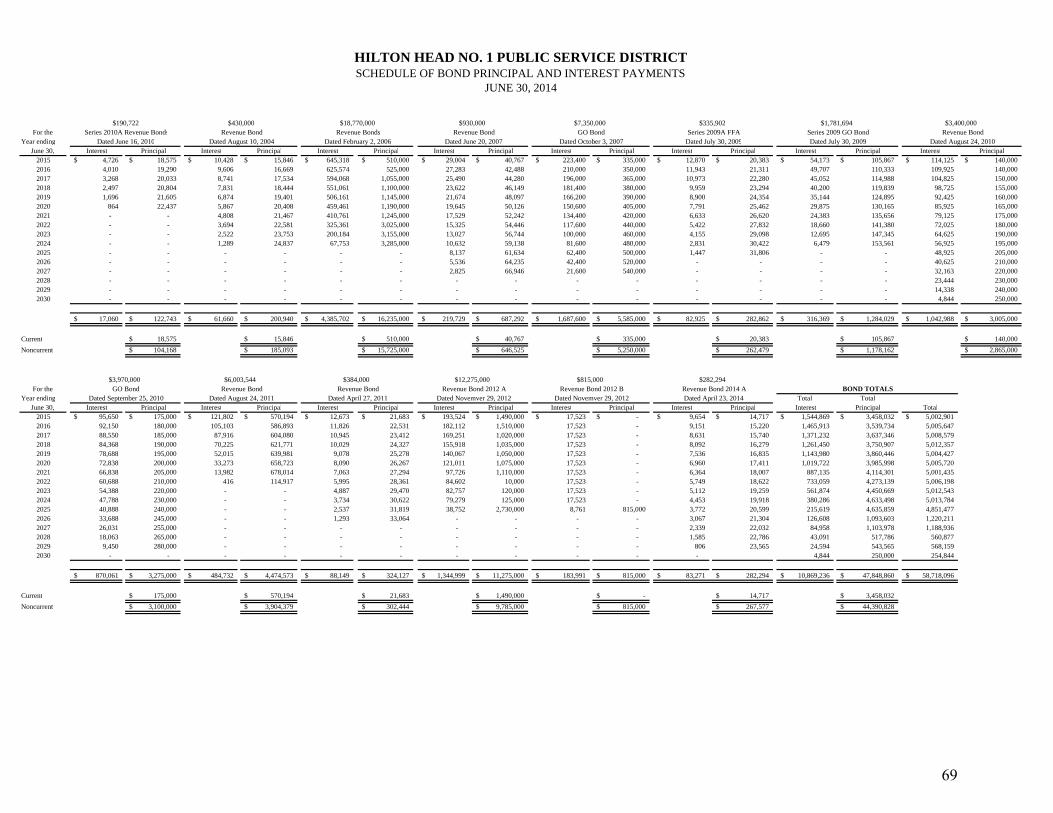
$190,722 $335,902For the Series 2010A Revenue Bonds
Year ending Dated June 16, 2010 Dated July 30, 2009June 30, Interest Principal Interest Principal Interest Principal Interest Principal Interest Principal Interest Principal Interest Principal Interest Principal
2015 4,726$ 18,575$ 10,428$ 15,846$ 645,318$ 510,000$ 29,004$ 40,767$ 223,400$ 335,000$ 12,870$ 20,383$ 54,173$ 105,867$ 114,125$ 140,000$ 2016 4,010 19,290 9,606 16,669 625,574 525,000 27,283 42,488 210,000 350,000 11,943 21,311 49,707 110,333 109,925 140,0002017 3,268 20,033 8,741 17,534 594,068 1,055,000 25,490 44,280 196,000 365,000 10,973 22,280 45,052 114,988 104,825 150,0002018 2,497 20,804 7,831 18,444 551,061 1,100,000 23,622 46,149 181,400 380,000 9,959 23,294 40,200 119,839 98,725 155,0002019 1,696 21,605 6,874 19,401 506,161 1,145,000 21,674 48,097 166,200 390,000 8,900 24,354 35,144 124,895 92,425 160,0002020 864 22,437 5,867 20,408 459,461 1,190,000 19,645 50,126 150,600 405,000 7,791 25,462 29,875 130,165 85,925 165,0002021 - - 4,808 21,467 410,761 1,245,000 17,529 52,242 134,400 420,000 6,633 26,620 24,383 135,656 79,125 175,0002022 - - 3,694 22,581 325,361 3,025,000 15,325 54,446 117,600 440,000 5,422 27,832 18,660 141,380 72,025 180,0002023 - - 2,522 23,753 200,184 3,155,000 13,027 56,744 100,000 460,000 4,155 29,098 12,695 147,345 64,625 190,0002024 - - 1,289 24,837 67,753 3,285,000 10,632 59,138 81,600 480,000 2,831 30,422 6,479 153,561 56,925 195,0002025 - - - - - - 8,137 61,634 62,400 500,000 1,447 31,806 - - 48,925 205,0002026 - - - - - - 5,536 64,235 42,400 520,000 - - - - 40,625 210,0002027 - - - - - - 2,825 66,946 21,600 540,000 - - - - 32,163 220,0002028 - - - - - - - - - - - - - - 23,444 230,000 2029 - - - - - - - - - - - - - - 14,338 240,000 2030 - - - - - - - - - - - - - - 4,844 250,000
17,060$ 122,743$ 61,660$ 200,940$ 4,385,702$ 16,235,000$ 219,729$ 687,292$ 1,687,600$ 5,585,000$ 82,925$ 282,862$ 316,369$ 1,284,029$ 1,042,988$ 3,005,000$
Current 18,575$ 15,846$ 510,000$ 40,767$ 335,000$ 20,383$ 105,867$ 140,000$
Noncurrent 104,168$ 185,093$ 15,725,000$ 646,525$ 5,250,000$ 262,479$ 1,178,162$ 2,865,000$
For the Year ending Total Total
June 30, Interest Principal Interest Principal Interest Principal Interest Principal Interest Principal Interest Principal Interest Principal Total2015 95,650$ 175,000$ 121,802$ 570,194$ 12,673$ 21,683$ 193,524$ 1,490,000$ 17,523$ -$ 9,654$ 14,717$ 1,544,869$ 3,458,032$ 5,002,901$ 2016 92,150 180,000 105,103 586,893 11,826 22,531 182,112 1,510,000 17,523 - 9,151 15,220 1,465,913 3,539,734 5,005,647 2017 88,550 185,000 87,916 604,080 10,945 23,412 169,251 1,020,000 17,523 - 8,631 15,740 1,371,232 3,637,346 5,008,579 2018 84,368 190,000 70,225 621,771 10,029 24,327 155,918 1,035,000 17,523 - 8,092 16,279 1,261,450 3,750,907 5,012,357 2019 78,688 195,000 52,015 639,981 9,078 25,278 140,067 1,050,000 17,523 - 7,536 16,835 1,143,980 3,860,446 5,004,427 2020 72,838 200,000 33,273 658,723 8,090 26,267 121,011 1,075,000 17,523 - 6,960 17,411 1,019,722 3,985,998 5,005,720 2021 66,838 205,000 13,982 678,014 7,063 27,294 97,726 1,110,000 17,523 - 6,364 18,007 887,135 4,114,301 5,001,435 2022 60,688 210,000 416 114,917 5,995 28,361 84,602 10,000 17,523 - 5,749 18,622 733,059 4,273,139 5,006,198 2023 54,388 220,000 - - 4,887 29,470 82,757 120,000 17,523 - 5,112 19,259 561,874 4,450,669 5,012,543 2024 47,788 230,000 - - 3,734 30,622 79,279 125,000 17,523 - 4,453 19,918 380,286 4,633,498 5,013,784 2025 40,888 240,000 - - 2,537 31,819 38,752 2,730,000 8,761 815,000 3,772 20,599 215,619 4,635,859 4,851,477 2026 33,688 245,000 - - 1,293 33,064 - - - - 3,067 21,304 126,608 1,093,603 1,220,211 2027 26,031 255,000 - - - - - - - - 2,339 22,032 84,958 1,103,978 1,188,936 2028 18,063 265,000 - - - - - - - - 1,585 22,786 43,091 517,786 560,877 2029 9,450 280,000 - - - - - - - - 806 23,565 24,594 543,565 568,159 2030 - - - - - - - - - - - 4,844 250,000 254,844
870,061$ 3,275,000$ 484,732$ 4,474,573$ 88,149$ 324,127$ 1,344,999$ 11,275,000$ 183,991$ 815,000$ 83,271$ 282,294$ 10,869,236$ 47,848,860$ 58,718,096$
Current 175,000$ 570,194$ 21,683$ 1,490,000$ -$ 14,717$ 3,458,032$
Noncurrent 3,100,000$ 3,904,379$ 302,444$ 9,785,000$ 815,000$ 267,577$ 44,390,828$
Dated September 25, 2010GO Bond
$3,970,000 $282,294Revenue Bond 2014 ADated April 23, 2014
BOND TOTALSRevenue Bond 2012 B$815,000
Dated Novemver 29, 2012
Dated August 10, 2004
$12,275,000Revenue Bond 2012 A
Dated Novemver 29, 2012Dated April 27, 2011Revenue Bond
$384,000
Dated August 24, 2011Revenue Bond$6,003,544
Dated August 24, 2010Dated July 30, 2009
$18,770,000Revenue Bonds
Dated February 2, 2006
$930,000Revenue Bond
Dated June 20, 2007 Dated October 3, 2007GO Bond Series 2009A FFA
HILTON HEAD NO. 1 PUBLIC SERVICE DISTRICTSCHEDULE OF BOND PRINCIPAL AND INTEREST PAYMENTS
JUNE 30, 2014
$430,000Revenue Bond
$7,350,000 $1,781,694Series 2009 GO Bond
$3,400,000Revenue Bond
69
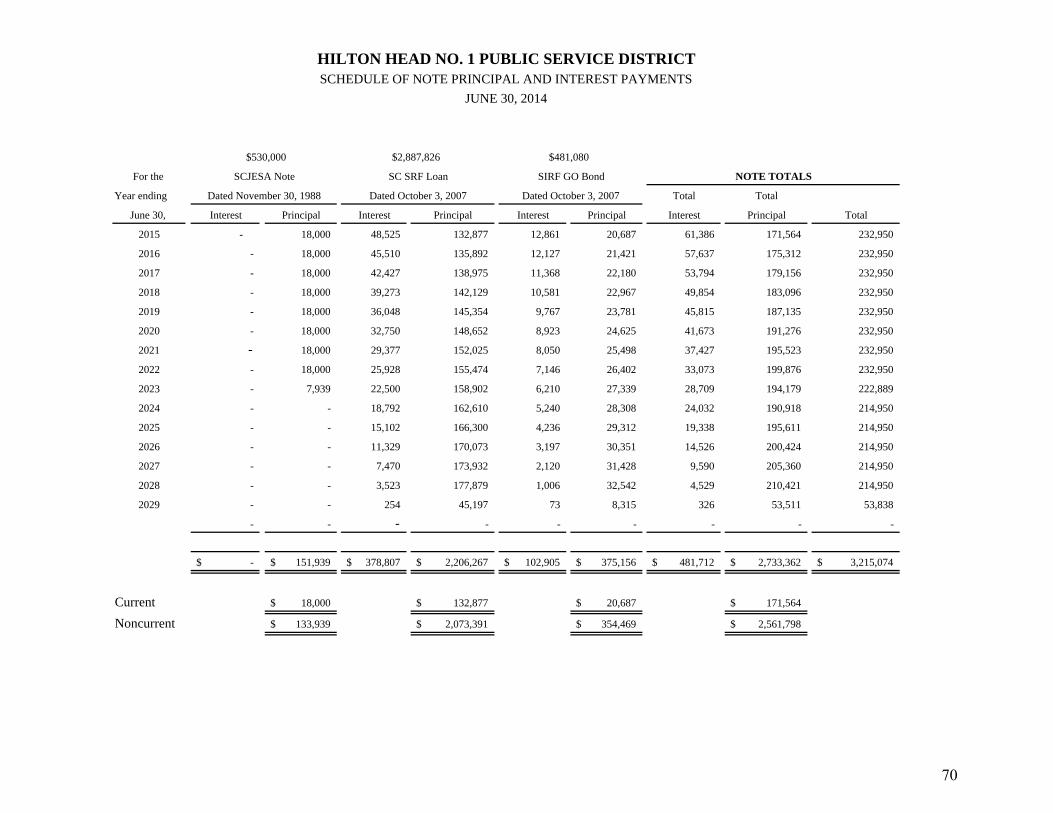
$530,000 $2,887,826 $481,080
For the SCJESA Note
Year ending Dated November 30, 1988 Dated October 3, 2007 Dated October 3, 2007 Total Total
June 30, Interest Principal Interest Principal Interest Principal Interest Principal Total
2015 - 18,000 48,525 132,877 12,861 20,687 61,386 171,564 232,950
2016 - 18,000 45,510 135,892 12,127 21,421 57,637 175,312 232,950
2017 - 18,000 42,427 138,975 11,368 22,180 53,794 179,156 232,950
2018 - 18,000 39,273 142,129 10,581 22,967 49,854 183,096 232,950
2019 - 18,000 36,048 145,354 9,767 23,781 45,815 187,135 232,950
2020 - 18,000 32,750 148,652 8,923 24,625 41,673 191,276 232,950
2021 - 18,000 29,377 152,025 8,050 25,498 37,427 195,523 232,950
2022 - 18,000 25,928 155,474 7,146 26,402 33,073 199,876 232,950
2023 - 7,939 22,500 158,902 6,210 27,339 28,709 194,179 222,889
2024 - - 18,792 162,610 5,240 28,308 24,032 190,918 214,950
2025 - - 15,102 166,300 4,236 29,312 19,338 195,611 214,950
2026 - - 11,329 170,073 3,197 30,351 14,526 200,424 214,950
2027 - - 7,470 173,932 2,120 31,428 9,590 205,360 214,950
2028 - - 3,523 177,879 1,006 32,542 4,529 210,421 214,950
2029 - - 254 45,197 73 8,315 326 53,511 53,838
- - - - - - - - -
-$ 151,939$ 378,807$ 2,206,267$ 102,905$ 375,156$ 481,712$ 2,733,362$ 3,215,074$
Current 18,000$ 132,877$ 20,687$ 171,564$
Noncurrent 133,939$ 2,073,391$ 354,469$ 2,561,798$
NOTE TOTALS
HILTON HEAD NO. 1 PUBLIC SERVICE DISTRICTSCHEDULE OF NOTE PRINCIPAL AND INTEREST PAYMENTS
JUNE 30, 2014
SC SRF Loan SIRF GO Bond
70
STATISTICAL SECTION
71
Statistical Table of Contents 7 Financial Trends – These schedules contain trend information to help the reader understand how the District’s financial performance and position have changed over time:
Statement of Revenues, Expenses, and Debt Service per Bond Covenants ................ 74
Schedule of Change in Net Position ............................................................................... 75
Net Position at End of Year ............................................................................................ 75
Net Position by Component ............................................................................................ 76
Ratio Analysis .................................................................................................................. 76
Outstanding Debt by Debt Type ..................................................................................... 77
Debt Service Coverage Analysis ..................................................................................... 78
Capital Assets – These schedules contain infrastructure data which shows how the District’s financial reports relate to its activities:
Schedule of Changes in Capital Assets .......................................................................... 79
Schedule of Net Property, Plant & Equipment ............................................................. 79
Demographic and Economic Information – These schedules offer demographic and economic indicators showing the environment in which the District operates:
Customer Statistics at Fiscal Year-End ......................................................................... 80
Billings at Fiscal Year-End (Just Water, No Irrigation) .............................................. 81
Billings at Fiscal Year-End (Water and Irrigation) ..................................................... 81
Water/Irrigation Customers vs. Water/Irrigation Kgal Sales ..................................... 82
Sewer Customers vs. Wastewater Kgal Sales ............................................................... 82
Water and Wastewater Rate Comparisons ................................................................... 83
Water/Wastewater Bill History (Residential Customers Using 10 Kgals/Month) .... 84
Water and Sewer Installation Fees ................................................................................ 84
7 In some cases in certain tables less than 10 years of data is illustrated due to the unavailability of information and/or the implementation GASB No.34 in fiscal year 2004.
72
Statistical Table of Contents (continued)
Population per Capita Income ........................................................................................ 85
Beaufort County Top Employers 2013 .......................................................................... 85
Beaufort County Labor Force and Employment .......................................................... 85
Unemployment Rate Comparison .................................................................................. 86
Debt Capacity – These schedules present information to help the reader assess the affordability of the District’s current level of outstanding debt and the District’s ability to issue additional debt in the future:
The District’s Millage History ........................................................................................ 86
Ratio of (net) General Bonded Debt .............................................................................. 86
General Obligation Outstanding Debt ........................................................................... 87
Overlapping Debt ............................................................................................................ 88
Assessed Values of the District ....................................................................................... 88
Calendar Year 2013 Market Value for the District ...................................................... 89
Tax Collection Record for the District .......................................................................... 89
District Largest Taxpayers ............................................................................................. 90
Other Operational Information – These schedules contain operational and service information to convey how the District’s financial reports relate to its services:
District Ten Top Water/Irrigation Users ...................................................................... 91
District Ten Top Wastewater Users ............................................................................... 91
Rainfall (Inches) vs. Water/Irrigation Kgal Sales ........................................................ 92
BJWSA-Purchased Water Expense Summary ............................................................. 93
73
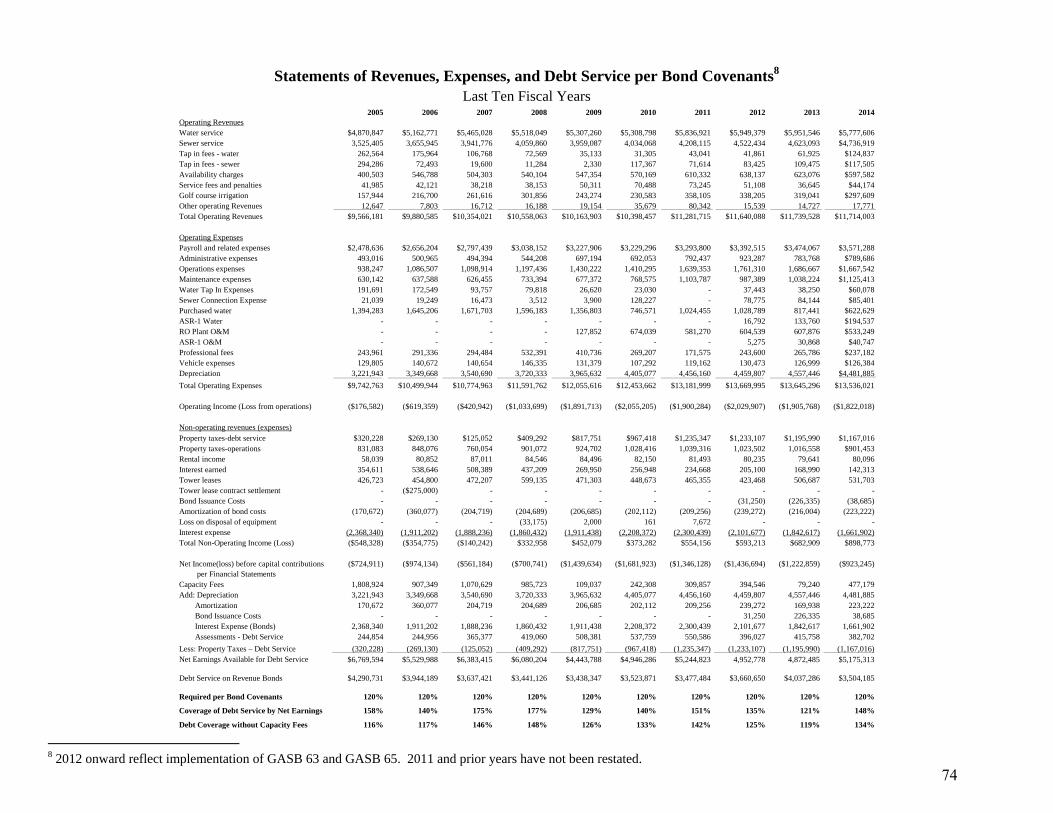
Statements of Revenues, Expenses, and Debt Service per Bond Covenants8 Last Ten Fiscal Years
2005 2006 2007 2008 2009 2010 2011 2012 2013 2014Operating RevenuesWater service $4,870,847 $5,162,771 $5,465,028 $5,518,049 $5,307,260 $5,308,798 $5,836,921 $5,949,379 $5,951,546 $5,777,606 Sewer service 3,525,405 3,655,945 3,941,776 4,059,860 3,959,087 4,034,068 4,208,115 4,522,434 4,623,093 $4,736,919 Tap in fees - water 262,564 175,964 106,768 72,569 35,133 31,305 43,041 41,861 61,925 $124,837 Tap in fees - sewer 294,286 72,493 19,600 11,284 2,330 117,367 71,614 83,425 109,475 $117,505 Availability charges 400,503 546,788 504,303 540,104 547,354 570,169 610,332 638,137 623,076 $597,582 Service fees and penalties 41,985 42,121 38,218 38,153 50,311 70,488 73,245 51,108 36,645 $44,174 Golf course irrigation 157,944 216,700 261,616 301,856 243,274 230,583 358,105 338,205 319,041 $297,609 Other operating Revenues 12,647 7,803 16,712 16,188 19,154 35,679 80,342 15,539 14,727 17,771 Total Operating Revenues $9,566,181 $9,880,585 $10,354,021 $10,558,063 $10,163,903 $10,398,457 $11,281,715 $11,640,088 $11,739,528 $11,714,003
Operating ExpensesPayroll and related expenses $2,478,636 $2,656,204 $2,797,439 $3,038,152 $3,227,906 $3,229,296 $3,293,800 $3,392,515 $3,474,067 $3,571,288 Administrative expenses 493,016 500,965 494,394 544,208 697,194 692,053 792,437 923,287 783,768 $789,686 Operations expenses 938,247 1,086,507 1,098,914 1,197,436 1,430,222 1,410,295 1,639,353 1,761,310 1,686,667 $1,667,542 Maintenance expenses 630,142 637,588 626,455 733,394 677,372 768,575 1,103,787 987,389 1,038,224 $1,125,413 Water Tap In Expenses 191,691 172,549 93,757 79,818 26,620 23,030 - 37,443 38,250 $60,078 Sewer Connection Expense 21,039 19,249 16,473 3,512 3,900 128,227 - 78,775 84,144 $85,401 Purchased water 1,394,283 1,645,206 1,671,703 1,596,183 1,356,803 746,571 1,024,455 1,028,789 817,441 $622,629 ASR-1 Water - - - - - - - 16,792 133,760 $194,537 RO Plant O&M - - - - 127,852 674,039 581,270 604,539 607,876 $533,249 ASR-1 O&M - - - - - - - 5,275 30,868 $40,747 Professional fees 243,961 291,336 294,484 532,391 410,736 269,207 171,575 243,600 265,786 $237,182 Vehicle expenses 129,805 140,672 140,654 146,335 131,379 107,292 119,162 130,473 126,999 $126,384 Depreciation 3,221,943 3,349,668 3,540,690 3,720,333 3,965,632 4,405,077 4,456,160 4,459,807 4,557,446 $4,481,885
Total Operating Expenses $9,742,763 $10,499,944 $10,774,963 $11,591,762 $12,055,616 $12,453,662 $13,181,999 $13,669,995 $13,645,296 $13,536,021
Operating Income (Loss from operations) ($176,582) ($619,359) ($420,942) ($1,033,699) ($1,891,713) ($2,055,205) ($1,900,284) ($2,029,907) ($1,905,768) ($1,822,018)
Non-operating revenues (expenses)Property taxes-debt service $320,228 $269,130 $125,052 $409,292 $817,751 $967,418 $1,235,347 $1,233,107 $1,195,990 $1,167,016 Property taxes-operations 831,083 848,076 760,054 901,072 924,702 1,028,416 1,039,316 1,023,502 1,016,558 $901,453 Rental income 58,039 80,852 87,011 84,546 84,496 82,150 81,493 80,235 79,641 80,096Interest earned 354,611 538,646 508,389 437,209 269,950 256,948 234,668 205,100 168,990 142,313Tower leases 426,723 454,800 472,207 599,135 471,303 448,673 465,355 423,468 506,687 531,703Tower lease contract settlement - ($275,000) - - - - - - - - Bond Issuance Costs - - - - - - - (31,250) (226,335) (38,685)Amortization of bond costs (170,672) (360,077) (204,719) (204,689) (206,685) (202,112) (209,256) (239,272) (216,004) (223,222)Loss on disposal of equipment - - - (33,175) 2,000 161 7,672 - - - Interest expense (2,368,340) (1,911,202) (1,888,236) (1,860,432) (1,911,438) (2,208,372) (2,300,439) (2,101,677) (1,842,617) (1,661,902)Total Non-Operating Income (Loss) ($548,328) ($354,775) ($140,242) $332,958 $452,079 $373,282 $554,156 $593,213 $682,909 $898,773
Net Income(loss) before capital contributions ($724,911) ($974,134) ($561,184) ($700,741) ($1,439,634) ($1,681,923) ($1,346,128) ($1,436,694) ($1,222,859) ($923,245) per Financial StatementsCapacity Fees 1,808,924 907,349 1,070,629 985,723 109,037 242,308 309,857 394,546 79,240 477,179 Add: Depreciation 3,221,943 3,349,668 3,540,690 3,720,333 3,965,632 4,405,077 4,456,160 4,459,807 4,557,446 4,481,885
Amortization 170,672 360,077 204,719 204,689 206,685 202,112 209,256 239,272 169,938 223,222 Bond Issuance Costs - - - - - - - 31,250 226,335 38,685 Interest Expense (Bonds) 2,368,340 1,911,202 1,888,236 1,860,432 1,911,438 2,208,372 2,300,439 2,101,677 1,842,617 1,661,902 Assessments - Debt Service 244,854 244,956 365,377 419,060 508,381 537,759 550,586 396,027 415,758 382,702
Less: Property Taxes – Debt Service (320,228) (269,130) (125,052) (409,292) (817,751) (967,418) (1,235,347) (1,233,107) (1,195,990) (1,167,016)Net Earnings Available for Debt Service $6,769,594 $5,529,988 $6,383,415 $6,080,204 $4,443,788 $4,946,286 $5,244,823 4,952,778 4,872,485 $5,175,313
Debt Service on Revenue Bonds $4,290,731 $3,944,189 $3,637,421 $3,441,126 $3,438,347 $3,523,871 $3,477,484 $3,660,650 $4,037,286 $3,504,185
Required per Bond Covenants 120% 120% 120% 120% 120% 120% 120% 120% 120% 120%
Coverage of Debt Service by Net Earnings 158% 140% 175% 177% 129% 140% 151% 135% 121% 148%
Debt Coverage without Capacity Fees 116% 117% 146% 148% 126% 133% 142% 125% 119% 134% 8 2012 onward reflect implementation of GASB 63 and GASB 65. 2011 and prior years have not been restated.
74
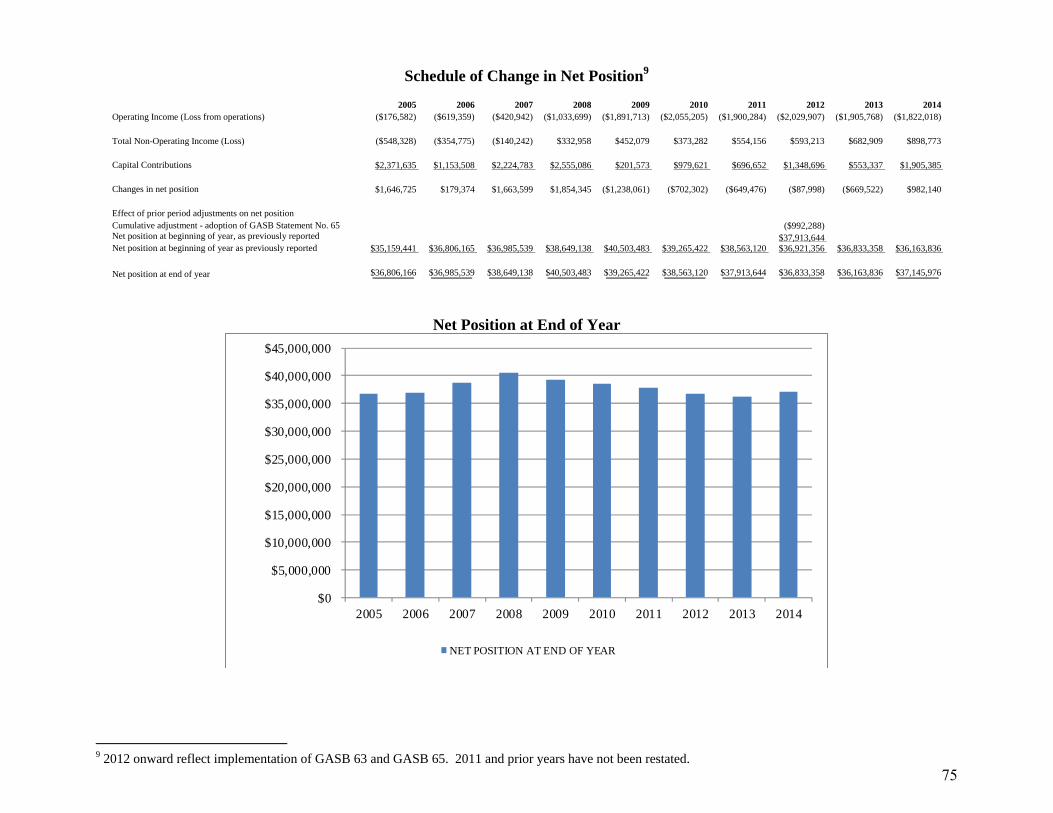
Schedule of Change in Net Position9
2005 2006 2007 2008 2009 2010 2011 2012 2013 2014Operating Income (Loss from operations) ($176,582) ($619,359) ($420,942) ($1,033,699) ($1,891,713) ($2,055,205) ($1,900,284) ($2,029,907) ($1,905,768) ($1,822,018)
Total Non-Operating Income (Loss) ($548,328) ($354,775) ($140,242) $332,958 $452,079 $373,282 $554,156 $593,213 $682,909 $898,773
Capital Contributions $2,371,635 $1,153,508 $2,224,783 $2,555,086 $201,573 $979,621 $696,652 $1,348,696 $553,337 $1,905,385
Changes in net position $1,646,725 $179,374 $1,663,599 $1,854,345 ($1,238,061) ($702,302) ($649,476) ($87,998) ($669,522) $982,140
Effect of prior period adjustments on net positionCumulative adjustment - adoption of GASB Statement No. 65 ($992,288)Net position at beginning of year, as previously reported $37,913,644 Net position at beginning of year as previously reported $35,159,441 $36,806,165 $36,985,539 $38,649,138 $40,503,483 $39,265,422 $38,563,120 $36,921,356 $36,833,358 $36,163,836
Net position at end of year $36,806,166 $36,985,539 $38,649,138 $40,503,483 $39,265,422 $38,563,120 $37,913,644 $36,833,358 $36,163,836 $37,145,976
Net Position at End of Year
$0
$5,000,000
$10,000,000
$15,000,000
$20,000,000
$25,000,000
$30,000,000
$35,000,000
$40,000,000
$45,000,000
2005 2006 2007 2008 2009 2010 2011 2012 2013 2014
NET POSITION AT END OF YEAR
9 2012 onward reflect implementation of GASB 63 and GASB 65. 2011 and prior years have not been restated.
75
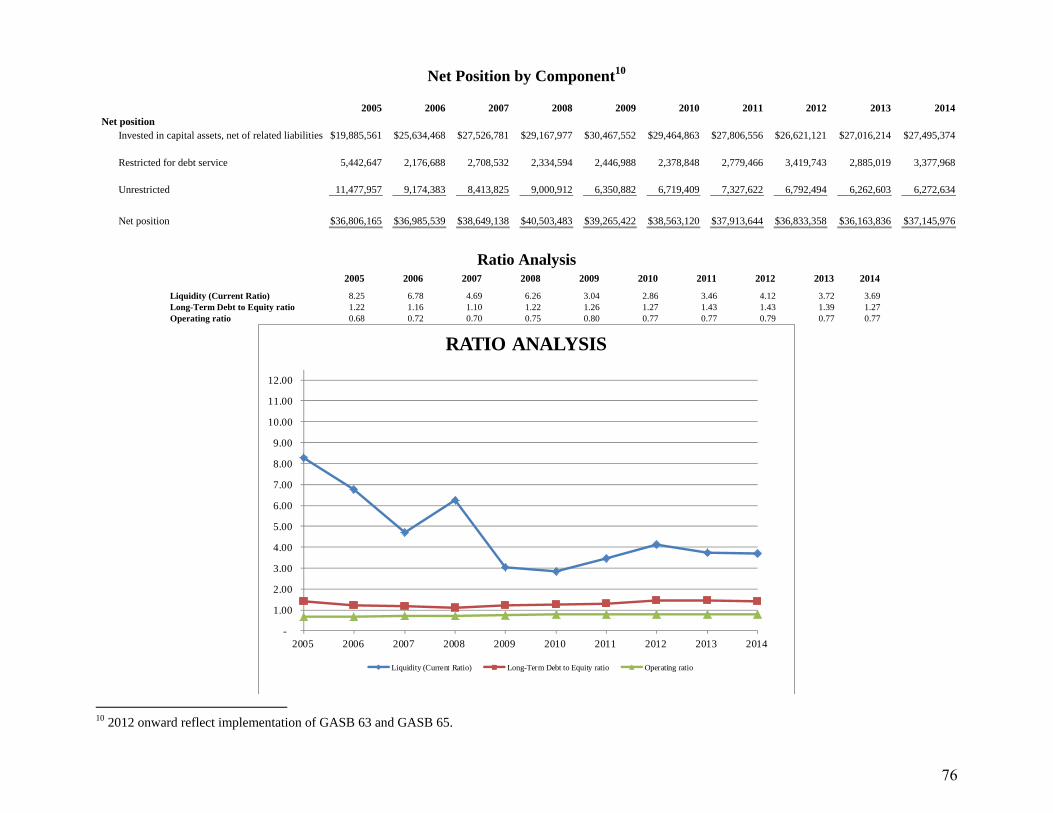
Net Position by Component10
2005 2006 2007 2008 2009 2010 2011 2012 2013 2014Net position
Invested in capital assets, net of related liabilities 19,885,561$ 25,634,468$ 27,526,781$ 29,167,977$ 30,467,552$ 29,464,863$ 27,806,556$ 26,621,121$ 27,016,214$ 27,495,374$
Restricted for debt service 5,442,647 2,176,688 2,708,532 2,334,594 2,446,988 2,378,848 2,779,466 3,419,743 2,885,019 3,377,968
Unrestricted 11,477,957 9,174,383 8,413,825 9,000,912 6,350,882 6,719,409 7,327,622 6,792,494 6,262,603 6,272,634
Net position 36,806,165$ 36,985,539$ 38,649,138$ 40,503,483$ 39,265,422$ 38,563,120$ 37,913,644$ 36,833,358$ 36,163,836$ 37,145,976$
Ratio Analysis
2005 2006 2007 2008 2009 2010 2011 2012 2013 2014
Liquidity (Current Ratio) 8.25 6.78 4.69 6.26 3.04 2.86 3.46 4.12 3.72 3.69 Long-Term Debt to Equity ratio 1.22 1.16 1.10 1.22 1.26 1.27 1.43 1.43 1.39 1.27 Operating ratio 0.68 0.72 0.70 0.75 0.80 0.77 0.77 0.79 0.77 0.77
-
1.00
2.00
3.00
4.00
5.00
6.00
7.00
8.00
9.00
10.00
11.00
12.00
2005 2006 2007 2008 2009 2010 2011 2012 2013 2014
RATIO ANALYSIS
Liquidity (Current Ratio) Long-Term Debt to Equity ratio Operating ratio
10 2012 onward reflect implementation of GASB 63 and GASB 65.
76
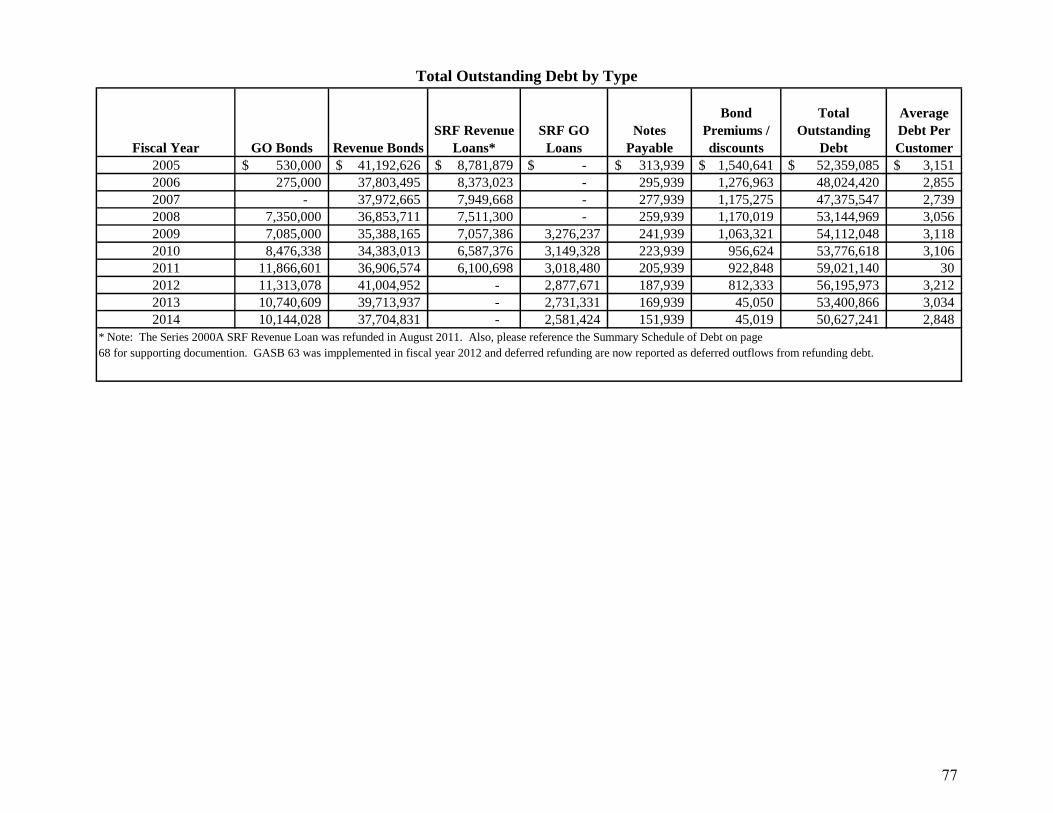
Total Outstanding Debt by Type
Fiscal Year GO Bonds Revenue BondsSRF Revenue
Loans*SRF GO
LoansNotes
Payable
Bond Premiums / discounts
Total Outstanding
Debt
Average Debt Per Customer
2005 530,000$ 41,192,626$ 8,781,879$ -$ 313,939$ 1,540,641$ 52,359,085$ 3,151$ 2006 275,000 37,803,495 8,373,023 - 295,939 1,276,963 48,024,420 2,855 2007 - 37,972,665 7,949,668 - 277,939 1,175,275 47,375,547 2,739 2008 7,350,000 36,853,711 7,511,300 - 259,939 1,170,019 53,144,969 3,056 2009 7,085,000 35,388,165 7,057,386 3,276,237 241,939 1,063,321 54,112,048 3,118 2010 8,476,338 34,383,013 6,587,376 3,149,328 223,939 956,624 53,776,618 3,106 2011 11,866,601 36,906,574 6,100,698 3,018,480 205,939 922,848 59,021,140 30 2012 11,313,078 41,004,952 - 2,877,671 187,939 812,333 56,195,973 3,212 2013 10,740,609 39,713,937 - 2,731,331 169,939 45,050 53,400,866 3,034 2014 10,144,028 37,704,831 - 2,581,424 151,939 45,019 50,627,241 2,848
* Note: The Series 2000A SRF Revenue Loan was refunded in August 2011. Also, please reference the Summary Schedule of Debt on page68 for supporting documention. GASB 63 was impplemented in fiscal year 2012 and deferred refunding are now reported as deferred outflows from refunding debt.
77
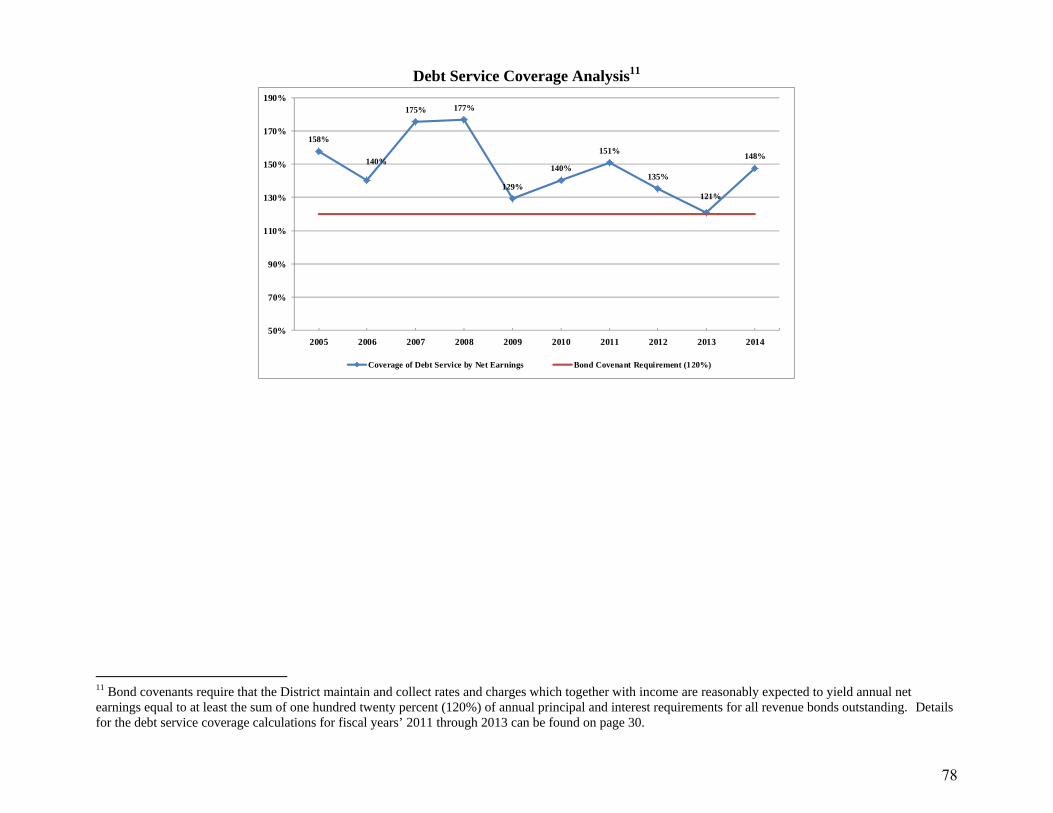
Debt Service Coverage Analysis11
158%
140%
175% 177%
129%
140%
151%
135%
121%
148%
50%
70%
90%
110%
130%
150%
170%
190%
2005 2006 2007 2008 2009 2010 2011 2012 2013 2014
Coverage of Debt Service by Net Earnings Bond Covenant Requirement (120%)
11 Bond covenants require that the District maintain and collect rates and charges which together with income are reasonably expected to yield annual net earnings equal to at least the sum of one hundred twenty percent (120%) of annual principal and interest requirements for all revenue bonds outstanding. Details for the debt service coverage calculations for fiscal years’ 2011 through 2013 can be found on page 30.
78
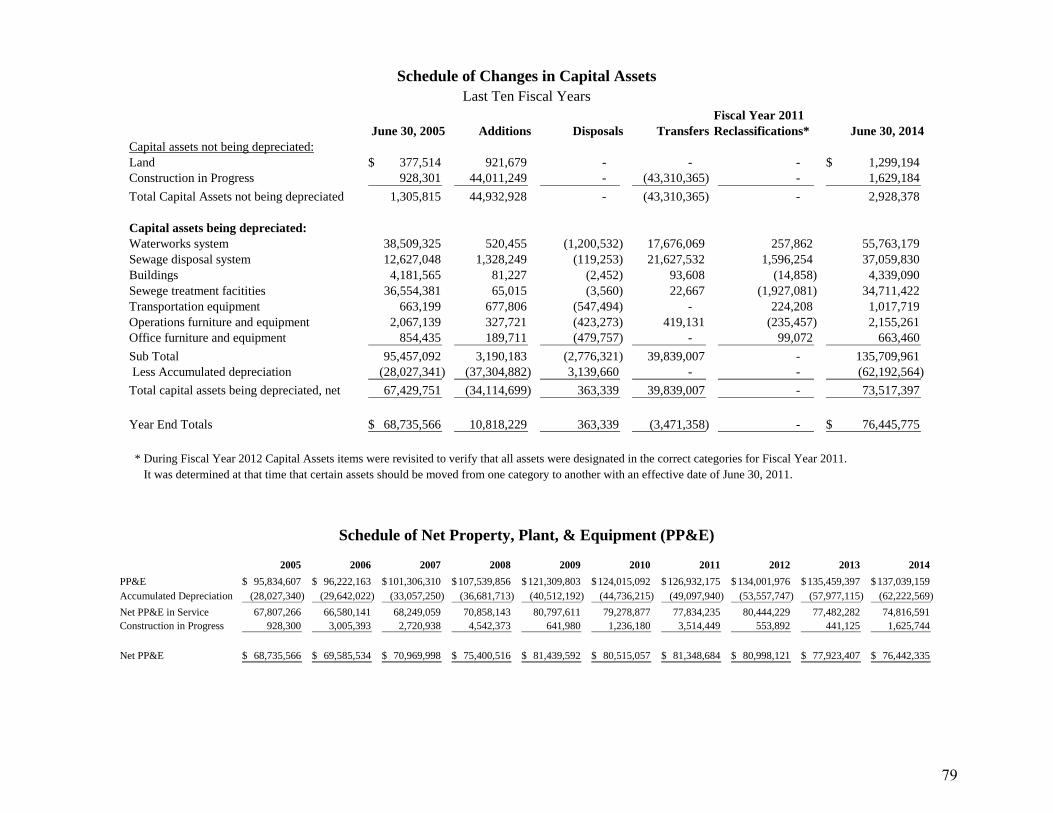
Schedule of Changes in Capital Assets Last Ten Fiscal Years
Fiscal Year 2011June 30, 2005 Additions Disposals Transfers Reclassifications* June 30, 2014
Capital assets not being depreciated:Land 377,514$ 921,679 - - - 1,299,194$ Construction in Progress 928,301 44,011,249 - (43,310,365) - 1,629,184
Total Capital Assets not being depreciated 1,305,815 44,932,928 - (43,310,365) - 2,928,378
Capital assets being depreciated:Waterworks system 38,509,325 520,455 (1,200,532) 17,676,069 257,862 55,763,179 Sewage disposal system 12,627,048 1,328,249 (119,253) 21,627,532 1,596,254 37,059,830 Buildings 4,181,565 81,227 (2,452) 93,608 (14,858) 4,339,090 Sewege treatment facitities 36,554,381 65,015 (3,560) 22,667 (1,927,081) 34,711,422 Transportation equipment 663,199 677,806 (547,494) - 224,208 1,017,719 Operations furniture and equipment 2,067,139 327,721 (423,273) 419,131 (235,457) 2,155,261 Office furniture and equipment 854,435 189,711 (479,757) - 99,072 663,460
Sub Total 95,457,092 3,190,183 (2,776,321) 39,839,007 - 135,709,961 Less Accumulated depreciation (28,027,341) (37,304,882) 3,139,660 - - (62,192,564)
Total capital assets being depreciated, net 67,429,751 (34,114,699) 363,339 39,839,007 - 73,517,397
Year End Totals 68,735,566$ 10,818,229 363,339 (3,471,358) - 76,445,775$
* During Fiscal Year 2012 Capital Assets items were revisited to verify that all assets were designated in the correct categories for Fiscal Year 2011. It was determined at that time that certain assets should be moved from one category to another with an effective date of June 30, 2011.
Schedule of Net Property, Plant, & Equipment (PP&E)
2005 2006 2007 2008 2009 2010 2011 2012 2013 2014
PP&E 95,834,607$ 96,222,163$ 101,306,310$ 107,539,856$ 121,309,803$ 124,015,092$ 126,932,175$ 134,001,976$ 135,459,397$ 137,039,159$ Accumulated Depreciation (28,027,340) (29,642,022) (33,057,250) (36,681,713) (40,512,192) (44,736,215) (49,097,940) (53,557,747) (57,977,115) (62,222,569)
Net PP&E in Service 67,807,266 66,580,141 68,249,059 70,858,143 80,797,611 79,278,877 77,834,235 80,444,229 77,482,282 74,816,591 Construction in Progress 928,300 3,005,393 2,720,938 4,542,373 641,980 1,236,180 3,514,449 553,892 441,125 1,625,744
Net PP&E 68,735,566$ 69,585,534$ 70,969,998$ 75,400,516$ 81,439,592$ 80,515,057$ 81,348,684$ 80,998,121$ 77,923,407$ 76,442,335$
79
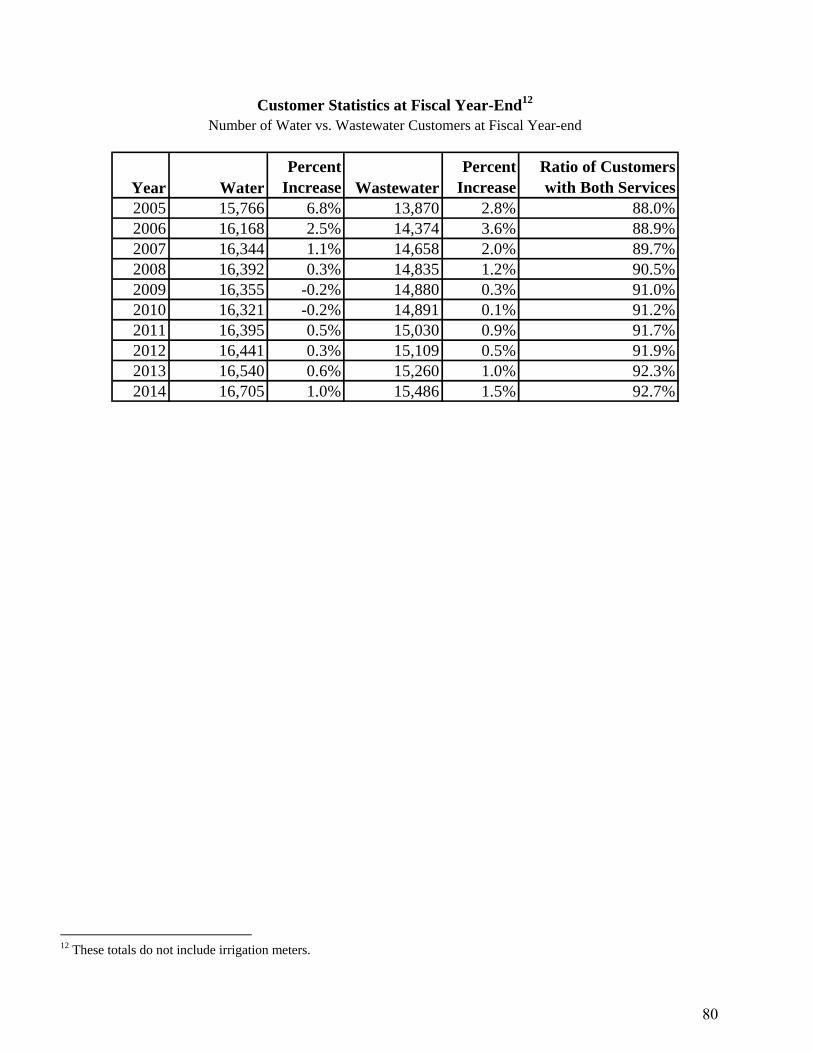
Customer Statistics at Fiscal Year-End12 Number of Water vs. Wastewater Customers at Fiscal Year-end
Year WaterPercent
Increase WastewaterPercent
IncreaseRatio of Customers with Both Services
2005 15,766 6.8% 13,870 2.8% 88.0%2006 16,168 2.5% 14,374 3.6% 88.9%2007 16,344 1.1% 14,658 2.0% 89.7%2008 16,392 0.3% 14,835 1.2% 90.5%2009 16,355 -0.2% 14,880 0.3% 91.0%2010 16,321 -0.2% 14,891 0.1% 91.2%2011 16,395 0.5% 15,030 0.9% 91.7%2012 16,441 0.3% 15,109 0.5% 91.9%2013 16,540 0.6% 15,260 1.0% 92.3%2014 16,705 1.0% 15,486 1.5% 92.7%
12 These totals do not include irrigation meters.
80
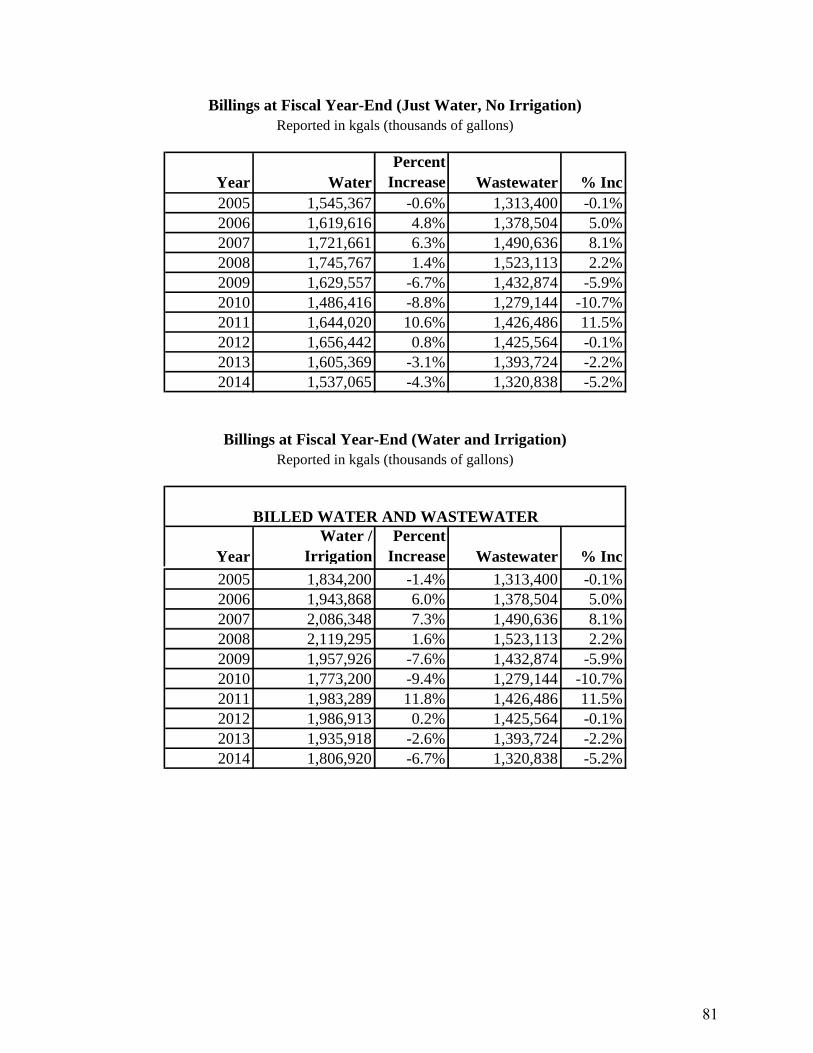
Billings at Fiscal Year-End (Just Water, No Irrigation) Reported in kgals (thousands of gallons)
Year WaterPercent
Increase Wastewater % Inc2005 1,545,367 -0.6% 1,313,400 -0.1%2006 1,619,616 4.8% 1,378,504 5.0%2007 1,721,661 6.3% 1,490,636 8.1%2008 1,745,767 1.4% 1,523,113 2.2%2009 1,629,557 -6.7% 1,432,874 -5.9%2010 1,486,416 -8.8% 1,279,144 -10.7%2011 1,644,020 10.6% 1,426,486 11.5%2012 1,656,442 0.8% 1,425,564 -0.1%2013 1,605,369 -3.1% 1,393,724 -2.2%2014 1,537,065 -4.3% 1,320,838 -5.2%
Billings at Fiscal Year-End (Water and Irrigation)
Reported in kgals (thousands of gallons)
YearWater /
Irrigation Percent
Increase Wastewater % Inc
2005 1,834,200 -1.4% 1,313,400 -0.1%2006 1,943,868 6.0% 1,378,504 5.0%2007 2,086,348 7.3% 1,490,636 8.1%2008 2,119,295 1.6% 1,523,113 2.2%2009 1,957,926 -7.6% 1,432,874 -5.9%2010 1,773,200 -9.4% 1,279,144 -10.7%2011 1,983,289 11.8% 1,426,486 11.5%2012 1,986,913 0.2% 1,425,564 -0.1%2013 1,935,918 -2.6% 1,393,724 -2.2%2014 1,806,920 -6.7% 1,320,838 -5.2%
BILLED WATER AND WASTEWATER
81
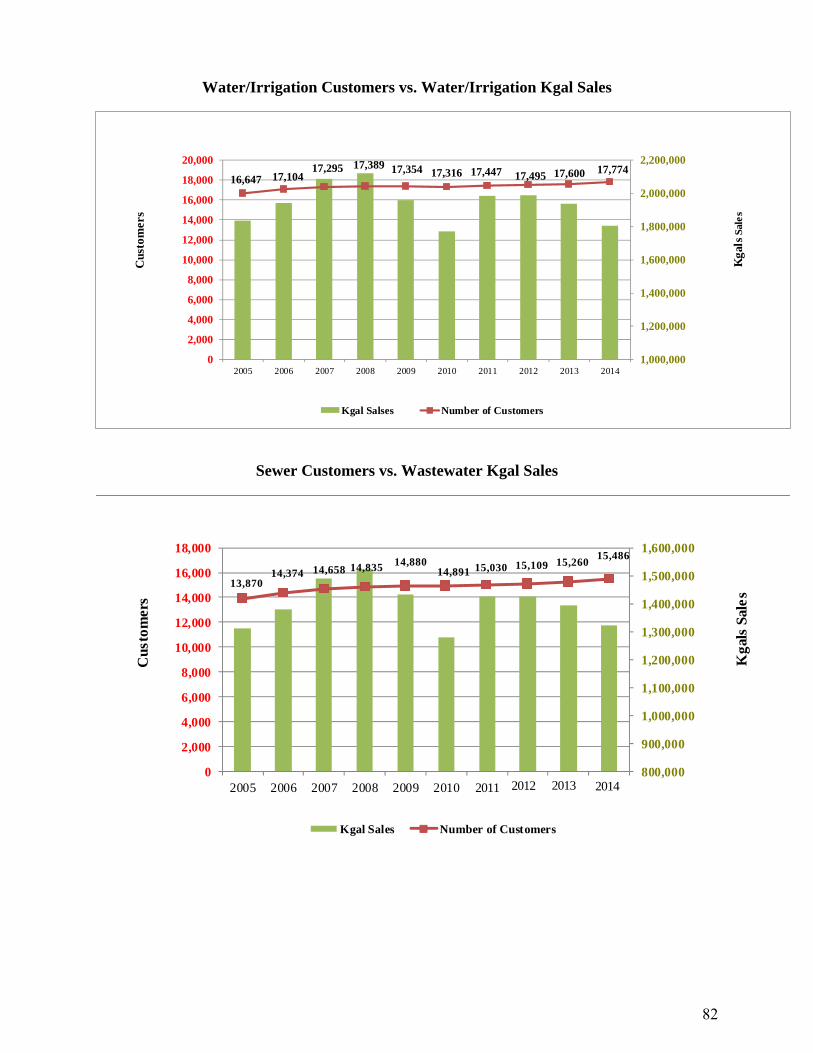
Water/Irrigation Customers vs. Water/Irrigation Kgal Sales
16,647 17,104 17,295 17,389 17,354 17,316 17,447 17,495 17,600 17,774
1,000,000
1,200,000
1,400,000
1,600,000
1,800,000
2,000,000
2,200,000
0
2,000
4,000
6,000
8,000
10,000
12,000
14,000
16,000
18,000
20,000
2005 2006 2007 2008 2009 2010 2011 2012 2013 2014
Kgal Salses Number of Customers
Kga
lsSa
les
Cus
tom
ers
Sewer Customers vs. Wastewater Kgal Sales
13,870 14,374 14,658 14,835 14,880
14,891 15,030 15,109 15,260 15,486
800,000
900,000
1,000,000
1,100,000
1,200,000
1,300,000
1,400,000
1,500,000
1,600,000
0
2,000
4,000
6,000
8,000
10,000
12,000
14,000
16,000
18,000
2005 2006 2007 2008 2009 2010
Kgal Sales Number of Customers
Kga
ls S
ales
Cus
tom
ers
2012 20132011 2014
82
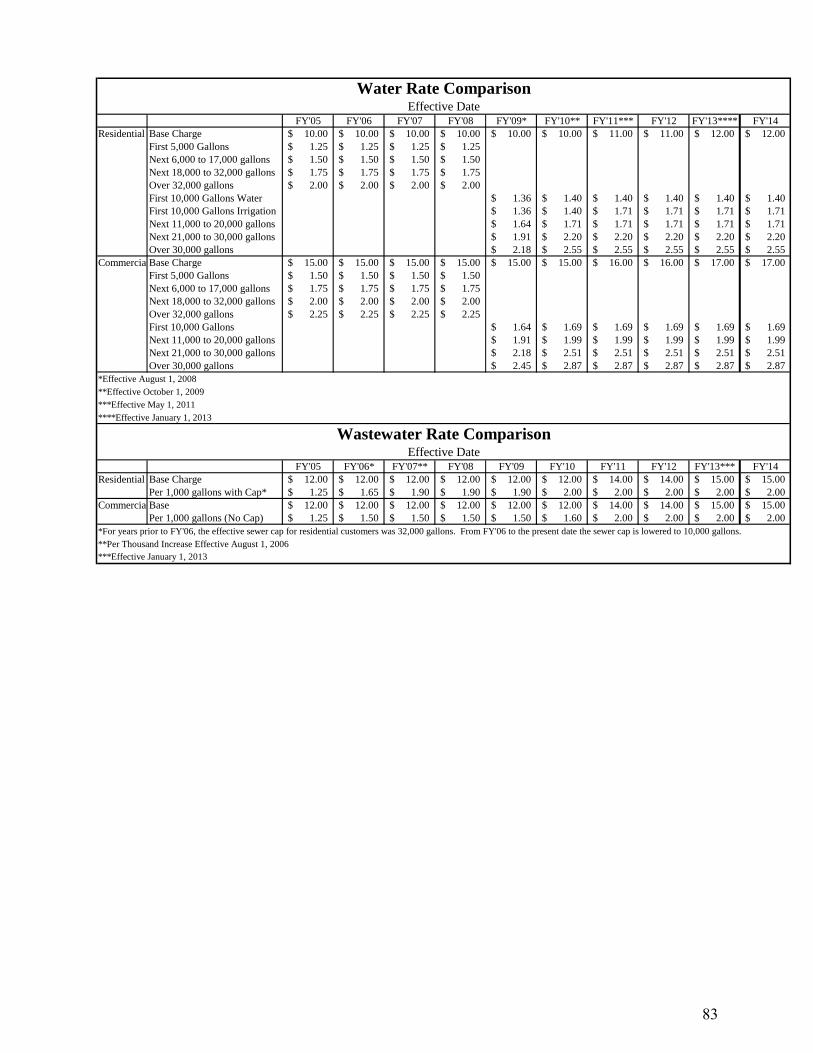
FY'05 FY'06 FY'07 FY'08 FY'09* FY'10** FY'11*** FY'12 FY'13**** FY'14Residential Base Charge 10.00$ 10.00$ 10.00$ 10.00$ 10.00$ 10.00$ 11.00$ 11.00$ 12.00$ 12.00$
First 5,000 Gallons 1.25$ 1.25$ 1.25$ 1.25$ Next 6,000 to 17,000 gallons 1.50$ 1.50$ 1.50$ 1.50$ Next 18,000 to 32,000 gallons 1.75$ 1.75$ 1.75$ 1.75$ Over 32,000 gallons 2.00$ 2.00$ 2.00$ 2.00$ First 10,000 Gallons Water 1.36$ 1.40$ 1.40$ 1.40$ 1.40$ 1.40$ First 10,000 Gallons Irrigation 1.36$ 1.40$ 1.71$ 1.71$ 1.71$ 1.71$ Next 11,000 to 20,000 gallons 1.64$ 1.71$ 1.71$ 1.71$ 1.71$ 1.71$ Next 21,000 to 30,000 gallons 1.91$ 2.20$ 2.20$ 2.20$ 2.20$ 2.20$ Over 30,000 gallons 2.18$ 2.55$ 2.55$ 2.55$ 2.55$ 2.55$
CommercialBase Charge 15.00$ 15.00$ 15.00$ 15.00$ 15.00$ 15.00$ 16.00$ 16.00$ 17.00$ 17.00$ First 5,000 Gallons 1.50$ 1.50$ 1.50$ 1.50$ Next 6,000 to 17,000 gallons 1.75$ 1.75$ 1.75$ 1.75$ Next 18,000 to 32,000 gallons 2.00$ 2.00$ 2.00$ 2.00$ Over 32,000 gallons 2.25$ 2.25$ 2.25$ 2.25$ First 10,000 Gallons 1.64$ 1.69$ 1.69$ 1.69$ 1.69$ 1.69$ Next 11,000 to 20,000 gallons 1.91$ 1.99$ 1.99$ 1.99$ 1.99$ 1.99$ Next 21,000 to 30,000 gallons 2.18$ 2.51$ 2.51$ 2.51$ 2.51$ 2.51$ Over 30,000 gallons 2.45$ 2.87$ 2.87$ 2.87$ 2.87$ 2.87$
*Effective August 1, 2008**Effective October 1, 2009***Effective May 1, 2011****Effective January 1, 2013
FY'05 FY'06* FY'07** FY'08 FY'09 FY'10 FY'11 FY'12 FY'13*** FY'14Residential Base Charge 12.00$ 12.00$ 12.00$ 12.00$ 12.00$ 12.00$ 14.00$ 14.00$ 15.00$ 15.00$
Per 1,000 gallons with Cap* 1.25$ 1.65$ 1.90$ 1.90$ 1.90$ 2.00$ 2.00$ 2.00$ 2.00$ 2.00$ CommercialBase 12.00$ 12.00$ 12.00$ 12.00$ 12.00$ 12.00$ 14.00$ 14.00$ 15.00$ 15.00$
Per 1,000 gallons (No Cap) 1.25$ 1.50$ 1.50$ 1.50$ 1.50$ 1.60$ 2.00$ 2.00$ 2.00$ 2.00$ *For years prior to FY'06, the effective sewer cap for residential customers was 32,000 gallons. From FY'06 to the present date the sewer cap is lowered to 10,000 gallons.**Per Thousand Increase Effective August 1, 2006***Effective January 1, 2013
Water Rate ComparisonEffective Date
Wastewater Rate ComparisonEffective Date
83
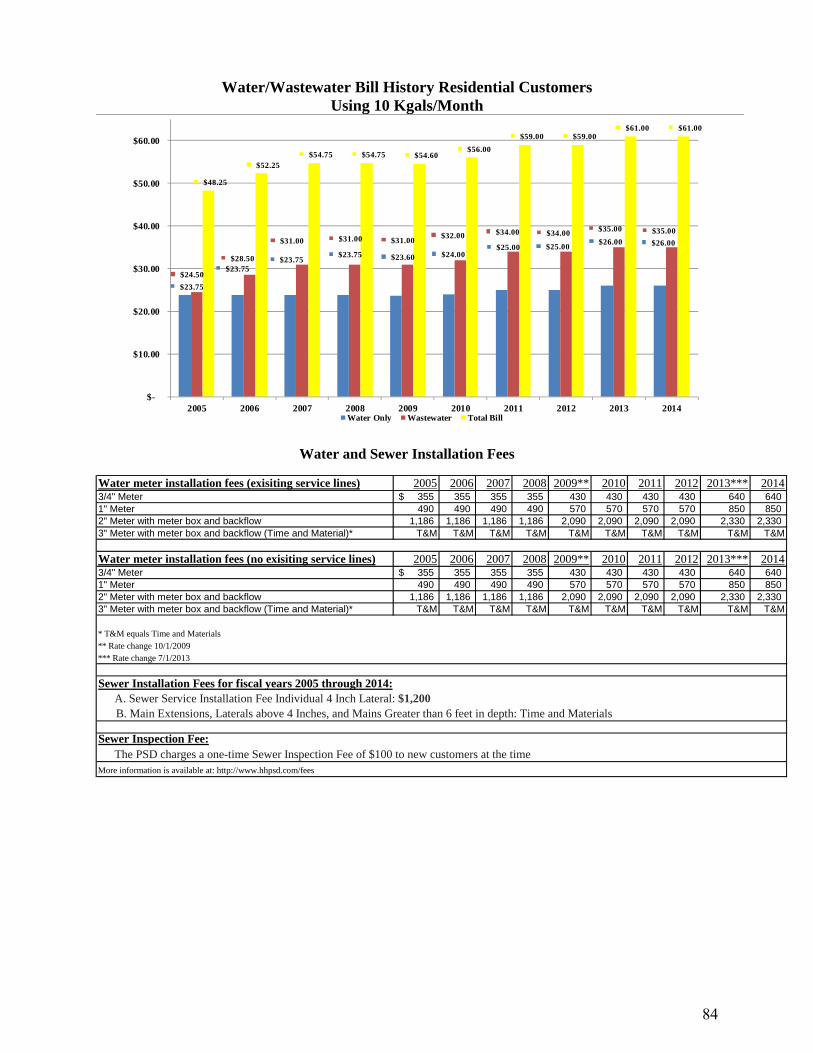
Water/Wastewater Bill History Residential Customers Using 10 Kgals/Month
$23.75
$23.75 $23.75
$23.75 $23.60 $24.00 $25.00 $25.00
$26.00 $26.00
$24.50
$28.50
$31.00 $31.00 $31.00 $32.00 $34.00 $34.00 $35.00 $35.00
$48.25
$52.25 $54.75 $54.75 $54.60
$56.00
$59.00 $59.00 $61.00 $61.00
$-
$10.00
$20.00
$30.00
$40.00
$50.00
$60.00
2005 2006 2007 2008 2009 2010 2011 2012 2013 2014Water Only Wastewater Total Bill
Water and Sewer Installation Fees
Water meter installation fees (exisiting service lines) 2005 2006 2007 2008 2009** 2010 2011 2012 2013*** 20143/4" Meter 355$ 355 355 355 430 430 430 430 640 640 1" Meter 490 490 490 490 570 570 570 570 850 850 2" Meter with meter box and backflow 1,186 1,186 1,186 1,186 2,090 2,090 2,090 2,090 2,330 2,330 3" Meter with meter box and backflow (Time and Material)* T&M T&M T&M T&M T&M T&M T&M T&M T&M T&M
Water meter installation fees (no exisiting service lines) 2005 2006 2007 2008 2009** 2010 2011 2012 2013*** 20143/4" Meter 355$ 355 355 355 430 430 430 430 640 640 1" Meter 490 490 490 490 570 570 570 570 850 850 2" Meter with meter box and backflow 1,186 1,186 1,186 1,186 2,090 2,090 2,090 2,090 2,330 2,330 3" Meter with meter box and backflow (Time and Material)* T&M T&M T&M T&M T&M T&M T&M T&M T&M T&M
* T&M equals Time and Materials** Rate change 10/1/2009*** Rate change 7/1/2013
Sewer Inspection Fee:
More information is available at: http://www.hhpsd.com/fees
Sewer Installation Fees for fiscal years 2005 through 2014:A. Sewer Service Installation Fee Individual 4 Inch Lateral: $1,200
The PSD charges a one-time Sewer Inspection Fee of $100 to new customers at the time
B. Main Extensions, Laterals above 4 Inches, and Mains Greater than 6 feet in depth: Time and Materials
84
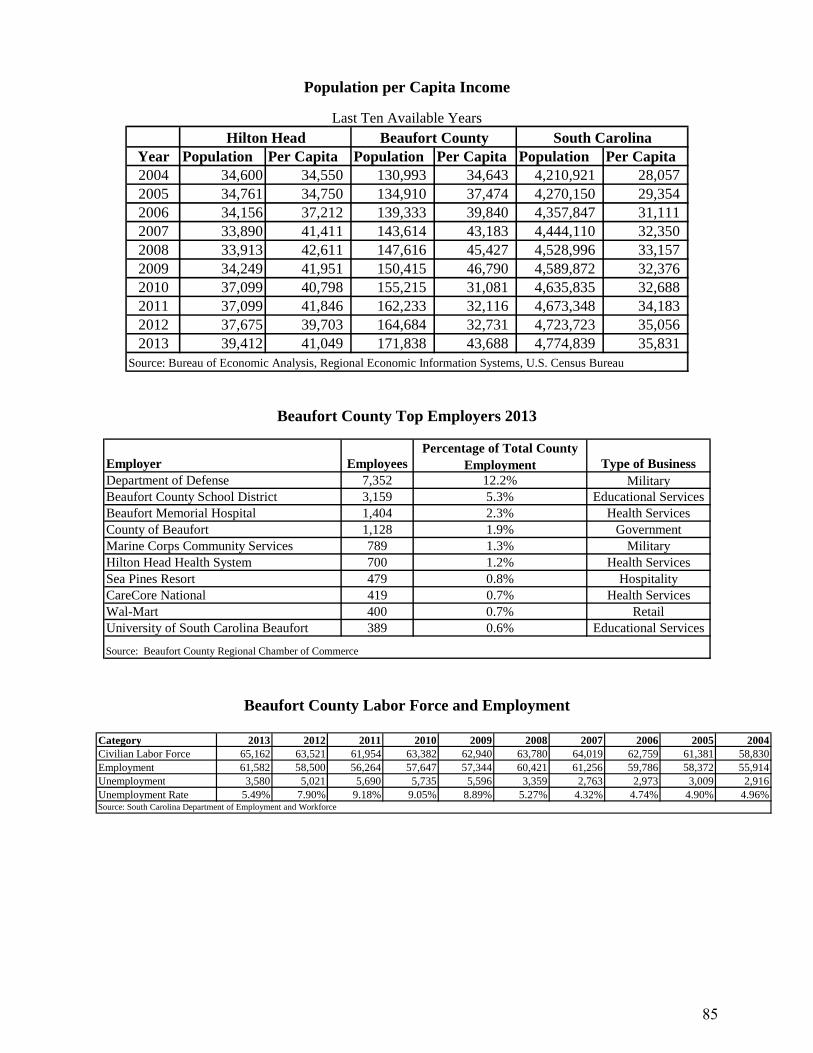
Population per Capita Income
Last Ten Available Years
Year Population Per Capita Population Per Capita Population Per Capita2004 34,600 34,550 130,993 34,643 4,210,921 28,057 2005 34,761 34,750 134,910 37,474 4,270,150 29,354 2006 34,156 37,212 139,333 39,840 4,357,847 31,111 2007 33,890 41,411 143,614 43,183 4,444,110 32,350 2008 33,913 42,611 147,616 45,427 4,528,996 33,157 2009 34,249 41,951 150,415 46,790 4,589,872 32,376 2010 37,099 40,798 155,215 31,081 4,635,835 32,688 2011 37,099 41,846 162,233 32,116 4,673,348 34,183 2012 37,675 39,703 164,684 32,731 4,723,723 35,056 2013 39,412 41,049 171,838 43,688 4,774,839 35,831
Source: Bureau of Economic Analysis, Regional Economic Information Systems, U.S. Census Bureau
Beaufort County South CarolinaHilton Head
Beaufort County Top Employers 2013
Employer EmployeesPercentage of Total County
Employment Type of BusinessDepartment of Defense 7,352 12.2% MilitaryBeaufort County School District 3,159 5.3% Educational ServicesBeaufort Memorial Hospital 1,404 2.3% Health ServicesCounty of Beaufort 1,128 1.9% GovernmentMarine Corps Community Services 789 1.3% MilitaryHilton Head Health System 700 1.2% Health ServicesSea Pines Resort 479 0.8% HospitalityCareCore National 419 0.7% Health ServicesWal-Mart 400 0.7% RetailUniversity of South Carolina Beaufort 389 0.6% Educational Services
Source: Beaufort County Regional Chamber of Commerce
Beaufort County Labor Force and Employment
Category 2013 2012 2011 2010 2009 2008 2007 2006 2005 2004Civilian Labor Force 65,162 63,521 61,954 63,382 62,940 63,780 64,019 62,759 61,381 58,830Employment 61,582 58,500 56,264 57,647 57,344 60,421 61,256 59,786 58,372 55,914Unemployment 3,580 5,021 5,690 5,735 5,596 3,359 2,763 2,973 3,009 2,916Unemployment Rate 5.49% 7.90% 9.18% 9.05% 8.89% 5.27% 4.32% 4.74% 4.90% 4.96%Source: South Carolina Department of Employment and Workforce
85
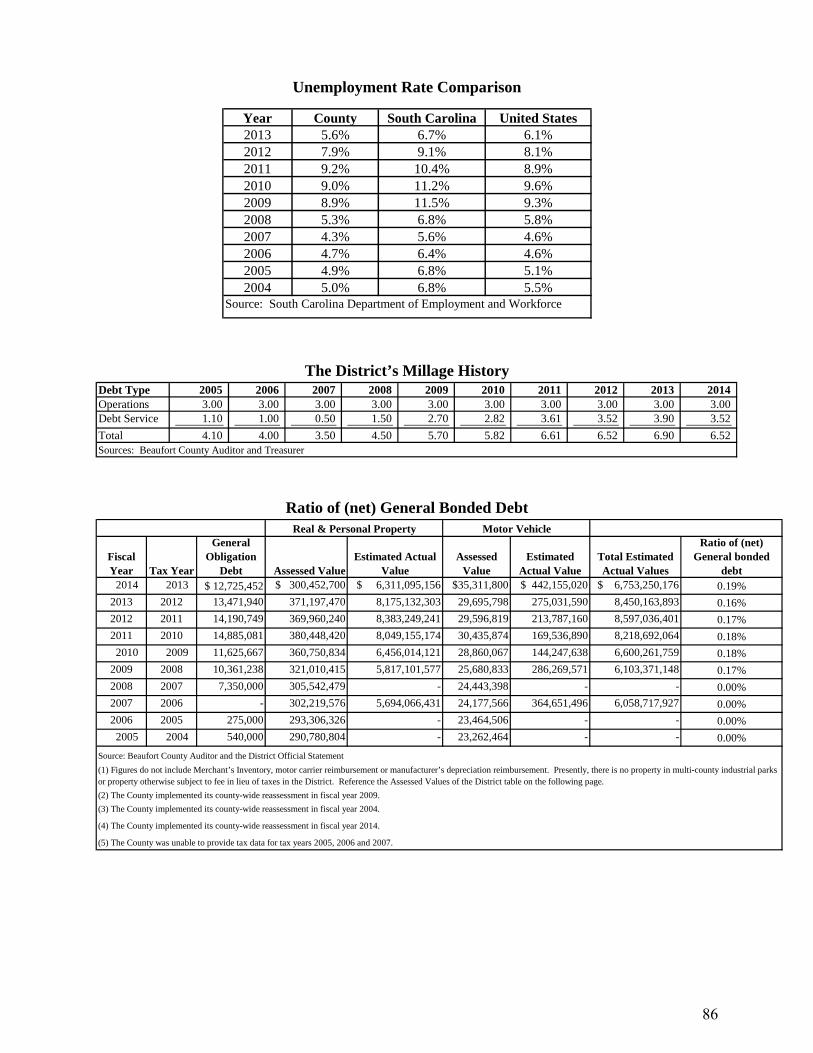
Unemployment Rate Comparison
Year County South Carolina United States2013 5.6% 6.7% 6.1%2012 7.9% 9.1% 8.1%2011 9.2% 10.4% 8.9%2010 9.0% 11.2% 9.6%2009 8.9% 11.5% 9.3%2008 5.3% 6.8% 5.8%2007 4.3% 5.6% 4.6%2006 4.7% 6.4% 4.6%2005 4.9% 6.8% 5.1%2004 5.0% 6.8% 5.5%
Source: South Carolina Department of Employment and Workforce
The District’s Millage History Debt Type 2005 2006 2007 2008 2009 2010 2011 2012 2013 2014Operations 3.00 3.00 3.00 3.00 3.00 3.00 3.00 3.00 3.00 3.00 Debt Service 1.10 1.00 0.50 1.50 2.70 2.82 3.61 3.52 3.90 3.52
Total 4.10 4.00 3.50 4.50 5.70 5.82 6.61 6.52 6.90 6.52 Sources: Beaufort County Auditor and Treasurer
Ratio of (net) General Bonded Debt
Fiscal Year Tax Year
General Obligation
Debt Assessed ValueEstimated Actual
ValueAssessed
ValueEstimated
Actual ValueTotal Estimated Actual Values
Ratio of (net) General bonded
debt 2014 2013 $ 12,725,452 $ 300,452,700 $ 6,311,095,156 $35,311,800 $ 442,155,020 $ 6,753,250,176 0.19%
2013 2012 13,471,940 371,197,470 8,175,132,303 29,695,798 275,031,590 8,450,163,893 0.16%
2012 2011 14,190,749 369,960,240 8,383,249,241 29,596,819 213,787,160 8,597,036,401 0.17%
2011 2010 14,885,081 380,448,420 8,049,155,174 30,435,874 169,536,890 8,218,692,064 0.18%
2010 2009 11,625,667 360,750,834 6,456,014,121 28,860,067 144,247,638 6,600,261,759 0.18%
2009 2008 10,361,238 321,010,415 5,817,101,577 25,680,833 286,269,571 6,103,371,148 0.17%
2008 2007 7,350,000 305,542,479 - 24,443,398 - - 0.00%
2007 2006 - 302,219,576 5,694,066,431 24,177,566 364,651,496 6,058,717,927 0.00%
2006 2005 275,000 293,306,326 - 23,464,506 - - 0.00%
2005 2004 540,000 290,780,804 - 23,262,464 - - 0.00%
(5) The County was unable to provide tax data for tax years 2005, 2006 and 2007.
(4) The County implemented its county-wide reassessment in fiscal year 2014.
Real & Personal Property Motor Vehicle
Source: Beaufort County Auditor and the District Official Statement
(1) Figures do not include Merchant’s Inventory, motor carrier reimbursement or manufacturer’s depreciation reimbursement. Presently, there is no property in multi-county industrial parks or property otherwise subject to fee in lieu of taxes in the District. Reference the Assessed Values of the District table on the following page.
(2) The County implemented its county-wide reassessment in fiscal year 2009.
(3) The County implemented its county-wide reassessment in fiscal year 2004.
86
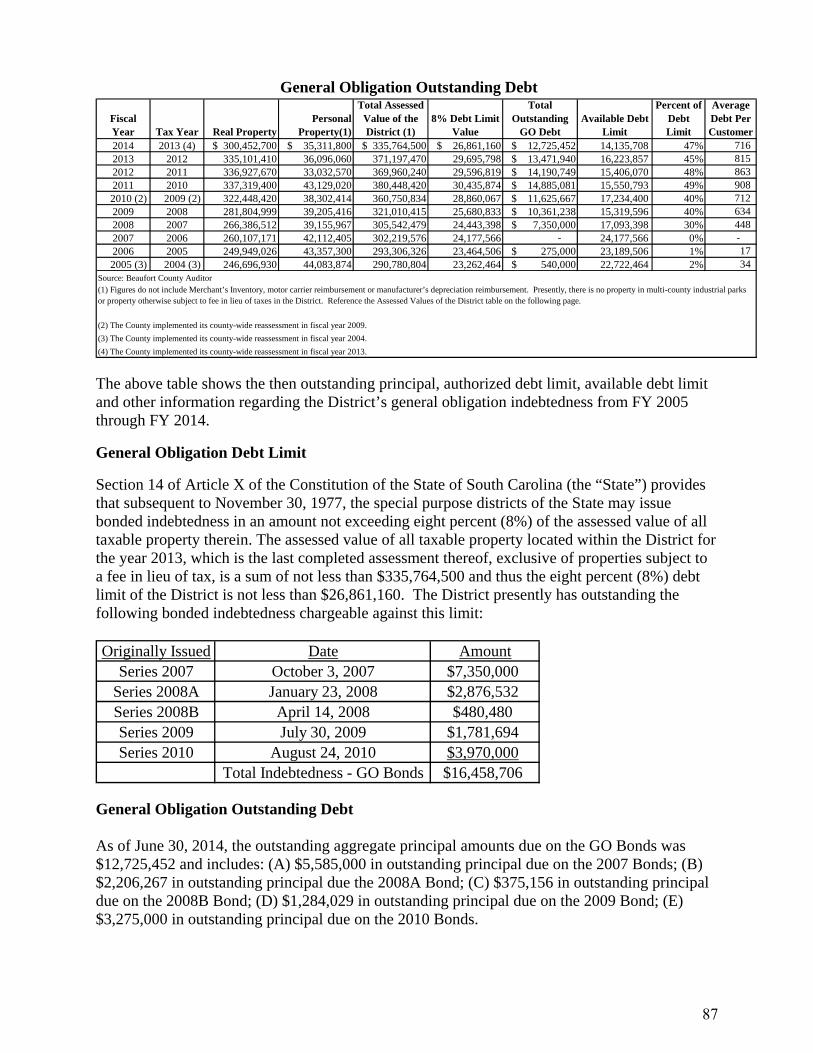
General Obligation Outstanding Debt
Fiscal Year Tax Year Real Property
Personal Property(1)
Total Assessed Value of the District (1)
8% Debt Limit Value
Total Outstanding
GO DebtAvailable Debt
Limit
Percent of Debt Limit
Average Debt Per Customer
2014 2013 (4) $ 300,452,700 $ 35,311,800 $ 335,764,500 $ 26,861,160 $ 12,725,452 14,135,708 47% 716 2013 2012 335,101,410 36,096,060 371,197,470 29,695,798 $ 13,471,940 16,223,857 45% 815 2012 2011 336,927,670 33,032,570 369,960,240 29,596,819 $ 14,190,749 15,406,070 48% 863 2011 2010 337,319,400 43,129,020 380,448,420 30,435,874 $ 14,885,081 15,550,793 49% 908
2010 (2) 2009 (2) 322,448,420 38,302,414 360,750,834 28,860,067 $ 11,625,667 17,234,400 40% 712 2009 2008 281,804,999 39,205,416 321,010,415 25,680,833 $ 10,361,238 15,319,596 40% 634 2008 2007 266,386,512 39,155,967 305,542,479 24,443,398 $ 7,350,000 17,093,398 30% 448 2007 2006 260,107,171 42,112,405 302,219,576 24,177,566 - 24,177,566 0% - 2006 2005 249,949,026 43,357,300 293,306,326 23,464,506 $ 275,000 23,189,506 1% 17
2005 (3) 2004 (3) 246,696,930 44,083,874 290,780,804 23,262,464 $ 540,000 22,722,464 2% 34 Source: Beaufort County Auditor(1) Figures do not include Merchant’s Inventory, motor carrier reimbursement or manufacturer’s depreciation reimbursement. Presently, there is no property in multi-county industrial parks or property otherwise subject to fee in lieu of taxes in the District. Reference the Assessed Values of the District table on the following page.
(2) The County implemented its county-wide reassessment in fiscal year 2009.
(4) The County implemented its county-wide reassessment in fiscal year 2013.
(3) The County implemented its county-wide reassessment in fiscal year 2004.
The above table shows the then outstanding principal, authorized debt limit, available debt limit and other information regarding the District’s general obligation indebtedness from FY 2005 through FY 2014.
General Obligation Debt Limit
Section 14 of Article X of the Constitution of the State of South Carolina (the “State”) provides that subsequent to November 30, 1977, the special purpose districts of the State may issue bonded indebtedness in an amount not exceeding eight percent (8%) of the assessed value of all taxable property therein. The assessed value of all taxable property located within the District for the year 2013, which is the last completed assessment thereof, exclusive of properties subject to a fee in lieu of tax, is a sum of not less than $335,764,500 and thus the eight percent (8%) debt limit of the District is not less than $26,861,160. The District presently has outstanding the following bonded indebtedness chargeable against this limit: Originally Issued Date Amount
Series 2007 October 3, 2007 $7,350,000Series 2008A January 23, 2008 $2,876,532Series 2008B April 14, 2008 $480,480Series 2009 July 30, 2009 $1,781,694Series 2010 August 24, 2010 $3,970,000
Total Indebtedness - GO Bonds $16,458,706
General Obligation Outstanding Debt As of June 30, 2014, the outstanding aggregate principal amounts due on the GO Bonds was $12,725,452 and includes: (A) $5,585,000 in outstanding principal due on the 2007 Bonds; (B) $2,206,267 in outstanding principal due the 2008A Bond; (C) $375,156 in outstanding principal due on the 2008B Bond; (D) $1,284,029 in outstanding principal due on the 2009 Bond; (E) $3,275,000 in outstanding principal due on the 2010 Bonds.
87
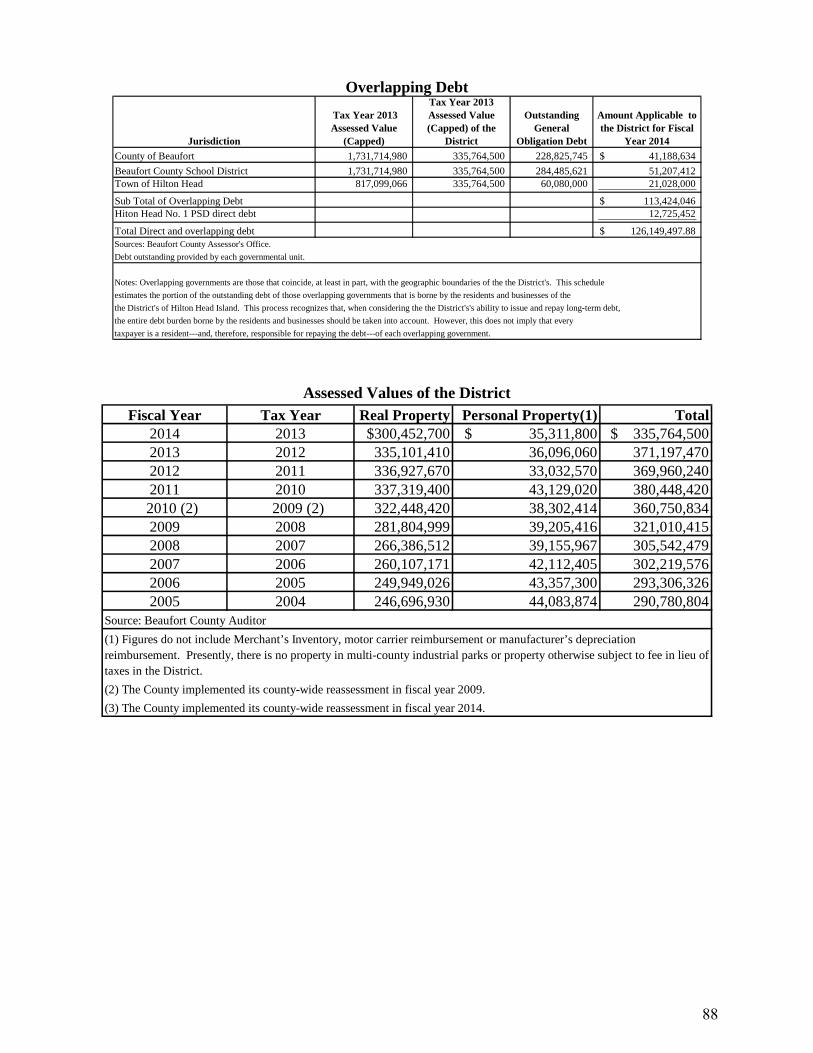
Overlapping Debt
County of Beaufort 1,731,714,980 335,764,500 228,825,745 41,188,634$
Beaufort County School District 1,731,714,980 335,764,500 284,485,621 51,207,412 Town of Hilton Head 817,099,066 335,764,500 60,080,000 21,028,000
Sub Total of Overlapping Debt 113,424,046$ Hiton Head No. 1 PSD direct debt 12,725,452
Total Direct and overlapping debt 126,149,497.88$ Sources: Beaufort County Assessor's Office.
Debt outstanding provided by each governmental unit.
Notes: Overlapping governments are those that coincide, at least in part, with the geographic boundaries of the the District's. This schedule
estimates the portion of the outstanding debt of those overlapping governments that is borne by the residents and businesses of the
the District's of Hilton Head Island. This process recognizes that, when considering the the District's's ability to issue and repay long-term debt,
the entire debt burden borne by the residents and businesses should be taken into account. However, this does not imply that every
taxpayer is a resident---and, therefore, responsible for repaying the debt---of each overlapping government.
Jurisdiction
Tax Year 2013 Assessed Value
(Capped)
Tax Year 2013 Assessed Value (Capped) of the
District
Outstanding General
Obligation Debt
Amount Applicable to the District for Fiscal
Year 2014
Assessed Values of the District
Fiscal Year Tax Year Real Property Personal Property(1) Total2014 2013 $300,452,700 $ 35,311,800 $ 335,764,500 2013 2012 335,101,410 36,096,060 371,197,470 2012 2011 336,927,670 33,032,570 369,960,240 2011 2010 337,319,400 43,129,020 380,448,420
2010 (2) 2009 (2) 322,448,420 38,302,414 360,750,834 2009 2008 281,804,999 39,205,416 321,010,415 2008 2007 266,386,512 39,155,967 305,542,479 2007 2006 260,107,171 42,112,405 302,219,576 2006 2005 249,949,026 43,357,300 293,306,326 2005 2004 246,696,930 44,083,874 290,780,804
Source: Beaufort County Auditor
(1) Figures do not include Merchant’s Inventory, motor carrier reimbursement or manufacturer’s depreciation reimbursement. Presently, there is no property in multi-county industrial parks or property otherwise subject to fee in lieu of taxes in the District.
(2) The County implemented its county-wide reassessment in fiscal year 2009.
(3) The County implemented its county-wide reassessment in fiscal year 2014.
88
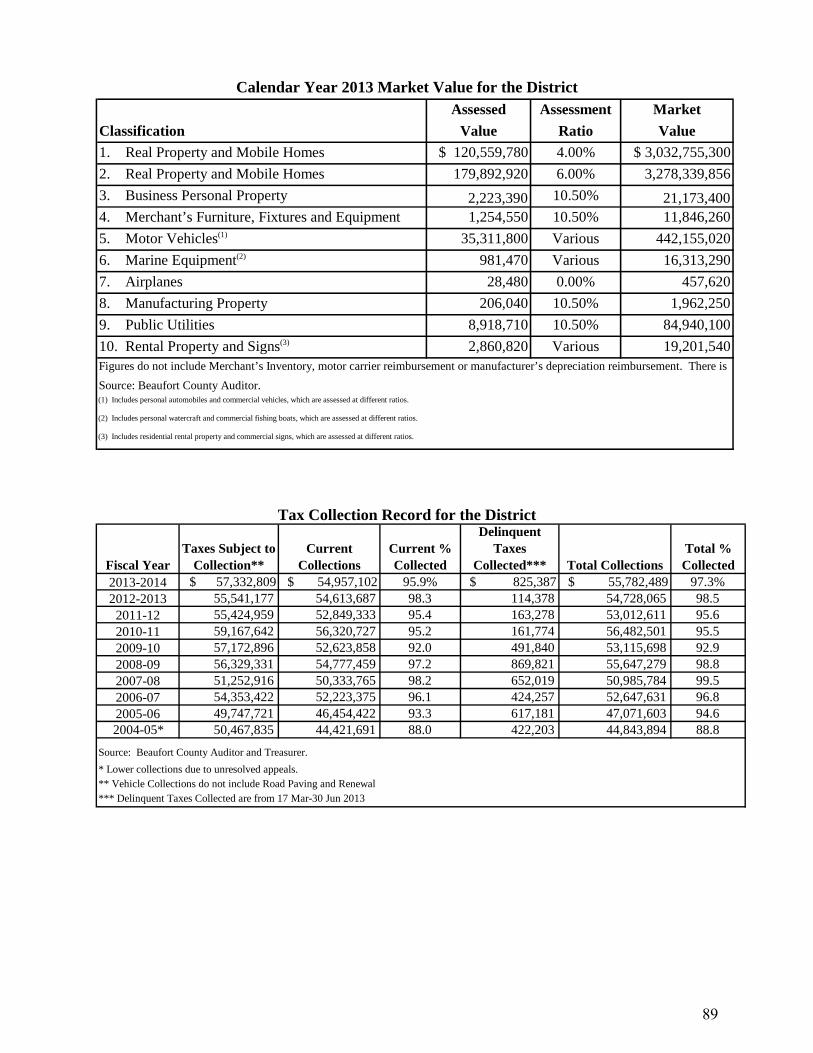
Calendar Year 2013 Market Value for the District Assessed Assessment Market
Classification Value Ratio Value
1. Real Property and Mobile Homes $ 120,559,780 4.00% $ 3,032,755,300
2. Real Property and Mobile Homes 179,892,920 6.00% 3,278,339,856
3. Business Personal Property 2,223,390 10.50% 21,173,4004. Merchant’s Furniture, Fixtures and Equipment 1,254,550 10.50% 11,846,260
5. Motor Vehicles(1) 35,311,800 Various 442,155,020
6. Marine Equipment(2) 981,470 Various 16,313,290
7. Airplanes 28,480 0.00% 457,620
8. Manufacturing Property 206,040 10.50% 1,962,250
9. Public Utilities 8,918,710 10.50% 84,940,100
10. Rental Property and Signs(3) 2,860,820 Various 19,201,540
Source: Beaufort County Auditor.(1) Includes personal automobiles and commercial vehicles, which are assessed at different ratios.
(2) Includes personal watercraft and commercial fishing boats, which are assessed at different ratios.
(3) Includes residential rental property and commercial signs, which are assessed at different ratios.
Figures do not include Merchant’s Inventory, motor carrier reimbursement or manufacturer’s depreciation reimbursement. There is
Tax Collection Record for the District
Fiscal YearTaxes Subject to
Collection**Current
CollectionsCurrent % Collected
Delinquent Taxes
Collected*** Total CollectionsTotal % Collected
2013-2014 $ 57,332,809 $ 54,957,102 95.9% $ 825,387 $ 55,782,489 97.3%2012-2013 55,541,177 54,613,687 98.3 114,378 54,728,065 98.5
2011-12 55,424,959 52,849,333 95.4 163,278 53,012,611 95.62010-11 59,167,642 56,320,727 95.2 161,774 56,482,501 95.52009-10 57,172,896 52,623,858 92.0 491,840 53,115,698 92.92008-09 56,329,331 54,777,459 97.2 869,821 55,647,279 98.82007-08 51,252,916 50,333,765 98.2 652,019 50,985,784 99.52006-07 54,353,422 52,223,375 96.1 424,257 52,647,631 96.82005-06 49,747,721 46,454,422 93.3 617,181 47,071,603 94.62004-05* 50,467,835 44,421,691 88.0 422,203 44,843,894 88.8
Source: Beaufort County Auditor and Treasurer.
* Lower collections due to unresolved appeals.** Vehicle Collections do not include Road Paving and Renewal *** Delinquent Taxes Collected are from 17 Mar-30 Jun 2013
89
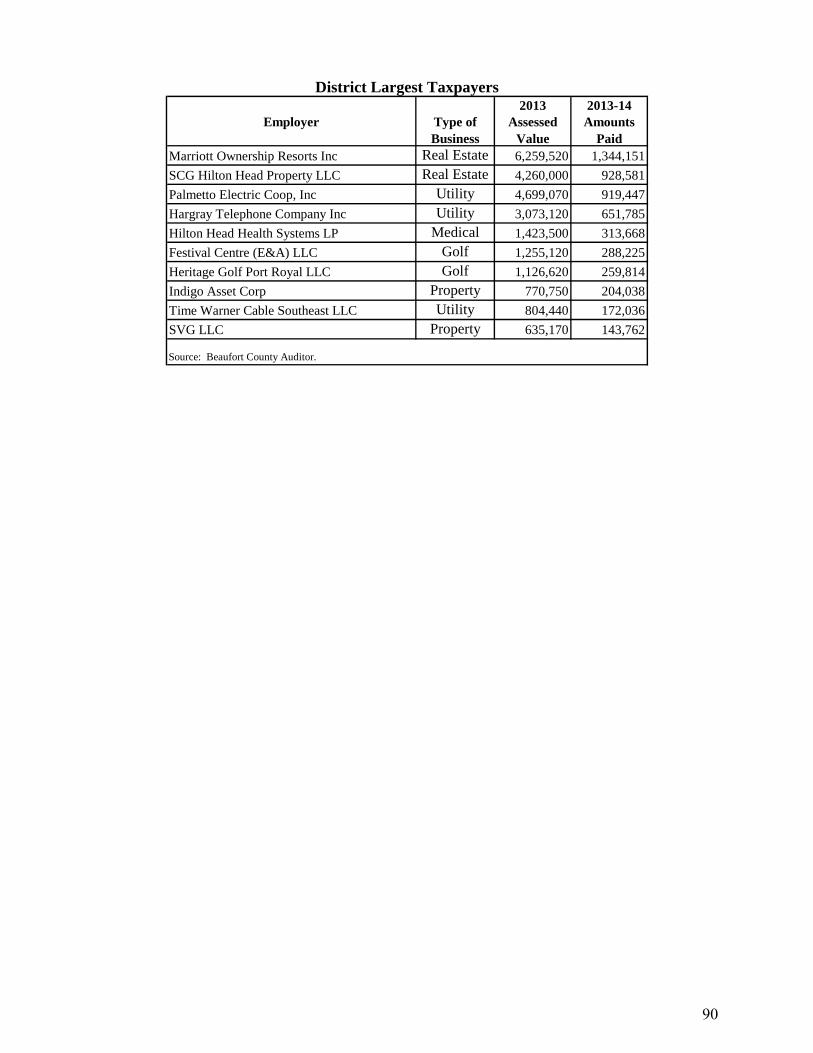
District Largest Taxpayers 2013 2013-14
Employer Type of Business
Assessed Value
Amounts Paid
Marriott Ownership Resorts Inc Real Estate 6,259,520 1,344,151
SCG Hilton Head Property LLC Real Estate 4,260,000 928,581
Palmetto Electric Coop, Inc Utility 4,699,070 919,447
Hargray Telephone Company Inc Utility 3,073,120 651,785
Hilton Head Health Systems LP Medical 1,423,500 313,668
Festival Centre (E&A) LLC Golf 1,255,120 288,225
Heritage Golf Port Royal LLC Golf 1,126,620 259,814
Indigo Asset Corp Property 770,750 204,038
Time Warner Cable Southeast LLC Utility 804,440 172,036
SVG LLC Property 635,170 143,762
Source: Beaufort County Auditor.
90
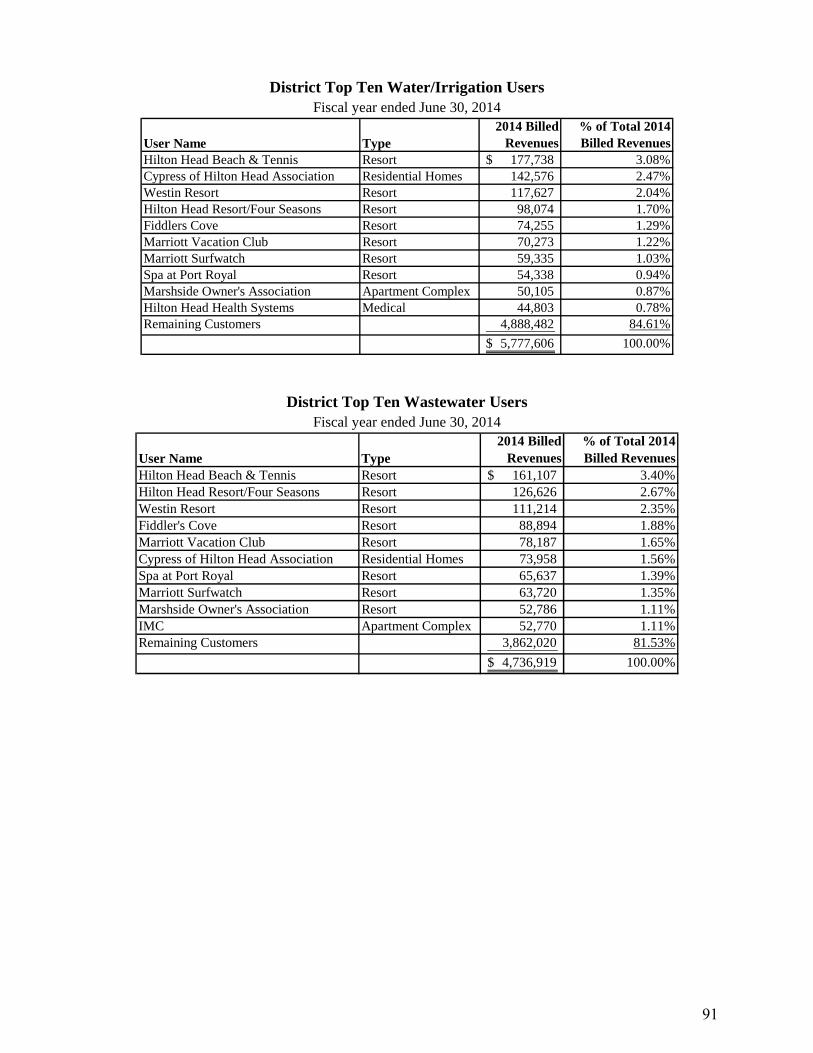
District Top Ten Water/Irrigation Users Fiscal year ended June 30, 2014
User Name Type2014 Billed
Revenues% of Total 2014 Billed Revenues
Hilton Head Beach & Tennis Resort 177,738$ 3.08%Cypress of Hilton Head Association Residential Homes 142,576 2.47%Westin Resort Resort 117,627 2.04%Hilton Head Resort/Four Seasons Resort 98,074 1.70%Fiddlers Cove Resort 74,255 1.29%Marriott Vacation Club Resort 70,273 1.22%Marriott Surfwatch Resort 59,335 1.03%Spa at Port Royal Resort 54,338 0.94%Marshside Owner's Association Apartment Complex 50,105 0.87%Hilton Head Health Systems Medical 44,803 0.78%Remaining Customers 4,888,482 84.61%
5,777,606$ 100.00%
District Top Ten Wastewater Users
Fiscal year ended June 30, 2014
User Name Type2014 Billed
Revenues% of Total 2014 Billed Revenues
Hilton Head Beach & Tennis Resort 161,107$ 3.40%Hilton Head Resort/Four Seasons Resort 126,626 2.67%Westin Resort Resort 111,214 2.35%Fiddler's Cove Resort 88,894 1.88%Marriott Vacation Club Resort 78,187 1.65%Cypress of Hilton Head Association Residential Homes 73,958 1.56%Spa at Port Royal Resort 65,637 1.39%Marriott Surfwatch Resort 63,720 1.35%Marshside Owner's Association Resort 52,786 1.11%IMC Apartment Complex 52,770 1.11%Remaining Customers 3,862,020 81.53%
4,736,919$ 100.00%
91
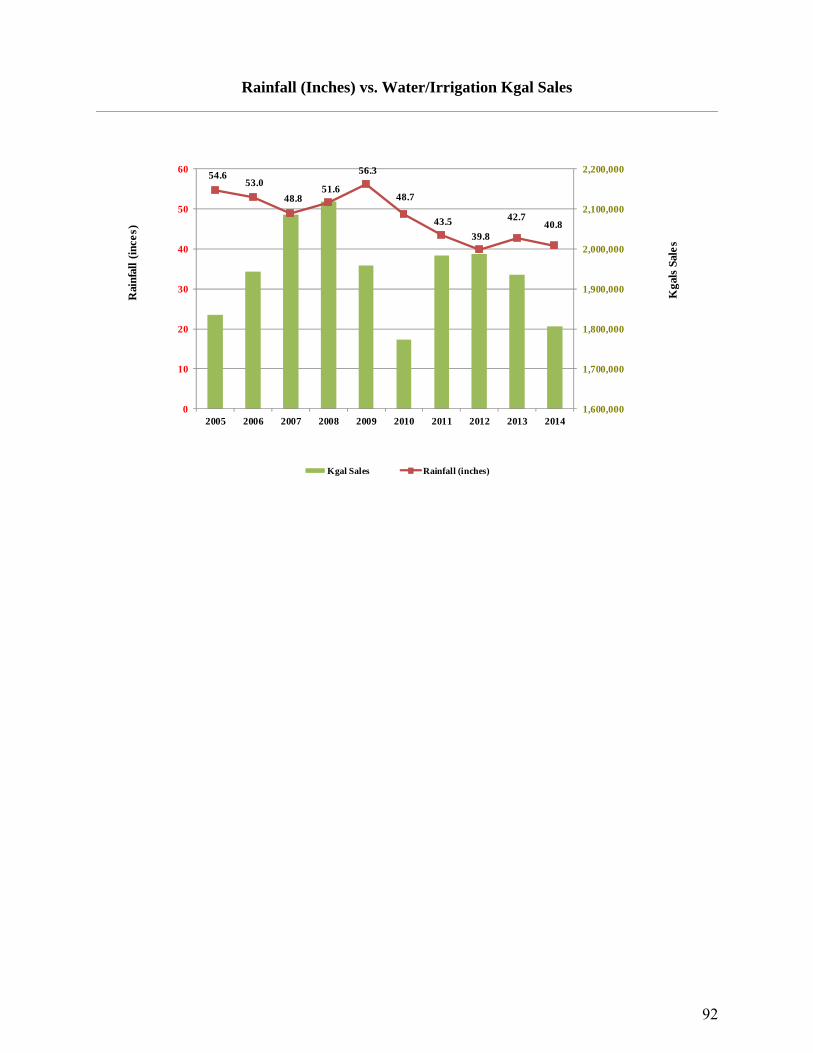
Rainfall (Inches) vs. Water/Irrigation Kgal Sales
54.6 53.0
48.8 51.6
56.3
48.7
43.5
39.8
42.740.8
1,600,000
1,700,000
1,800,000
1,900,000
2,000,000
2,100,000
2,200,000
0
10
20
30
40
50
60
2005 2006 2007 2008 2009 2010 2011 2012 2013 2014
Kgal Sales Rainfall (inches)
Kga
ls S
ales
Rai
nfal
l (i
nces
)
92
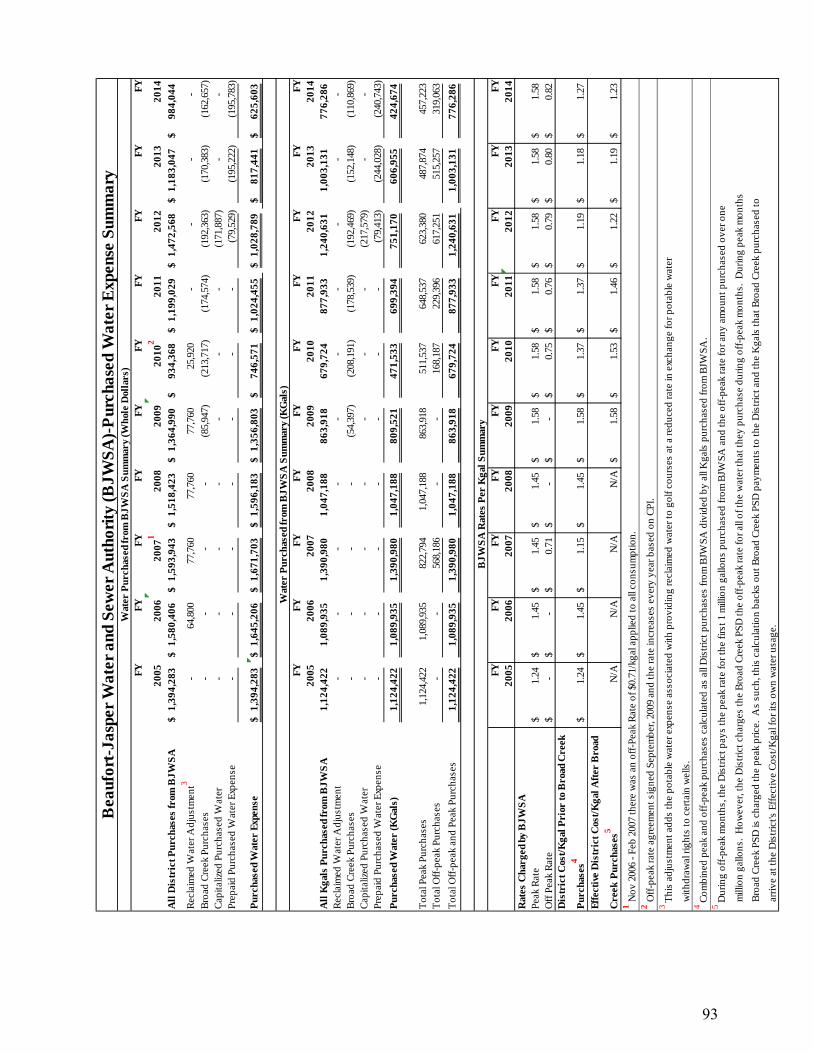
FYFY
FYFY
FYFY
FYFY
FYFY
2005
2006
2007
120
0820
0920
102
2011
2012
2013
2014
All
Dis
tric
t Pur
chas
es fr
om B
JWS
A1,
394,
283
$
1,58
0,40
6$
1,
593,
943
$
1,51
8,42
3$
1,
364,
990
$
934,
368
$
1,
199,
029
$
1,47
2,56
8$
1,
183,
047
$
984,
044
$
Rec
laim
ed W
ater
Adj
ustm
ent3
-
64
,800
77
,760
77
,760
77
,760
25
,920
-
-
-
-
B
road
Cre
ek P
urch
ases
-
-
-
-
(85,
947)
(213
,717
)
(174
,574
)
(192
,363
)
(170
,383
)
(162
,657
)
Cap
italiz
ed P
urch
ased
Wat
er-
-
-
-
-
-
-
(171
,887
)
-
-
Prep
aid
Purc
hase
d W
ater
Exp
ense
-
-
-
-
-
-
-
(7
9,52
9)
(1
95,2
22)
(1
95,7
83)
Pur
chas
ed W
ater
Exp
ense
1,39
4,28
3$
1,
645,
206
$
1,67
1,70
3$
1,
596,
183
$
1,35
6,80
3$
74
6,57
1$
1,02
4,45
5$
1,
028,
789
$
817,
441
$
62
5,60
3$
FYFY
FYFY
FYFY
FYFY
FYFY
2005
2006
2007
2008
2009
2010
2011
2012
2013
2014
All
Kga
ls P
urch
ased
from
BJW
SA
1,12
4,42
2
1,
089,
935
1,39
0,98
0
1,
047,
188
863,
918
67
9,72
4
877,
933
1,
240,
631
1,00
3,13
1
77
6,28
6
Rec
laim
ed W
ater
Adj
ustm
ent
-
-
-
-
-
-
-
-
-
-
Bro
ad C
reek
Pur
chas
es-
-
-
-
(5
4,39
7)
(2
08,1
91)
(1
78,5
39)
(1
92,4
69)
(1
52,1
48)
(1
10,8
69)
C
apita
lized
Pur
chas
ed W
ater
-
-
-
-
-
-
-
(2
17,5
79)
-
-
Pr
epai
d Pu
rcha
sed
Wat
er E
xpen
se-
-
-
-
-
-
-
(79,
413)
(244
,028
)
(240
,743
)
Pur
chas
ed W
ater
(KG
als)
1,12
4,42
2
1,
089,
935
1,39
0,98
0
1,
047,
188
809,
521
47
1,53
3
699,
394
75
1,17
0
606,
955
42
4,67
4
Tot
al P
eak
Purc
hase
s 1,
124,
422
1,
089,
935
82
2,79
4
1,
047,
188
86
3,91
8
51
1,53
7
64
8,53
7
62
3,38
0
48
7,87
4
45
7,22
3
T
otal
Off
-pea
k Pu
rcha
ses
-
-
568,
186
-
-
168,
187
229,
396
617,
251
515,
257
319,
063
Tot
al O
ff-p
eak
and
Peak
Pur
chas
es1,
124,
422
1,08
9,93
5
1,
390,
980
1,04
7,18
8
86
3,91
8
679,
724
87
7,93
3
1,24
0,63
1
1,
003,
131
776,
286
FYFY
FYFY
FYFY
FYFY
FYFY
2005
2006
2007
2008
2009
2010
2011
2012
2013
2014
Rat
es C
harg
ed b
y B
JWS
APe
ak R
ate
1.24
$
1.45
$
1.45
$
1.45
$
1.58
$
1.58
$
1.58
$
1.58
$
1.58
$
1.58
$
Off
Pea
k R
ate
-$
-
$
0.71
$
-$
-
$
0.75
$
0.76
$
0.79
$
0.80
$
0.82
$
Dis
tric
t Cos
t/K
gal P
rior
to B
road
Cre
ek
Pur
chas
es4
1.24
$
1.45
$
1.15
$
1.45
$
1.58
$
1.37
$
1.37
$
1.19
$
1.18
$
1.27
$
Effe
ctiv
e D
istr
ict C
ost/
Kga
l Aft
er B
road
Cre
ek P
urch
ases
5N
/AN
/AN
/AN
/A1.
58$
1.
53$
1.
46$
1.
22$
1.
19$
1.
23$
1 N
ov 2
006
- Feb
200
7 th
ere
was
an
off-
Peak
Rat
e of
$0.
71/k
gal a
pplie
d to
all
cons
umpt
ion.
2 Off
-pea
k ra
te a
gree
men
t sig
ned
Sept
embe
r, 20
09 a
nd th
e ra
te in
crea
ses
ever
y ye
ar b
ased
on
CPI
.3
Thi
s ad
just
men
t add
s th
e po
tabl
e w
ater
exp
ense
ass
ocia
ted
with
pro
vidi
ng re
clai
med
wat
er to
gol
f cou
rses
at a
redu
ced
rate
in e
xcha
nge
for p
otab
le w
ater
w
ithdr
awal
righ
ts to
cer
tain
wel
ls.
4 C
ombi
ned
peak
and
off
-pea
k pu
rcha
ses
calc
ulat
ed a
s al
l Dis
tric
t pur
chas
es fr
om B
JWSA
div
ided
by
all K
gals
pur
chas
ed fr
om B
JWSA
.5
Dur
ing
off-
peak
mon
ths,
the
Dis
tric
t pay
s th
e pe
ak ra
te fo
r the
firs
t 1 m
illio
n ga
llons
pur
chas
ed fr
om B
JWSA
and
the
off-
peak
rate
for a
ny a
mou
nt p
urch
ased
ove
r one
m
illio
n ga
llons
. H
owev
er, t
he D
istr
ict c
harg
es th
e B
road
Cre
ek P
SD th
e of
f-pe
ak ra
te fo
r all
of th
e w
ater
that
they
pur
chas
e du
ring
off-
peak
mon
ths.
Dur
ing
peak
mon
ths
B
road
Cre
ek P
SD is
cha
rged
the
peak
pric
e. A
s su
ch, t
his
calc
ulat
ion
back
s ou
t Bro
ad C
reek
PSD
pay
men
ts to
the
Dis
tric
t and
the
Kga
ls th
at B
road
Cre
ek p
urch
ased
to
ar
rive
at th
e D
istr
ict's
Eff
ectiv
e C
ost/
Kga
l for
its
own
wat
er u
sage
.Wat
er P
urch
ased
from
BJW
SA
Sum
mar
y (W
hole
Dol
lars
)
Wat
er P
urch
ased
from
BJW
SA
Sum
mar
y (K
Gal
s)
BJW
SA
Rat
es P
er K
gal S
umm
ary
Bea
ufor
t-Ja
sper
Wat
er a
nd S
ewer
Aut
hori
ty (
BJW
SA
)-P
urch
ased
Wat
er E
xpen
se S
umm
ary
93
Hilton Head No. 1 Public Service District 21 Oak Park Drive P.O. Box 21264 Hilton Head Island, SC 29925 843.681.5525
www.hhpsd.com
94