SB 360 Article Series - Article# 1: Replacing Transportation Concurrency with a Mobility Fee

HILLSBOROUGH COUNTY MOBILITY FEE STUDY FINAL REPORT
April 26, 2016
Prepared for:
Hillsborough County Public Works
601 E. Kennedy Blvd, 22nd Floor
Tampa, Florida 33602
ph (813) 307-1868
fax (813) 272-5811
Prepared by:
Tindale Oliver
1000 N. Ashley Drive, Suite 400
Tampa, Florida, 33602
ph (813) 224-8862
fax (813) 226-2106
E-mail: [email protected]
603013-00.15

Tindale Oliver Hillsborough County April 2016 i Mobility Fee Study
Hillsborough County
Mobility Fee Study
Table of Contents
INTRODUCTION ........................................................................................................... 1
DEMAND COMPONENT ................................................................................................ 6
Travel Demand ........................................................................................................ 6
Interstate & Toll Facility Discount Factor ............................................................... 6
Conversion of Vehicle-Trips to Person-Trips .......................................................... 7
COST COMPONENT ...................................................................................................... 8
County Roadway Cost ............................................................................................. 8
State Roadway Cost ................................................................................................ 10
Summary of Costs (Blended Cost Analysis) ............................................................ 12
Person-Miles of Capacity Added per Lane Mile (Roadways) .................................. 13
Cost per Person-Mile of Capacity Added (Roadways) ............................................ 14
Bicycle and Pedestrian Facility Costs ...................................................................... 15
Transit Capital Cost per Person-Mile of Travel ....................................................... 15
CREDIT COMPONENT ................................................................................................... 17
Capital Improvement Credit ................................................................................... 17
Present Worth Variables ......................................................................................... 19
Fuel Efficiency ......................................................................................................... 19
Effective Days per Year ........................................................................................... 20
ASSESSMENT DISTRICT ANALYSIS ................................................................................. 21
CALCULATED MOBILITY FEE SCHEDULE ........................................................................ 26
Mobility Fee Calculation ......................................................................................... 28
Mobility Fee Comparison ........................................................................................ 28
BENEFIT DISTRICT ANALYSIS ........................................................................................ 30
INDEXING ..................................................................................................................... 35
Appendix A: Demand Component Calculations
Appendix B: Cost Component Calculations
Appendix C: Credit Component Calculations
Appendix D: Mobility Fee Schedules

Tindale Oliver Hillsborough County April 2016 1 Mobility Fee Study
Introduction Hillsborough County’s transportation impact fee schedule was initially adopted in 1985, and
updated in 1989. Since then, there has been no major update or significant changes in the
transportation impact fee rates. Hillsborough County has retained Tindale Oliver to prepare
an update study to reflect changes to the cost, credit, and demand components since 1989.
The County is interested in converting the current roadway-based transportation impact fee
to a mobility fee. A mobility fee shares the same basic principles as a road impact fee except
that it provides additional flexibility to fund capital infrastructure for transit, bicycle, and
pedestrian facilities, in addition to roads, therefore recouping costs associated with new
development’s impact to the entire transportation system (excluding rail, interstates, and toll
facilities).
Per Florida Statutes, by transitioning to a mobility fee, the County will no longer require
transportation concurrency at site-plan review stage.
This report consists of the following sections:
Demand Component
Cost Component
Credit Component
Assessment District Analysis
Mobility Fee Calculation
Mobility Fee Comparison
Benefit District Analysis
Methodology
The methodology used for the mobility fee study follows a consumption-driven approach in
which new development is charged based upon the proportion of person-miles of travel
(PMT) that each unit of new development is expected to consume of a lane-mile of the
transportation network. The use of PMT is one of the primary differences from the current
methodology which uses vehicle-miles of travel (VMT) to calculate the transportation impact
fee. A consumption-based fee charges new growth the proportionate share of the cost of
providing additional infrastructure available for use by new growth. In addition, per legal
requirements, a credit is subtracted from the total cost to account for the value of future tax
contributions of the new development toward any capacity expansion projects through other

Tindale Oliver Hillsborough County April 2016 2 Mobility Fee Study
revenue sources. Contributions used to calculate the credit component include estimates of
future non-impact fee/mobility fee revenues generated by the new development that will be
used toward capacity expansion projects. In other words, case law requires that the new
development should not be charged twice for the same service.
The mobility fees developed in this report assess a proportionate share cost for the entire
transportation network in the county, including classified County and State roadways, with
the exception of local/neighborhood roads. Generally, neighborhood roads are the
obligation of the developer and are part of the site/subdivision approvals.
Legal Standard Overview
In Florida, legal requirements related to impact fees have primarily been established through
case law since the 1980’s. Generally speaking, impact fees must comply with the “dual
rational nexus” test, which requires that they:
Be supported by a study demonstrating that the fees are proportionate in amount to
the need created by new development paying the fee; and
Be spent in a manner that directs a proportionate benefit to new development,
typically accomplished through establishment of benefit districts and a list of capacity-
adding projects included in the County’s Capital Improvement Plan, Capital
Improvement Element, or another planning document/Master Plan.
In 2006, the Florida legislature passed the “Florida Impact Fee Act,” which recognized impact
fees as “an outgrowth of home rule power of a local government to provide certain services
within its jurisdiction.” § 163.31801(2), Fla. Stat. The statute – concerned with mostly
procedural and methodological limitations – did not expressly allow or disallow any particular
public facility type from being funded with impact fees. The Act did specify procedural and
methodological prerequisites, such as the requirement of the fee being based on most recent
and localized data, a 90-day requirement for fee changes, and other similar requirements,
most of which were common to the practice already.
More recent legislation further affected the impact fee framework in Florida, including the
following:
HB 227 in 2009: The Florida legislation statutorily clarified that in any action
challenging an impact fee, the government has the burden of proving by a

Tindale Oliver Hillsborough County April 2016 3 Mobility Fee Study
preponderance of the evidence that the imposition or amount of the fee meets the
requirements of state legal precedent or the Impact Fee Act and that the court may
not use a deferential standard.
SB 360 in 2009: Allowed fees to be decreased without the 90-day notice period
required to increase the fees and purported to change the standard of legal review
associated with impact fees. SB 360 also required the Florida Department of
Community Affairs (now the Department of Economic Opportunity) and Florida
Department of Transportation (FDOT) to conduct studies on “mobility fees,” which
were completed in 2010.
HB 7207 in 2011: Required a dollar-for-dollar credit, for purposes of concurrency
compliance, for impact fees paid and other concurrency mitigation required. The
payment must be reduced by the percentage share the project’s traffic represents of
the added capacity of the selected improvement (up to a maximum of 20 percent or
to an amount specified by ordinance, whichever results in a higher credit).
HB 319 in 2013: Applied mostly to concurrency management authorities, but also
encouraged local governments to adopt alternative mobility systems using a series of
tools identified in section 3180(5)(f), Florida Statutes, including:
1. Adoption of long-term strategies to facilitate development patterns that
support multi-modal solutions, including urban design, and appropriate land use
mixes, including intensity and density.
2. Adoption of an area-wide level of service not dependent on any single road
segment function.
3. Exempting or discounting impacts of locally desired development, such as
development in urban areas, redevelopment, job creation, and mixed use on the
transportation system.
4. Assigning secondary priority to vehicle mobility and primary priority to ensuring
a safe, comfortable, and attractive pedestrian environment, with convenient
interconnection to transit.
5. Establishing multimodal level of service standards that rely primarily on non-
vehicular modes of transportation where existing or planned community design
will provide adequate level of mobility.
6. Reducing impact fees or local access fees to promote development within urban
areas, multimodal transportation districts, and a balance of mixed-use
development in certain areas or districts, or for affordable or workforce housing.

Tindale Oliver Hillsborough County April 2016 4 Mobility Fee Study
Also, under HB 319, a mobility fee funding system expressly must comply with the dual
rational nexus test applicable to traditional impact fees. Furthermore, any mobility fee
revenues collected must be used to implement the local government’s plan, which served as
the basis for the fee. Finally, under HB 319, an alternative mobility system, that is not mobility
fee‐based, must not impose upon new development any responsibility for funding an existing
transportation deficiency.
The following paragraphs provide further detail on the generally applicable legal standards
applicable here.
Mobility Fee Definition
A mobility fee is a one-time capital charge levied against new development.
A mobility fee is designed to cover the portion of the capital costs of infrastructure
capacity consumed by new development.
The principle purpose of a mobility fee is to assist in funding the implementation of
projects identified in the Capital Improvements Element (CIE) and other capital
improvement programs for the respective facility/service categories.
A mobility fee replaces concurrency at site-plan review stage.
Mobility Fee vs. Tax
A mobility fee is generally regarded as a regulatory function established as a condition
for improving property and is not established for the primary purpose of generating
revenue, as taxes are.
Mobility fee expenditures must convey a proportional benefit to the fee payer. This
is accomplished through the establishment of benefit districts, where fees collected
in a benefit district are spent in the same benefit district. This report established five
mobility fee benefit districts in Hillsborough County.
A mobility fee must be tied to a proportional need for new infrastructure capacity
created by new development.
Included in this document is the necessary support material used in the calculation of the
mobility fee. The general equation used to compute the mobility fee for a given land use is:
[Demand x Cost] – Credit = Fee
Tindale Oliver Hillsborough County April 2016 5 Mobility Fee Study
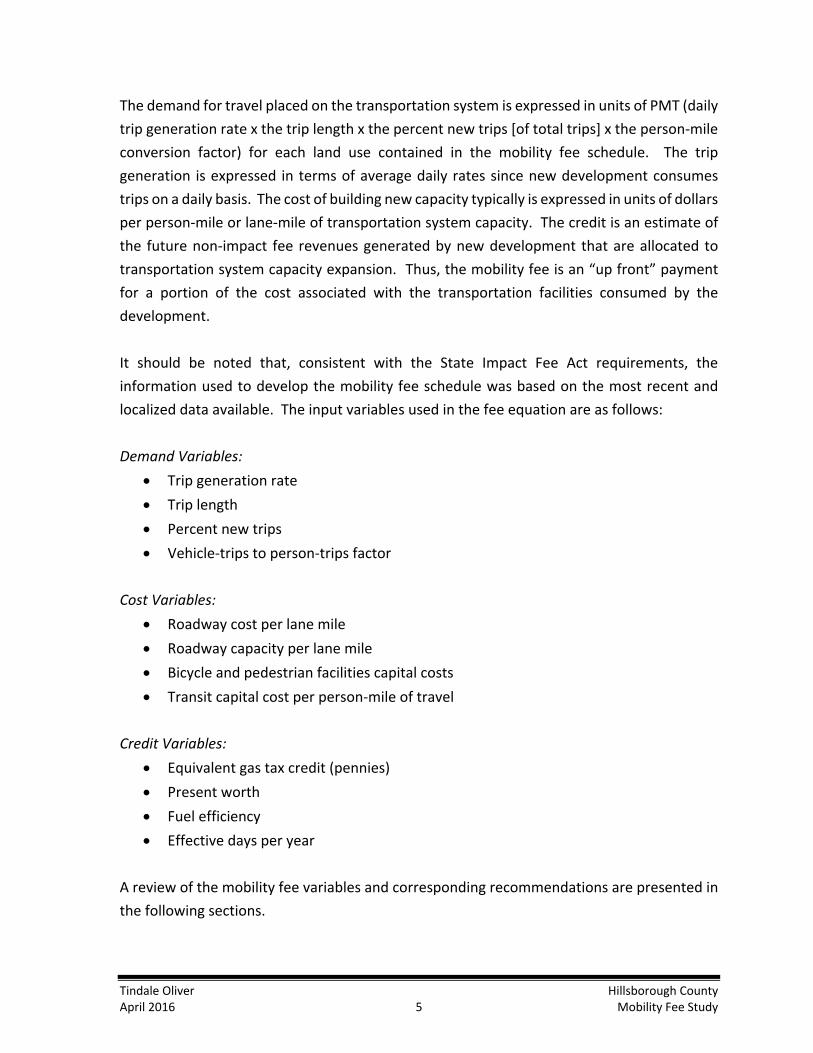
The demand for travel placed on the transportation system is expressed in units of PMT (daily
trip generation rate x the trip length x the percent new trips [of total trips] x the person-mile
conversion factor) for each land use contained in the mobility fee schedule. The trip
generation is expressed in terms of average daily rates since new development consumes
trips on a daily basis. The cost of building new capacity typically is expressed in units of dollars
per person-mile or lane-mile of transportation system capacity. The credit is an estimate of
the future non-impact fee revenues generated by new development that are allocated to
transportation system capacity expansion. Thus, the mobility fee is an “up front” payment
for a portion of the cost associated with the transportation facilities consumed by the
development.
It should be noted that, consistent with the State Impact Fee Act requirements, the
information used to develop the mobility fee schedule was based on the most recent and
localized data available. The input variables used in the fee equation are as follows:
Demand Variables:
Trip generation rate
Trip length
Percent new trips
Vehicle-trips to person-trips factor
Cost Variables:
Roadway cost per lane mile
Roadway capacity per lane mile
Bicycle and pedestrian facilities capital costs
Transit capital cost per person-mile of travel
Credit Variables:
Equivalent gas tax credit (pennies)
Present worth
Fuel efficiency
Effective days per year
A review of the mobility fee variables and corresponding recommendations are presented in
the following sections.

Tindale Oliver Hillsborough County April 2016 6 Mobility Fee Study
Demand Component
Travel Demand
The amount of road system consumed by a unit of new land development is calculated using
the following variables and is a measure of the vehicle miles of new travel a unit of
development places on the existing roadway system:
Number of daily trips generated;
Average length of those trips; and
Proportion of travel that is new travel, rather than travel that is already on the
transportation system.
As part of this update, the trip characteristics variables were obtained primarily from two
sources: (1) similar studies conducted throughout Florida (Florida Studies Database) and (2)
the Institute of Transportation Engineers’ (ITE) Trip Generation reference report (9th edition).
The Florida Trip Characteristics Studies Database is included in Appendix A. This database
was used to determine trip length, percent new trips, and trip rate for some land uses.
Interstate &Toll Facility Discount Factor
This variable was used to recognize that interstate highway and toll facility improvements are
funded by the State (specifically, the Florida Department of Transportation) using earmarked
State and Federal funds. Typically, mobility fees are not used to pay for these improvements
and the portion of travel occurring on the interstate/toll facility system is usually eliminated
from the total travel for each use.
To calculate the interstate and toll (I/T) facility discount factor, the loaded highway network
file was generated for the Tampa Bay Regional Planning Model (TBRPM v8.0). A select link
analysis was run for all traffic analysis zones located within Hillsborough County in order to
differentiate trips with an origin and/or destination within the county versus trips with no
origin or destination within the county.
Currently, interstate and toll facilities in Hillsborough County include I-275, I-75, I-4, the
Suncoast Parkway, the Lee Roy Selmon Expressway and the Veterans Expressway (to Dale
Mabry). The limited access vehicle-miles of travel (Limited Access VMT) for trips with an

Tindale Oliver Hillsborough County April 2016 7 Mobility Fee Study
origin and/or destination within County was calculated for the identified limited access
facilities. The total Hillsborough County VMT was calculated for all trips with an origin and/or
destination within County for all roads, including limited access facilities, located within
Hillsborough County.
The I/T discount factor of 36.6 percent was determined by dividing the total limited access
VMT by the total County VMT. By applying this factor to the total County VMT, the reduced
VMT is then representative of only the roadways which are funded by impact/mobility fees.
Appendix A, Table A-1 provides further detail on this calculation.
Conversion of Vehicle-Trips to Person-Trips
In the case of the mobility approach, it is necessary to estimate travel in units of person-miles.
Vehicle-trips were converted to person-trips by applying a vehicle-trip to person-trip
conversion factor of 1.30. This value was derived from a review of the TBRPM v8.0 and
nationwide travel data and vehicle occupancy levels observed in other communities
throughout Florida. Given that a large portion of travel occurs via automobile, this approach
is found to be reasonable.

Tindale Oliver Hillsborough County April 2016 8 Mobility Fee Study
Cost Component Since the County’s current impact fee calculation, which was last updated in 1989, there has
been significant increases in transportation costs. Especially over the past 10 years,
transportation capital costs fluctuated significantly in Florida. Costs increased significantly
between 2005 and 2007 due to additional construction demand caused by hurricanes, the
housing market growth, and other factors. Appreciation in land values also resulted in higher
right-of-way (ROW) costs during the same period. In early 2008, costs started to stabilize and
between 2008 and 2011 most communities experienced a decrease in construction costs,
returning to levels seen before 2005. In 2013/2014, roadway costs started to increase again
in Florida and have continued to increase. Cost information from Hillsborough County, other
Florida Counties, and the Florida Department of Transportation (FDOT) was reviewed to
develop a unit cost for all phases involved in the construction of one lane-mile of roadway
capacity. Additionally, cost information for bicycle/pedestrian and transit facilities was
reviewed and included in the cost component calculations for the mobility fee rate. The
following sections summarize the methodology and findings of the total unit cost analysis for
all modes of travel. Appendix B provides the data and other support information utilized in
these analyses.
County Roadway Cost
This section examines the right-of-way (ROW), construction and other cost components
associated with county roads with respect to transportation capacity expansion
improvements in Hillsborough County. For this purpose, recent bid data for recently
completed/ongoing local projects and recent construction bid data from roadway projects
throughout Florida were used to identify and provide supporting cost data for County
roadway improvements. The cost for each roadway capacity project was separated into four
phases: design, construction/engineering inspection (CEI), ROW, and construction.
Design and CEI
Design costs for county roads were estimated at 12 percent of construction phase costs based
on a review of recently completed and ongoing local improvements and a recent
transportation impact fee studies throughout Florida. Additional detail is included in
Appendix B, Tables B-2 and B-10.

Tindale Oliver Hillsborough County April 2016 9 Mobility Fee Study
CEI costs for county roads were estimated at nine (9) percent of construction phase costs
based on a review of recently completed and ongoing local improvements and a review of
recent transportation impact fee studies throughout Florida. Additional detail is included in
Appendix B, Tables B-8 and B-17.
Right-of-Way
The ROW cost reflects the total cost of the acquisitions along a corridor that were necessary
to have sufficient cross-section width to widen an existing road or, in the case of new
construction, to build a new road. A review of recent ROW cost data for Hillsborough County
identified 13 improvements with acquisition data. Using the construction costs for these
improvements, a ROW-to-construction factor was calculated for each improvement, ranging
from 4 to 119 percent, with a weighted average of approximately 44 percent. Based on this
review and discussions with staff, ROW costs were estimated at 50 percent of the county road
construction costs for the mobility fee calculation. The use of a 50 percent ROW factor is
higher than other ROW ratios seen in recent impact fee studies throughout Florida, which
average approximately 41 percent for county roadways. This reflects County’s urban nature
that results in higher ROW costs compared to more suburban and rural jurisdictions.
Additional detail is included in Appendix B, Tables B-4 and B-12.
Construction
The construction cost for county roads was based on a review of local and statewide projects.
A review of recent construction cost data for Hillsborough County identified 13 recent
capacity expansion improvements averaging $3.02 million per lane mile, as shown in
Appendix B, Table B-14.
In addition to local improvements, recent bids from multiple communities throughout the
state were also reviewed. This review included more than 320 lane miles of urban-design
(curb & gutter) roadway improvements from 17 counties and calculated and average cost of
$2.15 million per lane mile. Appendix B, Table B-15 provides a detailed description of the
projects reviewed.
Based on this review and a discussion with staff, a county roadway cost of $3.00 million per
lane mile was used in the mobility fee calculation for county roads with urban-design
characteristics.
To determine the cost per lane mile for county roads with rural-design characteristics (open
drainage), the relationship between urban and rural roadway costs from the FDOT District 7

Tindale Oliver Hillsborough County April 2016 10 Mobility Fee Study
Long Range Estimates (LRE)1 was reviewed. Based on these cost estimates, the costs for
roadways with rural-design characteristics were estimated at approximately 77 percent of
the costs for roadways with urban-design characteristics. Additional detail is provided in
Appendix B, Table B-1.
To determine the weighted average cost for county roadways, the cost for urban-design and
rural-design roadways were weighted based on the distribution of urban and rural roadways
included in the Hillsborough County Metropolitan Planning Organization’s 2040 Long Range
Transportation Plan’s Cost Feasible Plan and the Community Transportation Plan (Appendix
B, Table B-19). As shown in Table 1, the weighted average county roadway construction cost
was calculated at approximately $2.90 million per lane mile, with a total weighted average
cost of $4.95 million per lane mile for county roadways.
Table 1
Estimated Total Cost per Lane Mile for County Roads
1) Source: Appendix B, Table B-2 2) Source: Appendix B, Table B-4 3) Source: Appendix B, Table B-6 4) Source: Appendix B, Table B-8 5) Source: Appendix B, Table B-19; Items (c) and (d) 6) Urban/Rural distribution (Item 5) multiplied by the design, ROW, construction, and CEI
phase costs to develop a weighted average cost per lane mile
State Roadway Cost
This section examines the right-of-way, construction and other cost components associated
with state roads with respect to transportation capacity expansion improvements in
Hillsborough County. For this purpose, recent data from state roadway projects bid in
Hillsborough County and throughout Florida and the FDOT’s Long Range Estimates were used
1 http://www.dot.state.fl.us/planning/policy/costs/
UrbanDesign
RuralDesign
Weighted
Average(6)
Design(1) $360,000 $277,000 $348,000
Right-of-Way(2) $1,500,000 $1,155,000 $1,448,000
Construction(3) $3,000,000 $2,310,000 $2,897,000
CEI(4) $270,000 $208,000 $261,000
Total Cost $5,130,000 $3,950,000 $4,954,000
Lane Mile Distribution(5) 85% 15% 100%
Cost PhaseCost per Lane Mile

Tindale Oliver Hillsborough County April 2016 11 Mobility Fee Study
to identify and provide supporting cost data for state improvements. The cost for each
roadway capacity-expansion project was separated into four phases: design, CEI, ROW, and
construction.
Design and CEI
Design and CEI costs for state roads were each estimated at 11 percent of construction phase
costs based on a review of recent transportation impact fee studies throughout Florida.
Additional detail is provided in Appendix B, Tables B-11 (design) and B-18 (CEI).
Right-of-Way
Given the limited data on ROW costs for state roads in Hillsborough County and based on
experience in other jurisdictions, the ROW cost ratio calculation for county roads was also
applied to state roads. Using this ROW-to-construction ratio of 50 percent, the ROW cost for
state roads with urban design characteristics is approximately $1.50 million per lane mile.
Construction
A review of recent state road capacity improvements in Hillsborough County identified three
historical improvements, as shown in Appendix B, Table B-16:
CR 39/Alexander St from N. of I-4 to N. of Knights Griffin
SR 574 (MLK Jr. Blvd) from W. of Highview Rd to E. of Parsons Ave
SR 41 (US 301) from S. of Tampa Bypass Canal to N. of Fowler Ave
These improvements ranged from approximately $1.16 million per lane mile to $4.35 million
per lane mile for construction, with the two most recent improvements averaging
approximately $4.20 million per lane mile. To increase the sample size, these costs were
compared to costs for state road improvements for several other jurisdiction throughout the
state. Considering 70 improvements with over 340 lane miles, the weighted average cost per
lane mile for state road construction was approximately $3.10 million per lane mile.
Appendix B, Table B-16 provides a detailed description of the projects analyzed. Based on
this review, a state roadway construction cost of $3.00 million per lane mile was used in the
mobility fee calculation.
To determine the cost per lane mile for state roads with rural design characteristics, the
relationship between urban and rural roadway costs for state roadways was reviewed. With
only limited local data available, the recent data from the FDOT District 7 LRE was reviewed.

Tindale Oliver Hillsborough County April 2016 12 Mobility Fee Study
Based on these costs estimates, the costs for roadways with rural design characteristics were
estimated to be approximately 77 percent of the costs for roadways with urban design
characteristics. Additional detail is provided in Appendix B, Table B-1.
To determine the weighted average cost for state roadways, the cost for urban-design and
rural-design roadways were weighted based on the distribution of urban and rural roadways
included in the County’s 2040 Long Range Transportation Plan’s Cost Feasible Plan and the
Community Transportation Plan (Appendix B, Table B-19). As shown in Table 2, the weighted
average state roadway construction cost was calculated at approximately $2.90 million per
lane mile, with a total weighted average cost of $4.98 million per lane mile for state roadways.
Table 2 Cost per Lane Mile for State Roads
1) Source: Appendix B, Table B-3 2) Source: Appendix B, Table B-5 3) Source: Appendix B, Table B-7 4) Source: Appendix B, Table B-9 5) Source: Appendix B, Table B-19; Items (c) and (d) 6) Urban/Rural distribution (Item 5) multiplied by the design, ROW, construction, and
CEI phase costs to develop a weighted average cost per lane mile
Summary of Costs (Blended Cost Analysis)
The weighted average cost per lane mile for county and state roads is presented in Table 3.
The resulting weighted average cost of approximately $4.96 million per lane mile was utilized
as the roadway cost input in the calculation of the mobility fee schedule. The weighted
average cost per lane mile includes county and state roads and is based on weighting the lane
miles of roadway improvements in the County’s 2040 Long Range Transportation Plan’s Cost
Feasible Plan and the Community Transportation Plan.
UrbanDesign
RuralDesign
Weighted
Average(6)
Design(1) $330,000 $254,000 $319,000
Right-of-Way(2) $1,500,000 $1,155,000 $1,448,000
Construction(3) $3,000,000 $2,310,000 $2,897,000
CEI(4) $330,000 $254,000 $319,000
Total Cost $5,160,000 $3,973,000 $4,983,000
Lane Mile Distribution(5) 85% 15% 100%
Cost PhaseCost per Lane Mile

Tindale Oliver Hillsborough County April 2016 13 Mobility Fee Study
Table 3 Estimated Cost per Lane Mile for
County and State Roadway Projects in Hillsborough County
1) Source: Table 1 2) Source: Table 2 3) Lane mile distribution (Item 4) multiplied by the design, ROW, construction, and
CEI phase costs by jurisdiction to develop a weighted average cost per lane mile 4) Source: Appendix B, Table B-19; Items (a) and (b)
Person-Miles of Capacity Added per Lane Mile (Roadways)
An additional component of the transportation fee equation is the capacity added per lane
mile (also known as the maximum service volume added per mile) of roadway constructed.
To calculate the vehicle-miles of capacity (VMC) per lane mile of constructed future roadway,
an analysis of the Hillsborough County 2040 Long Range Transportation Plan’s Cost Feasible
Plan and the Community Transportation Plan (see Appendix B, Table B-19) was conducted to
review improvements that will be built in Hillsborough County in the future. As shown in
Table 4, the VMC was then converted to person-miles of capacity (PMC) using the person-trip
factor (1.30 persons per vehicle) previously discussed.
Cost Type County Roads(1) State Roads(2) County and
State Roads(3)
Design $348,000 $319,000 $340,000
Right-of-Way $1,448,000 $1,448,000 $1,448,000
Construction $2,897,000 $2,897,000 $2,897,000
CEI $261,000 $319,000 $277,000
Total $4,954,000 $4,983,000 $4,962,000
Lane Mile Distribution(4) 72% 28% 100%

Tindale Oliver Hillsborough County April 2016 14 Mobility Fee Study
Table 4 Weighted Average Capacity Added per Lane Mile
1) Source: Appendix B, Table B-19 2) Vehicle-miles of capacity added (Item 2) divided by lane mile added (Item 1) 3) Source: Based on a review of the transportation model, nation-wide vehicle occupancy data, and peer
jurisdictions 4) VMC added per lane mile (Item 3) multiplied by the vehicle-trip to person-trip factor (Item 4)
5) Total vehicles miles of capacity added for city/county and state roads (Item 2) divided by the total lane miles added (Item 1)
Cost per Person-Mile of Capacity Added (Roadways)
The transportation cost per unit of development is assessed based on the cost per person-
mile of capacity. As shown in Tables 3 and 4, the cost and capacity for roadways in
Hillsborough County have been calculated based on typical roadway improvements. As
shown in Table 5, the cost per PMC for travel within County is $401.78.
The cost per PMC figure is used in the transportation fee calculation to determine the total
mobility cost per unit of development based on the person-miles of travel consumed. For
each person-mile of travel that is added to the road system, approximately $400 of
transportation capacity is consumed.
Table 5 Cost per Person‐Mile of Capacity Added (Roadways)
1) Source: Table 3 2) Source: Table 4 3) Cost per lane mile (Item 1) divided by average PMC added per lane mile (Item 2)
SourceLane Mile
Added(1)
Vehicle‐Miles of
Capacity Added(1)
VMC Added per Lane
Mile(2)
Vehicle‐Trip to Person‐Trip
Factor(3)
PMC Added per Lane
Mile(4)
County Roads 98.06 891,447 9,091 1.30 11,818
State Roads 38.32 398,156 10,390 1.30 13,507
Total 136.38 1,289,603
Weighted Average VMC Added per Lane Mile(5) 9,500 1.30 12,350
SourceCost per Lane
Mile(1)
Average PMC Added per Lane
Mile(2)
Cost per
PMC(3)
County Roads $4,954,000 11,818 $419.19
State Roads $4,983,000 13,507 $368.92
Weighted Average $4,962,000 12,350 $401.78

Tindale Oliver Hillsborough County April 2016 15 Mobility Fee Study
Bicycle and Pedestrian Facility Costs
Bicycle and pedestrian facilities provide for relatively small quantities of the total vehicle-
miles of travel due to the difference in the average distance traveled by a car trip versus
pedestrian/bicycle trips. Because of their relatively small role in the urban travel scheme,
they do not have a significant effect on evaluating the costs of providing for mobility.
However, bike and pedestrian facilities are important and provide a source of travel for those
who cannot drive or cannot afford to drive, and they are a standard part of the urban street
and sometimes included in rural roadways. Their costs are included in the standard roadway
cross-sections for which costs are estimated for safety and mobility reasons. Thus, the costs
of these facilities on major roads are included in the mobility fee. The mobility fee provides
funding for only those bike and pedestrian facilities associated with roadways on the
classified road system (excluding local/neighborhood roads), and allows for facilities to be
added to existing classified roadways or included in the construction of a new classified
roadway or lane addition improvement.
Transit Capital Cost per Person-Mile of Travel
A model for transit service and cost was developed to establish both the capital cost per
person-mile of capacity and the system operating characteristics in terms of system coverage,
hours of service, and headways. The model developed for Hillsborough County was based on
information from the Hillsborough Area Regional Transit Authority’s (HART) Transit
Development Plan. Components of the transit capital cost include:
Vehicle acquisition tied to new routes
Bus stops, shelters, and benches
Cost of road network used by transit vehicles
Transit capital costs are computed as the cost of capital features needed to expand the transit
system, as follows:
Transit Capital Cost = Bus Infrastructure Cost + Road Capacity Cost
Taking into account the infrastructure costs and the decline in potential vehicle-capacity that
comes with adding transit, it was determined that the difference between constructing a lane
mile of roadway (for cars only) versus constructing a roadway with transit is not significant.

Tindale Oliver Hillsborough County April 2016 16 Mobility Fee Study
The roadway with transit cost per PMC is less than four (4) percent higher per lane mile than
the cost to simply construct a road without transit amenities. Therefore, for the mobility fee
calculation, the cost per PMC of approximately $400 is representative of the cost to provide
transportation capacity for all modes of travel. Additional information regarding the transit
capital cost calculation is included in Appendix B, Table B-20.

Tindale Oliver Hillsborough County April 2016 17 Mobility Fee Study
Credit Component
Capital Improvement Credit
The present value of the portion of non-impact/mobility fee funding generated by new
development over a 25-year period that is expected to be expended on capacity expansion
projects was credited against the cost of the system consumed by travel associated with new
development. In order to provide a connection to the demand component that is measured
in terms of travel, non-impact/mobility fee dollars are converted to gas tax equivalency.
City
As show in Table 6, the City of Tampa spends the equivalent of 0.6 pennies on transportation
capacity-expansion projects funded with non-impact fee revenues. In addition, the City
receives an equivalent credit of 0.1 pennies for debt service associated with transportation
capacity improvements. The future five-year plans for Temple Terrace and Plant City did not
include any transportation capacity improvements, and therefore no additional credit was
calculated for transportation improvements in these cities.
An additional revenue credit option was developed to reflect the increased transportation
capacity funding that would become available if the proposed 0.5 percent local option sales
tax is passed in Hillsborough County. Based on the current project lists for the Cities of
Tampa, Plant City, and Temple Terrace, and the projected revenues, this would increase the
revenue credit by 1.4 equivalent pennies.
County
As show in Table 6, Hillsborough County spends the equivalent of 5.3 pennies on
transportation capacity-expansion projects funded with non-impact/mobility fee revenues.
In addition, the County receives an equivalent credit of 3.4 pennies for debt service
associated with transportation capacity improvements.
An additional revenue credit option was developed to reflect the increased transportation
capacity funding that would become available if the proposed 0.5 percent local option sales
tax is passed in Hillsborough County. Based on the current project list and projected
revenues, this would increase the revenue credit by 16.0 equivalent pennies.

Tindale Oliver Hillsborough County April 2016 18 Mobility Fee Study
State
As show in Table 6, State expenditures on state roads were reviewed, and a credit for the
capacity-expansion portion attributable to state projects was estimated (excluding
expenditures on limited access facilities). The review, which included 10 years of historical
expenditures, as well as 5 years of planned expenditures, indicated that FDOT spending
generates an equivalent gas tax credit of 11.9 pennies of gas tax revenue annually. The use
of a 15-year period for developing a State credit results in a reasonably stable credit for
Hillsborough County, since it accounts for the volatility in FDOT spending in the county over
short time periods.
In summary, the City of Tampa contributes 0.7 pennies, Hillsborough County contributes
approximately 8.7 pennies, and FDOT is spending gas tax revenues at an average of 11.9
equivalent pennies for state transportation projects in Hillsborough County. With the
adoption of the sales tax, the City contribution increases to 2.1 total pennies and the County
contribution increases to 24.7 total pennies. Therefore, a total of 21.3 pennies (without sales
tax) or a total of 38.7 pennies (with sales tax) were included in the mobility fee equation to
recognize the future capital revenue that is expected to be generated by new development
from all non-impact/mobility fee revenues, as shown in Table 6.
Table 6 Equivalent Pennies of Gas Tax Revenue
1) Source: Appendix C, Table C-2 2) Source: Appendix C, Table C-5 3) Source: Appendix C, Table C-3 4) Source: Appendix C, Table C-6 5) Source: Appendix C, Table C-4 6) Source: Appendix C, Table C-7 7) Source: Appendix C, Table C-8
w/o Sales Tax w/Sales Tax
City Revenues(1) $0.006 $0.006
County Revenues(2) $0.053 $0.053
City Debt Service(3) $0.001 $0.001
County Debt Service(4) $0.034 $0.034
City Sales Tax(5) - $0.014
County Sales Tax(6) - $0.160
State Revenues(7) $0.119 $0.119
Total $0.213 $0.387
Equivalent Pennies per GallonCredit

Tindale Oliver Hillsborough County April 2016 19 Mobility Fee Study
Present Worth Variables
Facility Life
The facility life used in the mobility fee analysis is 25 years, which represents the reasonable
life of a roadway. Additionally, 10-year, 20-year and 30-year scenarios were created to reflect
different potential adoption lifecycles of the ½-cent local option sales tax. The resulting fee
rates for these options are presented in Appendix D, Tables D-5 through D-10.
Interest Rate
This is the discount rate at which gasoline tax revenues might be bonded. It is used to
compute the present value of the gasoline taxes generated by new development. The
discount rate of 2.5 percent was used in the mobility fee calculation based on information
obtained from Hillsborough County.
Fuel Efficiency
The fuel efficiency (i.e., the average miles traveled per gallon of fuel consumed) of the fleet
of motor vehicles was estimated using the quantity of gasoline consumed by travel associated
with a particular land use.
Appendix C, Table C-17 documents the calculation of the fuel efficiency value based on the
following equation, where “VMT” is vehicle miles of travel and “MPG” is fuel efficiency in
terms of miles per gallon.
TypeRoadwayTypeVehicle
TypeVehicleTypeRoadway MPG
VMTVMTEfficiencyFuel
The methodology uses non-interstate VMT and average fuel efficiency data for passenger
vehicles (i.e., passenger cars and other 2-axle, 4-tire vehicles, such as vans, pickups, and SUVs)
and large trucks (i.e., single-unit, 2-axle, 6-tire or more trucks and combination trucks) to
calculate the total gallons of fuel used by each of these vehicle types.
The combined total VMT for the vehicle types is then divided by the combined total gallons
of fuel consumed to calculate, in effect, a “weighted” fuel efficiency value that appropriately
accounts for the existing fleet mix of traffic on non-interstate roadways. The VMT and
average fuel efficiency data were obtained from the most recent Highway Statistics 2014

Tindale Oliver Hillsborough County April 2016 20 Mobility Fee Study
(Federal Highway Administration). Based on the calculation completed in Appendix C, Table
C-17, the fuel efficiency rate to be used in the updated mobility fee equation is 18.18 miles
per gallon.
Effective Days per Year
An effective 365 days per year of operation was assumed for all land uses in the proposed
fee. However, this will not be the case for all land uses since some uses operate only on
weekdays (e.g., office buildings) and/or only seasonally (e.g., schools). The use of 365 days
per year, therefore, provides a conservative estimate, ensuring that gasoline taxes are
adequately credited against the fee.

Tindale Oliver Hillsborough County April 2016 21 Mobility Fee Study
Assessment District Analysis Currently, Hillsborough County has 10 transportation impact fee assessment zones. Each
zone has a different fee rate for each land use in the impact fee schedule. The proposed
mobility fee will have two different schedules: one for development within the Urban Service
Area (USA) and the other for development outside of the USA. In addition, new growth within
the Residential Planned-2 (RP-2) area will be charged based on development type, which is
discussed in more detail later in this section. Map 1 presents the USA and RP-2 boundaries.
The fees in the USA are based on the adopted level-of-service (LOS) standard2. Currently, on
average, the roadways outside of the USA are performing significantly better than the
adopted LOS standard and in an effort to maintain this higher level of performance, a
differential capacity option was developed.
2 FL Statute 163.3180 emphasizes the adoption of an area-wide level-of-service not dependent on any single roadway segment function.

Tindale Oliver Hillsborough County April 2016 22 Mobility Fee Study
Map 1: Mobility Fee Assessment Districts

Tindale Oliver Hillsborough County April 2016 23 Mobility Fee Study
To create a transportation capacity differential, a review of the current volume-to-capacity
(V/C) ratio of all county and state roadways in Hillsborough was conducted. Figures 1 and 2
illustrate the distribution of roadway VMT based on each road segments current V/C ratio.
Figure 1 illustrates all of those segments within the USA (urban district) and Figure 2
illustrates those segments outside of the USA (rural district). As shown, the rural area
roadways have a much lower V/C ratio, indicating that those segments are less congested.
Figure 1: Percent of VMT by V/C Ratio (Inside Urban Service Area)
Source: Hillsborough County MPO, 2014 Level of Service Report
Figure 2: Percent of VMT by V/C Ratio (Outside Urban Service Area)
Source: Hillsborough County MPO, 2014 Level of Service Report
0.0%
2.0%
4.0%
6.0%
8.0%
10.0%
12.0%
14.0%
16.0%
18.0%
0.1 0.2 0.3 0.4 0.5 0.6 0.7 0.8 0.9 1.0 1.1 1.2 1.3 1.4 1.5 1.6 1.7 1.8 1.9 2.0 2.0+
0.0%
2.0%
4.0%
6.0%
8.0%
10.0%
12.0%
14.0%
16.0%
18.0%
0.1 0.2 0.3 0.4 0.5 0.6 0.7 0.8 0.9 1.0 1.1 1.2 1.3 1.4 1.5 1.6 1.7 1.8 1.9 2.0 2.0+

Tindale Oliver Hillsborough County April 2016 24 Mobility Fee Study
Within the USA, new development will be charged for their fair-share of travel added with
the adopted roadway LOS standard. Recognizing the higher quality of service currently
provided in the rural area, the County could elect to charge a higher fee outside of the USA
in an effort to preserve this higher LOS.
Based on the average V/C ratio achieved in the rural zone (≈0.6), as compared to the urban
zone (≈0.8), the capacity adjustment would need to be approximately 25 percent. Therefore,
the rural area person-miles of capacity added per lane mile would be reduced to
approximately 9,263. However, this reduction would only be applied to residential, office,
and industrial land uses. These land uses generally demand the longer trip lengths and
receive significant benefit from the high service levels, whereas retail uses attract more local
travel with shorter trip lengths and the benefit they receive is more limited. Therefore, the
retail uses are estimated to receive a capacity decrease of 12.5 percent.
Residential Planned‐2 (RP‐2):
RP-2 land use classification described in the Future Land Use Element (FLUE) of the County’s
Comprehensive Plan has certain characteristics that warrant a slightly different approach in
determining the appropriate fee levels for new development. These characteristics include
the following:
RP-2 is located adjacent to the USA and is identified as one of the areas located
outside the USA limits, but is appropriate for up to 2 units per gross acre development
in the future.
Per Policy 33.1 of FLUE, RP-2 may be eligible to receive transferable development
rights (TDR) from rural areas upon amendments outlined in Objective 32 of FLUE,
which increases its potential density up to 6 units per net acre and supports its rural
to urban transitioning make-up.
The ability to obtain the maximum intensities and/or densities permitted in the RP-2
land use categories on parcels 160 acres or greater is depending on the extent to
which developments are planned to achieve on-site clustering. The purpose of
clustering is to prevent urban sprawl and the Comprehensive Plan outlines required
clustering ratios for the mix of uses, such as neighborhood and retail shopping and
commercial development in addition to residential units.
The required level of on-site clustering may be waived for projects under 320 acres if
the required non-residential development is located within close proximity. FLUE

Tindale Oliver Hillsborough County April 2016 25 Mobility Fee Study
requires that the existing Community Commercial to be within 5 miles and
Neighborhood Commercial to be within 1.5 miles of the site.
Finally, Policy 33.11 of FLUE states that achieving adequate connectivity is a high
priority in areas designated as RP-2.
A review of travel within the portion of RP-2 located outside of USA suggests that VMT in this
area amounts to less than 3 percent of total VMT outside the USA, which is not significant.
Given that RP-2 have a mixture of urban and rural characteristics and serve as transition
areas, it is found appropriate that developments with urban characteristics within RP-2 are
charged the urban assessment rate and those with rural characteristics (e.g., 1 unit per acre,
etc.) are charged the rural assessment rate.

Tindale Oliver Hillsborough County April 2016 26 Mobility Fee Study
Calculated Mobility Fee Schedule The mobility fee calculations for each land use are included in Appendix D, which includes the
major land use categories and the mobility fees for the individual land uses contained in each
of the major categories. For each land use, Appendix D illustrates the following:
Demand component variables (trip rate, trip length, percent new trips, and person-
trip factor)
Total mobility cost
Annual gas tax credit
Present value of the gas tax credit
Net mobility fee
Current Hillsborough County transportation impact fee
Percent difference between the calculated mobility fee and the current impact fee
It should be noted that the net mobility fee illustrated in Appendix D is not necessarily a
recommended fee, but instead represents a technically documented mobility fee per unit of
land use that could be charged in Hillsborough County.
For clarification purposes, it may be useful to walk through the calculation of a mobility fee
one of the land use categories. In the following example, the net mobility fee rate is
calculated for the single-family residential land use category (ITE LUC 210) using information
from the proposed mobility fee schedule included in Appendix D, Table D-1. For each land
use category, the following equations are utilized to calculate the net mobility fee:
Net Mobility Fee = Total Mobility Cost – Gas Tax Credit
Where:
Total Mobility Cost = ([Trip Rate x Assessable Trip Length x % New Trips] / 2) x (1 –
Interstate/Toll Facility Discount Factor) x (Person-Trip Factor) * (Cost per Person-Mile of
Capacity)
Gas Tax Credit = Present Value (Annual Gas Tax), given a 2.5% interest rate & a 25-year
facility life

Tindale Oliver Hillsborough County April 2016 27 Mobility Fee Study
Annual Gas Tax = ([Trip Rate x Total Trip Length x % New Trips] / 2) x (Effective Days per
Year x $/Gallon to Capital) / Fuel Efficiency
Each of the inputs has been discussed previously in this document; however, for purposes of
this example, brief definitions for each input are provided in the following paragraphs, along
with the actual inputs used in the calculation of the fee for the single-family detached
residential (1,500-2,499 sf) land use category:
Trip Rate = the average daily trip generation rate, in vehicle-trips/day (7.81)
Assessable Trip Length = the actual average trip length for the category, in vehicle-miles
(6.62)
Total Trip Length = the assessable trip length plus an adjustment factor of half a mile,
which is added to the trip length to account for the fact that gas taxes are collected for
travel on all roads including local roads (6.62 + 0.50 = 7.12)
% New Trips = adjustment factor to account for trips that are already on the roadway
(100%)
Divide by 2 = the total daily miles of travel generated by a particular category (i.e.,
rate*length*% new trips) is divided by two to prevent the double-counting of travel
generated among land use codes since every trip has an origin and a destination
Person-Trip Factor = Converts vehicle-miles of travel to person-miles of travel (1.30)
Interstate/Toll Facility Discount Factor = discount factor to account for the travel
demand occurring on interstate highways and/or toll facilities (36.6%)
Cost per Person-Mile of Capacity = unit of person-miles of capacity consumed per unit
of development ($401.78)
Effective Days per Year = 365 days
$/Gallon to Capital = the amount of gas tax revenue per gallon of fuel that is used for
capital improvements, in $/gallon ($0.213)
Fuel Efficiency = average fuel efficiency of vehicles, in vehicle-miles/gallon (18.18)
Present Value = calculation of the present value of a uniform series of cash flows, gas
tax payments in this case, given an interest rate, “i,” and a number of periods, “n;” for
2.5% interest and a 25-year facility life, the uniform series present worth factor is
18.4244

Tindale Oliver Hillsborough County April 2016 28 Mobility Fee Study
Mobility Fee Calculation
Using these inputs, a net mobility fee can be calculated for the single-family residential (1,500-
2,499 sf) detached land use category, for the urban area, with no sales tax credit:
Total Mobility Cost = ([7.81 * 6.62 * 1.0] /2) * (1 – 0.366) * 1.30 * ($401.78) = $8,561
Annual Gas Tax = ([7.81 * 7.12 * 1.0] /2) * 365 * ($0.213 /18.18) = $119
Revenue Credit = $119 * 18.4244 = $2,193
Net Mobility Fee = $8,561 - $2,193 = $6,368
Mobility Fee Comparison
As part of the work effort in developing Hillsborough County mobility fee program, a
comparison of calculated fees to mobility/multi-modal/roadway impact fee schedules
adopted in other jurisdictions was completed, as shown in Table 7.
It should be noted that the differences in fee levels for a given land use can be caused by
several factors, including the year of the technical study, adoption percentage, study
methodology including variations in costs, credits and travel demand, land use categories
included in the fee schedule, etc.

Tindale Oliver Hillsborough County April 2016 29 Mobility Fee Study
Table 7 Mobility Fee Comparison
Table 7 (continued)
1) Represents that portion of the maximum calculated fee for each respective county that is actually charged. Fees may have been lowered through indexing or policy discounts. Does not account for moratoriums/suspensions 2) Du = dwelling unit 3) Source: Appendix D, Table D-1 4) Source: Appendix D, Table D-2 5) Source: Appendix D, Table D-3 6) Source: Appendix D, Table D-4 7) Source: Hillsborough County Department of Development Services; Average of 10 Impact Fee Zones 8) Source: Pasco County Central Planning Department; Fees shown reflect the subsidized rates that are charged in the County 9) Source: Polk County Planning and Development 10) Source: Pinellas County Building Services; General County Fees 11) Source: Manatee County Impact Fee Administration; Residential impact fee is average of three bedroom options 12) Source: Hernando County Development Department 13) Source: Citrus County Planning and Development Department; County-wide rates 14) Source: Orange County Planning and Development; Average of AMA and Non-AMA districts 15) Source: Collier County Impact Fee Administration
Urban(3) Rural(4) Urban(5) Rural(6) Urban Suburban Rural
Date of Last Update 2016 2016 2016 2016 1985 2014 2014 2014 2015 1990
Assessed Portion of Calculated(1) 100% 100% 100% 100% 100% n/a n/a n/a 50% n/aResidential:Single Family Detached (2,000 sq ft) du $6,368 $9,221 $4,581 $7,434 $1,475 $5,835 $8,570 $9,800 $1,077 $2,066Non-Residential:Light Industrial 1,000 sf $4,049 $5,872 $2,870 $4,693 $994 $0 $0 $0 $333 $1,414Office (50,000 sq ft) 1,000 sf $8,991 $13,044 $6,393 $10,446 $2,326 $0 $0 $0 $1,118 $2,767Retail (125,000 sq ft) 1,000 sf $10,113 $12,140 $6,778 $8,805 $3,352 $5,641 $7,051 $8,813 $1,904 $3,627Bank w/Drive-In 1,000 sf $21,306 $25,570 $14,323 $18,587 $13,043 $12,730 $14,384 $15,582 $1,904 $2,975Fast Food w/Drive-Thru 1,000 sf $70,825 $85,197 $46,505 $60,877 $7,726 $40,950 $46,712 $50,978 $1,904 $19,599
Land Use Unit(2)
Hillsborough County
Polk County(9)Pinellas
County(10)No Sales Tax 1/2% Sales TaxExisting(7)
Pasco County(8)
Urban(3) Rural(4) Urban(5) Rural(6)
Date of Last Update 2016 2016 2016 2016 1985 2011 2013 2014 2012 2015
Assessed Portion of Calculated(1) 100% 100% 100% 100% 100% 100% 22% 50% 56% 100%Residential:Single Family Detached (2,000 sq ft) du $6,368 $9,221 $4,581 $7,434 $1,475 $3,981 $1,269 $1,697 $3,830 $7,017Non-Residential:Light Industrial 1,000 sf $4,049 $5,872 $2,870 $4,693 $994 $776 $806 $584 $2,126 $5,373Office (50,000 sq ft) 1,000 sf $8,991 $13,044 $6,393 $10,446 $2,326 $1,823 $1,516 $1,687 $5,474 $9,661Retail (125,000 sq ft) 1,000 sf $10,113 $12,140 $6,778 $8,805 $3,352 $7,152 $1,844 $1,248 $5,362 $13,531Bank w/Drive-In 1,000 sf $21,306 $25,570 $14,323 $18,587 $13,043 $7,152 $4,257 $1,248 $11,288 $27,300Fast Food w/Drive-Thru 1,000 sf $70,825 $85,197 $46,505 $60,877 $7,726 $7,152 $17,397 $1,248 $37,636 $91,028
Collier
County(15)Land Use Unit(2)
Hillsborough County
No Sales Tax 1/2% Sales TaxExisting(7)
Manatee
County(11)
Hernando
County(12)
Citrus
County(13)
Orange
County(14)

Tindale Oliver Hillsborough County April 2016 30 Mobility Fee Study
Benefit District Analysis Currently, Hillsborough County has 10 transportation impact fee assessment zones, as
outlined in Article 9, Section A.17 of the Hillsborough County Consolidated Impact
Assessment Program Ordinance (see Map 2). These assessment zones also serve as the
County’s impact fee benefit zones. Assessment zones dictate the amount of the impact fee
charged to each new development while the benefit zones dictate where impact fee revenues
can be spent to ensure that fee payers receive the associated benefit. Typically, boundaries
for benefit districts are based on land uses, growth rates, major roadway boundaries, and
major geographical/environmental boundaries.
In recent years, most jurisdictions have started to transition to impact/mobility fee programs
with fewer benefit districts, with many having no more than three districts. Fewer districts
create a simpler administrative process and also create larger pools of money that can be
used to fund large-scale improvements in a shorter time-frame while still meeting the legal
requirement of dual-rational nexus.
As part of this mobility fee study, the existing transportation impact fee zones were reviewed
to determine if a realignment was needed as the County shifts to a mobility fee. This review
included a review of the historical impact fee revenue collections by district in addition to the
following factors:
Preservation (non-developable) land to identify the County’s activity areas;
Natural geographic boundaries (i.e, rivers, lakes);
Urban Services Area (USA) Boundary;
Municipal boundaries;
Location of roadway improvements in the County’s 5-year plan;
Location of roadway improvements in the County’s long range transportation plan; and
Intra/Inter-district and regional travel patterns.
Map 3 illustrates the five mobility fee benefit districts recommended for Hillsborough County.
These recommended districts strike a balance between creating larger revenue pools to get
projects funded while still proving benefit to the fee payers within the district.

Tindale Oliver Hillsborough County April 2016 31 Mobility Fee Study
Map 2: Transportation Impact Fee Benefit Zones

Tindale Oliver Hillsborough County April 2016 32 Mobility Fee Study
Map 3: Recommended Mobility Fee Benefit Districts

Tindale Oliver Hillsborough County April 2016 33 Mobility Fee Study
Table 8 provides a summary of the inter- and intra-district travel characteristics of the five
proposed mobility fee districts. This summary includes travel between the proposed districts
and the cities of Tampa, Temple Terrace, and Plant City.
District 1 – 45% of the travel stays within the district and 48% goes into Tampa
District 2 – 46% of the travel stays within the district and 29% goes into Tampa
District 3 – 30% of the travel stays within the district, 25% goes into Plant City, and
23% goes into District 2
District 4 – 49% of the travel stays within the district and 21% goes into District 3
District 5 – 25% of the travel stays within the district and 41% goes into District 5
Table 8
Travel between Mobility Benefit Districts (including Cities)
Source: TBRPM 8.0, 2040 Cost Affordable Alternative, April, 2015
Mobility Fee District 1
District 1 shows a clear separation from the rest of the unincorporated County with the City
of Tampa acting as a divider. As shown in Table 8, approximately 47 percent of the traffic
District: District 1 District 2 District 3 District 4 District 5District 1 592,692 57,411 13,250 13,705 3,517
D1 % County 44.6% 4.4% 3.1% 2.1% 2.3%Avg Trip Length 3.93 14.31 19.24 28.93 36.44
District 2 57,411 598,701 98,244 136,792 21,736D3 % County 4.3% 45.7% 23.1% 20.8% 14.3%
Avg Trip Length 14.31 3.98 9.07 12.54 18.37District 3 13,250 98,244 126,191 9,690 4,234
D4 % County 1.0% 7.5% 29.6% 1.5% 2.8%Avg Trip Length 19.24 9.07 3.91 24.66 23.84
District 4 13,705 136,792 9,690 323,719 62,330D5 % County 1.0% 10.4% 2.3% 49.3% 41.1%
Avg Trip Length 28.93 12.54 24.66 4.06 8.26District 5 3,517 21,736 4,234 62,330 37,295
D6 % County 0.3% 1.7% 1.0% 9.5% 24.6%Avg Trip Length 36.44 18.37 23.84 8.26 2.74
City/County: District 1 District 2 District 3 District 4 District 5Plant City 2,358 19,340 106,764 4,207 3,037
PC % County 0.2% 1.5% 25.1% 0.6% 2.0%Avg Trip Length 27.37 14.36 5.06 27.89 22.67
Tampa/TT 632,003 373,355 66,518 105,037 19,162T/TT % County 47.5% 28.5% 15.6% 16.0% 12.6%
Avg Trip Length 7.56 10.05 17.29 21.34 27.81Hillsb. County 1,329,587 1,309,832 426,163 656,403 151,503
Total % County 100.0% 100.0% 100.0% 100.0% 100.0%Avg Trip Length 6.67 7.86 8.66 10.00 12.24

Tindale Oliver Hillsborough County April 2016 34 Mobility Fee Study
stays within the District 1 boundaries and approximately 48 percent travels into the City of
Tampa. The Urban Service Area was considered in the creation of this district, but travel
patterns did not support breaking out the portion outside the USA into a separate district.
Mobility Fee Districts 2 and 3
Districts 2 and 3 are comprised of the northeastern portion of the County with the Urban
Service Area serving as the boundary between these two districts. To the south, both districts
are bordered by the Alafia River, creating a geographical barrier between the north and south
portions of the unincorporated County. For District 2, travel patterns indicated a heavy
volume of intra-district trips, as well as travel towards the City of Tampa. Travel in District 3
was split between intra-district trips and travel to District 2 and Plant City.
With future improvements being focused within the Urban Service Area, this boundary was
recommended as a divider to create these two districts. Fee payers within District 2 will
benefit from these improvements as will the large volume of District 3 fee payers that travel
into District 2. However, District 2 fee payers will not directly benefit from future
improvements in District 3 as only a small volume of traffic travels from District 2 to District
3.
Mobility Fee Districts 4 and 5
Districts 4 and 5 are comprised of the southeastern portion of the County with the Urban
Service Area serving as the boundary between the districts. To the north, both districts are
bordered by the Alafia River, creating a geographical barrier between the north and south
portions of the unincorporated County. For District 4, travel patterns indicated a heavy
volume of intra-district trips, as well as travel towards District 2. Travel in District 5 was
primarily headed west into the USA (District 4).
Similar to Districts 2 and 3, future improvements are being focused within the Urban Service
Area and this boundary was recommended as a divider to create these two districts. Fee
payers in both Districts 4 and 5 benefit from improvements within District 4, but only fee
payers in District 5 directly benefit from improvements in District 5.
It is recommended that the County monitor the effectiveness of the five district layout with
regard to mobility fee collection distribution, planned projects, and future travel patterns.

Tindale Oliver Hillsborough County April 2016 35 Mobility Fee Study
Indexing
In many cases, mobility fees are reviewed periodically (every three to five years) as opposed
to an annual review. If no adjustment to the mobility fee schedule is made between the
update periods a situation can be created where major adjustments to the fee schedule
become necessary due to the time interval between adjustments. The need for significant
adjustment also creates major concern in the development community. To address this issue,
the calculated fees in Appendix D, Tables D-1 through D-4, could potentially be indexed
annually for construction and land cost increases, as appropriate. The method for developing
this index is provided in this sub-section.
Land Cost
As shown in Table 9, between 2010 and 2015 the total just property value for unincorporated
Hillsborough County increased by an annual average of 2.9 percent. This index was used for
the ROW component of the mobility fee.
Table 9 Just Value Trend
Source: Florida Legislature’s Office of Economic and Demographic Research
Roadway Construction Cost
The Florida Department of Transportation (FDOT) provides historical inflation factors for
transportation project costs, which are presented in Table 10. It is recommended that these
factors be used for the design, construction, and CEI components of the mobility fee indexing.
As shown in Table 10, the average index is 2.7 percent based on the past five years.
YearUnincorporated
Hillsborough County Just Values
Percent Change
2010 $56,618,615,609 -2011 $53,667,138,184 -5.2%2012 $52,125,727,682 -2.9%2013 $55,260,161,095 6.0%2014 $60,362,581,529 9.2%2015 $65,374,127,666 8.3%
Average (2010‐2015) 2.9%

Tindale Oliver Hillsborough County April 2016 36 Mobility Fee Study
Table 10 FDOT Project Cost Inflation Index
Source: FDOT Transportation Policy Planning Office
Transit Capital Cost
As previously noted, the transit capital cost for the mobility fee is not included in the unit
construction cost per person-mile used to calculate the mobility fee due to the insignificant
impact on the cost per person-mile. Therefore, there is no indexing adjustment for costs
increases related to transit investment. However, an index should be applied to the transit
capital costs once the investment reaches a significant level, as determined in a future update
study. For this index, the Engineering News-Record (ENR) Building Cost Index is
recommended.
Index Calculation
Table 11 presents the indexing application for the mobility fee rates.
Table 11 FDOT Project Cost Inflation Index
1) Source: Table 3 2) Cost phase (design, ROW, construction, CEI) divided by the total cost 3) Source: Table 10 for design, construction, and CEI; Table 9 for right-of-way 4) Percent of the total cost (Item 2) for each phase, multiplied by the annual
increase (Item 3) 5) Sum of the index components (Item 4) for all phases
Fiscal YearInflation
Rate2011 3.6%2012 3.8%2013 1.9%2014 3.0%2015 1.0%
Annual Avg. 2.7%
PhaseCost per
Lane Mile(1)
Percent of
Total Cost(2)
Annual
Increase(3) Index(4)
Design $340,000 6.9% 2.7% 0.2%
Right-of-Way $1,448,000 29.2% 2.9% 0.9%
Construction $2,897,000 58.4% 2.7% 1.6%
CEI $277,000 5.7% 2.7% 0.2%
Total Cost $4,962,000 - -
2.9%Total Applicable Index(5)

Tindale Oliver Hillsborough County April 2016 37 Mobility Fee Study
Index Application
To provide an example, using the total application index of 2.9 percent, the net mobility fee
for the single family detached land use (no sales tax, urban district) would increase to $6,553
($6,368 x [1 + 0.029]) at the end of the first year after the adoption and implementation of
the updated fee schedule. This index would be applied to the fee for each land use listed in
the mobility fee schedule. Given the recent fluctuations in land and construction values, it is
recommended that the indices be re-evaluated and re-calculated at the end of the first year
adoption. At the end of each subsequent year, the index would be re-calculated and applied
to the current adopted fee schedule. This approach creates and opportunity to base the index
on the most current data available.

Appendix A Demand Component Calculations
Tindale Oliver Hillsborough County April 2016 A-1 Mobility Fee Study
Demand Component This appendix presents the detailed calculations for the demand component of the mobility
fee update.
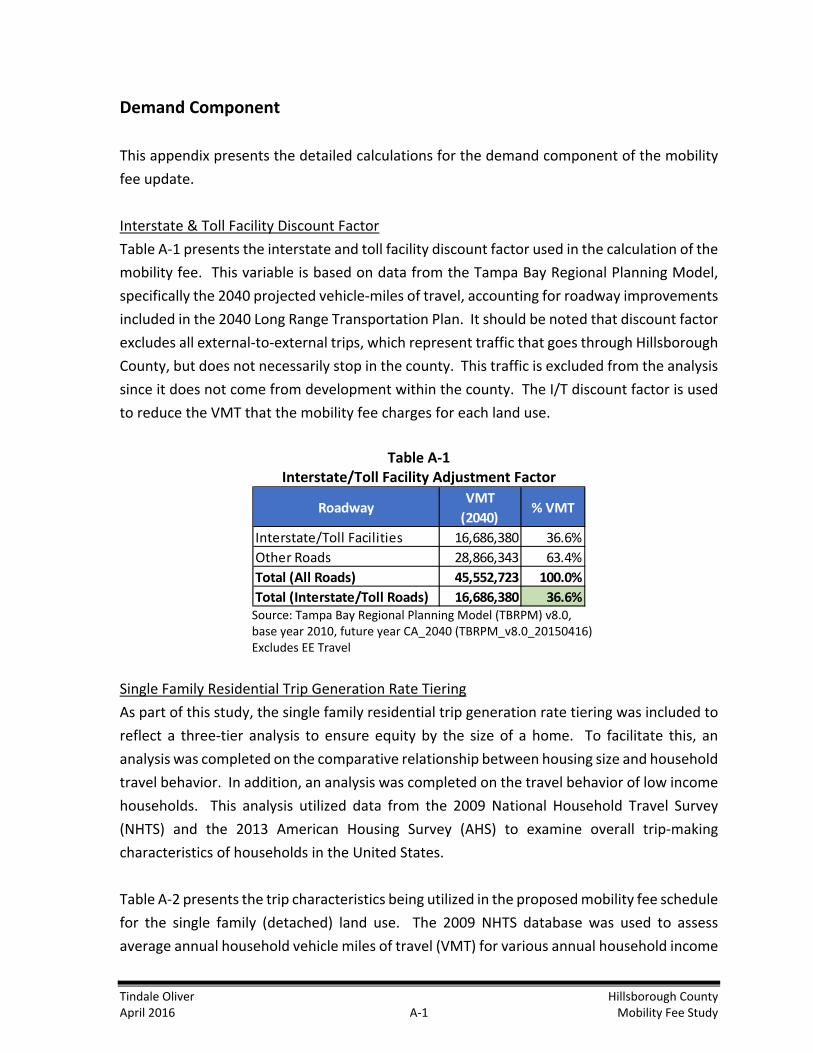
Interstate & Toll Facility Discount Factor
Table A-1 presents the interstate and toll facility discount factor used in the calculation of the
mobility fee. This variable is based on data from the Tampa Bay Regional Planning Model,
specifically the 2040 projected vehicle-miles of travel, accounting for roadway improvements
included in the 2040 Long Range Transportation Plan. It should be noted that discount factor
excludes all external-to-external trips, which represent traffic that goes through Hillsborough
County, but does not necessarily stop in the county. This traffic is excluded from the analysis
since it does not come from development within the county. The I/T discount factor is used
to reduce the VMT that the mobility fee charges for each land use.
Table A‐1 Interstate/Toll Facility Adjustment Factor
Source: Tampa Bay Regional Planning Model (TBRPM) v8.0, base year 2010, future year CA_2040 (TBRPM_v8.0_20150416) Excludes EE Travel
Single Family Residential Trip Generation Rate Tiering
As part of this study, the single family residential trip generation rate tiering was included to
reflect a three-tier analysis to ensure equity by the size of a home. To facilitate this, an
analysis was completed on the comparative relationship between housing size and household
travel behavior. In addition, an analysis was completed on the travel behavior of low income
households. This analysis utilized data from the 2009 National Household Travel Survey
(NHTS) and the 2013 American Housing Survey (AHS) to examine overall trip-making
characteristics of households in the United States.
Table A-2 presents the trip characteristics being utilized in the proposed mobility fee schedule
for the single family (detached) land use. The 2009 NHTS database was used to assess
average annual household vehicle miles of travel (VMT) for various annual household income
RoadwayVMT
(2040)% VMT
Interstate/Toll Facilities 16,686,380 36.6%Other Roads 28,866,343 63.4%Total (All Roads) 45,552,723 100.0%Total (Interstate/Toll Roads) 16,686,380 36.6%

Tindale Oliver Hillsborough County April 2016 A-2 Mobility Fee Study
levels. In addition, the 2013 AHS database was used to compare median annual
family/household incomes with housing unit size. It is important to recognize that the use of
the income variable in each of these databases is completed simply to provide a convenient
linking mechanism between household VMT from the NHTS and housing unit size from the
AHS.
Table A‐2 Calculated Single Family Trip Characteristics
Source: Florida Studies for LUC 210 included in this Appendix
The results of the NHTS and AHS analyses are included in Tables A-3 through A-5. First, the
data shown in Table A-3 presents the average income in the U.S. for families/households
living in the three housing tiers. As shown, the average income for housing units between
1,500 and 2,499 square feet in size ($66,398) is higher than the overall average income for
the U.S. ($56,993). Table A-3 presents the median household income levels for low and very
low income levels in Hillsborough County. Next, as shown in Table A-4, annual average
household VMT was calculated from the NHTS database for a number of different income
levels and ranges related to the resulting AHS income data from Table A-3 and the
Hillsborough County SHIP definitions for low income (<$47,200) and very low income
($<29,500).
Table A‐3 Annual Income by Housing Size
Source: American Housing Survey for the United States in 2013 1) Weighted average of annual income for each tier
Calculated Values Excluding Tiering Trip RateAssessable Trip Length
Daily VMTRatio to Mean
Single Family (Detached) 7.81 6.62 51.70 1.00
2013 AHS Average Income Data by Housing Size
Annual
Income(1)
Less than 1,500 sf $44,243
1,500 to 2,499 sf $66,398
2,500 sf or more $80,449
Average of All Houses $56,993

Tindale Oliver Hillsborough County April 2016 A-3 Mobility Fee Study
Table A‐4 Hillsborough County SHIP Definitions
Source: Florida Housing Finance Corporation, 2015 Income Limits; SHIP (4 person household) 1) Defined as 80% of the median income 2) Defined as 50% of the median income
To calculate a corresponding trip rate for the new tiers it was necessary to rely on
comparative ratios. As an example, consider the $44,243 annual income category. First, it
was determine that the average annual household VMT for this income level is 19,856 miles.
This figure was then compared to the overall average annual VMT per household in the U.S.
and normalized to the average of the $56,993 (23,455 miles) category to derive a ratio of
0.782 as shown in Table A-5.
Next, the normalized ratio was applied to the daily VMT for the average single family housing
unit size (less than 1,500 sf) to generate a daily VMT of 40.43 for the new tier, as shown in
Table A-6. This daily VMT figure was then divided by the proposed assessable trip length of
6.62 miles to obtain a typical trip rate of 6.11 trips per day.
Table A‐5 NHTS Annual VMT by Income Category
Source: 2009 National Household Travel Survey Database, Federal Highway Administration
Median Income $59,000
Low Income(1) $47,200
Very Low Income(2) $29,500
HIllsborough County SHIP Definitions
2009 NHTS Travel Data byAnnual HH Income
Annual VMT/HH
Days Daily VMTRatio to Mean
Normalized to 1.083
Average of $14,750 8,513 365 23.32 0.363 0.335Average of $23,600 12,883 365 35.30 0.549 0.507Average of $44,243 19,856 365 54.40 0.847 0.782Total (All Homes) 23,455 365 64.26 1.000Average of $66,398 25,397 365 69.58 1.083 1.000Average of $80,449 28,461 365 77.98 1.214 1.121

Tindale Oliver Hillsborough County April 2016 A-4 Mobility Fee Study
Table A‐6 Trip Generation Rate by Single Family Land Use Tier
1) Daily VMT (Item 3) divided by assessable trip length (Item 2) for each tiered single family land use
category 2) Source: Table A-2 3) Ratio to the mean (Item 4) divided by total daily VMT for the 1,500 to 2,499 sf tier for each tiered
single family land use category 4) Source: Table A-5
Table A-7 illustrates the impact that the incorporation of the trip generation rate tiers for the
single family (detached) land use have on the County’s calculated mobility fee schedule.
Table A‐7 Net Mobility Fee by Single Family Land Use Tier
1) Source: Table A-4 2) Source: Appendix D, Table D-1
Multi-Family Residential Trip Generation Rate Tiering
Similar to the single family residential land use, “low income” and “very low income” tiers
were developed for the multi-family residential (apartment) land uses in Hillsborough
County. Tables A-8 through A-15 detail these calculations for both the Multi-Family (1-2
stories) and the Multi-Family (3+ stories) land uses.
Estimation of Trip Rate by Tier Trip Rate(1) Assessable
Trip Length(2)
Daily
VMT(3)
Ratio to
Mean(4)
Single Family (Detached)Less than 1,500 sf & Very Low Income 2.62 6.62 17.32 0.335Less than 1,500 sf & Low Income 3.96 6.62 26.21 0.507Less than 1,500 sf 6.11 6.62 40.43 0.7821,500 to 2,499 sf 7.81 6.62 51.70 1.0002,500 sf or larger 8.76 6.62 57.96 1.121
Impact of Tiering on Fee Schedule Trip Rate(1) Assessable Trip Length
Daily VMT Net Fee(2)
Single Family (Detached)Less than 1,500 sf & Very Low Income 2.62 6.62 17.32 $2,135Less than 1,500 sf & Low Income 3.96 6.62 26.21 $3,236Less than 1,500 sf 6.11 6.62 40.43 $4,9841,500 to 2,499 sf 7.81 6.62 51.70 $6,3682,500 sf or larger 8.76 6.62 57.96 $7,152

Tindale Oliver Hillsborough County April 2016 A-5 Mobility Fee Study
Table A‐8 Calculated Multi‐Family (1‐2 Stories) Trip Characteristics
Source: Florida Studies for LUC 220 included in this Appendix
Table A‐9 NHTS Annual VMT by Income Category
Source: 2009 National Household Travel Survey Database, Federal Highway Administration
Table A‐10 Trip Generation Rate by Multi‐Family (1‐2 Stories) Income Level
1) Daily VMT (Item 3) divided by assessable trip length (Item 2) 2) Source: Table A-8 3) Ratio to the mean (Item 4) divided by total daily VMT for the standard multi-family 4) Source: Table A-9
Table A‐11 Net Mobility Fee by Multi‐Family (1‐2 Stories) Income Level
1) Source: Table A-10 2) Source: Appendix D, Table D-1
Calculated Values Excluding Tiering Trip RateAssessable Trip Length
Daily VMTRatio to Mean
Multi-Family; 1-2 Stories 6.60 5.10 33.66 1.00
2009 NHTS Travel Data by Annual HH Income
Annual VMT/HH
Days Daily VMTRatio to Mean
Average of $14,750 8,513 365 23.32 0.360Average of $23,600 12,883 365 35.30 0.545Average of $59,000 23,636 365 64.76 1.000
Estimation of Trip Rate by Tier Trip Rate(1) Assessable
Trip Length(2)
Daily
VMT(3)
Ratio to
Mean(4)
Multi-Family; 1-2 StoriesVery Low Income 2.38 5.10 12.12 0.360Low Income 3.60 5.10 18.34 0.545Multi-Family; 1-2 Stories 6.60 5.10 33.66 1.000
Impact of Tiering on Fee Schedule Trip Rate(1) Assessable Trip Length
Daily VMT Net Fee(2)
Multi-Family; 1-2 StoriesVery Low Income 2.38 5.10 12.12 $1,494Low Income 3.60 5.10 18.34 $2,248Multi-Family; 1-2 Stories 6.60 5.10 33.66 $4,117

Tindale Oliver Hillsborough County April 2016 A-6 Mobility Fee Study
Table A‐12 Calculated Multi‐Family (3+ Stories) Trip Characteristics
Source: Florida Studies for LUC 220 included in this Appendix
Table A‐13 NHTS Annual VMT by Income Category
Source: 2009 National Household Travel Survey Database, Federal Highway Administration
Table A‐14 Trip Generation Rate by Multi‐Family (3+ Stories) Income Level
1) Daily VMT (Item 3) divided by assessable trip length (Item 2) 2) Source: Table A-12 3) Ratio to the mean (Item 4) divided by total daily VMT for the standard multi-family 4) Source: Table A-13
Table A‐15 Net Mobility Fee by Multi‐Family (3+ Stories) Income Level
1) Source: Table A-14 2) Source: Appendix D, Table D-1
Calculated Values Excluding Tiering Trip RateAssessable Trip Length
Daily VMTRatio to Mean
Multi-Family; 3+ Stories 4.14 5.10 21.11 1.00
2009 NHTS Travel Data by Annual HH Income
Annual VMT/HH
Days Daily VMTRatio to Mean
Average of $14,750 8,513 365 23.32 0.360Average of $23,600 12,883 365 35.30 0.545Average of $59,000 23,636 365 64.76 1.000
Estimation of Trip Rate by Tier Trip Rate(1) Assessable
Trip Length(2)
Daily
VMT(3)
Ratio to
Mean(4)
Multi-Family; 3+ StoriesVery Low Income 1.49 5.10 7.60 0.360Low Income 2.25 5.10 11.50 0.545Multi-Family; 3+ Stories 4.14 5.10 21.11 1.000
Impact of Tiering on Fee Schedule Trip Rate(1) Assessable Trip Length
Daily VMT Net Fee(2)
Multi-Family; 3+ StoriesVery Low Income 1.49 5.10 7.60 $926Low Income 2.25 5.10 11.50 $1,403Multi-Family; 3+ Stories 4.14 5.10 21.11 $2,575

Tindale Oliver Hillsborough County April 2016 A-7 Mobility Fee Study
Travel Demand Reductions
Studies show that mixed-use developments tend to generate fewer trips due to such factors
as density, diversity, design, distance, destination, and demand of the mix of land uses.
An analysis of potential trip reduction factors for mixed-use developments was conducted as
part of the Mobility Fee update. ITE Handbook provides information on the impact of internal
capture when multiple land uses are co-located. Using Tables 7.1 and 7.2 from the ITE 8th
Edition Handbook, the total trip generation and internal capture trips were estimated for
mixed-use developments. As shown in Table A-16, four example developments were
analyzed to illustrate the range of potential trip generation rate reductions:
Scenario #1 – Even distribution between residential, retail, and office trips
Scenario #2 – 2/3 residential trips, 1/6 retail trips, 1/6 office trips
Scenario #3 – 1/6 residential trips, 2/3 retail trips, 1/6 office trips
Scenario #4 – 1/6 residential trips, 1/6 retail trips, 2/3 office trips
As shown in Table A-16, the internal capture reductions range from five (5) percent to 16
percent, depending on the ratio of development units of residential, retail, and office land
uses. Although no longer in effect, the County’s Land Development Code previously included
information on definitions and policies regarding mixed use development. Prior to granting
any mobility fee discounts, it would be beneficial for Hillsborough County to expand on these
definitions and address spacing and other physical characteristics as well as mix of uses
needed for developments to qualify for a mixed-use travel demand reduction as it relates to
the mobility fee.

Tindale Oliver Hillsborough County April 2016 A-8 Mobility Fee Study
Table A‐16 Mixed‐Use Trip Generation Reductions
1) Source: Table A-17 2) Source: Table A-18 3) Source: Table A-19 4) Source: Table A-20
Land UseSize of
DevelopmentUnit Daily Trips
% of Total Trips
Scenario #1
Residential 1,000 du 8,735 33.3%
Retail 150,000 sq ft 8,839 33.7%
Office 1,200,000 sq ft 8,677 33.1%
26,251
-2,562 9.8%
23,689Scenario #2: Residential
Residential 2,000 du 16,528 63.0%
Retail 50,000 sq ft 4,328 16.5%
Office 500,000 sq ft 4,461 17.0%
25,317
-1,260 5.0%
24,057Scenario #3: Retail
Residential 300 du 2,886 11.0%
Retail 200,000 sq ft 10,656 40.6%
Office 300,000 sq ft 3,026 11.5%
16,568
-2,718 16.4%
13,850Scenario #4: Office
Residential 500 du 4,617 17.6%
Retail 50,000 sq ft 4,328 16.5%
Office 3,000,000 sq ft 17,411 66.3%
26,356
-1,308 5.0%
25,048Total Gross External Trips
Total Gross Trips
Internal Capture(1)
Total Gross External Trips
Total Gross Trips
Internal Capture(2)
Total Gross External Trips
Total Gross Trips
Internal Capture(3)
Total Gross External Trips
Total Gross Trips
Internal Capture(4)

Tindale Oliver Hillsborough County April 2016 A-9 Mobility Fee Study
Table A‐17 Daily Internal Capture Matrix (Scenario #1)
1) Daily trip generation by land use (Table A-16) divided by 2 (50% in, 50% out)
2) Daily trip generation by land use (Table A-16) divided by 2 (50% in, 50% out)
Table A‐18 Daily Internal Capture Matrix (Scenario #2)
1) Daily trip generation by land use (Table A-16) divided by 2 (50% in, 50% out)
2) Daily trip generation by land use (Table A-16) divided by 2 (50% in, 50% out)
In Out In Out In Out
4,339 4,339 4,420 4,420 4,368 4,368 26,251
In(1) 4,339 133 0 133
Out(2) 4,339 177 87 264
In(1) 4,420 177 398 575
Out(2) 4,420 133 486 619
In(1) 4,368 87 486 573
Out(2) 4,368 0 398 398
In(1) 13,126 Internal Capture = 2,562
Out(2) 13,126
Residential 11.1%
Total
Total InternalCapture
Reduction
Office 4.6%
Retail 13.5%
LandUse
for Trip Generation
Purposes
DailyTrip
Generation
Office Retail Residential
In Out In Out In Out
2,231 2,231 2,164 2,164 2,164 2,164 13,117
In(1) 2,231 65 0 65
Out(2) 2,231 87 45 132
In(1) 2,164 87 195 282
Out(2) 2,164 65 238 303
In(1) 2,164 45 238 283
Out(2) 2,164 0 195 195
In(1) 6,559 Internal Capture = 1,260
Out(2) 6,559Total
Office 4.4%
Retail 13.5%
Residential 11.0%
LandUse
for Trip Generation
Purposes
DailyTrip
Generation
Office Retail ResidentialTotal Internal
CaptureReduction

Tindale Oliver Hillsborough County April 2016 A-10 Mobility Fee Study
Table A‐19 Daily Internal Capture Matrix (Scenario #3)
1) Daily trip generation by land use (Table A-16) divided by 2 (50% in, 50% out)
2) Daily trip generation by land use (Table A-16) divided by 2 (50% in, 50% out)
Table A‐20 Daily Internal Capture Matrix (Scenario #4)
1) Daily trip generation by land use (Table A-16) divided by 2 (50% in, 50% out)
2) Daily trip generation by land use (Table A-16) divided by 2 (50% in, 50% out)
In Out In Out In Out
1,513 1,513 5,328 5,328 1,443 1,443 16,568
In(1) 1,513 160 0 160
Out(2) 1,513 213 30 243
In(1) 5,328 213 480 693
Out(2) 5,328 160 476 636
In(1) 1,443 30 476 506
Out(2) 1,443 0 480 480
In(1) 8,284 Internal Capture = 2,718
Out(2) 8,284
LandUse
for Trip Generation
Purposes
DailyTrip
Generation
Office RetailTotal Internal
CaptureReduction
Office 13.3%
Retail 12.5%
Residential
Residential 34.2%
Total
In Out In Out In Out
8,706 8,706 2,164 2,164 2,309 2,309 26,356
In(1) 8,706 65 0 65
Out(2) 8,706 87 69 156
In(1) 2,164 87 195 282
Out(2) 2,164 65 238 303
In(1) 2,309 69 238 307
Out(2) 2,309 0 195 195
In(1) 13,178 Internal Capture = 1,308
Out(2) 13,178
LandUse
for Trip Generation
Purposes
DailyTrip
Generation
Office Retail ResidentialTotal Internal
CaptureReduction
Total
Office 1.3%
Retail 13.5%
Residential 10.9%

Tindale Oliver Hillsborough County April 2016 A-11 Mobility Fee Study
Retail Shopping Center Out-Parcels
The following analysis was completed to help clarify the classification of retail shopping
center out-parcels for mobility fee assessment purposes.
The Florida trip characteristics database includes studies for 22 shopping centers with trip
generation data. These centers either did not have out-parcels or the trip generation of out-
parcels was excluded from the counts. The majority of the data is for shopping centers with
50,000 to 250,000 square feet. Plotting these studies against the ITE curve, which was used
in mobility fee calculations, indicates that the curves are very similar, at least for this size
group. This relation is presented in Figure A-1.
Figure A‐1
Shopping Center TGR Comparison (50,000 – 250,000 sflga)
Tindale Oliver also evaluated the change in the ITE curve over time, and it appears that the
trip generation has been declining. This would suggest that studies added between updates
did not include a significant number of out-parcels with high trip generation rate.
Finally, Tindale Oliver conducted an additional analysis to measure the impact of out-parcels
in terms of gross VMT on the shopping center land use. Because demand for mobility fees is
0.00
10.00
20.00
30.00
40.00
50.00
60.00
70.00
80.00
90.00
100.00
50 75 100 125 150 175 200 225 250
Trip
Gen
erat
ion
Rate
Size (1,000 sfgla)
Tindale Oliver (Linear-Log)
ITE 9th

Tindale Oliver Hillsborough County April 2016 A-12 Mobility Fee Study
expressed in terms of person miles of travel, which is based on vehicle miles of travel,
calculated as the product of trip generation rate, trip length, percent new trips, the analysis
provides a comparison of VMTs. Four land uses included in the analysis are banks with drive-
thru, quality restaurants, convenience markets with gas pumps, and fast food restaurants.
The analysis provides a comparison of traffic generated by each type of out-parcels
(measured in terms of VMT) to the VMT generated by a shopping center of varying sizes.
Table A-21 provides this analysis for a 100,000 square foot shopping center. As presented,
the structures added by the four land uses result in an increase of 3 to 5 percent in terms of
square footage. In terms of traffic volume, while quality restaurants and banks increase the
total VMT by approximately 6 to 7 percent, fast food restaurants increase it by 20 percent,
and convenience markets with gas stations increase it by 16 percent.
Table A-22 provides a summary of the same analysis for different size shopping centers. As
the size of the shopping center increases, the impact of out-parcels becomes less significant.
However, fast food restaurants and convenience markets with gas stations continue to have
a larger impact than other land uses.
Based on this analysis, the following conclusions are reached:
These findings suggest that it is reasonable for the County to charge the retail shopping
center rate to all out-parcels except for convenience markets with gas pumps and fast
food restaurants with drive-thru service. This is especially true for shopping centers up
to 300,000 square feet. Given that the Tindale Oliver data includes primarily shopping
centers with 250,000 square feet or less, and the impact of fast food restaurant or gas
station decreases to approximately 6 to 8 percent range for shopping centers with
300,000 square feet or more, the County may consider conducting a trip generation
study for larger shopping centers.
Alternatively, a developer may choose to conduct a trip characteristics study to
demonstrate that the vehicle-miles of travel of a shopping center with these types of
out-parcels is similar to that of shopping centers included in the County’s mobility fee
study.

Tindale Oliver Hillsborough County April 2016 A-13 Mobility Fee Study
Table A‐21
Impact of Out‐Parcels Compared to Retail Shopping Center (100,000 sfgla)
1) For illustrative purposes, 3,000 sf structures were used for banks, quality restaurants, and fast food restaurants and a 4,500 sf structure was used for convenience market
2) Estimated size of a retail shopping center land use
3) Sum of out parcel square footage (Item 1) and retail square footage (Item 2)
4) The percent increase in square footage due to the out parcel; ((Total - Retail) / Retail)
5) VMT = (TGR x TL x PNT / 2); input variables for each land use can be found in Appendix D, Table D-1
6) VMT = (TGR x TL x PNT / 2); input variables for retail were determined using the ITE 9th Edition TGR equation. TL and PNT use the FL curve analysis
7) Sum of out parcel VMT (Item 5) and retail VMT (Item 6)
8) The percent increases in VMT due to the addition of an out parcel to the retail shopping center ((Total - Retail) / Retail)
Table A‐22
Impact of Out‐Parcels Compared to Retail Shopping Center (50,000 – 400,000 sfgla)
Out‐Parcel(1) Retail(2) Total(3)
% Increase due to Out‐
Parcel(4)
Out‐Parcel
VMT(5)
Retail
VMT(6)
Total
VMT(7)
% Increase due to Out‐
Parcel(8)
853 Conv. Market w/Gas Pumps 4,500 100,000 104,500 4.5% 737 4,547 5,455 16.2%912 Bank 3,000 100,000 103,000 3.0% 270 4,547 4,988 5.9%931 Quality Restaurant 3,000 100,000 103,000 3.0% 330 4,547 5,048 7.3%934 Fast Food Restaurant 3,000 100,000 103,000 3.0% 911 4,547 5,629 20.0%
Out‐Parcel LUC
Out‐Parcel Description
Square Footage Vehicle‐Miles Traveled
Square Footage
Vehicle‐Miles of Travel
Square Footage
Vehicle‐Miles of Travel
Square Footage
Vehicle‐Miles of Travel
Square Footage
Vehicle‐Miles of Travel
853 Conv. Market w/Gas Pumps 9.0% 32.5% 2.3% 9.1% 1.5% 6.3% 1.1% 4.8%912 Bank 6.0% 11.9% 1.5% 3.3% 1.0% 2.3% 0.8% 1.8%931 Quality Restaurant 6.0% 14.6% 1.5% 4.1% 1.0% 2.8% 0.8% 2.2%934 Fast Food Restaurant 6.0% 40.2% 1.5% 11.2% 1.0% 7.8% 0.8% 6.0%
Size: 300K sfgla Size: 400K sflga% Increase due to Out‐ParcelOut‐Parcel
LUCOut‐Parcel Description
Size: 50K sfgla Size: 200K sflga% Increase due to Out‐Parcel

Tindale Oliver Hillsborough County April 2016 A-14 Mobility Fee Study
Florida Studies Trip Characteristics Database
The Florida Studies Trip Characteristics Database includes over 200 studies on 40 different
residential and non-residential land uses collected over the last 25 years. Data from these
studies include trip generation, trip length, and percent new trips for each land use. This
information has been used in the development of impact/multi-modal/mobility fees and the
creation of land use plan category trip characteristics for communities throughout Florida and
the U.S.
Tindale Oliver estimates trip generation rates for all land uses in a mobility fee schedule using
data from studies in the Florida Studies Database and the Institute of Transportation
Engineers’ (ITE) Trip Generation reference report (9th edition). In instances, when both ITE
Trip Generation reference report (9th edition) and Florida Studies trip generation rate (TGR)
data are available for a particular land use, the data is typically blended together to increase
the sample size and provide a more valid estimate of the average number of trips generated
per unit of development. If no Florida Studies data is available, only TGR data from the ITE
reference report is used in the fee calculation.
The trip generation rate for each respective land use is calculated using machine counts that
record daily traffic into and out of the site studied. The traffic count hoses are set at
entrances to residential subdivisions for the residential land uses and at all access points for
non-residential land uses.
The trip length information is obtained through origin-destination surveys that ask
respondents where they came from prior to arriving at the site and where they intended to
go after leaving the site. The results of these surveys were used to estimate average trip
length by land use.
The percent new trip variable is based on assigning each trip collected through the origin-
destination survey process a trip type (primary, secondary, diverted, and captured). The
percent new trip variable is then calculated as 1 minus the percentage of trips that are
captured. Tindale Oliver has published an article entitled, Measuring Travel Characteristics
for Transportation Impact Fees, ITE Journal, April 1991 on the data collecting methodology
for trip characteristics studies.

Tindale Oliver Hillsborough County April 2016 A-15 Mobility Fee Study
Mini‐Warehouse (ITE LUC 151)
Orange Co, FL 107.0 - - - 1.45 - - - - Orange County Orange Co, FL 89.6 - - - 1.23 - - - - Orange County Orange Co, FL 84.7 - - - 1.39 - - - - Orange County Orange Co, FL 93.0 - - - 1.51 - - - - Orange County Orange Co, FL 77.0 - - - 2.18 - - - - Orange County
Total Size 451.3 5 Average Trip Length: n/aITE 784.0 14 Weighted Average Trip Length: n/a
Blended total 1,235.3 Weighted Percent New Trip Average: -Weighted Average Trip Generation Rate: 1.53
ITE Average Trip Generation Rate: 2.50Blend of FL Studies and ITE Average Trip Generation Rate: 2.15
Trip Gen Rate Time PeriodLocation Size (1,000 sf) DateTotal #
Interviews# Trip Length
InterviewsTrip Length
Percent New Trips
VMT Source
Gwinnett Co, GA - 12/13-18/92 - - 5.80 - 5.40 N/A 31.32 Street SmartsGwinnett Co, GA - 12/13-18/92 - - 5.40 - 6.10 N/A 32.94 Street SmartsSarasota Co, FL 76 Jun-93 70 70 10.03 - 6.00 N/A 60.18 Sarasota CountySarasota Co, FL 79 Jun-93 86 86 9.77 - 4.40 N/A 42.99 Sarasota CountySarasota Co, FL 135 Jun-93 75 75 8.05 - 5.90 N/A 47.50 Sarasota CountySarasota Co, FL 152 Jun-93 63 63 8.55 - 7.30 N/A 62.42 Sarasota CountySarasota Co, FL 193 Jun-93 123 123 6.85 - 4.60 N/A 31.51 Sarasota CountySarasota Co, FL 97 Jun-93 33 33 13.20 - 3.00 N/A 39.60 Sarasota CountySarasota Co, FL 282 Jun-93 146 146 6.61 - 8.40 N/A 55.52 Sarasota CountySarasota Co, FL 393 Jun-93 207 207 7.76 - 5.40 N/A 41.90 Sarasota County
Hernando Co, FL 76 May-96 148 148 10.01 9a-6p 4.85 N/A 48.55 Tindale-Oliver & AssociatesHernando Co, FL 128 May-96 205 205 8.17 9a-6p 6.03 N/A 49.27 Tindale-Oliver & AssociatesHernando Co, FL 232 May-96 182 182 7.24 9a-6p 5.04 N/A 36.49 Tindale-Oliver & AssociatesHernando Co, FL 301 May-96 264 264 8.93 9a-6p 3.28 N/A 29.29 Tindale-Oliver & AssociatesCharlotte Co, FL 135 Oct-97 230 - 5.30 9a-5p 7.90 N/A 41.87 Tindale-Oliver & AssociatesCharlotte Co, FL 142 Oct-97 245 - 5.20 9a-5p 4.10 N/A 21.32 Tindale-Oliver & AssociatesCharlotte Co, FL 150 Oct-97 160 - 5.00 9a-5p 10.80 N/A 54.00 Tindale-Oliver & AssociatesCharlotte Co, FL 215 Oct-97 158 - 7.60 9a-5p 4.60 N/A 34.96 Tindale-Oliver & AssociatesCharlotte Co, FL 257 Oct-97 225 - 7.60 9a-5p 7.40 N/A 56.24 Tindale-Oliver & AssociatesCharlotte Co, FL 345 Oct-97 161 - 7.00 9a-5p 6.60 N/A 46.20 Tindale-Oliver & AssociatesCharlotte Co, FL 368 Oct-97 152 - 6.60 9a-5p 5.70 N/A 37.62 Tindale-Oliver & AssociatesCharlotte Co, FL 383 Oct-97 516 - 8.40 9a-5p 5.00 N/A 42.00 Tindale-Oliver & AssociatesCharlotte Co, FL 441 Oct-97 195 - 8.20 9a-5p 4.70 N/A 38.54 Tindale-Oliver & AssociatesCharlotte Co, FL 1,169 Oct-97 348 - 6.10 9a-5p 8.00 N/A 48.80 Tindale-Oliver & Associates
Collier Co, FL 90 Dec-99 91 - 12.80 8a-6p 11.40 N/A 145.92 Tindale-Oliver & AssociatesCollier Co, FL 400 Dec-99 389 - 7.80 8a-6p 6.40 N/A 49.92 Tindale-Oliver & AssociatesLake Co, FL 49 Apr-02 170 - 6.70 7a-6p 10.20 N/A 68.34 Tindale-Oliver & AssociatesLake Co, FL 52 Apr-02 212 - 10.00 7a-6p 7.60 N/A 76.00 Tindale-Oliver & AssociatesLake Co, FL 126 Apr-02 217 - 8.50 7a-6p 8.30 N/A 70.55 Tindale-Oliver & AssociatesPasco Co, FL 55 Apr-02 133 - 6.80 8a-6p 8.12 N/A 55.22 Tindale-Oliver & AssociatesPasco Co, FL 60 Apr-02 106 - 7.73 8a-6p 8.75 N/A 67.64 Tindale-Oliver & AssociatesPasco Co, FL 70 Apr-02 188 - 7.80 8a-6p 6.03 N/A 47.03 Tindale-Oliver & AssociatesPasco Co, FL 74 Apr-02 188 - 8.18 8a-6p 5.95 N/A 48.67 Tindale-Oliver & AssociatesPasco Co, FL 189 Apr-02 261 - 7.46 8a-6p 8.99 N/A 67.07 Tindale-Oliver & Associates
Marion Co, FL 102 Apr-02 167 - 8.02 7a-6p 5.10 N/A 40.90 Kimley-Horn & AssociatesMarion Co, FL 105 Apr-02 169 - 7.23 7a-6p 7.22 N/A 52.20 Kimley-Horn & AssociatesMarion Co, FL 124 Apr-02 170 - 6.04 7a-6p 7.29 N/A 44.03 Kimley-Horn & AssociatesMarion Co, FL 132 Apr-02 171 - 7.87 7a-6p 7.00 N/A 55.09 Kimley-Horn & AssociatesMarion Co, FL 133 Apr-02 209 - 8.04 7a-6p 4.92 N/A 39.56 Kimley-Horn & AssociatesCitrus Co, FL 111 Oct-03 273 - 8.66 7a-6p 7.70 N/A 66.68 Tindale-Oliver & AssociatesCitrus Co, FL 231 Oct-03 155 - 5.71 7a-6p 4.82 N/A 27.52 Tindale-Oliver & AssociatesCitrus Co, FL 306 Oct-03 146 - 8.40 7a-6p 3.94 N/A 33.10 Tindale-Oliver & AssociatesCitrus Co, FL 364 Oct-03 345 - 7.20 7a-6p 9.14 N/A 65.81 Tindale-Oliver & AssociatesCitrus Co, FL 374 Oct-03 248 - 12.30 7a-6p 6.88 N/A 84.62 Tindale-Oliver & AssociatesLake Co, FL 42 Dec-06 122 - 11.26 - 5.56 N/A 62.61 Tindale-Oliver & AssociatesLake Co, FL 51 Dec-06 346 - 18.22 - 9.46 N/A 172.36 Tindale-Oliver & AssociatesLake Co, FL 59 Dec-06 144 - 12.07 - 10.79 N/A 130.24 Tindale-Oliver & AssociatesLake Co, FL 90 Dec-06 194 - 9.12 - 5.78 N/A 52.71 Tindale-Oliver & AssociatesLake Co, FL 239 Dec-06 385 - 7.58 - 8.93 N/A 67.69 Tindale-Oliver & Associates
Hernando Co, FL 232 Apr-07 516 - 8.02 7a-6p 8.16 N/A 65.44 Tindale-Oliver & AssociatesHernando Co, FL 95 Apr-07 256 - 8.08 7a-6p 5.88 N/A 47.51 Tindale-Oliver & AssociatesHernando Co, FL 90 Apr-07 338 - 7.13 7a-6p 5.86 N/A 41.78 Tindale-Oliver & AssociatesHernando Co, FL 58 Apr-07 153 - 6.16 7a-6p 8.39 N/A 51.68 Tindale-Oliver & Associates
Collier Co, FL 74 Mar-08 503 - 12.81 7a-6p 3.05 N/A 39.07 Tindale-Oliver & AssociatesCollier Co, FL 97 Mar-08 512 - 8.78 7a-6p 11.29 N/A 99.13 Tindale-Oliver & AssociatesCollier Co, FL 315 Mar-08 1,347 - 6.97 7a-6p 6.55 N/A 45.65 Tindale-Oliver & AssociatesCollier Co, FL 42 Mar-08 314 - 9.55 7a-6p 10.98 N/A 104.86 Tindale-Oliver & Associates
Total Size 10,380 55 13,130 Average Trip Length: 6.79Weighted Average Trip Length: 6.62
Note: Georgia studies are not included in summary statistics. Weighted Average Trip Generation Rate: 7.81
Single‐Family Detached Housing (ITE LUC 210)
Location Size / UnitsPercent New
TripsDate
Total # Interviews
# Trip Length Interviews
Trip Gen Rate Time Period Trip Length VMT Source

Tindale Oliver Hillsborough County April 2016 A-16 Mobility Fee Study
Multi‐Family/Apartment and Residential Condo/Townhouse (ITE LUC 220/230)
Sarasota Co, FL 212 Jun-93 42 42 5.78 - 5.20 N/A 30.06 Sarasota CountySarasota Co, FL 243 Jun-93 36 36 5.84 - - N/A - Sarasota CountyMarion Co, FL 214 Apr-02 175 175 6.84 - 4.61 N/A 31.53 Kimley-Horn & AssociatesMarion Co, FL 240 Apr-02 174 174 6.96 - 3.43 N/A 23.87 Kimley-Horn & AssociatesMarion Co, FL 288 Apr-02 175 175 5.66 - 5.55 N/A 31.41 Kimley-Horn & AssociatesMarion Co, FL 480 Apr-02 175 175 5.73 - 6.88 N/A 39.42 Kimley-Horn & AssociatesMarion Co, FL 500 Apr-02 170 170 5.46 - 5.94 N/A 32.43 Kimley-Horn & Associates
Lake Co, FL 250 Dec-06 135 135 6.71 - 5.33 N/A 35.76 Tindale-Oliver & AssociatesLake Co, FL 157 Dec-06 265 265 13.97 - 2.62 N/A 36.60 Tindale-Oliver & AssociatesLake Co, FL 169 Dec-06 212 - 8.09 - 6.00 N/A 48.54 Tindale-Oliver & AssociatesLake Co, FL 226 Dec-06 301 - 6.74 - 2.17 N/A 14.63 Tindale-Oliver & Associates
Hernando Co, FL 312 Apr-07 456 - 4.09 - 5.95 N/A 24.34 Tindale-Oliver & AssociatesHernando Co, FL 176 Apr-07 332 - 5.38 - 5.24 N/A 28.19 Tindale-Oliver & AssociatesHernando Co, FL 31 May-96 31 31 6.12 9a-6p 4.98 N/A 30.48 Tindale-Oliver & AssociatesHernando Co, FL 128 May-96 128 128 6.47 9a-6p 5.18 N/A 33.51 Tindale-Oliver & Associates
Pasco Co, FL 229 Apr-02 198 198 4.77 9a-6p - N/A - Tindale-Oliver & AssociatesPasco Co, FL 248 Apr-02 353 353 4.24 9a-6p 3.53 N/A 14.97 Tindale-Oliver & Associates
Total Size 4,103 Average Trip Length: 4.84Total Size (TL) 3,631 Weighted Average Trip Length: 5.10
LUC 220: Multi‐FamilyTotal Size 3,467 13 Weighted Average Trip Generation Rate: 6.31
ITE 18,480 88 ITE Average Trip Generation Rate: 6.65Blended total 21,947 Blend of FL Studies and ITE Average Trip Generation Rate: 6.60
LUC 230: Condo/TownhouseTotal Size 636 4 Weighted Average Trip Generation Rate: 4.97
ITE 10,024 56 ITE Average Trip Generation Rate: 5.81Blended total 10,660 Blend of FL Studies and ITE Average Trip Generation Rate: 5.76
Multi‐Family/Apartment; 3+ Stories (ITE LUC 222/223)ITE 435 High-Rise Apartment: 4.20ITE 120 Mid-Rise Apartment: 3.90
555 Blend of ITE Average Trip Generation Rates for High‐Rise and Mid‐Rise Apts: 4.14
VMTTrip Gen Rate Time Period Trip LengthPercent New
TripsLocation Size / Units Date
Total # Interviews
LUC 230 Studies are highlighted
Source# Trip Length
Interviews
Mobile Home Park (ITE LUC 240)
Marion Co, FL 67 Jul-91 22 22 5.40 48hrs. 2.29 N/A 12.37 Tindale-Oliver & AssociatesMarion Co, FL 82 Jul-91 58 58 10.80 24hr. 3.72 N/A 40.18 Tindale-Oliver & AssociatesMarion Co, FL 137 Jul-91 22 22 3.10 24hr. 4.88 N/A 15.13 Tindale-Oliver & AssociatesMarion Co, FL 188 Apr-02 147 - 3.51 24hr. 5.48 N/A 19.23 Kimley-Horn & AssociatesMarion Co, FL 227 Apr-02 173 - 2.76 24hr. 8.80 N/A 24.29 Kimley-Horn & AssociatesSarasota Co, FL 235 Jun-93 100 100 3.51 - 5.10 N/A 17.90 Sarasota CountyMarion Co, FL 297 Apr-02 175 - 4.78 24hr. 4.76 N/A 22.75 Kimley-Horn & AssociatesSarasota Co, FL 996 Jun-93 181 181 4.19 - 4.40 N/A 18.44 Sarasota County
Hernando Co, FL 1,892 May-96 425 425 4.13 9a-6p 4.13 N/A 17.06 Tindale-Oliver & AssociatesTotal Size 4,121 9 1,303 Average Trip Length: 4.84
Weighted Average Trip Length: 4.60Weighted Average Trip Generation Rate: 4.17
Time Period Trip LengthPercent New
TripsLocation Size / Units Date
Total # Interviews
# Trip Length Interviews
Trip Gen Rate VMT Source
Congregate Care Facility ( ITE LUC 253)
Pinellas Park, FL 72 Aug-89 25 19 3.50 9am-5pm 2.20 79.0 7.70 Tindale-Oliver & AssociatesPalm Harbor, FL 200 Oct-89 58 40 - 9am-5pm 3.40 69.0 - Tindale-Oliver & Associates
Total Size 272 2 83 Average Trip Length: 2.80ITE 388 2 Weighted Average Trip Length: 3.08
Blended total 660 Weighted Percent New Trip Average: 71.6460 Weighted Average Trip Generation Rate: 3.50
ITE Average Trip Generation Rate: 2.02Blend of FL Studies and ITE Average Trip Generation Rate: 2.25
Total # Interviews
# Trip Length Interviews
Trip Gen RateLocation Size / Units Date Time Period Trip LengthPercent New
TripsVMT Source

Tindale Oliver Hillsborough County April 2016 A-17 Mobility Fee Study
Hotel (ITE LUC 310)
Pinellas Co, FL 174 Aug-89 134 106 12.50 7-11a/3-7p 6.30 79.0 62.21 Tindale-Oliver & AssociatesPinellas Co, FL 114 Oct-89 30 14 7.30 12-7p 6.20 47.0 21.27 Tindale-Oliver & AssociatesOrange Co, FL 70 - - - 1.85 - - - - Orange CountyOrange Co, FL 211 - - - 2.23 - - - - Orange CountyOrange Co, FL 112 - - - 2.78 - - - - Orange CountyOrange Co, FL 1,495 - - - 3.50 - - - - Orange CountyOrange Co, FL 123 - - - 3.70 - - - - Orange CountyOrange Co, FL 130 - - - 4.29 - - - - Orange CountyOrange Co, FL 1,499 - - - 4.69 - - - - Orange CountyOrange Co, FL 190 - - - 4.71 - - - - Orange CountyOrange Co, FL 123 - - - 4.81 - - - - Orange CountyOrange Co, FL 105 - - - 5.25 - - - - Orange CountyOrange Co, FL 120 - - - 5.27 - - - - Orange CountyOrange Co, FL 1,584 - - - 5.88 - - - - Orange CountyOrange Co, FL 128 - - - 6.10 - - - - Orange CountyOrange Co, FL 174 - - - 7.03 - - - - Orange CountyOrange Co, FL 144 - - - 7.32 - - - - Orange CountyOrange Co, FL 98 - - - 7.32 - - - - Orange CountyOrange Co, FL 106 - - - 7.34 - - - - Orange CountyOrange Co, FL 100 - - - 7.37 - - - - Orange CountyOrange Co, FL 144 - - - 7.66 - - - - Orange County
Total Size 6,944 21 164 Average Trip Length: 6.25ITE 4,760 10 Weighted Average Trip Length: 6.26
Blended total 11,704 Weighted Percent New Trip Average: 66.3Weighted Average Trip Generation Rate: 5.12
ITE Average Trip Generation Rate: 8.17Blend of FL Studies and ITE Average Trip Generation Rate: 6.36
Location Size (Rooms) Date Time PeriodTotal #
Interviews# Trip Length
InterviewsTrip Gen Rate Trip Length
Percent New Trips
VMT Source
Motel (ITE LUC 320)
Pinellas Co, FL 48 Oct-89 46 24 - 10a-2p 2.80 65.0 - Tindale-Oliver & AssociatesPinellas Co, FL 54 Oct-89 32 22 - 12p-7p 3.80 69.0 - Tindale-Oliver & AssociatesPinellas Co, FL 120 Oct-89 26 22 - 2p-7p 5.20 84.6 - Tindale-Oliver & Associates
Total Size 222 3 104 Average Trip Length: 3.93ITE 2,160 10 Weighted Average Trip Length: 4.34
Weighted Percent New Trip Average: 76.6ITE Average Trip Generation Rate: 5.63
VMT SourceTotal #
Interviews# Trip Length
InterviewsTrip Gen Rate Time Period Trip Length
Percent New Trips
Location Size (Rooms) Date
Movie Theater (ITE LUC 444)
Pinellas Co, FL 8 Oct-89 151 116 113.10 2p-8p 2.70 77.0 235.13 Tindale-Oliver & AssociatesPinellas Co, FL 12 Sep-89 122 116 63.40 2p-8p 1.90 95.0 114.44 Tindale-Oliver & Associates
Total Size 20 273 Average Trip Length: 2.30ITE 10 estimated Weighted Average Trip Length: 2.22
30 Weighted Percent New Trip Average: 87.8Weighted Average Trip Generation Rate: 83.28
ITE Average Trip Generation Rate (6th): 153.33Blend of FL Studies and ITE Average Trip Generation Rate: 106.63
Location Size (Screens) DateTotal #
Interviews# Trip Length
InterviewsTrip Gen Rate Time Period VMT SourceTrip Length
Percent New Trips
Health Club (ITE LUC 492)
Tampa, FL - Mar-86 33 31 - - 7.90 94.0 - Kimley-Horn & AssociatesTotal Size 33 Average Trip Length: n/a
ITE 15 1 Percent New Trip Average: 94.0ITE Average Trip Generation Rate: 32.93
Location Size (1,000 sf) Date Time PeriodTotal #
Interviews# Trip Length
InterviewsTrip Gen Rate Trip Length
Percent New Trips
VMT Source
Day Care Center (ITE LUC 565)
Pinellas Co, FL 5.6 Aug-89 94 66 66.99 7a-6p 1.90 70.0 89.10 Tindale-Oliver & AssociatesPinellas Co, FL 10.0 Sep-89 179 134 66.99 7a-6p 2.10 75.0 105.51 Tindale-Oliver & Associates
Tampa, FL - Mar-86 28 25 - - 2.60 89.0 - Kimley-Horn & AssociatesTotal Size 15.6 2 301 Average Trip Length: 2.20
ITE 35.0 7 Weighted Average Trip Length: 2.03Blended total 50.6 Weighted Percent New Trip Average: 73.2
Weighted Average Trip Generation Rate: 66.99ITE Average Trip Generation Rate: 74.06
Blend of FL Studies and ITE Average Trip Generation Rate: 71.88
VMT SourceTotal #
Interviews# Trip Length
InterviewsTrip Gen Rate Time Period Trip Length
Percent New Trips
Location Size (1,000 sf) Date
Tindale Oliver Hillsborough County April 2016 A-18 Mobility Fee Study
Nursing Home (ITE LUC 620)
Lakeland, FL 120 Mar-90 74 66 2.86 11a-4p 2.59 89.0 6.59 Tindale-Oliver & AssociatesTotal Size 120 1 74 Average Trip Length: 2.59
ITE 714 6 Weighted Average Trip Length: 2.59Blended total 834 Weighted Percent New Trip Average: 89.0
Weighted Average Trip Generation Rate: 2.86ITE Average Trip Generation Rate: 2.74
Blend of FL Studies and ITE Average Trip Generation Rate: 2.76
Location Size (Beds) DateTotal #
Interviews# Trip Length
InterviewsTrip Gen Rate Time Period VMT SourceTrip Length
Percent New Trips
Clinic (ITE LUC 630)
Largo, FL 103.9 Aug-89 614 572 37.03 7a-430p 5.10 93.0 175.63 Tindale-Oliver & AssociatesSt. Petersburg, FL - Oct-89 280 252 - 9a-5p 4.10 90.0 - Tindale-Oliver & Associates
Total Size 103.9 1 894 Average Trip Length: 4.60ITE 224.0 2 Weighted Average Trip Length: 5.10
327.9 Weighted Percent New Trip Average: 93.0Weighted Average Trip Generation Rate: 37.03
ITE Average Trip Generation Rate: 31.45Blend of FL Studies and ITE Average Trip Generation Rate: 33.22
Location Size (1,000 sf) Date Time PeriodTotal #
Interviews# Trip Length
InterviewsTrip Gen Rate Trip Length
Percent New Trips
VMT Source
General Office Building (ITE LUC 710)
Sarasota Co, FL 14.3 Jun-93 14 14 46.85 - 11.30 - 529.41 Sarasota CountyGwinnett Co, GA 98.0 Dec-92 - - 4.30 - 5.40 - - Street SmartsGwinnett Co, GA 180.0 Dec-92 - - 3.60 - 5.90 - - Street Smarts
Pinellas Co, FL 187.0 Oct-89 431 388 18.49 7a-5p 6.30 90.0 104.84 Tindale-Oliver & AssociatesSt. Petersburg, FL 262.8 Sep-89 291 274 - 7a-5p 3.40 94.0 - Tindale-Oliver & Associates
Total Size 742.1 5 736 Average Trip Length: 6.46ITE 15,522.0 78 Weighted Average Trip Length: 5.15
Weighted Percent New Trip Average: 92.3
VMT SourceTotal #
Interviews# Trip Length
InterviewsTrip Gen Rate Time Period Trip Length
Percent New Trips
Location Size (1,000 sf) Date
IN OUT IN OUT IN OUT IN OUT IN OUT IN OUT TOTAL
Coll ier Co, FL - Site 1 2.100 35 35 22 22 13 13 70 70 23.33 23.33 11.11 11.11 22.22
Coll ier Co, FL - Site 2 3.000 40 40 52 52 53 53 145 145 48.33 48.33 16.11 16.11 32.22
Coll ier Co, FL - Site 3 2.000 28 28 19 21 24 26 71 75 23.67 25.00 11.84 12.50 24.34
Coll ier Co, FL - Site 4 1.000 30 30 52 52 57 57 139 139 46.33 46.33 46.33 46.33 92.66
Coll ier Co, FL - Site 5 3.024 31 32 43 43 24 24 98 99 32.67 33.00 10.80 10.91 21.71
Coll ier Co, FL - Site 6 1.860 22 24 19 17 11 11 52 52 17.33 17.33 9.32 9.32 18.64
Average 17.59 17.71 35.30
Average (excluding Site 4) 11.84 11.99 23.83
AVERAGE AVERAGE (per 1,000 sf)
Medical‐Dental Office Building (ITE LUC 720): 10,000 sf or Less
SiteSize
(1,000 sf)Tues., Jan 11 Wedn., Jan 12 Thur., Jan 13 TOTAL
Medical‐Dental Office Building (ITE LUC 720)
Tampa, FL - Mar-86 33 26 - - 6.00 79.0 - Kimley-Horn & AssociatesPalm Harbor, FL 14.6 Oct-89 104 76 33.98 9a-5p 6.30 73.0 156.27 Tindale-Oliver & Associates
St. Petersburg, FL - Nov-89 34 30 57.20 9a-4p 1.20 88.0 - Tindale-Oliver & AssociatesHernando Co, FL 58.4 May-96 390 349 28.52 9a-6p 6.47 89.5 165.09 Tindale-Oliver & AssociatesHernando Co, FL 28.0 May-96 202 189 49.75 9a-6p 6.06 93.8 282.64 Tindale-Oliver & AssociatesCharlotte Co, FL 11.0 Oct-97 - 186 49.50 9a-5p 4.60 92.1 209.67 Tindale-Oliver & AssociatesCharlotte Co, FL 28.0 Oct-97 - 186 31.00 9a-5p 3.60 81.6 91.04 Tindale-Oliver & AssociatesCharlotte Co, FL 30.4 Oct-97 - 324 39.80 9a-5p 3.30 83.5 109.68 Tindale-Oliver & Associates
Citrus Co, FL 38.9 Oct-03 - 168 32.26 8-6p 6.80 97.1 213.03 Tindale-Oliver & AssociatesCitrus Co, FL 10.0 Nov-03 - 340 40.56 8-630p 6.20 92.4 232.33 Tindale-Oliver & AssociatesCitrus Co, FL 5.3 Dec-03 - 20 29.36 8-5p 5.25 95.2 146.78 Tindale-Oliver & Associates
Orange Co, FL 50.6 - - - 26.72 - - - - Orange CountyOrange Co, FL 23.5 - - - 16.58 - - - - Orange County
Total Size 298.6 11 763 Average Trip Length: 5.07ITE 450.0 10 Weighted Average Trip Length: 5.55
Blended total 748.6 Weighted Percent New Trip Average: 88.9Average Trip Generation Rate: 32.59
ITE Average Trip Generation Rate: 36.13Blend of FL Studies and ITE Average Trip Generation Rate: 34.72
Trip LengthPercent New
TripsLocation Size (1,000 sf) Date
Total # Interviews
# Trip Length Interviews
Trip Gen Rate Time Period VMT Source

Tindale Oliver Hillsborough County April 2016 A-19 Mobility Fee Study
Figure A‐1 Retail/Shopping Center (LUC 820) – Florida Curve Trip Length Regression
Source: Regression analysis based on FL Studies data for LUC 820
Shopping Center (ITE LUC 820)
Tampa, FL - Mar-86 527 348 - - - 66.0 - Kimley-Horn & AssociatesTampa, FL - Mar-86 170 - - - 1.70 - - Kimley-Horn & AssociatesTampa, FL - Mar-86 354 269 - - - 76.0 - Kimley-Horn & AssociatesTampa, FL - Mar-86 144 - - - 2.50 - - Kimley-Horn & Associates
St. Petersburg, FL 1,192.0 Aug-89 384 298 - 11a-7p 3.60 78.0 - Tindale-Oliver & AssociatesSt. Petersburg, FL 132.3 Sep-89 400 368 77.00 10a-7p 1.80 92.0 127.51 Tindale-Oliver & Associates
Largo, FL 425.0 Aug-89 160 120 26.73 10a-6p 2.30 75.0 46.11 Tindale-Oliver & AssociatesDunedin, FL 80.5 Sep-89 276 210 81.48 9a-5p 1.40 76.0 86.69 Tindale-Oliver & Associates
Pinellas Park, FL 696.0 Sep-89 485 388 - 9a-6p 3.20 80.0 - Tindale-Oliver & AssociatesSeminole, FL 425.0 Oct-89 674 586 - - - 87.0 - Tindale-Oliver & Associates
Hillsborough Co, FL 134.0 Jul-91 - - - - 1.30 74.0 - Tindale-Oliver & AssociatesHillsborough Co, FL 151.0 Jul-91 - - - - 1.30 73.0 - Tindale-Oliver & Associates
Collier Co, FL - Aug-91 68 64 - - 3.33 94.1 - Tindale-Oliver & AssociatesCollier Co, FL - Aug-91 208 154 - - 2.64 74.0 - Tindale-Oliver & Associates
Sarasota/Bradenton, FL 109.0 Sep-92 300 185 - 12a-6p - 61.6 - King Engineering Associates, Inc.Ocala, FL 133.4 Sep-92 300 192 - 12a-6p - 64.0 - King Engineering Associates, Inc.
Gwinnett Co, GA 99.1 Dec-92 - - 46.00 - 3.20 70.0 103.04 Street SmartsGwinnett Co, GA 314.7 Dec-92 - - 27.00 - 8.50 84.0 192.78 Street SmartsSarasota Co, FL 110.0 Jun-93 58 58 122.14 - 3.20 - - Sarasota CountySarasota Co, FL 146.1 Jun-93 65 65 51.53 - 2.80 - - Sarasota CountySarasota Co, FL 157.5 Jun-93 57 57 79.79 - 3.40 - - Sarasota CountySarasota Co, FL 191.0 Jun-93 62 62 66.79 - 5.90 - - Sarasota County
Hernando Co, FL 107.8 May-96 608 331 77.60 9a-6p 4.68 54.5 197.85 Tindale-Oliver & AssociatesCharlotte Co, FL 88.0 Oct-97 - - 73.50 9a-5p 1.80 57.1 75.56 Tindale-Oliver & AssociatesCharlotte Co, FL 191.9 Oct-97 - - 72.00 9a-5p 2.40 50.9 87.97 Tindale-Oliver & AssociatesCharlotte Co, FL 51.3 Oct-97 - - 43.00 9a-5p 2.70 51.8 60.08 Tindale-Oliver & Associates
Lake Co, FL 67.8 Apr-01 246 177 102.60 - 3.40 71.2 248.37 Tindale-Oliver & AssociatesLake Co, FL 72.3 Apr-01 444 376 65.30 - 4.50 59.0 173.37 Tindale-Oliver & AssociatesPasco Co, FL 65.6 Apr-02 222 - 145.64 9a-5p 1.46 46.9 99.62 Tindale-Oliver & AssociatesPasco Co, FL 75.8 Apr-02 134 - 38.23 9a-5p 2.36 58.2 52.52 Tindale-Oliver & AssociatesCitrus Co, FL 185.0 Oct-03 - 784 55.84 8a-6p 2.40 88.1 118.05 Tindale-Oliver & AssociatesCitrus Co, FL 91.3 Nov-03 - 390 54.50 8a-6p 1.60 88.0 76.77 Tindale-Oliver & Associates
Bozeman, MT 104.3 Dec-06 359 359 46.96 - 3.35 49.0 77.08 Tindale-Oliver & AssociatesBozeman, MT 159.9 Dec-06 502 502 56.49 - 1.56 54.0 47.59 Tindale-Oliver & AssociatesBozeman, MT 35.9 Dec-06 329 329 69.30 - 1.39 74.0 71.28 Tindale-Oliver & Associates
Total Size 5,757.5 7,536 Average Trip Length: n/aWeighted Average Trip Length: n/a
VMTTotal #
Interviews# Trip Length
InterviewsTrip Gen Rate Time Period Trip Length
Percent New Trips
SourceLocation Size (1,000 sf) Date
0.00
0.50
1.00
1.50
2.00
2.50
3.00
3.50
4.00
0 200 400 600 800 1000 1200 1400 1600
Trip
Len
gth
(Mile
s)
Square Footage

Tindale Oliver Hillsborough County April 2016 A-20 Mobility Fee Study
Figure A‐2 Retail/Shopping Center (LUC 820) – Florida Curve Percent New Trips Regression
Source: Regression analysis based on FL Studies data for LUC 820
0%
10%
20%
30%
40%
50%
60%
70%
80%
90%
0 200 400 600 800 1000 1200 1400 1600
Perc
ent N
ew T
rips
Square Footage
New/Used Auto Sales (ITE LUC 841)
St.Petersburg, FL 43.0 Oct-89 152 120 - 9a-5p 4.70 79.0 - Tindale-Oliver & AssociatesClearwater, FL 43.0 Oct-89 136 106 29.40 9a-5p 4.50 78.0 103.19 Tindale-Oliver & AssociatesOrange Co, FL 116.7 - - - 22.18 - - - - Orange CountyOrange Co, FL 99.8 - - - 13.45 - - - - Orange CountyOrange Co, FL 39.1 - - - 10.48 - - - - Orange CountyOrange Co, FL 66.3 - - - 28.50 - - - - Orange CountyOrange Co, FL 46.7 - - - 40.34 - - - - Orange CountyOrange Co, FL 34.4 - - - 23.45 - - - - Orange CountyOrange Co, FL 13.8 - - - 35.75 - - - - Orange County
Total Size 459.7 9 288 Average Trip Length: 4.60ITE 570.0 15 Weighted Average Trip Length: 4.60
Blended total 1,029.7 Weighted Percent New Trip Average: 78.5Weighted Average Trip Generation Rate: 23.22
ITE Average Trip Generation Rate: 32.30Blend of FL Studies and ITE Average Trip Generation Rate: 28.25
Location Size (1,000 sf) Date VMT SourceTotal #
Interviews# Trip Length
InterviewsTrip Gen Rate Time Period Trip Length
Percent New Trips
Convenience Market w/Gasoline (ITE LUC 853)
Tampa, FL - Mar-86 72 - - - 2.00 - - Kimley-Horn & AssociatesMarion Co, FL 1.1 Jun-91 77 20 544.80 24hr. 0.89 26.0 126.07 Tindale-Oliver & AssociatesMarion Co, FL 2.1 Jun-91 66 24 997.60 24hr. 1.67 36.4 606.42 Tindale-Oliver & AssociatesMarion Co, FL 4.4 Jun-91 85 25 486.70 48hrs. 1.06 29.4 151.68 Tindale-Oliver & AssociatesCollier Co, FL - Aug-91 96 38 - - 1.19 39.6 - Tindale-Oliver & AssociatesCollier Co, FL - Aug-91 78 16 - - 1.06 20.5 - Tindale-Oliver & Associates
Tampa, FL 2.3 10/13-15/92 239 74 - 24hr. 1.06 31.1 - Tindale-Oliver & AssociatesEllenton, FL 3.3 10/20-22/92 124 44 - 24hr. 0.96 35.3 - Tindale-Oliver & AssociatesTampa, FL 3.8 11/10-12/92 142 23 - 24hr. 3.13 16.4 - Tindale-Oliver & Associates
Marion Co, FL 2.5 Apr-02 87 - 719.79 24hr. 1.62 32.8 322.19 Kimley-Horn & AssociatesMarion Co, FL 2.5 Apr-02 23 - 610.46 24hr. 1.77 11.7 126.61 Kimley-Horn & AssociatesMarion Co, FL 3.0 Apr-02 59 - 606.02 24hr. 0.83 32.6 195.00 Kimley-Horn & Associates
Total Size 25.1 9 1,148 Average Trip Length: 1.44ITE 30.0 10 Weighted Average Trip Length: 1.51
Blended Total 55.1 Weighted Percent New Trip Average: 27.745.6 15.6 Average Trip Generation Rate: 639.68
ITE Average Trip Generation Rate: 845.60Blend of FL Studies and ITE Average Trip Generation Rate: 775.14
Location Size (1,000 sf) DateTotal #
Interviews# Trip Length
InterviewsPercent New
TripsTrip Gen Rate Time Period Trip Length VMT Source
Tindale Oliver Hillsborough County April 2016 A-21 Mobility Fee Study
Pharmacy/Drug Store with & without Drive‐Thru (ITE LUC 880 & 881)
Pasco Co, FL 11.1 Apr-02 138 38 88.97 - 2.05 27.5 50.23 Tindale-Oliver & AssociatesPasco Co, FL 12.0 Apr-02 212 90 122.16 - 2.04 42.5 105.79 Tindale-Oliver & AssociatesPasco Co, FL 15.1 Apr-02 1192 54 97.96 - 2.13 28.1 58.69 Tindale-Oliver & Associates
Total Size 38.2 3 1,542 Average Trip Length: 2.07ITE 196.0 16 Weighted Average Trip Length: 2.08
Blended total 234.2 Weighted Percent New Trip Average: 32.4Average Trip Generation Rate: 103.03
ITE Average Trip Generation Rate (LUC 880 / 881): 90.06 / 96.91Blend of FL Studies and ITE Average Trip Generation Rate: 95.96
SourceTime Period Trip LengthLocation Size (1,000 sf) DateTotal #
Interviews# Trip Length
InterviewsTrip Gen Rate
Percent New Trips
VMT
Furniture Store (ITE LUC 890)
Largo, FL 15.0 7/28-30/92 64 34 - - 4.63 52.5 - Tindale-Oliver & AssociatesTampa, FL 16.9 Jul-92 68 39 - - 7.38 55.7 - Tindale-Oliver & Associates
Total Size 31.9 2 132 Average Trip Length: 6.01ITE 897.0 13 Weighted Average Trip Length: 6.09
Weighted Percent New Trip Average: 54.2ITE Average Trip Generation Rate: 5.06
Trip LengthPercent New
TripsVMT Source
Total # Interviews
Time Period# Trip Length
InterviewsTrip Gen RateLocation Size (1,000 sf) Date
Bank/Savings Drive‐In (ITE LUC 912)
Tampa, FL - Mar-86 77 - - - 2.40 - - Kimley-Horn & AssociatesTampa, FL - Mar-86 211 - - - - 54.0 - Kimley-Horn & Associates
Clearwater, FL 0.4 Aug-89 113 52 - 9a-6p 5.20 46.0 - Tindale-Oliver & AssociatesLargo, FL 2.0 Sep-89 129 94 - - 1.60 73.0 - Tindale-Oliver & Associates
Seminole, FL 4.5 Oct-89 - - - - - - - Tindale-Oliver & AssociatesMarion Co, FL 2.3 Jun-91 69 29 - 24hr. 1.33 42.0 - Tindale-Oliver & AssociatesMarion Co, FL 3.1 Jun-91 47 32 - 24hr. 1.75 68.1 - Tindale-Oliver & AssociatesMarion Co, FL 2.5 Jul-91 57 26 - 48hrs. 2.70 45.6 - Tindale-Oliver & AssociatesCollier Co, FL - Aug-91 162 96 - 24hr. 0.88 59.3 - Tindale-Oliver & AssociatesCollier Co, FL - Aug-91 116 54 - - 1.58 46.6 - Tindale-Oliver & AssociatesCollier Co, FL - Aug-91 142 68 - - 2.08 47.9 - Tindale-Oliver & Associates
Hernando Co, FL 5.4 May-96 164 41 - 9a-6p 2.77 24.7 - Tindale-Oliver & AssociatesMarion Co, FL 2.4 Apr-02 70 - - 24hr. 3.55 54.6 - Kimley-Horn & AssociatesMarion Co, FL 2.7 May-02 50 - 246.66 24hr. 2.66 40.5 265.44 Kimley-Horn & Associates
Total Size 25.2 9 1,407 Average Trip Length: 2.38ITE 21.0 7 Weighted Average Trip Length: 2.46
Blended total 46.2 Weighted Percent New Trip Average: 46.223.7 Weighted Average Trip Generation Rate: 246.66
ITE Average Trip Generation Rate: 148.15Blend of FL Studies and ITE Average Trip Generation Rate: 159.34
Total # Interviews
# Trip Length Interviews
Trip Gen Rate Time Period Trip LengthPercent New
TripsLocation Size (1,000 sf) Date VMT Source
Quality Restaurant (ITE LUC 931)
Tampa, FL - Mar-86 76 62 - - 2.10 82.0 - Kimley-Horn & AssociatesSt. Petersburg, FL 7.5 Oct-89 177 154 - 11a-2p/4-8p 3.50 87.0 - Tindale-Oliver & Associates
Clearwater, FL 8.0 Oct-89 60 40 110.63 10a-2p/5-9p 2.80 67.0 207.54 Tindale-Oliver & AssociatesTotal Size 15.5 2 313 Average Trip Length: 2.80
ITE 135.0 15 Weighted Average Trip Length: 3.14Blended total 150.5 Weighted Percent New Trip Average: 76.7
143.0 Weighted Average Trip Generation Rate: 110.63ITE Average Trip Generation Rate: 89.95
Blend of FL Studies and ITE Average Trip Generation Rate: 91.10
Total # Interviews
# Trip Length Interviews
Trip Gen RateLocation Size (1,000 sf) Date Time Period Trip LengthPercent New
TripsVMT Source

Tindale Oliver Hillsborough County April 2016 A-22 Mobility Fee Study
High‐Turnover Restaurant (ITE LUC 932)
Hernando Co, FL 6.2 May-96 242 175 187.51 9a-6p 2.76 72.5 375.00 Tindale-Oliver & AssociatesHernando Co, FL 8.2 May-96 154 93 102.71 9a-6p 4.15 60.2 256.43 Tindale-Oliver & Associates
St. Petersburg, FL 5.0 Oct-89 74 68 132.60 1130-7p 2.00 92.0 243.98 Tindale-Oliver & AssociatesKenneth City, FL 5.2 Oct-89 236 176 127.88 4p-730p 2.30 75.0 220.59 Tindale-Oliver & Associates
Pasco Co, FL 5.2 Apr-02 114 88 82.47 9a-6p 3.72 77.2 236.81 Tindale-Oliver & AssociatesPasco Co, FL 5.8 Apr-02 182 102 116.97 9a-6p 3.49 56.0 228.77 Tindale-Oliver & Associates
Orange Co, FL 8.9 - - - 52.69 - - - - Orange CountyOrange Co, FL 11.3 - - - 62.12 - - - - Orange CountyOrange Co, FL 6.7 - - - 82.58 - - - - Orange CountyOrange Co, FL 11.4 - - - 91.67 - - - - Orange CountyOrange Co, FL 11.3 - - - 95.33 - - - - Orange CountyOrange Co, FL 7.2 - - - 98.06 - - - - Orange CountyOrange Co, FL 5.5 - - - 100.18 - - - - Orange CountyOrange Co, FL 9.7 - - - 105.84 - - - - Orange CountyOrange Co, FL 4.6 - - - 129.23 - - - - Orange CountyOrange Co, FL 7.0 - - - 126.40 - - - - Orange CountyOrange Co, FL 9.7 - - - 132.32 - - - - Orange CountyOrange Co, FL 5.0 - - - 135.68 - - - - Orange CountyOrange Co, FL 5.6 - - - 145.59 - - - - Orange CountyOrange Co, FL 7.4 - - - 147.44 - - - - Orange CountyOrange Co, FL 5.9 - - - 147.74 - - - - Orange County
Total Size 152.8 21 1,102 Average Trip Length: 3.07ITE 98.0 14 Weighted Average Trip Length: 3.17
Blended total 250.8 Weighted Percent New Trip Average: 70.8Weighted Average Trip Generation Rate: 109.84
ITE Average Trip Generation Rate: 127.15Blend of FL Studies and ITE Average Trip Generation Rate: 116.60
Location Size (1,000 sf) VMT SourceDateTotal #
Interviews# Trip Length
InterviewsTrip Gen Rate Time Period Trip Length
Percent New Trips
Fast Food Restaurant w/Drive Thru (ITE LUC 934)
Tampa, FL - Mar-86 61 - - - 2.70 - - Kimley-Horn & AssociatesTampa, FL - Mar-86 306 - - - - 65.0 - Kimley-Horn & Associates
Pinellas Co, FL 2.20 Aug-89 81 48 502.80 11a-2p 1.70 59.0 504.31 Tindale-Oliver & AssociatesPinellas Co, FL 4.30 Oct-89 456 260 660.40 1 day 2.30 57.0 865.78 Tindale-Oliver & Associates
Tarpon Springs, FL - Oct-89 233 114 - 7a-7p 3.60 49.0 - Tindale-Oliver & AssociatesMarion Co, FL 1.60 Jun-91 60 32 962.50 48hrs. 0.91 53.3 466.84 Tindale-Oliver & AssociatesMarion Co, FL 4.00 Jun-91 75 46 625.00 48hrs. 1.54 61.3 590.01 Tindale-Oliver & AssociatesCollier Co, FL - Aug-91 66 44 - - 1.91 66.7 - Tindale-Oliver & AssociatesCollier Co, FL - Aug-91 118 40 - - 1.17 33.9 - Tindale-Oliver & Associates
Hernando Co, FL 5.43 May-96 136 82 311.83 9a-6p 1.68 60.2 315.27 Tindale-Oliver & AssociatesHernando Co, FL 3.13 May-96 168 82 547.34 9a-6p 1.59 48.8 425.04 Tindale-Oliver & Associates
Lake Co, FL 2.20 Apr-01 376 252 934.30 - 2.50 74.6 1742.47 Tindale-Oliver & AssociatesLake Co, FL 3.20 Apr-01 171 182 654.90 - 4.10 47.8 - Tindale-Oliver & AssociatesLake Co, FL 3.80 Apr-01 188 137 353.70 - 3.30 70.8 826.38 Tindale-Oliver & AssociatesPasco Co, FL 2.66 Apr-02 100 46 283.12 9a-6p 5.10 46.0 - Tindale-Oliver & AssociatesPasco Co, FL 2.96 Apr-02 486 164 515.32 9a-6p 2.72 33.7 472.92 Tindale-Oliver & AssociatesPasco Co, FL 4.42 Apr-02 168 120 759.24 9a-6p 1.89 71.4 1024.99 Tindale-Oliver & Associates
Orange Co, FL 8.93 - - - 377.00 - - - - Orange CountyTotal Size 48.8 13 4,463 Average Trip Length: 2.42
ITE 63.0 21 Weighted Average Trip Length: 2.05Blended total 111.8 Weighted Percent New Trip Average: 57.9
34.0 Weighted Average Trip Generation Rate: 530.19ITE Average Trip Generation Rate: 496.12
Blend of FL Studies and ITE Average Trip Generation Rate: 511.00
VMT SourceLocation Size (1,000 sf) DateTotal #
Interviews# Trip Length
InterviewsTrip Gen Rate Time Period Trip Length
Percent New Trips
Automobile Care Center (ITE LUC 942)
Jacksonville, FL 2.3 2/3-4/90 124 94 - 9a-5p 3.07 76.0 - Tindale-Oliver & AssociatesJacksonville, FL 2.3 2/3-4/90 110 74 - 9a-5p 2.96 67.0 - Tindale-Oliver & AssociatesJacksonville, FL 2.4 2/3-4/90 132 87 - 9a-5p 2.32 66.0 - Tindale-Oliver & Associates
Lakeland, FL 5.2 Mar-90 24 14 - 9a-4p 1.36 59.0 - Tindale-Oliver & AssociatesLargo, FL 5.5 Sep-89 34 30 37.64 9a-5p 2.40 88.0 79.50 Tindale-Oliver & Associates
Orange Co, FL 25.0 Nov-92 41 39 - 2-6p 4.60 - - LCE, Inc. Lakeland, FL - Mar-90 54 42 - 9a-4p 2.44 78.0 - Tindale-Oliver & Associates
Total Size 42.6 6 519 Average Trip Length: 2.74ITE 102.0 6 Weighted Average Trip Length: 3.62
Blended total 144.6 Weighted Percent New Trip Average: 72.2107.5 Weighted Average Trip Generation Rate: 37.64
ITE Average Trip Generation Rate: 31.10Blend of FL Studies and ITE Average Trip Generation Rate: 31.43
Location Size (1,000 sf) Date# Trip Length
InterviewsTrip Gen Rate Time Period Trip Length
Percent New Trips
VMT SourceTotal #
Interviews

Tindale Oliver Hillsborough County April 2016 A-23 Mobility Fee Study
Service Station with and w/o Car Wash (ITE LUC 944 & 946)
Largo, FL 0.6 Nov-89 70 14 - 8am-5pm 1.90 23.0 - Tindale-Oliver & AssociatesCollier County, FL - Aug-91 168 40 - - 1.01 23.8 - Tindale-Oliver & Associates
Total Size 0.6 1 238 Average Trip Length: 1.46ITE LUC 944 (vfp) 48.0 6 Weighted Average Trip Length: 1.90ITE LUC 946 (vfp) 120.0 10 Weighted Percent New Trip Average: 23.0
ITE Average Trip Generation Rate - per fuel position (LUC 944): 168.56ITE Average Trip Generation Rate - per fuel position (LUC 946): 152.84Blended ITE Average Trip Generation Rate ‐ per fuel position: 157.33
Location Size (1,000 sf) DateTotal #
Interviews# Trip Length
InterviewsTrip Gen Rate Time Period Trip Length
Percent New Trips
VMT Source
Self‐Service Car Wash (ITE LUC 947)
Largo, FL 10 Nov-89 111 84 - 8am-5pm 2.00 76.0 - Tindale-Oliver & AssociatesClearwater, FL - Nov-89 177 108 - 10am-5pm 1.30 61.0 - Tindale-Oliver & Associates
Collier, FL 11 Dec-09 304 - 30.24 - 2.50 57.0 - Tindale-Oliver & AssociatesCollier, FL 8 Jan-09 186 - 22.75 - 1.96 72.0 - Tindale-Oliver & Associates
Total Size 29 3 778 Average Trip Length: 1.94Total Size (TGR) 19 2 Weighted Average Trip Length: 2.18
ITE 5 1 Weighted Percent New Trip Average: 67.7Blended total 24 Weighted Average Trip Generation Rate: 27.09
ITE Average Trip Generation Rate: 108.00Blend of FL Studies and ITE Average Trip Generation Rate: 43.94
Time Period Trip LengthPercent New
TripsDate
Total # Interviews
# Trip Length Interviews
Trip Gen RateLocation Size (Bays) VMT Source

Appendix B Cost Component Calculations

Tindale Oliver Hillsborough County April 2016 B-1 Mobility Fee Study
Cost Component This appendix presents the detailed calculations for the cost component of the mobility fee
update. Backup data and assumptions are provided for all cost variables, including:
Design
Right-of-Way
Construction
Construction engineering/inspection
Roadway capacity
Transit capital costs
Urban-Design vs. Rural-Design
Due to a lack of available roadway construction data for rural-design roadways, the cost per
lane mile for these types of roads was calculated using an adjustment factor. This factor was
based on the rural-to-urban design cost ratio from the most recent District 7 Long Range
Estimates provided by FDOT. Based on the LRE, the costs for rural-design roadway capacity
expansion (new road construction or lane addition) is approximately 77 percent of the
construction costs for urban-design roadway improvements. For all subsequent tables (for
county and state roadways), costs are presented for urban-design roadways, with the rural-
design roadway costs being calculated using the cost ratio in Table B-1.
Table B‐1 Urban/Rural‐Design Cost Factor
Source: FDOT District 7 Long Range Estimates, 2015
Rural Design Urban Design Ratio0-2 Lanes $2,607,379 $4,013,085 65%0-4 Lanes $2,106,777 $2,758,628 76%0-6 Lanes $1,773,647 $2,215,237 80%2-4 Lanes $2,979,105 $3,581,065 83%4-6 Lanes $3,313,993 $4,035,253 82%Average $2,556,180 $3,320,654 77%
ImprovementCost per Lane Mile

Tindale Oliver Hillsborough County April 2016 B-2 Mobility Fee Study
Design
County Roadways
The design cost factor for county roads was estimated as a percentage of the construction
cost per lane mile. This factor was determined through a review of the design-to-construction
cost ratios from recently completed and bid improvements in Hillsborough County and from
previously completed impact studies throughout Florida. For local county roadways, the
design factors ranged from 3 percent to 32 percent, with a weighted average of 12 percent.
For county roadways from throughout Florida, the design factors ranged from 6 percent to
14 percent with a weighted average of 10 percent. For purposes of this study, the design cost
for county roads was calculated at 10 percent of the construction cost per lane mile based on
the local data, statewide data, and discussions with County staff. See Tables B-10 and B-11
for additional information.
Table B‐2 Design Cost Adjustment – County Roads
1) Design cost is estimated at 12% of construction based on local projects (Table B-10)
and recent impact fee studies (Table B-11, Item a) 2) Source: Appendix B, Table B-19, Items c and d 3) Design cost per lane mile (Item 1) multiplied by the associated section design
weight (Item 2) for each road type and added together All figure rounded to the nearest $1,000
State Roadways
The design cost factor for state roads was estimated as a percentage of the construction cost
per lane mile. This factor was determined through a review of the design-to-construction
cost ratios for state road unit costs in previously completed transportation impact studies
throughout Florida. For state roadways, the design factors ranged from 10 percent to 14
percent, with a weighted average of 11 percent. For purposes of this study, the design cost
for state roads was calculated at 11 percent of the construction cost per lane mile. See Table
B-11 for additional information.
Road TypeDesign Cost per
Lane Mile(1)
Section Design
Distribution(2)
Weighted Design Cost per
Lane Mile(3)
Urban Design $360,000 85% $306,000Rural Design $277,000 15% $42,000Weighted Average Design Cost per Lane Mile $348,000

Tindale Oliver Hillsborough County April 2016 B-3 Mobility Fee Study
Table B‐3 Design Cost Adjustment –State Roads
1) Design cost is estimated at 11% of construction based on recent impact fee studies
(Table B-11, Item b) 2) Source: Appendix B, Table B-19, Items c and d 3) Design cost per lane mile (Item 1) multiplied by the associated section design
weight (Item 2) for each road type and added together All figure rounded to the nearest $1,000
Right-of-Way
The ROW cost reflects the total cost of the acquisitions along a corridor that was necessary
to have sufficient cross-section width to widen an existing road or, in the case of new road
construction, build a new road.
County Roadways
For mobility fee purposes, the ROW cost for county roads was estimated as a percentage of
the construction cost per lane mile. To determine the ROW cost factor, Tindale Oliver
conducted a review of recently completed ROW acquisitions and current ROW estimates
along capacity expansion projects in Hillsborough County and also reviewed ROW estimates
from recent transportation impact fee studies from other counties in Florida. For county
roadways in Hillsborough County, the ROW factors ranged from 4 percent to 119 percent,
with a weighted average of 44 percent, as shown in Table B-12. This factor is higher than the
ratio of ROW to construction cost observed in other Florida jurisdictions (41 percent), as
shown in Table B-13, and reflects more urbanized nature of County. Discussion with staff and
a review of the ROW estimates in the Community Transportation Plan indicated that future
ROW acquisitions are expected to be on the higher than recent acquisition costs. For
purposes of this update study, the ROW cost was estimated at 50 percent of the construction
cost per lane mile for county roadways.
Road TypeDesign Cost per
Lane Mile(1)
Section Design
Distribution(2)
Weighted Design Cost per
Lane Mile(3)
Urban Design $330,000 85% $281,000Rural Design $254,000 15% $38,000Weighted Average Design Cost per Lane Mile $319,000

Tindale Oliver Hillsborough County April 2016 B-4 Mobility Fee Study
Table B‐4 Right‐of‐Way Cost Adjustment – County Roads
1) ROW cost is estimated at 50% of construction based on local projects (Table B-12),
recent impact fee studies (Table B-13, Item a), and discussions with staff 2) Source: Appendix B, Table B-19, Items c and d 3) ROW cost per lane mile (Item 1) multiplied by the associated section design weight
(Item 2) for each road type and added together All figure rounded to the nearest $1,000
State Roadways
Similar to county roads, the ROW cost of state roads was estimated as a percentage of the
construction cost per lane mile. Given the limited data of ROW costs for state roads in
Hillsborough County and based on experience in other jurisdictions, the ROW cost ratio
calculated for county roads was also applied to state roads. Therefore, for purposes of this
update study, the ROW cost for state roads was calculated at 50 percent of the construction
cost per lane mile. See Table B-13 for additional information.
Table B‐5 Right‐of‐Way Cost Adjustment – State Roads
1) ROW cost is estimated at 50% of construction based on local projects (Table B-12),
recent impact fee studies (Table B-13, Item a), and discussions with staff 2) Source: Appendix B, Table B-19, Items c and d 3) ROW cost per lane mile (Item 1) multiplied by the associated section design weight
(Item 2) for each road type and added together All figure rounded to the nearest $1,000
Road TypeROW Cost per
Lane Mile(1)
Section Design
Distribution(2)
Weighted ROW Cost per Lane
Mile(3)
Urban Design $1,500,000 85% $1,275,000Rural Design $1,155,000 15% $173,000Weighted Average ROW Cost per Lane Mile $1,448,000
Road TypeROW Cost per
Lane Mile(1)
Section Design
Distribution(2)
Weighted ROW Cost per Lane
Mile(3)
Urban Design $1,500,000 85% $1,275,000Rural Design $1,155,000 15% $173,000Weighted Average ROW Cost per Lane Mile $1,448,000
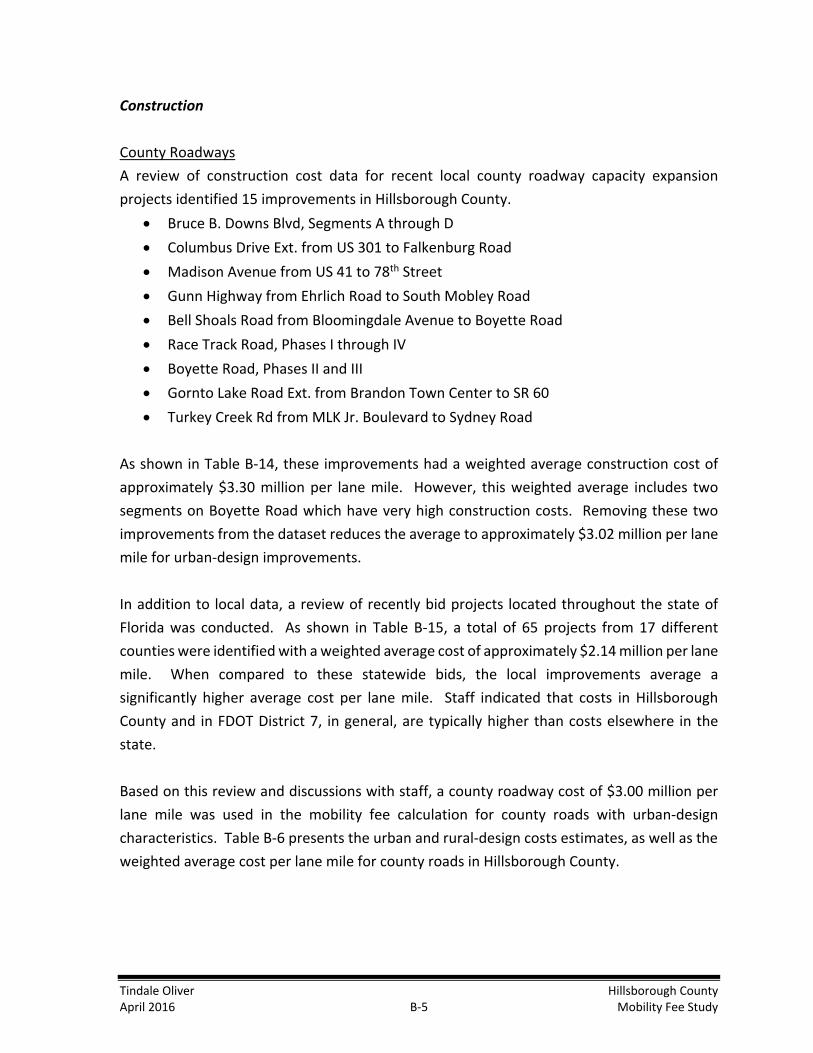
Tindale Oliver Hillsborough County April 2016 B-5 Mobility Fee Study
Construction
County Roadways
A review of construction cost data for recent local county roadway capacity expansion
projects identified 15 improvements in Hillsborough County.
Bruce B. Downs Blvd, Segments A through D
Columbus Drive Ext. from US 301 to Falkenburg Road
Madison Avenue from US 41 to 78th Street
Gunn Highway from Ehrlich Road to South Mobley Road
Bell Shoals Road from Bloomingdale Avenue to Boyette Road
Race Track Road, Phases I through IV
Boyette Road, Phases II and III
Gornto Lake Road Ext. from Brandon Town Center to SR 60
Turkey Creek Rd from MLK Jr. Boulevard to Sydney Road
As shown in Table B-14, these improvements had a weighted average construction cost of
approximately $3.30 million per lane mile. However, this weighted average includes two
segments on Boyette Road which have very high construction costs. Removing these two
improvements from the dataset reduces the average to approximately $3.02 million per lane
mile for urban-design improvements.
In addition to local data, a review of recently bid projects located throughout the state of
Florida was conducted. As shown in Table B-15, a total of 65 projects from 17 different
counties were identified with a weighted average cost of approximately $2.14 million per lane
mile. When compared to these statewide bids, the local improvements average a
significantly higher average cost per lane mile. Staff indicated that costs in Hillsborough
County and in FDOT District 7, in general, are typically higher than costs elsewhere in the
state.
Based on this review and discussions with staff, a county roadway cost of $3.00 million per
lane mile was used in the mobility fee calculation for county roads with urban-design
characteristics. Table B-6 presents the urban and rural-design costs estimates, as well as the
weighted average cost per lane mile for county roads in Hillsborough County.

Tindale Oliver Hillsborough County April 2016 B-6 Mobility Fee Study
Table B‐6 Construction Cost Adjustment – County Roads
1) Source: Tables B-14, B-15, and discussions with staff. Rural design is estimated at
77% of urban design costs (see Table B-1) 2) Source: Appendix B, Table B-19, Items c and d 3) Construction cost per lane mile (Item 1) multiplied by the associated section design
weight (Item 2) for each road type and added together All figure rounded to the nearest $1,000
State Roadways
A review of construction cost data for recent local state roadway capacity expansion projects
identified three (3) improvements in Hillsborough County:
CR 39/Alexander Street from North of I-4 to North of Knights Griffin Road
SR 574 (MLK Jr. Boulevard) from West of Highview Road to East of Parsons Avenue
SR 41 (US 301) from South of Tampa Bypass Canal to North of Fowler Avenue
As shown in Table B-16, these improvements had a weighted average construction cost of
approximately $2.07 million. However, this is heavily influenced by the oldest and longest of
the improvements (CR 39), which was built at a low cost. A review of only the more recent
improvements resulted in a weighted average construction cost of $4.21 million per lane
mile.
In addition to local data, a review of recently bid projects located throughout the state of
Florida was conducted. As shown in Table B-16, a total of 70 projects from 34 different
counties were identified with a weighted average cost of approximately $3.06 million per lane
mile (all improvements are urban-design). The FDOT District 7 Long Range Estimates were
also reviewed (previously presented in Table B-1) and provided an average construction cost
of approximately $3.32 million per lane mile for urban-design projects.
Based on this review and discussions with staff, a state roadway cost of $3.00 million per lane
mile was used in the mobility fee calculation for state roads with urban-design characteristics.
Table B-7 presents the urban and rural-design cost estimates, as well as the weighted average
cost per lane mile for state roads in Hillsborough County.
Road TypeConstruction Cost per Lane
Mile(1)
Section Design
Distribution(2)
Weighted Constr. Cost per
Lane Mile(3)
Urban Design $3,000,000 85% $2,550,000Rural Design $2,310,000 15% $347,000Weighted Average Construction Cost per Lane Mile $2,897,000

Tindale Oliver Hillsborough County April 2016 B-7 Mobility Fee Study
Table B‐7 Construction Cost Adjustment – State Roads
1) Source: Table B-16 and discussions with staff. Rural design is estimated at 77% of
urban design costs (see Table B-1) 2) Source: Appendix B, Table B-19, Items c and d 3) Construction cost per lane mile (Item 1) multiplied by the associated section design
weight (Item 2) for each road type and added together All figure rounded to the nearest $1,000
Construction Engineering/Inspection
County Roadways
The CEI cost factor for county roads was estimated as a percentage of the construction cost
per lane mile. This factor was determined through a review of the CEI-to-construction cost
ratios from recently completed improvements in Hillsborough County and from previously
completed impact studies throughout Florida. For local county roadways, the CEI factors
ranged from 9 percent to 10 percent, with a weighted average of 9 percent. For county
roadways from throughout Florida, the CEI factors ranged from 3 percent to 17 percent with
a weighted average of 9 percent. For purposes of this study, the CEI cost for county roads
was calculated at 9 percent of the construction cost per lane mile based on the local data,
statewide data, and discussions with County staff. See Tables B-17 and B-18 for additional
information.
Table B‐8 CEI Cost Adjustment – County Roads
1) CEI cost is estimated at 9% of construction based on local projects (Table B-17) and
recent impact fee studies (Table B-18, Item a) 2) Source: Appendix B, Table B-19, Items c and d 3) CEI cost per lane mile (Item 1) multiplied by the associated section design weight
(Item 2) for each road type and added together All figure rounded to the nearest $1,000
Road TypeConstruction Cost per Lane
Mile(1)
Section Design
Distribution(2)
Weighted Constr. Cost per
Lane Mile(3)
Urban Design $3,000,000 85% $2,550,000Rural Design $2,310,000 15% $347,000Weighted Average Construction Cost per Lane Mile $2,897,000
Road TypeCEI Cost per Lane
Mile(1)
Section Design
Distribution(2)
Weighted CEI Cost per Lane
Mile(3)
Urban Design $270,000 85% $230,000Rural Design $208,000 15% $31,000Weighted Average CEI Cost per Lane Mile $261,000
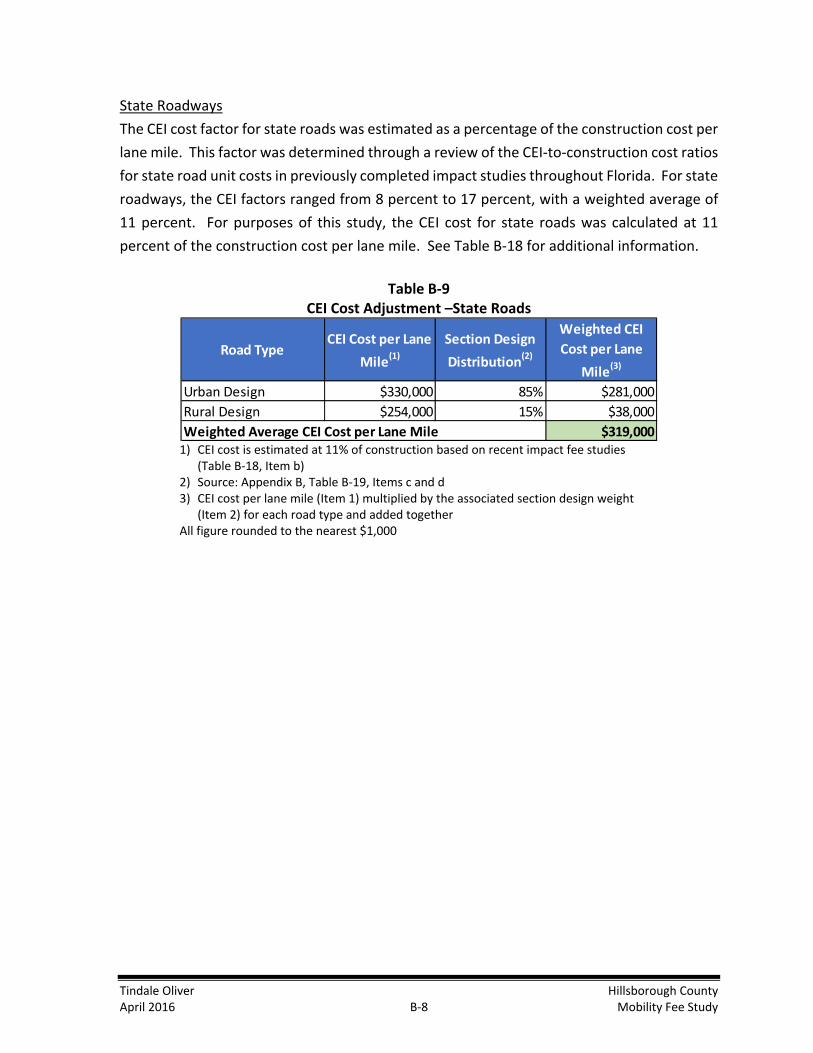
Tindale Oliver Hillsborough County April 2016 B-8 Mobility Fee Study
State Roadways
The CEI cost factor for state roads was estimated as a percentage of the construction cost per
lane mile. This factor was determined through a review of the CEI-to-construction cost ratios
for state road unit costs in previously completed impact studies throughout Florida. For state
roadways, the CEI factors ranged from 8 percent to 17 percent, with a weighted average of
11 percent. For purposes of this study, the CEI cost for state roads was calculated at 11
percent of the construction cost per lane mile. See Table B-18 for additional information.
Table B‐9
CEI Cost Adjustment –State Roads
1) CEI cost is estimated at 11% of construction based on recent impact fee studies
(Table B-18, Item b) 2) Source: Appendix B, Table B-19, Items c and d 3) CEI cost per lane mile (Item 1) multiplied by the associated section design weight
(Item 2) for each road type and added together All figure rounded to the nearest $1,000
Road TypeCEI Cost per Lane
Mile(1)
Section Design
Distribution(2)
Weighted CEI Cost per Lane
Mile(3)
Urban Design $330,000 85% $281,000Rural Design $254,000 15% $38,000Weighted Average CEI Cost per Lane Mile $319,000

Tindale Oliver Hillsborough County April 2016 B-9 Mobility Fee Study
Table B‐10 Design Cost Factor ‐ Hillsborough County Local Roadway Improvements
Source: Hillsborough County Public Works Department
Project ID Roadway From ToStartDate
Status Feature Section Design Design CostConstruction
CostDesign‐to‐
Construction61043000 Bruce B. Downs Blvd, Segment D Pebble Creek Pasco Co. Line 10/31/2003 Active 4 to 8 Lanes Urban; Curb & Gutter $4,749,955 $14,931,747 32%61044000 Bruce B. Downs Blvd, Segment B/C Palm Springs Pebble Creek Dr 10/15/2003 Active 4 to 8 Lanes Urban; Curb & Gutter $3,552,458 $52,249,133 7%61045000 Bruce B. Downs Blvd, Segment A Bearss Ave Palm Springs 10/31/2003 Active 4 to 8 Lanes Urban; Curb & Gutter $4,534,978 $37,489,099 12%61057000 Columbus Dr Ext. US 301 Falkenburg Rd 4/1/2006 Completed 0 to 4 Lanes Urban; Curb & Gutter $851,923 $7,242,200 12%61150000 Madison Ave US 41 78th St 10/7/2011 Active 2 to 4 Lanes Urban; Curb & Gutter $923,013 $7,000,000 13%69106000 Gunn Hwy Ehrlich Rd S. Mobley Rd 10/15/2001 Completed 2 to 4 Lanes Urban; Curb & Gutter $999,745 $5,656,000 18%69112000 Bell Shoals Rd Bloomingdale Ave Boyette Rd 4/10/2007 Active 2 to 4 Lanes Urban; Curb & Gutter $780,150 $24,000,000 3%69118000 Race Track Rd, Ph. I Douglas Rd Linebaugh Ave 4/30/2008 Completed 2 to 6 Lanes Urban; Curb & Gutter $12,187,14469119000 Race Track Rd, Ph. II Countryway Blvd S. Mobley Rd 7/16/2004 Completed 2 to 4 Lanes Urban; Curb & Gutter $15,973,28669120000 Race Track Rd, Ph. III Linebaugh Ave Countryway Blvd 9/6/2006 Completed 2 to 4 Lanes Urban; Curb & Gutter $12,198,25169121000 Race Track Rd, Ph. IV Hillsborough Ave Douglas Rd 5/1/2009 Active 2 to 6 Lanes Urban; Curb & Gutter $5,375,85569123000 Boyette Rd, Ph. II Balm Riverview Rd Donneymoor Dr 11/22/2006 Completed 2 to 4 Lanes Urban; Curb & Gutter $16,570,83769124000 Boyette Rd, Ph. III Donneymoor Dr Bell Shoals Rd 10/2/2009 Active 2 to 4 Lanes Urban; Curb & Gutter $20,814,45069127000 Gornto Lake Rd Ext. Brandon Town Center SR 60 8/1/2006 Completed 0 to 4 Lanes Urban; Curb & Gutter $1,400,493 $8,656,579 16%69625000 Turkey Creek Rd MLK Blvd Sydney Rd 12/1/2014 Active 2 to 4 Lanes Urban; Curb & Gutter $700,000 $3,166,000 22%
$28,212,155 $243,510,581 12%Total
11%
13%
$5,019,295
$4,700,145

Tindale Oliver Hillsborough County April 2016 B-10 Mobility Fee Study
Table B‐11 Design Cost Factor for County and State Roads – Recent Impact Fee Studies
Source: Recent impact fee studies conducted throughout Florida Note: Letter references (i.e., “a”) are used to assist with footnotes and sourcing
Design Constr. Design Ratio Design Constr. Design Ratio2006 Collier $323,639 $2,558,546 13% $349,643 $3,385,978 10%2006 Citrus $361,774 $2,584,099 14% $400,432 $2,860,227 14%2006 Highlands $235,030 $1,678,785 14% $347,326 $2,480,900 14%2006 Marion $185,333 $1,941,244 10% $154,643 $1,430,919 11%2007 Pasco $246,324 $3,079,051 8% $427,112 $3,050,799 14%2007 Lake $232,882 $2,911,021 8% $318,412 $3,184,125 10%2007 Flagler $174,000 $1,740,000 10% - - n/a2007 Volusia $291,696 $2,651,778 11% $309,526 $3,095,258 10%2008 Leon $212,800 $2,660,000 8% $372,130 $3,383,000 11%2008 Sumter $178,960 $2,237,000 8% $238,000 $2,380,000 10%2009 Collier $217,000 $3,100,000 7% $320,000 $3,200,000 10%2009 Polk $95,400 $1,590,000 6% $217,000 $2,170,000 10%2009 Hillsborough/Tampa $308,000 $2,800,000 11% $420,000 $3,500,000 12%2010 Collier $119,560 $1,708,000 7% $241,800 $2,418,000 10%2011 Sarasota/North Port $240,000 $2,400,000 10% $200,000 $2,000,000 10%2012 Osceola $371,196 $2,651,400 14% $313,258 $2,847,800 11%2012 Orange $264,000 $2,400,000 11% - - n/a2012 City of Orlando $288,000 $2,400,000 12% $319,000 $2,900,000 11%2012 City of Sarasota $240,000 $2,400,000 10% $286,000 $2,600,000 11%2013 Hernando $198,000 $1,980,000 10% $222,640 $2,024,000 11%2013 Charlotte $220,000 $2,200,000 10% $240,000 $2,400,000 10%2014 Indian River $159,000 $1,598,000 10% $196,000 $1,776,000 11%2015 Collier $270,000 $2,700,000 10% $270,000 $2,700,000 10%2015 Brevard $242,000 $2,023,000 12% $316,000 $2,875,000 11%2015 Sumter $210,000 $2,100,000 10% $276,000 $2,505,000 11%2015 Marion $167,000 $2,668,000 6% $227,000 $2,060,000 11%2015 Palm Beach $224,000 $1,759,000 13% $333,000 $3,029,000 11%
$232,429 $2,315,516 10% $292,597 $2,650,240 11%(a) (b)
Year CountyCounty Roadways (Cost per Lane Mile) State Roadways (Cost per Lane Mile)
Average

Tindale Oliver Hillsborough County April 2016 B-11 Mobility Fee Study
Table B‐12 Right‐of‐Way Cost Factor ‐ Hillsborough County Local Roadway Improvements
Source: Hillsborough County Public Works Department
Project ID Roadway From ToStartDate
Status Feature Section Design ROW CostConstruction
CostROW‐to‐
Construction61043000 Bruce B. Downs Blvd, Segment D Pebble Creek Pasco Co. Line 10/31/2003 Active 4 to 8 Lanes Urban; Curb & Gutter $590,366 $14,931,747 4%61044000 Bruce B. Downs Blvd, Segment B/C Palm Springs Pebble Creek Dr 10/15/2003 Active 4 to 8 Lanes Urban; Curb & Gutter $13,368,974 $52,249,133 26%61045000 Bruce B. Downs Blvd, Segment A Bearss Ave Palm Springs 10/31/2003 Active 4 to 8 Lanes Urban; Curb & Gutter $9,831,370 $37,489,099 26%61057000 Columbus Dr Ext. US 301 Falkenburg Rd 4/1/2006 Completed 0 to 4 Lanes Urban; Curb & Gutter $4,000,000 $7,242,200 55%69106000 Gunn Hwy Ehrlich Rd S. Mobley Rd 10/15/2001 Completed 2 to 4 Lanes Urban; Curb & Gutter $6,750,000 $5,656,000 119%69112000 Bell Shoals Rd Bloomingdale Ave Boyette Rd 4/10/2007 Active 2 to 4 Lanes Urban; Curb & Gutter $23,700,000 $24,000,000 99%69118000 Race Track Rd, Ph. I Douglas Rd Linebaugh Ave 4/30/2008 Completed 2 to 6 Lanes Urban; Curb & Gutter $12,187,14469119000 Race Track Rd, Ph. II Countryway Blvd S. Mobley Rd 7/16/2004 Completed 2 to 4 Lanes Urban; Curb & Gutter $15,973,28669120000 Race Track Rd, Ph. III Linebaugh Ave Countryway Blvd 9/6/2006 Completed 2 to 4 Lanes Urban; Curb & Gutter $12,198,25169121000 Race Track Rd, Ph. IV Hillsborough Ave Douglas Rd 5/1/2009 Active 2 to 6 Lanes Urban; Curb & Gutter $5,375,85569123000 Boyette Rd, Ph. II Balm Riverview Rd Donneymoor Dr 11/22/2006 Completed 2 to 4 Lanes Urban; Curb & Gutter $16,570,83769124000 Boyette Rd, Ph. III Donneymoor Dr Bell Shoals Rd 10/2/2009 Active 2 to 4 Lanes Urban; Curb & Gutter $20,814,45069127000 Gornto Lake Rd Ext. Brandon Town Center SR 60 8/1/2006 Completed 0 to 4 Lanes Urban; Curb & Gutter $9,883,047 $8,656,579 114%
$102,122,401 $233,344,581 44%Total
52%
27%
$23,782,299
$10,216,345

Tindale Oliver Hillsborough County April 2016 B-12 Mobility Fee Study
Table B‐13 Right‐of‐Way Cost Factor for County and State Roads – Recent Impact Fee Studies
Source: Recent impact fee studies conducted throughout Florida Note: Letter references (i.e., “a”) are used to assist with footnotes and sourcing
ROW Constr. ROW Ratio ROW Constr. ROW Ratio2006 Collier $1,751,790 $2,558,546 68% $1,751,790 $3,385,978 52%2006 Citrus $784,599 $2,584,099 30% $949,979 $2,860,227 33%2006 Highlands $468,853 $1,678,785 28% $507,500 $2,480,900 20%2006 Marion $1,005,123 $1,941,244 52% $868,908 $1,430,919 61%2007 Pasco $814,517 $3,079,051 26% $1,560,714 $3,050,799 51%2007 Lake $599,185 $2,911,021 21% $1,462,133 $3,184,125 46%2007 Flagler $460,000 $1,740,000 26% - - n/a2007 Volusia $858,109 $2,651,778 32% $954,543 $3,095,258 31%2008 Leon $1,120,000 $2,660,000 42% $1,363,000 $3,383,000 40%2008 Sumter $802,000 $2,237,000 36% $1,400,000 $2,380,000 59%2009 Collier $1,300,000 $3,100,000 42% $1,300,000 $3,200,000 41%2009 Polk $1,491,000 $1,590,000 94% $550,000 $2,170,000 25%2009 Hillsborough/Tampa $1,500,000 $2,800,000 54% $2,500,000 $3,500,000 71%2010 Collier $901,000 $1,708,000 53% $901,000 $2,418,000 37%2011 Sarasota/North Port $620,000 $2,400,000 26% $800,000 $2,000,000 40%2012 Osceola $1,087,074 $2,651,400 41% $1,167,598 $2,847,800 41%2012 Orange $1,080,000 $2,400,000 45% - - n/a2012 City of Orlando $1,080,000 $2,400,000 45% $1,305,000 $2,900,000 45%2012 City of Sarasota $620,000 $2,400,000 26% $1,144,000 $2,600,000 44%2013 Hernando $811,800 $1,980,000 41% $890,560 $2,024,000 44%2013 Charlotte $1,034,000 $2,200,000 47% $1,128,000 $2,400,000 47%2014 Indian River $656,000 $1,598,000 41% $781,000 $1,776,000 44%2015 Collier $863,000 $2,700,000 32% $863,000 $2,700,000 32%2015 Brevard $708,000 $2,023,000 35% $1,006,000 $2,785,000 36%2015 Sumter $945,000 $2,100,000 45% $1,127,000 $2,505,000 45%2015 Marion $1,001,000 $1,668,000 60% $1,236,000 $2,060,000 60%2015 Palm Beach $721,000 $1,759,000 41% $1,333,000 $3,029,000 44%
$929,002 $2,278,479 41% $1,154,029 $2,646,640 44%(a) (b)
Year CountyCounty Roadways (Cost per Lane Mile) State Roadways (Cost per Lane Mile)
Average

Tindale Oliver Hillsborough County April 2016 B-13 Mobility Fee Study
Table B‐14 Construction Cost ‐ Hillsborough County Local Roadway Improvements
Source: Hillsborough County Public Works Department
Project ID Roadway From ToStartDate
Status Feature Section Design LengthLanes Added
Lane Miles Added
Construction Cost
Construction Cost per Lane
Mile61043000 Bruce B. Downs Blvd, Segment D Pebble Creek Pasco Co. Line 10/31/2003 Active 4 to 8 Lanes Urban; Curb & Gutter 1.36 4 5.44 $14,931,747 $2,744,80661044000 Bruce B. Downs Blvd, Segment B/C Palm Springs Pebble Creek Dr 10/15/2003 Active 4 to 8 Lanes Urban; Curb & Gutter 3.36 4 13.44 $52,249,133 $3,887,58461045000 Bruce B. Downs Blvd, Segment A Bearss Ave Palm Springs 10/31/2003 Active 4 to 8 Lanes Urban; Curb & Gutter 3.56 4 14.24 $37,489,099 $2,632,66161057000 Columbus Dr Ext. US 301 Falkenburg Rd 4/1/2006 Completed 0 to 4 Lanes Urban; Curb & Gutter 1.56 4 6.24 $7,242,200 $1,160,60961150000 Madison Ave US 41 78th St 10/7/2011 Active 2 to 4 Lanes Urban; Curb & Gutter 2.29 2 4.58 $7,000,000 $1,528,38469106000 Gunn Hwy Ehrlich Rd S. Mobley Rd 10/15/2001 Completed 2 to 4 Lanes Urban; Curb & Gutter 0.90 2 1.80 $5,656,000 $3,142,22269112000 Bell Shoals Rd Bloomingdale Ave Boyette Rd 4/10/2007 Active 2 to 4 Lanes Urban; Curb & Gutter 2.20 2 4.40 $24,000,000 $5,454,54569118000 Race Track Rd, Ph. I Douglas Rd Linebaugh Ave 4/30/2008 Completed 2 to 6 Lanes Urban; Curb & Gutter 1.01 4 4.04 $12,187,144 $3,016,62069119000 Race Track Rd, Ph. II Countryway Blvd S. Mobley Rd 7/16/2004 Completed 2 to 4 Lanes Urban; Curb & Gutter 1.80 2 3.60 $15,973,286 $4,437,02469120000 Race Track Rd, Ph. III Linebaugh Ave Countryway Blvd 9/6/2006 Completed 2 to 4 Lanes Urban; Curb & Gutter 1.26 2 2.52 $12,198,251 $4,840,57669121000 Race Track Rd, Ph. IV Hillsborough Ave Douglas Rd 5/1/2009 Active 2 to 6 Lanes Urban; Curb & Gutter 0.69 4 2.76 $5,375,855 $1,947,77469123000 Boyette Rd, Ph. II Balm Riverview Rd Donneymoor Dr 11/22/2006 Completed 2 to 4 Lanes Urban; Curb & Gutter 0.92 2 1.84 $16,570,837 $9,005,89069124000 Boyette Rd, Ph. III Donneymoor Dr Bell Shoals Rd 10/2/2009 Active 2 to 4 Lanes Urban; Curb & Gutter 1.84 2 3.68 $20,814,450 $5,656,10169127000 Gornto Lake Rd Ext. Brandon Town Center SR 60 8/1/2006 Completed 0 to 4 Lanes Urban; Curb & Gutter 0.60 4 2.40 $8,656,579 $3,606,90869625000 Turkey Creek Rd MLK Blvd Sydney Rd 12/1/2014 Active 2 to 4 Lanes Urban; Curb & Gutter 1.40 2 2.80 $3,166,000 $1,130,714
24.75 ‐ 73.78 $243,510,581 $3,300,49621.99 ‐ 68.26 $206,125,294 $3,019,708
TotalTotal (excluding Boyette Rd, Ph. II and Ph. III)

Tindale Oliver Hillsborough County April 2016 B-14 Mobility Fee Study
Table B‐15 Construction Cost – County Road Improvements from Other Jurisdictions throughout Florida
Orange 5 Clarcona-Ocoee Rd Hiawassee Rd Clark 2009 Bid 2 to 4 Urban 2.50 2 5.00 $10,182,738 $2,036,548Orange 5 Woodbury Rd S. of SR 50 Challenger Pkwy 2009 Bid 2 to 4 Urban 0.65 2 1.30 $4,088,942 $3,145,340Orange 5 Sand Lake Rd President's Dr FL Mall 2009 Bid 2 to 4 Urban 1.00 2 2.00 $6,020,755 $3,010,378Orange 5 Taft-Vineland Road Extension Central Florida Pkwy John Young Pkwy 2009 Bid 2 to 4 Urban 0.70 2 1.40 $4,462,535 $3,187,525Osceola 5 Narcoossee Rd US 192 Orange Co. Line 2009 Bid 2 to 4 Urban 7.40 2 14.80 $47,360,000 $3,200,000Osceola 5 Osceola Pkwy (Ph. I) FL Turnpike Buenaventura Blvd 2009 Bid 4 to 6 Urban 1.57 2 3.14 $5,966,000 $1,900,000Osceola 5 Poinciana Blvd (Ph. II) Crescent Lakes US 17/92 2009 Bid 2 to 4 Urban 2.50 2 5.00 $16,000,000 $3,200,000Osceola 5 Old Lake Wilson Rd (Ph. I) Livingston Rd Sinclair Rd 2009 Bid 2 to 4 Urban 2.30 2 4.60 $14,720,000 $3,200,000Sarasota 1 Fruitvil le Rd (Ph. I) Tatum Rd Debrecen Rd 2009 Bid 2 to 4 Urban 0.72 2 1.44 $4,355,796 $3,024,858Sarasota 1 Fruitvil le Rd (Ph. II) Coburn Rd Tatum Rd 2009 Bid 2 to 4 Urban 1.26 2 2.52 $8,557,904 $3,395,994Lee 1 Colonial Blvd (CR 884) I-75 SR 82 2009 Bid 4 to 6 Urban 2.70 2 5.40 $14,576,393 $2,699,332Indian River 4 College Lane Rd Extension IRSC 66th Ave 2009 Bid 0 to 2 Urban 0.50 2 1.00 $1,700,000 $1,700,000Indian River 4 16th St 66th Ave 74th Ave 2009 Bid 0 to 2 Urban 1.27 2 2.54 $3,109,321 $1,224,142Polk 1 Pine Tree Trail Ernie Caldwell Blvd CR 54/Reagan Pkwy 2009 Bid 0 to 2 Urban 1.40 2 2.80 $3,442,332 $1,229,404Polk 1 Lakeland Highlands Rd Polk Pkwy CR 540A 2009 Bid 2 to 4 Urban 3.01 2 6.02 $13,603,672 $2,259,746Palm Beach 4 Alt. A1A S. of Frederick Small Rd Center St 2009 Bid 4 to 6 Urban 4.40 2 8.80 $6,364,139 $723,198Palm Beach 4 Lyons Rd Glades Rd Yamato Rd 2009 Bid 4 to 6 Urban 1.80 2 3.60 $5,967,464 $1,657,629Palm Beach 4 Hypoluxo Rd Jog Rd Military Tr 2009 Bid 4 to 6 Urban 2.00 2 4.00 $4,054,386 $1,013,597Palm Beach 4 Lawrence Rd S. of C. Stanley Weaver Canal N. of C. Stanley Weaver Canal 2009 Bid 2 to 4 Urban 0.20 2 0.40 $1,051,680 $2,629,200Collier 1 Oil Well Rd (Segment 2) Immokalee Rd E. of Everglades Blvd 2009 Bid 2 to 4/6 Urban 5.05 2/4 10.92 $15,091,068 $1,381,966Collier 1 Oil Well Rd (Segment 4A) W. of Oil Well Grade Rd W. of Camp Keais Rd 2009 Bid 2 to 6 Urban 4.72 4 18.88 $15,875,782 $840,878Marion 5 CR 200A US 441 NE 35th St 2009 Bid 2 to 4 Urban 1.73 2 3.46 $6,451,296 $1,864,536Marion 5 NW 44th Ave US 27 NW 60th St 2009 Bid 2 to 4 Urban 2.63 2 5.26 $5,910,189 $1,123,610Marion 5 SE 19th Ave SE 36th Ave 2009 Bid 2 to 4 Urban 1.50 2Marion 5 SE 36th Ave SR 464 2009 Bid 0 to 4 Urban 0.30 4Orange 5 Alafaya Tr Avalon Park Blvd Mark Twain Blvd 2010 Bid 2 to 4 Urban 3.83 2 7.66 $18,918,599 $2,469,791Broward 4 Bailey Rd NW 64th Ave / SW 81st Ave SR 7 (US 441) 2010 Bid 2 to 4 Urban 2.00 2 4.00 $6,330,297 $1,582,574Lee 1 Six Mile Cypress Pkwy Daniels Pkwy S. of Winkler Rd Ext. 2010 Bid 2 to 4 Urban 3.09 2 6.18 $6,711,242 $1,085,961Charlotte 1 Piper Rd Henry St Jones Loop Rd 2010 Bid 2 to 4 Sub-Urb 2.10 2 4.20 $8,627,803 $2,054,239Indian River 4 53rd St Kings Hwy Lateral H Canal 2010 Bid 0 to 4 Urban 2.04 4 8.16 $7,000,000 $857,843Indian River 4 53rd St Lateral H Canal Indian River Blvd 2010 Bid 0 to 4 Urban 0.50 4 2.00 $7,605,993 $3,802,997Palm Beach 4 45th St Jog Rd E. of Haverhil l Rd 2010 Bid 2 to 4 Urban 1.50 2 3.00 $12,423,103 $4,141,034Palm Beach 4 Jog Rd S. of 45th St N. of 45th St 2010 Bid 0 to 4 Urban 0.50 4 2.00 $4,960,399 $2,480,200Palm Beach 4 Congress Ave Lantana Rd Melaluca Ln 2010 Bid 4 to 6 Urban 1.30 2 2.60 $6,130,698 $2,357,961Palm Beach 4 Seminole Pratt Whitney Rd SR 80 Sycamore Dr 2010 Bid 2 to 4 Urban 4.20 2 8.40 $9,930,460 $1,182,198Palm Beach 4 Seminole Pratt Whitney Rd S. of M Canal S. of Orange Blvd 2010 Bid 2 to 4 Urban 1.40 2 2.80 $2,820,892 $1,007,461Citrus 7 CR 486 SR 44 Forest Ridge Blvd 2010 Bid 2 to 4 Urban 6.30 2 12.60 $26,614,211 $2,112,239Brevard 5 Pineda Cswy Extension I-95 W. of Wickham Rd 2010 Bid 0 to 4 Urban 2.10 4 8.40 $17,238,865 $2,052,246Sarasota 1 North Cattlemen Rd Richardson Rd Desoto Rd 2011 Bid 2 to 4 Urban 2.55 2 5.10 $12,153,584 $2,383,056Lee 1 Daniels Pkwy Chamberlin Pkwy Gateway Blvd 2011 Bid 4 to 6 Urban 2.05 2 4.10 $2,906,553 $708,915Orange 5 Rouse Rd SR 50 Corporate Blvd 2011 Bid 2 to 4 Urban 2.60 2 5.20 $29,380,249 $5,650,048Orange 5 CR 535 Seg. A Magnolia Park Ct SR 429 2011 Bid 2 to 4 Urban 1.37 2 2.74 $8,390,570 $3,062,252Osceola 5 Goodman Rd Tri-County Sand Mine Rd 2011 Bid 0 to 2 Urban 3.53 2 7.06 $7,060,000 $1,000,000Pinellas 1 Bryan Dairy Rd Starkey Rd (CR 1) 72nd St 2011 Bid 4 to 6 Urban 1.47 2 2.94 $10,327,383 $3,512,715Hernando 7 Elgin Blvd Mariner Blvd East 3900' 2011 Bid 2 to 4 Urban 0.74 2 1.48 $2,684,566 $1,813,896Hernando 7 Sunshine Grove Rd SR 50 Ken Austin Pkwy 2011 Bid 2 to 4 Urban 2.10 2 4.20 $4,646,801 $1,106,381
Construction CostConstruction Cost
per Lane Mile
SE 31st St 4.20 $5,544,524 $1,320,125
Status Feature Design LengthLanes
AddedLane Miles
AddedCounty District Description From To Year

Tindale Oliver Hillsborough County April 2016 B-15 Mobility Fee Study
Table B‐15 (Continued) Construction Cost – County Road Improvements from Other Jurisdictions throughout Florida
Source: Data obtained from each respective county (Building and Public Works Departments
Palm Beach 4 Lyons Rd N. of West Atlantic Ave S. of Boynotno Beach Blvd 2011 Bid 0 to 2 Urban 3.20 2 6.40 $5,329,359 $832,712Charlotte 1 Burnt Store Rd (Ph. I) US 41 Notre Dame Blvd 2011 Bid 2 to 4 Urban 2.40 2 4.80 $13,512,394 $2,815,082Indian River 4 Oslo Rd Ph. II 43rd Ave 27th Ave 2011 Bid 2 to 4D Urban 1.20 3 3.60 $4,531,822 $1,258,839Indian River 4 Oslo Rd Ph. III 43rd Ave 58th Ave 2012 Bid 2 to 4 Urban 1.15 2 2.30 $3,812,202 $1,657,479Indian River 4 66th Ave SR 60 49th St 2012 Bid 2 to 4 Urban 3.05 2 6.10 $20,773,389 $3,405,474Polk 1 Kathleen Rd (CR35A) Ph. II Galloway Rd Duff Rd 2012 Bid 2 to 4 Urban 3.00 2 6.00 $17,813,685 $2,968,948Polk 1 Bartow Northern Connector Ph. I US 98 US 17 2012 Bid 0 to 4 Urban 2.00 4 8.00 $11,255,736 $1,406,967Volusia 5 Tymber Creek Rd SR 40 Peruvian Ln 2012 Bid 2 to 4 Urban 0.75 2 1.50 $5,276,057 $3,517,371Palm Beach 4 Jog Rd N. of SR 710 N. of Florida's Turnpike 2012 Bid 0 to 4 Urban 0.70 4 2.80 $3,413,874 $1,219,241Palm Beach 4 West Atlantic Ave W. of Lyons Rd Starkey Rd 2012 Bid 2 to 4 Urban 0.80 2 1.60 $8,818,727 $5,511,704Palm Beach 4 60th St N & SR 7 Ext. E. of Royal Palm Beach Blvd SR 7 2012 Bid 0 to 2 Urban 1.50 2 3.00 $3,821,404 $1,273,801Brevard 5 Babcock St S. of Foundation Park Blvd Malabar Rd 2013 Bid 2 to 4 Urban 12.40 2 24.80 $56,000,000 $2,258,065Marion 5 SW 110th St US 41 SW 200th Ave 2013 Bid 0 to 2 Urban 0.11 2 0.22 $438,765 $1,994,386Marion 5 NW 35th St NW 35th Avenue Rd NW 27th Ave 2013 Bid 0 to 4 Urban 0.50 4Marion 5 NW 35th St NW 27th Ave US 441 2013 Bid 2 to 4 Urban 1.30 2Sumter 5 C-466A, Ph. III US 301 N Powell Rd 2013 Bid 2 to 3/4 Urban 1.10 2 2.20 $4,283,842 $1,947,201Collier 1 Collier Blvd (CR 951) Golden Gate Blvd Green Blvd 2014 Bid 4 to 6 Urban 2.74 2 5.48 $21,157,124 $3,860,789Collier 1 Golden Gate Blvd Wilson Blvd Desoto Blvd 2014 Bid 2 to 4 Urban 5.71 2 11.42 $51,402,161 $4,501,065Brevard 5 St. Johns Heritage Pkwy SE of I-95 Intersection US 192 (Space Coast Pkwy) 2014 Bid 0 to 2 Sub-Urb 3.11 2 6.22 $16,763,567 $2,695,107
Count: 65 324.34 $694,339,528 $2,140,777
YearCounty District Description From To
4.60 $8,616,236 $1,873,095
Total
Construction CostConstruction Cost
per Lane MileStatus Feature Design Length
Lanes Added
Lane Miles Added

Tindale Oliver Hillsborough County April 2016 B-16 Mobility Fee Study
Table B‐16 Construction Cost – State Road Improvements from Hillsborough County and Other Jurisdictions throughout Florida
Leon 3 SR 10 (Mahan Drive) Dempsey Mayo Rd Walden Rd 2009 Bid 2 to 4 Urban 3.10 2 6.20 $18,083,410 $2,916,679Indian River 4 SR 60 (Osceola Blvd) W. of I-95 W. of 82nd Ave/CR 609 2009 Bid 4 to 6 Urban 3.07 2 6.14 $7,134,452 $1,161,963Sarasota 1 US 301 Wood St Myrtle Ave 2009 Bid 4 to 6 Urban 2.60 2 5.20 $14,666,593 $2,820,499Pasco 7 US 41 (SR 45) Tower Rd Ridge Rd 2009 Bid 2 to 4 Urban 2.84 2 5.68 $12,685,027 $2,233,279Lee 1 SR 739 US 41 (S. of Alico) Six Mile Cypress Pkwy 2009 Bid 0 to 6 Urban 2.77 6 16.62 $20,552,627 $1,236,620Marion 5 SR 35 (US 301) Sumter County Line 529' S. of CR 42 2009 Bid 2 to 4 Urban 1.40 2 2.80 $3,596,000 $1,284,286Miami-Dade 6 Perimeter Rd NW 72 Avenue NW 57 Avenue 2009 Bid 2 to 4 Urban 1.50 2 3.00 $4,855,070 $1,618,357Polk 1 US 27 N. of CR 546 S. of SR 544 2009 Bid 2 to 4 Urban 1.56 2 3.12 $4,100,069 $1,314,125Santa Rosa 3 SR 281 (Avalon Blvd) N. of CSX R/R Bridge S. of Commerce Rd 2009 Bid 2 to 4 Urban 0.98 2 1.96 $5,621,006 $2,867,860Santa Rosa 3 SR 281 (Avalon Blvd) Gulf Rd SR 10 (US 90) 2009 Bid 2 to 4 Urban 1.78 2 3.56 $9,150,583 $2,570,388St. Lucie 4 SR 70 MP 5.860 MP 10.216 2009 Bid 2 to 4 Urban 4.36 2 8.72 $12,426,020 $1,425,002Sumter 5 SR 35 (US 301) N. of CR 204 Marion County Line 2009 Bid 2 to 4 Urban 1.51 2 3.02 $3,856,688 $1,277,049Washington 3 SR 79 N. Environmental Rd Strickland Rd 2009 Bid 2 to 4 Sub-Urb 1.72 2 3.44 $8,877,323 $2,580,617Lake 5 SR 50 E. of Grand Hwy W. of Hancock Rd 2010 Bid 4 to 6 Urban 1.30 2 2.60 $4,689,633 $1,803,705Polk 1 SR 559 Extension SR 655 (Recker Hwy) Derby Ave 2010 Bid 0 to 2 Urban 0.69 2 1.38 $2,751,592 $1,993,907Santa Rosa 3 SR 281 (Avalon Blvd) SR 8 (I-10) S. of Moor's Lodge 2010 Bid 2 to 4 Urban 0.85 2 1.70 $5,378,226 $3,163,662Santa Rosa 3 SR 281 (Avalon Blvd) S. of Moor's Lodge N. of CSX R/R Bridge 2010 Bid 2 to 4 Urban 1.48 2 2.96 $7,120,212 $2,405,477Lee 1 US 41 Corkscrew Rd San Carlos Blvd 2010 Bid 4 to 6 Urban 4.48 2 8.96 $12,468,224 $1,391,543Polk 1 US 98 S. of Manor Dr N. of CR 540A 2010 Bid 4 to 6 Urban 3.32 2 6.64 $11,092,909 $1,670,619St. Lucie 4 SR 70 Okeechobee County Line MP 5.871 2010 Bid 2 to 4 Urban 5.87 2 11.74 $18,782,629 $1,599,883Polk 1 US 98 (Bartow Hwy) Brooks St Edgewood Dr 2011 Bid 4 to 6 Urban 0.72 2 1.44 $4,341,917 $3,015,220Hillsborough 7 CR 39/Alexander St N. of I-4 N. of Knights Griffin 2011 Bid 0 to 4 Urban 3.19 4 12.76 $14,782,862 $1,158,532Pinellas 7 SR 688 (Ulmerton Rd) E. of 119th St W. of Seminole Bypass 2011 Bid 4 to 6 Urban 1.50 2 3.00 $16,908,928 $5,636,309Polk 1 SR 60 (Van Fleet) W. of US 98/Broadway W. of US 17 (SR 555) 2011 Bid 2 to 4 Urban 0.86 2 1.72 $9,460,591 $5,500,344Lake 5 SR 500 (US 441) Martin Luther King Jr. Blvd Lake Ella Rd 2011 Bid 4 to 6 Urban 3.25 2 6.50 $16,278,889 $2,504,444Hillsborough 7 SR 574 (MLK Blvd) W. of Highview Rd E. of Parsons Ave 2011 Bid 3 to 5 Urban 0.91 2 1.82 $7,147,510 $3,927,203Collier 1 SR 84 (Davis Blvd) E. of Santa Barbara Blvd W. of Radio Rd 2012 Bid 2 to 6 Urban 1.77 4 7.08 $10,663,287 $1,506,114Volusia 5 SR 415 Seminole Co. Line Reed Ell is Rd 2012 Bid 2 to 4 Urban 2.26 2 4.53 $18,718,637 $4,132,149Volusia 5 SR 415 Reed Ell is Rd 0.3 miles N. of Acorn Lake 2012 Bid 2 to 4 Urban 5.07 2 10.13 $18,388,845 $1,815,286Pinellas 7 US 19 (SR 55) N. of CR 576/Sunset Pnt S. of Countryside Blvd 2012 Bid 4 to 6 Urban 1.76 2 3.52 $17,196,050 $4,885,241Miami-Dade 6 SR 823/NW 57th Ave W. 23rd St W. 46th St 2012 Bid 4 to 6 Urban 1.48 2 2.96 $13,942,533 $4,710,315Hernando 7 SR 50 (Cortez Blvd) US 19 (SR 55) W. of CR 587/Mariner Blvd 2012 Bid 4 to 6 Urban 6.02 2 12.04 $39,444,222 $3,276,098Orange 5 SR 50 E. of West Oaks Mall W. of Good Homes Rd 2012 Bid 4 to 6 Urban 0.45 2 0.90 $8,694,472 $9,660,524Clay 2 SR 23 Oakleaf Plantation Pkwy Old Jennings 2012 Bid 0 to 2 Urban 3.14 2 6.28 $13,231,111 $2,106,865Hendry 1 SR 80 Birchwood Pkwy Dalton Lane 2012 Bid 2 to 4 Urban 5.00 2 10.00 $12,855,092 $1,285,509Hendry 1 SR 80 CR 833 US 27 2012 Bid 2 to 4 Urban 2.90 2 5.80 $8,117,039 $1,399,489Lee 1 SR 739 Winkler Ave Hanson St 2012 Bid 0 to 6 Urban 1.34 6 8.04 $14,025,932 $1,744,519Seminole 5 SR 434 I-4 Rangeline Rd 2012 Bid 4 to 6 Urban 1.80 2 3.60 $10,111,333 $2,808,704Palm Beach 4 SR 710/Beeline Hwy W. of Congress Ave W. of Australian Ave 2012 Bid 2 to 4 Urban 0.84 2 1.68 $12,189,533 $7,255,674Polk 1 US 27 N. of Ritchie Rd S. of Barry Rd 2012 Bid 4 to 6 Urban 3.20 2 6.40 $14,242,918 $2,225,456Polk 1 US 98 (SR 35/SR 700) N. of CR 540A SR 540 2012 Bid 4 to 6 Urban 3.45 2 6.90 $17,707,436 $2,566,295Brevard 5 SR 5 (US 1) N. of Pine St N. of Cidco Rd 2012 Bid 4 to 6 Urban 3.84 2 7.68 $28,089,660 $3,657,508Broward 4 Andrews Ave Ext. NW 18th St Copans Rd 2013 Bid 2 to 4 Urban 0.50 2 1.00 $6,592,014 $6,592,014Lee 1 SR 78 (Pine Island) Burnt Store Rd W of Chiquita Blvd 2013 Bid 2 to 4 Urban 1.94 2 3.88 $8,005,048 $2,063,157Brevard 5 SR 507 (Babcock St) Melbourne Ave Fee Ave 2013 Bid 2 to 4 Urban 0.55 2 1.10 $5,167,891 $4,698,083Hillsborough 7 SR 41 (US 301) S. of Tampa Bypass Canal N. of Fowler Ave 2013 Bid 2 to 4 Sub-Urb 1.81 2 3.62 $15,758,965 $4,353,305Lee 1 US 41 Business Littleton Rd SR 739 2013 Bid 2 to 4 Urban 1.23 2 2.46 $8,488,393 $3,450,566
Construction CostConstruction Cost
per Lane MileStatus Feature Design Length
Lanes Added
Lane Miles Added
County District Description From To Year

Tindale Oliver Hillsborough County April 2016 B-17 Mobility Fee Study
Table B‐16 (continued) Construction Cost – State Road Improvements from Hillsborough County and Other Jurisdictions throughout Florida
Source: FDOT Bid Tabs
Table B‐17
Construction Engineering & Inspection Cost Factor ‐ Hillsborough County Local Roadway Improvements
Source: Hillsborough County Public Works Department
Brevard 5 Apollo Blvd Sarno Rd Eau Gallie Blvd 2013 Bid 2 to 4 Urban 0.74 2 1.48 $10,318,613 $6,972,036Orange 5 SR 50 (Colonial Dr) E. of CR 425 (Dean Rd) E. of Old Cheney Hwy 2013 Bid 4 to 6 Urban 4.91 2 9.82 $66,201,688 $6,741,516Okeechobee 1 SR 70 NE 34th Ave NE 80th Ave 2014 Bid 2 to 4 Urban 3.60 2 7.20 $23,707,065 $3,292,648Martin 4 CR 714/Indian St Turnpike/Martin Downs Blvd W. of Mapp Rd 2014 Bid 2 to 4 Urban 1.87 2 3.74 $14,935,957 $3,993,571Pinellas 7 43rd St Extension S. of 118th Ave 40th St 2014 Bid 0 to 4 Urban 0.49 4 1.96 $4,872,870 $2,486,158Broward 4 SR 7 (US 441) N. of Hallendale Beach N. of Fil lmore St 2014 Bid 4 to 6 Urban 1.79 2 3.58 $30,674,813 $8,568,384Nassau 2 SR 200 (A1A) W. of Stil l Quarters Rd W. of Ruben Ln 2014 Bid 4 to 6 Urban 3.05 2 6.10 $18,473,682 $3,028,472Broward 4 Andrews Ave Ext. Pompano Park Place S. of Atlantic Blvd 2014 Bid 2 to 4 Urban 0.36 2 0.72 $3,177,530 $4,413,236Miami-Dade 6 SR 823/NW 57th Ave W. 65th St W. 84th St 2014 Bid 4 to 6 Urban 1.00 2 2.00 $17,896,531 $8,948,266Miami-Dade 6 SR 823/NW 57th Ave W. 53rd St W. 65th St 2014 Bid 4 to 6 Urban 0.78 2 1.56 $14,837,466 $9,511,196Charlotte 1 US 41 (SR 45) Enterprise Dr Sarasota County Line 2014 Bid 4 to 6 Urban 3.62 2 7.24 $31,131,016 $4,299,864Duval 2 SR 243 (JIA N Access) Airport Rd Pelican Park (I-95) 2014 Bid 0 to 2 Urban 2.60 2 5.20 $14,205,429 $2,731,813Desoto 1 US 17 CR 760A (Nocatee) Heard St 2014 Bid 2 to 4 Urban 4.40 2 8.80 $29,584,798 $3,361,909Pinellas 7 SR 688 (Ulmerton Rd) E. of 49th St W. of 38th St N 2014 Bid 4 to 6 Urban 0.76 2 1.52 $19,306,771 $12,701,823Orange 5 SR 50 SR 429 (Western Beltway) E. of West Oaks Mall 2014 Bid 4 to 6 Urban 2.56 2 5.12 $34,275,001 $6,694,336Hendry 1 SR 82 (Immokalee Rd) Lee County Line Collier County Line 2015 Bid 2 to 4 Urban 1.27 2 2.54 $7,593,742 $2,989,662Sarasota 1 SR 45A (US 41) (Venice Bypass) Gulf Coast Blvd Bird Bay Dr W 2015 Bid 4 to 6 Urban 1.14 2 2.28 $16,584,224 $7,273,782Clay 2 SR 21 S. of Branan Field Old Jennings Rd 2015 Bid 4 to 6 Urban 1.45 2 2.90 $15,887,487 $5,478,444Putnam 2 SR 15 (US 17) Horse Landing Rd N Boundary Rd 2015 Bid 2 to 4 Urban 1.99 2 3.98 $13,869,804 $3,484,875Palm Beach 4 SR 710 (Beeline Hwy) W. of Australian Ave Old Dixie Hwy 2015 Bid 2 to 4 Urban 0.82 2 1.64 $17,423,228 $10,623,920Osceola 5 SR 500 (US 192/441) Eastern Ave Nova Rd 2015 Bid 4 to 6 Urban 3.18 2 6.36 $16,187,452 $2,545,197Orange 5 SR 15 (Hofner Rd) Lee Vista Blvd Conway Rd 2015 Bid 2 to 4 Urban 3.81 2 7.62 $37,089,690 $4,867,413Osceola 5 SR 500 (US 192/441) Aeronautical Blvd Budinger Ave 2015 Bid 4 to 6 Urban 3.94 2 7.88 $34,256,621 $4,347,287
Count: 3 18.20 $37,689,337 $2,070,843Count: 2 5.44 $22,906,475 $4,210,749Count: 70 343.52 $1,050,930,879 $3,059,300
Hillsborough (excluding CR 39)
Construction CostConstruction Cost
per Lane Mile
Total
Status Feature Design LengthLanes
AddedLane Miles
AddedCounty District Description From To Year
Hillsborough ONLY
Project ID Roadway From ToStartDate
Status Feature Section Design CEI CostConstruction
CostCEI‐to‐
Construction61043000 Bruce B. Downs Blvd, Segment D Pebble Creek Pasco Co. Line 10/31/2003 Active 4 to 8 Lanes Urban; Curb & Gutter $1,356,000 $14,931,747 9%61044000 Bruce B. Downs Blvd, Segment B/C Palm Springs Pebble Creek Dr 10/15/2003 Active 4 to 8 Lanes Urban; Curb & Gutter $4,746,261 $52,249,133 9%61045000 Bruce B. Downs Blvd, Segment A Bearss Ave Palm Springs 10/31/2003 Active 4 to 8 Lanes Urban; Curb & Gutter $3,645,578 $37,489,099 10%
$9,747,839 $104,669,979 9%Total

Tindale Oliver Hillsborough County April 2016 B-18 Mobility Fee Study
Table B‐18 CEI Cost Factor for County and State Roads – Recent Impact Fee Studies
Source: Recent impact fee studies conducted throughout Florida Note: Letter references (i.e., “a”) are used to assist with footnotes and sourcing
CEI Constr. CEI Ratio CEI Constr. CEI Ratio2006 Collier $294,054 $2,558,546 11% $354,442 $3,385,978 10%2006 Citrus $180,887 $2,584,099 7% $474,464 $2,860,227 17%2006 Highlands - - n/a - - n/a2006 Marion - - n/a - - n/a2007 Pasco $215,534 $3,079,051 7% $442,849 $3,050,799 15%2007 Lake $116,441 $2,911,021 4% $318,412 $3,184,125 10%2007 Flagler $174,000 $1,740,000 10% - - n/a2007 Volusia $238,660 $2,651,778 9% $309,526 $3,095,258 10%2008 Leon $372,400 $2,660,000 14% $270,640 $3,383,000 8%2008 Sumter $223,700 $2,237,000 10% $238,000 $2,380,000 10%2009 Collier $186,000 $3,100,000 6% $320,000 $3,200,000 10%2009 Polk $111,300 $1,590,000 7% $217,000 $2,170,000 10%2009 Hillsborough/Tampa $308,000 $2,800,000 11% $315,000 $3,500,000 9%2010 Collier $119,560 $1,708,000 7% $241,800 $2,418,000 10%2011 Sarasota/North Port $216,000 $2,400,000 9% $180,000 $2,000,000 9%2012 Osceola $265,140 $2,651,400 10% $313,258 $2,847,800 11%2012 Orange - $2,400,000 n/a - - n/a2012 City of Orlando - $2,400,000 n/a - $2,900,000 n/a2012 City of Sarasota $216,000 $2,400,000 9% $286,000 $2,600,000 11%2013 Hernando $178,200 $1,980,000 9% $222,640 $2,024,000 11%2013 Charlotte $220,000 $2,200,000 10% $240,000 $2,400,000 10%2014 Indian River $143,000 $1,598,000 9% $196,000 $1,776,000 11%2015 Collier $270,000 $2,700,000 10% $270,000 $2,700,000 10%2015 Brevard $344,000 $2,023,000 17% $316,000 $2,875,000 11%2015 Sumter $147,000 $2,100,000 7% $250,000 $2,505,000 10%2015 Marion $50,000 $1,668,000 3% $227,000 $2,060,000 11%2015 Palm Beach $108,000 $1,759,000 6% $333,000 $3,029,000 11%
$204,255 $2,308,648 9% $6,336,031 $59,444,187 11%(a) (b)
Average
Year CountyCounty Roadways (Cost per Lane Mile) State Roadways (Cost per Lane Mile)

Tindale Oliver Hillsborough County April 2016 B-19 Mobility Fee Study
Roadway Capacity
As shown in Table B-19, the average capacity per lane mile was based on the projects in the
Hillsborough County 2040 Long Range Transportation Cost Feasible Plan and the Community
Transportation Plan. This listing of projects reflects the mix of improvements that will yield
the vehicle-miles of capacity (VMC) that will be built in Hillsborough County. The resulting
weighted average capacity per lane mile of 9,500 was used in the mobility fee calculation.

Tindale Oliver Hillsborough County April 2016 B-20 Mobility Fee Study
Table B‐19 Hillsborough County 2040 Long Range Transportation Plan & Community Transportation Plan
Source: Imagine Hillsborough 2040 Long Range Transportation Cost Feasible Plan Hillsborough Community Transportation Plan Discussions with Public Works Staff
Jurisdiction Description From To Improvement LengthLanes Added
Lane Miles Added
Section Design
Initial Capacity
Future Capacity
Added Capacity
Vehicle Miles of Capacity
AddedState Roads
State Hillsborough Ave 50th St Orient Rd Lane Addition (4 to 6) 1.77 2 3.54 Urban 39,800 59,900 20,100 35,577State US 92 I-4 CR 579 (Mango Rd) Lane Addition (2 to 4) 2.95 2 5.90 Urban 17,700 39,800 22,100 65,195State US 92 Reynolds St County Line Rd Lane Addition (2 to 4) 3.57 2 7.14 Rural 17,700 39,800 22,100 78,897State SR 60 Valrico Rd SR 39 Lane Addition (4 to 6) 8.04 2 16.08 Urban 39,800 59,900 20,100 161,604State US 41 Madison Ave Causeway Blvd Lane Addition (4 to 6) 1.52 2 3.04 Urban 39,800 59,900 20,100 30,552State US 301 SR 60 Selmon Expressway Lane Addition (4 to 6) 1.31 2 2.62 Urban 39,800 59,900 20,100 26,331
County/City RoadsCity Reo St Gray St Cypress St Lane Addition (2 to 4) 0.30 2 0.60 Urban 14,060 30,780 16,720 5,016City Trask St Cypress St Boyscout Blvd New Road Construction (0 to 2) 0.52 2 1.04 Urban 0 14,060 14,060 7,311City Interbay Blvd Manhattan Ave Dale Mabry Hwy Lane Addition (2 to 4) 0.90 2 1.80 Urban 16,815 37,810 20,995 18,896
County Orient Rd Sligh Ave Columbus Dr Lane Addition (2 to 4) 3.00 2 6.00 Urban 16,815 37,810 20,995 62,985County Progress Blvd Magnolia Park Blvd Valleydale Dr Lane Addition (2 to 4) 0.55 2 1.10 Urban 16,815 37,810 20,995 11,547County Big Bend Rd US 41 I-75 Lane Addition (4 to 6) 1.70 2 3.40 Urban 37,810 56,905 19,095 32,462County Lithia Pinecrest Blvd Adelaide Ave Lumsden Dr Lane Addition (2 to 4) 4.00 2 8.00 Urban 16,815 37,810 20,995 83,980County Harney Rd Hillsborough Ave Temple Terrace Hwy Lane Addition (2 to 4) 2.19 2 4.38 Urban 16,815 37,810 20,995 45,979County Sligh Ave 56th St US 301 Lane Addition (2 to 4) 2.37 2 4.74 Urban 16,815 37,810 20,995 49,758County County Line Rd Livingston Ave Grand Hampton Lane Addition (2 to 4) 3.11 2 6.22 Rural 16,815 37,810 20,995 65,294County Anderson Rd Hillsborough Ave Hoover Blvd Lane Addition (2 to 4) 0.99 2 1.98 Urban 14,060 30,780 16,720 16,553County Anderson Rd Sligh Ave Linebaugh Ave Lane Addition (4 to 6) 2.13 2 4.26 Urban 32,110 48,355 16,245 34,602County Bearss Ave I-275 BB Downs Blvd Lane Addition (4 to 6) 2.08 2 4.16 Urban 37,810 56,905 19,095 39,718County Davis Rd Harney Rd Maislin Dr New Road Construction (0 to 2) 0.40 2 0.80 Urban 0 14,060 14,060 5,624County Falkenburg Rd MLK Jr. Blvd Hillsborough Ave Lane Addition (2 to 4) 0.98 2 1.96 Urban 16,815 37,810 20,995 20,575County Fletcher Ave 30th St Morris Bridge Rd Lane Addition (4 to 6) 4.07 2 8.14 Urban 34,471 51,890 17,419 70,895County Linebaugh Ave Sheldon Rd Veterans Exway Lane Addition (4 to 6) 1.53 2 3.06 Urban 37,810 56,905 19,095 29,215County New E/W Road (New Tampa) I-275 Commerce Park Blvd New Road Construction (0 to 4) 2.75 4 11.00 Urban 0 30,780 30,780 84,645
City New Tampa Blvd Commerce Park Blvd BB Downs Blvd Lane Addition (2 to 4) 2.35 2 4.70 Urban 15,930 35,820 19,890 46,742City Occident St Extension Cypress St Westshore Plaza New Road Construction (0 to 2) 0.22 2 0.44 Urban 0 13,320 13,320 2,930
County Sam Allen Rd Park Rd Wilder Rd Lane Addition (2 to 4) 0.43 2 0.86 Rural 16,815 37,810 20,995 9,028County Sam Allen Rd Extension Wilder Rd County Line Rd New Road Construction (0 to 4) 1.70 4 6.80 Rural 0 16,815 16,815 28,586
City Trask St Extension Cypress St Gray St New Road Construction (0 to 2) 0.25 2 0.50 Urban 0 13,320 13,320 3,330County Woodberry Rd Falkenburg Rd Grand Regency Blvd Lane Addition (2 to 4) 0.58 2 1.16 Urban 16,815 37,810 20,995 12,177County Citrus Park Dr Extension Country Way Blvd Sheldon Rd New Road Construction (0 to 4) 2.74 4 10.96 Urban 0 37,810 37,810 103,599
136.38 1,289,60398.06 72% (a) 891,44738.32 28% (b) 398,156
115.36 85% (c) 1,107,79821.02 15% (d) 181,80531.54 23% (e) 1,107,798
104.84 77% (f) 181,805VMC Added per Lane Mile: 9,500
New Road Construction:Lane Addition:
Total (All Roads):County Roads (includes City Rds):State Roads:Urban (Curb & Gutter) Section Design:Rural (Open Drainage) Section Design:

Tindale Oliver Hillsborough County April 2016 B-21 Mobility Fee Study
Transit Capital Costs
To convert the roadway impact fee into a mobility fee, the marginal cost of adding transit
infrastructure needs to be considered. This section details the difference in cost per person-
mile of capacity between expanding a roadway without transit amenities versus expanding a
roadway with transit amenities. This calculation also accounts for the change in roadway
PMC that occurs when a bus is on the road.
First, Table B-21 calculates the person-miles of capacity added for each new transit vehicle
on the road. This calculation adjusts for the fact that buses have a significantly higher person-
capacity than passenger vehicles. This table also identifies transit capital cost variables that
will be used to calculate the added capital cost of constructing/expanding a roadway with
transit facilities.
Next, Table B-20 combines the roadway VMC and the transit PMC to calculate the marginal
change in cost per PMC. First, the roadway characteristics, including cost and capacity, were
used to calculate the roadway cost per VMC for a generic 20-mile roadway segment. Then,
an adjustment factor was applied to recognize that incorporating transit along a segment of
roadway decreases the vehicle-capacity as the bus makes intermittent stops and interrupts
the free-flowing traffic. As shown in Table B-20, the bus blockage adjustment factor is much
higher for a 2-lane roadway than for a 4-lane roadway. On a 2-lane road, all cars get caught
behind the bus during a stop, while on a 4-lane roadway, there is an unobstructed travel lane
that cars can use to pass-by or maneuver around the slower transit vehicle. This adjusted
VMC was then converted to PMC using the vehicle-miles to person-miles adjustment factor
previously discussed in this report. The additional person-capacity from the buses was added
to the adjusted roadway PMC. The person-miles of capacity that a transit system would add
to the stretch of roadway (Table B-21) mitigates the decrease in vehicle-miles of capacity due
to the bus blockage adjustments.
Next, the capital cost of transit infrastructure was added to the capital cost of the roadway
expansion for both new road construction (0 to 2 lanes) and lane addition (2 to 4 lanes). With
the transit infrastructure included, the updated cost per PMC was calculated, which now
reflects the total cost of building a new road with transit, or expanding a roadway and adding
transit amenities. When compared to the cost per PMC for simply building/expanding a
roadway without transit, the added cost of transit is between two (2) percent and five (5)
percent.

Tindale Oliver Hillsborough County April 2016 B-22 Mobility Fee Study
As a final step, the increased costs were then weighted by the lane mile distribution of new
road construction and lane addition improvements in the Hillsborough County 2040 Long
Range Transportation Cost Feasible Plan and the Community Transportation Plan. As shown,
the plan calls for a higher number of lane addition improvements through 2040. When the
marginal cost of transit is included and weighted by this ratio, the resulting percent change is
approximately 3.15 percent. Essentially, adding transit does not have a significant effect on
the cost per person-mile of capacity for new road construction and lane addition
improvements.
As it is currently structured, the transit model detailed in Tables B-20 and B-21 assumes that
transit-miles and road-miles will be added to the system at the same rate. If the County builds
more transit-miles, this would increase the bus traffic on existing roads, adding more stops,
higher stop frequency, and creating additional bus blockage. As a result, the capital cost per
person-mile for a roadway with transit would increase in relation to the ratio of added transit-
miles vs. roadway-miles. For example, if the transit-mile investment was double that of
roadway construction/expansion, the 3.15 percent change calculated in Table B-20 would
increase to approximately 6.30 percent. The annual construction figures for transit-miles and
road-miles should be tracked by the County and adjusted for in subsequent mobility fee
update studies.

Tindale Oliver Hillsborough County April 2016 B-23 Mobility Fee Study
Table B‐20 Mobility Fee: Transit Component Model
Roadway Transit Roadway Transit
Source:
Roadway Cost per Mile(1) $9,924,000 $9,924,000 1) Source: Table 3, adjusted to cost "per mile"
Roadway Segment Length (miles)(2) 20.00 20.00 2) Source: Average length of HART route
Roadway Segment Cost(3) $198,480,000 PMC $198,480,000 PMC 3) Roadway cost per mile (Item 1) multipl ied by the roadway segment length (Item 2)
Average Capacity Added (per mile)(4) 19,000 24,700 19,000 24,700 4) Source: Table 4, adjusted to capacity "per mile"
VMC/PMC Added (entire segment)(5) 380,000 494,000 380,000 494,000 5) Roadway segment length (Item 2) multipl ied by the average capacity added (Item 4) for both VMC and PMC
Roadway Cost per VMC/PMC(6) $522.32 $401.78 $522.32 $401.78 6) Roadway segment cost (Item 3) divided by the VMC/PMC added (Item 5) individually
Adjustment for Bus Blockage(7) 3.2% - 1.6% - 7) Source: 2010 Highway Capacity Manual, Equation 18-9
VMC/PMC Added (transit deduction)(8) 12,160 15,808 6,080 7,904 8) VMC added (Item 5) multipl ied by the adjustment for bus blockage (Item 7). For PMC, multiply the VMC by 1.30 persons per vehicle
VMC/PMC Added (less transit deduction)(9) 367,840 478,192 373,920 486,096 9) VMC/PMC added (entire segment) (Item 5) less the VMC/PMC added (transit deduction) (Item 8) for VMC and PMC individually
PMC Added (transit addition ONLY)(10) 8,064 8,064 10) Source: Table B-10, Adjusted Person-Miles of Capacity (Item 12)
Net PMC Added (transit effect included)(11) 486,256 494,160 11) PMC added (less transit deduction) (Item 9) plus the PMC added (transit addition ONLY) (Item 10)
Road/Transit Cost per PMC (Road Capital)(12) $408.18 $401.65 12) Road segment cost (Item 3) divided by the net PMC added (transit effect included) (Item 11)
Buses Needed(13) 5 $3,125,000 5 $3,125,000 13) Number of vehicles (see Table B-10, Item 2) multipl ied by the vehicle cost (see Table B-10, Item 15)
Stops per mile (both sides of street)(14) 3 $1,440,000 3 $1,440,000 14) Stops per mile (3) multiplied by the roadway segment length (Item 2) multiplied by the cost per stop (Table B-10, Item 16)
Shelters per mile (both sides of street)(15) 1 $1,000,000 1 $1,000,000 15) Shelters per mile (1) multipl ied by the roadway segment length (Item 2) multiplied by the cost per shelter (Table B-10, Item 17)
Total infrastructure(16) $5,565,000 $5,565,000 16) Sum of buses needed (Item 13), stops needed (Item 14), and shelters needed (Item 15)
Road/Transit Cost per PMC(17) $419.62 $412.91 17) Sum of the roadway segment cost (Item 3) and the total transit infrastructure cost (Item 16) divided by the net PMC added (Item 11)
Percent Change(18) 4.44% 2.77% 18) Percent difference between the road/transit cost per PMC (Item 17) and the Roadway cost per PMC (Item 6)
Lane Mile Distribution(19) 23% 77% 19) Source: Appendix B, Table B-19, Items (e) and (f). Lane mile distribution of new road construction versus lane addition
Weighted Roadway Cost per PMC(20) $92.41 $309.37 20) Roadway cost per PMC (Item 6) multiplied by the lane mile distribution (Item 19)
Weighted Road/Transit Cost per PMC(21) $96.51 $317.94 21) Road/Transit cost per PMC (Item 17) multiplied by the lane mile distribution (Item 19)
$401.78 22) Sum of the weighted roadway cost per PMC (Item 20) for new road construction and lane additions
$414.45 23) Sum of the weighted road/transit cost per PMC (Item 21) for new road construction and lane additions
3.15% 24) Percent difference between the weighted average road/transit cost per PMC (Item 23) and the weighted average roadway cost per PMC (Item 22)
ItemNew Road Construction Lane Addtions
Roadway Characteristics:
Transit Capacity:
Transit Infrastructure:
Multi-Modal Cost per PMC:
Weighted Average Road/Transit Cost per PMC (new road construction and lane additions)(23)
Percent Change(24)
Weighted Multi-Modal Cost per PMC:
Weighted Average Multi-Modal Cost per PMC:
Weighted Average Roadway Cost per PMC (new road construction and lane additions)(22)

Tindale Oliver Hillsborough County April 2016 B-24 Mobility Fee Study
Table B‐21 Mobility Cost per Person‐Mile of Capacity
Input Local Transit
Source:
Vehicle Capacity(1) 42 1) Source: Local transit is assumed to have 30 seats with a 40 percent standing room capacity equivalent
Number of Vehicles (20% fleet margin)(2) 5 2) Cycle time (Item 9) divided by headway time (Item 6) increased by 20 percent to accommodate the required fleet margin
Service Span (hours)(3) 16 3) Source: Assumption based on current HART routes
Cycles/Hour (aka Peak Vehicles)(4) 2.00 4) Headway time (Item 6) divided by 60
Cycles per Day(5) 32 5) Service span (Item 3) multiplied by the cycles/hour (Item 4)
Headway Time (minutes)(6) 30 6) Source: Assumption based on current HART routes
Speed (mph)(7) 12 7) Source: Integrated National Transit Database Analysis System (INTDAS). 6-yr average
Round Trip Length (miles)(8) 20.00 8) Source: Average trip length of current HART routes
Cycle Time (minutes)(9) 100 9) Round trip length (Item 8) divided by speed (Item 7) multiplied by 60
Total Person-Miles of Capacity(10) 26,880 10) Vehicle capacity (Item 1) multiplied by the cycles per day (Item 5) multiplied by the round trip length (Item 8)
Load Factor/System Capacity(11) 30% 11) Source: Optimistic assumption based on future goals
Adjusted Person-Miles of Capacity(12) 8,064 12) Total person-miles of capacity (Item 10) multiplied by the load factor (Item 11)
Stops per Mile (w/o Shelter)(13) 3 13) Source: Model assumes 3 bench stops per mile
Shelters per Mile(14) 1 14) Source: Model assumes 1 shelter stop per mile
Vehicle Cost(15) $625,000 15) Source: Assumption based on local characteristics and industry knowledge
Simple Bus Stop(16) $12,000 16) Source: Assumption based on local characteristics and industry knowledge
Sheltered Bus Stop(17) $25,000 17) Source: Assumption based on local characteristics and industry knowledge
Transit Person‐Miles of Capacity Calculation
Capital Cost Variables

Appendix C Credit Component Calculations

Tindale Oliver Hillsborough County April 2016 C-1 Mobility Fee Study
Credit Component
This appendix presents the detailed calculations for the credit component. Currently, in
addition to the capital support that ultimately results from State fuel tax revenue,
Hillsborough County also receives financial benefit from several other funding sources. Of
these, the fuel taxes collected in Hillsborough County are listed below, along with a few
pertinent characteristics of each.
1. Constitutional Fuel Tax (2¢/gallon)
Tax applies to every net gallon of motor and diesel fuel sold within a county. Collected
in accordance with Article XII, Section 9 (c) of the Florida Constitution.
The State allocated 80 percent of this tax to Counties after withholding amounts
pledged for debt service on bonds issued pursuant to provisions of the State
Constitution for road and bridge purposes.
The 20 percent surplus can be used to support the road construction program within
the county.
Counties are not required to share the proceeds of this tax with their municipalities.
2. County Fuel Tax (1¢/gallon)
Tax applies to every net gallon of motor and diesel fuel sold within a county.
Primary purpose of these funds is to help reduce a County’s reliance on ad valorem
taxes.
Proceeds are to be used for transportation-related expenses, including the reduction
of bond indebtedness incurred for transportation purposes. Authorized uses include
acquisition of rights-of-way; the construction, reconstruction, operation,
maintenance, and repair of transportation facilities, roads, bridges, bicycle paths, and
pedestrian pathways; or the reduction of bond indebtedness incurred for
transportation purposes.
Counties are not required to share the proceeds of this tax with their municipalities.
3. Municipal Fuel Tax (1¢/gallon)
Tax applies to every net gallon of motor fuel sold within a county.
Primary purpose of the municipal revenue sharing program is to ensure a minimum
level of parity across units of local government.
Proceeds may be used to fund purchase of transportation facilities and road and
street rights-of-way; construction, reconstruction, and maintenance of roads, streets,

Tindale Oliver Hillsborough County April 2016 C-2 Mobility Fee Study
bicycle paths, and pedestrian pathways; adjustments of city-owned utilities as
required by road and street construction; and construction, reconstruction,
transportation-related public safety activities, maintenance, and operation of
transportation facilities.
4. Ninth‐Cent Fuel Tax (1¢/gallon)
Tax applies to every net gallon of motor and diesel fuel sold within a county.
Proceeds may be used to fund transportation expenditures.
To accommodate statewide equalization, this tax is automatically levied on diesel fuel
in every county, regardless of whether a County is levying the tax on motor fuel at all.
Counties are not required to share the proceeds of this tax with their municipalities.
5. 1st Local Option Tax (6¢/gallon)
Tax applies to every net gallon of motor and diesel fuel sold within a county.
Proceeds may be used to fund transportation expenditures.
To accommodate statewide equalization, all six cents are automatically levied on
diesel fuel in every county, regardless of whether a County is levying the tax on motor
fuel at all or at the maximum rate.
Proceeds are distributed to a county and its municipalities according to a mutually
agreed upon distribution ratio, or by using a formula contained in the Florida Statutes.
Each year, the Florida Legislature’s Office of Economic and Demographic Research produces
the Local Government Financial Information Handbook, which details the estimated local
government revenues for the upcoming fiscal year. Included in this document are the
estimated distributions of the various fuel tax revenues for each county in the state. The
2015-16 data represent projected fuel tax distributions to Hillsborough County for the current
fiscal year. In the table, the fuel tax revenue data are used to calculate the value per penny
(per gallon of fuel) that should be used to estimate the “equivalent pennies” of other revenue
sources. Table C-1 shows the distribution per penny for each of the fuel levies, and then the
calculation of the weighted average for the value of a penny of fuel tax. The weighting
procedure takes into account the differing amount of revenues generated for the various
types of gas tax revenues. The weighted average figure of approximately $5.94 million
estimates the annual revenue that one penny of gas tax generates in Hillsborough County.

Tindale Oliver Hillsborough County April 2016 C-3 Mobility Fee Study
Table C‐1 Estimated Fuel Tax Distributions Allocated to Capital Program of
Hillsborough County & Municipalities, FY 2015‐16(1)
1) Source: Florida Legislature’s Office of Economic and Demographic Research; Local
Government Financial Information Handbook 2) The weighted average distribution per penny is calculated by taking the sum of the total
distribution and dividing that value by the sum of the total levies per gallon (multiplied by 100).
Capital Improvement Credit
A revenue credit for the annual expenditures on transportation capacity expansion projects
in Hillsborough County is presented below. The components of the credit are as follows:
City gas tax equivalent pennies
City debt service
City sales tax (potential 0.5% referendum)
County gas tax equivalent pennies
County debt service
County sales tax (potential 0.5% referendum)
State gas tax expenditures
The annual expenditures from each revenue source are converted to gas tax pennies to be
able to create a connection between travel by each land use and tax revenue contributions.
City Gas Tax Equivalent Pennies
A review of the City of Tampa’s 5-year planned expenditures shows that transportation
projects are primarily being funded by a combination of impact fees, gas taxes, and grants.
As shown in Table C-2, a total gas tax equivalent revenue credit of 0.6 pennies was given for
transportation capacity-expansion projects funded with non-impact fee revenues. A review
TaxAmount of Levy
per GallonTotal
DistributionDistribution per Penny
Constitutional Fuel Tax $0.02 $11,429,659 $5,714,830
County Fuel Tax $0.01 $5,070,188 $5,070,188
Municipal Fuel Tax $0.01 $3,491,962 $3,491,962
9th Cent Fuel Tax $0.01 $6,806,685 $6,806,685
1st Local Option (1-6 cents) $0.06 $38,550,428 $6,425,071
Total $0.11 $65,348,922
Weighted Average per Penny(2) $5,940,811

Tindale Oliver Hillsborough County April 2016 C-4 Mobility Fee Study
of CIP documents for Temple Terrace and Plant City was also conducted, but neither City has
any planned transportation capacity expansion in the next five years.
Table C‐2 City of Tampa Fuel Tax Equivalent Pennies
1) Source: Table C-9 2) Source: Table C-1 3) Cost of projects divided by number of years divided by revenue from 1 penny (Item 3) multiplied by 0.01
In addition, the City of Tampa receives an equivalent credit of 0.1 pennies for debt service
associated with the Sales Tax Revenue Refunding Bond, Series 2010. This credit is given for
only the portion used for transportation capacity-expansion improvements.
Table C‐3 City of Tampa Debt Service Equivalent Pennies
1) Source: Table C-10 2) Source: Table C-1 3) Cost of projects divided by number of years divided by revenue from 1 penny (Item 4) multiplied by 0.01
Hillsborough County is currently considering the possibility of adopting an additional 0.5
percent of local infrastructure sales surtax. If the referendum for this sales tax passes, a
portion of the new revenues would be dedicated to transportation capacity. Therefore, an
additional credit option was developed to reflect this potential new revenue source. Table
C-4 details the additional equivalent pennies for the Cities of Tampa, Temple Terrace, and
Plant City that should be included in the mobility fee credit should the sales tax referendum
pass in Hillsborough County.
SourceCost of
ProjectsNumber of Years
Revenue from 1
Penny(2)
Equivalent
Pennies(3)
Projected City Expenditures (FY 2016-2020)(1) $16,585,621 5 $5,940,811 $0.006
Total $16,585,621 5 $5,940,811 $0.006
SourceCost of
ProjectsNumber of Years
Revenue from 1
Penny(2)
Equivalent
Pennies(3)
Sales Tax Refunding Bond; Series 2010(1) $4,034,429 5 $5,940,811 $0.001
Total $0.001
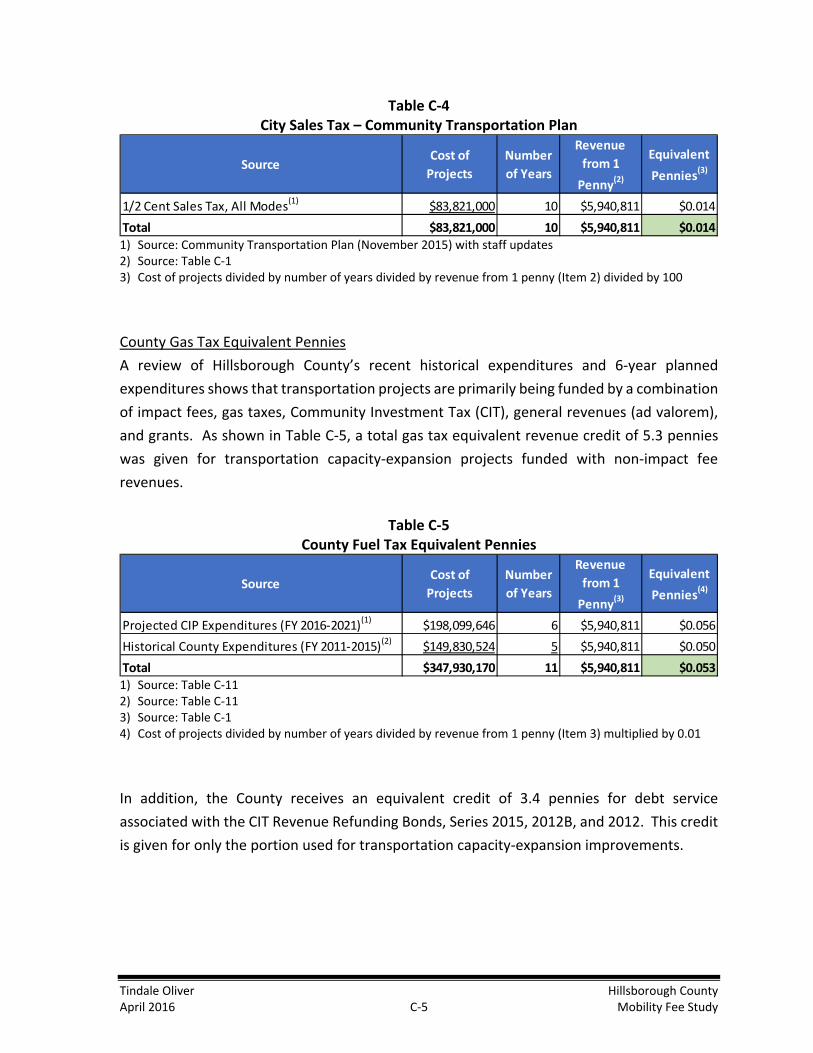
Tindale Oliver Hillsborough County April 2016 C-5 Mobility Fee Study
Table C‐4 City Sales Tax – Community Transportation Plan
1) Source: Community Transportation Plan (November 2015) with staff updates 2) Source: Table C-1 3) Cost of projects divided by number of years divided by revenue from 1 penny (Item 2) divided by 100
County Gas Tax Equivalent Pennies
A review of Hillsborough County’s recent historical expenditures and 6-year planned
expenditures shows that transportation projects are primarily being funded by a combination
of impact fees, gas taxes, Community Investment Tax (CIT), general revenues (ad valorem),
and grants. As shown in Table C-5, a total gas tax equivalent revenue credit of 5.3 pennies
was given for transportation capacity-expansion projects funded with non-impact fee
revenues.
Table C‐5
County Fuel Tax Equivalent Pennies
1) Source: Table C-11 2) Source: Table C-11 3) Source: Table C-1 4) Cost of projects divided by number of years divided by revenue from 1 penny (Item 3) multiplied by 0.01
In addition, the County receives an equivalent credit of 3.4 pennies for debt service
associated with the CIT Revenue Refunding Bonds, Series 2015, 2012B, and 2012. This credit
is given for only the portion used for transportation capacity-expansion improvements.
SourceCost of
ProjectsNumber of Years
Revenue from 1
Penny(2)
Equivalent
Pennies(3)
1/2 Cent Sales Tax, All Modes(1) $83,821,000 10 $5,940,811 $0.014
Total $83,821,000 10 $5,940,811 $0.014
SourceCost of
ProjectsNumber of Years
Revenue from 1
Penny(3)
Equivalent
Pennies(4)
Projected CIP Expenditures (FY 2016-2021)(1) $198,099,646 6 $5,940,811 $0.056
Historical County Expenditures (FY 2011-2015)(2) $149,830,524 5 $5,940,811 $0.050
Total $347,930,170 11 $5,940,811 $0.053

Tindale Oliver Hillsborough County April 2016 C-6 Mobility Fee Study
Table C‐6 County Debt Service Equivalent Pennies
1) Source: Table C-12 2) Source: Table C-13 3) Source: Table C-14 4) Source: Table C-1 5) Cost of projects divided by number of years divided by revenue from 1 penny (Item 4) multiplied by 0.01
As previously mentioned, Hillsborough County is currently considering the possibility of
adopting an additional 0.5 percent of local infrastructure sales surtax. Table C-7 details the
additional equivalent pennies for County expansion that should be included in the mobility
fee credit should the sales tax referendum pass in Hillsborough County.
Table C‐7
County Sales Tax – Community Transportation Plan
1) Source: Community Transportation Plan (November 2015) with staff updates 2) Source: Table C-1 3) Cost of projects divided by number of years divided by revenue from 1 penny (Item 2) divided by 100
State Gas Tax Expenditures
In the calculation of the equivalent pennies of gas tax from the State, expenditures on
transportation capacity expansion spanning a 15-year period (from FY 2006 to FY 2020) were
reviewed. This period represents past FDOT Work Program expenditures from FY 2006-2015
and also includes the projected FDOT Work Program expenditures from 2016 to 2020. From
these, a list of improvements was developed, including lane additions, new road construction,
intersection improvements, interchanges, traffic signal projects, bike paths, sidewalks, capital
for fixed-route service, and other capacity-addition projects. The use of a 15-year period, for
SourceCost of
ProjectsNumber of Years
Revenue from 1
Penny(4)
Equivalent
Pennies(5)
CIT Revenue Refunding Bond; Series 2015(1) $102,657,682 10 $5,940,811 $0.017
CIT Revenue Refunding Bond; Series 2012B(2) $35,989,230 10 $5,940,811 $0.006
CIP Revenue Refunding Bond; Series 2012(3) $69,349,403 11 $5,940,811 $0.011
Total $0.034
SourceCost of
ProjectsNumber of Years
Revenue from 1
Penny(2)
Equivalent
Pennies(3)
1/2 Cent Sales Tax, All Modes(1) $949,890,000 10 $5,940,811 $0.160
Total $949,890,000 10 $5,940,811 $0.160

Tindale Oliver Hillsborough County April 2016 C-7 Mobility Fee Study
purposes of developing a State credit for mobility capacity expansion projects, results in a
stable credit, as it accounts for the volatility in FDOT spending in the county over short periods
of time.
The total cost of the capacity-adding projects for the “historical” periods and the “future”
period:
FY 2006-2010 work plan equates to 12.0 pennies
FY 2011-2015 work plan equates to 10.1 pennies
FY 2016-2020 work plan equates to 13.6 pennies
The combined weighted average over the 15-year period of state expenditure for capacity-
adding mobility projects results in a total of 11.9 equivalent pennies. Table C-8 documents
this calculation. The specific projects that were used in the equivalent penny calculations are
summarized in Table C-16.
Table C‐8
State Fuel Tax Equivalent Pennies
1) Source: Table C-16 2) Source: Table C-16 3) Source: Table C-16 4) Source: Table C-1 5) Cost of projects divided by number of years divided by revenue from 1 penny (Item 4) multiplied by 0.01
SourceCost of
ProjectsNumber of Years
Revenue from 1
Penny(4)
Equivalent
Pennies(5)
Projected Work Program (FY 2016-2020)(1) $403,971,497 5 $5,940,811 $0.136
Historical Work Program (FY 2011-2015)(2) $301,088,049 5 $5,940,811 $0.101
Historical Work Program (FY 2006-2010)(3) $357,039,868 5 $5,940,811 $0.120
Total $1,062,099,414 15 $5,940,811 $0.119

Tindale Oliver Hillsborough County April 2016 C-8 Mobility Fee Study
Table C‐9 City of Tampa – Capital Improvements Program
Source: City of Tampa FY 2016 Recommended Operating and Capital Budget
Project Number Improvement Project Title FY 2016 FY 2017 FY 2018 FY 2019 FY 2020 TotalPR_1000577 Add Bike Lane Bayshore Blvd Enhancements, Ph. III $0 $2,899,200 $0 $0 $0 $2,899,200PR_1000767 Road Extension Cherry Street Extension $0 $185,000 $0 $0 $0 $185,000PR_1000261 Complete Streets Bougainvillea Shared Use Path $472,410 $0 $0 $0 $0 $472,410PR_1000260 Complete Streets Willow Ave $462,605 $0 $0 $0 $0 $462,605PR_0000075 Complete Streets Complete Street Safety Improvement $500,000 $300,000 $305,000 $300,000 $310,000 $1,715,000PR_1000250 ITS Maintenance Intelligent Transporation System - Citywide $125,000 $121,000 $120,000 $120,000 $120,000 $606,000PR_0000080 ITS Program Intelligent Transporation System - Citywide $100,000 $100,000 $100,000 $100,000 $100,000 $500,000PR_0000081 Intersection Improvement Intersections - Citywide $200,000 $300,000 $300,000 $300,000 $350,000 $1,450,000PR_0000289 Widen 2 to 4 Lanes N O'Brien St from W Cypress St to W Spruce St $1,106,591 $0 $0 $0 $0 $1,106,591PR_0000077 Sidewalks Sidewalks - Citywide $500,000 $450,000 $460,000 $460,000 $500,000 $2,370,000PR_0000085 Street Lights New Street Lighting $0 $0 $100,000 $100,000 $100,000 $300,000PR_0000086 Traffic Signals New/Upgraded Signals $1,157,000 $500,000 $500,000 $500,000 $500,000 $3,157,000PR_0000088 Intersection Improvement Westshore Blvd @ Gandy Blvd $0 $0 $0 $1,361,815 $0 $1,361,815
$4,623,606 $4,855,200 $1,885,000 $3,241,815 $1,980,000 $16,585,621 TOTAL

Tindale Oliver Hillsborough County April 2016 C-9 Mobility Fee Study
Table C‐10 City of Tampa County; Sales Tax Refunding Revenue Bonds; Series 2010
Source: City of Tampa
Month‐Year
Prior Bond Debt Service
Series 2010Principal
Series 2010Coupon
Series 2010Interest
Series 2010Debt Service
Total Debt Service
2011 $3,140,556 $1,794,574 $1,794,574 $4,935,1302012 $1,279,606 $1,855,000 4.71% $1,819,850 $3,674,850 $4,954,4562013 $1,276,206 $1,930,000 4.74% $1,745,650 $3,675,650 $4,951,8562014 $1,276,806 $2,005,000 4.78% $1,668,450 $3,673,450 $4,950,2562015 $1,276,206 $2,105,000 4.77% $1,568,200 $3,673,200 $4,949,4062016 $1,279,406 $2,210,000 4.75% $1,462,950 $3,672,950 $4,952,3562017 $1,276,206 $2,325,000 4.73% $1,352,450 $3,677,450 $4,953,6562018 $1,276,806 $2,435,000 4.71% $1,236,200 $3,671,200 $4,948,0062019 $1,276,006 $2,535,000 4.78% $1,138,800 $3,673,800 $4,949,8062020 $1,278,806 $2,635,000 4.88% $1,037,400 $3,672,400 $4,951,2062021 $1,275,006 $2,740,000 5.00% $932,000 $3,672,000 $4,947,0062022 $1,274,806 $2,880,000 5.00% $795,000 $3,675,000 $4,949,8062023 $1,278,006 $3,025,000 5.00% $651,000 $3,676,000 $4,954,0062024 $1,274,406 $3,170,000 5.00% $499,750 $3,669,750 $4,944,1562025 $1,279,206 $3,330,000 5.00% $341,250 $3,671,250 $4,950,4562026 $1,275,531 $3,495,000 5.00% $174,750 $3,669,750 $4,945,281
Totals $22,293,571 $38,675,000 4.86% $18,218,274 $56,893,274 $79,186,845$54,445,741
7.41%$4,034,429
Payments Remaining (2016‐2026)Percentage Dedicated to Roadway Capacity Expansion ProjectsPortion for Transportation Capacity

Tindale Oliver Hillsborough County April 2016 C-10 Mobility Fee Study
Table C‐11 Hillsborough County ‐ Local Improvements (Historical & Future)
Project Number Project Title FY 2011 FY 2012 FY 2013 FY 2014 FY 2015 FY 2016‐2021 TotalC61035000 Paved Shoulders/Bicycle Lanes County Rural Roads $510,649 $132,072 $193,330 $0 $1,151,345 $2,908,745 $4,896,141C61036000 131st St Improvements $0 $0 $0 $110,686 $75,421 $0 $186,107C61037000 Bearss Ave at BBD Improvements $0 $0 $0 $0 $3,966 $650,000 $653,966C61038000 Skipper Rd/46th St BBD to Fletcher $0 $0 $0 $33,792 $162,992 $1,759,663 $1,956,447C61043000 Bruce B. Downs (Pebble Creek To Pasco County) Road Widening -$41,625 $808 $0 $193,304 $669,622 $15,348,246 $16,170,355C61044000 Bruce B. Downs (Palm Springs To Pebble Creek Drive South) Road Widening $14,943,238 $14,241,588 $4,857,664 $228,439 $0 $13,230,594 $47,501,523C61045000 Bruce B. Downs (Bearss Avenue To Palm Springs) Road Widening $580,710 $306,441 $832,573 $9,578,171 $5,520,993 $59,840,742 $76,659,630C61051000 US 301 Widening (Gibsonton Road To SR 674) $140,529 $126,018 $174,615 $159,216 $10,035 $3,560,233 $4,170,646C61052000 Lutz Lake Fern Rd (Suncoast Exp to Dale Mabry) $4,733,177 $374,378 $638 $94 $0 $0 $5,108,287C61054000 Hillsborough Ave Improvements - Town 'N Country Community Plan $642 $0 $0 $0 $0 $0 $642C61057000 Columbus Drive Extension $351 $0 $0 $0 $0 $0 $351C61058000 Cross Creek Blvd Rd Widening Phase II E. Cory Lake Blvd to Morris Bridge Rd $0 $0 $1,499,972 $0 $0 $0 $1,499,972C61060000 Orient Rd Widening - Hil lsborough Ave to Broadway Ave $0 $0 $0 $73,343 $112,418 $85,911 $271,672C61134000 Citrus Park Drive Extension (Countryway Blvd to Sheldon Rd) $32,508 -$20 $0 $169 $0 $1,154,104 $1,186,761C61149000 Big Bend Rd Widening (Covington Garden to Simmons Loop) - PD&E $1,389 $190,681 $96,736 $120,940 $0 $16,219 $425,965C61150000 Madison Ave Improvments - US 41 to 66th St $0 $131,781 $284,453 $329,207 $42,493 $1,272,947 $2,060,881C61151000 Old US 41 Roadway Improvements @ Archie Creek $0 $24,143 $365,110 $0 $0 $0 $389,253C63000000 Critical Accident Mitigation Intersection Improvements $0 $0 $0 $0 $0 $4,425,294 $4,425,294C63002000 Countywide School Traffic Signal Signs & Markings Program $69,670 $4,427 $0 $193,640 $0 $0 $267,737C63003000 Countywide School Traffic Safety Devices Program $152,940 $111,156 $0 $0 $41,575 $0 $305,671C63073000 New Traffic Signals $317,463 $149,877 $101,510 $625,344 $833,209 $901,568 $2,928,971C63077000 Lithia Pinecrest/Lumsden/Bell Shoals/Durant Intersection Improvements $0 $0 $0 $0 $0 $5,604,983 $5,604,983C63090000 Intersection and Pedestrian Safety Program $753,679 $232,900 $354,761 $4,356,626 $435,564 $398,020 $6,531,550C63142000 Riverview High School Driveway/Black Forest/Balm Intersection $5,730 $0 $0 $0 $0 $0 $5,730C63320000 Bloomingdale Ave and US 301 Intersection $35,558 $0 $0 $0 $0 $0 $35,558C63487000 Falkenburd Rd @ Leroy Ave Intersection Improvement $0 $0 $0 $0 $385,409 $359,405 $744,814C63520000 Orient Rd/Sligh Ave Traffic Signal $18,108 $67,696 $17,321 $40,736 $0 $547,728 $691,589C63947000 Bruce B. Downs Blvd & Pine Dr/University Square Dr Intersection Improvement $107,731 $0 $0 $62,500 $0 $0 $170,231C64037000 CDBG Funded Sidewalks $0 $0 $21,761 $79,845 $0 $0 $101,606C65002000 Waters Ave Area/Tropical Sports International Traffic Control Project $1,567 $0 $0 $0 $0 $0 $1,567C65004000 Waters Ave & Anderson Rd Adv Traveler Information Traffic Control Project -$20,586 $0 $0 $0 $0 $0 ‐$20,586C69104000 Boyette Rd (US 301 to Bell Shoals) Road Widening $324,760 $108,546 $8,717 $39,292 $2,450 $233,704 $717,469C69110000 Race Track Rd (Hil lsborough - South Mobley) $169,291 $24,488 $3,850 $0 $0 $0 $197,629C69112000 Bell Shoals Rd Widening (Bloomingdale to Boyette) $137 $0 $708 $123,260 $2,340,861 $37,156,175 $39,621,141C69117000 Town N Country Community Plan - Paula and Ambassador Roads $0 $100,000 $0 $0 $0 $0 $100,000C69118000 Race Track Rd Widening Construction Phase I (Douglas to Linebaugh) $197,644 $0 $0 $500,000 $0 $0 $697,644C69120000 Race Track Rd Widening Construction Phase III (Linebaugh to Countryway) $11,784 $0 $0 $0 $0 $0 $11,784C69121000 Race Track Rd Widening Construction Phase IV (Hil lsborough to Douglas) $1,827,768 $183,280 $171,500 $0 $0 $453,995 $2,636,543C69123000 Boyette Rd Widening Construction Phase II (Balm Riverview to Donneymoor) $0 $103 $0 $0 $0 $0 $103C69124000 Boyette Rd Widening Construction Phase III (Donneymoor to Bell Shoals) $1,631,915 $3,570,686 $7,568,981 $6,673,660 $634,905 $432,281 $20,512,428C69125000 Lithia Pinecrest Road Widening (SR 60 To CR 39) -$201,326 -$685,000 $0 $0 $0 $0 ‐$886,326C69127000 Gornto Lake Rd Extension (Brandon Town Center to SR 60) $4,616,021 $176,495 $800,329 $280,567 $3,479 $0 $5,876,891C69345000 131St Ave/Holly Rd/Bruce B. Downs Blvd Intersection Improvements $158,331 $0 $0 $62,500 $0 $0 $220,831C69351000 Hanley Rd and Waters Ave Intersection Improvements $185,750 -$994 $0 $0 $0 $0 $184,756C69359000 Himes & Lambright with Himes & Minnehaha Intersection Improvement $83,853 $0 $0 $0 $0 $0 $83,853C69360000 Gunn Highway and Linebaugh Ave Intersection Improvements $104,209 $110,512 $2,740 $16,227 $217,263 $2,169,814 $2,620,765C69361000 John Moore Rd/Parsons Ave & Lumsden Rd Intersection Improvements $55,586 $86 $0 $0 $0 $0 $55,672

Tindale Oliver Hillsborough County April 2016 C-11 Mobility Fee Study
Table C‐11 (Continued) Hillsborough County ‐ Local Improvements (Historical & Future)
Source: Hillsborough County Department of Management and Budget and the Public Works Department
Project Number Project Title FY 2011 FY 2012 FY 2013 FY 2014 FY 2015 FY 2016‐2021 TotalC69362000 Habana Ave & Waters Ave Intersection Improvements $80,899 $692,006 $27,017 $0 $0 $0 $799,922C69363000 Boy Scout/Race Track Int Impr $448,623 $0 $0 $0 $0 $0 $448,623C69600000 Intersection Improvement Program $232,998 $13,787 $221,831 $682,635 $666,012 $24,381,769 $26,199,032C69601000 New & Improved Signalization Program $1,040,929 $189,814 $164,915 $830,811 $584,466 $10,510,110 $13,321,045C69602000 Advanced Traffic Management System Improvement Program $8,777,963 -$3,635,028 $507,709 $571,698 $813,003 $3,712,922 $10,748,267C69603000 US 301 Widening Construction Phase 2 (Balm Rd To SR 674) $308 $1,088 $2,276 $679 $0 $659 $5,010C69604000 Linebaugh Ave (Race Track Rd to Countryway) $294,159 $28,356 -$1,045 $9,448 $0 $0 $330,918C69606000 Fletcher Ave (Bruce B Downs Blvd to I-75) Widening $1,159,007 $179,158 $164,359 $15,142 $0 $0 $1,517,666C69607000 CR 579 (Mango Rd) I-4 to Sligh Ave $0 $0 $0 $0 $6,269 $1,268,475 $1,274,744C69611000 Telecom Parkway Extension (End to Morris Bridge Rd) $0 $0 $0 $42,437 $655,268 $946,717 $1,644,422C69615000 Hartline - Northeast Hil lsborough to Westshore BRT Improvements $318,688 $497,356 $409,257 $451,429 $0 $0 $1,676,730C69616000 Hartline Park & Ride - Brandon $10,748 $63,400 $526 $0 $0 $0 $74,674C69617000 Hartline Park & Ride - Fletcher Ave $2,112 $1,594,645 $73,944 $33,398 $0 $0 $1,704,099C69618000 Hartline - I-75 North to South Corridor BRT Improvements $1,688,836 $1,149,550 $14,278,258 $6,095,739 $78,576 $0 $23,290,959C69619000 Hartline Transit Signals $161,565 $32,199 $656,256 $223,868 $0 $0 $1,073,888C69623000 Wheeler Street Re-Alignment - Plant City $0 $0 $0 $1,433,843 $0 $0 $1,433,843C69625000 Turkey Creek Rd Improvements from MLK Blvd to Sydney Rd $0 $0 $0 $0 $0 $3,637,157 $3,637,157C69628000 Westshore Blvd (Kennedy to Boy Scout) $0 $0 $0 $0 $33,208 $75,000 $108,208C69999000 Proportionate Share Transportation Project $0 $0 $0 $0 $0 $1,056,466 $1,056,466
$45,725,986 $20,488,479 $33,862,572 $34,272,685 $15,480,802 $198,099,646 $347,930,170TOTAL

Tindale Oliver Hillsborough County April 2016 C-12 Mobility Fee Study
Table C‐12 Hillsborough County; CIT Refunding Revenue Bonds; Series 2015
Source: Hillsborough County Staff; refinancing of the 2007 bond from the FY 2015 Adopted Budget, pg. 448
Table C‐13 Hillsborough County; CIT Refunding Revenue Bonds; Series 2012B
Source: Hillsborough County FY 2015 Adopted Budget, pg. 451
Year Principal InterestTotal Debt
Service2016 - $5,202,076 $5,202,0762017 $2,480,000 $6,847,900 $9,327,9002018 $2,605,000 $6,758,600 $9,363,6002019 $13,970,000 $6,357,250 $20,327,2502020 $14,680,000 $5,641,000 $20,321,0002021 $15,420,000 $4,888,500 $20,308,5002022 $16,205,000 $4,097,876 $20,302,8762023 $17,085,000 $3,265,626 $20,350,6262024 $17,845,000 $2,392,376 $20,237,3762025 $18,705,000 $1,478,626 $20,183,6262026 $20,220,000 $505,500 $20,725,500Total $139,215,000 $47,435,330 $186,650,330
Percent for Transportation Capacity 55%Portion for Transportation Capacity $102,657,682
Year Principal InterestTotal Debt
Service2016 $3,820,000 $2,171,250 $5,991,2502017 $4,025,000 $1,980,250 $6,005,2502018 $4,210,000 $1,779,000 $5,989,0002019 $4,420,000 $1,568,500 $5,988,5002020 $4,645,000 $1,347,500 $5,992,5002021 $4,880,000 $1,115,250 $5,995,2502022 $5,130,000 $871,250 $6,001,2502023 $5,410,000 $614,750 $6,024,7502024 $5,640,000 $344,250 $5,984,2502025 $5,835,000 $175,050 $6,010,050Total $48,015,000 $11,967,050 $59,982,050
Percent for Transportation Capacity 60%Portion for Transportation Capacity $35,989,230

Tindale Oliver Hillsborough County April 2016 C-13 Mobility Fee Study
Table C‐14 Hillsborough County; CIP Refunding Revenue Bonds; Series 2012
Source: Hillsborough County FY 2015 Adopted Budget, pg. 452
Year Principal InterestTotal Debt
Service2016 $3,965,000 $2,815,500 $6,780,5002017 $4,160,000 $2,617,250 $6,777,2502018 $4,370,000 $2,409,250 $6,779,2502019 $4,590,000 $2,190,750 $6,780,7502020 $4,820,000 $1,961,250 $6,781,2502021 $5,060,000 $1,720,250 $6,780,2502022 $5,310,000 $1,467,250 $6,777,2502023 $5,575,000 $1,201,750 $6,776,7502024 $5,855,000 $923,000 $6,778,0002025 $6,150,000 $630,250 $6,780,2502026 $6,455,000 $322,750 $6,777,750Total $56,310,000 $18,259,250 $74,569,250
Percent for Transportation Capacity 93%Portion for Transportation Capacity $69,349,403
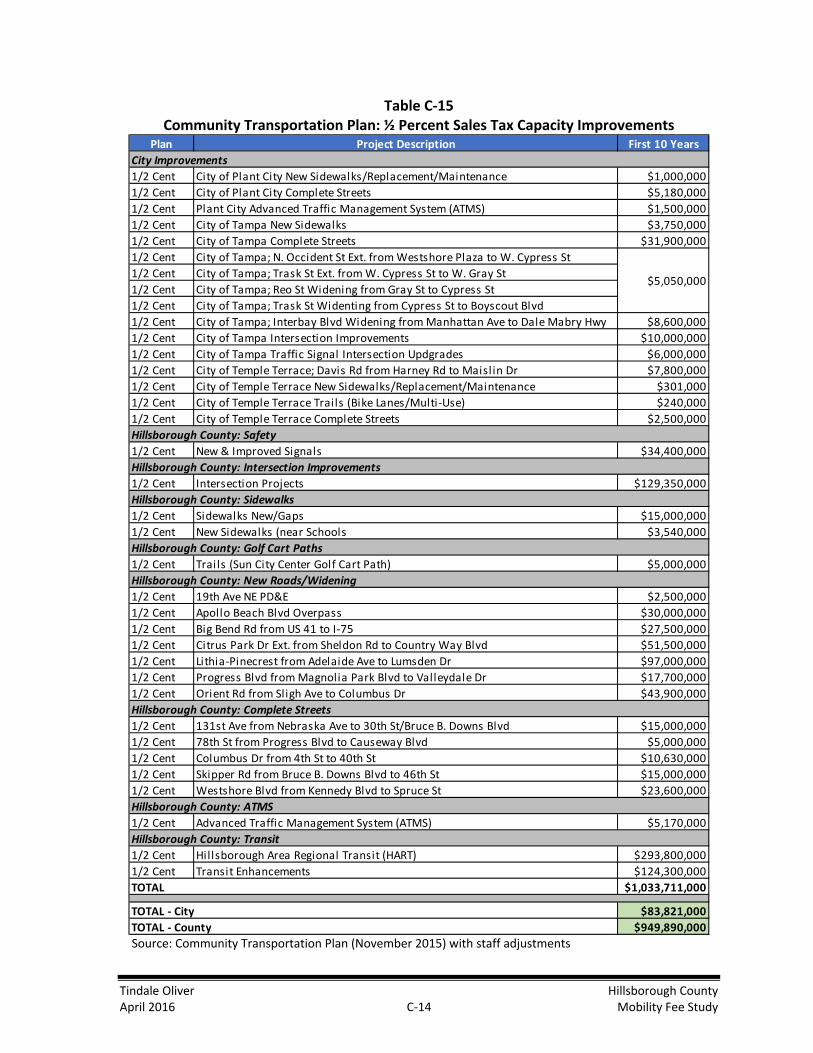
Tindale Oliver Hillsborough County April 2016 C-14 Mobility Fee Study
Table C‐15 Community Transportation Plan: ½ Percent Sales Tax Capacity Improvements
Source: Community Transportation Plan (November 2015) with staff adjustments
Plan Project Description First 10 Years
1/2 Cent City of Plant City New Sidewalks/Replacement/Maintenance $1,000,0001/2 Cent City of Plant City Complete Streets $5,180,0001/2 Cent Plant City Advanced Traffic Management System (ATMS) $1,500,0001/2 Cent City of Tampa New Sidewalks $3,750,0001/2 Cent City of Tampa Complete Streets $31,900,0001/2 Cent City of Tampa; N. Occident St Ext. from Westshore Plaza to W. Cypress St1/2 Cent City of Tampa; Trask St Ext. from W. Cypress St to W. Gray St1/2 Cent City of Tampa; Reo St Widening from Gray St to Cypress St1/2 Cent City of Tampa; Trask St Widenting from Cypress St to Boyscout Blvd1/2 Cent City of Tampa; Interbay Blvd Widening from Manhattan Ave to Dale Mabry Hwy $8,600,0001/2 Cent City of Tampa Intersection Improvements $10,000,0001/2 Cent City of Tampa Traffic Signal Intersection Updgrades $6,000,0001/2 Cent City of Temple Terrace; Davis Rd from Harney Rd to Maislin Dr $7,800,0001/2 Cent City of Temple Terrace New Sidewalks/Replacement/Maintenance $301,0001/2 Cent City of Temple Terrace Trails (Bike Lanes/Multi-Use) $240,0001/2 Cent City of Temple Terrace Complete Streets $2,500,000
1/2 Cent New & Improved Signals $34,400,000
1/2 Cent Intersection Projects $129,350,000
1/2 Cent Sidewalks New/Gaps $15,000,0001/2 Cent New Sidewalks (near Schools $3,540,000
1/2 Cent Trails (Sun City Center Golf Cart Path) $5,000,000
1/2 Cent 19th Ave NE PD&E $2,500,0001/2 Cent Apollo Beach Blvd Overpass $30,000,0001/2 Cent Big Bend Rd from US 41 to I-75 $27,500,0001/2 Cent Citrus Park Dr Ext. from Sheldon Rd to Country Way Blvd $51,500,0001/2 Cent Lithia-Pinecrest from Adelaide Ave to Lumsden Dr $97,000,0001/2 Cent Progress Blvd from Magnolia Park Blvd to Valleydale Dr $17,700,0001/2 Cent Orient Rd from Sligh Ave to Columbus Dr $43,900,000
1/2 Cent 131st Ave from Nebraska Ave to 30th St/Bruce B. Downs Blvd $15,000,0001/2 Cent 78th St from Progress Blvd to Causeway Blvd $5,000,0001/2 Cent Columbus Dr from 4th St to 40th St $10,630,0001/2 Cent Skipper Rd from Bruce B. Downs Blvd to 46th St $15,000,0001/2 Cent Westshore Blvd from Kennedy Blvd to Spruce St $23,600,000
1/2 Cent Advanced Traffic Management System (ATMS) $5,170,000
1/2 Cent Hillsborough Area Regional Transit (HART) $293,800,0001/2 Cent Transit Enhancements $124,300,000
$1,033,711,000
$83,821,000$949,890,000
TOTAL ‐ CityTOTAL ‐ County
Hillsborough County: Transit
$5,050,000
TOTAL
City Improvements
Hillsborough County: Safety
Hillsborough County: Intersection Improvements
Hillsborough County: Sidewalks
Hillsborough County: Golf Cart Paths
Hillsborough County: New Roads/Widening
Hillsborough County: Complete Streets
Hillsborough County: ATMS
Tindale Oliver Hillsborough County April 2016 C-15 Mobility Fee Study
Table C‐16 Hillsborough County FDOT Work Program
Item Work Mix Description Item Description FY 2006 FY 2007 FY 2008 FY 2009 FY 2010 FY 2011 FY 2012 FY 2013 FY 2014 FY 2015 FY 2016 FY 2017 FY 2018 FY 2019 FY 2020 Total427454-2 ADD AUXILIARY LANE(S) US 301 (SR 43) NB FROM N OF BLOOMINGDALE AV TO NB I-75 ON RAMP $0 $0 $0 $0 $0 $34,460 $236,065 $60,599 $23,161 $818 $0 $0 $0 $0 $0 $355,103255893-3 ADD LANES & RECONSTRUCT SR 574 (MLK BLVD) FROM E OF PARSONS AVE TO E OF KINGSWAY RD $0 $1,054,552 $11,222 $4,870 $10,353 $10,877 $580,271 $2,607,705 $10,243,753 $3,109,916 $5,152,973 $0 $0 $0 $0 $22,786,492255893-4 ADD LANES & RECONSTRUCT SR 574 (MLK BLVD) FROM EAST OF KINGSWAY RD TO E OF MCINTOSH RD $0 $0 $0 $0 $0 $909 $47,542 $3,070,517 $56,544 $388,153 $3,661,063 $10,322,432 $24,925,785 $933,605 $0 $43,406,550405525-2 ADD LANES & RECONSTRUCT SR 60 (ADAMO DR) FROM E OF US 301 TO W OF FALKENBURG RD $734,190 $7,085 $17,504 $6,084 $0 $864 $1,081,028 $124,090 $304,555 $26,852 $17,457 $20,530,961 $400,000 $0 $0 $23,250,670435750-2 ADD LANES & RECONSTRUCT SR 60 FROM DOVER RD TO SR 39 $0 $0 $0 $0 $0 $0 $0 $0 $29,036 $6,211,402 $3,507 $0 $0 $0 $0 $6,243,945435750-1 ADD LANES & RECONSTRUCT SR 60 FROM VALRICO RD TO DOVER RD $0 $0 $0 $0 $0 $0 $0 $0 $29,265 $3,712,238 $3,048 $0 $0 $0 $0 $3,744,551415489-3 ADD LANES & RECONSTRUCT US 301 (SR 43) FM SR 674/SUNCITY CTR BL TO CR 672/BALM ROAD $0 $0 $0 $0 $0 $603,229 $7,868 $27,011 $3,571 $43,259,828 $0 $0 $0 $0 $43,901,507415489-1 ADD LANES & RECONSTRUCT US 301 (SR 43) FROM S OF SUN CITY CENTER TO N OF GIBSONTON DR $72,645 $202,427 $2,420,329 $6,487,341 $24,671 $5,466 $104,503 $10,122 $518,490 $262,790 $2,464 $0 $0 $0 $0 $10,111,248255796-2 ADD LANES & RECONSTRUCT US 301 FROM FOWLER AVE TO FUTURE SR 56 $0 $0 $0 $0 $0 $0 $0 $0 $0 $868 $1,000 $5,500,000 $0 $0 $0 $5,501,868255709-2 ADD LANES & RECONSTRUCT US 92 (SR 600) FROM KINGSWAY RD TO MCINTOSH RD $0 $0 $0 $0 $0 $0 $0 $0 $0 $0 $659,380 $2,749,000 $0 $0 $0 $3,408,380255710-2 ADD LANES & RECONSTRUCT US 92 (SR 600) FROM MCINTOSH RD TO SR 566 (THONOTOSASSA) $0 $0 $0 $0 $0 $0 $0 $0 $0 $0 $1,512,953 $4,047,000 $0 $0 $0 $5,559,953255734-1 ADD LANES & RECONSTRUCT 22ND/20TH ST FROM MARITIME BLVD TO SR 60 $4,069,421 $0 $0 $0 $0 $0 $0 $0 $0 $0 $0 $0 $0 $0 $0 $4,069,421255893-2 ADD LANES & RECONSTRUCT SR 574 (MLK BLVD) FROM W OF HIGHVIEW RD TO E OF PARSONS AVE $2,925,179 $6,958,780 $14,493,039 $1,126,902 $1,438,742 $206,155 $7,472,958 $440,017 $644,158 $25,431 $757 $0 $0 $0 $0 $35,732,118255340-1 ADD LANES & RECONSTRUCT SR 600 (HILLS AVE) FROM DALE MABRY HWY TO E OF ARMENIA AVE $6,000 $0 $0 $0 $0 $0 $0 $0 $0 $0 $0 $0 $0 $0 $0 $6,000255599-1 ADD LANES & RECONSTRUCT SR 676 (CAUSEWAY BL) FROM 1/4 MI W OF US 41 TO 1/4 E OF US 301 $5,664,176 $42,387,362 $3,752,132 $3,318,086 $3,939,330 $951,357 $215,544 $208 $658 $10,563 $3,965,797 $0 $0 $0 $0 $64,205,213255888-1 ADD LANES & RECONSTRUCT US 301 (SR 41) FROM S OF SLIGH AVE TO S OF TPA BYPASS CANAL $482,219 $2,090,617 $894,055 $5,922 $23 $0 $0 $0 $0 $0 $0 $0 $0 $0 $0 $3,472,836255793-1 ADD LANES & RECONSTRUCT US 301 (SR 41) FROM S OF TPA BYPASS CNL TO N OF FOWLER AVE $369,970 $1,803,643 $62,881 $1,695,326 $56,212 $383,417 $994,689 $24,776,878 $208,289 $993,574 $382,140 $0 $0 $0 $0 $31,727,019415489-2 ADD LANES & RECONSTRUCT US 301 (SR 43) FROM S OF BALM RD TO N OF GIBSONTON DR $0 $18,092 $24,747,580 $279,827 $5,366,777 $391,951 $335,013 $67,811 $27,002 $0 $0 $0 $0 $0 $0 $31,234,053255512-1 ADD LANES & RECONSTRUCT US 41 (SR 45) S OF APEX FLA/NEB SUNSET LANE $0 $0 $0 $0 $0 $0 $0 $0 $0 $338 $60,861 $0 $0 $0 $0 $61,199257839-1 ADD LANES & RECONSTRUCT CR 39A (ALEXANDER) FROM US 92 (EASTBOUND) TO NORTH OF I-4 (SR 400) $692,748 $782,548 $69,697 $0 $0 $0 $0 $0 $0 $0 $0 $0 $0 $0 $0 $1,544,993257862-3 ADD LANES & RECONSTRUCT CR 580/SAM ALLEN RD FM W OF SR39/BUCHMAN HWY TO E OF PARK RD $0 $0 $0 $0 $0 $2,662 $2,746,591 $42,148 $44,283 $638,274 $2,404,061 $1,695,000 $23,731,789 $0 $0 $31,304,808405492-2 ADD LANES & RECONSTRUCT CR 581 (BB DOWNS BL) FROM PALM SPRINGS DR TO PEBBLE CREEK DR $112,000 $6,005,321 $0 $19,251,175 $4,000,000 $3,062,631 $426 $86 $75 $0 $0 $0 $0 $0 $0 $32,431,714405492-4 ADD LANES & RECONSTRUCT CR 581 (BB DOWNS BL) FROM PEBBLE CREEK DR TO COUNTY LINE RD $45,500 $1,156,750 $0 $0 $0 $0 $0 $0 $0 $5,000,141 $858 $0 $0 $0 $0 $6,203,249405492-5 ADD LANES & RECONSTRUCT CR 581 (BB DOWNS BL) FROM S OF BEARSS AVE TO S OF PALM SPRINGS BLVD $89,250 $2,044,000 $0 $0 $0 $0 $3,542,881 $0 $26,214,991 $219,278 $6,608 $0 $0 $0 $0 $32,117,008257809-2 ADD LANES & RECONSTRUCT CR 585A (40TH ST) FROM DIANA ST TO HANLON ST $8,212,516 $811,000 $953,098 $3,396,082 $0 $2,704,760 $0 $0 $0 $0 $0 $0 $0 $0 $0 $16,077,456257809-3 ADD LANES & RECONSTRUCT CR 585A (40TH ST) FROM HANLON ST TO N OF YUKON $462,298 $0 $8,516,849 $4,900,012 $0 $1,637,842 $311 $0 $0 $0 $0 $0 $0 $0 $0 $15,517,312257809-1 ADD LANES & RECONSTRUCT CR 585A (40TH ST) FROM HILLSBOROUGH AVE TO DIANA ST $280,677 $29,338 $7,054,413 $2,022,582 $1,391,672 $0 $2,636,951 $0 $0 $0 $0 $0 $0 $0 $0 $13,415,633420625-1 ADD LANES & RECONSTRUCT CROSS CREEK BLVD FROM W CORY LAKE BLVD TO MORRIS BRIDGE RD $0 $424,034 $0 $0 $0 $474,957 $0 $0 $896,921 $11,806 $693 $0 $0 $0 $0 $1,808,411437002-1 ADD LANES & RECONSTRUCT MADISON AVENUE FROM US 41 TO 78TH STREET (CR 573) $0 $0 $0 $0 $0 $0 $0 $0 $0 $0 $0 $0 $0 $0 $3,500,000 $3,500,000422695-1 ADD LANES & RECONSTRUCT TAMPA INT'L AIRPORT GEORGE BEAN PARKWAY $0 $0 $791,271 $0 $0 $0 $0 $0 $0 $0 $0 $0 $0 $0 $0 $791,271433586-1 ADD LANES & RECONSTRUCT GATX DRIVE FROM MARITIME BOULEVARD TO GUY N VERGER BOULEVARD $0 $0 $0 $0 $0 $0 $0 $0 $0 $0 $1,250,000 $0 $0 $0 $0 $1,250,000257862-2 ADD LANES & REHABILITATE PVMNT PARK RD FROM I-4 (SR 400) TO SAM ALLEN RD $10,713 $84,880 $313 $59,863 $2,348,824 $561,730 $321,193 $947 $0 $0 $0 $0 $0 $0 $0 $3,388,463430685-1 ADD LEFT TURN LANE(S) SR 574 (MLK BLVD) AT GALLAGHER ROAD $0 $0 $0 $0 $0 $1,241 $7,511 $321,495 $122,283 $1,620,460 $426,195 $0 $0 $0 $0 $2,499,185406631-1 ADD LEFT TURN LANE(S) US 41 BUSINESS/SR685 AT HANNA AVENUE $0 $0 $459 $0 $0 $0 $0 $0 $0 $0 $0 $0 $0 $0 $0 $459427484-1 ADD LEFT TURN LANE(S) US 92 (SR 600) DALE MABRY HIGHWAY AT WATROUS AVE $0 $0 $0 $0 $0 $435,687 $18,027 $0 $0 $0 $0 $0 $0 $0 $0 $453,714403763-1 ADD RIGHT TURN LANE(S) SR 574 (MLK BLVD) AT MCINTOSH RD $364,611 $787,244 $31,846 $0 $0 $0 $0 $0 $0 $0 $0 $0 $0 $0 $0 $1,183,701255893-5 ADD TURN LANE(S) SR 574 (MLK BLVD) @ I-75 (SR 93A) $0 $466,854 $0 $1,858,292 $99,613 $1,002 $0 $0 $0 $0 $0 $0 $0 $0 $0 $2,425,761424213-3 ATMS - ARTERIAL TRAFFIC MGMT CITY OF TAMPA DOWNTOWN TAMPA ATMS 191 SIGNALS - PHASE 2 $0 $0 $0 $0 $0 $0 $0 $0 $0 $0 $0 $1,075,000 $0 $0 $12,693,032 $13,768,032424213-4 ATMS - ARTERIAL TRAFFIC MGMT CITY OF TAMPA KENNEDY/HYDE PARK/DALE MABRY ATMS 142 SIGNALS- PHASE 3 $0 $0 $0 $0 $0 $0 $0 $0 $0 $0 $0 $1,244,000 $0 $0 $12,405,570 $13,649,570424213-6 ATMS - ARTERIAL TRAFFIC MGMT CITY OF TAMPA USF AREA/BUSCH BLVD ATMS 119 SIGNALS - PHASE 4 $0 $0 $0 $0 $0 $0 $0 $0 $0 $0 $0 $1,134,000 $0 $0 $10,205,108 $11,339,108429171-1 ATMS - ARTERIAL TRAFFIC MGMT COUNTYWIDE ATMS/ITS $0 $0 $0 $0 $0 $1,500,000 $0 $0 $0 $0 $0 $0 $0 $0 $0 $1,500,000424213-1 ATMS - ARTERIAL TRAFFIC MGMT CITY OF TAMPA TRAFFIC SIGNAL MANAGEMENT PHASE 1 $0 $0 $0 $0 $0 $0 $526 $1,083,229 $39,220 $2,967,159 $839,571 $0 $0 $0 $0 $4,929,705426160-1 BIKE LANE/SIDEWALK SR 580 (HILLS AVE) FROM TOWN & COUNTRY BLVD TO AMBASSADOR DR $0 $0 $0 $0 $221,338 $0 $0 $0 $0 $0 $0 $0 $0 $0 $0 $221,338413092-1 BIKE LANE/SIDEWALK BAYSHORE BLVD FROM BAY TO BAY BLVD TO PLATT ST $0 $0 $404,592 $0 $2,086,800 $0 $73 $0 $0 $0 $0 $0 $0 $0 $0 $2,491,465432715-1 BIKE LANE/SIDEWALK BOUGAINVILLEA AVE FROM 30TH STREET TO 46TH STREET $0 $0 $0 $0 $0 $0 $0 $0 $155 $94 $387,800 $0 $0 $0 $0 $388,049432714-1 BIKE LANE/SIDEWALK CYPRESS STREET FROM SR 60/U-PATH TO N WESTSHORE BLVD $0 $0 $0 $0 $0 $0 $0 $0 $332 $562,855 $1,000 $0 $0 $0 $0 $564,187436013-2 BIKE LANE/SIDEWALK HYDE PARK AVE (SB-ONE WAY PAIR) FROM PLATT ST TO SR 60/KENNEDY BLVD $0 $0 $0 $0 $0 $0 $0 $0 $0 $0 $169,200 $0 $0 $0 $0 $169,200432716-1 BIKE LANE/SIDEWALK PALM AVENUE FROM NORTH BOULEVARD TO NEBRASKA AVENUE $0 $0 $0 $0 $0 $0 $0 $0 $135 $597,773 $1,000 $0 $0 $0 $0 $598,908436013-1 BIKE LANE/SIDEWALK PLANT AVE (NB-ONE WAY PAIR) FROM W PLATT ST TO SR 60/KENNEDY BLVD $0 $0 $0 $0 $0 $0 $0 $0 $0 $0 $259,000 $0 $0 $0 $0 $259,000429464-1 BIKE LANE/SIDEWALK ALEXANDER ELEM SCH FERN ST FROM OCCIDENT ST TO HESPERIDES $0 $0 $0 $0 $0 $0 $7,031 $156,784 $30 $0 $0 $0 $0 $0 $0 $163,845426141-1 BIKE LANE/SIDEWALK TEMPLE HEIGHTS ROAD FROM W OF OVERLOOK DR TO 56TH ST $0 $0 $0 $0 $0 $596,442 $89 $22 $0 $0 $0 $0 $0 $0 $0 $596,553432717-1 BIKE LANE/SIDEWALK WILLOW AVENUE FROM SWANN AVENUE TO MAIN STREET $0 $0 $0 $0 $0 $0 $0 $0 $155 $31 $0 $450,600 $0 $0 $0 $450,786424394-1 CAPITAL FOR FIXED ROUTE HART (HILLS AREA REG IONAL TRANSIT)PARATRANSIT VAN ACQUIST SECTION 530 $0 $0 $0 $0 $294,000 $0 $0 $0 $0 $0 $0 $0 $0 $0 $0 $294,000433763-1 CAPITAL FOR FIXED ROUTE HART HILLSBOROUGH BUS LIVABILTY CAPITAL $0 $0 $0 $0 $0 $0 $0 $0 $4,000,000 $0 $0 $0 $0 $0 $0 $4,000,000433764-1 CAPITAL FOR FIXED ROUTE HART HILLSBOROUGH STATE OF GOOD REPAIR CAPITAL $0 $0 $0 $0 $0 $0 $0 $0 $0 $4,700,000 $0 $0 $0 $0 $0 $4,700,000415014-1 CAPITAL FOR FIXED ROUTE HART NORTHWEST TRANSIT CENTER URBAN TRANSIT CAPITAL $430,000 $0 $0 $0 $0 $0 $0 $0 $0 $0 $0 $0 $0 $0 $0 $430,000436677-1 CAPITAL FOR FIXED ROUTE HART REGIONAL FARE COLLECTION SYSTEM/SURFACE TRANSPORTATION $0 $0 $0 $0 $0 $0 $0 $0 $0 $0 $0 $0 $1,473,593 $2,000,000 $0 $3,473,593422737-1 CAPITAL FOR FIXED ROUTE HART SECTION 115: YBOR STATION INTERMODAL FACILITY $0 $28,846 $0 $0 $0 $0 $0 $0 $0 $0 $0 $0 $0 $0 $0 $28,846408329-1 CAPITAL FOR FIXED ROUTE HART SECTION 5208 $454,420 $0 $0 $0 $0 $0 $0 $0 $0 $0 $0 $0 $0 $0 $0 $454,420408109-1 CAPITAL FOR FIXED ROUTE HART SECTION 5307 $9,123,203 $9,080,454 $0 $9,616,025 $9,615,025 $10,973,308 $11,300,000 $11,560,727 $0 $15,800,000 $29,057,222 $16,528,240 $16,528,240 $16,528,240 $0 $165,710,684415014-2 CAPITAL FOR FIXED ROUTE HART TAMPA BAY CENTER (SECTION 5307) $250,000 $0 $0 $0 $0 $0 $0 $0 $0 $0 $0 $0 $0 $0 $0 $250,000424396-1 FIXED GUIDEWAY IMPROVEMENTS HART (HILLS AREA REGIONAL TRANSIT) TECO LINE STREETCAR EXT SE 129 $0 $0 $0 $1,960,000 $0 $0 $0 $0 $0 $0 $0 $0 $0 $0 $0 $1,960,000415172-1 FIXED GUIDEWAY IMPROVEMENTS HART FIXED GUIDEWAY SECTION 5309/5337 $0 $130,688 $153,077 $155,000 $308,077 $0 $353,193 $0 $0 $885,265 $0 $0 $0 $0 $0 $1,985,300415172-2 FIXED GUIDEWAY IMPROVEMENTS HART SEC. 5309: FIXED GUIDEWAY $0 $130,688 $0 $0 $0 $0 $0 $0 $0 $0 $0 $0 $0 $0 $0 $130,688435141-1 FIXED GUIDEWAY IMPROVEMENTS HART TECO STREETCAR CAPITAL MAINTENANCE $0 $0 $0 $0 $0 $0 $0 $0 $0 $0 $0 $100,000 $0 $880,006 $0 $980,006433535-3 INTERCHANGE (NEW) SR 60 (SR 589) FROM N OF INDEPENDENCE TO I-275 AT WESTSHORE $0 $0 $0 $0 $0 $0 $0 $0 $0 $0 $0 $605,000 $0 $8,946,000 $0 $9,551,000425503-2 INTERCHANGE IMPROVEMENT SR 566/THONOTOSASSA FROM S OF TOWNSGATE CT TO N OF I-4 $0 $0 $0 $0 $0 $0 $0 $0 $11,823 $2,214,202 $14,679 $0 $0 $0 $0 $2,240,704414594-1 INTERMODAL HUB CAPACITY HART INTERMODAL FACILITIES $0 $0 $0 $956,347 $0 $0 $0 $0 $0 $0 $0 $0 $0 $0 $0 $956,347416264-1 INTERMODAL HUB CAPACITY HART INTERMODAL TRANSIT CTRS $0 $0 $0 $82,260 $0 $0 $0 $0 $0 $0 $0 $0 $0 $0 $0 $82,260415348-2 INTERMODAL HUB CAPACITY MULTIMODAL TERMINALS $0 $0 $0 $0 $0 $0 $0 $0 $0 $93,771 $42,014,000 $0 $0 $0 $0 $42,107,771403760-1 INTERSECTION (MINOR) US 301(SR41/FT KING) AT MCINTOSH RD $65,527 $919,171 $18,874 $0 $0 $0 $0 $0 $0 $0 $0 $0 $0 $0 $0 $1,003,572413387-1 INTERSECTION (MINOR) MEMORIAL HWY AT KELLY RD $0 $199,000 $0 $0 $0 $0 $0 $0 $0 $0 $0 $0 $0 $0 $0 $199,000

Tindale Oliver Hillsborough County April 2016 C-16 Mobility Fee Study
Table C‐16 (Continued) Hillsborough County FDOT Work Program
Item Work Mix Description Item Description FY 2006 FY 2007 FY 2008 FY 2009 FY 2010 FY 2011 FY 2012 FY 2013 FY 2014 FY 2015 FY 2016 FY 2017 FY 2018 FY 2019 FY 2020 Total433045-1 INTERSECTION IMPROVEMENT US 41 SOUTHBOUND AT PEMBROKE RD WESTBOUND $0 $0 $0 $0 $0 $0 $117 $12,916 $559,639 $4,134 $1,618 $0 $0 $0 $0 $578,424436530-1 INTERSECTION IMPROVEMENT USB 41/SR 685/N FLORIDA AVENUE AT CR 584/ W WATERS AVENUE $0 $0 $0 $0 $0 $0 $0 $0 $0 $0 $5,000 $0 $0 $0 $0 $5,000433046-1 INTERSECTION IMPROVEMENT US 41 NORTHBOUND AT HARTFORD ST (WB) $0 $0 $0 $0 $0 $0 $117 $77,615 $27,047 $345 $5,296 $0 $0 $0 $0 $110,420433047-1 INTERSECTION IMPROVEMENT US 41 NORTHBOUND AT RALEIGH (WESTBOUND) $0 $0 $0 $0 $0 $0 $117 $71,282 $12,351 $26 $17,841 $0 $0 $0 $0 $101,617433049-1 INTERSECTION IMPROVEMENT US 41 NORTHBOUND AT S 34TH AVE (WESTBOUND) $0 $0 $0 $0 $0 $0 $0 $69,845 $9,776 $169 $16,562 $0 $0 $0 $0 $96,352433048-1 INTERSECTION IMPROVEMENT US 41 NORTHBOUND AT TOWAWAY AVE (WB) $0 $0 $0 $0 $0 $0 $352 $69,788 $18,807 $26 $14,386 $0 $0 $0 $0 $103,359255842-1 INTERSECTION IMPROVEMENT US 92 (SR 600) AT BAY TO BAY BLVD $105,161 $1,246,694 $74,516 $22,606 $0 $0 $0 $0 $0 $0 $0 $0 $0 $0 $0 $1,448,977424450-1 INTERSECTION IMPROVEMENT US 92/SR 600/DALEMABRY FROM GOLD TRIANGLE ST TO N OF COLUMBUS $0 $0 $0 $24,232 $128,121 $155,171 $0 $0 $0 $0 $0 $0 $0 $0 $0 $307,524437044-1 INTERSECTION IMPROVEMENT ARMENIA AVENUE AT BUSCH BOULEVARD $0 $0 $0 $0 $0 $0 $0 $0 $0 $0 $0 $0 $0 $977,691 $0 $977,691433071-1 INTERSECTION IMPROVEMENT BROADWAY FROM US 41 TO N 62ND ST CSX INTRMD $0 $0 $0 $0 $0 $0 $0 $0 $769,066 $3,395 $66,594 $0 $0 $0 $0 $839,055433926-1 INTERSECTION IMPROVEMENT FALKENBURG ROAD AT LEROY AVE/REEVES RD INTERSECTION IMPROVEMENT $0 $0 $0 $0 $0 $0 $0 $0 $602,392 $12,502 $240 $0 $0 $0 $0 $615,134436012-1 INTERSECTION IMPROVEMENT GUNN HIGHWAY AT LINEBAUGH AVE $0 $0 $0 $0 $0 $0 $0 $0 $0 $1,652,153 $1,965 $0 $0 $0 $0 $1,654,118433436-1 INTERSECTION IMPROVEMENT HARNEY ROAD AT 78TH ST/STEAMBOAT LANE $0 $0 $0 $0 $0 $0 $0 $0 $800,000 $364,608 $4,003 $0 $0 $0 $0 $1,168,611433071-2 INTERSECTION IMPROVEMENT N 62ND STREET FROM CSX INTRMD ENTRANCE TO NORTH OF E COLUMBUS DRIVE $0 $0 $0 $0 $0 $0 $0 $0 $0 $0 $0 $2,501,400 $0 $0 $4,350,111 $6,851,511433437-1 INTERSECTION IMPROVEMENT VALRICO ROAD AT SYDNEY ROAD $0 $0 $0 $0 $0 $0 $0 $0 $241,565 $10,335 $509 $0 $0 $0 $0 $252,409437041-1 INTERSECTION IMPROVEMENT WESTSHORE BOULEVARD AND GANDY BOULEVARD $0 $0 $0 $0 $0 $0 $0 $0 $0 $0 $0 $0 $0 $0 $1,361,815 $1,361,815255585-1 NEW ROAD CONSTRUCTION SR/CR 39 ALEXANDER FROM N OF I-4 (SR 400) TO N OF KNIGHTS GRIFFIN $8,634,955 $11,279,753 $245,569 $850,134 $345,315 $17,535,504 $88,989 $154,856 $376,218 $134,184 $0 $0 $0 $0 $0 $39,645,477405492-8 NEW ROAD CONSTRUCTION CR 581 (BB DOWNS BL) FROM COMMERCE PALMS DR TO DONA MICHELLE DR $0 $0 $0 $0 $0 $2,822,771 $26,729 $68,200 $131,503 $31,140 $3,083 $0 $0 $0 $0 $3,083,426435359-1 NEW ROAD CONSTRUCTION MARITIME BOULEVARD FROM GATX DRIVE TO CONTAINER YARD ENTRANC $0 $0 $0 $0 $0 $0 $0 $0 $0 $0 $1,250,000 $0 $0 $0 $0 $1,250,000435360-1 NEW ROAD CONSTRUCTION PORTWIDE ACCESS IMPROVEMENTS $0 $0 $0 $0 $0 $0 $0 $0 $0 $750,000 $0 $0 $0 $0 $0 $750,000434435-1 NEW ROAD CONSTRUCTION PROJECT SUNRISE-EDTF SOUTH SHORE CORPORATE CTR TRANSP IMPROVEMENTS $0 $0 $0 $0 $0 $0 $0 $0 $3,000,000 $0 $0 $0 $0 $0 $0 $3,000,000436031-1 NEW ROAD CONSTRUCTION TEMPLE TERRACE PARKWAY EXTENSION FROM TELECOM PKWY TO MORRIS BRIDGE R $0 $0 $0 $0 $0 $0 $0 $0 $0 $600,000 $0 $0 $0 $0 $0 $600,000422720-1 PARK AND RIDE LOTS HILLSBOROUGH AREA REGIONAL TRANSIT (HART) PARK N' RIDE $0 $0 $182,694 $199,984 $0 $0 $0 $0 $0 $0 $0 $0 $0 $0 $0 $382,678435912-1 PD&E/EMO STUDY SR 574 PD&E FROM MCINTOSH RD TO US 92/SR 600 $0 $0 $0 $0 $0 $0 $0 $0 $0 $0 $1,000 $2,000,000 $0 $0 $0 $2,001,000435911-1 PD&E/EMO STUDY SR 574 PD&E RE-EVAL FROM N 40TH ST TO I-4 $0 $0 $0 $0 $0 $0 $0 $0 $0 $0 $1,000 $1,000,000 $0 $0 $0 $1,001,000435908-1 PD&E/EMO STUDY SR 580 / BUSCH BLVD STUDY FROM N DALE MABRY HWY TO N NEBRASKA AVE $0 $0 $0 $0 $0 $0 $0 $0 $0 $0 $1,000 $400,000 $0 $0 $0 $401,000430055-1 PD&E/EMO STUDY SR 60 FROM VALRICO RD TO POLK COUNTY LINE RD $0 $0 $0 $0 $0 $661 $1,224,357 $24,458 $18,599 $19,773 $896 $0 $0 $0 $0 $1,288,744255822-1 PD&E/EMO STUDY SR 600 (GANDY BLVD) FROM E END OF BRIDGE TO DALE MABRY HWY $0 $0 $0 $0 $455 $0 $0 $0 $0 $0 $0 $0 $0 $0 $0 $455255796-1 PD&E/EMO STUDY US 301 FROM FOWLER AVE TO FUTURE SR 56 $0 $0 $0 $0 $0 $0 $0 $0 $0 $2,015,409 $1,253 $0 $0 $0 $0 $2,016,662430050-1 PD&E/EMO STUDY US 301 FROM SR 60 TO I-4 $0 $0 $0 $0 $0 $0 $0 $719,518 $10,918 $17,246 $534 $0 $0 $0 $0 $748,216430056-1 PD&E/EMO STUDY US 41 FROM KRACKER AVE TO S OF CAUSEWAY BLVD $0 $0 $0 $0 $0 $13,078 $0 $1,128,890 $8,781 $47,244 $603 $0 $0 $0 $0 $1,198,596435918-1 PD&E/EMO STUDY US 41 PD&E STUDY FROM MANATEE CO LINE TO SR 674 $0 $0 $0 $0 $0 $0 $0 $0 $0 $0 $1,501,000 $0 $0 $0 $0 $1,501,000435749-1 PD&E/EMO STUDY US 92 FROM I-4 TO COUNTY LINE $0 $0 $0 $0 $0 $0 $0 $0 $0 $1,516,233 $1,256 $0 $0 $0 $0 $1,517,489430054-1 PD&E/EMO STUDY US 92/HILLSBOROUGH FROM 50TH ST TO I-4 $0 $0 $0 $0 $0 $11,893 $15,705 $10,242 $284 $0 $0 $0 $0 $0 $0 $38,124435748-1 PD&E/EMO STUDY US 92/SR 580/HILLSBOROUGH CORRIDOR EVALUATION FM MEMORIAL HWY TO I-275 $0 $0 $0 $0 $0 $0 $0 $0 $0 $1,000,000 $1,000 $0 $0 $0 $0 $1,001,000255893-1 PD&E/EMO STUDY SR 574 (MLK BLVD) FROM CR 579 TO MCINTOSH RD $10,725 $27,931 $0 $0 $0 $0 $0 $0 $0 $0 $0 $0 $0 $0 $0 $38,656405525-1 PD&E/EMO STUDY SR 60 (ADAMO DR) FROM W OF 50TH ST TO FALKENBURG RD $9,229 $0 $0 $0 $0 $0 $0 $0 $0 $0 $0 $0 $0 $0 $0 $9,229405492-1 PD&E/EMO STUDY CR 581 (BB DOWNS BL) FROM BEARSS AVE TO SR 54 $0 $431 $324 $0 $0 $0 $0 $0 $0 $0 $0 $0 $0 $0 $0 $755410649-1 PD&E/EMO STUDY EAST/WEST RD (COT) FROM I-275 TO CR 581 (BB DOWNS BLVD) $0 $48,364 $0 $0 $0 $0 $0 $0 $0 $0 $0 $0 $0 $0 $0 $48,364257862-1 PD&E/EMO STUDY PARK RD/SAM ALLEN RD FROM I-4 (SR 400) TO ALEXANDER ST EXTENSION $3,873 $0 $0 $0 $0 $0 $0 $0 $0 $0 $0 $0 $0 $0 $0 $3,873435912-2 PRELIMINARY ENGINEERING SR 574 FROM MCINTOSH ROAD TO US 92 / SR 600 $0 $0 $0 $0 $0 $0 $0 $0 $0 $0 $0 $0 $0 $2,000 $4,000,000 $4,002,000435911-2 PRELIMINARY ENGINEERING SR 574 FROM N 40TH ST TO I-4 $0 $0 $0 $0 $0 $0 $0 $0 $0 $0 $0 $0 $2,000 $2,000,000 $0 $2,002,000435918-2 PRELIMINARY ENGINEERING US 41 FROM MANATEE COUNTY LINE TO SR 674 $0 $0 $0 $0 $0 $0 $0 $0 $0 $0 $1,000 $4,000,000 $0 $0 $0 $4,001,000435748-2 PRELIMINARY ENGINEERING US 92/SR 580/HILLSBOROUGH AVE FROM MEMORIAL HIGHWAY TO I-275 $0 $0 $0 $0 $0 $0 $0 $0 $0 $0 $0 $1,000 $4,800,000 $0 $0 $4,801,000402255-1 PTO STUDIES HILLSBOROUGH CTY MPO TRANSIT PLANNING SECTION 5305 $237,017 $303,739 $328,533 $356,534 $383,560 $385,777 $408,063 $414,654 $516,609 $520,695 $468,240 $340,256 $350,463 $350,463 $360,978 $5,725,581410948-1 PUBLIC TRANSPORTATION SHELTER HART TRANSIT ENHANCEMENT $600,000 $0 $600,000 $0 $700,000 $0 $700,000 $0 $0 $0 $0 $0 $0 $0 $0 $2,600,000426371-5 PURCHASE VEHICLES/EQUIPMENT ARRA/HART SECTION 5307 (ARRA): FAREBOX REPLACEMENT/EXPAN $0 $0 $0 $0 $450,000 $0 $0 $0 $0 $0 $0 $0 $0 $0 $0 $450,000426371-1 PURCHASE VEHICLES/EQUIPMENT ARRA/HART SECTION 5307;ARRA BUSES & PARATRANSIT VANS $0 $0 $0 $0 $7,793,203 $0 $0 $0 $0 $0 $0 $0 $0 $0 $0 $7,793,203426475-1 PURCHASE VEHICLES/EQUIPMENT HART BUS ACQUISTION $0 $0 $0 $0 $2,185,000 $0 $0 $0 $0 $0 $0 $0 $0 $0 $0 $2,185,000405428-1 PURCHASE VEHICLES/EQUIPMENT HART BUS AND BUS FACILITIES SECTION 5309 $0 $451,440 $0 $489,060 $0 $0 $0 $0 $0 $0 $0 $0 $0 $0 $0 $940,500405428-3 PURCHASE VEHICLES/EQUIPMENT HART BUS COALITION $0 $671,188 $0 $1,222,668 $0 $0 $0 $0 $0 $0 $0 $0 $0 $0 $0 $1,893,856410693-2 PURCHASE VEHICLES/EQUIPMENT HART BUS PURCHASES-TRANSIT CORRIDOR-CAPITAL $0 $0 $0 $0 $0 $0 $0 $0 $0 $172,100 $0 $0 $0 $0 $0 $172,100405428-5 PURCHASE VEHICLES/EQUIPMENT HART BUS/BUS FACILITIES $900,000 $1,000,000 $0 $2,000,000 $0 $0 $0 $0 $0 $0 $0 $0 $0 $0 $0 $3,900,000405428-6 PURCHASE VEHICLES/EQUIPMENT HART BUS/BUS FACILITIES SECTION 5309 $0 $0 $0 $0 $247,500 $0 $0 $0 $0 $0 $0 $0 $0 $0 $0 $247,500434366-1 PURCHASE VEHICLES/EQUIPMENT HART SECTION 5339 CAPITAL ACTIVITIES $0 $0 $0 $0 $0 $0 $0 $0 $0 $1,297,193 $1,328,792 $0 $0 $0 $0 $2,625,985412751-1 PURCHASE VEHICLES/EQUIPMENT HART SURFACE TRANSPORTATION BUS PURCHASES $0 $0 $0 $3,000,000 $0 $0 $0 $0 $0 $0 $0 $0 $0 $0 $0 $3,000,000414963-2 PURCHASE VEHICLES/EQUIPMENT HART SURFACE TRANSPORTATION PROGRAM $0 $0 $0 $0 $0 $0 $0 $12,000,000 $0 $10,000,000 $0 $8,200,000 $6,300,000 $5,220,000 $4,000,000 $45,720,000430175-1 PURCHASE VEHICLES/EQUIPMENT TBARTA SURFACE TRANSPORTATION PROGRAM / VANPOOL $0 $0 $0 $0 $0 $0 $0 $0 $0 $310,800 $0 $386,400 $800,000 $800,000 $0 $2,297,200421480-2 SIDEWALK SR 574 (MLK BLVD) FROM E OF HIMES AVE TO 350' W OF BURDINES DR $0 $0 $0 $117,432 $30,659 $0 $0 $0 $0 $0 $0 $0 $0 $0 $0 $148,091416114-1 SIDEWALK SR 580 (HILLS AVE) FROM BEAUMONT CTR BLVD TO HOOVER BLVD $0 $186 $1,609 $274,733 $34,474 $0 $0 $0 $0 $0 $0 $0 $0 $0 $0 $311,002420627-1 SIDEWALK SR 583/56TH ST FROM HILLSBOROUGH RIVER TO TEMPLE HEIGHTS RD $0 $0 $0 $3,442,227 $0 $8,013 $0 $0 $0 $0 $0 $0 $0 $0 $0 $3,450,240416746-1 SIDEWALK SR 585 (22ND ST) FROM 23RD AVE E TO LAKE AVE E $257,000 $0 $0 $0 $0 $624 $593,042 $292,485 $25 $0 $0 $0 $0 $0 $0 $1,143,176415234-4 SIDEWALK SR 597 (DALE MABRY) FM N CARROLLWOOD SPRINGS TO S OF NORTHDALE BLVD $0 $0 $0 $0 $0 $467,997 $34,624 $1,101 $0 $0 $0 $0 $0 $0 $0 $503,722426161-1 SIDEWALK SR 597 (DALE MABRY) FM W FLETCHER/S VILLAGE TO CAROLL SPRINGS/ZAMBITO $0 $0 $0 $0 $25,438 $884,532 $1,412 $0 $0 $0 $0 $0 $0 $0 $0 $911,382415234-9 SIDEWALK SR 597 (DALE MABRY) FROM N LAKEVIEW DRIVE TO SOUTH OF VAN DYKE RD $0 $0 $0 $0 $0 $13,038 $296,449 $432,051 $43,632 $45,261 $0 $0 $0 $0 $0 $830,431415234-5 SIDEWALK SR 597 (DALE MABRY) FROM NORTHDALE BLVD TO NORTHGREEN AVE $0 $0 $0 $0 $0 $259,612 $8,249 $0 $0 $0 $0 $0 $0 $0 $0 $267,861415234-7 SIDEWALK SR 597 (DALE MABRY) FROM NORTHGREEN AVE TO N LAKEVIEW DR $0 $0 $0 $68,177 $0 $252,249 $381 $0 $0 $0 $0 $0 $0 $0 $0 $320,807428218-1 SIDEWALK SR 60 FROM BRANDON TOWN CENTER TO GORNTO LAKE RD $0 $0 $0 $61 $1,075 $134,917 $23,316 $0 $0 $0 $0 $0 $0 $0 $0 $159,369415004-1 SIDEWALK CHARLIE GRIFFIN RD FROM JL REDMAN PKWAY TO PK SPRINGS APTS. ENTR. $0 $0 $0 $43,037 $0 $0 $0 $0 $0 $0 $0 $0 $0 $0 $0 $43,037408551-1 SIDEWALK CLAY PIT RD FROM SCOTLAND COURT TO A&A MOBILE HOME PARK $0 $138,733 $0 $0 $0 $0 $0 $0 $0 $0 $0 $0 $0 $0 $0 $138,733408550-1 SIDEWALK DANNY BRYAN BLVD FROM MLK BLVD TO PATINA ST $0 $129,977 $0 $0 $0 $0 $0 $0 $0 $0 $0 $0 $0 $0 $0 $129,977

Tindale Oliver Hillsborough County April 2016 C-17 Mobility Fee Study
Table C‐16 (Continued) Hillsborough County FDOT Work Program
Source: Florida Department of Transportation, District 7
Item Work Mix Description Item Description FY 2006 FY 2007 FY 2008 FY 2009 FY 2010 FY 2011 FY 2012 FY 2013 FY 2014 FY 2015 FY 2016 FY 2017 FY 2018 FY 2019 FY 2020 Total257805-3 SIDEWALK DOWNTOWN RIVERWALK AT PLATT ST BRIDGE $0 $600,000 $0 $0 $860,000 $0 $0 $0 $0 $0 $0 $0 $0 $0 $0 $1,460,000413128-1 SIDEWALK LITTLE RD FROM BLOOMINGDALE AVE TO DURANT RD $0 $0 $143,689 $60,459 $0 $0 $0 $0 $0 $0 $0 $0 $0 $0 $0 $204,148413130-1 SIDEWALK THONOTOSASSA RD FROM TAYLOR RD TO BAKER CREEK PARK $0 $529 $197,742 $18,160 $0 $0 $0 $0 $0 $0 $0 $0 $0 $0 $0 $216,431257805-5 SIDEWALK DOWNTOWN RIVERWALK FROM MACDILL PARK TO CURTIS HIXON WF PARK $0 $0 $0 $0 $0 $0 $0 $0 $0 $9,512,000 $218,750 $0 $0 $0 $0 $9,730,750413136-1 SIDEWALK MCMULLEN RD FROM BALM RIVERVIEW RD TO S BOYETTE RD $0 $0 $2,483 $11,149 $10,545 $251,011 $24,733 $0 $0 $0 $0 $0 $0 $0 $0 $299,921428160-1 SIDEWALK MENDONSA ROAD FROM ALEXANDER ST TO HUNTER ST $0 $0 $0 $0 $0 $192,217 $144 $171 $232 $8 $0 $0 $0 $0 $0 $192,772428206-1 SIDEWALK MULRENNAN MIDDLE SCH DURANT RD FRM ST CLOUD TO MULRENNAN $0 $0 $0 $0 $0 $101,520 $0 $30 $0 $0 $0 $0 $0 $0 $0 $101,550257805-7 SIDEWALK SELMON GREENWAY FROM HILLSBOROUGH RIVER TO 19TH STREET $0 $0 $0 $0 $0 $0 $0 $1,431,000 $0 $0 $0 $0 $0 $0 $0 $1,431,000405521-1 TRAFFIC CONTROL DEVICES/SYSTEM CITY OF TAMPA TRAFFIC SURVEILLANCE $448,148 $1,174 $0 $0 $0 $0 $0 $0 $0 $0 $0 $0 $0 $0 $0 $449,322414990-1 TRAFFIC CONTROL DEVICES/SYSTEM US 92 (SR 600) FROM CR 566 (THONOTOSSA) TO PARK RD $0 $0 $2,076,936 $0 $0 $0 $0 $0 $0 $0 $0 $0 $0 $0 $0 $2,076,936436244-1 TRAFFIC SIGNAL UPDATE SR 582 / FOWLER AVE AT RAINTREE BLVD, GILLETTE AVE, N RIVERHILL DR $0 $0 $0 $0 $0 $0 $0 $0 $0 $148 $68,915 $72,000 $0 $0 $0 $141,063416856-1 TRAFFIC SIGNAL UPDATE SR 60 (KENNEDY BLVD) FROM W OF ARMENIA AVE TO E OF BREVARD AVE $0 $0 $0 $0 $0 $0 $0 $0 $10,018 $1,002,955 $750,208 $906,700 $50,000 $1,828,066 $0 $4,547,947436243-1 TRAFFIC SIGNAL UPDATE US 301/SR 43 AT RIVERVIEW DRIVE $0 $0 $0 $0 $0 $0 $0 $0 $0 $894 $28,048 $138,000 $0 $0 $0 $166,942436242-1 TRAFFIC SIGNAL UPDATE US 92/SR 600 AT INTERBAY BLVD $0 $0 $0 $0 $0 $0 $0 $0 $0 $1,192 $20,724 $131,000 $0 $0 $0 $152,916436245-1 TRAFFIC SIGNAL UPDATE US 92/SR 600/S DALE MABRY AT EL PRADO BLVD $0 $0 $0 $0 $0 $0 $0 $0 $0 $148 $34,818 $44,000 $0 $0 $0 $78,966427171-2 TRAFFIC SIGNAL UPDATE USB 41 (SR 45/SR 60) FM W OF 14TH ST TO E OF 19TH ST $0 $0 $0 $0 $0 $0 $0 $2,952 $83,624 $106,075 $879,849 $371,090 $0 $0 $0 $1,443,590416816-1 TRAFFIC SIGNAL UPDATE SR 597 (DALE MABRY) FROM HUMPHREY ST TO VAN DYKE RD $829,751 $1,174 $0 $3,195 $0 $10,745 $772,347 $28,033 $11 $0 $0 $0 $0 $0 $0 $1,645,256405920-4 TRAFFIC SIGNALS TRAFFIC SIGNAL MAINTENANCE AND OPERATION FOR LOCAL GOVERNMENT $636,584 $664,057 $684,008 $720,191 $750,585 $774,406 $796,834 $823,027 $849,635 $876,997 $963,361 $0 $0 $0 $0 $8,539,685435956-1 TRAFFIC SIGNALS US 41/92/SR 600/E HILLSBOROUGH AVE AT E GATE PLAZA/MERIDIAN POINTE APTS $0 $0 $0 $0 $0 $0 $0 $0 $0 $306,764 $935 $0 $0 $0 $0 $307,699416687-1 TRAFFIC SIGNALS SR 580 (HILLS AVE) AT SILVERMILL DR $5,533 $0 $0 $0 $0 $0 $0 $0 $0 $0 $0 $0 $0 $0 $0 $5,533255769-1 TRAFFIC SIGNALS SR 600 (HILLS AVE) WEST OF 22ND ST .05 MILES W OF 22ND ST $286 $177 $5,045 $280,690 $6,132 $0 $0 $0 $0 $0 $0 $0 $0 $0 $0 $292,330416121-1 TRAFFIC SIGNALS US 41 (SR 685) AT LAKE MAGDALENE BLVD $54,620 $0 $0 $0 $0 $0 $0 $0 $0 $0 $0 $0 $0 $0 $0 $54,620415269-1 TRAFFIC SIGNALS HANLEY RD AT PAULA DR $10,159 $230,000 $0 $0 $0 $0 $0 $0 $0 $0 $0 $0 $0 $0 $0 $240,159420286-1 TRANSIT IMPROVEMENT WHEELER ST TRACK IMPROVEMENTS $0 $53,358 $0 $0 $0 $0 $0 $0 $0 $0 $0 $0 $0 $0 $0 $53,358426371-7 TRANSIT IMPROVEMENT ARRA/HART SECTION 5307 (ARRA): TECHNOLOGY IMPROVEMENTS $0 $0 $0 $0 $800,000 $0 $0 $0 $0 $0 $0 $0 $0 $0 $0 $800,000426371-4 TRANSIT IMPROVEMENT ARRA/HART SECTION 5307 (ARRA): TECO STREETCAR EXP/CAP MAINT $0 $0 $0 $0 $1,000,000 $0 $0 $0 $0 $0 $0 $0 $0 $0 $0 $1,000,000426371-3 TRANSIT IMPROVEMENT ARRA/HART SECTION 5307;ARRA 21ST AVE IMPROVEMENTS $0 $0 $0 $0 $1,693,592 $0 $0 $0 $0 $0 $0 $0 $0 $0 $0 $1,693,592408209-1 TRANSIT IMPROVEMENT HART $365,000 $0 $0 $0 $0 $0 $0 $0 $0 $0 $0 $0 $0 $0 $0 $365,000413330-1 TRANSIT IMPROVEMENT HART $3,000,000 $0 $0 $0 $0 $0 $0 $0 $0 $0 $0 $0 $0 $0 $0 $3,000,000430322-1 TRANSIT IMPROVEMENT HART $0 $0 $0 $0 $0 $0 $241,000 $241,000 $241,000 $400,000 $241,000 $241,000 $241,000 $252,407 $248,000 $2,346,407424453-1 TRANSIT IMPROVEMENT HART (HILLSBOROUGH AREA REGIONAL TRANSIT SECTION 5307 $0 $0 $0 $0 $250,000 $0 $0 $0 $0 $0 $0 $0 $0 $0 $0 $250,000409045-1 TRANSIT IMPROVEMENT HART JOBS ACCESS/REVERSE COMMUTE $0 $99,118 $0 $0 $0 $0 $0 $0 $0 $0 $0 $0 $0 $0 $0 $99,118420740-1 TRANSIT IMPROVEMENT HART PARK AND RIDE $0 $200,000 $0 $0 $0 $0 $0 $0 $0 $0 $0 $0 $0 $0 $0 $200,000420739-1 TRANSIT IMPROVEMENT HART SERVICE DEVELOPMENT $0 $123,364 $0 $0 $0 $0 $0 $0 $0 $0 $0 $0 $0 $0 $0 $123,364408207-1 TRANSIT IMPROVEMENT HART STREETCAR EXTENSION $0 $0 $0 $900,000 $0 $0 $0 $0 $0 $0 $0 $0 $0 $0 $0 $900,000412762-1 TRANSIT IMPROVEMENT HART STREETCAR EXTENSION $0 $0 $0 $2,800,000 $0 $0 $0 $0 $0 $0 $0 $0 $0 $0 $0 $2,800,000410719-1 TRANSIT IMPROVEMENT HART SURFACE TRANSPORTATION $2,000,000 $0 $0 $0 $0 $0 $0 $0 $0 $0 $0 $0 $0 $0 $0 $2,000,000410720-1 TRANSIT IMPROVEMENT HART SURFACE TRANSPORTATION $2,000,000 $0 $0 $0 $0 $0 $0 $0 $0 $0 $0 $0 $0 $0 $0 $2,000,000413330-2 TRANSIT IMPROVEMENT HART SURFACE TRANSPORTATION PROGRAM $0 $0 $0 $0 $1,000,000 $0 $0 $0 $0 $0 $0 $0 $0 $0 $0 $1,000,000414963-1 TRANSIT IMPROVEMENT HART SURFACE TRANSPORTATION PROGRAM $0 $0 $0 $4,000,000 $0 $0 $0 $0 $0 $0 $0 $0 $0 $0 $0 $4,000,000408530-1 TRANSIT IMPROVEMENT HART TRANSIT ENHANCEMENT $400,000 $0 $0 $0 $0 $0 $0 $0 $0 $0 $0 $0 $0 $0 $0 $400,000430327-1 TRANSIT IMPROVEMENT HART-NORTHDALE FLEX SERVICE $0 $0 $0 $0 $0 $0 $375,000 $0 $0 $0 $0 $0 $0 $0 $0 $375,000430326-1 TRANSIT IMPROVEMENT HART-TOWN-N-COUNTRY FLEX 60X $0 $0 $0 $0 $0 $0 $606,000 $0 $0 $0 $0 $0 $0 $0 $0 $606,000429925-1 TRANSIT IMPROVEMENT HILLSBOROUGH RURAL MAP 21 ADA $0 $0 $0 $0 $0 $0 $217,678 $0 $0 $0 $0 $108,373 $285,132 $0 $0 $611,183417978-1 TRANSIT IMPROVEMENT JAIL PROPERTY FROM MORGAN ST TO ORANGE AVE $3,917,129 $0 $0 $611 $0 $0 $0 $0 $0 $0 $0 $0 $0 $0 $0 $3,917,740418685-1 URBAN CORRIDOR IMPROVEMENTS SR 585 (21ST/22ND ST) FROM SR 60 (ADAMO DRIVE) TO SR 600 (HILLSBOROUGH) $0 $0 $0 $0 $0 $164,636 $1,914,432 $19,565 $7,743,813 $351,350 $1,557 $0 $0 $0 $0 $10,195,353405428-4 URBAN CORRIDOR IMPROVEMENTS HART BUS RAPID TRANSIT (BRT) SECTION 5309 $0 $0 $0 $0 $1,066,000 $0 $0 $0 $0 $0 $0 $0 $0 $0 $0 $1,066,000405428-2 URBAN CORRIDOR IMPROVEMENTS HART EMPHASIS CORRIDOR IMPROVEMENT SECTION 5309 $0 $0 $0 $0 $332,310 $0 $0 $0 $0 $0 $0 $0 $0 $0 $0 $332,310420741-2 URBAN CORRIDOR IMPROVEMENTS HART NEW TAMPA FLEX $0 $0 $0 $0 $0 $0 $0 $0 $150,200 $0 $0 $0 $0 $0 $0 $150,200418213-1 URBAN CORRIDOR IMPROVEMENTS HART SURFACE TRANSPORTATION PROGRAM $0 $0 $0 $0 $4,500,000 $1,000,000 $0 $5,500,000 $0 $0 $0 $0 $0 $0 $0 $11,000,000410768-1 PD&E/EMO STUDY EAST/WEST RD AT I-275 $64 $3,474 $0 $0 $0 $0 $0 $0 $0 $0 $0 $0 $0 $0 $0 $81,942Grand Total $59,342,497 $94,878,235 $68,936,379 $78,087,336 $55,795,421 $49,981,319 $40,372,603 $67,924,932 $59,668,070 $83,141,125 $143,417,951 $86,822,452 $79,888,002 $40,718,478 $53,124,614 $1,062,177,818

Tindale Oliver Hillsborough County April 2016 C-18 Mobility Fee Study
Table C‐17 Average Motor Vehicle Fuel Efficiency – Excluding Interstate Travel
Source: U.S. Department of Transportation, Federal Highway Administration, Highway Statistics 2014, Section V, Table VM-1 Annual Vehicle Distance Traveled in Miles and Related Data - 2014 by Highway Category and Vehicle Type http://www.fhwa.dot.gov/policyinformation/statistics.cfm
21.4 6.3 @ 21.4 mpg @ 6.3 mpgOther Arterial Rural 304,792,000,000 45,625,000,000 350,417,000,000 87% 13%Other Rural 299,027,000,000 30,471,000,000 329,498,000,000 91% 9%Other Urban 1,476,377,000,000 89,623,000,000 1,566,000,000,000 94% 6%
Total 2,080,196,000,000 165,719,000,000 2,245,915,000,000 93% 7%
Gallons @ 21.4 mpg Gallons @ 6.3 mpg 2,245,915 miles (millions)Other Arterial Rural 14,242,616,822 7,242,063,492 21,484,680,314 123,510 gallons (millions)Other Rural 13,973,224,299 4,836,666,667 18,809,890,966 18.18 mpgOther Urban 68,989,579,439 14,225,873,016 83,215,452,455
Total 97,205,420,560 26,304,603,175 123,510,023,735
Travel
Vehicle Miles of Travel (VMT) @ Percent VMT
Fuel Consumed Total Mileage and Fuel
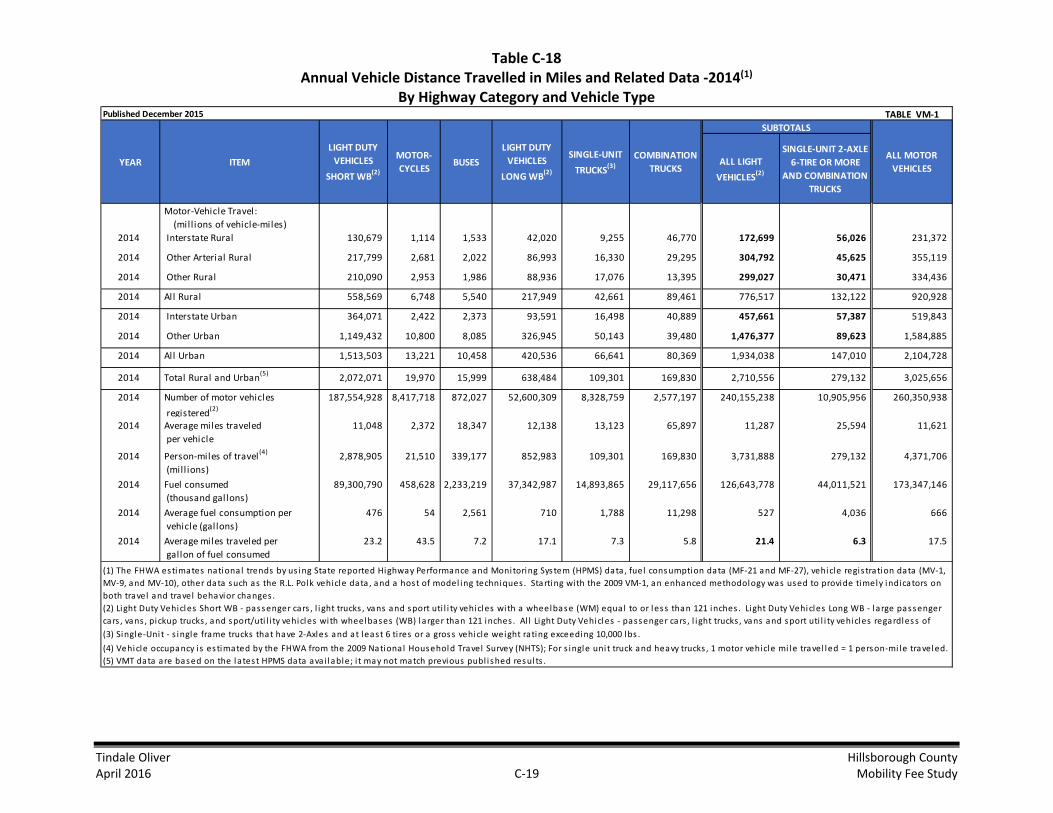
Tindale Oliver Hillsborough County April 2016 C-19 Mobility Fee Study
Table C‐18 Annual Vehicle Distance Travelled in Miles and Related Data ‐2014(1)
By Highway Category and Vehicle Type
Published December 2015 TABLE VM‐1
ALL LIGHT
VEHICLES(2)
SINGLE‐UNIT 2‐AXLE 6‐TIRE OR MORE
AND COMBINATION TRUCKS
Motor-Vehicle Travel: (mill ions of vehicle-miles)
2014 Interstate Rural 130,679 1,114 1,533 42,020 9,255 46,770 172,699 56,026 231,372
2014 Other Arterial Rural 217,799 2,681 2,022 86,993 16,330 29,295 304,792 45,625 355,119
2014 Other Rural 210,090 2,953 1,986 88,936 17,076 13,395 299,027 30,471 334,436
2014 All Rural 558,569 6,748 5,540 217,949 42,661 89,461 776,517 132,122 920,928
2014 Interstate Urban 364,071 2,422 2,373 93,591 16,498 40,889 457,661 57,387 519,843
2014 Other Urban 1,149,432 10,800 8,085 326,945 50,143 39,480 1,476,377 89,623 1,584,885
2014 All Urban 1,513,503 13,221 10,458 420,536 66,641 80,369 1,934,038 147,010 2,104,728
2014 Total Rural and Urban(5) 2,072,071 19,970 15,999 638,484 109,301 169,830 2,710,556 279,132 3,025,656
2014 Number of motor vehicles 187,554,928 8,417,718 872,027 52,600,309 8,328,759 2,577,197 240,155,238 10,905,956 260,350,938
registered(2)
2014 Average miles traveled 11,048 2,372 18,347 12,138 13,123 65,897 11,287 25,594 11,621 per vehicle
2014 Person-miles of travel(4) 2,878,905 21,510 339,177 852,983 109,301 169,830 3,731,888 279,132 4,371,706 (mill ions)
2014 Fuel consumed 89,300,790 458,628 2,233,219 37,342,987 14,893,865 29,117,656 126,643,778 44,011,521 173,347,146 (thousand gallons)
2014 Average fuel consumption per 476 54 2,561 710 1,788 11,298 527 4,036 666 vehicle (gallons)
2014 Average miles traveled per 23.2 43.5 7.2 17.1 7.3 5.8 21.4 6.3 17.5 gallon of fuel consumed
(3) Single-Uni t - s ingle frame trucks that have 2-Axles and at least 6 ti res or a gros s vehicle weight rating exceeding 10,000 lbs .
(4) Vehicle occupancy is estimated by the FHWA from the 2009 National Household Travel Survey (NHTS); For s ingle unit truck and heavy trucks , 1 motor vehicle mi le travel led = 1 person-mi le traveled.(5) VMT data are based on the latest HPMS data ava i lable; i t may not match previous publ i shed resul ts .
SINGLE‐UNIT
TRUCKS(3)COMBINATION
TRUCKS
SUBTOTALS
ALL MOTOR VEHICLES
(1) The FHWA estimates national trends by us ing State reported Highway Performance and Monitoring System (HPMS) data , fuel cons umption data (MF-21 and MF-27), vehicle regis tration data (MV-1, MV-9, and MV-10), other data such as the R.L. Polk vehicle data , and a host of model ing techniques . Starting with the 2009 VM-1, an enhanced methodology was used to provide timely indicators on both travel and travel behavior changes .(2) Light Duty Vehicles Short WB - passenger cars , l i ght trucks , vans and sport uti l i ty vehicles with a wheelbase (WM) equal to or less than 121 inches . Light Duty Vehicles Long WB - large passenger cars , vans , pickup trucks , and sport/uti l i ty vehicles with wheelbases (WB) larger than 121 inches . Al l Light Duty Vehicles - passenger cars , l ight trucks , vans and sport uti l i ty vehicles regardles s of
YEAR ITEM
LIGHT DUTY VEHICLES
SHORT WB(2)
MOTOR‐CYCLES
BUSES
LIGHT DUTY VEHICLES
LONG WB(2)

APPENDIX D
Mobility Fee Schedules

Tindale Oliver Hillsborough County April 2016 D-1 Mobility Fee Study
Mobility Fee Schedule
This appendix presents the detailed fee calculations for each land use in the Hillsborough
County mobility fee schedule. The differentiation of input variables is presented below:
Table D-1 – Urban Area Mobility Fee; does NOT include additional ½-percent sales tax
revenue credit
Table D-2 – Rural Area Mobility Fee; does NOT include additional ½-percent sales tax
revenue credit
Table D-3 – Urban Area Mobility Fee; includes additional sales tax revenues credit for
a 25-year period, based on a reasonable lifecycle of a roadway.
Table D-4 – Rural Area Mobility Fee; includes additional sales tax revenue credit for a
25-year period, based on a reasonable lifecycle of a roadway
Table D-5 – Urban Area Mobility Fee; includes additional sales tax revenue credit that
is assumed to be adopted for the next 20 years
Table D-6 – Rural Area Mobility Fee; includes additional sales tax revenue credit that
is assumed to be adopted for the next 20 years
Table D-7 – Urban Area Mobility Fee; includes additional sales tax revenue credit that
is assumed to be adopted for the next 30 years
Table D-8 – Rural Area Mobility Fee; includes additional sales tax revenue credit that
is assumed to be adopted for the next 30 years
Table D-9 – Urban Area Mobility Fee; includes additional sales tax revenue credit that
is assumed to be adopted for the next 10 years
Table D-10 – Rural Area Mobility Fee; includes additional sales tax revenue credit that
is assumed to be adopted for the next 10 years

Tindale Oliver Hillsborough County April 2016 D-2 Mobility Fee Study
Table D‐1 Mobility Fee Schedule – Urban Area; No Sales Tax
Gasoline Tax Unit Cost per Lane Mile: $4,962,000 Interstate/Toll Facility Adjustment Factor: 36.6%$$ per gallon to capital: $0.213 City Revenues: $0.007 Average PMC per Lane Mile: 12,350 12,350 Cost per PMC: $401.78
Facility life (years): 25 County Revenues: $0.087 Fuel Efficiency: 18.18 mpgInterest rate: 2.50% State Revenues: $0.119 Effectivedays per year: 365
ITE LUC Land Use Unit Trip Rate Trip Rate SourceAssessable Trip
LengthTotal Trip
LengthTrip Length Source
PercentNew Trips
% New Trips Source Net VMT(1) Person‐Trip Factor
Net PMTTotal
Mobility CostAnnualGas Tax
Gas Tax CreditNet
Mobility Fee
Current Impact
Fee Zone 7(2) % Change
RESIDENTIAL:
Single Family (Detached) - Less than 1,500 sf & Annual HH Income less than 50% SHIP Definition du 2.62
FL Studies(NHTS, AHS, Census) 6.62 7.12 FL Studies 100% n/a 5.50 1.30 7.15 $2,872 $40 $737 $2,135 $1,792 19%
Single Family (Detached) - Less than 1,500 sf & Annual HH Income between 50-80% SHIP Definition du 3.96
FL Studies(NHTS, AHS, Census) 6.62 7.12 FL Studies 100% n/a 8.31 1.30 10.80 $4,341 $60 $1,105 $3,236 $1,792 81%
Single Family (Detached) - Less than 1,500 sf du 6.11FL Studies
(NHTS, AHS, Census) 6.62 7.12 FL Studies 100% n/a 12.82 1.30 16.67 $6,697 $93 $1,713 $4,984 $1,792 178%
Single Family (Detached) - 1,501 to 2,499 sf du 7.81FL Studies
(NHTS, AHS, Census) 6.62 7.12 FL Studies 100% n/a 16.39 1.30 21.31 $8,561 $119 $2,193 $6,368 $1,792 255%
Single Family (Detached) - 2,500 sf and greater du 8.76FL Studies
(NHTS, AHS, Census) 6.62 7.12 FL Studies 100% n/a 18.38 1.30 23.89 $9,602 $133 $2,450 $7,152 $1,792 299%
Multi-Family (Apartment); 1-2 Stories - Annual HH Income less than 50% SHIP Definition du 2.38
Blend ITE 9th & FL Studies 5.10 5.60
FL Studies(LUC 220/230) 100% n/a 3.85 1.30 5.01 $2,010 $28 $516 $1,494 $1,242 20%
Multi-Family (Apartment); 1-2 Stories - Annual HH Income between 50-80% SHIP Definition du 3.60
Blend ITE 9th & FL Studies 5.10 5.60
FL Studies(LUC 220/230) 100% n/a 5.82 1.30 7.57 $3,040 $43 $792 $2,248 $1,242 81%
Multi-Family (Apartment); 1-2 Stories du 6.60Blend ITE 9th & FL
Studies 5.10 5.60FL Studies
(LUC 220/230) 100% n/a 10.67 1.30 13.87 $5,573 $79 $1,456 $4,117 $1,242 232%
Multi-Family (Apartment); 3+ Stories - Annual HH Income less than 50% SHIP Definition du 1.49
ITE 9th Edition (weighted avg) 5.10 5.60
FL Studies(LUC 220/230) 100% n/a 2.41 1.30 3.13 $1,258 $18 $332 $926 $1,242 -25%
Multi-Family (Apartment); 3+ Stories - Annual HH Income between 50-80% SHIP Definition du 2.25
ITE 9th Edition (weighted avg) 5.10 5.60
FL Studies(LUC 220/230) 100% n/a 3.64 1.30 4.73 $1,900 $27 $497 $1,403 $1,242 13%
Multi-Family (Apartment); 3+ Stories du 4.14ITE 9th Edition (weighted avg) 5.10 5.60
FL Studies(LUC 220/230) 100% n/a 6.69 1.30 8.70 $3,496 $50 $921 $2,575 $1,242 107%
230 Residential Condominium/Townhouse du 5.76Blend ITE 9th & FL
Studies 5.10 5.60FL Studies
(LUC 220/230) 100% n/a 9.31 1.30 12.10 $4,864 $69 $1,271 $3,593 $1,097 227%
232 High-Rise Condominium; 3+ Stories du 4.18 ITE 9th Edition 5.10 5.60FL Studies
(LUC 220/230) 100% n/a 6.76 1.30 8.79 $3,530 $50 $921 $2,609 $1,097 138%
240 Mobile Home Park du 4.17 FL Studies 4.60 5.10 FL Studies 100% n/a 6.08 1.30 7.90 $3,176 $45 $829 $2,347 $901 161%
253 Congregate Care Facility du 2.25Blend ITE 9th & FL
Studies 3.08 3.58 Same as LUC 210 72% FL Studies 1.58 1.30 2.05 $826 $12 $221 $605 n/a n/a
LODGING:
310 Hotel room 6.36Blend ITE 9th & FL
Studies 6.26 6.76 FL Studies 66% FL Studies 8.33 1.30 10.83 $4,351 $61 $1,124 $3,227 $1,546 109%
311 Hotel; All Suites room 4.90 ITE 9th Edition 6.26 6.76 Same as LUC 310 66% Same as LUC 310 6.42 1.30 8.35 $3,352 $47 $866 $2,486 $1,082 130%
320 Motel room 5.63 ITE 9th Edition 4.34 4.84 FL Studies 77% FL Studies 5.96 1.30 7.75 $3,115 $45 $829 $2,286 $1,579 45%
RECREATION:
412 General Recreation acre 2.28 ITE 9th Edition 5.11 5.61FL Studies
(Pinellas County) 90%FL Studies
(Pinellas County) 3.32 1.30 4.32 $1,736 $25 $461 $1,275 n/a n/a
416 RV Park(3) site 1.62ITE 9th Edition
(Adjusted) 4.60 5.10 Same as LUC 240 100%FL Studies
(Pinellas County) 2.36 1.30 3.07 $1,234 $18 $332 $902 n/a n/a
420 Marina boat berth 2.96 ITE 9th Edition 6.62 7.12 Same as LUC 210 90%FL Studies
(Pinellas County) 5.59 1.30 7.27 $2,920 $41 $755 $2,165 n/a n/a
430 Golf Course hole 35.74 ITE 9th Edition 6.62 7.12 Same as LUC 210 90%FL Studies
(Pinellas County) 67.50 1.30 87.75 $35,257 $490 $9,028 $26,229 $4,272 514%
444 Movie Theater screen 106.63Blend ITE 6th & FL
Studies 2.22 2.72 FL Studies 88% FL Studies 66.04 1.30 85.85 $34,491 $546 $10,060 $24,431 $9,164 167%
492 Health Club 1,000 sf 32.93 ITE 9th Edition 5.15 5.65 Same as LUC 710 94% FL Studies 50.53 1.30 65.69 $26,395 $374 $6,891 $19,504 n/a n/a
210
220
222/ 223

Tindale Oliver Hillsborough County April 2016 D-3 Mobility Fee Study
Table D‐1 (Continued)
Mobility Fee Schedule – Urban Area; No Sales Tax
ITE LUC Land Use Unit Trip Rate Trip Rate SourceAssessable Trip
LengthTotal Trip
LengthTrip Length Source
PercentNew Trips
% New Trips Source Net VMT(1) Person‐Trip Factor
Net PMTTotal
Mobility CostAnnualGas Tax
Gas Tax CreditNet
Mobility FeeCurrent Impact
Fee Zone 7(2) % Change
INSTITUTIONS:
520 Elementary School (Private) student 1.29 ITE 9th Edition 4.30 4.80FL Studies
(Pinellas County) 80%FL Studies
(Pinellas County) 1.41 1.30 1.83 $735 $11 $203 $532 $61 772%
522 Middle School (Private) student 1.62 ITE 9th Edition 4.30 4.80FL Studies
(Pinellas County) 90%FL Studies
(Pinellas County) 1.99 1.30 2.59 $1,038 $15 $276 $762 n/a n/a
530 High School (Private) student 1.71 ITE 9th Edition 4.30 4.80FL Studies
(Pinellas County) 90%FL Studies
(Pinellas County) 2.10 1.30 2.73 $1,096 $16 $295 $801 n/a n/a
540University/Junior College (7,500 or fewer students) (Private) student 2.00 ITE Regression Analysis 6.62 7.12 Same as LUC 210 90%
FL Studies(Pinellas County) 3.78 1.30 4.91 $1,973 $27 $497 $1,476 n/a n/a
550University/Junior College (more than 7,500 students) (Private) student 1.50 ITE Regression Analysis 6.62 7.12 Same as LUC 210 90%
FL Studies(Pinellas County) 2.83 1.30 3.68 $1,480 $21 $387 $1,093 n/a n/a
560 Church 1,000 sf 9.11 ITE 9th Edition 3.90 4.40FL Studies
(Pinellas County) 90%FL Studies
(Pinellas County) 10.14 1.30 13.18 $5,294 $77 $1,419 $3,875 $544 612%
565 Day Care Center 1,000 sf 71.88Blend ITE 9th & FL
Studies 2.03 2.53 FL Studies 73% FL Studies 33.77 1.30 43.90 $17,637 $284 $5,233 $12,404 $1,500 727%
610 Hospital 1,000 sf 13.22 ITE 9th Edition 6.62 7.12 Same as LUC 210 77%FL Studies
(Pinellas County) 21.36 1.30 27.77 $11,158 $155 $2,856 $8,302 unit change n/a
620 Nursing Home bed 2.76Blend ITE 9th & FL
Studies 2.59 3.09 FL Studies 89% FL Studies 2.02 1.30 2.63 $1,053 $16 $295 $758 $194 291%
630 Clinic 1,000 sf 33.22Blend ITE 9th & FL
Studies 5.10 5.60 FL Studies 93% FL Studies 49.95 1.30 64.94 $26,088 $370 $6,817 $19,271 $1,880 925%
OFFICE:
General Office 50,000 sq ft or less(4) 1,000 sf 15.50 ITE 9th equation 5.15 5.65 FL Studies 92% FL Studies 23.28 1.30 30.26 $12,160 $172 $3,169 $8,991 $3,728 141%
General Office 50,001-100,000 sq ft(4) 1,000 sf 13.13 ITE 9th equation 5.15 5.65 FL Studies 92% FL Studies 19.72 1.30 25.64 $10,300 $146 $2,690 $7,610 $2,300 231%
General Office 100,001-200,000 sq ft(4) 1,000 sf 11.12 ITE 9th equation 5.15 5.65 FL Studies 92% FL Studies 16.70 1.30 21.71 $8,724 $124 $2,285 $6,439 $1,958 229%
General Office 200,001-400,000 sq ft(4) 1,000 sf 9.41 ITE 9th equation 5.15 5.65 FL Studies 92% FL Studies 14.13 1.30 18.37 $7,382 $105 $1,935 $5,447 $1,958 178%
General Office greater that 400,000 sq ft(4) 1,000 sf 8.54 ITE 9th equation 5.15 5.65 FL Studies 92% FL Studies 12.83 1.30 16.68 $6,700 $95 $1,750 $4,950 $1,958 153%
715 Single Tenant Office Building 1,000 sf 11.65 ITE 9th equation 5.15 5.65 Same as LUC 710 92% Same as LUC 710 17.50 1.30 22.75 $9,139 $129 $2,377 $6,762 $2,005 237%
720 Medical Office 10,000 sq ft or less 1,000 sf 23.83 FL Studies 5.55 6.05 FL Studies 89% FL Studies 37.31 1.30 48.50 $19,489 $274 $5,048 $14,441 $6,262 131%
720 Medical Office greater than 10,000 sq ft 1,000 sf 34.72Blend ITE 9th & FL
Studies 5.55 6.05 FL Studies 89% FL Studies 54.37 1.30 70.68 $28,396 $400 $7,370 $21,026 $6,262 236%
RETAIL:
813 Discount Superstore 1,000 sf 50.82 ITE 9th Edition 2.40 2.90Same as LUC 820(50k-200k sq ft) 67%
Same as LUC 820(50k-200k sq ft) 25.90 1.30 33.67 $13,530 $211 $3,888 $9,642 $2,807 244%
815 Discount Store; Free-Standing 1,000 sf 57.24 ITE 9th Edition 2.40 2.90Same as LUC 820(50k-200k sq ft) 67%
Same as LUC 820(50k-200k sq ft) 29.18 1.30 37.93 $15,240 $238 $4,385 $10,855 $3,384 221%
Shopping Center 50,000 sq ft or less(4)(5) 1,000 sfgla 86.56 ITE 9th equation 1.87 2.37 TL Regression 56% FL Curve 28.73 1.30 37.35 $15,009 $246 $4,532 $10,477 $1,565 570%
Shopping Center 50,001-200,000 sq ft(4)(5) 1,000 sfgla 53.28 ITE 9th equation 2.40 2.90 TL Regression 67% FL Curve 27.16 1.30 35.31 $14,185 $221 $4,072 $10,113 $3,181 218%
Shopping Center 200,001-400,000 sq ft(4)(5) 1,000 sfgla 41.80 ITE 9th equation 2.64 3.14 TL Regression 73% FL Curve 25.54 1.30 33.20 $13,338 $205 $3,777 $9,561 $5,504 74%
Shopping Center greater than 400,000 sq ft(4)(5) 1,000 sfgla 36.27 ITE 9th equation 2.87 3.37 TL Regression 76% FL Curve 25.08 1.30 32.60 $13,099 $199 $3,666 $9,433 $5,504 71%
841 New/Used Auto Sales 1,000 sf 28.25Blend ITE 9th & FL
Studies 4.60 5.10 FL Studies 79% FL Studies 32.54 1.30 42.30 $16,998 $243 $4,477 $12,521 $4,482 179%
853 Convenience Market w/Gasoline 1,000 sf 775.14Blend ITE 9th & FL
Studies 1.51 2.01 FL Studies 28% FL Studies 103.89 1.30 135.06 $54,263 $933 $17,190 $37,073 $7,581 389%
820
710

Tindale Oliver Hillsborough County April 2016 D-4 Mobility Fee Study
Table D‐1 (Continued) Mobility Fee Schedule – Urban Area; No Sales Tax
1) Net VMT calculated as ((Trip Generation Rate* Trip Length* % New Trips)*(1-Interstate/Toll Facility Adjustment Factor)/2). This reflects the unit of vehicle miles of capacity consumed per unit of development and is multiplied by the cost per vehicle 2) Source: Hillsborough County Department of Development Services; Fees shown for Zone 7 3) The ITE 9th Edition trip generation rate was adjusted to reflect the average occupancy rate of 60 percent based on data provided by the Florida Association of RV Parks and Campgrounds 4) The trip generation rates recommended for the offices and shopping centers use the end-point regression value 5) In the case of shopping centers with up to 300,000 square feet, fast-food, convenience store, and gas stations located on outparcels should be charged separately using their individual categories, as opposed to the general shopping center rate
ITE LUC Land Use Unit Trip Rate Trip Rate SourceAssessable Trip
LengthTotal Trip
LengthTrip Length Source
PercentNew Trips
% New Trips Source Net VMT(1) Person‐Trip Factor
Net PMTTotal
Mobility CostAnnualGas Tax
Gas Tax CreditNet
Mobility FeeCurrent Impact
Fee Zone 7(2) % Change
RETAIL:
857 Discount Club 1,000 sf 41.80 ITE 9th Edition 2.40 2.90Same as LUC 820(50k-200k sq ft) 67%
Same as LUC 820(50k-200k sq ft) 21.31 1.30 27.70 $11,129 $174 $3,206 $7,923 $2,498 217%
862 Home Improvement Superstore 1,000 sf 30.74 ITE 9th Edition 2.40 2.90Same as LUC 820(50k-200k sq ft) 67%
Same as LUC 820(50k-200k sq ft) 15.67 1.30 20.37 $8,184 $128 $2,358 $5,826 $2,095 178%
863 Electronics Superstore 1,000 sf 45.04 ITE 9th Edition 1.87 2.37Same as LUC 820(50k sq ft or less) 56%
Same as LUC 820(50k sq ft or less) 14.95 1.30 19.44 $7,809 $128 $2,358 $5,451 $2,692 103%
880/881 Pharmacy/Drug Store with & without Drive-Thru 1,000 sf 95.96
Blend ITE 9th & FL Studies 2.08 2.58 FL Studies 32% FL Studies 20.25 1.30 26.33 $10,575 $169 $3,114 $7,461 $5,269 42%
890 Furniture Store 1,000 sf 5.06 ITE 9th Edition 6.09 6.59 FL Studies 54% FL Studies 5.27 1.30 6.85 $2,755 $39 $719 $2,036 $605 237%
912 Bank/Savings Drive-In 1,000 sf 159.34Blend ITE 9th & FL
Studies 2.46 2.96 FL Studies 46% FL Studies 57.16 1.30 74.31 $29,855 $464 $8,549 $21,306 $15,850 34%
931 Quality Restaurant 1,000 sf 91.10Blend ITE 9th & FL
Studies 3.14 3.64 FL Studies 77% FL Studies 69.82 1.30 90.77 $36,470 $546 $10,060 $26,410 $10,752 146%
932 High-Turn Over Restaurant 1,000 sf 116.60Blend ITE 9th & FL
Studies 3.17 3.67 FL Studies 71% FL Studies 83.19 1.30 108.15 $43,452 $650 $11,976 $31,476 $7,790 304%
934 Fast Food Restaurant w/Drive-Thru 1,000 sf 511.00Blend ITE 9th & FL
Studies 2.05 2.55 FL Studies 58% FL Studies 192.60 1.30 250.38 $100,599 $1,616 $29,774 $70,825 $9,389 654%
942 Automobile Care Center 1,000 sf 31.43Blend ITE 9th & FL
Studies 3.62 4.12 FL Studies 72% FL Studies 25.97 1.30 33.76 $13,564 $199 $3,666 $9,898 n/a n/a
944/946 Gas/Service Station with & without Car Wash fuel pos. 157.33
ITE 9th Edition(944 & 946 Blend) 1.90 2.40 FL Studies 23% FL Studies 21.79 1.30 28.33 $11,384 $186 $3,427 $7,957 $1,511 427%
947 Self-Service Car Wash service bay 43.94Blend ITE 9th & FL
Studies 2.18 2.68 FL Studies 68% FL Studies 20.65 1.30 26.85 $10,785 $171 $3,151 $7,634 $6,455 18%
INDUSTRIAL:
110 General Light Industrial 1,000 sf 6.97 ITE 9th Edition 5.15 5.65 Same as LUC 710 92% Same as LUC 710 10.47 1.30 13.61 $5,468 $77 $1,419 $4,049 $1,208 235%
120 General Heavy Industrial 1,000 sf 1.50 ITE 9th Edition 5.15 5.65 Same as LUC 710 92% Same as LUC 710 2.25 1.30 2.93 $1,177 $17 $313 $864 $1,208 -29%
140 Manufacturing 1,000 sf 3.82 ITE 9th Edition 5.15 5.65 Same as LUC 710 92% Same as LUC 710 5.74 1.30 7.46 $2,997 $42 $774 $2,223 $1,208 84%
150 Warehousing 1,000 sf 3.56 ITE 9th Edition 5.15 5.65 Same as LUC 710 92% Same as LUC 710 5.35 1.30 6.96 $2,793 $40 $737 $2,056 $860 139%
151 Mini-Warehouse 1,000 sf 2.15Blend ITE 9th & FL
Studies 3.10 3.60FL Studies
(Pinellas County) 92% Same as LUC 710 1.94 1.30 2.52 $1,015 $15 $276 $739 $433 71%
152 High-Cube Warehouse 1,000 sf 1.68 ITE 9th Edition 5.15 5.65 Same as LUC 710 92% Same as LUC 710 2.52 1.30 3.28 $1,318 $19 $350 $968 n/a n/a

Tindale Oliver Hillsborough County April 2016 D-5 Mobility Fee Study
Table D‐2 Mobility Fee Schedule – Rural Area; No Sales Tax
Gasoline Tax Unit Cost per Lane Mile: $4,962,000 Interstate/Toll Facility Adjustment Factor: 36.6%$$ per gallon to capital: $0.213 City Revenues: $0.007 Average PMC per Lane Mile: 9,263 10,806 Cost per PMC (Residential/Office/Industrial): $535.71
Facility life (years): 25 County Revenues: $0.087 Fuel Efficiency: 18.18 mpg Cost per PMC (Other Non-Residential): $459.18Interest rate: 2.50% State Revenues: $0.119 Effectivedays per year: 365
ITE LUC Land Use Unit Trip Rate Trip Rate SourceAssessable Trip
LengthTotal Trip
LengthTrip Length Source
PercentNew Trips
% New Trips Source Net VMT(1) Person‐Trip Factor
Net PMTTotal
Mobility CostAnnualGas Tax
Gas Tax CreditNet
Mobility Fee
Current Impact
Fee Zone 7(2) % Change
RESIDENTIAL:
Single Family (Detached) - Less than 1,500 sf & Annual HH Income less than 50% SHIP Definition du 2.62
FL Studies(NHTS, AHS, Census) 6.62 7.12 FL Studies 100% n/a 5.50 1.30 7.15 $3,829 $40 $737 $3,092 $1,792 73%
Single Family (Detached) - Less than 1,500 sf & Annual HH Income between 50-80% SHIP Definition du 3.96
FL Studies(NHTS, AHS, Census) 6.62 7.12 FL Studies 100% n/a 8.31 1.30 10.80 $5,787 $60 $1,105 $4,682 $1,792 161%
Single Family (Detached) - Less than 1,500 sf du 6.11FL Studies
(NHTS, AHS, Census) 6.62 7.12 FL Studies 100% n/a 12.82 1.30 16.67 $8,930 $93 $1,713 $7,217 $1,792 303%
Single Family (Detached) - 1,501 to 2,499 sf du 7.81FL Studies
(NHTS, AHS, Census) 6.62 7.12 FL Studies 100% n/a 16.39 1.30 21.31 $11,414 $119 $2,193 $9,221 $1,792 415%
Single Family (Detached) - 2,500 sf and greater du 8.76FL Studies
(NHTS, AHS, Census) 6.62 7.12 FL Studies 100% n/a 18.38 1.30 23.89 $12,802 $133 $2,450 $10,352 $1,792 478%
Multi-Family (Apartment); 1-2 Stories - Annual HH Income less than 50% SHIP Definition du 2.38
Blend ITE 9th & FL Studies 5.10 5.60
FL Studies(LUC 220/230) 100% n/a 3.85 1.30 5.01 $2,680 $28 $516 $2,164 $1,242 74%
Multi-Family (Apartment); 1-2 Stories - Annual HH Income between 50-80% SHIP Definition du 3.60
Blend ITE 9th & FL Studies 5.10 5.60
FL Studies(LUC 220/230) 100% n/a 5.82 1.30 7.57 $4,053 $43 $792 $3,261 $1,242 163%
Multi-Family (Apartment); 1-2 Stories du 6.60Blend ITE 9th & FL
Studies 5.10 5.60FL Studies
(LUC 220/230) 100% n/a 10.67 1.30 13.87 $7,431 $79 $1,456 $5,975 $1,242 381%
Multi-Family (Apartment); 3+ Stories - Annual HH Income less than 50% SHIP Definition du 1.49
ITE 9th Edition (weighted avg) 5.10 5.60
FL Studies(LUC 220/230) 100% n/a 2.41 1.30 3.13 $1,678 $18 $332 $1,346 $1,242 8%
Multi-Family (Apartment); 3+ Stories - Annual HH Income between 50-80% SHIP Definition du 2.25
ITE 9th Edition (weighted avg) 5.10 5.60
FL Studies(LUC 220/230) 100% n/a 3.64 1.30 4.73 $2,533 $27 $497 $2,036 $1,242 64%
Multi-Family (Apartment); 3+ Stories du 4.14ITE 9th Edition (weighted avg) 5.10 5.60
FL Studies(LUC 220/230) 100% n/a 6.69 1.30 8.70 $4,661 $50 $921 $3,740 $1,242 201%
230 Residential Condominium/Townhouse du 5.76Blend ITE 9th & FL
Studies 5.10 5.60FL Studies
(LUC 220/230) 100% n/a 9.31 1.30 12.10 $6,485 $69 $1,271 $5,214 $1,097 375%
232 High-Rise Condominium; 3+ Stories du 4.18 ITE 9th Edition 5.10 5.60FL Studies
(LUC 220/230) 100% n/a 6.76 1.30 8.79 $4,706 $50 $921 $3,785 $1,097 245%
240 Mobile Home Park du 4.17 FL Studies 4.60 5.10 FL Studies 100% n/a 6.08 1.30 7.90 $4,235 $45 $829 $3,406 $901 278%
253 Congregate Care Facility du 2.25Blend ITE 9th & FL
Studies 3.08 3.58 Same as LUC 210 72% FL Studies 1.58 1.30 2.05 $1,102 $12 $221 $881 n/a n/a
LODGING:
310 Hotel room 6.36Blend ITE 9th & FL
Studies 6.26 6.76 FL Studies 66% FL Studies 8.33 1.30 10.83 $4,972 $61 $1,124 $3,848 $1,546 149%
311 Hotel; All Suites room 4.90 ITE 9th Edition 6.26 6.76 Same as LUC 310 66% Same as LUC 310 6.42 1.30 8.35 $3,831 $47 $866 $2,965 $1,082 174%
320 Motel room 5.63 ITE 9th Edition 4.34 4.84 FL Studies 77% FL Studies 5.96 1.30 7.75 $3,560 $45 $829 $2,731 $1,579 73%
RECREATION:
412 General Recreation acre 2.28 ITE 9th Edition 5.11 5.61FL Studies
(Pinellas County) 90%FL Studies
(Pinellas County) 3.32 1.30 4.32 $1,984 $25 $461 $1,523 n/a n/a
416 RV Park(3) site 1.62ITE 9th Edition
(Adjusted) 4.60 5.10 Same as LUC 240 100%FL Studies
(Pinellas County) 2.36 1.30 3.07 $1,410 $18 $332 $1,078 n/a n/a
420 Marina boat berth 2.96 ITE 9th Edition 6.62 7.12 Same as LUC 210 90%FL Studies
(Pinellas County) 5.59 1.30 7.27 $3,337 $41 $755 $2,582 n/a n/a
430 Golf Course hole 35.74 ITE 9th Edition 6.62 7.12 Same as LUC 210 90%FL Studies
(Pinellas County) 67.50 1.30 87.75 $40,294 $490 $9,028 $31,266 $4,272 632%
444 Movie Theater screen 106.63Blend ITE 6th & FL
Studies 2.22 2.72 FL Studies 88% FL Studies 66.04 1.30 85.85 $39,418 $546 $10,060 $29,358 $9,164 220%
492 Health Club 1,000 sf 32.93 ITE 9th Edition 5.15 5.65 Same as LUC 710 94% FL Studies 50.53 1.30 65.69 $30,166 $374 $6,891 $23,275 n/a n/a
210
220
222/ 223

Tindale Oliver Hillsborough County April 2016 D-6 Mobility Fee Study
Table D‐2 (continued) Mobility Fee Schedule – Rural Area; No Sales Tax
ITE LUC Land Use Unit Trip Rate Trip Rate SourceAssessable Trip
LengthTotal Trip
LengthTrip Length Source
PercentNew Trips
% New Trips Source Net VMT(1) Person‐Trip Factor
Net PMTTotal
Mobility CostAnnualGas Tax
Gas Tax CreditNet
Mobility FeeCurrent Impact
Fee Zone 7(2) % Change
INSTITUTIONS:
520 Elementary School (Private) student 1.29 ITE 9th Edition 4.30 4.80FL Studies
(Pinellas County) 80%FL Studies
(Pinellas County) 1.41 1.30 1.83 $840 $11 $203 $637 $61 944%
522 Middle School (Private) student 1.62 ITE 9th Edition 4.30 4.80FL Studies
(Pinellas County) 90%FL Studies
(Pinellas County) 1.99 1.30 2.59 $1,186 $15 $276 $910 n/a n/a
530 High School (Private) student 1.71 ITE 9th Edition 4.30 4.80FL Studies
(Pinellas County) 90%FL Studies
(Pinellas County) 2.10 1.30 2.73 $1,252 $16 $295 $957 n/a n/a
540University/Junior College (7,500 or fewer students) (Private) student 2.00 ITE Regression Analysis 6.62 7.12 Same as LUC 210 90%
FL Studies(Pinellas County) 3.78 1.30 4.91 $2,255 $27 $497 $1,758 n/a n/a
550University/Junior College (more than 7,500 students) (Private) student 1.50 ITE Regression Analysis 6.62 7.12 Same as LUC 210 90%
FL Studies(Pinellas County) 2.83 1.30 3.68 $1,691 $21 $387 $1,304 n/a n/a
560 Church 1,000 sf 9.11 ITE 9th Edition 3.90 4.40FL Studies
(Pinellas County) 90%FL Studies
(Pinellas County) 10.14 1.30 13.18 $6,051 $77 $1,419 $4,632 $544 752%
565 Day Care Center 1,000 sf 71.88Blend ITE 9th & FL
Studies 2.03 2.53 FL Studies 73% FL Studies 33.77 1.30 43.90 $20,156 $284 $5,233 $14,923 $1,500 895%
610 Hospital 1,000 sf 13.22 ITE 9th Edition 6.62 7.12 Same as LUC 210 77%FL Studies
(Pinellas County) 21.36 1.30 27.77 $12,752 $155 $2,856 $9,896 unit change n/a
620 Nursing Home bed 2.76Blend ITE 9th & FL
Studies 2.59 3.09 FL Studies 89% FL Studies 2.02 1.30 2.63 $1,204 $16 $295 $909 $194 369%
630 Clinic 1,000 sf 33.22Blend ITE 9th & FL
Studies 5.10 5.60 FL Studies 93% FL Studies 49.95 1.30 64.94 $29,815 $370 $6,817 $22,998 $1,880 1123%
OFFICE:
General Office 50,000 sq ft or less(4) 1,000 sf 15.50 ITE 9th equation 5.15 5.65 FL Studies 92% FL Studies 23.28 1.30 30.26 $16,213 $172 $3,169 $13,044 $3,728 250%
General Office 50,001-100,000 sq ft(4) 1,000 sf 13.13 ITE 9th equation 5.15 5.65 FL Studies 92% FL Studies 19.72 1.30 25.64 $13,734 $146 $2,690 $11,044 $2,300 380%
General Office 100,001-200,000 sq ft(4) 1,000 sf 11.12 ITE 9th equation 5.15 5.65 FL Studies 92% FL Studies 16.70 1.30 21.71 $11,631 $124 $2,285 $9,346 $1,958 377%
General Office 200,001-400,000 sq ft(4) 1,000 sf 9.41 ITE 9th equation 5.15 5.65 FL Studies 92% FL Studies 14.13 1.30 18.37 $9,843 $105 $1,935 $7,908 $1,958 304%
General Office greater that 400,000 sq ft(4) 1,000 sf 8.54 ITE 9th equation 5.15 5.65 FL Studies 92% FL Studies 12.83 1.30 16.68 $8,933 $95 $1,750 $7,183 $1,958 267%
715 Single Tenant Office Building 1,000 sf 11.65 ITE 9th equation 5.15 5.65 Same as LUC 710 92% Same as LUC 710 17.50 1.30 22.75 $12,186 $129 $2,377 $9,809 $2,005 389%
720 Medical Office 10,000 sq ft or less 1,000 sf 23.83 FL Studies 5.55 6.05 FL Studies 89% FL Studies 37.31 1.30 48.50 $25,986 $274 $5,048 $20,938 $6,262 234%
720 Medical Office greater than 10,000 sq ft 1,000 sf 34.72Blend ITE 9th & FL
Studies 5.55 6.05 FL Studies 89% FL Studies 54.37 1.30 70.68 $37,861 $400 $7,370 $30,491 $6,262 387%
RETAIL:
813 Discount Superstore 1,000 sf 50.82 ITE 9th Edition 2.40 2.90Same as LUC 820(50k-200k sq ft) 67%
Same as LUC 820(50k-200k sq ft) 25.90 1.30 33.67 $15,463 $211 $3,888 $11,575 $2,807 312%
815 Discount Store; Free-Standing 1,000 sf 57.24 ITE 9th Edition 2.40 2.90Same as LUC 820(50k-200k sq ft) 67%
Same as LUC 820(50k-200k sq ft) 29.18 1.30 37.93 $17,417 $238 $4,385 $13,032 $3,384 285%
Shopping Center 50,000 sq ft or less(4)(5) 1,000 sfgla 86.56 ITE 9th equation 1.87 2.37 TL Regression 56% FL Curve 28.73 1.30 37.35 $17,153 $246 $4,532 $12,621 $1,565 707%
Shopping Center 50,001-200,000 sq ft(4)(5) 1,000 sfgla 53.28 ITE 9th equation 2.40 2.90 TL Regression 67% FL Curve 27.16 1.30 35.31 $16,212 $221 $4,072 $12,140 $3,181 282%
Shopping Center 200,001-400,000 sq ft(4)(5) 1,000 sfgla 41.80 ITE 9th equation 2.64 3.14 TL Regression 73% FL Curve 25.54 1.30 33.20 $15,244 $205 $3,777 $11,467 $5,504 108%
Shopping Center greater than 400,000 sq ft(4)(5) 1,000 sfgla 36.27 ITE 9th equation 2.87 3.37 TL Regression 76% FL Curve 25.08 1.30 32.60 $14,970 $199 $3,666 $11,304 $5,504 105%
841 New/Used Auto Sales 1,000 sf 28.25Blend ITE 9th & FL
Studies 4.60 5.10 FL Studies 79% FL Studies 32.54 1.30 42.30 $19,426 $243 $4,477 $14,949 $4,482 234%
853 Convenience Market w/Gasoline 1,000 sf 775.14Blend ITE 9th & FL
Studies 1.51 2.01 FL Studies 28% FL Studies 103.89 1.30 135.06 $62,015 $933 $17,190 $44,825 $7,581 491%
710
820

Tindale Oliver Hillsborough County April 2016 D-7 Mobility Fee Study
Table D‐2 (continued) Mobility Fee Schedule – Rural Area; No Sales Tax
1) Net VMT calculated as ((Trip Generation Rate* Trip Length* % New Trips)*(1-Interstate/Toll Facility Adjustment Factor)/2). This reflects the unit of vehicle miles of capacity consumed per unit of development and is multiplied by the cost per vehicle 2) Source: Hillsborough County Department of Development Services; Fees shown for Zone 7 3) The ITE 9th Edition trip generation rate was adjusted to reflect the average occupancy rate of 60 percent based on data provided by the Florida Association of RV Parks and Campgrounds 4) The trip generation rates recommended for the offices and shopping centers use the end-point regression value 5) In the case of shopping centers with up to 300,000 square feet, fast-food, convenience store, and gas stations located on outparcels should be charged separately using their individual categories, as opposed to the general shopping center rate
ITE LUC Land Use Unit Trip Rate Trip Rate SourceAssessable Trip
LengthTotal Trip
LengthTrip Length Source
PercentNew Trips
% New Trips Source Net VMT(1) Person‐Trip Factor
Net PMTTotal
Mobility CostAnnualGas Tax
Gas Tax CreditNet
Mobility FeeCurrent Impact
Fee Zone 7(2) % Change
RETAIL:
857 Discount Club 1,000 sf 41.80 ITE 9th Edition 2.40 2.90Same as LUC 820(50k-200k sq ft) 67%
Same as LUC 820(50k-200k sq ft) 21.31 1.30 27.70 $12,719 $174 $3,206 $9,513 $2,498 281%
862 Home Improvement Superstore 1,000 sf 30.74 ITE 9th Edition 2.40 2.90Same as LUC 820(50k-200k sq ft) 67%
Same as LUC 820(50k-200k sq ft) 15.67 1.30 20.37 $9,354 $128 $2,358 $6,996 $2,095 234%
863 Electronics Superstore 1,000 sf 45.04 ITE 9th Edition 1.87 2.37Same as LUC 820(50k sq ft or less) 56%
Same as LUC 820(50k sq ft or less) 14.95 1.30 19.44 $8,925 $128 $2,358 $6,567 $2,692 144%
880/881 Pharmacy/Drug Store with & without Drive-Thru 1,000 sf 95.96
Blend ITE 9th & FL Studies 2.08 2.58 FL Studies 32% FL Studies 20.25 1.30 26.33 $12,086 $169 $3,114 $8,972 $5,269 70%
890 Furniture Store 1,000 sf 5.06 ITE 9th Edition 6.09 6.59 FL Studies 54% FL Studies 5.27 1.30 6.85 $3,149 $39 $719 $2,430 $605 302%
912 Bank/Savings Drive-In 1,000 sf 159.34Blend ITE 9th & FL
Studies 2.46 2.96 FL Studies 46% FL Studies 57.16 1.30 74.31 $34,119 $464 $8,549 $25,570 $15,850 61%
931 Quality Restaurant 1,000 sf 91.10Blend ITE 9th & FL
Studies 3.14 3.64 FL Studies 77% FL Studies 69.82 1.30 90.77 $41,680 $546 $10,060 $31,620 $10,752 194%
932 High-Turn Over Restaurant 1,000 sf 116.60Blend ITE 9th & FL
Studies 3.17 3.67 FL Studies 71% FL Studies 83.19 1.30 108.15 $49,659 $650 $11,976 $37,683 $7,790 384%
934 Fast Food Restaurant w/Drive-Thru 1,000 sf 511.00Blend ITE 9th & FL
Studies 2.05 2.55 FL Studies 58% FL Studies 192.60 1.30 250.38 $114,971 $1,616 $29,774 $85,197 $9,389 807%
942 Automobile Care Center 1,000 sf 31.43Blend ITE 9th & FL
Studies 3.62 4.12 FL Studies 72% FL Studies 25.97 1.30 33.76 $15,501 $199 $3,666 $11,835 n/a n/a
944/946 Gas/Service Station with & without Car Wash fuel pos. 157.33
ITE 9th Edition(944 & 946 Blend) 1.90 2.40 FL Studies 23% FL Studies 21.79 1.30 28.33 $13,010 $186 $3,427 $9,583 $1,511 534%
947 Self-Service Car Wash service bay 43.94Blend ITE 9th & FL
Studies 2.18 2.68 FL Studies 68% FL Studies 20.65 1.30 26.85 $12,326 $171 $3,151 $9,175 $6,455 42%
INDUSTRIAL:
110 General Light Industrial 1,000 sf 6.97 ITE 9th Edition 5.15 5.65 Same as LUC 710 92% Same as LUC 710 10.47 1.30 13.61 $7,291 $77 $1,419 $5,872 $1,208 386%
120 General Heavy Industrial 1,000 sf 1.50 ITE 9th Edition 5.15 5.65 Same as LUC 710 92% Same as LUC 710 2.25 1.30 2.93 $1,569 $17 $313 $1,256 $1,208 4%
140 Manufacturing 1,000 sf 3.82 ITE 9th Edition 5.15 5.65 Same as LUC 710 92% Same as LUC 710 5.74 1.30 7.46 $3,996 $42 $774 $3,222 $1,208 167%
150 Warehousing 1,000 sf 3.56 ITE 9th Edition 5.15 5.65 Same as LUC 710 92% Same as LUC 710 5.35 1.30 6.96 $3,724 $40 $737 $2,987 $860 247%
151 Mini-Warehouse 1,000 sf 2.15Blend ITE 9th & FL
Studies 3.10 3.60FL Studies
(Pinellas County) 92% Same as LUC 710 1.94 1.30 2.52 $1,354 $15 $276 $1,078 $433 149%
152 High-Cube Warehouse 1,000 sf 1.68 ITE 9th Edition 5.15 5.65 Same as LUC 710 92% Same as LUC 710 2.52 1.30 3.28 $1,757 $19 $350 $1,407 n/a n/a

Tindale Oliver Hillsborough County April 2016 D-8 Mobility Fee Study
Table D‐3 Mobility Fee Schedule – Urban Area; ½% Sales Tax
Gasoline Tax Unit Cost per Lane Mile: $4,962,000 Interstate/Toll Facility Adjustment Factor: 36.6%$$ per gallon to capital: $0.387 City Revenues: $0.021 Average PMC per Lane Mile: 12,350 12,350 Cost per PMC: $401.78
Facility life (years): 25 County Revenues: $0.247 Fuel Efficiency: 18.18 mpgInterest rate: 2.50% State Revenues: $0.119 Effectivedays per year: 365
ITE LUC Land Use Unit Trip Rate Trip Rate SourceAssessable Trip
LengthTotal Trip
LengthTrip Length Source
PercentNew Trips
% New Trips Source Net VMT(1) Person‐Trip Factor
Net PMTTotal
Mobility CostAnnualGas Tax
Gas Tax CreditNet
Mobility FeeCurrent Impact
Fee Zone 7(2) % Change
RESIDENTIAL:
Single Family (Detached) - Less than 1,500 sf & Annual HH Income less than 50% SHIP Definition du 2.62
FL Studies(NHTS, AHS, Census) 6.62 7.12 FL Studies 100% n/a 5.50 1.30 7.15 $2,872 $72 $1,327 $1,545 $1,792 -14%
Single Family (Detached) - Less than 1,500 sf & Annual HH Income between 50-80% SHIP Definition du 3.96
FL Studies(NHTS, AHS, Census) 6.62 7.12 FL Studies 100% n/a 8.31 1.30 10.80 $4,341 $110 $2,027 $2,314 $1,792 29%
Single Family (Detached) - Less than 1,500 sf du 6.11FL Studies
(NHTS, AHS, Census) 6.62 7.12 FL Studies 100% n/a 12.82 1.30 16.67 $6,697 $169 $3,114 $3,583 $1,792 100%
Single Family (Detached) - 1,501 to 2,499 sf du 7.81FL Studies
(NHTS, AHS, Census) 6.62 7.12 FL Studies 100% n/a 16.39 1.30 21.31 $8,561 $216 $3,980 $4,581 $1,792 156%
Single Family (Detached) - 2,500 sf and greater du 8.76FL Studies
(NHTS, AHS, Census) 6.62 7.12 FL Studies 100% n/a 18.38 1.30 23.89 $9,602 $242 $4,459 $5,143 $1,792 187%
Multi-Family (Apartment); 1-2 Stories - Annual HH Income less than 50% SHIP Definition du 2.38
Blend ITE 9th & FL Studies 5.10 5.60
FL Studies(LUC 220/230) 100% n/a 3.85 1.30 5.01 $2,010 $52 $958 $1,052 $1,242 -15%
Multi-Family (Apartment); 1-2 Stories - Annual HH Income between 50-80% SHIP Definition du 3.60
Blend ITE 9th & FL Studies 5.10 5.60
FL Studies(LUC 220/230) 100% n/a 5.82 1.30 7.57 $3,040 $78 $1,437 $1,603 $1,242 29%
Multi-Family (Apartment); 1-2 Stories du 6.60Blend ITE 9th & FL
Studies 5.10 5.60FL Studies
(LUC 220/230) 100% n/a 10.67 1.30 13.87 $5,573 $144 $2,653 $2,920 $1,242 135%
Multi-Family (Apartment); 3+ Stories - Annual HH Income less than 50% SHIP Definition du 1.49
ITE 9th Edition (weighted avg) 5.10 5.60
FL Studies(LUC 220/230) 100% n/a 2.41 1.30 3.13 $1,258 $32 $590 $668 $1,242 -46%
Multi-Family (Apartment); 3+ Stories - Annual HH Income between 50-80% SHIP Definition du 2.25
ITE 9th Edition (weighted avg) 5.10 5.60
FL Studies(LUC 220/230) 100% n/a 3.64 1.30 4.73 $1,900 $49 $903 $997 $1,242 -20%
Multi-Family (Apartment); 3+ Stories du 4.14ITE 9th Edition (weighted avg) 5.10 5.60
FL Studies(LUC 220/230) 100% n/a 6.69 1.30 8.70 $3,496 $90 $1,658 $1,838 $1,242 48%
230 Residential Condominium/Townhouse du 5.76Blend ITE 9th & FL
Studies 5.10 5.60FL Studies
(LUC 220/230) 100% n/a 9.31 1.30 12.10 $4,864 $125 $2,303 $2,561 $1,097 133%
232 High-Rise Condominium; 3+ Stories du 4.18 ITE 9th Edition 5.10 5.60FL Studies
(LUC 220/230) 100% n/a 6.76 1.30 8.79 $3,530 $91 $1,677 $1,853 $1,097 69%
240 Mobile Home Park du 4.17 FL Studies 4.60 5.10 FL Studies 100% n/a 6.08 1.30 7.90 $3,176 $83 $1,529 $1,647 $901 83%
253 Congregate Care Facility du 2.25Blend ITE 9th & FL
Studies 3.08 3.58 Same as LUC 210 72% FL Studies 1.58 1.30 2.05 $826 $23 $424 $402 n/a n/a
LODGING:
310 Hotel room 6.36Blend ITE 9th & FL
Studies 6.26 6.76 FL Studies 66% FL Studies 8.33 1.30 10.83 $4,351 $110 $2,027 $2,324 $1,546 50%
311 Hotel; All Suites room 4.90 ITE 9th Edition 6.26 6.76 Same as LUC 310 66% Same as LUC 310 6.42 1.30 8.35 $3,352 $85 $1,566 $1,786 $1,082 65%
320 Motel room 5.63 ITE 9th Edition 4.34 4.84 FL Studies 77% FL Studies 5.96 1.30 7.75 $3,115 $82 $1,511 $1,604 $1,579 2%
RECREATION:
412 General Recreation acre 2.28 ITE 9th Edition 5.11 5.61FL Studies
(Pinellas County) 90%FL Studies
(Pinellas County) 3.32 1.30 4.32 $1,736 $45 $829 $907 n/a n/a
416 RV Park(3) site 1.62ITE 9th Edition
(Adjusted) 4.60 5.10 Same as LUC 240 100%FL Studies
(Pinellas County) 2.36 1.30 3.07 $1,234 $32 $590 $644 n/a n/a
420 Marina boat berth 2.96 ITE 9th Edition 6.62 7.12 Same as LUC 210 90%FL Studies
(Pinellas County) 5.59 1.30 7.27 $2,920 $74 $1,363 $1,557 n/a n/a
430 Golf Course hole 35.74 ITE 9th Edition 6.62 7.12 Same as LUC 210 90%FL Studies
(Pinellas County) 67.50 1.30 87.75 $35,257 $890 $16,398 $18,859 $4,272 342%
444 Movie Theater screen 106.63Blend ITE 6th & FL
Studies 2.22 2.72 FL Studies 88% FL Studies 66.04 1.30 85.85 $34,491 $992 $18,277 $16,214 $9,164 77%
492 Health Club 1,000 sf 32.93 ITE 9th Edition 5.15 5.65 Same as LUC 710 94% FL Studies 50.53 1.30 65.69 $26,395 $679 $12,510 $13,885 n/a n/a
210
220
222/ 223

Tindale Oliver Hillsborough County April 2016 D-9 Mobility Fee Study
Table D‐3 (continued) Mobility Fee Schedule – Urban Area; ½% Sales Tax
ITE LUC Land Use Unit Trip Rate Trip Rate SourceAssessable Trip
LengthTotal Trip
LengthTrip Length Source
PercentNew Trips
% New Trips Source Net VMT(1) Person‐Trip Factor
Net PMTTotal
Mobility CostAnnualGas Tax
Gas Tax CreditNet
Mobility FeeCurrent Impact
Fee Zone 7(2) % Change
INSTITUTIONS:
520 Elementary School (Private) student 1.29 ITE 9th Edition 4.30 4.80FL Studies
(Pinellas County) 80%FL Studies
(Pinellas County) 1.41 1.30 1.83 $735 $19 $350 $385 $61 531%
522 Middle School (Private) student 1.62 ITE 9th Edition 4.30 4.80FL Studies
(Pinellas County) 90%FL Studies
(Pinellas County) 1.99 1.30 2.59 $1,038 $27 $497 $541 n/a n/a
530 High School (Private) student 1.71 ITE 9th Edition 4.30 4.80FL Studies
(Pinellas County) 90%FL Studies
(Pinellas County) 2.10 1.30 2.73 $1,096 $29 $534 $562 n/a n/a
540University/Junior College (7,500 or fewer students) (Private) student 2.00 ITE Regression Analysis 6.62 7.12 Same as LUC 210 90%
FL Studies(Pinellas County) 3.78 1.30 4.91 $1,973 $50 $921 $1,052 n/a n/a
550University/Junior College (more than 7,500 students) (Private) student 1.50 ITE Regression Analysis 6.62 7.12 Same as LUC 210 90%
FL Studies(Pinellas County) 2.83 1.30 3.68 $1,480 $37 $682 $798 n/a n/a
560 Church 1,000 sf 9.11 ITE 9th Edition 3.90 4.40FL Studies
(Pinellas County) 90%FL Studies
(Pinellas County) 10.14 1.30 13.18 $5,294 $140 $2,579 $2,715 $544 399%
565 Day Care Center 1,000 sf 71.88Blend ITE 9th & FL
Studies 2.03 2.53 FL Studies 73% FL Studies 33.77 1.30 43.90 $17,637 $516 $9,507 $8,130 $1,500 442%
610 Hospital 1,000 sf 13.22 ITE 9th Edition 6.62 7.12 Same as LUC 210 77%FL Studies
(Pinellas County) 21.36 1.30 27.77 $11,158 $282 $5,196 $5,962 unit change n/a
620 Nursing Home bed 2.76Blend ITE 9th & FL
Studies 2.59 3.09 FL Studies 89% FL Studies 2.02 1.30 2.63 $1,053 $29 $534 $519 $194 168%
630 Clinic 1,000 sf 33.22Blend ITE 9th & FL
Studies 5.10 5.60 FL Studies 93% FL Studies 49.95 1.30 64.94 $26,088 $672 $12,381 $13,707 $1,880 629%
OFFICE:
General Office 50,000 sq ft or less(4) 1,000 sf 15.50 ITE 9th equation 5.15 5.65 FL Studies 92% FL Studies 23.28 1.30 30.26 $12,160 $313 $5,767 $6,393 $3,728 72%
General Office 50,001-100,000 sq ft(4) 1,000 sf 13.13 ITE 9th equation 5.15 5.65 FL Studies 92% FL Studies 19.72 1.30 25.64 $10,300 $265 $4,882 $5,418 $2,300 136%
General Office 100,001-200,000 sq ft(4) 1,000 sf 11.12 ITE 9th equation 5.15 5.65 FL Studies 92% FL Studies 16.70 1.30 21.71 $8,724 $225 $4,145 $4,579 $1,958 134%
General Office 200,001-400,000 sq ft(4) 1,000 sf 9.41 ITE 9th equation 5.15 5.65 FL Studies 92% FL Studies 14.13 1.30 18.37 $7,382 $190 $3,501 $3,881 $1,958 98%
General Office greater that 400,000 sq ft(4) 1,000 sf 8.54 ITE 9th equation 5.15 5.65 FL Studies 92% FL Studies 12.83 1.30 16.68 $6,700 $172 $3,169 $3,531 $1,958 80%
715 Single Tenant Office Building 1,000 sf 11.65 ITE 9th equation 5.15 5.65 Same as LUC 710 92% Same as LUC 710 17.50 1.30 22.75 $9,139 $235 $4,330 $4,809 $2,005 140%
720 Medical Office 10,000 sq ft or less 1,000 sf 23.83 FL Studies 5.55 6.05 FL Studies 89% FL Studies 37.31 1.30 48.50 $19,489 $498 $9,175 $10,314 $6,262 65%
720 Medical Office greater than 10,000 sq ft 1,000 sf 34.72Blend ITE 9th & FL
Studies 5.55 6.05 FL Studies 89% FL Studies 54.37 1.30 70.68 $28,396 $726 $13,376 $15,020 $6,262 140%
RETAIL:
813 Discount Superstore 1,000 sf 50.82 ITE 9th Edition 2.40 2.90Same as LUC 820(50k-200k sq ft) 67%
Same as LUC 820(50k-200k sq ft) 25.90 1.30 33.67 $13,530 $384 $7,075 $6,455 $2,807 130%
815 Discount Store; Free-Standing 1,000 sf 57.24 ITE 9th Edition 2.40 2.90Same as LUC 820(50k-200k sq ft) 67%
Same as LUC 820(50k-200k sq ft) 29.18 1.30 37.93 $15,240 $432 $7,959 $7,281 $3,384 115%
Shopping Center 50,000 sq ft or less(4)(5) 1,000 sfgla 86.56 ITE 9th equation 1.87 2.37 TL Regression 56% FL Curve 28.73 1.30 37.35 $15,009 $446 $8,217 $6,792 $1,565 334%
Shopping Center 50,001-200,000 sq ft(4)(5) 1,000 sfgla 53.28 ITE 9th equation 2.40 2.90 TL Regression 67% FL Curve 27.16 1.30 35.31 $14,185 $402 $7,407 $6,778 $3,181 113%
Shopping Center 200,001-400,000 sq ft(4)(5) 1,000 sfgla 41.80 ITE 9th equation 2.64 3.14 TL Regression 73% FL Curve 25.54 1.30 33.20 $13,338 $372 $6,854 $6,484 $5,504 18%
Shopping Center greater than 400,000 sq ft(4)(5) 1,000 sfgla 36.27 ITE 9th equation 2.87 3.37 TL Regression 76% FL Curve 25.08 1.30 32.60 $13,099 $361 $6,651 $6,448 $5,504 17%
841 New/Used Auto Sales 1,000 sf 28.25Blend ITE 9th & FL
Studies 4.60 5.10 FL Studies 79% FL Studies 32.54 1.30 42.30 $16,998 $442 $8,144 $8,854 $4,482 98%
853 Convenience Market w/Gasoline 1,000 sf 775.14Blend ITE 9th & FL
Studies 1.51 2.01 FL Studies 28% FL Studies 103.89 1.30 135.06 $54,263 $1,695 $31,229 $23,034 $7,581 204%
710
820

Tindale Oliver Hillsborough County April 2016 D-10 Mobility Fee Study
Table D‐3 (continued) Mobility Fee Schedule – Urban Area; ½% Sales Tax
1) Net VMT calculated as ((Trip Generation Rate* Trip Length* % New Trips)*(1-Interstate/Toll Facility Adjustment Factor)/2). This reflects the unit of vehicle miles of capacity consumed per unit of development and is multiplied by the cost per vehicle 2) Source: Hillsborough County Department of Development Services; Fees shown for Zone 7 3) The ITE 9th Edition trip generation rate was adjusted to reflect the average occupancy rate of 60 percent based on data provided by the Florida Association of RV Parks and Campgrounds 4) The trip generation rates recommended for the offices and shopping centers use the end-point regression value 5) In the case of shopping centers with up to 300,000 square feet, fast-food, convenience store, and gas stations located on outparcels should be charged separately using their individual categories, as opposed to the general shopping center rate
ITE LUC Land Use Unit Trip Rate Trip Rate SourceAssessable Trip
LengthTotal Trip
LengthTrip Length Source
PercentNew Trips
% New Trips Source Net VMT(1) Person‐Trip Factor
Net PMTTotal
Mobility CostAnnualGas Tax
Gas Tax CreditNet
Mobility FeeCurrent Impact
Fee Zone 7(2) % Change
RETAIL:
857 Discount Club 1,000 sf 41.80 ITE 9th Edition 2.40 2.90Same as LUC 820(50k-200k sq ft) 67%
Same as LUC 820(50k-200k sq ft) 21.31 1.30 27.70 $11,129 $316 $5,822 $5,307 $2,498 112%
862 Home Improvement Superstore 1,000 sf 30.74 ITE 9th Edition 2.40 2.90Same as LUC 820(50k-200k sq ft) 67%
Same as LUC 820(50k-200k sq ft) 15.67 1.30 20.37 $8,184 $232 $4,274 $3,910 $2,095 87%
863 Electronics Superstore 1,000 sf 45.04 ITE 9th Edition 1.87 2.37Same as LUC 820(50k sq ft or less) 56%
Same as LUC 820(50k sq ft or less) 14.95 1.30 19.44 $7,809 $232 $4,274 $3,535 $2,692 31%
880/881 Pharmacy/Drug Store with & without Drive-Thru 1,000 sf 95.96
Blend ITE 9th & FL Studies 2.08 2.58 FL Studies 32% FL Studies 20.25 1.30 26.33 $10,575 $308 $5,675 $4,900 $5,269 -7%
890 Furniture Store 1,000 sf 5.06 ITE 9th Edition 6.09 6.59 FL Studies 54% FL Studies 5.27 1.30 6.85 $2,755 $70 $1,290 $1,465 $605 142%
912 Bank/Savings Drive-In 1,000 sf 159.34Blend ITE 9th & FL
Studies 2.46 2.96 FL Studies 46% FL Studies 57.16 1.30 74.31 $29,855 $843 $15,532 $14,323 $15,850 -10%
931 Quality Restaurant 1,000 sf 91.10Blend ITE 9th & FL
Studies 3.14 3.64 FL Studies 77% FL Studies 69.82 1.30 90.77 $36,470 $992 $18,277 $18,193 $10,752 69%
932 High-Turn Over Restaurant 1,000 sf 116.60Blend ITE 9th & FL
Studies 3.17 3.67 FL Studies 71% FL Studies 83.19 1.30 108.15 $43,452 $1,180 $21,741 $21,711 $7,790 179%
934 Fast Food Restaurant w/Drive-Thru 1,000 sf 511.00Blend ITE 9th & FL
Studies 2.05 2.55 FL Studies 58% FL Studies 192.60 1.30 250.38 $100,599 $2,936 $54,094 $46,505 $9,389 395%
942 Automobile Care Center 1,000 sf 31.43Blend ITE 9th & FL
Studies 3.62 4.12 FL Studies 72% FL Studies 25.97 1.30 33.76 $13,564 $362 $6,670 $6,894 n/a n/a
944/946 Gas/Service Station with & without Car Wash fuel pos. 157.33
ITE 9th Edition(944 & 946 Blend) 1.90 2.40 FL Studies 23% FL Studies 21.79 1.30 28.33 $11,384 $337 $6,209 $5,175 $1,511 243%
947 Self-Service Car Wash service bay 43.94Blend ITE 9th & FL
Studies 2.18 2.68 FL Studies 68% FL Studies 20.65 1.30 26.85 $10,785 $311 $5,730 $5,055 $6,455 -22%
INDUSTRIAL:
110 General Light Industrial 1,000 sf 6.97 ITE 9th Edition 5.15 5.65 Same as LUC 710 92% Same as LUC 710 10.47 1.30 13.61 $5,468 $141 $2,598 $2,870 $1,208 138%
120 General Heavy Industrial 1,000 sf 1.50 ITE 9th Edition 5.15 5.65 Same as LUC 710 92% Same as LUC 710 2.25 1.30 2.93 $1,177 $30 $553 $624 $1,208 -48%
140 Manufacturing 1,000 sf 3.82 ITE 9th Edition 5.15 5.65 Same as LUC 710 92% Same as LUC 710 5.74 1.30 7.46 $2,997 $77 $1,419 $1,578 $1,208 31%
150 Warehousing 1,000 sf 3.56 ITE 9th Edition 5.15 5.65 Same as LUC 710 92% Same as LUC 710 5.35 1.30 6.96 $2,793 $72 $1,327 $1,466 $860 71%
151 Mini-Warehouse 1,000 sf 2.15Blend ITE 9th & FL
Studies 3.10 3.60FL Studies
(Pinellas County) 92% Same as LUC 710 1.94 1.30 2.52 $1,015 $28 $516 $499 $433 15%
152 High-Cube Warehouse 1,000 sf 1.68 ITE 9th Edition 5.15 5.65 Same as LUC 710 92% Same as LUC 710 2.52 1.30 3.28 $1,318 $34 $626 $692 n/a n/a

Tindale Oliver Hillsborough County April 2016 D-11 Mobility Fee Study
Table D‐4 Mobility Fee Schedule – Rural Area; ½% Sales Tax
Gasoline Tax Unit Cost per Lane Mile: $4,962,000 Interstate/Toll Facility Adjustment Factor: 36.6%$$ per gallon to capital: $0.387 City Revenues: $0.021 Average PMC per Lane Mile: 9,263 10,806 Cost per PMC (Residential/Office/Industrial): $535.71
Facility life (years): 25 County Revenues: $0.247 Fuel Efficiency: 18.18 mpg Cost per PMC (Other Non-Residential): $459.18Interest rate: 2.50% State Revenues: $0.119 Effectivedays per year: 365
ITE LUC Land Use Unit Trip Rate Trip Rate SourceAssessable Trip
LengthTotal Trip
LengthTrip Length Source
PercentNew Trips
% New Trips Source Net VMT(1) Person‐Trip Factor
Net PMTTotal
Mobility CostAnnualGas Tax
Gas Tax CreditNet
Mobility FeeCurrent Impact
Fee Zone 7(2) % Change
RESIDENTIAL:
Single Family (Detached) - Less than 1,500 sf & Annual HH Income less than 50% SHIP Definition du 2.62
FL Studies(NHTS, AHS, Census) 6.62 7.12 FL Studies 100% n/a 5.50 1.30 7.15 $3,829 $72 $1,327 $2,502 $1,792 40%
Single Family (Detached) - Less than 1,500 sf & Annual HH Income between 50-80% SHIP Definition du 3.96
FL Studies(NHTS, AHS, Census) 6.62 7.12 FL Studies 100% n/a 8.31 1.30 10.80 $5,787 $110 $2,027 $3,760 $1,792 110%
Single Family (Detached) - Less than 1,500 sf du 6.11FL Studies
(NHTS, AHS, Census) 6.62 7.12 FL Studies 100% n/a 12.82 1.30 16.67 $8,930 $169 $3,114 $5,816 $1,792 225%
Single Family (Detached) - 1,501 to 2,499 sf du 7.81FL Studies
(NHTS, AHS, Census) 6.62 7.12 FL Studies 100% n/a 16.39 1.30 21.31 $11,414 $216 $3,980 $7,434 $1,792 315%
Single Family (Detached) - 2,500 sf and greater du 8.76FL Studies
(NHTS, AHS, Census) 6.62 7.12 FL Studies 100% n/a 18.38 1.30 23.89 $12,802 $242 $4,459 $8,343 $1,792 366%
Multi-Family (Apartment); 1-2 Stories - Annual HH Income less than 50% SHIP Definition du 2.38
Blend ITE 9th & FL Studies 5.10 5.60
FL Studies(LUC 220/230) 100% n/a 3.85 1.30 5.01 $2,680 $52 $958 $1,722 $1,242 39%
Multi-Family (Apartment); 1-2 Stories - Annual HH Income between 50-80% SHIP Definition du 3.60
Blend ITE 9th & FL Studies 5.10 5.60
FL Studies(LUC 220/230) 100% n/a 5.82 1.30 7.57 $4,053 $78 $1,437 $2,616 $1,242 111%
Multi-Family (Apartment); 1-2 Stories du 6.60Blend ITE 9th & FL
Studies 5.10 5.60FL Studies
(LUC 220/230) 100% n/a 10.67 1.30 13.87 $7,431 $144 $2,653 $4,778 $1,242 285%
Multi-Family (Apartment); 3+ Stories - Annual HH Income less than 50% SHIP Definition du 1.49
ITE 9th Edition (weighted avg) 5.10 5.60
FL Studies(LUC 220/230) 100% n/a 2.41 1.30 3.13 $1,678 $32 $590 $1,088 $1,242 -12%
Multi-Family (Apartment); 3+ Stories - Annual HH Income between 50-80% SHIP Definition du 2.25
ITE 9th Edition (weighted avg) 5.10 5.60
FL Studies(LUC 220/230) 100% n/a 3.64 1.30 4.73 $2,533 $49 $903 $1,630 $1,242 31%
Multi-Family (Apartment); 3+ Stories du 4.14ITE 9th Edition (weighted avg) 5.10 5.60
FL Studies(LUC 220/230) 100% n/a 6.69 1.30 8.70 $4,661 $90 $1,658 $3,003 $1,242 142%
230 Residential Condominium/Townhouse du 5.76Blend ITE 9th & FL
Studies 5.10 5.60FL Studies
(LUC 220/230) 100% n/a 9.31 1.30 12.10 $6,485 $125 $2,303 $4,182 $1,097 281%
232 High-Rise Condominium; 3+ Stories du 4.18 ITE 9th Edition 5.10 5.60FL Studies
(LUC 220/230) 100% n/a 6.76 1.30 8.79 $4,706 $91 $1,677 $3,029 $1,097 176%
240 Mobile Home Park du 4.17 FL Studies 4.60 5.10 FL Studies 100% n/a 6.08 1.30 7.90 $4,235 $83 $1,529 $2,706 $901 200%
253 Congregate Care Facility du 2.25Blend ITE 9th & FL
Studies 3.08 3.58 Same as LUC 210 72% FL Studies 1.58 1.30 2.05 $1,102 $23 $424 $678 n/a n/a
LODGING:
310 Hotel room 6.36Blend ITE 9th & FL
Studies 6.26 6.76 FL Studies 66% FL Studies 8.33 1.30 10.83 $4,972 $110 $2,027 $2,945 $1,546 91%
311 Hotel; All Suites room 4.90 ITE 9th Edition 6.26 6.76 Same as LUC 310 66% Same as LUC 310 6.42 1.30 8.35 $3,831 $85 $1,566 $2,265 $1,082 109%
320 Motel room 5.63 ITE 9th Edition 4.34 4.84 FL Studies 77% FL Studies 5.96 1.30 7.75 $3,560 $82 $1,511 $2,049 $1,579 30%
RECREATION:
412 General Recreation acre 2.28 ITE 9th Edition 5.11 5.61FL Studies
(Pinellas County) 90%FL Studies
(Pinellas County) 3.32 1.30 4.32 $1,984 $45 $829 $1,155 n/a n/a
416 RV Park(3) site 1.62ITE 9th Edition
(Adjusted) 4.60 5.10 Same as LUC 240 100%FL Studies
(Pinellas County) 2.36 1.30 3.07 $1,410 $32 $590 $820 n/a n/a
420 Marina boat berth 2.96 ITE 9th Edition 6.62 7.12 Same as LUC 210 90%FL Studies
(Pinellas County) 5.59 1.30 7.27 $3,337 $74 $1,363 $1,974 n/a n/a
430 Golf Course hole 35.74 ITE 9th Edition 6.62 7.12 Same as LUC 210 90%FL Studies
(Pinellas County) 67.50 1.30 87.75 $40,294 $890 $16,398 $23,896 $4,272 459%
444 Movie Theater screen 106.63Blend ITE 6th & FL
Studies 2.22 2.72 FL Studies 88% FL Studies 66.04 1.30 85.85 $39,418 $992 $18,277 $21,141 $9,164 131%
492 Health Club 1,000 sf 32.93 ITE 9th Edition 5.15 5.65 Same as LUC 710 94% FL Studies 50.53 1.30 65.69 $30,166 $679 $12,510 $17,656 n/a n/a
210
220
222/ 223

Tindale Oliver Hillsborough County April 2016 D-12 Mobility Fee Study
Table D‐4 (continued) Mobility Fee Schedule – Rural Area; ½% Sales Tax
ITE LUC Land Use Unit Trip Rate Trip Rate SourceAssessable Trip
LengthTotal Trip
LengthTrip Length Source
PercentNew Trips
% New Trips Source Net VMT(1) Person‐Trip Factor
Net PMTTotal
Mobility CostAnnualGas Tax
Gas Tax CreditNet
Mobility FeeCurrent Impact
Fee Zone 7(2) % Change
INSTITUTIONS:
520 Elementary School (Private) student 1.29 ITE 9th Edition 4.30 4.80FL Studies
(Pinellas County) 80%FL Studies
(Pinellas County) 1.41 1.30 1.83 $840 $19 $350 $490 $61 703%
522 Middle School (Private) student 1.62 ITE 9th Edition 4.30 4.80FL Studies
(Pinellas County) 90%FL Studies
(Pinellas County) 1.99 1.30 2.59 $1,186 $27 $497 $689 n/a n/a
530 High School (Private) student 1.71 ITE 9th Edition 4.30 4.80FL Studies
(Pinellas County) 90%FL Studies
(Pinellas County) 2.10 1.30 2.73 $1,252 $29 $534 $718 n/a n/a
540University/Junior College (7,500 or fewer students) (Private) student 2.00 ITE Regression Analysis 6.62 7.12 Same as LUC 210 90%
FL Studies(Pinellas County) 3.78 1.30 4.91 $2,255 $50 $921 $1,334 n/a n/a
550University/Junior College (more than 7,500 students) (Private) student 1.50 ITE Regression Analysis 6.62 7.12 Same as LUC 210 90%
FL Studies(Pinellas County) 2.83 1.30 3.68 $1,691 $37 $682 $1,009 n/a n/a
560 Church 1,000 sf 9.11 ITE 9th Edition 3.90 4.40FL Studies
(Pinellas County) 90%FL Studies
(Pinellas County) 10.14 1.30 13.18 $6,051 $140 $2,579 $3,472 $544 538%
565 Day Care Center 1,000 sf 71.88Blend ITE 9th & FL
Studies 2.03 2.53 FL Studies 73% FL Studies 33.77 1.30 43.90 $20,156 $516 $9,507 $10,649 $1,500 610%
610 Hospital 1,000 sf 13.22 ITE 9th Edition 6.62 7.12 Same as LUC 210 77%FL Studies
(Pinellas County) 21.36 1.30 27.77 $12,752 $282 $5,196 $7,556 unit change n/a
620 Nursing Home bed 2.76Blend ITE 9th & FL
Studies 2.59 3.09 FL Studies 89% FL Studies 2.02 1.30 2.63 $1,204 $29 $534 $670 $194 245%
630 Clinic 1,000 sf 33.22Blend ITE 9th & FL
Studies 5.10 5.60 FL Studies 93% FL Studies 49.95 1.30 64.94 $29,815 $672 $12,381 $17,434 $1,880 827%
OFFICE:
General Office 50,000 sq ft or less(4) 1,000 sf 15.50 ITE 9th equation 5.15 5.65 FL Studies 92% FL Studies 23.28 1.30 30.26 $16,213 $313 $5,767 $10,446 $3,728 180%
General Office 50,001-100,000 sq ft(4) 1,000 sf 13.13 ITE 9th equation 5.15 5.65 FL Studies 92% FL Studies 19.72 1.30 25.64 $13,734 $265 $4,882 $8,852 $2,300 285%
General Office 100,001-200,000 sq ft(4) 1,000 sf 11.12 ITE 9th equation 5.15 5.65 FL Studies 92% FL Studies 16.70 1.30 21.71 $11,631 $225 $4,145 $7,486 $1,958 282%
General Office 200,001-400,000 sq ft(4) 1,000 sf 9.41 ITE 9th equation 5.15 5.65 FL Studies 92% FL Studies 14.13 1.30 18.37 $9,843 $190 $3,501 $6,342 $1,958 224%
General Office greater that 400,000 sq ft(4) 1,000 sf 8.54 ITE 9th equation 5.15 5.65 FL Studies 92% FL Studies 12.83 1.30 16.68 $8,933 $172 $3,169 $5,764 $1,958 194%
715 Single Tenant Office Building 1,000 sf 11.65 ITE 9th equation 5.15 5.65 Same as LUC 710 92% Same as LUC 710 17.50 1.30 22.75 $12,186 $235 $4,330 $7,856 $2,005 292%
720 Medical Office 10,000 sq ft or less 1,000 sf 23.83 FL Studies 5.55 6.05 FL Studies 89% FL Studies 37.31 1.30 48.50 $25,986 $498 $9,175 $16,811 $6,262 169%
720 Medical Office greater than 10,000 sq ft 1,000 sf 34.72Blend ITE 9th & FL
Studies 5.55 6.05 FL Studies 89% FL Studies 54.37 1.30 70.68 $37,861 $726 $13,376 $24,485 $6,262 291%
RETAIL:
813 Discount Superstore 1,000 sf 50.82 ITE 9th Edition 2.40 2.90Same as LUC 820(50k-200k sq ft) 67%
Same as LUC 820(50k-200k sq ft) 25.90 1.30 33.67 $15,463 $384 $7,075 $8,388 $2,807 199%
815 Discount Store; Free-Standing 1,000 sf 57.24 ITE 9th Edition 2.40 2.90Same as LUC 820(50k-200k sq ft) 67%
Same as LUC 820(50k-200k sq ft) 29.18 1.30 37.93 $17,417 $432 $7,959 $9,458 $3,384 180%
Shopping Center 50,000 sq ft or less(4)(5) 1,000 sfgla 86.56 ITE 9th equation 1.87 2.37 TL Regression 56% FL Curve 28.73 1.30 37.35 $17,153 $446 $8,217 $8,936 $1,565 471%
Shopping Center 50,001-200,000 sq ft(4)(5) 1,000 sfgla 53.28 ITE 9th equation 2.40 2.90 TL Regression 67% FL Curve 27.16 1.30 35.31 $16,212 $402 $7,407 $8,805 $3,181 177%
Shopping Center 200,001-400,000 sq ft(4)(5) 1,000 sfgla 41.80 ITE 9th equation 2.64 3.14 TL Regression 73% FL Curve 25.54 1.30 33.20 $15,244 $372 $6,854 $8,390 $5,504 52%
Shopping Center greater than 400,000 sq ft(4)(5) 1,000 sfgla 36.27 ITE 9th equation 2.87 3.37 TL Regression 76% FL Curve 25.08 1.30 32.60 $14,970 $361 $6,651 $8,319 $5,504 51%
841 New/Used Auto Sales 1,000 sf 28.25Blend ITE 9th & FL
Studies 4.60 5.10 FL Studies 79% FL Studies 32.54 1.30 42.30 $19,426 $442 $8,144 $11,282 $4,482 152%
853 Convenience Market w/Gasoline 1,000 sf 775.14Blend ITE 9th & FL
Studies 1.51 2.01 FL Studies 28% FL Studies 103.89 1.30 135.06 $62,015 $1,695 $31,229 $30,786 $7,581 306%
710
820

Tindale Oliver Hillsborough County April 2016 D-13 Mobility Fee Study
Table D‐4 (continued) Mobility Fee Schedule – Rural Area; ½% Sales Tax
1) Net VMT calculated as ((Trip Generation Rate* Trip Length* % New Trips)*(1-Interstate/Toll Facility Adjustment Factor)/2). This reflects the unit of vehicle miles of capacity consumed per unit of development and is multiplied by the cost per vehicle 2) Source: Hillsborough County Department of Development Services; Fees shown for Zone 7 3) The ITE 9th Edition trip generation rate was adjusted to reflect the average occupancy rate of 60 percent based on data provided by the Florida Association of RV Parks and Campgrounds 4) The trip generation rates recommended for the offices and shopping centers use the end-point regression value 5) In the case of shopping centers with up to 300,000 square feet, fast-food, convenience store, and gas stations located on outparcels should be charged separately using their individual categories, as opposed to the general shopping center rate
ITE LUC Land Use Unit Trip Rate Trip Rate SourceAssessable Trip
LengthTotal Trip
LengthTrip Length Source
PercentNew Trips
% New Trips Source Net VMT(1) Person‐Trip Factor
Net PMTTotal
Mobility CostAnnualGas Tax
Gas Tax CreditNet
Mobility FeeCurrent Impact
Fee Zone 7(2) % Change
RETAIL:
857 Discount Club 1,000 sf 41.80 ITE 9th Edition 2.40 2.90Same as LUC 820(50k-200k sq ft) 67%
Same as LUC 820(50k-200k sq ft) 21.31 1.30 27.70 $12,719 $316 $5,822 $6,897 $2,498 176%
862 Home Improvement Superstore 1,000 sf 30.74 ITE 9th Edition 2.40 2.90Same as LUC 820(50k-200k sq ft) 67%
Same as LUC 820(50k-200k sq ft) 15.67 1.30 20.37 $9,354 $232 $4,274 $5,080 $2,095 143%
863 Electronics Superstore 1,000 sf 45.04 ITE 9th Edition 1.87 2.37Same as LUC 820(50k sq ft or less) 56%
Same as LUC 820(50k sq ft or less) 14.95 1.30 19.44 $8,925 $232 $4,274 $4,651 $2,692 73%
880/881 Pharmacy/Drug Store with & without Drive-Thru 1,000 sf 95.96
Blend ITE 9th & FL Studies 2.08 2.58 FL Studies 32% FL Studies 20.25 1.30 26.33 $12,086 $308 $5,675 $6,411 $5,269 22%
890 Furniture Store 1,000 sf 5.06 ITE 9th Edition 6.09 6.59 FL Studies 54% FL Studies 5.27 1.30 6.85 $3,149 $70 $1,290 $1,859 $605 207%
912 Bank/Savings Drive-In 1,000 sf 159.34Blend ITE 9th & FL
Studies 2.46 2.96 FL Studies 46% FL Studies 57.16 1.30 74.31 $34,119 $843 $15,532 $18,587 $15,850 17%
931 Quality Restaurant 1,000 sf 91.10Blend ITE 9th & FL
Studies 3.14 3.64 FL Studies 77% FL Studies 69.82 1.30 90.77 $41,680 $992 $18,277 $23,403 $10,752 118%
932 High-Turn Over Restaurant 1,000 sf 116.60Blend ITE 9th & FL
Studies 3.17 3.67 FL Studies 71% FL Studies 83.19 1.30 108.15 $49,659 $1,180 $21,741 $27,918 $7,790 258%
934 Fast Food Restaurant w/Drive-Thru 1,000 sf 511.00Blend ITE 9th & FL
Studies 2.05 2.55 FL Studies 58% FL Studies 192.60 1.30 250.38 $114,971 $2,936 $54,094 $60,877 $9,389 548%
942 Automobile Care Center 1,000 sf 31.43Blend ITE 9th & FL
Studies 3.62 4.12 FL Studies 72% FL Studies 25.97 1.30 33.76 $15,501 $362 $6,670 $8,831 n/a n/a
944/946 Gas/Service Station with & without Car Wash fuel pos. 157.33
ITE 9th Edition(944 & 946 Blend) 1.90 2.40 FL Studies 23% FL Studies 21.79 1.30 28.33 $13,010 $337 $6,209 $6,801 $1,511 350%
947 Self-Service Car Wash service bay 43.94Blend ITE 9th & FL
Studies 2.18 2.68 FL Studies 68% FL Studies 20.65 1.30 26.85 $12,326 $311 $5,730 $6,596 $6,455 2%
INDUSTRIAL:
110 General Light Industrial 1,000 sf 6.97 ITE 9th Edition 5.15 5.65 Same as LUC 710 92% Same as LUC 710 10.47 1.30 13.61 $7,291 $141 $2,598 $4,693 $1,208 289%
120 General Heavy Industrial 1,000 sf 1.50 ITE 9th Edition 5.15 5.65 Same as LUC 710 92% Same as LUC 710 2.25 1.30 2.93 $1,569 $30 $553 $1,016 $1,208 -16%
140 Manufacturing 1,000 sf 3.82 ITE 9th Edition 5.15 5.65 Same as LUC 710 92% Same as LUC 710 5.74 1.30 7.46 $3,996 $77 $1,419 $2,577 $1,208 113%
150 Warehousing 1,000 sf 3.56 ITE 9th Edition 5.15 5.65 Same as LUC 710 92% Same as LUC 710 5.35 1.30 6.96 $3,724 $72 $1,327 $2,397 $860 179%
151 Mini-Warehouse 1,000 sf 2.15Blend ITE 9th & FL
Studies 3.10 3.60FL Studies
(Pinellas County) 92% Same as LUC 710 1.94 1.30 2.52 $1,354 $28 $516 $838 $433 94%
152 High-Cube Warehouse 1,000 sf 1.68 ITE 9th Edition 5.15 5.65 Same as LUC 710 92% Same as LUC 710 2.52 1.30 3.28 $1,757 $34 $626 $1,131 n/a n/a

Tindale Oliver Hillsborough County April 2016 D-14 Mobility Fee Study
Table D‐5 Mobility Fee Schedule – Urban Area; ½% Sales Tax (20 year lifecycle)
Gasoline Tax Unit Cost per Lane Mile: $4,962,000 Interstate/Toll Facility Adjustment Factor: 36.6%$$ per gallon to capital: $0.213 $0.174 City Revenues: Average PMC per Lane Mile: 12,350 12,350 Cost per PMC: $401.78
Facility life (years): 25 20 County Revenues: Fuel Efficiency: 18.18 mpgInterest rate: 2.50% 2.50% State Revenues: Effectivedays per year: 365
ITE LUC Land Use Unit Trip Rate Trip Rate SourceAssessable Trip
LengthTotal Trip
LengthTrip Length Source
PercentNew Trips
% New Trips Source Net VMT(1) Person‐Trip Factor
Net PMTTotal
Mobility CostAnnualGas Tax
Gas Tax Credit
AnnualSales Tax
Sales Tax Credit
NetMobility Fee
Current Impact Fee
Zone 7(2)
% Change
RESIDENTIAL:
Single Family (Detached) - Less than 1,500 sf & Annual HH Income less than 50% SHIP Definition du 2.62
FL Studies(NHTS, AHS, Census) 6.62 7.12 FL Studies 100% n/a 5.50 1.30 7.15 $2,872 $40 $737 $33 $514 $1,621 $1,792 -10%
Single Family (Detached) - Less than 1,500 sf & Annual HH Income between 50-80% SHIP Definition du 3.96
FL Studies(NHTS, AHS, Census) 6.62 7.12 FL Studies 100% n/a 8.31 1.30 10.80 $4,341 $60 $1,105 $49 $764 $2,472 $1,792 38%
Single Family (Detached) - Less than 1,500 sf du 6.11FL Studies
(NHTS, AHS, Census) 6.62 7.12 FL Studies 100% n/a 12.82 1.30 16.67 $6,697 $93 $1,713 $76 $1,185 $3,799 $1,792 112%
Single Family (Detached) - 1,501 to 2,499 sf du 7.81FL Studies
(NHTS, AHS, Census) 6.62 7.12 FL Studies 100% n/a 16.39 1.30 21.31 $8,561 $119 $2,193 $97 $1,512 $4,856 $1,792 171%
Single Family (Detached) - 2,500 sf and greater du 8.76FL Studies
(NHTS, AHS, Census) 6.62 7.12 FL Studies 100% n/a 18.38 1.30 23.89 $9,602 $133 $2,450 $109 $1,699 $5,453 $1,792 204%
Multi-Family (Apartment); 1-2 Stories - Annual HH Income less than 50% SHIP Definition du 2.38
Blend ITE 9th & FL Studies 5.10 5.60
FL Studies(LUC 220/230) 100% n/a 3.85 1.30 5.01 $2,010 $28 $516 $23 $359 $1,135 $1,242 -9%
Multi-Family (Apartment); 1-2 Stories - Annual HH Income between 50-80% SHIP Definition du 3.60
Blend ITE 9th & FL Studies 5.10 5.60
FL Studies(LUC 220/230) 100% n/a 5.82 1.30 7.57 $3,040 $43 $792 $35 $546 $1,702 $1,242 37%
Multi-Family (Apartment); 1-2 Stories du 6.60Blend ITE 9th & FL
Studies 5.10 5.60FL Studies
(LUC 220/230) 100% n/a 10.67 1.30 13.87 $5,573 $79 $1,456 $65 $1,013 $3,104 $1,242 150%
Multi-Family (Apartment); 3+ Stories - Annual HH Income less than 50% SHIP Definition du 1.49
ITE 9th Edition (weighted avg) 5.10 5.60
FL Studies(LUC 220/230) 100% n/a 2.41 1.30 3.13 $1,258 $18 $332 $15 $234 $692 $1,242 -44%
Multi-Family (Apartment); 3+ Stories - Annual HH Income between 50-80% SHIP Definition du 2.25
ITE 9th Edition (weighted avg) 5.10 5.60
FL Studies(LUC 220/230) 100% n/a 3.64 1.30 4.73 $1,900 $27 $497 $22 $343 $1,060 $1,242 -15%
Multi-Family (Apartment); 3+ Stories du 4.14ITE 9th Edition (weighted avg) 5.10 5.60
FL Studies(LUC 220/230) 100% n/a 6.69 1.30 8.70 $3,496 $50 $921 $40 $624 $1,951 $1,242 57%
230 Residential Condominium/Townhouse du 5.76Blend ITE 9th & FL
Studies 5.10 5.60FL Studies
(LUC 220/230) 100% n/a 9.31 1.30 12.10 $4,864 $69 $1,271 $56 $873 $2,720 $1,097 148%
232 High-Rise Condominium; 3+ Stories du 4.18 ITE 9th Edition 5.10 5.60FL Studies
(LUC 220/230) 100% n/a 6.76 1.30 8.79 $3,530 $50 $921 $41 $639 $1,970 $1,097 80%
240 Mobile Home Park du 4.17 FL Studies 4.60 5.10 FL Studies 100% n/a 6.08 1.30 7.90 $3,176 $45 $829 $37 $577 $1,770 $901 97%
253 Congregate Care Facility du 2.25Blend ITE 9th & FL
Studies 3.08 3.58 Same as LUC 210 72% FL Studies 1.58 1.30 2.05 $826 $12 $221 $10 $156 $449 n/a n/a
LODGING:
310 Hotel room 6.36Blend ITE 9th & FL
Studies 6.26 6.76 FL Studies 66% FL Studies 8.33 1.30 10.83 $4,351 $61 $1,124 $50 $779 $2,448 $1,546 58%
311 Hotel; All Suites room 4.90 ITE 9th Edition 6.26 6.76 Same as LUC 310 66% Same as LUC 310 6.42 1.30 8.35 $3,352 $47 $866 $38 $592 $1,894 $1,082 75%
320 Motel room 5.63 ITE 9th Edition 4.34 4.84 FL Studies 77% FL Studies 5.96 1.30 7.75 $3,115 $45 $829 $37 $577 $1,709 $1,579 8%
RECREATION:
412 General Recreation acre 2.28 ITE 9th Edition 5.11 5.61FL Studies
(Pinellas County) 90%FL Studies
(Pinellas County) 3.32 1.30 4.32 $1,736 $25 $461 $20 $312 $963 n/a n/a
416 RV Park(3) site 1.62ITE 9th Edition
(Adjusted) 4.60 5.10 Same as LUC 240 100%FL Studies
(Pinellas County) 2.36 1.30 3.07 $1,234 $18 $332 $14 $218 $684 n/a n/a
420 Marina boat berth 2.96 ITE 9th Edition 6.62 7.12 Same as LUC 210 90%FL Studies
(Pinellas County) 5.59 1.30 7.27 $2,920 $41 $755 $33 $514 $1,651 n/a n/a
430 Golf Course hole 35.74 ITE 9th Edition 6.62 7.12 Same as LUC 210 90%FL Studies
(Pinellas County) 67.50 1.30 87.75 $35,257 $490 $9,028 $400 $6,236 $19,993 $4,272 368%
444 Movie Theater screen 106.63Blend ITE 6th & FL
Studies 2.22 2.72 FL Studies 88% FL Studies 66.04 1.30 85.85 $34,491 $546 $10,060 $446 $6,953 $17,478 $9,164 91%
492 Health Club 1,000 sf 32.93 ITE 9th Edition 5.15 5.65 Same as LUC 710 94% FL Studies 50.53 1.30 65.69 $26,395 $374 $6,891 $305 $4,755 $14,749 n/a n/a
210
220
222/ 223

Tindale Oliver Hillsborough County April 2016 D-15 Mobility Fee Study
Table D‐5 (continued) Mobility Fee Schedule – Urban Area; ½% Sales Tax (20 year lifecycle)
ITE LUC Land Use Unit Trip Rate Trip Rate SourceAssessable Trip
LengthTotal Trip
LengthTrip Length Source
PercentNew Trips
% New Trips Source Net VMT(1) Person‐Trip Factor
Net PMTTotal
Mobility CostAnnualGas Tax
Gas Tax Credit
AnnualSales Tax
Sales Tax Credit
NetMobility Fee
Current Impact Fee
Zone 7(2)
% Change
INSTITUTIONS:
520 Elementary School (Private) student 1.29 ITE 9th Edition 4.30 4.80FL Studies
(Pinellas County) 80%FL Studies
(Pinellas County) 1.41 1.30 1.83 $735 $11 $203 $9 $140 $392 $61 543%
522 Middle School (Private) student 1.62 ITE 9th Edition 4.30 4.80FL Studies
(Pinellas County) 90%FL Studies
(Pinellas County) 1.99 1.30 2.59 $1,038 $15 $276 $12 $187 $575 n/a n/a
530 High School (Private) student 1.71 ITE 9th Edition 4.30 4.80FL Studies
(Pinellas County) 90%FL Studies
(Pinellas County) 2.10 1.30 2.73 $1,096 $16 $295 $13 $203 $598 n/a n/a
540University/Junior College (7,500 or fewer students) (Private) student 2.00 ITE Regression Analysis 6.62 7.12 Same as LUC 210 90%
FL Studies(Pinellas County) 3.78 1.30 4.91 $1,973 $27 $497 $22 $343 $1,133 n/a n/a
550University/Junior College (more than 7,500 students) (Private) student 1.50 ITE Regression Analysis 6.62 7.12 Same as LUC 210 90%
FL Studies(Pinellas County) 2.83 1.30 3.68 $1,480 $21 $387 $17 $265 $828 n/a n/a
560 Church 1,000 sf 9.11 ITE 9th Edition 3.90 4.40FL Studies
(Pinellas County) 90%FL Studies
(Pinellas County) 10.14 1.30 13.18 $5,294 $77 $1,419 $63 $982 $2,893 $544 432%
565 Day Care Center 1,000 sf 71.88Blend ITE 9th & FL
Studies 2.03 2.53 FL Studies 73% FL Studies 33.77 1.30 43.90 $17,637 $284 $5,233 $232 $3,617 $8,787 $1,500 486%
610 Hospital 1,000 sf 13.22 ITE 9th Edition 6.62 7.12 Same as LUC 210 77%FL Studies
(Pinellas County) 21.36 1.30 27.77 $11,158 $155 $2,856 $127 $1,980 $6,322 unit change n/a
620 Nursing Home bed 2.76Blend ITE 9th & FL
Studies 2.59 3.09 FL Studies 89% FL Studies 2.02 1.30 2.63 $1,053 $16 $295 $13 $203 $555 $194 186%
630 Clinic 1,000 sf 33.22Blend ITE 9th & FL
Studies 5.10 5.60 FL Studies 93% FL Studies 49.95 1.30 64.94 $26,088 $370 $6,817 $302 $4,708 $14,563 $1,880 675%
OFFICE:
General Office 50,000 sq ft or less(4) 1,000 sf 15.50 ITE 9th equation 5.15 5.65 FL Studies 92% FL Studies 23.28 1.30 30.26 $12,160 $172 $3,169 $141 $2,198 $6,793 $3,728 82%
General Office 50,001-100,000 sq ft(4) 1,000 sf 13.13 ITE 9th equation 5.15 5.65 FL Studies 92% FL Studies 19.72 1.30 25.64 $10,300 $146 $2,690 $119 $1,855 $5,755 $2,300 150%
General Office 100,001-200,000 sq ft(4) 1,000 sf 11.12 ITE 9th equation 5.15 5.65 FL Studies 92% FL Studies 16.70 1.30 21.71 $8,724 $124 $2,285 $101 $1,575 $4,864 $1,958 148%
General Office 200,001-400,000 sq ft(4) 1,000 sf 9.41 ITE 9th equation 5.15 5.65 FL Studies 92% FL Studies 14.13 1.30 18.37 $7,382 $105 $1,935 $85 $1,325 $4,122 $1,958 111%
General Office greater that 400,000 sq ft(4) 1,000 sf 8.54 ITE 9th equation 5.15 5.65 FL Studies 92% FL Studies 12.83 1.30 16.68 $6,700 $95 $1,750 $78 $1,216 $3,734 $1,958 91%
715 Single Tenant Office Building 1,000 sf 11.65 ITE 9th equation 5.15 5.65 Same as LUC 710 92% Same as LUC 710 17.50 1.30 22.75 $9,139 $129 $2,377 $106 $1,652 $5,110 $2,005 155%
720 Medical Office 10,000 sq ft or less 1,000 sf 23.83 FL Studies 5.55 6.05 FL Studies 89% FL Studies 37.31 1.30 48.50 $19,489 $274 $5,048 $224 $3,492 $10,949 $6,262 75%
720 Medical Office greater than 10,000 sq ft 1,000 sf 34.72Blend ITE 9th & FL
Studies 5.55 6.05 FL Studies 89% FL Studies 54.37 1.30 70.68 $28,396 $400 $7,370 $327 $5,098 $15,928 $6,262 154%
RETAIL:
813 Discount Superstore 1,000 sf 50.82 ITE 9th Edition 2.40 2.90Same as LUC 820(50k-200k sq ft) 67%
Same as LUC 820(50k-200k sq ft) 25.90 1.30 33.67 $13,530 $211 $3,888 $172 $2,681 $6,961 $2,807 148%
815 Discount Store; Free-Standing 1,000 sf 57.24 ITE 9th Edition 2.40 2.90Same as LUC 820(50k-200k sq ft) 67%
Same as LUC 820(50k-200k sq ft) 29.18 1.30 37.93 $15,240 $238 $4,385 $194 $3,024 $7,831 $3,384 131%
Shopping Center 50,000 sq ft or less(4)(5) 1,000 sfgla 86.56 ITE 9th equation 1.87 2.37 TL Regression 56% FL Curve 28.73 1.30 37.35 $15,009 $246 $4,532 $201 $3,133 $7,344 $1,565 369%
Shopping Center 50,001-200,000 sq ft(4)(5) 1,000 sfgla 53.28 ITE 9th equation 2.40 2.90 TL Regression 67% FL Curve 27.16 1.30 35.31 $14,185 $221 $4,072 $181 $2,822 $7,291 $3,181 129%
Shopping Center 200,001-400,000 sq ft(4)(5) 1,000 sfgla 41.80 ITE 9th equation 2.64 3.14 TL Regression 73% FL Curve 25.54 1.30 33.20 $13,338 $205 $3,777 $167 $2,603 $6,958 $5,504 26%
Shopping Center greater than 400,000 sq ft(4)(5) 1,000 sfgla 36.27 ITE 9th equation 2.87 3.37 TL Regression 76% FL Curve 25.08 1.30 32.60 $13,099 $199 $3,666 $162 $2,525 $6,908 $5,504 26%
841 New/Used Auto Sales 1,000 sf 28.25Blend ITE 9th & FL
Studies 4.60 5.10 FL Studies 79% FL Studies 32.54 1.30 42.30 $16,998 $243 $4,477 $199 $3,102 $9,419 $4,482 110%
853 Convenience Market w/Gasoline 1,000 sf 775.14Blend ITE 9th & FL
Studies 1.51 2.01 FL Studies 28% FL Studies 103.89 1.30 135.06 $54,263 $933 $17,190 $762 $11,879 $25,194 $7,581 232%
710
820

Tindale Oliver Hillsborough County April 2016 D-16 Mobility Fee Study
Table D‐5 (continued) Mobility Fee Schedule – Urban Area; ½% Sales Tax (20 year lifecycle)
1) Net VMT calculated as ((Trip Generation Rate* Trip Length* % New Trips)*(1-Interstate/Toll Facility Adjustment Factor)/2). This reflects the unit of vehicle miles of capacity consumed per unit of development and is multiplied by the cost per vehicle 2) Source: Hillsborough County Department of Development Services; Fees shown for Zone 7 3) The ITE 9th Edition trip generation rate was adjusted to reflect the average occupancy rate of 60 percent based on data provided by the Florida Association of RV Parks and Campgrounds 4) The trip generation rates recommended for the offices and shopping centers use the end-point regression value 5) In the case of shopping centers with up to 300,000 square feet, fast-food, convenience store, and gas stations located on outparcels should be charged separately using their individual categories, as opposed to the general shopping center rate
ITE LUC Land Use Unit Trip Rate Trip Rate SourceAssessable Trip
LengthTotal Trip
LengthTrip Length Source
PercentNew Trips
% New Trips Source Net VMT(1) Person‐Trip Factor
Net PMTTotal
Mobility CostAnnualGas Tax
Gas Tax Credit
AnnualSales Tax
Sales Tax Credit
NetMobility Fee
Current Impact Fee
Zone 7(2)
% Change
RETAIL:
857 Discount Club 1,000 sf 41.80 ITE 9th Edition 2.40 2.90Same as LUC 820(50k-200k sq ft) 67%
Same as LUC 820(50k-200k sq ft) 21.31 1.30 27.70 $11,129 $174 $3,206 $142 $2,214 $5,709 $2,498 129%
862 Home Improvement Superstore 1,000 sf 30.74 ITE 9th Edition 2.40 2.90Same as LUC 820(50k-200k sq ft) 67%
Same as LUC 820(50k-200k sq ft) 15.67 1.30 20.37 $8,184 $128 $2,358 $104 $1,621 $4,205 $2,095 101%
863 Electronics Superstore 1,000 sf 45.04 ITE 9th Edition 1.87 2.37Same as LUC 820(50k sq ft or less) 56%
Same as LUC 820(50k sq ft or less) 14.95 1.30 19.44 $7,809 $128 $2,358 $104 $1,621 $3,830 $2,692 42%
880/881 Pharmacy/Drug Store with & without Drive-Thru 1,000 sf 95.96
Blend ITE 9th & FL Studies 2.08 2.58 FL Studies 32% FL Studies 20.25 1.30 26.33 $10,575 $169 $3,114 $138 $2,151 $5,310 $5,269 1%
890 Furniture Store 1,000 sf 5.06 ITE 9th Edition 6.09 6.59 FL Studies 54% FL Studies 5.27 1.30 6.85 $2,755 $39 $719 $31 $483 $1,553 $605 157%
912 Bank/Savings Drive-In 1,000 sf 159.34Blend ITE 9th & FL
Studies 2.46 2.96 FL Studies 46% FL Studies 57.16 1.30 74.31 $29,855 $464 $8,549 $379 $5,908 $15,398 $15,850 -3%
931 Quality Restaurant 1,000 sf 91.10Blend ITE 9th & FL
Studies 3.14 3.64 FL Studies 77% FL Studies 69.82 1.30 90.77 $36,470 $546 $10,060 $446 $6,953 $19,457 $10,752 81%
932 High-Turn Over Restaurant 1,000 sf 116.60Blend ITE 9th & FL
Studies 3.17 3.67 FL Studies 71% FL Studies 83.19 1.30 108.15 $43,452 $650 $11,976 $531 $8,278 $23,198 $7,790 198%
934 Fast Food Restaurant w/Drive-Thru 1,000 sf 511.00Blend ITE 9th & FL
Studies 2.05 2.55 FL Studies 58% FL Studies 192.60 1.30 250.38 $100,599 $1,616 $29,774 $1,320 $20,578 $50,247 $9,389 435%
942 Automobile Care Center 1,000 sf 31.43Blend ITE 9th & FL
Studies 3.62 4.12 FL Studies 72% FL Studies 25.97 1.30 33.76 $13,564 $199 $3,666 $163 $2,541 $7,357 n/a n/a
944/946 Gas/Service Station with & without Car Wash fuel pos. 157.33
ITE 9th Edition(944 & 946 Blend) 1.90 2.40 FL Studies 23% FL Studies 21.79 1.30 28.33 $11,384 $186 $3,427 $152 $2,370 $5,587 $1,511 270%
947 Self-Service Car Wash service bay 43.94Blend ITE 9th & FL
Studies 2.18 2.68 FL Studies 68% FL Studies 20.65 1.30 26.85 $10,785 $171 $3,151 $140 $2,182 $5,452 $6,455 -16%
INDUSTRIAL:
110 General Light Industrial 1,000 sf 6.97 ITE 9th Edition 5.15 5.65 Same as LUC 710 92% Same as LUC 710 10.47 1.30 13.61 $5,468 $77 $1,419 $63 $982 $3,067 $1,208 154%
120 General Heavy Industrial 1,000 sf 1.50 ITE 9th Edition 5.15 5.65 Same as LUC 710 92% Same as LUC 710 2.25 1.30 2.93 $1,177 $17 $313 $14 $218 $646 $1,208 -47%
140 Manufacturing 1,000 sf 3.82 ITE 9th Edition 5.15 5.65 Same as LUC 710 92% Same as LUC 710 5.74 1.30 7.46 $2,997 $42 $774 $35 $546 $1,677 $1,208 39%
150 Warehousing 1,000 sf 3.56 ITE 9th Edition 5.15 5.65 Same as LUC 710 92% Same as LUC 710 5.35 1.30 6.96 $2,793 $40 $737 $32 $499 $1,557 $860 81%
151 Mini-Warehouse 1,000 sf 2.15Blend ITE 9th & FL
Studies 3.10 3.60FL Studies
(Pinellas County) 92% Same as LUC 710 1.94 1.30 2.52 $1,015 $15 $276 $12 $187 $552 $433 28%
152 High-Cube Warehouse 1,000 sf 1.68 ITE 9th Edition 5.15 5.65 Same as LUC 710 92% Same as LUC 710 2.52 1.30 3.28 $1,318 $19 $350 $15 $234 $734 n/a n/a

Tindale Oliver Hillsborough County April 2016 D-17 Mobility Fee Study
Table D‐6 Mobility Fee Schedule – Rural Area; ½% Sales Tax (20 year lifecycle)
Gasoline Tax Unit Cost per Lane Mile: $4,962,000 Interstate/Toll Facility Adjustment Factor: 36.6%$$ per gallon to capital: $0.213 $0.174 City Revenues: - Average PMC per Lane Mile: 9,263 10,806 Cost per PMC (Residential/Office/Industrial): $535.71
Facility life (years): 25 20 County Revenues: - Fuel Efficiency: 18.18 mpg Cost per PMC (Other Non-Residential): $459.18Interest rate: 2.50% 2.50% State Revenues: - Effectivedays per year: 365
ITE LUC Land Use Unit Trip Rate Trip Rate SourceAssessable Trip
LengthTotal Trip
LengthTrip Length Source
PercentNew Trips
% New Trips Source Net VMT(1) Person‐Trip Factor
Net PMTTotal
Mobility CostAnnualGas Tax
Gas Tax Credit
AnnualSales Tax
Sales Tax Credit
NetMobility Fee
Current Impact Fee
Zone 7(2)
% Change
RESIDENTIAL:
Single Family (Detached) - Less than 1,500 sf & Annual HH Income less than 50% SHIP Definition du 2.62
FL Studies(NHTS, AHS, Census) 6.62 7.12 FL Studies 100% n/a 5.50 1.30 7.15 $3,829 $40 $737 $33 $514 $2,578 $1,792 44%
Single Family (Detached) - Less than 1,500 sf & Annual HH Income between 50-80% SHIP Definition du 3.96
FL Studies(NHTS, AHS, Census) 6.62 7.12 FL Studies 100% n/a 8.31 1.30 10.80 $5,787 $60 $1,105 $49 $764 $3,918 $1,792 119%
Single Family (Detached) - Less than 1,500 sf du 6.11FL Studies
(NHTS, AHS, Census) 6.62 7.12 FL Studies 100% n/a 12.82 1.30 16.67 $8,930 $93 $1,713 $76 $1,185 $6,032 $1,792 237%
Single Family (Detached) - 1,501 to 2,499 sf du 7.81FL Studies
(NHTS, AHS, Census) 6.62 7.12 FL Studies 100% n/a 16.39 1.30 21.31 $11,414 $119 $2,193 $97 $1,512 $7,709 $1,792 330%
Single Family (Detached) - 2,500 sf and greater du 8.76FL Studies
(NHTS, AHS, Census) 6.62 7.12 FL Studies 100% n/a 18.38 1.30 23.89 $12,802 $133 $2,450 $109 $1,699 $8,653 $1,792 383%
Multi-Family (Apartment); 1-2 Stories - Annual HH Income less than 50% SHIP Definition du 2.38
Blend ITE 9th & FL Studies 5.10 5.60
FL Studies(LUC 220/230) 100% n/a 3.85 1.30 5.01 $2,680 $28 $516 $23 $359 $1,805 $1,242 45%
Multi-Family (Apartment); 1-2 Stories - Annual HH Income between 50-80% SHIP Definition du 3.60
Blend ITE 9th & FL Studies 5.10 5.60
FL Studies(LUC 220/230) 100% n/a 5.82 1.30 7.57 $4,053 $43 $792 $35 $546 $2,715 $1,242 119%
Multi-Family (Apartment); 1-2 Stories du 6.60Blend ITE 9th & FL
Studies 5.10 5.60FL Studies
(LUC 220/230) 100% n/a 10.67 1.30 13.87 $7,431 $79 $1,456 $65 $1,013 $4,962 $1,242 300%
Multi-Family (Apartment); 3+ Stories - Annual HH Income less than 50% SHIP Definition du 1.49
ITE 9th Edition (weighted avg) 5.10 5.60
FL Studies(LUC 220/230) 100% n/a 2.41 1.30 3.13 $1,678 $18 $332 $15 $234 $1,112 $1,242 -10%
Multi-Family (Apartment); 3+ Stories - Annual HH Income between 50-80% SHIP Definition du 2.25
ITE 9th Edition (weighted avg) 5.10 5.60
FL Studies(LUC 220/230) 100% n/a 3.64 1.30 4.73 $2,533 $27 $497 $22 $343 $1,693 $1,242 36%
Multi-Family (Apartment); 3+ Stories du 4.14ITE 9th Edition (weighted avg) 5.10 5.60
FL Studies(LUC 220/230) 100% n/a 6.69 1.30 8.70 $4,661 $50 $921 $40 $624 $3,116 $1,242 151%
230 Residential Condominium/Townhouse du 5.76Blend ITE 9th & FL
Studies 5.10 5.60FL Studies
(LUC 220/230) 100% n/a 9.31 1.30 12.10 $6,485 $69 $1,271 $56 $873 $4,341 $1,097 296%
232 High-Rise Condominium; 3+ Stories du 4.18 ITE 9th Edition 5.10 5.60FL Studies
(LUC 220/230) 100% n/a 6.76 1.30 8.79 $4,706 $50 $921 $41 $639 $3,146 $1,097 187%
240 Mobile Home Park du 4.17 FL Studies 4.60 5.10 FL Studies 100% n/a 6.08 1.30 7.90 $4,235 $45 $829 $37 $577 $2,829 $901 214%
253 Congregate Care Facility du 2.25Blend ITE 9th & FL
Studies 3.08 3.58 Same as LUC 210 72% FL Studies 1.58 1.30 2.05 $1,102 $12 $221 $10 $156 $725 n/a n/a
LODGING:
310 Hotel room 6.36Blend ITE 9th & FL
Studies 6.26 6.76 FL Studies 66% FL Studies 8.33 1.30 10.83 $4,972 $61 $1,124 $50 $779 $3,069 $1,546 99%
311 Hotel; All Suites room 4.90 ITE 9th Edition 6.26 6.76 Same as LUC 310 66% Same as LUC 310 6.42 1.30 8.35 $3,831 $47 $866 $38 $592 $2,373 $1,082 119%
320 Motel room 5.63 ITE 9th Edition 4.34 4.84 FL Studies 77% FL Studies 5.96 1.30 7.75 $3,560 $45 $829 $37 $577 $2,154 $1,579 36%
RECREATION:
412 General Recreation acre 2.28 ITE 9th Edition 5.11 5.61FL Studies
(Pinellas County) 90%FL Studies
(Pinellas County) 3.32 1.30 4.32 $1,984 $25 $461 $20 $312 $1,211 n/a n/a
416 RV Park(3) site 1.62ITE 9th Edition
(Adjusted) 4.60 5.10 Same as LUC 240 100%FL Studies
(Pinellas County) 2.36 1.30 3.07 $1,410 $18 $332 $14 $218 $860 n/a n/a
420 Marina boat berth 2.96 ITE 9th Edition 6.62 7.12 Same as LUC 210 90%FL Studies
(Pinellas County) 5.59 1.30 7.27 $3,337 $41 $755 $33 $514 $2,068 n/a n/a
430 Golf Course hole 35.74 ITE 9th Edition 6.62 7.12 Same as LUC 210 90%FL Studies
(Pinellas County) 67.50 1.30 87.75 $40,294 $490 $9,028 $400 $6,236 $25,030 $4,272 486%
444 Movie Theater screen 106.63Blend ITE 6th & FL
Studies 2.22 2.72 FL Studies 88% FL Studies 66.04 1.30 85.85 $39,418 $546 $10,060 $446 $6,953 $22,405 $9,164 145%
492 Health Club 1,000 sf 32.93 ITE 9th Edition 5.15 5.65 Same as LUC 710 94% FL Studies 50.53 1.30 65.69 $30,166 $374 $6,891 $305 $4,755 $18,520 n/a n/a
210
220
222/ 223

Tindale Oliver Hillsborough County April 2016 D-18 Mobility Fee Study
Table D‐6 (continued) Mobility Fee Schedule – Rural Area; ½% Sales Tax (20 year lifecycle)
ITE LUC Land Use Unit Trip Rate Trip Rate SourceAssessable Trip
LengthTotal Trip
LengthTrip Length Source
PercentNew Trips
% New Trips Source Net VMT(1) Person‐Trip Factor
Net PMTTotal
Mobility CostAnnualGas Tax
Gas Tax Credit
AnnualSales Tax
Sales Tax Credit
NetMobility Fee
Current Impact Fee
Zone 7(2)
% Change
INSTITUTIONS:
520 Elementary School (Private) student 1.29 ITE 9th Edition 4.30 4.80FL Studies
(Pinellas County) 80%FL Studies
(Pinellas County) 1.41 1.30 1.83 $840 $11 $203 $9 $140 $497 $61 715%
522 Middle School (Private) student 1.62 ITE 9th Edition 4.30 4.80FL Studies
(Pinellas County) 90%FL Studies
(Pinellas County) 1.99 1.30 2.59 $1,186 $15 $276 $12 $187 $723 n/a n/a
530 High School (Private) student 1.71 ITE 9th Edition 4.30 4.80FL Studies
(Pinellas County) 90%FL Studies
(Pinellas County) 2.10 1.30 2.73 $1,252 $16 $295 $13 $203 $754 n/a n/a
540University/Junior College (7,500 or fewer students) (Private) student 2.00 ITE Regression Analysis 6.62 7.12 Same as LUC 210 90%
FL Studies(Pinellas County) 3.78 1.30 4.91 $2,255 $27 $497 $22 $343 $1,415 n/a n/a
550University/Junior College (more than 7,500 students) (Private) student 1.50 ITE Regression Analysis 6.62 7.12 Same as LUC 210 90%
FL Studies(Pinellas County) 2.83 1.30 3.68 $1,691 $21 $387 $17 $265 $1,039 n/a n/a
560 Church 1,000 sf 9.11 ITE 9th Edition 3.90 4.40FL Studies
(Pinellas County) 90%FL Studies
(Pinellas County) 10.14 1.30 13.18 $6,051 $77 $1,419 $63 $982 $3,650 $544 571%
565 Day Care Center 1,000 sf 71.88Blend ITE 9th & FL
Studies 2.03 2.53 FL Studies 73% FL Studies 33.77 1.30 43.90 $20,156 $284 $5,233 $232 $3,617 $11,306 $1,500 654%
610 Hospital 1,000 sf 13.22 ITE 9th Edition 6.62 7.12 Same as LUC 210 77%FL Studies
(Pinellas County) 21.36 1.30 27.77 $12,752 $155 $2,856 $127 $1,980 $7,916 unit change n/a
620 Nursing Home bed 2.76Blend ITE 9th & FL
Studies 2.59 3.09 FL Studies 89% FL Studies 2.02 1.30 2.63 $1,204 $16 $295 $13 $203 $706 $194 264%
630 Clinic 1,000 sf 33.22Blend ITE 9th & FL
Studies 5.10 5.60 FL Studies 93% FL Studies 49.95 1.30 64.94 $29,815 $370 $6,817 $302 $4,708 $18,290 $1,880 873%
OFFICE:
General Office 50,000 sq ft or less(4) 1,000 sf 15.50 ITE 9th equation 5.15 5.65 FL Studies 92% FL Studies 23.28 1.30 30.26 $16,213 $172 $3,169 $141 $2,198 $10,846 $3,728 191%
General Office 50,001-100,000 sq ft(4) 1,000 sf 13.13 ITE 9th equation 5.15 5.65 FL Studies 92% FL Studies 19.72 1.30 25.64 $13,734 $146 $2,690 $119 $1,855 $9,189 $2,300 300%
General Office 100,001-200,000 sq ft(4) 1,000 sf 11.12 ITE 9th equation 5.15 5.65 FL Studies 92% FL Studies 16.70 1.30 21.71 $11,631 $124 $2,285 $101 $1,575 $7,771 $1,958 297%
General Office 200,001-400,000 sq ft(4) 1,000 sf 9.41 ITE 9th equation 5.15 5.65 FL Studies 92% FL Studies 14.13 1.30 18.37 $9,843 $105 $1,935 $85 $1,325 $6,583 $1,958 236%
General Office greater that 400,000 sq ft(4) 1,000 sf 8.54 ITE 9th equation 5.15 5.65 FL Studies 92% FL Studies 12.83 1.30 16.68 $8,933 $95 $1,750 $78 $1,216 $5,967 $1,958 205%
715 Single Tenant Office Building 1,000 sf 11.65 ITE 9th equation 5.15 5.65 Same as LUC 710 92% Same as LUC 710 17.50 1.30 22.75 $12,186 $129 $2,377 $106 $1,652 $8,157 $2,005 307%
720 Medical Office 10,000 sq ft or less 1,000 sf 23.83 FL Studies 5.55 6.05 FL Studies 89% FL Studies 37.31 1.30 48.50 $25,986 $274 $5,048 $224 $3,492 $17,446 $6,262 179%
720 Medical Office greater than 10,000 sq ft 1,000 sf 34.72Blend ITE 9th & FL
Studies 5.55 6.05 FL Studies 89% FL Studies 54.37 1.30 70.68 $37,861 $400 $7,370 $327 $5,098 $25,393 $6,262 306%
RETAIL:
813 Discount Superstore 1,000 sf 50.82 ITE 9th Edition 2.40 2.90Same as LUC 820(50k-200k sq ft) 67%
Same as LUC 820(50k-200k sq ft) 25.90 1.30 33.67 $15,463 $211 $3,888 $172 $2,681 $8,894 $2,807 217%
815 Discount Store; Free-Standing 1,000 sf 57.24 ITE 9th Edition 2.40 2.90Same as LUC 820(50k-200k sq ft) 67%
Same as LUC 820(50k-200k sq ft) 29.18 1.30 37.93 $17,417 $238 $4,385 $194 $3,024 $10,008 $3,384 196%
Shopping Center 50,000 sq ft or less(4)(5) 1,000 sfgla 86.56 ITE 9th equation 1.87 2.37 TL Regression 56% FL Curve 28.73 1.30 37.35 $17,153 $246 $4,532 $201 $3,133 $9,488 $1,565 506%
Shopping Center 50,001-200,000 sq ft(4)(5) 1,000 sfgla 53.28 ITE 9th equation 2.40 2.90 TL Regression 67% FL Curve 27.16 1.30 35.31 $16,212 $221 $4,072 $181 $2,822 $9,318 $3,181 193%
Shopping Center 200,001-400,000 sq ft(4)(5) 1,000 sfgla 41.80 ITE 9th equation 2.64 3.14 TL Regression 73% FL Curve 25.54 1.30 33.20 $15,244 $205 $3,777 $167 $2,603 $8,864 $5,504 61%
Shopping Center greater than 400,000 sq ft(4)(5) 1,000 sfgla 36.27 ITE 9th equation 2.87 3.37 TL Regression 76% FL Curve 25.08 1.30 32.60 $14,970 $199 $3,666 $162 $2,525 $8,779 $5,504 60%
841 New/Used Auto Sales 1,000 sf 28.25Blend ITE 9th & FL
Studies 4.60 5.10 FL Studies 79% FL Studies 32.54 1.30 42.30 $19,426 $243 $4,477 $199 $3,102 $11,847 $4,482 164%
853 Convenience Market w/Gasoline 1,000 sf 775.14Blend ITE 9th & FL
Studies 1.51 2.01 FL Studies 28% FL Studies 103.89 1.30 135.06 $62,015 $933 $17,190 $762 $11,879 $32,946 $7,581 335%
710
820

Tindale Oliver Hillsborough County April 2016 D-19 Mobility Fee Study
Table D‐6 (continued) Mobility Fee Schedule – Rural Area; ½% Sales Tax (20 year lifecycle)
1) Net VMT calculated as ((Trip Generation Rate* Trip Length* % New Trips)*(1-Interstate/Toll Facility Adjustment Factor)/2). This reflects the unit of vehicle miles of capacity consumed per unit of development and is multiplied by the cost per vehicle 2) Source: Hillsborough County Department of Development Services; Fees shown for Zone 7 3) The ITE 9th Edition trip generation rate was adjusted to reflect the average occupancy rate of 60 percent based on data provided by the Florida Association of RV Parks and Campgrounds 4) The trip generation rates recommended for the offices and shopping centers use the end-point regression value 5) In the case of shopping centers with up to 300,000 square feet, fast-food, convenience store, and gas stations located on outparcels should be charged separately using their individual categories, as opposed to the general shopping center rate
ITE LUC Land Use Unit Trip Rate Trip Rate SourceAssessable Trip
LengthTotal Trip
LengthTrip Length Source
PercentNew Trips
% New Trips Source Net VMT(1) Person‐Trip Factor
Net PMTTotal
Mobility CostAnnualGas Tax
Gas Tax Credit
AnnualSales Tax
Sales Tax Credit
NetMobility Fee
Current Impact Fee
Zone 7(2)
% Change
RETAIL:
857 Discount Club 1,000 sf 41.80 ITE 9th Edition 2.40 2.90Same as LUC 820(50k-200k sq ft) 67%
Same as LUC 820(50k-200k sq ft) 21.31 1.30 27.70 $12,719 $174 $3,206 $142 $2,214 $7,299 $2,498 192%
862 Home Improvement Superstore 1,000 sf 30.74 ITE 9th Edition 2.40 2.90Same as LUC 820(50k-200k sq ft) 67%
Same as LUC 820(50k-200k sq ft) 15.67 1.30 20.37 $9,354 $128 $2,358 $104 $1,621 $5,375 $2,095 157%
863 Electronics Superstore 1,000 sf 45.04 ITE 9th Edition 1.87 2.37Same as LUC 820(50k sq ft or less) 56%
Same as LUC 820(50k sq ft or less) 14.95 1.30 19.44 $8,925 $128 $2,358 $104 $1,621 $4,946 $2,692 84%
880/881 Pharmacy/Drug Store with & without Drive-Thru 1,000 sf 95.96
Blend ITE 9th & FL Studies 2.08 2.58 FL Studies 32% FL Studies 20.25 1.30 26.33 $12,086 $169 $3,114 $138 $2,151 $6,821 $5,269 30%
890 Furniture Store 1,000 sf 5.06 ITE 9th Edition 6.09 6.59 FL Studies 54% FL Studies 5.27 1.30 6.85 $3,149 $39 $719 $31 $483 $1,947 $605 222%
912 Bank/Savings Drive-In 1,000 sf 159.34Blend ITE 9th & FL
Studies 2.46 2.96 FL Studies 46% FL Studies 57.16 1.30 74.31 $34,119 $464 $8,549 $379 $5,908 $19,662 $15,850 24%
931 Quality Restaurant 1,000 sf 91.10Blend ITE 9th & FL
Studies 3.14 3.64 FL Studies 77% FL Studies 69.82 1.30 90.77 $41,680 $546 $10,060 $446 $6,953 $24,667 $10,752 129%
932 High-Turn Over Restaurant 1,000 sf 116.60Blend ITE 9th & FL
Studies 3.17 3.67 FL Studies 71% FL Studies 83.19 1.30 108.15 $49,659 $650 $11,976 $531 $8,278 $29,405 $7,790 278%
934 Fast Food Restaurant w/Drive-Thru 1,000 sf 511.00Blend ITE 9th & FL
Studies 2.05 2.55 FL Studies 58% FL Studies 192.60 1.30 250.38 $114,971 $1,616 $29,774 $1,320 $20,578 $64,619 $9,389 588%
942 Automobile Care Center 1,000 sf 31.43Blend ITE 9th & FL
Studies 3.62 4.12 FL Studies 72% FL Studies 25.97 1.30 33.76 $15,501 $199 $3,666 $163 $2,541 $9,294 n/a n/a
944/946 Gas/Service Station with & without Car Wash fuel pos. 157.33
ITE 9th Edition(944 & 946 Blend) 1.90 2.40 FL Studies 23% FL Studies 21.79 1.30 28.33 $13,010 $186 $3,427 $152 $2,370 $7,213 $1,511 377%
947 Self-Service Car Wash service bay 43.94Blend ITE 9th & FL
Studies 2.18 2.68 FL Studies 68% FL Studies 20.65 1.30 26.85 $12,326 $171 $3,151 $140 $2,182 $6,993 $6,455 8%
INDUSTRIAL:
110 General Light Industrial 1,000 sf 6.97 ITE 9th Edition 5.15 5.65 Same as LUC 710 92% Same as LUC 710 10.47 1.30 13.61 $7,291 $77 $1,419 $63 $982 $4,890 $1,208 305%
120 General Heavy Industrial 1,000 sf 1.50 ITE 9th Edition 5.15 5.65 Same as LUC 710 92% Same as LUC 710 2.25 1.30 2.93 $1,569 $17 $313 $14 $218 $1,038 $1,208 -14%
140 Manufacturing 1,000 sf 3.82 ITE 9th Edition 5.15 5.65 Same as LUC 710 92% Same as LUC 710 5.74 1.30 7.46 $3,996 $42 $774 $35 $546 $2,676 $1,208 122%
150 Warehousing 1,000 sf 3.56 ITE 9th Edition 5.15 5.65 Same as LUC 710 92% Same as LUC 710 5.35 1.30 6.96 $3,724 $40 $737 $32 $499 $2,488 $860 189%
151 Mini-Warehouse 1,000 sf 2.15Blend ITE 9th & FL
Studies 3.10 3.60FL Studies
(Pinellas County) 92% Same as LUC 710 1.94 1.30 2.52 $1,354 $15 $276 $12 $187 $891 $433 106%
152 High-Cube Warehouse 1,000 sf 1.68 ITE 9th Edition 5.15 5.65 Same as LUC 710 92% Same as LUC 710 2.52 1.30 3.28 $1,757 $19 $350 $15 $234 $1,173 n/a n/a

Tindale Oliver Hillsborough County April 2016 D-20 Mobility Fee Study
Table D‐7 Mobility Fee Schedule – Urban Area; ½% Sales Tax (30 year lifecycle)
Gasoline Tax Unit Cost per Lane Mile: $4,962,000 Interstate/Toll Facility Adjustment Factor: 36.6%$$ per gallon to capital: $0.213 $0.174 City Revenues: Average PMC per Lane Mile: 12,350 12,350 Cost per PMC: $401.78
Facility life (years): 25 30 County Revenues: Fuel Efficiency: 18.18 mpgInterest rate: 2.50% 2.50% State Revenues: Effectivedays per year: 365
ITE LUC Land Use Unit Trip Rate Trip Rate SourceAssessable Trip
LengthTotal Trip
LengthTrip Length Source
PercentNew Trips
% New Trips Source Net VMT(1) Person‐Trip Factor
Net PMTTotal
Mobility CostAnnualGas Tax
Gas Tax Credit
AnnualSales Tax
Sales Tax Credit
NetMobility Fee
Current Impact Fee
Zone 7(2)
% Change
RESIDENTIAL:
Single Family (Detached) - Less than 1,500 sf & Annual HH Income less than 50% SHIP Definition du 2.62
FL Studies(NHTS, AHS, Census) 6.62 7.12 FL Studies 100% n/a 5.50 1.30 7.15 $2,872 $40 $737 $33 $691 $1,444 $1,792 -19%
Single Family (Detached) - Less than 1,500 sf & Annual HH Income between 50-80% SHIP Definition du 3.96
FL Studies(NHTS, AHS, Census) 6.62 7.12 FL Studies 100% n/a 8.31 1.30 10.80 $4,341 $60 $1,105 $49 $1,026 $2,210 $1,792 23%
Single Family (Detached) - Less than 1,500 sf du 6.11FL Studies
(NHTS, AHS, Census) 6.62 7.12 FL Studies 100% n/a 12.82 1.30 16.67 $6,697 $93 $1,713 $76 $1,591 $3,393 $1,792 89%
Single Family (Detached) - 1,501 to 2,499 sf du 7.81FL Studies
(NHTS, AHS, Census) 6.62 7.12 FL Studies 100% n/a 16.39 1.30 21.31 $8,561 $119 $2,193 $97 $2,030 $4,338 $1,792 142%
Single Family (Detached) - 2,500 sf and greater du 8.76FL Studies
(NHTS, AHS, Census) 6.62 7.12 FL Studies 100% n/a 18.38 1.30 23.89 $9,602 $133 $2,450 $109 $2,281 $4,871 $1,792 172%
Multi-Family (Apartment); 1-2 Stories - Annual HH Income less than 50% SHIP Definition du 2.38
Blend ITE 9th & FL Studies 5.10 5.60
FL Studies(LUC 220/230) 100% n/a 3.85 1.30 5.01 $2,010 $28 $516 $23 $481 $1,013 $1,242 -18%
Multi-Family (Apartment); 1-2 Stories - Annual HH Income between 50-80% SHIP Definition du 3.60
Blend ITE 9th & FL Studies 5.10 5.60
FL Studies(LUC 220/230) 100% n/a 5.82 1.30 7.57 $3,040 $43 $792 $35 $733 $1,515 $1,242 22%
Multi-Family (Apartment); 1-2 Stories du 6.60Blend ITE 9th & FL
Studies 5.10 5.60FL Studies
(LUC 220/230) 100% n/a 10.67 1.30 13.87 $5,573 $79 $1,456 $65 $1,360 $2,757 $1,242 122%
Multi-Family (Apartment); 3+ Stories - Annual HH Income less than 50% SHIP Definition du 1.49
ITE 9th Edition (weighted avg) 5.10 5.60
FL Studies(LUC 220/230) 100% n/a 2.41 1.30 3.13 $1,258 $18 $332 $15 $314 $612 $1,242 -51%
Multi-Family (Apartment); 3+ Stories - Annual HH Income between 50-80% SHIP Definition du 2.25
ITE 9th Edition (weighted avg) 5.10 5.60
FL Studies(LUC 220/230) 100% n/a 3.64 1.30 4.73 $1,900 $27 $497 $22 $460 $943 $1,242 -24%
Multi-Family (Apartment); 3+ Stories du 4.14ITE 9th Edition (weighted avg) 5.10 5.60
FL Studies(LUC 220/230) 100% n/a 6.69 1.30 8.70 $3,496 $50 $921 $40 $837 $1,738 $1,242 40%
230 Residential Condominium/Townhouse du 5.76Blend ITE 9th & FL
Studies 5.10 5.60FL Studies
(LUC 220/230) 100% n/a 9.31 1.30 12.10 $4,864 $69 $1,271 $56 $1,172 $2,421 $1,097 121%
232 High-Rise Condominium; 3+ Stories du 4.18 ITE 9th Edition 5.10 5.60FL Studies
(LUC 220/230) 100% n/a 6.76 1.30 8.79 $3,530 $50 $921 $41 $858 $1,751 $1,097 60%
240 Mobile Home Park du 4.17 FL Studies 4.60 5.10 FL Studies 100% n/a 6.08 1.30 7.90 $3,176 $45 $829 $37 $774 $1,573 $901 75%
253 Congregate Care Facility du 2.25Blend ITE 9th & FL
Studies 3.08 3.58 Same as LUC 210 72% FL Studies 1.58 1.30 2.05 $826 $12 $221 $10 $209 $396 n/a n/a
LODGING:
310 Hotel room 6.36Blend ITE 9th & FL
Studies 6.26 6.76 FL Studies 66% FL Studies 8.33 1.30 10.83 $4,351 $61 $1,124 $50 $1,047 $2,180 $1,546 41%
311 Hotel; All Suites room 4.90 ITE 9th Edition 6.26 6.76 Same as LUC 310 66% Same as LUC 310 6.42 1.30 8.35 $3,352 $47 $866 $38 $795 $1,691 $1,082 56%
320 Motel room 5.63 ITE 9th Edition 4.34 4.84 FL Studies 77% FL Studies 5.96 1.30 7.75 $3,115 $45 $829 $37 $774 $1,512 $1,579 -4%
RECREATION:
412 General Recreation acre 2.28 ITE 9th Edition 5.11 5.61FL Studies
(Pinellas County) 90%FL Studies
(Pinellas County) 3.32 1.30 4.32 $1,736 $25 $461 $20 $419 $856 n/a n/a
416 RV Park(3) site 1.62ITE 9th Edition
(Adjusted) 4.60 5.10 Same as LUC 240 100%FL Studies
(Pinellas County) 2.36 1.30 3.07 $1,234 $18 $332 $14 $293 $609 n/a n/a
420 Marina boat berth 2.96 ITE 9th Edition 6.62 7.12 Same as LUC 210 90%FL Studies
(Pinellas County) 5.59 1.30 7.27 $2,920 $41 $755 $33 $691 $1,474 n/a n/a
430 Golf Course hole 35.74 ITE 9th Edition 6.62 7.12 Same as LUC 210 90%FL Studies
(Pinellas County) 67.50 1.30 87.75 $35,257 $490 $9,028 $400 $8,372 $17,857 $4,272 318%
444 Movie Theater screen 106.63Blend ITE 6th & FL
Studies 2.22 2.72 FL Studies 88% FL Studies 66.04 1.30 85.85 $34,491 $546 $10,060 $446 $9,335 $15,096 $9,164 65%
492 Health Club 1,000 sf 32.93 ITE 9th Edition 5.15 5.65 Same as LUC 710 94% FL Studies 50.53 1.30 65.69 $26,395 $374 $6,891 $305 $6,384 $13,120 n/a n/a
210
220
222/ 223

Tindale Oliver Hillsborough County April 2016 D-21 Mobility Fee Study
Table D‐7 (continued) Mobility Fee Schedule – Urban Area; ½% Sales Tax (30 year lifecycle)
ITE LUC Land Use Unit Trip Rate Trip Rate SourceAssessable Trip
LengthTotal Trip
LengthTrip Length Source
PercentNew Trips
% New Trips Source Net VMT(1) Person‐Trip Factor
Net PMTTotal
Mobility CostAnnualGas Tax
Gas Tax Credit
AnnualSales Tax
Sales Tax Credit
NetMobility Fee
Current Impact Fee
Zone 7(2)
% Change
INSTITUTIONS:
520 Elementary School (Private) student 1.29 ITE 9th Edition 4.30 4.80FL Studies
(Pinellas County) 80%FL Studies
(Pinellas County) 1.41 1.30 1.83 $735 $11 $203 $9 $188 $344 $61 464%
522 Middle School (Private) student 1.62 ITE 9th Edition 4.30 4.80FL Studies
(Pinellas County) 90%FL Studies
(Pinellas County) 1.99 1.30 2.59 $1,038 $15 $276 $12 $251 $511 n/a n/a
530 High School (Private) student 1.71 ITE 9th Edition 4.30 4.80FL Studies
(Pinellas County) 90%FL Studies
(Pinellas County) 2.10 1.30 2.73 $1,096 $16 $295 $13 $272 $529 n/a n/a
540University/Junior College (7,500 or fewer students) (Private) student 2.00 ITE Regression Analysis 6.62 7.12 Same as LUC 210 90%
FL Studies(Pinellas County) 3.78 1.30 4.91 $1,973 $27 $497 $22 $460 $1,016 n/a n/a
550University/Junior College (more than 7,500 students) (Private) student 1.50 ITE Regression Analysis 6.62 7.12 Same as LUC 210 90%
FL Studies(Pinellas County) 2.83 1.30 3.68 $1,480 $21 $387 $17 $356 $737 n/a n/a
560 Church 1,000 sf 9.11 ITE 9th Edition 3.90 4.40FL Studies
(Pinellas County) 90%FL Studies
(Pinellas County) 10.14 1.30 13.18 $5,294 $77 $1,419 $63 $1,319 $2,556 $544 370%
565 Day Care Center 1,000 sf 71.88Blend ITE 9th & FL
Studies 2.03 2.53 FL Studies 73% FL Studies 33.77 1.30 43.90 $17,637 $284 $5,233 $232 $4,856 $7,548 $1,500 403%
610 Hospital 1,000 sf 13.22 ITE 9th Edition 6.62 7.12 Same as LUC 210 77%FL Studies
(Pinellas County) 21.36 1.30 27.77 $11,158 $155 $2,856 $127 $2,658 $5,644 unit change n/a
620 Nursing Home bed 2.76Blend ITE 9th & FL
Studies 2.59 3.09 FL Studies 89% FL Studies 2.02 1.30 2.63 $1,053 $16 $295 $13 $272 $486 $194 151%
630 Clinic 1,000 sf 33.22Blend ITE 9th & FL
Studies 5.10 5.60 FL Studies 93% FL Studies 49.95 1.30 64.94 $26,088 $370 $6,817 $302 $6,321 $12,950 $1,880 589%
OFFICE:
General Office 50,000 sq ft or less(4) 1,000 sf 15.50 ITE 9th equation 5.15 5.65 FL Studies 92% FL Studies 23.28 1.30 30.26 $12,160 $172 $3,169 $141 $2,951 $6,040 $3,728 62%
General Office 50,001-100,000 sq ft(4) 1,000 sf 13.13 ITE 9th equation 5.15 5.65 FL Studies 92% FL Studies 19.72 1.30 25.64 $10,300 $146 $2,690 $119 $2,491 $5,119 $2,300 123%
General Office 100,001-200,000 sq ft(4) 1,000 sf 11.12 ITE 9th equation 5.15 5.65 FL Studies 92% FL Studies 16.70 1.30 21.71 $8,724 $124 $2,285 $101 $2,114 $4,325 $1,958 121%
General Office 200,001-400,000 sq ft(4) 1,000 sf 9.41 ITE 9th equation 5.15 5.65 FL Studies 92% FL Studies 14.13 1.30 18.37 $7,382 $105 $1,935 $85 $1,779 $3,668 $1,958 87%
General Office greater that 400,000 sq ft(4) 1,000 sf 8.54 ITE 9th equation 5.15 5.65 FL Studies 92% FL Studies 12.83 1.30 16.68 $6,700 $95 $1,750 $78 $1,633 $3,317 $1,958 69%
715 Single Tenant Office Building 1,000 sf 11.65 ITE 9th equation 5.15 5.65 Same as LUC 710 92% Same as LUC 710 17.50 1.30 22.75 $9,139 $129 $2,377 $106 $2,219 $4,543 $2,005 127%
720 Medical Office 10,000 sq ft or less 1,000 sf 23.83 FL Studies 5.55 6.05 FL Studies 89% FL Studies 37.31 1.30 48.50 $19,489 $274 $5,048 $224 $4,688 $9,753 $6,262 56%
720 Medical Office greater than 10,000 sq ft 1,000 sf 34.72Blend ITE 9th & FL
Studies 5.55 6.05 FL Studies 89% FL Studies 54.37 1.30 70.68 $28,396 $400 $7,370 $327 $6,844 $14,182 $6,262 127%
RETAIL:
813 Discount Superstore 1,000 sf 50.82 ITE 9th Edition 2.40 2.90Same as LUC 820(50k-200k sq ft) 67%
Same as LUC 820(50k-200k sq ft) 25.90 1.30 33.67 $13,530 $211 $3,888 $172 $3,600 $6,042 $2,807 115%
815 Discount Store; Free-Standing 1,000 sf 57.24 ITE 9th Edition 2.40 2.90Same as LUC 820(50k-200k sq ft) 67%
Same as LUC 820(50k-200k sq ft) 29.18 1.30 37.93 $15,240 $238 $4,385 $194 $4,060 $6,795 $3,384 101%
Shopping Center 50,000 sq ft or less(4)(5) 1,000 sfgla 86.56 ITE 9th equation 1.87 2.37 TL Regression 56% FL Curve 28.73 1.30 37.35 $15,009 $246 $4,532 $201 $4,207 $6,270 $1,565 301%
Shopping Center 50,001-200,000 sq ft(4)(5) 1,000 sfgla 53.28 ITE 9th equation 2.40 2.90 TL Regression 67% FL Curve 27.16 1.30 35.31 $14,185 $221 $4,072 $181 $3,788 $6,325 $3,181 99%
Shopping Center 200,001-400,000 sq ft(4)(5) 1,000 sfgla 41.80 ITE 9th equation 2.64 3.14 TL Regression 73% FL Curve 25.54 1.30 33.20 $13,338 $205 $3,777 $167 $3,495 $6,066 $5,504 10%
Shopping Center greater than 400,000 sq ft(4)(5) 1,000 sfgla 36.27 ITE 9th equation 2.87 3.37 TL Regression 76% FL Curve 25.08 1.30 32.60 $13,099 $199 $3,666 $162 $3,391 $6,042 $5,504 10%
841 New/Used Auto Sales 1,000 sf 28.25Blend ITE 9th & FL
Studies 4.60 5.10 FL Studies 79% FL Studies 32.54 1.30 42.30 $16,998 $243 $4,477 $199 $4,165 $8,356 $4,482 86%
853 Convenience Market w/Gasoline 1,000 sf 775.14Blend ITE 9th & FL
Studies 1.51 2.01 FL Studies 28% FL Studies 103.89 1.30 135.06 $54,263 $933 $17,190 $762 $15,949 $21,124 $7,581 179%
710
820

Tindale Oliver Hillsborough County April 2016 D-22 Mobility Fee Study
Table D‐7 (continued) Mobility Fee Schedule – Urban Area; ½% Sales Tax (30 year lifecycle)
1) Net VMT calculated as ((Trip Generation Rate* Trip Length* % New Trips)*(1-Interstate/Toll Facility Adjustment Factor)/2). This reflects the unit of vehicle miles of capacity consumed per unit of development and is multiplied by the cost per vehicle 2) Source: Hillsborough County Department of Development Services; Fees shown for Zone 7 3) The ITE 9th Edition trip generation rate was adjusted to reflect the average occupancy rate of 60 percent based on data provided by the Florida Association of RV Parks and Campgrounds 4) The trip generation rates recommended for the offices and shopping centers use the end-point regression value 5) In the case of shopping centers with up to 300,000 square feet, fast-food, convenience store, and gas stations located on outparcels should be charged separately using their individual categories, as opposed to the general shopping center rate
Gasoline Tax Unit Cost per Lane Mile: $4,962,000 Interstate/Toll Facility Adjustment Factor: ll Facility Adjustment Factor: 36.6%$$ per gallon to capital: $0.213 $0.174 City Revenues: Average PMC per Lane Mile: 12,350 12,350 Cost per PMC: Cost per PMC: $401.78
Facility life (years): 25 30 County Revenues: Fuel Efficiency: 18.18 mpgInterest rate: 2.50% 2.50% State Revenues: Effectivedays per year: 365
ITE LUC Land Use Unit Trip Rate Trip Rate SourceAssessable Trip
LengthTotal Trip
LengthTrip Length Source
PercentNew Trips
% New Trips Source Net VMT(1) Person‐Trip Factor
Net PMTTotal
Mobility CostAnnualGas Tax
Gas Tax Credit
AnnualSales Tax
Sales Tax Credit
NetMobility Fee
Current Impact Fee
Zone 7(2)
% Change
RETAIL:
857 Discount Club 1,000 sf 41.80 ITE 9th Edition 2.40 2.90Same as LUC 820(50k-200k sq ft) 67%
Same as LUC 820(50k-200k sq ft) 21.31 1.30 27.70 $11,129 $174 $3,206 $142 $2,972 $4,951 $2,498 98%
862 Home Improvement Superstore 1,000 sf 30.74 ITE 9th Edition 2.40 2.90Same as LUC 820(50k-200k sq ft) 67%
Same as LUC 820(50k-200k sq ft) 15.67 1.30 20.37 $8,184 $128 $2,358 $104 $2,177 $3,649 $2,095 74%
863 Electronics Superstore 1,000 sf 45.04 ITE 9th Edition 1.87 2.37Same as LUC 820(50k sq ft or less) 56%
Same as LUC 820(50k sq ft or less) 14.95 1.30 19.44 $7,809 $128 $2,358 $104 $2,177 $3,274 $2,692 22%
880/881 Pharmacy/Drug Store with & without Drive-Thru 1,000 sf 95.96
Blend ITE 9th & FL Studies 2.08 2.58 FL Studies 32% FL Studies 20.25 1.30 26.33 $10,575 $169 $3,114 $138 $2,888 $4,573 $5,269 -13%
890 Furniture Store 1,000 sf 5.06 ITE 9th Edition 6.09 6.59 FL Studies 54% FL Studies 5.27 1.30 6.85 $2,755 $39 $719 $31 $649 $1,387 $605 129%
912 Bank/Savings Drive-In 1,000 sf 159.34Blend ITE 9th & FL
Studies 2.46 2.96 FL Studies 46% FL Studies 57.16 1.30 74.31 $29,855 $464 $8,549 $379 $7,933 $13,373 $15,850 -16%
931 Quality Restaurant 1,000 sf 91.10Blend ITE 9th & FL
Studies 3.14 3.64 FL Studies 77% FL Studies 69.82 1.30 90.77 $36,470 $546 $10,060 $446 $9,335 $17,075 $10,752 59%
932 High-Turn Over Restaurant 1,000 sf 116.60Blend ITE 9th & FL
Studies 3.17 3.67 FL Studies 71% FL Studies 83.19 1.30 108.15 $43,452 $650 $11,976 $531 $11,114 $20,362 $7,790 161%
934 Fast Food Restaurant w/Drive-Thru 1,000 sf 511.00Blend ITE 9th & FL
Studies 2.05 2.55 FL Studies 58% FL Studies 192.60 1.30 250.38 $100,599 $1,616 $29,774 $1,320 $27,628 $43,197 $9,389 360%
942 Automobile Care Center 1,000 sf 31.43Blend ITE 9th & FL
Studies 3.62 4.12 FL Studies 72% FL Studies 25.97 1.30 33.76 $13,564 $199 $3,666 $163 $3,412 $6,486 n/a n/a
944/946 Gas/Service Station with & without Car Wash fuel pos. 157.33
ITE 9th Edition(944 & 946 Blend) 1.90 2.40 FL Studies 23% FL Studies 21.79 1.30 28.33 $11,384 $186 $3,427 $152 $3,181 $4,776 $1,511 216%
947 Self-Service Car Wash service bay 43.94Blend ITE 9th & FL
Studies 2.18 2.68 FL Studies 68% FL Studies 20.65 1.30 26.85 $10,785 $171 $3,151 $140 $2,930 $4,704 $6,455 -27%
INDUSTRIAL:
110 General Light Industrial 1,000 sf 6.97 ITE 9th Edition 5.15 5.65 Same as LUC 710 92% Same as LUC 710 10.47 1.30 13.61 $5,468 $77 $1,419 $63 $1,319 $2,730 $1,208 126%
120 General Heavy Industrial 1,000 sf 1.50 ITE 9th Edition 5.15 5.65 Same as LUC 710 92% Same as LUC 710 2.25 1.30 2.93 $1,177 $17 $313 $14 $293 $571 $1,208 -53%
140 Manufacturing 1,000 sf 3.82 ITE 9th Edition 5.15 5.65 Same as LUC 710 92% Same as LUC 710 5.74 1.30 7.46 $2,997 $42 $774 $35 $733 $1,490 $1,208 23%
150 Warehousing 1,000 sf 3.56 ITE 9th Edition 5.15 5.65 Same as LUC 710 92% Same as LUC 710 5.35 1.30 6.96 $2,793 $40 $737 $32 $670 $1,386 $860 61%
151 Mini-Warehouse 1,000 sf 2.15Blend ITE 9th & FL
Studies 3.10 3.60FL Studies
(Pinellas County) 92% Same as LUC 710 1.94 1.30 2.52 $1,015 $15 $276 $12 $251 $488 $433 13%
152 High-Cube Warehouse 1,000 sf 1.68 ITE 9th Edition 5.15 5.65 Same as LUC 710 92% Same as LUC 710 2.52 1.30 3.28 $1,318 $19 $350 $15 $314 $654 n/a n/a

Tindale Oliver Hillsborough County April 2016 D-23 Mobility Fee Study
Table D‐8 Mobility Fee Schedule – Rural Area; ½% Sales Tax (30 year lifecycle)
Gasoline Tax Unit Cost per Lane Mile: $4,962,000 Interstate/Toll Facility Adjustment Factor: 36.6%$$ per gallon to capital: $0.213 $0.174 City Revenues: - Average PMC per Lane Mile: 9,263 10,806 Cost per PMC (Residential/Office/Industrial): $535.71
Facility life (years): 25 30 County Revenues: - Fuel Efficiency: 18.18 mpg Cost per PMC (Other Non-Residential): $459.18Interest rate: 2.50% 2.50% State Revenues: - Effectivedays per year: 365
ITE LUC Land Use Unit Trip Rate Trip Rate SourceAssessable Trip
LengthTotal Trip
LengthTrip Length Source
PercentNew Trips
% New Trips Source Net VMT(1) Person‐Trip Factor
Net PMTTotal
Mobility CostAnnualGas Tax
Gas Tax Credit
AnnualSales Tax
Sales Tax Credit
NetMobility Fee
Current Impact Fee
Zone 7(2)
% Change
RESIDENTIAL:
Single Family (Detached) - Less than 1,500 sf & Annual HH Income less than 50% SHIP Definition du 2.62
FL Studies(NHTS, AHS, Census) 6.62 7.12 FL Studies 100% n/a 5.50 1.30 7.15 $3,829 $40 $737 $33 $691 $2,401 $1,792 34%
Single Family (Detached) - Less than 1,500 sf & Annual HH Income between 50-80% SHIP Definition du 3.96
FL Studies(NHTS, AHS, Census) 6.62 7.12 FL Studies 100% n/a 8.31 1.30 10.80 $5,787 $60 $1,105 $49 $1,026 $3,656 $1,792 104%
Single Family (Detached) - Less than 1,500 sf du 6.11FL Studies
(NHTS, AHS, Census) 6.62 7.12 FL Studies 100% n/a 12.82 1.30 16.67 $8,930 $93 $1,713 $76 $1,591 $5,626 $1,792 214%
Single Family (Detached) - 1,501 to 2,499 sf du 7.81FL Studies
(NHTS, AHS, Census) 6.62 7.12 FL Studies 100% n/a 16.39 1.30 21.31 $11,414 $119 $2,193 $97 $2,030 $7,191 $1,792 301%
Single Family (Detached) - 2,500 sf and greater du 8.76FL Studies
(NHTS, AHS, Census) 6.62 7.12 FL Studies 100% n/a 18.38 1.30 23.89 $12,802 $133 $2,450 $109 $2,281 $8,071 $1,792 350%
Multi-Family (Apartment); 1-2 Stories - Annual HH Income less than 50% SHIP Definition du 2.38
Blend ITE 9th & FL Studies 5.10 5.60
FL Studies(LUC 220/230) 100% n/a 3.85 1.30 5.01 $2,680 $28 $516 $23 $481 $1,683 $1,242 36%
Multi-Family (Apartment); 1-2 Stories - Annual HH Income between 50-80% SHIP Definition du 3.60
Blend ITE 9th & FL Studies 5.10 5.60
FL Studies(LUC 220/230) 100% n/a 5.82 1.30 7.57 $4,053 $43 $792 $35 $733 $2,528 $1,242 104%
Multi-Family (Apartment); 1-2 Stories du 6.60Blend ITE 9th & FL
Studies 5.10 5.60FL Studies
(LUC 220/230) 100% n/a 10.67 1.30 13.87 $7,431 $79 $1,456 $65 $1,360 $4,615 $1,242 272%
Multi-Family (Apartment); 3+ Stories - Annual HH Income less than 50% SHIP Definition du 1.49
ITE 9th Edition (weighted avg) 5.10 5.60
FL Studies(LUC 220/230) 100% n/a 2.41 1.30 3.13 $1,678 $18 $332 $15 $314 $1,032 $1,242 -17%
Multi-Family (Apartment); 3+ Stories - Annual HH Income between 50-80% SHIP Definition du 2.25
ITE 9th Edition (weighted avg) 5.10 5.60
FL Studies(LUC 220/230) 100% n/a 3.64 1.30 4.73 $2,533 $27 $497 $22 $460 $1,576 $1,242 27%
Multi-Family (Apartment); 3+ Stories du 4.14ITE 9th Edition (weighted avg) 5.10 5.60
FL Studies(LUC 220/230) 100% n/a 6.69 1.30 8.70 $4,661 $50 $921 $40 $837 $2,903 $1,242 134%
230 Residential Condominium/Townhouse du 5.76Blend ITE 9th & FL
Studies 5.10 5.60FL Studies
(LUC 220/230) 100% n/a 9.31 1.30 12.10 $6,485 $69 $1,271 $56 $1,172 $4,042 $1,097 268%
232 High-Rise Condominium; 3+ Stories du 4.18 ITE 9th Edition 5.10 5.60FL Studies
(LUC 220/230) 100% n/a 6.76 1.30 8.79 $4,706 $50 $921 $41 $858 $2,927 $1,097 167%
240 Mobile Home Park du 4.17 FL Studies 4.60 5.10 FL Studies 100% n/a 6.08 1.30 7.90 $4,235 $45 $829 $37 $774 $2,632 $901 192%
253 Congregate Care Facility du 2.25Blend ITE 9th & FL
Studies 3.08 3.58 Same as LUC 210 72% FL Studies 1.58 1.30 2.05 $1,102 $12 $221 $10 $209 $672 n/a n/a
LODGING:
310 Hotel room 6.36Blend ITE 9th & FL
Studies 6.26 6.76 FL Studies 66% FL Studies 8.33 1.30 10.83 $4,972 $61 $1,124 $50 $1,047 $2,801 $1,546 81%
311 Hotel; All Suites room 4.90 ITE 9th Edition 6.26 6.76 Same as LUC 310 66% Same as LUC 310 6.42 1.30 8.35 $3,831 $47 $866 $38 $795 $2,170 $1,082 101%
320 Motel room 5.63 ITE 9th Edition 4.34 4.84 FL Studies 77% FL Studies 5.96 1.30 7.75 $3,560 $45 $829 $37 $774 $1,957 $1,579 24%
RECREATION:
412 General Recreation acre 2.28 ITE 9th Edition 5.11 5.61FL Studies
(Pinellas County) 90%FL Studies
(Pinellas County) 3.32 1.30 4.32 $1,984 $25 $461 $20 $419 $1,104 n/a n/a
416 RV Park(3) site 1.62ITE 9th Edition
(Adjusted) 4.60 5.10 Same as LUC 240 100%FL Studies
(Pinellas County) 2.36 1.30 3.07 $1,410 $18 $332 $14 $293 $785 n/a n/a
420 Marina boat berth 2.96 ITE 9th Edition 6.62 7.12 Same as LUC 210 90%FL Studies
(Pinellas County) 5.59 1.30 7.27 $3,337 $41 $755 $33 $691 $1,891 n/a n/a
430 Golf Course hole 35.74 ITE 9th Edition 6.62 7.12 Same as LUC 210 90%FL Studies
(Pinellas County) 67.50 1.30 87.75 $40,294 $490 $9,028 $400 $8,372 $22,894 $4,272 436%
444 Movie Theater screen 106.63Blend ITE 6th & FL
Studies 2.22 2.72 FL Studies 88% FL Studies 66.04 1.30 85.85 $39,418 $546 $10,060 $446 $9,335 $20,023 $9,164 119%
492 Health Club 1,000 sf 32.93 ITE 9th Edition 5.15 5.65 Same as LUC 710 94% FL Studies 50.53 1.30 65.69 $30,166 $374 $6,891 $305 $6,384 $16,891 n/a n/a
210
220
222/ 223

Tindale Oliver Hillsborough County April 2016 D-24 Mobility Fee Study
Table D‐8 (continued) Mobility Fee Schedule – Rural Area; ½% Sales Tax (30 year lifecycle)
ITE LUC Land Use Unit Trip Rate Trip Rate SourceAssessable Trip
LengthTotal Trip
LengthTrip Length Source
PercentNew Trips
% New Trips Source Net VMT(1) Person‐Trip Factor
Net PMTTotal
Mobility CostAnnualGas Tax
Gas Tax Credit
AnnualSales Tax
Sales Tax Credit
NetMobility Fee
Current Impact Fee
Zone 7(2)
% Change
INSTITUTIONS:
520 Elementary School (Private) student 1.29 ITE 9th Edition 4.30 4.80FL Studies
(Pinellas County) 80%FL Studies
(Pinellas County) 1.41 1.30 1.83 $840 $11 $203 $9 $188 $449 $61 636%
522 Middle School (Private) student 1.62 ITE 9th Edition 4.30 4.80FL Studies
(Pinellas County) 90%FL Studies
(Pinellas County) 1.99 1.30 2.59 $1,186 $15 $276 $12 $251 $659 n/a n/a
530 High School (Private) student 1.71 ITE 9th Edition 4.30 4.80FL Studies
(Pinellas County) 90%FL Studies
(Pinellas County) 2.10 1.30 2.73 $1,252 $16 $295 $13 $272 $685 n/a n/a
540University/Junior College (7,500 or fewer students) (Private) student 2.00 ITE Regression Analysis 6.62 7.12 Same as LUC 210 90%
FL Studies(Pinellas County) 3.78 1.30 4.91 $2,255 $27 $497 $22 $460 $1,298 n/a n/a
550University/Junior College (more than 7,500 students) (Private) student 1.50 ITE Regression Analysis 6.62 7.12 Same as LUC 210 90%
FL Studies(Pinellas County) 2.83 1.30 3.68 $1,691 $21 $387 $17 $356 $948 n/a n/a
560 Church 1,000 sf 9.11 ITE 9th Edition 3.90 4.40FL Studies
(Pinellas County) 90%FL Studies
(Pinellas County) 10.14 1.30 13.18 $6,051 $77 $1,419 $63 $1,319 $3,313 $544 509%
565 Day Care Center 1,000 sf 71.88Blend ITE 9th & FL
Studies 2.03 2.53 FL Studies 73% FL Studies 33.77 1.30 43.90 $20,156 $284 $5,233 $232 $4,856 $10,067 $1,500 571%
610 Hospital 1,000 sf 13.22 ITE 9th Edition 6.62 7.12 Same as LUC 210 77%FL Studies
(Pinellas County) 21.36 1.30 27.77 $12,752 $155 $2,856 $127 $2,658 $7,238 unit change n/a
620 Nursing Home bed 2.76Blend ITE 9th & FL
Studies 2.59 3.09 FL Studies 89% FL Studies 2.02 1.30 2.63 $1,204 $16 $295 $13 $272 $637 $194 228%
630 Clinic 1,000 sf 33.22Blend ITE 9th & FL
Studies 5.10 5.60 FL Studies 93% FL Studies 49.95 1.30 64.94 $29,815 $370 $6,817 $302 $6,321 $16,677 $1,880 787%
OFFICE:
General Office 50,000 sq ft or less(4) 1,000 sf 15.50 ITE 9th equation 5.15 5.65 FL Studies 92% FL Studies 23.28 1.30 30.26 $16,213 $172 $3,169 $141 $2,951 $10,093 $3,728 171%
General Office 50,001-100,000 sq ft(4) 1,000 sf 13.13 ITE 9th equation 5.15 5.65 FL Studies 92% FL Studies 19.72 1.30 25.64 $13,734 $146 $2,690 $119 $2,491 $8,553 $2,300 272%
General Office 100,001-200,000 sq ft(4) 1,000 sf 11.12 ITE 9th equation 5.15 5.65 FL Studies 92% FL Studies 16.70 1.30 21.71 $11,631 $124 $2,285 $101 $2,114 $7,232 $1,958 269%
General Office 200,001-400,000 sq ft(4) 1,000 sf 9.41 ITE 9th equation 5.15 5.65 FL Studies 92% FL Studies 14.13 1.30 18.37 $9,843 $105 $1,935 $85 $1,779 $6,129 $1,958 213%
General Office greater that 400,000 sq ft(4) 1,000 sf 8.54 ITE 9th equation 5.15 5.65 FL Studies 92% FL Studies 12.83 1.30 16.68 $8,933 $95 $1,750 $78 $1,633 $5,550 $1,958 184%
715 Single Tenant Office Building 1,000 sf 11.65 ITE 9th equation 5.15 5.65 Same as LUC 710 92% Same as LUC 710 17.50 1.30 22.75 $12,186 $129 $2,377 $106 $2,219 $7,590 $2,005 279%
720 Medical Office 10,000 sq ft or less 1,000 sf 23.83 FL Studies 5.55 6.05 FL Studies 89% FL Studies 37.31 1.30 48.50 $25,986 $274 $5,048 $224 $4,688 $16,250 $6,262 160%
720 Medical Office greater than 10,000 sq ft 1,000 sf 34.72Blend ITE 9th & FL
Studies 5.55 6.05 FL Studies 89% FL Studies 54.37 1.30 70.68 $37,861 $400 $7,370 $327 $6,844 $23,647 $6,262 278%
RETAIL:
813 Discount Superstore 1,000 sf 50.82 ITE 9th Edition 2.40 2.90Same as LUC 820(50k-200k sq ft) 67%
Same as LUC 820(50k-200k sq ft) 25.90 1.30 33.67 $15,463 $211 $3,888 $172 $3,600 $7,975 $2,807 184%
815 Discount Store; Free-Standing 1,000 sf 57.24 ITE 9th Edition 2.40 2.90Same as LUC 820(50k-200k sq ft) 67%
Same as LUC 820(50k-200k sq ft) 29.18 1.30 37.93 $17,417 $238 $4,385 $194 $4,060 $8,972 $3,384 165%
Shopping Center 50,000 sq ft or less(4)(5) 1,000 sfgla 86.56 ITE 9th equation 1.87 2.37 TL Regression 56% FL Curve 28.73 1.30 37.35 $17,153 $246 $4,532 $201 $4,207 $8,414 $1,565 438%
Shopping Center 50,001-200,000 sq ft(4)(5) 1,000 sfgla 53.28 ITE 9th equation 2.40 2.90 TL Regression 67% FL Curve 27.16 1.30 35.31 $16,212 $221 $4,072 $181 $3,788 $8,352 $3,181 163%
Shopping Center 200,001-400,000 sq ft(4)(5) 1,000 sfgla 41.80 ITE 9th equation 2.64 3.14 TL Regression 73% FL Curve 25.54 1.30 33.20 $15,244 $205 $3,777 $167 $3,495 $7,972 $5,504 45%
Shopping Center greater than 400,000 sq ft(4)(5) 1,000 sfgla 36.27 ITE 9th equation 2.87 3.37 TL Regression 76% FL Curve 25.08 1.30 32.60 $14,970 $199 $3,666 $162 $3,391 $7,913 $5,504 44%
841 New/Used Auto Sales 1,000 sf 28.25Blend ITE 9th & FL
Studies 4.60 5.10 FL Studies 79% FL Studies 32.54 1.30 42.30 $19,426 $243 $4,477 $199 $4,165 $10,784 $4,482 141%
853 Convenience Market w/Gasoline 1,000 sf 775.14Blend ITE 9th & FL
Studies 1.51 2.01 FL Studies 28% FL Studies 103.89 1.30 135.06 $62,015 $933 $17,190 $762 $15,949 $28,876 $7,581 281%
710
820
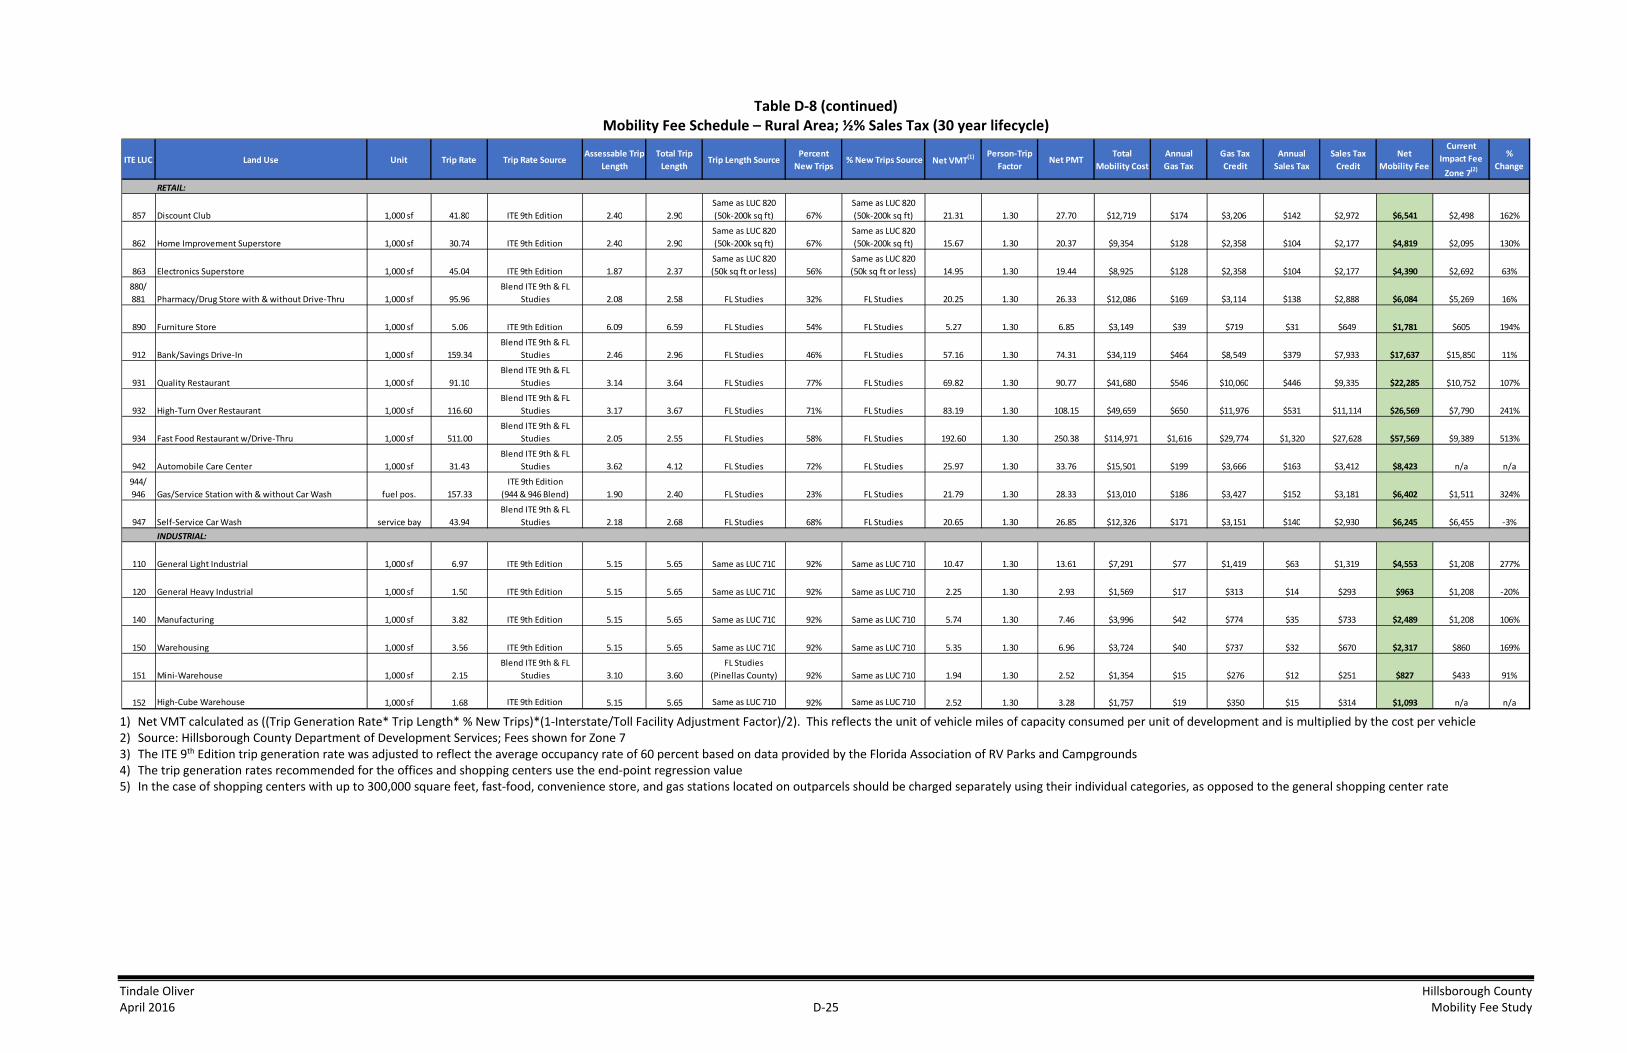
Tindale Oliver Hillsborough County April 2016 D-25 Mobility Fee Study
Table D‐8 (continued) Mobility Fee Schedule – Rural Area; ½% Sales Tax (30 year lifecycle)
1) Net VMT calculated as ((Trip Generation Rate* Trip Length* % New Trips)*(1-Interstate/Toll Facility Adjustment Factor)/2). This reflects the unit of vehicle miles of capacity consumed per unit of development and is multiplied by the cost per vehicle 2) Source: Hillsborough County Department of Development Services; Fees shown for Zone 7 3) The ITE 9th Edition trip generation rate was adjusted to reflect the average occupancy rate of 60 percent based on data provided by the Florida Association of RV Parks and Campgrounds 4) The trip generation rates recommended for the offices and shopping centers use the end-point regression value 5) In the case of shopping centers with up to 300,000 square feet, fast-food, convenience store, and gas stations located on outparcels should be charged separately using their individual categories, as opposed to the general shopping center rate
ITE LUC Land Use Unit Trip Rate Trip Rate SourceAssessable Trip
LengthTotal Trip
LengthTrip Length Source
PercentNew Trips
% New Trips Source Net VMT(1) Person‐Trip Factor
Net PMTTotal
Mobility CostAnnualGas Tax
Gas Tax Credit
AnnualSales Tax
Sales Tax Credit
NetMobility Fee
Current Impact Fee
Zone 7(2)
% Change
RETAIL:
857 Discount Club 1,000 sf 41.80 ITE 9th Edition 2.40 2.90Same as LUC 820(50k-200k sq ft) 67%
Same as LUC 820(50k-200k sq ft) 21.31 1.30 27.70 $12,719 $174 $3,206 $142 $2,972 $6,541 $2,498 162%
862 Home Improvement Superstore 1,000 sf 30.74 ITE 9th Edition 2.40 2.90Same as LUC 820(50k-200k sq ft) 67%
Same as LUC 820(50k-200k sq ft) 15.67 1.30 20.37 $9,354 $128 $2,358 $104 $2,177 $4,819 $2,095 130%
863 Electronics Superstore 1,000 sf 45.04 ITE 9th Edition 1.87 2.37Same as LUC 820(50k sq ft or less) 56%
Same as LUC 820(50k sq ft or less) 14.95 1.30 19.44 $8,925 $128 $2,358 $104 $2,177 $4,390 $2,692 63%
880/881 Pharmacy/Drug Store with & without Drive-Thru 1,000 sf 95.96
Blend ITE 9th & FL Studies 2.08 2.58 FL Studies 32% FL Studies 20.25 1.30 26.33 $12,086 $169 $3,114 $138 $2,888 $6,084 $5,269 16%
890 Furniture Store 1,000 sf 5.06 ITE 9th Edition 6.09 6.59 FL Studies 54% FL Studies 5.27 1.30 6.85 $3,149 $39 $719 $31 $649 $1,781 $605 194%
912 Bank/Savings Drive-In 1,000 sf 159.34Blend ITE 9th & FL
Studies 2.46 2.96 FL Studies 46% FL Studies 57.16 1.30 74.31 $34,119 $464 $8,549 $379 $7,933 $17,637 $15,850 11%
931 Quality Restaurant 1,000 sf 91.10Blend ITE 9th & FL
Studies 3.14 3.64 FL Studies 77% FL Studies 69.82 1.30 90.77 $41,680 $546 $10,060 $446 $9,335 $22,285 $10,752 107%
932 High-Turn Over Restaurant 1,000 sf 116.60Blend ITE 9th & FL
Studies 3.17 3.67 FL Studies 71% FL Studies 83.19 1.30 108.15 $49,659 $650 $11,976 $531 $11,114 $26,569 $7,790 241%
934 Fast Food Restaurant w/Drive-Thru 1,000 sf 511.00Blend ITE 9th & FL
Studies 2.05 2.55 FL Studies 58% FL Studies 192.60 1.30 250.38 $114,971 $1,616 $29,774 $1,320 $27,628 $57,569 $9,389 513%
942 Automobile Care Center 1,000 sf 31.43Blend ITE 9th & FL
Studies 3.62 4.12 FL Studies 72% FL Studies 25.97 1.30 33.76 $15,501 $199 $3,666 $163 $3,412 $8,423 n/a n/a
944/946 Gas/Service Station with & without Car Wash fuel pos. 157.33
ITE 9th Edition(944 & 946 Blend) 1.90 2.40 FL Studies 23% FL Studies 21.79 1.30 28.33 $13,010 $186 $3,427 $152 $3,181 $6,402 $1,511 324%
947 Self-Service Car Wash service bay 43.94Blend ITE 9th & FL
Studies 2.18 2.68 FL Studies 68% FL Studies 20.65 1.30 26.85 $12,326 $171 $3,151 $140 $2,930 $6,245 $6,455 -3%
INDUSTRIAL:
110 General Light Industrial 1,000 sf 6.97 ITE 9th Edition 5.15 5.65 Same as LUC 710 92% Same as LUC 710 10.47 1.30 13.61 $7,291 $77 $1,419 $63 $1,319 $4,553 $1,208 277%
120 General Heavy Industrial 1,000 sf 1.50 ITE 9th Edition 5.15 5.65 Same as LUC 710 92% Same as LUC 710 2.25 1.30 2.93 $1,569 $17 $313 $14 $293 $963 $1,208 -20%
140 Manufacturing 1,000 sf 3.82 ITE 9th Edition 5.15 5.65 Same as LUC 710 92% Same as LUC 710 5.74 1.30 7.46 $3,996 $42 $774 $35 $733 $2,489 $1,208 106%
150 Warehousing 1,000 sf 3.56 ITE 9th Edition 5.15 5.65 Same as LUC 710 92% Same as LUC 710 5.35 1.30 6.96 $3,724 $40 $737 $32 $670 $2,317 $860 169%
151 Mini-Warehouse 1,000 sf 2.15Blend ITE 9th & FL
Studies 3.10 3.60FL Studies
(Pinellas County) 92% Same as LUC 710 1.94 1.30 2.52 $1,354 $15 $276 $12 $251 $827 $433 91%
152 High-Cube Warehouse 1,000 sf 1.68 ITE 9th Edition 5.15 5.65 Same as LUC 710 92% Same as LUC 710 2.52 1.30 3.28 $1,757 $19 $350 $15 $314 $1,093 n/a n/a

Tindale Oliver Hillsborough County April 2016 D-26 Mobility Fee Study
Table D‐9 Mobility Fee Schedule – Urban Area; ½% Sales Tax (10 year lifecycle)
Gasoline Tax Unit Cost per Lane Mile: $4,962,000 Interstate/Toll Facility Adjustment Factor: 36.6%$$ per gallon to capital: $0.213 $0.174 City Revenues: Average PMC per Lane Mile: 12,350 12,350 Cost per PMC: $401.78
Facility life (years): 25 10 County Revenues: Fuel Efficiency: 18.18 mpgInterest rate: 2.50% 2.50% State Revenues: Effectivedays per year: 365
ITE LUC Land Use Unit Trip Rate Trip Rate SourceAssessable Trip
LengthTotal Trip
LengthTrip Length Source
PercentNew Trips
% New Trips Source Net VMT(1) Person‐Trip Factor
Net PMTTotal
Mobility CostAnnualGas Tax
Gas Tax Credit
AnnualSales Tax
Sales Tax Credit
NetMobility Fee
Current Impact Fee
Zone 7(2)
% Change
RESIDENTIAL:
Single Family (Detached) - Less than 1,500 sf & Annual HH Income less than 50% SHIP Definition du 2.62
FL Studies(NHTS, AHS, Census) 6.62 7.12 FL Studies 100% n/a 5.50 1.30 7.15 $2,872 $40 $737 $33 $289 $1,846 $1,792 3%
Single Family (Detached) - Less than 1,500 sf & Annual HH Income between 50-80% SHIP Definition du 3.96
FL Studies(NHTS, AHS, Census) 6.62 7.12 FL Studies 100% n/a 8.31 1.30 10.80 $4,341 $60 $1,105 $49 $429 $2,807 $1,792 57%
Single Family (Detached) - Less than 1,500 sf du 6.11FL Studies
(NHTS, AHS, Census) 6.62 7.12 FL Studies 100% n/a 12.82 1.30 16.67 $6,697 $93 $1,713 $76 $665 $4,319 $1,792 141%
Single Family (Detached) - 1,501 to 2,499 sf du 7.81FL Studies
(NHTS, AHS, Census) 6.62 7.12 FL Studies 100% n/a 16.39 1.30 21.31 $8,561 $119 $2,193 $97 $849 $5,519 $1,792 208%
Single Family (Detached) - 2,500 sf and greater du 8.76FL Studies
(NHTS, AHS, Census) 6.62 7.12 FL Studies 100% n/a 18.38 1.30 23.89 $9,602 $133 $2,450 $109 $954 $6,198 $1,792 246%
Multi-Family (Apartment); 1-2 Stories - Annual HH Income less than 50% SHIP Definition du 2.38
Blend ITE 9th & FL Studies 5.10 5.60
FL Studies(LUC 220/230) 100% n/a 3.85 1.30 5.01 $2,010 $28 $516 $23 $201 $1,293 $1,242 4%
Multi-Family (Apartment); 1-2 Stories - Annual HH Income between 50-80% SHIP Definition du 3.60
Blend ITE 9th & FL Studies 5.10 5.60
FL Studies(LUC 220/230) 100% n/a 5.82 1.30 7.57 $3,040 $43 $792 $35 $306 $1,942 $1,242 56%
Multi-Family (Apartment); 1-2 Stories du 6.60Blend ITE 9th & FL
Studies 5.10 5.60FL Studies
(LUC 220/230) 100% n/a 10.67 1.30 13.87 $5,573 $79 $1,456 $65 $569 $3,548 $1,242 186%
Multi-Family (Apartment); 3+ Stories - Annual HH Income less than 50% SHIP Definition du 1.49
ITE 9th Edition (weighted avg) 5.10 5.60
FL Studies(LUC 220/230) 100% n/a 2.41 1.30 3.13 $1,258 $18 $332 $15 $131 $795 $1,242 -36%
Multi-Family (Apartment); 3+ Stories - Annual HH Income between 50-80% SHIP Definition du 2.25
ITE 9th Edition (weighted avg) 5.10 5.60
FL Studies(LUC 220/230) 100% n/a 3.64 1.30 4.73 $1,900 $27 $497 $22 $193 $1,210 $1,242 -3%
Multi-Family (Apartment); 3+ Stories du 4.14ITE 9th Edition (weighted avg) 5.10 5.60
FL Studies(LUC 220/230) 100% n/a 6.69 1.30 8.70 $3,496 $50 $921 $40 $350 $2,225 $1,242 79%
230 Residential Condominium/Townhouse du 5.76Blend ITE 9th & FL
Studies 5.10 5.60FL Studies
(LUC 220/230) 100% n/a 9.31 1.30 12.10 $4,864 $69 $1,271 $56 $490 $3,103 $1,097 183%
232 High-Rise Condominium; 3+ Stories du 4.18 ITE 9th Edition 5.10 5.60FL Studies
(LUC 220/230) 100% n/a 6.76 1.30 8.79 $3,530 $50 $921 $41 $359 $2,250 $1,097 105%
240 Mobile Home Park du 4.17 FL Studies 4.60 5.10 FL Studies 100% n/a 6.08 1.30 7.90 $3,176 $45 $829 $37 $324 $2,023 $901 125%
253 Congregate Care Facility du 2.25Blend ITE 9th & FL
Studies 3.08 3.58 Same as LUC 210 72% FL Studies 1.58 1.30 2.05 $826 $12 $221 $10 $88 $517 n/a n/a
LODGING:
310 Hotel room 6.36Blend ITE 9th & FL
Studies 6.26 6.76 FL Studies 66% FL Studies 8.33 1.30 10.83 $4,351 $61 $1,124 $50 $438 $2,789 $1,546 80%
311 Hotel; All Suites room 4.90 ITE 9th Edition 6.26 6.76 Same as LUC 310 66% Same as LUC 310 6.42 1.30 8.35 $3,352 $47 $866 $38 $333 $2,153 $1,082 99%
320 Motel room 5.63 ITE 9th Edition 4.34 4.84 FL Studies 77% FL Studies 5.96 1.30 7.75 $3,115 $45 $829 $37 $324 $1,962 $1,579 24%
RECREATION:
412 General Recreation acre 2.28 ITE 9th Edition 5.11 5.61FL Studies
(Pinellas County) 90%FL Studies
(Pinellas County) 3.32 1.30 4.32 $1,736 $25 $461 $20 $175 $1,100 n/a n/a
416 RV Park(3) site 1.62ITE 9th Edition
(Adjusted) 4.60 5.10 Same as LUC 240 100%FL Studies
(Pinellas County) 2.36 1.30 3.07 $1,234 $18 $332 $14 $123 $779 n/a n/a
420 Marina boat berth 2.96 ITE 9th Edition 6.62 7.12 Same as LUC 210 90%FL Studies
(Pinellas County) 5.59 1.30 7.27 $2,920 $41 $755 $33 $289 $1,876 n/a n/a
430 Golf Course hole 35.74 ITE 9th Edition 6.62 7.12 Same as LUC 210 90%FL Studies
(Pinellas County) 67.50 1.30 87.75 $35,257 $490 $9,028 $400 $3,501 $22,728 $4,272 432%
444 Movie Theater screen 106.63Blend ITE 6th & FL
Studies 2.22 2.72 FL Studies 88% FL Studies 66.04 1.30 85.85 $34,491 $546 $10,060 $446 $3,903 $20,528 $9,164 124%
492 Health Club 1,000 sf 32.93 ITE 9th Edition 5.15 5.65 Same as LUC 710 94% FL Studies 50.53 1.30 65.69 $26,395 $374 $6,891 $305 $2,669 $16,835 n/a n/a
210
220
222/ 223

Tindale Oliver Hillsborough County April 2016 D-27 Mobility Fee Study
Table D‐9 (continued) Mobility Fee Schedule – Urban Area; ½% Sales Tax (10 year lifecycle)
ITE LUC Land Use Unit Trip Rate Trip Rate SourceAssessable Trip
LengthTotal Trip
LengthTrip Length Source
PercentNew Trips
% New Trips Source Net VMT(1) Person‐Trip Factor
Net PMTTotal
Mobility CostAnnualGas Tax
Gas Tax Credit
AnnualSales Tax
Sales Tax Credit
NetMobility Fee
Current Impact Fee
Zone 7(2)
% Change
INSTITUTIONS:
520 Elementary School (Private) student 1.29 ITE 9th Edition 4.30 4.80FL Studies
(Pinellas County) 80%FL Studies
(Pinellas County) 1.41 1.30 1.83 $735 $11 $203 $9 $79 $453 $61 643%
522 Middle School (Private) student 1.62 ITE 9th Edition 4.30 4.80FL Studies
(Pinellas County) 90%FL Studies
(Pinellas County) 1.99 1.30 2.59 $1,038 $15 $276 $12 $105 $657 n/a n/a
530 High School (Private) student 1.71 ITE 9th Edition 4.30 4.80FL Studies
(Pinellas County) 90%FL Studies
(Pinellas County) 2.10 1.30 2.73 $1,096 $16 $295 $13 $114 $687 n/a n/a
540University/Junior College (7,500 or fewer students) (Private) student 2.00 ITE Regression Analysis 6.62 7.12 Same as LUC 210 90%
FL Studies(Pinellas County) 3.78 1.30 4.91 $1,973 $27 $497 $22 $193 $1,283 n/a n/a
550University/Junior College (more than 7,500 students) (Private) student 1.50 ITE Regression Analysis 6.62 7.12 Same as LUC 210 90%
FL Studies(Pinellas County) 2.83 1.30 3.68 $1,480 $21 $387 $17 $149 $944 n/a n/a
560 Church 1,000 sf 9.11 ITE 9th Edition 3.90 4.40FL Studies
(Pinellas County) 90%FL Studies
(Pinellas County) 10.14 1.30 13.18 $5,294 $77 $1,419 $63 $551 $3,324 $544 511%
565 Day Care Center 1,000 sf 71.88Blend ITE 9th & FL
Studies 2.03 2.53 FL Studies 73% FL Studies 33.77 1.30 43.90 $17,637 $284 $5,233 $232 $2,030 $10,374 $1,500 592%
610 Hospital 1,000 sf 13.22 ITE 9th Edition 6.62 7.12 Same as LUC 210 77%FL Studies
(Pinellas County) 21.36 1.30 27.77 $11,158 $155 $2,856 $127 $1,112 $7,190 unit change n/a
620 Nursing Home bed 2.76Blend ITE 9th & FL
Studies 2.59 3.09 FL Studies 89% FL Studies 2.02 1.30 2.63 $1,053 $16 $295 $13 $114 $644 $194 232%
630 Clinic 1,000 sf 33.22Blend ITE 9th & FL
Studies 5.10 5.60 FL Studies 93% FL Studies 49.95 1.30 64.94 $26,088 $370 $6,817 $302 $2,643 $16,628 $1,880 785%
OFFICE:
General Office 50,000 sq ft or less(4) 1,000 sf 15.50 ITE 9th equation 5.15 5.65 FL Studies 92% FL Studies 23.28 1.30 30.26 $12,160 $172 $3,169 $141 $1,234 $7,757 $3,728 108%
General Office 50,001-100,000 sq ft(4) 1,000 sf 13.13 ITE 9th equation 5.15 5.65 FL Studies 92% FL Studies 19.72 1.30 25.64 $10,300 $146 $2,690 $119 $1,041 $6,569 $2,300 186%
General Office 100,001-200,000 sq ft(4) 1,000 sf 11.12 ITE 9th equation 5.15 5.65 FL Studies 92% FL Studies 16.70 1.30 21.71 $8,724 $124 $2,285 $101 $884 $5,555 $1,958 184%
General Office 200,001-400,000 sq ft(4) 1,000 sf 9.41 ITE 9th equation 5.15 5.65 FL Studies 92% FL Studies 14.13 1.30 18.37 $7,382 $105 $1,935 $85 $744 $4,703 $1,958 140%
General Office greater that 400,000 sq ft(4) 1,000 sf 8.54 ITE 9th equation 5.15 5.65 FL Studies 92% FL Studies 12.83 1.30 16.68 $6,700 $95 $1,750 $78 $683 $4,267 $1,958 118%
715 Single Tenant Office Building 1,000 sf 11.65 ITE 9th equation 5.15 5.65 Same as LUC 710 92% Same as LUC 710 17.50 1.30 22.75 $9,139 $129 $2,377 $106 $928 $5,834 $2,005 191%
720 Medical Office 10,000 sq ft or less 1,000 sf 23.83 FL Studies 5.55 6.05 FL Studies 89% FL Studies 37.31 1.30 48.50 $19,489 $274 $5,048 $224 $1,960 $12,481 $6,262 99%
720 Medical Office greater than 10,000 sq ft 1,000 sf 34.72Blend ITE 9th & FL
Studies 5.55 6.05 FL Studies 89% FL Studies 54.37 1.30 70.68 $28,396 $400 $7,370 $327 $2,862 $18,164 $6,262 190%
RETAIL:
813 Discount Superstore 1,000 sf 50.82 ITE 9th Edition 2.40 2.90Same as LUC 820(50k-200k sq ft) 67%
Same as LUC 820(50k-200k sq ft) 25.90 1.30 33.67 $13,530 $211 $3,888 $172 $1,505 $8,137 $2,807 190%
815 Discount Store; Free-Standing 1,000 sf 57.24 ITE 9th Edition 2.40 2.90Same as LUC 820(50k-200k sq ft) 67%
Same as LUC 820(50k-200k sq ft) 29.18 1.30 37.93 $15,240 $238 $4,385 $194 $1,698 $9,157 $3,384 171%
Shopping Center 50,000 sq ft or less(4)(5) 1,000 sfgla 86.56 ITE 9th equation 1.87 2.37 TL Regression 56% FL Curve 28.73 1.30 37.35 $15,009 $246 $4,532 $201 $1,759 $8,718 $1,565 457%
Shopping Center 50,001-200,000 sq ft(4)(5) 1,000 sfgla 53.28 ITE 9th equation 2.40 2.90 TL Regression 67% FL Curve 27.16 1.30 35.31 $14,185 $221 $4,072 $181 $1,584 $8,529 $3,181 168%
Shopping Center 200,001-400,000 sq ft(4)(5) 1,000 sfgla 41.80 ITE 9th equation 2.64 3.14 TL Regression 73% FL Curve 25.54 1.30 33.20 $13,338 $205 $3,777 $167 $1,462 $8,099 $5,504 47%
Shopping Center greater than 400,000 sq ft(4)(5) 1,000 sfgla 36.27 ITE 9th equation 2.87 3.37 TL Regression 76% FL Curve 25.08 1.30 32.60 $13,099 $199 $3,666 $162 $1,418 $8,015 $5,504 46%
841 New/Used Auto Sales 1,000 sf 28.25Blend ITE 9th & FL
Studies 4.60 5.10 FL Studies 79% FL Studies 32.54 1.30 42.30 $16,998 $243 $4,477 $199 $1,742 $10,779 $4,482 141%
853 Convenience Market w/Gasoline 1,000 sf 775.14Blend ITE 9th & FL
Studies 1.51 2.01 FL Studies 28% FL Studies 103.89 1.30 135.06 $54,263 $933 $17,190 $762 $6,669 $30,404 $7,581 301%
710
820

Tindale Oliver Hillsborough County April 2016 D-28 Mobility Fee Study
Table D‐9 (continued) Mobility Fee Schedule – Urban Area; ½% Sales Tax (10 year lifecycle)
1) Net VMT calculated as ((Trip Generation Rate* Trip Length* % New Trips)*(1-Interstate/Toll Facility Adjustment Factor)/2). This reflects the unit of vehicle miles of capacity consumed per unit of development and is multiplied by the cost per vehicle 2) Source: Hillsborough County Department of Development Services; Fees shown for Zone 7 3) The ITE 9th Edition trip generation rate was adjusted to reflect the average occupancy rate of 60 percent based on data provided by the Florida Association of RV Parks and Campgrounds 4) The trip generation rates recommended for the offices and shopping centers use the end-point regression value 5) In the case of shopping centers with up to 300,000 square feet, fast-food, convenience store, and gas stations located on outparcels should be charged separately using their individual categories, as opposed to the general shopping center rate
ITE LUC Land Use Unit Trip Rate Trip Rate SourceAssessable Trip
LengthTotal Trip
LengthTrip Length Source
PercentNew Trips
% New Trips Source Net VMT(1) Person‐Trip Factor
Net PMTTotal
Mobility CostAnnualGas Tax
Gas Tax Credit
AnnualSales Tax
Sales Tax Credit
NetMobility Fee
Current Impact Fee
Zone 7(2)
% Change
RETAIL:
857 Discount Club 1,000 sf 41.80 ITE 9th Edition 2.40 2.90Same as LUC 820(50k-200k sq ft) 67%
Same as LUC 820(50k-200k sq ft) 21.31 1.30 27.70 $11,129 $174 $3,206 $142 $1,243 $6,680 $2,498 167%
862 Home Improvement Superstore 1,000 sf 30.74 ITE 9th Edition 2.40 2.90Same as LUC 820(50k-200k sq ft) 67%
Same as LUC 820(50k-200k sq ft) 15.67 1.30 20.37 $8,184 $128 $2,358 $104 $910 $4,916 $2,095 135%
863 Electronics Superstore 1,000 sf 45.04 ITE 9th Edition 1.87 2.37Same as LUC 820(50k sq ft or less) 56%
Same as LUC 820(50k sq ft or less) 14.95 1.30 19.44 $7,809 $128 $2,358 $104 $910 $4,541 $2,692 69%
880/881 Pharmacy/Drug Store with & without Drive-Thru 1,000 sf 95.96
Blend ITE 9th & FL Studies 2.08 2.58 FL Studies 32% FL Studies 20.25 1.30 26.33 $10,575 $169 $3,114 $138 $1,208 $6,253 $5,269 19%
890 Furniture Store 1,000 sf 5.06 ITE 9th Edition 6.09 6.59 FL Studies 54% FL Studies 5.27 1.30 6.85 $2,755 $39 $719 $31 $271 $1,765 $605 192%
912 Bank/Savings Drive-In 1,000 sf 159.34Blend ITE 9th & FL
Studies 2.46 2.96 FL Studies 46% FL Studies 57.16 1.30 74.31 $29,855 $464 $8,549 $379 $3,317 $17,989 $15,850 14%
931 Quality Restaurant 1,000 sf 91.10Blend ITE 9th & FL
Studies 3.14 3.64 FL Studies 77% FL Studies 69.82 1.30 90.77 $36,470 $546 $10,060 $446 $3,903 $22,507 $10,752 109%
932 High-Turn Over Restaurant 1,000 sf 116.60Blend ITE 9th & FL
Studies 3.17 3.67 FL Studies 71% FL Studies 83.19 1.30 108.15 $43,452 $650 $11,976 $531 $4,647 $26,829 $7,790 244%
934 Fast Food Restaurant w/Drive-Thru 1,000 sf 511.00Blend ITE 9th & FL
Studies 2.05 2.55 FL Studies 58% FL Studies 192.60 1.30 250.38 $100,599 $1,616 $29,774 $1,320 $11,553 $59,272 $9,389 531%
942 Automobile Care Center 1,000 sf 31.43Blend ITE 9th & FL
Studies 3.62 4.12 FL Studies 72% FL Studies 25.97 1.30 33.76 $13,564 $199 $3,666 $163 $1,427 $8,471 n/a n/a
944/946 Gas/Service Station with & without Car Wash fuel pos. 157.33
ITE 9th Edition(944 & 946 Blend) 1.90 2.40 FL Studies 23% FL Studies 21.79 1.30 28.33 $11,384 $186 $3,427 $152 $1,330 $6,627 $1,511 339%
947 Self-Service Car Wash service bay 43.94Blend ITE 9th & FL
Studies 2.18 2.68 FL Studies 68% FL Studies 20.65 1.30 26.85 $10,785 $171 $3,151 $140 $1,225 $6,409 $6,455 -1%
INDUSTRIAL:
110 General Light Industrial 1,000 sf 6.97 ITE 9th Edition 5.15 5.65 Same as LUC 710 92% Same as LUC 710 10.47 1.30 13.61 $5,468 $77 $1,419 $63 $551 $3,498 $1,208 190%
120 General Heavy Industrial 1,000 sf 1.50 ITE 9th Edition 5.15 5.65 Same as LUC 710 92% Same as LUC 710 2.25 1.30 2.93 $1,177 $17 $313 $14 $123 $741 $1,208 -39%
140 Manufacturing 1,000 sf 3.82 ITE 9th Edition 5.15 5.65 Same as LUC 710 92% Same as LUC 710 5.74 1.30 7.46 $2,997 $42 $774 $35 $306 $1,917 $1,208 59%
150 Warehousing 1,000 sf 3.56 ITE 9th Edition 5.15 5.65 Same as LUC 710 92% Same as LUC 710 5.35 1.30 6.96 $2,793 $40 $737 $32 $280 $1,776 $860 107%
151 Mini-Warehouse 1,000 sf 2.15Blend ITE 9th & FL
Studies 3.10 3.60FL Studies
(Pinellas County) 92% Same as LUC 710 1.94 1.30 2.52 $1,015 $15 $276 $12 $105 $634 $433 46%
152 High-Cube Warehouse 1,000 sf 1.68 ITE 9th Edition 5.15 5.65 Same as LUC 710 92% Same as LUC 710 2.52 1.30 3.28 $1,318 $19 $350 $15 $131 $837 n/a n/a

Tindale Oliver Hillsborough County April 2016 D-29 Mobility Fee Study
Table D‐10 Mobility Fee Schedule – Rural Area; ½% Sales Tax (10 year lifecycle)
Gasoline Tax Unit Cost per Lane Mile: $4,962,000 Interstate/Toll Facility Adjustment Factor: 36.6%$$ per gallon to capital: $0.213 $0.174 City Revenues: - Average PMC per Lane Mile: 9,263 10,806 Cost per PMC (Residential/Office/Industrial): $535.71
Facility life (years): 25 10 County Revenues: - Fuel Efficiency: 18.18 mpg Cost per PMC (Other Non-Residential): $459.18Interest rate: 2.50% 2.50% State Revenues: - Effectivedays per year: 365
ITE LUC Land Use Unit Trip Rate Trip Rate SourceAssessable Trip
LengthTotal Trip
LengthTrip Length Source
PercentNew Trips
% New Trips Source Net VMT(1) Person‐Trip Factor
Net PMTTotal
Mobility CostAnnualGas Tax
Gas Tax Credit
AnnualSales Tax
Sales Tax Credit
NetMobility Fee
Current Impact Fee
Zone 7(2)
% Change
RESIDENTIAL:
Single Family (Detached) - Less than 1,500 sf & Annual HH Income less than 50% SHIP Definition du 2.62
FL Studies(NHTS, AHS, Census) 6.62 7.12 FL Studies 100% n/a 5.50 1.30 7.15 $3,829 $40 $737 $33 $289 $2,803 $1,792 56%
Single Family (Detached) - Less than 1,500 sf & Annual HH Income between 50-80% SHIP Definition du 3.96
FL Studies(NHTS, AHS, Census) 6.62 7.12 FL Studies 100% n/a 8.31 1.30 10.80 $5,787 $60 $1,105 $49 $429 $4,253 $1,792 137%
Single Family (Detached) - Less than 1,500 sf du 6.11FL Studies
(NHTS, AHS, Census) 6.62 7.12 FL Studies 100% n/a 12.82 1.30 16.67 $8,930 $93 $1,713 $76 $665 $6,552 $1,792 266%
Single Family (Detached) - 1,501 to 2,499 sf du 7.81FL Studies
(NHTS, AHS, Census) 6.62 7.12 FL Studies 100% n/a 16.39 1.30 21.31 $11,414 $119 $2,193 $97 $849 $8,372 $1,792 367%
Single Family (Detached) - 2,500 sf and greater du 8.76FL Studies
(NHTS, AHS, Census) 6.62 7.12 FL Studies 100% n/a 18.38 1.30 23.89 $12,802 $133 $2,450 $109 $954 $9,398 $1,792 424%
Multi-Family (Apartment); 1-2 Stories - Annual HH Income less than 50% SHIP Definition du 2.38
Blend ITE 9th & FL Studies 5.10 5.60
FL Studies(LUC 220/230) 100% n/a 3.85 1.30 5.01 $2,680 $28 $516 $23 $201 $1,963 $1,242 58%
Multi-Family (Apartment); 1-2 Stories - Annual HH Income between 50-80% SHIP Definition du 3.60
Blend ITE 9th & FL Studies 5.10 5.60
FL Studies(LUC 220/230) 100% n/a 5.82 1.30 7.57 $4,053 $43 $792 $35 $306 $2,955 $1,242 138%
Multi-Family (Apartment); 1-2 Stories du 6.60Blend ITE 9th & FL
Studies 5.10 5.60FL Studies
(LUC 220/230) 100% n/a 10.67 1.30 13.87 $7,431 $79 $1,456 $65 $569 $5,406 $1,242 335%
Multi-Family (Apartment); 3+ Stories - Annual HH Income less than 50% SHIP Definition du 1.49
ITE 9th Edition (weighted avg) 5.10 5.60
FL Studies(LUC 220/230) 100% n/a 2.41 1.30 3.13 $1,678 $18 $332 $15 $131 $1,215 $1,242 -2%
Multi-Family (Apartment); 3+ Stories - Annual HH Income between 50-80% SHIP Definition du 2.25
ITE 9th Edition (weighted avg) 5.10 5.60
FL Studies(LUC 220/230) 100% n/a 3.64 1.30 4.73 $2,533 $27 $497 $22 $193 $1,843 $1,242 48%
Multi-Family (Apartment); 3+ Stories du 4.14ITE 9th Edition (weighted avg) 5.10 5.60
FL Studies(LUC 220/230) 100% n/a 6.69 1.30 8.70 $4,661 $50 $921 $40 $350 $3,390 $1,242 173%
230 Residential Condominium/Townhouse du 5.76Blend ITE 9th & FL
Studies 5.10 5.60FL Studies
(LUC 220/230) 100% n/a 9.31 1.30 12.10 $6,485 $69 $1,271 $56 $490 $4,724 $1,097 331%
232 High-Rise Condominium; 3+ Stories du 4.18 ITE 9th Edition 5.10 5.60FL Studies
(LUC 220/230) 100% n/a 6.76 1.30 8.79 $4,706 $50 $921 $41 $359 $3,426 $1,097 212%
240 Mobile Home Park du 4.17 FL Studies 4.60 5.10 FL Studies 100% n/a 6.08 1.30 7.90 $4,235 $45 $829 $37 $324 $3,082 $901 242%
253 Congregate Care Facility du 2.25Blend ITE 9th & FL
Studies 3.08 3.58 Same as LUC 210 72% FL Studies 1.58 1.30 2.05 $1,102 $12 $221 $10 $88 $793 n/a n/a
LODGING:
310 Hotel room 6.36Blend ITE 9th & FL
Studies 6.26 6.76 FL Studies 66% FL Studies 8.33 1.30 10.83 $4,972 $61 $1,124 $50 $438 $3,410 $1,546 121%
311 Hotel; All Suites room 4.90 ITE 9th Edition 6.26 6.76 Same as LUC 310 66% Same as LUC 310 6.42 1.30 8.35 $3,831 $47 $866 $38 $333 $2,632 $1,082 143%
320 Motel room 5.63 ITE 9th Edition 4.34 4.84 FL Studies 77% FL Studies 5.96 1.30 7.75 $3,560 $45 $829 $37 $324 $2,407 $1,579 52%
RECREATION:
412 General Recreation acre 2.28 ITE 9th Edition 5.11 5.61FL Studies
(Pinellas County) 90%FL Studies
(Pinellas County) 3.32 1.30 4.32 $1,984 $25 $461 $20 $175 $1,348 n/a n/a
416 RV Park(3) site 1.62ITE 9th Edition
(Adjusted) 4.60 5.10 Same as LUC 240 100%FL Studies
(Pinellas County) 2.36 1.30 3.07 $1,410 $18 $332 $14 $123 $955 n/a n/a
420 Marina boat berth 2.96 ITE 9th Edition 6.62 7.12 Same as LUC 210 90%FL Studies
(Pinellas County) 5.59 1.30 7.27 $3,337 $41 $755 $33 $289 $2,293 n/a n/a
430 Golf Course hole 35.74 ITE 9th Edition 6.62 7.12 Same as LUC 210 90%FL Studies
(Pinellas County) 67.50 1.30 87.75 $40,294 $490 $9,028 $400 $3,501 $27,765 $4,272 550%
444 Movie Theater screen 106.63Blend ITE 6th & FL
Studies 2.22 2.72 FL Studies 88% FL Studies 66.04 1.30 85.85 $39,418 $546 $10,060 $446 $3,903 $25,455 $9,164 178%
492 Health Club 1,000 sf 32.93 ITE 9th Edition 5.15 5.65 Same as LUC 710 94% FL Studies 50.53 1.30 65.69 $30,166 $374 $6,891 $305 $2,669 $20,606 n/a n/a
210
220
222/ 223

Tindale Oliver Hillsborough County April 2016 D-30 Mobility Fee Study
Table D‐10 (continued) Mobility Fee Schedule – Rural Area; ½% Sales Tax (10 year lifecycle)
ITE LUC Land Use Unit Trip Rate Trip Rate SourceAssessable Trip
LengthTotal Trip
LengthTrip Length Source
PercentNew Trips
% New Trips Source Net VMT(1) Person‐Trip Factor
Net PMTTotal
Mobility CostAnnualGas Tax
Gas Tax Credit
AnnualSales Tax
Sales Tax Credit
NetMobility Fee
Current Impact Fee
Zone 7(2)
% Change
INSTITUTIONS:
520 Elementary School (Private) student 1.29 ITE 9th Edition 4.30 4.80FL Studies
(Pinellas County) 80%FL Studies
(Pinellas County) 1.41 1.30 1.83 $840 $11 $203 $9 $79 $558 $61 815%
522 Middle School (Private) student 1.62 ITE 9th Edition 4.30 4.80FL Studies
(Pinellas County) 90%FL Studies
(Pinellas County) 1.99 1.30 2.59 $1,186 $15 $276 $12 $105 $805 n/a n/a
530 High School (Private) student 1.71 ITE 9th Edition 4.30 4.80FL Studies
(Pinellas County) 90%FL Studies
(Pinellas County) 2.10 1.30 2.73 $1,252 $16 $295 $13 $114 $843 n/a n/a
540University/Junior College (7,500 or fewer students) (Private) student 2.00 ITE Regression Analysis 6.62 7.12 Same as LUC 210 90%
FL Studies(Pinellas County) 3.78 1.30 4.91 $2,255 $27 $497 $22 $193 $1,565 n/a n/a
550University/Junior College (more than 7,500 students) (Private) student 1.50 ITE Regression Analysis 6.62 7.12 Same as LUC 210 90%
FL Studies(Pinellas County) 2.83 1.30 3.68 $1,691 $21 $387 $17 $149 $1,155 n/a n/a
560 Church 1,000 sf 9.11 ITE 9th Edition 3.90 4.40FL Studies
(Pinellas County) 90%FL Studies
(Pinellas County) 10.14 1.30 13.18 $6,051 $77 $1,419 $63 $551 $4,081 $544 650%
565 Day Care Center 1,000 sf 71.88Blend ITE 9th & FL
Studies 2.03 2.53 FL Studies 73% FL Studies 33.77 1.30 43.90 $20,156 $284 $5,233 $232 $2,030 $12,893 $1,500 760%
610 Hospital 1,000 sf 13.22 ITE 9th Edition 6.62 7.12 Same as LUC 210 77%FL Studies
(Pinellas County) 21.36 1.30 27.77 $12,752 $155 $2,856 $127 $1,112 $8,784 unit change n/a
620 Nursing Home bed 2.76Blend ITE 9th & FL
Studies 2.59 3.09 FL Studies 89% FL Studies 2.02 1.30 2.63 $1,204 $16 $295 $13 $114 $795 $194 310%
630 Clinic 1,000 sf 33.22Blend ITE 9th & FL
Studies 5.10 5.60 FL Studies 93% FL Studies 49.95 1.30 64.94 $29,815 $370 $6,817 $302 $2,643 $20,355 $1,880 983%
OFFICE:
General Office 50,000 sq ft or less(4) 1,000 sf 15.50 ITE 9th equation 5.15 5.65 FL Studies 92% FL Studies 23.28 1.30 30.26 $16,213 $172 $3,169 $141 $1,234 $11,810 $3,728 217%
General Office 50,001-100,000 sq ft(4) 1,000 sf 13.13 ITE 9th equation 5.15 5.65 FL Studies 92% FL Studies 19.72 1.30 25.64 $13,734 $146 $2,690 $119 $1,041 $10,003 $2,300 335%
General Office 100,001-200,000 sq ft(4) 1,000 sf 11.12 ITE 9th equation 5.15 5.65 FL Studies 92% FL Studies 16.70 1.30 21.71 $11,631 $124 $2,285 $101 $884 $8,462 $1,958 332%
General Office 200,001-400,000 sq ft(4) 1,000 sf 9.41 ITE 9th equation 5.15 5.65 FL Studies 92% FL Studies 14.13 1.30 18.37 $9,843 $105 $1,935 $85 $744 $7,164 $1,958 266%
General Office greater that 400,000 sq ft(4) 1,000 sf 8.54 ITE 9th equation 5.15 5.65 FL Studies 92% FL Studies 12.83 1.30 16.68 $8,933 $95 $1,750 $78 $683 $6,500 $1,958 232%
715 Single Tenant Office Building 1,000 sf 11.65 ITE 9th equation 5.15 5.65 Same as LUC 710 92% Same as LUC 710 17.50 1.30 22.75 $12,186 $129 $2,377 $106 $928 $8,881 $2,005 343%
720 Medical Office 10,000 sq ft or less 1,000 sf 23.83 FL Studies 5.55 6.05 FL Studies 89% FL Studies 37.31 1.30 48.50 $25,986 $274 $5,048 $224 $1,960 $18,978 $6,262 203%
720 Medical Office greater than 10,000 sq ft 1,000 sf 34.72Blend ITE 9th & FL
Studies 5.55 6.05 FL Studies 89% FL Studies 54.37 1.30 70.68 $37,861 $400 $7,370 $327 $2,862 $27,629 $6,262 341%
RETAIL:
813 Discount Superstore 1,000 sf 50.82 ITE 9th Edition 2.40 2.90Same as LUC 820(50k-200k sq ft) 67%
Same as LUC 820(50k-200k sq ft) 25.90 1.30 33.67 $15,463 $211 $3,888 $172 $1,505 $10,070 $2,807 259%
815 Discount Store; Free-Standing 1,000 sf 57.24 ITE 9th Edition 2.40 2.90Same as LUC 820(50k-200k sq ft) 67%
Same as LUC 820(50k-200k sq ft) 29.18 1.30 37.93 $17,417 $238 $4,385 $194 $1,698 $11,334 $3,384 235%
Shopping Center 50,000 sq ft or less(4)(5) 1,000 sfgla 86.56 ITE 9th equation 1.87 2.37 TL Regression 56% FL Curve 28.73 1.30 37.35 $17,153 $246 $4,532 $201 $1,759 $10,862 $1,565 594%
Shopping Center 50,001-200,000 sq ft(4)(5) 1,000 sfgla 53.28 ITE 9th equation 2.40 2.90 TL Regression 67% FL Curve 27.16 1.30 35.31 $16,212 $221 $4,072 $181 $1,584 $10,556 $3,181 232%
Shopping Center 200,001-400,000 sq ft(4)(5) 1,000 sfgla 41.80 ITE 9th equation 2.64 3.14 TL Regression 73% FL Curve 25.54 1.30 33.20 $15,244 $205 $3,777 $167 $1,462 $10,005 $5,504 82%
Shopping Center greater than 400,000 sq ft(4)(5) 1,000 sfgla 36.27 ITE 9th equation 2.87 3.37 TL Regression 76% FL Curve 25.08 1.30 32.60 $14,970 $199 $3,666 $162 $1,418 $9,886 $5,504 80%
841 New/Used Auto Sales 1,000 sf 28.25Blend ITE 9th & FL
Studies 4.60 5.10 FL Studies 79% FL Studies 32.54 1.30 42.30 $19,426 $243 $4,477 $199 $1,742 $13,207 $4,482 195%
853 Convenience Market w/Gasoline 1,000 sf 775.14Blend ITE 9th & FL
Studies 1.51 2.01 FL Studies 28% FL Studies 103.89 1.30 135.06 $62,015 $933 $17,190 $762 $6,669 $38,156 $7,581 403%
710
820

Tindale Oliver Hillsborough County April 2016 D-31 Mobility Fee Study
Table D‐10 (continued) Mobility Fee Schedule – Rural Area; ½% Sales Tax (10 year lifecycle)
1) Net VMT calculated as ((Trip Generation Rate* Trip Length* % New Trips)*(1-Interstate/Toll Facility Adjustment Factor)/2). This reflects the unit of vehicle miles of capacity consumed per unit of development and is multiplied by the cost per vehicle 2) Source: Hillsborough County Department of Development Services; Fees shown for Zone 7 3) The ITE 9th Edition trip generation rate was adjusted to reflect the average occupancy rate of 60 percent based on data provided by the Florida Association of RV Parks and Campgrounds 4) The trip generation rates recommended for the offices and shopping centers use the end-point regression value 5) In the case of shopping centers with up to 300,000 square feet, fast-food, convenience store, and gas stations located on outparcels should be charged separately using their individual categories, as opposed to the general shopping center rate
ITE LUC Land Use Unit Trip Rate Trip Rate SourceAssessable Trip
LengthTotal Trip
LengthTrip Length Source
PercentNew Trips
% New Trips Source Net VMT(1) Person‐Trip Factor
Net PMTTotal
Mobility CostAnnualGas Tax
Gas Tax Credit
AnnualSales Tax
Sales Tax Credit
NetMobility Fee
Current Impact Fee
Zone 7(2)
% Change
RETAIL:
857 Discount Club 1,000 sf 41.80 ITE 9th Edition 2.40 2.90Same as LUC 820(50k-200k sq ft) 67%
Same as LUC 820(50k-200k sq ft) 21.31 1.30 27.70 $12,719 $174 $3,206 $142 $1,243 $8,270 $2,498 231%
862 Home Improvement Superstore 1,000 sf 30.74 ITE 9th Edition 2.40 2.90Same as LUC 820(50k-200k sq ft) 67%
Same as LUC 820(50k-200k sq ft) 15.67 1.30 20.37 $9,354 $128 $2,358 $104 $910 $6,086 $2,095 191%
863 Electronics Superstore 1,000 sf 45.04 ITE 9th Edition 1.87 2.37Same as LUC 820(50k sq ft or less) 56%
Same as LUC 820(50k sq ft or less) 14.95 1.30 19.44 $8,925 $128 $2,358 $104 $910 $5,657 $2,692 110%
880/881 Pharmacy/Drug Store with & without Drive-Thru 1,000 sf 95.96
Blend ITE 9th & FL Studies 2.08 2.58 FL Studies 32% FL Studies 20.25 1.30 26.33 $12,086 $169 $3,114 $138 $1,208 $7,764 $5,269 47%
890 Furniture Store 1,000 sf 5.06 ITE 9th Edition 6.09 6.59 FL Studies 54% FL Studies 5.27 1.30 6.85 $3,149 $39 $719 $31 $271 $2,159 $605 257%
912 Bank/Savings Drive-In 1,000 sf 159.34Blend ITE 9th & FL
Studies 2.46 2.96 FL Studies 46% FL Studies 57.16 1.30 74.31 $34,119 $464 $8,549 $379 $3,317 $22,253 $15,850 40%
931 Quality Restaurant 1,000 sf 91.10Blend ITE 9th & FL
Studies 3.14 3.64 FL Studies 77% FL Studies 69.82 1.30 90.77 $41,680 $546 $10,060 $446 $3,903 $27,717 $10,752 158%
932 High-Turn Over Restaurant 1,000 sf 116.60Blend ITE 9th & FL
Studies 3.17 3.67 FL Studies 71% FL Studies 83.19 1.30 108.15 $49,659 $650 $11,976 $531 $4,647 $33,036 $7,790 324%
934 Fast Food Restaurant w/Drive-Thru 1,000 sf 511.00Blend ITE 9th & FL
Studies 2.05 2.55 FL Studies 58% FL Studies 192.60 1.30 250.38 $114,971 $1,616 $29,774 $1,320 $11,553 $73,644 $9,389 684%
942 Automobile Care Center 1,000 sf 31.43Blend ITE 9th & FL
Studies 3.62 4.12 FL Studies 72% FL Studies 25.97 1.30 33.76 $15,501 $199 $3,666 $163 $1,427 $10,408 n/a n/a
944/946 Gas/Service Station with & without Car Wash fuel pos. 157.33
ITE 9th Edition(944 & 946 Blend) 1.90 2.40 FL Studies 23% FL Studies 21.79 1.30 28.33 $13,010 $186 $3,427 $152 $1,330 $8,253 $1,511 446%
947 Self-Service Car Wash service bay 43.94Blend ITE 9th & FL
Studies 2.18 2.68 FL Studies 68% FL Studies 20.65 1.30 26.85 $12,326 $171 $3,151 $140 $1,225 $7,950 $6,455 23%
INDUSTRIAL:
110 General Light Industrial 1,000 sf 6.97 ITE 9th Edition 5.15 5.65 Same as LUC 710 92% Same as LUC 710 10.47 1.30 13.61 $7,291 $77 $1,419 $63 $551 $5,321 $1,208 341%
120 General Heavy Industrial 1,000 sf 1.50 ITE 9th Edition 5.15 5.65 Same as LUC 710 92% Same as LUC 710 2.25 1.30 2.93 $1,569 $17 $313 $14 $123 $1,133 $1,208 -6%
140 Manufacturing 1,000 sf 3.82 ITE 9th Edition 5.15 5.65 Same as LUC 710 92% Same as LUC 710 5.74 1.30 7.46 $3,996 $42 $774 $35 $306 $2,916 $1,208 141%
150 Warehousing 1,000 sf 3.56 ITE 9th Edition 5.15 5.65 Same as LUC 710 92% Same as LUC 710 5.35 1.30 6.96 $3,724 $40 $737 $32 $280 $2,707 $860 215%
151 Mini-Warehouse 1,000 sf 2.15Blend ITE 9th & FL
Studies 3.10 3.60FL Studies
(Pinellas County) 92% Same as LUC 710 1.94 1.30 2.52 $1,354 $15 $276 $12 $105 $973 $433 125%
152 High-Cube Warehouse 1,000 sf 1.68 ITE 9th Edition 5.15 5.65 Same as LUC 710 92% Same as LUC 710 2.52 1.30 3.28 $1,757 $19 $350 $15 $131 $1,276 n/a n/a