Hilary W. Heuer and Kenneth H. Britten J Neurophysiol This ... · linear direction stimuli (Britten...
14
91:1314-1326, 2004. First published Oct 8, 2003; doi:10.1152/jn.00637.2003 J Neurophysiol Hilary W. Heuer and Kenneth H. Britten You might find this additional information useful... 45 articles, 32 of which you can access free at: This article cites http://jn.physiology.org/cgi/content/full/91/3/1314#BIBL 4 other HighWire hosted articles: This article has been cited by [PDF] [Full Text] [Abstract] , January 1, 2007; 97 (1): 761-771. J Neurophysiol U. J. Ilg and S. Schumann Movements Primate Area MST-l Is Involved in the Generation of Goal-Directed Eye and Hand [PDF] [Full Text] [Abstract] , July 25, 2007; 27 (30): 8122-8137. J. Neurosci. C. Palmer, S.-Y. Cheng and E. Seidemann Linking Neuronal and Behavioral Performance in a Reaction-Time Visual Detection Task [PDF] [Full Text] [Abstract] , September 1, 2007; 98 (3): 1115-1124. J Neurophysiol H. W. Heuer and K. H. Britten Linear Responses to Stochastic Motion Signals in Area MST [PDF] [Full Text] [Abstract] , September 5, 2007; 27 (36): 9742-9756. J. Neurosci. K. Takahashi, Y. Gu, P. J. May, S. D. Newlands, G. C. DeAngelis and D. E. Angelaki Comparison of Visual and Vestibular Selectivity Multimodal Coding of Three-Dimensional Rotation and Translation in Area MSTd: including high-resolution figures, can be found at: Updated information and services http://jn.physiology.org/cgi/content/full/91/3/1314 can be found at: Journal of Neurophysiology about Additional material and information http://www.the-aps.org/publications/jn This information is current as of April 7, 2008 . http://www.the-aps.org/. American Physiological Society. ISSN: 0022-3077, ESSN: 1522-1598. Visit our website at (monthly) by the American Physiological Society, 9650 Rockville Pike, Bethesda MD 20814-3991. Copyright © 2005 by the publishes original articles on the function of the nervous system. It is published 12 times a year Journal of Neurophysiology on April 7, 2008 jn.physiology.org Downloaded from
Transcript of Hilary W. Heuer and Kenneth H. Britten J Neurophysiol This ... · linear direction stimuli (Britten...

91:1314-1326, 2004. First published Oct 8, 2003; doi:10.1152/jn.00637.2003 J NeurophysiolHilary W. Heuer and Kenneth H. Britten
You might find this additional information useful...
45 articles, 32 of which you can access free at: This article cites http://jn.physiology.org/cgi/content/full/91/3/1314#BIBL
4 other HighWire hosted articles: This article has been cited by
[PDF] [Full Text] [Abstract]
, January 1, 2007; 97 (1): 761-771. J NeurophysiolU. J. Ilg and S. Schumann
MovementsPrimate Area MST-l Is Involved in the Generation of Goal-Directed Eye and Hand
[PDF] [Full Text] [Abstract], July 25, 2007; 27 (30): 8122-8137. J. Neurosci.
C. Palmer, S.-Y. Cheng and E. Seidemann Linking Neuronal and Behavioral Performance in a Reaction-Time Visual Detection Task
[PDF] [Full Text] [Abstract]
, September 1, 2007; 98 (3): 1115-1124. J NeurophysiolH. W. Heuer and K. H. Britten
Linear Responses to Stochastic Motion Signals in Area MST
[PDF] [Full Text] [Abstract], September 5, 2007; 27 (36): 9742-9756. J. Neurosci.
K. Takahashi, Y. Gu, P. J. May, S. D. Newlands, G. C. DeAngelis and D. E. Angelaki Comparison of Visual and Vestibular Selectivity
Multimodal Coding of Three-Dimensional Rotation and Translation in Area MSTd:
including high-resolution figures, can be found at: Updated information and services http://jn.physiology.org/cgi/content/full/91/3/1314
can be found at: Journal of Neurophysiologyabout Additional material and information http://www.the-aps.org/publications/jn
This information is current as of April 7, 2008 .
http://www.the-aps.org/.American Physiological Society. ISSN: 0022-3077, ESSN: 1522-1598. Visit our website at (monthly) by the American Physiological Society, 9650 Rockville Pike, Bethesda MD 20814-3991. Copyright © 2005 by the
publishes original articles on the function of the nervous system. It is published 12 times a yearJournal of Neurophysiology
on April 7, 2008
jn.physiology.orgD
ownloaded from

Optic Flow Signals in Extrastriate Area MST: Comparison of Perceptual andNeuronal Sensitivity
Hilary W. Heuer1 and Kenneth H. Britten1,2
1Center for Neuroscience and 2Section of Neurobiology, Physiology and Behavior, University of California, Davis, California 95616
Submitted 3 July 2003; accepted in final form 3 October 2003
Heuer, Hilary W. and Kenneth H. Britten. Optic flow signals inextrastriate area MST: comparison of perceptual and neuronal sensi-tivity. J Neurophysiol 91: 1314–1326, 2004. First published October8, 2003; 10.1152/jn.00637.2003. The medial superior temporal area ofextrastriate cortex (MST) contains signals selective for nonuniformpatterns of motion often termed “optic flow.” The presence of suchtuning, however, does not necessarily imply involvement in percep-tion. To quantify the relationship between these selective neuronalsignals and the perception of optic flow, we designed a discriminationtask that allowed us to simultaneously record neuronal and behavioralsensitivities to near-threshold optic flow stimuli tailored to MST cells’preferences. In this two-alternative forced-choice task, we controlledthe salience of globally opposite patterns (e.g., expansion and con-traction) by varying the coherence of the motion. Using these stimuli,we could both relate the sensitivity of neuronal signals in MST to theanimal’s behavioral sensitivity and also measure trial-by-trial corre-lation between neuronal signals and behavioral choices. Neurons inMST showed a wide range of sensitivities to these complex motionstimuli. Many neurons had sensitivities equal or superior to themonkey’s threshold. On the other hand, trial-by-trial correlation be-tween neuronal discharge and choice (“choice probability”) was weakor nonexistent in our data. Together, these results lead us to concludethat MST contains sufficient information for threshold judgments ofoptic flow; however, the role of MST activity in optic flow discrim-inations may be less direct than in other visual motion tasks previ-ously described by other laboratories.
I N T R O D U C T I O N
Visual motion is created by objects moving in the environ-ment or by self-motion through the world. Whatever thesource, visual motion is generally believed to be processed ina functionally specialized pathway in visual cortex, the “dorsalstream.” Early stages of this pathway, such as the middletemporal area (MT), are selective for uniform linear motionpatterns (Orban 1997). However, much of the motion experi-enced by organisms under normal conditions consists of morecomplex, spatially nonuniform motion, or “optic flow” (Gibson1950).
Response selectivities for such complex patterns of motionfirst become evident in the medial superior temporal area(MST), a relatively high-level area in this cortical pathway.Neurons in MST show selective tuning for patterns such asexpansion, contraction, rotation, or combinations thereof(Duffy and Wurtz 1991a,b; Saito et al. 1986; Tanaka and Saito1989; Tanaka et al. 1986). Thus it is natural to consider MSTas a likely substrate for the perception of optic flow, includingheading stimuli—optic flow patterns that simulate trajectories
experienced through self-navigation in the world (Bradley etal. 1996; Duffy and Wurtz 1995; Froehler 2002; Page andDuffy 1999; Paolini et al. 2000). Additionally, perturbingactivity in MST with electrical microstimulation during theperformance of a complex heading perception task (Britten andVan Wezel 2002; Britten and Van Wezel 1998) or a lineardirection discrimination task (Celebrini and Newsome 1995)influences perceptual judgments. Together, these studies sug-gest that area MST is indeed involved in optic flow perceptionbut do not elucidate the relationship between the activity ofindividual neurons and behavioral ability. To examine thisissue, we recorded the responses of single neurons in MSTof awake behaving monkeys while the monkeys performed apsychophysical discrimination of specified locally and globallyopposite optic flow patterns that were optimized for eachneuron’s stimulus preferences. We were thus able to simulta-neously measure both behavioral and neuronal sensitivity tooptic flow patterns under conditions where the neuronal signalwas most likely to be relevant to the perceptual judgment.These measurements allowed us to address directly whetherthe sensitivity of MST neurons for optic flow patterns wassufficient to support perceptual judgments of complex motion.In addition, this approach allowed us to investigate thepossibility of correlation between neuronal response and be-havioral choice on a trial-by-trial basis. Preliminary results ofthis study have previously appeared as abstracts (Heuer andBritten 1999, 2000).
M E T H O D S
Preparation
Two adult rhesus macaques (Macaca mulatta) were used in thisstudy: one male and one female. Prior to recording, each monkey wasimplanted with a stainless steel head restraint post and a scleral searchcoil (Judge et al. 1980) to monitor eye position. After each monkeycompleted training on the psychophysical task, a recording chamberwas surgically placed over occipital cortex. For recording sessions, astainless steel transdural guide tube was inserted at known locationswithin a plastic coordinate grid (Crist et al. 1988). A tungsten micro-electrode (FHC) was introduced through the guide tube and advancedusing a stepping motor microdrive (National Aperture).
We used both physiological and anatomical landmarks to localizearea MST on the anterior bank of the superior temporal sulcus (STS).These landmarks included recording depth from the dural surface,gray matter/white matter transitions, and receptive field (RF) size(Tanaka et al. 1986; Van Essen et al. 1981). On a few penetrationsnear the floor of the STS, the transition from area MT to MST was
Address for reprint requests and other correspondence: K. H. Britten, Centerfor Neuroscience, Univ. of California, 1544 Newton Ct., Davis, CA 95616(E-mail: [email protected]).
The costs of publication of this article were defrayed in part by the paymentof page charges. The article must therefore be hereby marked ‘‘advertisement’’in accordance with 18 U.S.C. Section 1734 solely to indicate this fact.
J Neurophysiol 91: 1314–1326, 2004.First published October 8, 2003; 10.1152/jn.00637.2003.
1314 0022-3077/04 $5.00 Copyright © 2004 The American Physiological Society www.jn.org
on April 7, 2008
jn.physiology.orgD
ownloaded from

ambiguous; for these penetrations, only cells with large RFs thatclearly included the fovea or were entirely ipsilateral were included.Generally, these cells were found after an abrupt discontinuity inretinotopy; they account for a small proportion (approximately 5%) ofour sample and did not noticeably differ in their results.
After we located MST, we isolated and recorded single-unit activityusing standard extracellular techniques. Electrode signals were am-plified and filtered: single units were isolated with a window-discrim-inator (Bak Electronics) and their action potentials converted to TTLpulses. We used the public domain software package REX (Hays et al.1982) to record the time of stimulus events and action potentials with1-ms resolution.
Stimuli
All stimuli were presented on a CRT monitor (Mitsubishi DiamondPro 21TX) that subtended 80° horizontally by 60° vertically at aviewing distance of 28 cm from the monkey. Pixel resolution was1280 � 1024, with a vertical refresh rate of 72 Hz, corresponding toa frame interval of 13.9 ms. The stimuli were generated using customsoftware on a Pentium computer with a video card (ATI Mach 64)running in 8-bit grayscale mode. For the primary experiments de-scribed here, the background luminance was 10 cd/M2, and theforeground was 60 cd/M2, resulting in a Michelson contrast of 70%.The monitor was regularly calibrated to establish a linear luminanceprofile. Dots were presented within circular apertures, at a constantaverage density of 0.12 dots/deg2. Dots were randomly generated, andeach stimulus was generated with a new seed.
The random dot patterns employed consisted of a subset of opticflow patterns termed “spiral space” by Graziano et al. (1994). Spiralspace can be formalized as a pair of orthogonal axes, with radialmotion on one axis and rotary motion on the other (Fig. 1A). Inter-mediate directions are spirals—combinations of rotation and radialmotion, such as an expanding counter-clockwise pattern. To vary thestrength of these stimuli, we used a technique previously applied tolinear direction stimuli (Britten et al. 1992; Celebrini and Newsome1994). This technique varies the stimulus strength by changing thepercentage of dots that are replotted in a manner consistent with thespecified direction pattern. We varied this percentage, and thus themotion strength, by setting the probability that each dot would berepositioned in this manner. We refer to the proportion of dots thatcarry the specified motion pattern as the percent coherence. A stim-ulus that is fully coherent has all the dots replotted with the appro-priate spatial and temporal offsets to produce an apparently smoothmotion pattern. The opposite extreme, the 0% coherence stimulus,contains only dots that are randomly repositioned, forming “white”motion noise (see Fig. 1B for schematic examples). The speed of thestimulus dots increased linearly from the center of the stimulus to theedge.
RF mapping and stimulus optimization
Once a neuron was isolated, we determined the RF location and sizeusing handheld moving bar stimuli or computer-generated moving dotpatches. Many neurons were only weakly responsive to the handheldmoving bar stimuli; for these, we used dot patterns of varying size toestimate the receptive field boundaries. Some neurons showed sensi-tivity to eye position within the orbit, as previously reported (Squatritoand Maioli 1996, 1997); for these cells, we attempted to maximizeresponse due to both eye position and stimulus extent. We positionedthe stimuli within the RF for maximal response. When a cell’s RFexhibited a “hot spot” of greater excitability, we placed stimuli overthe hot spot and may not have filled the entire RF. For the remainingcells, we placed the stimuli to maximize areal extent within the RFwithout extending past the RF edges. Once we determined stimulussize and location, we undertook parametric optimization of the stim-
ulus. We initially approximated both preferred spiral space directionand preferred speed qualitatively.
Following the initial estimates of location and speed, we obtainedquantitative direction tuning data. We presented eight directions ofspiral space motion, equally spaced at 45° intervals, and eight direc-tions of linear motion. The direction tuning stimuli were presented ashighly coherent (75%) dot patterns; 100% coherent patterns were notused to minimize dot density artifacts. Generally, trials consisted ofthree stimuli of 500-ms duration, with 500-ms intervals betweenstimuli. For some cells, trials consisting of two stimuli of 1-s durationwere used; there was no significant difference between the two mea-surements for cells where data were collected in both ways. Thedifferent directions of linear and spiral space were presented in arandom sequence until responses were collected for a minimum offive repetitions of each motion pattern. We then fit these data withGaussian functions to obtain a measure of the neuron’s preferreddirection. Such fits have previously been shown to describe accuratelythe direction tuning of MST cells to this family of stimuli (Grazianoet al. 1994).
Psychophysical discrimination task
The primary data described here were collected while the monkeysperformed a psychophysical discrimination between opposite spiralspace directions. For each session, the directions for the behavioraldiscrimination were set to be the neuron’s preferred stimulus and itsopposite (or “null”). These directions were determined from theGaussian fit to the tuning data (see Fig. 4A for example). The directionof the stimulus was randomly varied from trial to trial between theopposed alternatives; the monkey’s task was to accurately identifywhich pattern was presented. The strength of the motion signal was
FIG. 1. A: stimulus space (Graziano et al. 1994). B: schematic demonstra-tion of altering the motion strength for an expansion stimulus. Coherenceincreases from left to right.
1315OPTIC FLOW DISCRIMINATION IN MST
J Neurophysiol • VOL 91 • MARCH 2004 • www.jn.org
on April 7, 2008
jn.physiology.orgD
ownloaded from

also varied systematically using log-spaced coherence levels chosento span both neuronal and behavioral thresholds.
A schematic representation of task timing and geometry is shown inFig. 2. Each trial began with the appearance of the fixation point. Oncethe monkey fixated, the stimulus appeared for 1 s. The monkey wasrequired to maintain fixation throughout the stimulus period. Whenthe stimulus disappeared, the monkey continued to fixate for 250 ms,followed by the onset of the two targets. This intervening fixationperiod allowed us to segregate temporally the neuron’s response to thestimulus from any response evoked by the target onset. Targets weresmaller random dot patches (6° diam); each target contained one ofthe two alternative motion patterns at high coherence (80%). Thisdesign allowed target geometry to be flexible; the monkey could learneach new geometrical configuration by using the information providedby the matching targets. Furthermore, even if the monkeys wereperforming a match on every trial, it would have negligible influenceon our results, since performance would always be limited by thelower coherence of the first stimulus. The targets were usually posi-tioned to require saccades of approximately equal magnitude to eithertarget and were placed in different quadrants of the visual field, andtheir positions were held constant through each block of trials. Fixa-tion was enforced for an additional 150 ms to allow visual inspectionof the targets. The fixation point was extinguished, signaling themonkey to saccade to the target whose direction matched that of theinitial stimulus. The monkey received a juice reward for correctdiscriminations; incorrect choices were followed by a brief “time-out”period (usually 1,500 ms) and a short tone. The monkey was randomlyrewarded with a probability of 0.5 on trials where there was no netmotion pattern (0% coherence) because there was no objectivelycorrect answer for these stimuli.
Curve-fitting procedures
All descriptive fits of our data were performed using a maximum-likelihood, iterative fitter (Chandler 1965), and nested likelihood ratioanalysis was used to determine the comparative quality of the result-ing fits. We used this approach when the equations fit were variants ofthe same function with differing numbers of free parameters (Hoel etal. 1971). We transformed the likelihoods obtained from each fit by
� � �2ln�L(data reduced function)/L(data expanded function))
� is distributed approximately as �2, where the degrees of freedom arethe additional number of free parameters in the expanded function. If� exceeded the critical value for the degrees of freedom, we concludedthat the expanded version provided a significantly better account ofthe data.
Analysis of psychophysical data
Behavioral data were analyzed as a function of motion coherence(%). For each level of motion strength, we calculated the proportionof correct choices, collapsed across the two directions of motion toform a psychometric function. We fit these data with a modified Quick(1974) function
p � 1 � 0.5 exp[(c/�)]�
where c is motion strength (percent coherence) and � indicates themonkey’s threshold, or the motion strength level at which the monkeyreliably gets 82.5% correct. � indicates the slope of the function, orhow sharply the monkey’s performance improves as a function ofcoherence. This analysis method has been described previously ingreater detail in the context of a linear direction discrimination task(Britten et al. 1992; Celebrini and Newsome 1994).
Analysis of physiological data
The primary experiment compared neuronal sensitivity to percep-tual sensitivity for spiral space motion patterns. To provide this directcomparison, we analyzed our physiological data to produce “neuro-metric functions” analogous to the psychometric functions used todescribe the behavioral data. This method has been used in a varietyof contexts (Bradley et al. 1987; Britten et al. 1992; Celebrini andNewsome 1994; DeAngelis and Uka 2003). Effectively, this methodallows a calculation of the discriminability of direction based solelyon neuronal firing rate.
To generate the neurometric function for each cell, we calculatedthe neuron’s responses to individual stimulus presentations. Unlessotherwise specified, all neuronal responses were analyzed as the totalspike count for the duration of the visual stimulus, shifted 50 ms toaccount for neuronal latency. We required �10 stimulus repetitionsfor each condition (range, 10–45; mean, 17). For each coherence(motion strength), we compiled two distributions of these responses:one for stimuli in the preferred spiral space direction and a separatedistribution for anti-preferred (null) stimuli. To compare these distri-butions, we assumed the existence of a neuron with equal and oppositetuning in spiral space [the “anti-neuron” (Britten et al. 1992)]. Theresponse distributions were then assigned to neuron and anti-neuronaccording to preferred direction, allowing us to evaluate the discrim-ination performance for each stimulus level using receiver operatorcharacteristic (ROC) analysis (Green and Swets 1966). We were thenable to fit these ROC values with the same equation as our psycho-physical data (Eq. 2) to obtain a neurometric function that was directlycomparable to the monkey’s simultaneously measured psychometricfunction.
One might wonder about the choice of an opponent formulation forthe neurometric function, given that there is little evidence for directopponency between neurons tuned for opposite directions of opticflow. We believe that this choice is sensible, because the opponencyin the model has more to do with the readout of the representation. Inour task, two opposite directions are being compared. Thus a sensibledecision rule would be to compare the weight of evidence in favor ofeach alternative to form a decision (Gold and Shadlen 2002). Whilethe representation of complex motion is distinctly biased in favor ofexpansion (Graziano et al. 1994), this does not effect the outcome inany fundamental way. Pools representing each alternative directionmay differ in size, which would affect the performance of a popula-
FIG. 2. Schematic indication of trial geometry. A: box indicates screen size;FP, fixation point; T1 and T2, example target locations; dashed line, receptivefield; dotted line, stimulus aperture. B: relative timing of trial events.
1316 H. W HEUER AND K. H. BRITTEN
J Neurophysiol • VOL 91 • MARCH 2004 • www.jn.org
on April 7, 2008
jn.physiology.orgD
ownloaded from

tion-based analysis. However, for the opponent analysis of singleneuron signals, the presence of all directions in the population repre-sentation is sufficient.
We measured the neurometric functions of 112 neurons in twomonkeys. Seven of these cells were discarded from analysis due topoor behavioral performance during the psychophysical task; thesewere cases where the monkey’s psychometric function was nonmono-tonic or did not reach �95% correct at the highest coherence tested.Due to the poor behavioral performance, the comparison betweenneuronal and psychophysical sensitivity was invalid for these sevencases.
Of the remaining 105 cases, an additional 15 cells were excludedbecause their neurometric functions were not significantly better fit bythe Quick function than by a constant value (nested log-likelihoodtest; P � 0.05, df � 3). These cells were ones that respondedsignificantly above baseline to spiral space stimuli during the directiontuning series but were only weakly directional even at the highcoherence used for the tuning measurements. This weak directionalitydid not produce a significant neurometric function across motionstrengths.
Calculation of choice probability
To examine the relationship between neuronal activity and behav-ioral choice on a trial-by-trial basis, we computed a “choice proba-bility” for each cell.
For each cell, we created two distributions of neuronal responsesorted by the monkey’s choice. Only conditions where the monkeymade at least three choices in each direction were included. To avoidstimulus-dependent effects due to different firing rate means for eachcondition, we Z-transformed all spike counts before combining thedata across conditions. Before combining the data in this way, weverified that there was no systematic variation in choice probability asa function of motion strength (data not shown). This allowed us tocalculate a single pair of distributions of Z-transformed firing rates forpreferred and null choices for each cell. These distributions were usedto calculate the choice probability by ROC analysis.
To test the significance of observed choice probability values, weused a bootstrap method. For the bootstrap test, we randomly reas-signed each trial’s Z-score to the preferred or null distribution. Thisdissociated the response from the behavioral choice without distortingthe relative proportion of preferred and null choices. We then calcu-lated the choice probability for the permuted distributions; we re-peated this manipulation for 2,500 iterations, allowing us to estimatethe probability the observed value would occur by chance.
R E S U L T S
Behavioral results
Perceptually, the monkeys were sensitive to the spiral spacestimuli used in these experiments, although thresholds differedsignificantly between the two monkeys. Monkey H had thresh-olds that were significantly higher than those of monkey F;average thresholds for the two monkeys were 14.5 and 5.9%coherence, respectively. Thresholds were measured for twohuman observers (1 naı̈ve), who were instructed to use the fullglobal motion pattern to perform the task, as opposed to localmotion features. For central stimuli, thresholds for the twoobservers were 4.5 and 6.7%, respectively. Thus one of ourmonkeys performed similarly as did human observers on ourtask, while the other did not.
The threshold difference between the two monkeys couldnot be accounted for by differing stimulus parameter distribu-tions for each monkey. Parameters for each experimental ses-sion were matched to the stimulus preferences of the neuron
under study and therefore could have differed between the twomonkeys. The primary stimulus parameters that varied acrossexperiments were the preferred direction, speed, size, andeccentricity of the stimuli. In our analysis, we consideredwhether these parameters varied between the experiments con-ducted on each monkey and whether they influenced thresholdmeasurements. While some stimulus parameters were relatedto psychophysically measured thresholds, none of these rela-tionships was able to explain the observed threshold differ-ences.
Neither stimulus direction nor speed was capable of explain-ing the monkey threshold differences. There was no correlationbetween preferred direction (as determined for the cell understudy) and the monkey’s threshold for that session (linear �circular correlation; Mardia and Jupp 2000; P � 0.05). Incontrast, faster stimulus speeds systematically were correlatedwith higher behavioral thresholds (r � 0.332; P � 0.0015),although this correlation was not significant for each monkey’sdata considered individually (r � 0.191 and 0.236; P � 0.1).This correlation between speed and psychophysical perfor-mance did not explain the differences between the two mon-keys’ thresholds because speeds were similar for both monkeys(t � �1.451, P � 0.1).
Stimulus size and eccentricity showed a more complicatedrelationship with threshold; this relationship differed betweenthe monkeys (Fig. 3). While the average stimulus size (diam-eter) differed between the two monkeys (t � �2.104, P �0.038), this parameter only affected the behavioral thresholdsof monkey F. Monkey F showed a significant correlationbetween stimulus diameter and threshold (r � �0.327; P �0.0149), but monkey H did not (r � 0.320; P � 0.0605). Onthe other hand, eccentricity was sampled similarly between thetwo monkeys, and again only one monkey (H) showed asignificant relationship between eccentricity and threshold (r �0.367, P � 0.0301). Across the data from both monkeys,stimulus eccentricity had a significant effect (r � 0.309, P �0.003) on thresholds, but the stimulus size did not. Thusindividual stimulus parameters did not systematically appear toaffect the thresholds in a way that would explain the observedsubstantial threshold difference. Individual thresholds areknown to vary widely on many tasks, of course, both formonkeys and humans. As we will describe later, we found thatneuronal thresholds did not differ between the animals as muchas did their perceptual thresholds.
We were concerned that monkey H might have employed
FIG. 3. Behavioral thresholds (percent coherence) as a function of stimulusparameters; solid lines indicate linear regressions. *Significant correlations.
1317OPTIC FLOW DISCRIMINATION IN MST
J Neurophysiol • VOL 91 • MARCH 2004 • www.jn.org
on April 7, 2008
jn.physiology.orgD
ownloaded from
more local cues than did monkey F, which might have ex-plained his higher thresholds. To test for this, we performed aseparate series of psychophysical experiments, using foveallycentered displays. We measured thresholds for a 10° diampattern and a 40° pattern, which differed by over a factor of 5(19.6 and 3.4% coherence, respectively). The large decrease inthreshold by the addition of eccentric signal suggests that thismonkey was not strictly attending to local cues, but instead,was integrating across larger areas when these were available.
Neuronal response properties
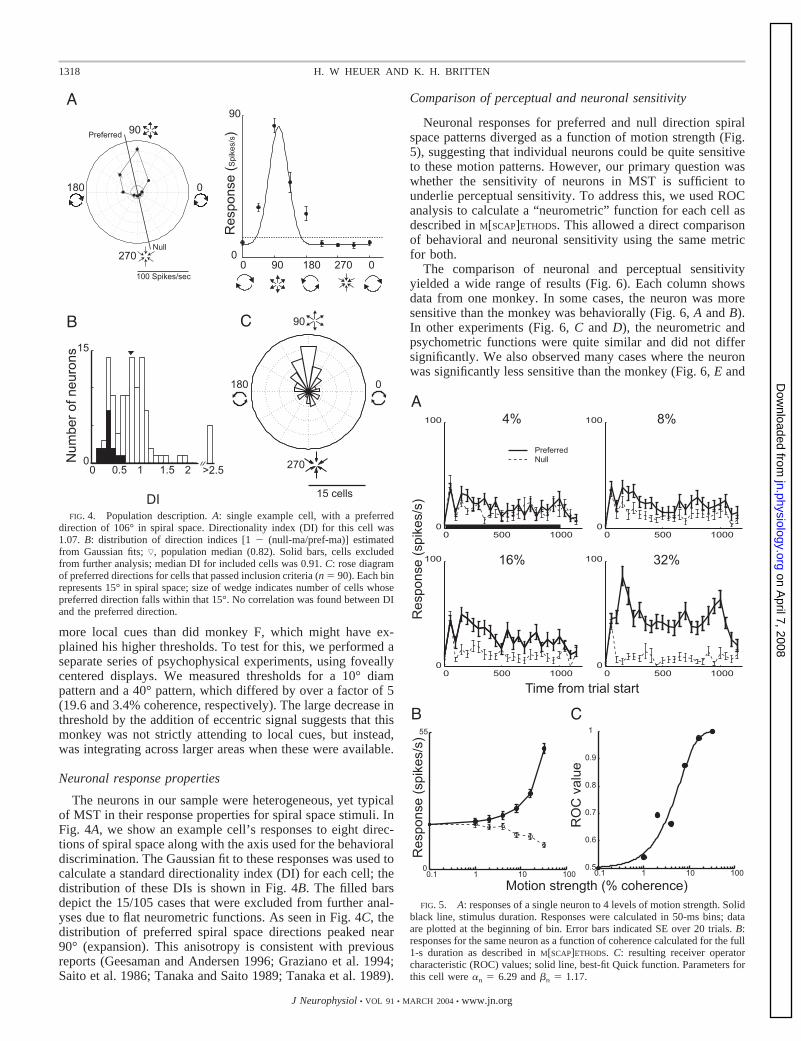
The neurons in our sample were heterogeneous, yet typicalof MST in their response properties for spiral space stimuli. InFig. 4A, we show an example cell’s responses to eight direc-tions of spiral space along with the axis used for the behavioraldiscrimination. The Gaussian fit to these responses was used tocalculate a standard directionality index (DI) for each cell; thedistribution of these DIs is shown in Fig. 4B. The filled barsdepict the 15/105 cases that were excluded from further anal-yses due to flat neurometric functions. As seen in Fig. 4C, thedistribution of preferred spiral space directions peaked near90° (expansion). This anisotropy is consistent with previousreports (Geesaman and Andersen 1996; Graziano et al. 1994;Saito et al. 1986; Tanaka and Saito 1989; Tanaka et al. 1989).
Comparison of perceptual and neuronal sensitivity
Neuronal responses for preferred and null direction spiralspace patterns diverged as a function of motion strength (Fig.5), suggesting that individual neurons could be quite sensitiveto these motion patterns. However, our primary question waswhether the sensitivity of neurons in MST is sufficient tounderlie perceptual sensitivity. To address this, we used ROCanalysis to calculate a “neurometric” function for each cell asdescribed in M[SCAP]ETHODS. This allowed a direct comparisonof behavioral and neuronal sensitivity using the same metricfor both.
The comparison of neuronal and perceptual sensitivityyielded a wide range of results (Fig. 6). Each column showsdata from one monkey. In some cases, the neuron was moresensitive than the monkey was behaviorally (Fig. 6, A and B).In other experiments (Fig. 6, C and D), the neurometric andpsychometric functions were quite similar and did not differsignificantly. We also observed many cases where the neuronwas significantly less sensitive than the monkey (Fig. 6, E and
FIG. 5. A: responses of a single neuron to 4 levels of motion strength. Solidblack line, stimulus duration. Responses were calculated in 50-ms bins; dataare plotted at the beginning of bin. Error bars indicated SE over 20 trials. B:responses for the same neuron as a function of coherence calculated for the full1-s duration as described in M[SCAP]ETHODS. C: resulting receiver operatorcharacteristic (ROC) values; solid line, best-fit Quick function. Parameters forthis cell were �n � 6.29 and �n � 1.17.
FIG. 4. Population description. A: single example cell, with a preferreddirection of 106° in spiral space. Directionality index (DI) for this cell was1.07. B: distribution of direction indices [1 � (null-ma/pref-ma)] estimatedfrom Gaussian fits; ƒ, population median (0.82). Solid bars, cells excludedfrom further analysis; median DI for included cells was 0.91. C: rose diagramof preferred directions for cells that passed inclusion criteria (n � 90). Each binrepresents 15° in spiral space; size of wedge indicates number of cells whosepreferred direction falls within that 15°. No correlation was found between DIand the preferred direction.
1318 H. W HEUER AND K. H. BRITTEN
J Neurophysiol • VOL 91 • MARCH 2004 • www.jn.org
on April 7, 2008
jn.physiology.orgD
ownloaded from

F). Both monkeys showed a wide array of results, with somecells falling into each category of more, less, or equally sen-sitive relative to the simultaneously collected psychophysics.
For the majority of cases in our sample, the neurometricand psychometric functions appeared to differ from eachother. To quantify these differences, we calculated the ratiosbetween the neuronal and psychophysical thresholds. Aratio greater than unity implies that the neuron was lesssensitive than the monkey. Because the two monkeys dif-fered in their behavioral performance, we analyzed the
results separately for each monkey. The resulting distribu-tions of threshold ratios are seen in Fig. 7A. There was asignificant difference in the threshold ratio distributionsbetween the two monkeys (t on log-transformed ratios �3.315, P � 0.0013). For monkey F, the mean threshold ratiowas 2.01, indicating that neurons in MST were, on average,much less sensitive than behavioral performance. In con-trast, for monkey H, neuronal and behavioral thresholdswere much more similar; the mean threshold ratio being1.11.
FIG. 6. Example psychometric and neu-rometric comparisons. Dashed lines andopen circles, behavioral performance; solidlines and filled symbols, neurometric data.Data in left column are from monkey F; datain right column are from monkey H. Param-eters are given 1st for the psychometric func-tion �p,�p and followed by the neurometric�n,�n. A: 3.89, 1.20; 1.84, 1.69. B:12.98,2.37; 3.84, 3.40. C: 5.86, 1.76; 5.45,1.56. D: 12.32, 2.01; 13.54, 3.11. E: 4.051,1.35; 8.71, 1.39. F: 13.09, 1.05; 23.32, 1.55.
1319OPTIC FLOW DISCRIMINATION IN MST
J Neurophysiol • VOL 91 • MARCH 2004 • www.jn.org
on April 7, 2008
jn.physiology.orgD
ownloaded from

To address the statistical reliability of these differencesbetween neuronal and psychophysical thresholds, we tested thehypothesis that both sets of data could be fit by a singlefunction. We used nested log-likelihood testing to determinewhether the functions differed reliably. For 25/90 cells (28%),a single function well described both sets of data for theexperiment; we could not reject the null hypothesis that asingle threshold and slope described both data sets (Fig. 7,filled bars).
Both monkeys showed a wide range of threshold ratios,indicating that the relationship between neuronal and percep-tual sensitivity is diverse in our population of MST cells.Observed ratios for monkey F ranged between 0.14 and 13.95,
while those for monkey H were between 0.16 and 4.2. Themaximum possible ratio for monkey H was lower due to thehigher psychophysical thresholds, described earlier. For mon-key F, 22/55 (40%) cells were as sensitive as or more sensitivethan the simultaneously measured psychophysical perfor-mance; for monkey H, the percentage was much higher (24/35;69%). Thus we see that while the threshold ratios were quan-titatively different for the two monkeys, there was nearlycomplete overlap as well. As we will show below, the onlyfactor contributing to this difference in threshold ratios is thelower perceptual thresholds for monkey F.
Unlike the thresholds, the slopes of neurometric and psy-chometric functions were consistently quite similar. When wecompared neurometric and psychometric slopes by measuringthe ratio of the � parameters of the two functions, the meanslope ratio was 0.98 across the population. The distributions ofslope ratios are shown in Fig. 7B. There was a tendency for theslope ratio to be lower for monkey H. However, this tendencydid not produce a significant difference between monkeys (t �1.639, P � 0.05); mean slope ratios were 1.12 and 0.86 formonkeys F and H, respectively.
For both monkeys, approximately one-quarter of all cases(15/55 for monkey F; 9/35 for monkey H) showed a significantimprovement when fit with two functions differing only in theirslopes. Each monkey had a substantial overlap between thesecells and the group that were better fit when the threshold wasfree (Fig. 7C). For the cases that fell into the overlap category,we could evaluate which parameter better captured the data bycomparing the residual errors. Because these fits had the samenumber of free parameters, the fit that better captured the datahad a smaller residual error. For the vast majority of thesecases, allowing � to vary captured the data better. Thus evenfor the neurometric functions that differed from the psycho-metric functions in both parameters, the larger difference wasin the thresholds, indicating that the primary discrepanciesbetween neurometric and psychometric functions reflect dif-ferences in sensitivity.
The difference in threshold ratios between the two monkeyscould primarily be attributed to the difference in psychophys-ical performance. Neuronal thresholds for both monkeys var-ied, and the mean neuronal sensitivity did not differ betweenthe two monkeys (t � �1.775; P � 0.05). Therefore we canconclude that the two monkeys differed far more in theirperformance than could be accounted for by differences in thesensitivities of their MST cells.
Although the ratios between neuronal and psychophysicalthreshold were diverse, there was a significant relationshipbetween the two measures of sensitivity (P � 0.006; Spearmanrank-order correlation). When the data from each monkey wasconsidered individually, the relationship was only significantfor one monkey, monkey H (P � 0.0011). The relationshipbetween neuronal and perceptual performance was steep (Fig.8), consistent with the fact that there was much more variancein neuronal than perceptual thresholds.
We found the presence of such a correlation puzzling, be-cause we previously had established that no stimulus variablesystematically predicts perceptual threshold. We extended thisanalysis to the neuronal thresholds, with similar results. Thusthe relationship between neuronal and behavioral thresholdcould not be fully explained by the stimulus parameters weexplored. For both monkeys, neuronal thresholds were statis-
FIG. 7. Data from monkey F are in left column; data in right column arefrom monkey H. A: distribution of threshold ratios for the population. Ratiosare calculated as �n:�p and are derived from fits with both threshold and slopeallowed to vary. Values less than 1 indicate that neuronal threshold was lower(more sensitive) than behavioral threshold (see Fig. 6A). Open bars, cases witha significant improvement when data were fit with 2 separate functions,differing only in threshold, compared with a single function fit to both neuronaland psychometric data (nested log-likelihood test, df � 2). Solid bars, caseswhere the neuronal and behavioral data are not statistically distinguishable. ƒ,population mean. B: slope ratios, calculated as �n/�p. ƒ, population mean. C:distribution of cases for psychometric and neurometric comparisons. Dashedcircle, experiments where both sets of data can be well described by a singlefunction. Solid circles, experiments where significant improvement in fit wasobtained by allowing either � or � to vary; note large overlap.
1320 H. W HEUER AND K. H. BRITTEN
J Neurophysiol • VOL 91 • MARCH 2004 • www.jn.org
on April 7, 2008
jn.physiology.orgD
ownloaded from

tically not related to stimulus direction, speed, or eccentricity.However, neuronal thresholds from monkey H did show sig-nificant correlation with stimulus diameter (r � 0.394; P �0.0192). In contrast, the behavioral thresholds from this mon-key showed the opposite pattern; psychophysical sensitivity formonkey H was largely controlled by stimulus eccentricity andwas unaffected by the size of the stimulus. Because the neu-ronal thresholds for the two monkeys were not affected by thestimulus parameters in the same manner as the psychophysicalthresholds, the relationship between the two measures couldnot be explained by joint dependence on stimulus parameters.Given the absence of independent variables under our controlthat could jointly correlate with both neuronal and perceptualthresholds, we conclude that the most likely interpretation ofthis correlation is uncontrolled variability in attention orarousal.
Temporal dynamics of neuronal responses
Our primary analysis comparing neuronal and behavioraldiscrimination used the spike counts from the entire stimulusduration; however, this long integration window could obscuresubtleties in the neuronal signal and might affect our mainresults. The neuronal signal of direction could either accumu-late slowly or appear rapidly near the beginning of the trial. Asseen in the single cell example (Fig. 5), spike rates divergedearly in the trial, suggesting the latter model. We examined thedynamics of neuronal performance as a function of coherenceusing higher time resolution. Because neuronal thresholds didnot differ between the two monkeys, this analysis was appliedto the entire sample of 90 cells. For each cell, we divided thetrial into 50-ms time bins and calculated the ROC value in eachtime window for each motion strength level.
The neuronal signals appeared quickly; for all coherencelevels, the ROC value arose early (within the 1st 200 ms of thetrial) and was relatively flat throughout the trial, as seen for oursample of 90 cells in Fig. 9. At the highest coherences, theROC value initially rose more steeply but plateaued at a
slightly lower level for the remainder of the stimulus duration.Not unexpectedly, the maximal value achieved for the highestcoherence was �1.0; the smaller time windows reduced thenumber of spikes available for the calculation, and the range ofdifferent absolute sensitivities further reduced the average sen-sitivity. The temporal dynamics observed suggest that sensitiveinformation was available early in the trial.
The early onset of neuronal sensitivity, coupled with itspersistence throughout the trial, suggests that shorter integra-tion times may be sufficient to achieve maximal sensitivity. Toinvestigate this possibility, we systematically increased inte-gration time in 50-ms intervals and calculated the threshold(�n) for each cell as a function of integration time (Fig. 10A).Note that �n sharply declined over the first 400–500 ms of thetrial and then leveled out to a gradual improvement in perfor-mance as additional integration time was allowed. This flat-tening occurred throughout the population and was not drivensolely by the less sensitive cells. To quantify this thresholdasymptote as a function of time, we calculated, for each cell,the ratio between thresholds early in the integration period (400ms) and late (the full 1-s duration). The distribution of theseratios is shown in Fig. 10B; the mean ratio is 1.26. This showsthat, on average, the neuronal threshold only improved by
FIG. 8. Relationship between behavioral and neuronal thresholds for eachmonkey. Large filled symbols are geometric means.
FIG. 9. Time course of selectivity. Each line represents median ROC valuefor the population for a single level of motion strength, calculated in 50-msbins. Data are plotted at the beginning of bin.
FIG. 10. Effects of integration time on neuronal threshold; integration timewas incremented in 50-ms steps. A: population results: solid line, geometricmean of �n for the population; dashed line, median values of the population.Arrows indicate times used for ratio calculation, as seen in B. B: distributionof ratios of �n with 400-ms integration to �n at the end of trial.
1321OPTIC FLOW DISCRIMINATION IN MST
J Neurophysiol • VOL 91 • MARCH 2004 • www.jn.org
on April 7, 2008
jn.physiology.orgD
ownloaded from

approximately 25% with an additional 600 ms of integrationtime. Some cells showed a slight increase in threshold with thelonger integration times, probably due to more transient re-sponses.
Two aspects of our data suggest that firing statistics changeover the duration of a trial. First, the average ROC value for agiven coherence level dropped slightly over time. Second,estimates of �n approached a plateau around 400 ms of inte-gration time. The drop in ROC value at later time points wasdue to the difference in firing rate between preferred and nullresponses decreasing over the course of the trial, as shown forone motion strength level (16% coherence; Fig. 11). Figure11A shows the average firing rates for preferred and nulldirections; all rates were normalized to the maximal responsefor the preferred direction for the individual neuron, whichcould occur in any time bin. Figure 11B shows the decline inthe difference between the null and preferred directions andrevealed that the difference did plateau in the later stages of thetrial.
We used a simulation to determine whether this decrease infiring rate difference was sufficient to account for the asymp-totic nature of the neuronal threshold as a function of integra-tion time. For each cell, we calculated the mean firing rates foreach motion strength and direction in each 50-ms window. Wethen used the mean firing rate for each window to generate aPoisson distribution of spike counts for that time bin. We usedthese simulated trials to produce ROC values as a function ofintegration time and fit the results with a Quick function (Eq.2) to evaluate the simulated neuronal thresholds.
There were modest, but systematic, departures of the neu-ronal thresholds from the simulation, indicating that the spik-ing statistics departed from purely Poisson predictions in twoways (Fig. 12A). First, the observed thresholds dropped morerapidly in the early portion of the trial than did the simulatedthresholds. Second, the observed thresholds remained higher atthe end of the trial than the simulation predicted. To quantify
FIG. 12. A: observed effects of integration time on neuronal thresholdcompared with expected effects from a Poisson simulation with changingmeans. Dashed line, geometric mean of simulation predictions; solid line,geometric mean of observed effects (see also Fig. 10). B: variance: meanrelationship changes over duration of trial. Each data point represents averageFano Factor for all conditions for all cells; error bars show SE.
FIG. 11. A: average responses for preferred and null directions for 16%coherence. For each cell, both preferred and null rates were normalized to themaximal rate for preferred direction. Error bars represent SE for the popula-tion. B: population average of normalized rate difference between preferredand null for 16% coherence as a function of time within trial.
1322 H. W HEUER AND K. H. BRITTEN
J Neurophysiol • VOL 91 • MARCH 2004 • www.jn.org
on April 7, 2008
jn.physiology.orgD
ownloaded from

this departure from Poisson statistics, we calculated the aver-age Fano factor (variance: mean ratio) across all cells and allconditions, as a function of time within the trial. Time windowsearly in the trial had more reliable spiking statistics (Fanofactors � 1), while late time epochs showed more variablefiring (Fig. 12B); the average Fano factors were significantlycorrelated with time (r � 0.831; P � 0.0001). This wasconsistent with the departures of the data from the simulationand indicates that responses early in the trial may be morereliably informative about the stimulus.
Trial by trial correlation between neuronal response andbehavioral choice
In many tasks for which neuronal sensitivity and perceptualsensitivity are quite similar, a signature of neuronal involve-ment in the task is found in the “choice probability” (Britten etal. 1996; Celebrini and Newsome 1994; Dodd et al. 2001;Parker et al. 2002). This metric captures the amount of trial-by-trial correlation between the response of a sensory neuronand the subsequent choice of the monkey. Given the correla-tion between neuronal and perceptual thresholds in this study,it seemed likely that a choice probability would exist in ourdata as well.
We explored the choice probability for our population ofMST cells and were surprised to find little relationship betweenchoice and neuronal activity on a trial-by-trial basis. We com-puted a single choice probability for each neuron by combiningacross all stimulus conditions where the monkey made at leastthree decisions in each direction (for details, see METHODS).Choice probability values are bounded between 0 and 1, with0.5 representing chance (no correlation). Choice probabilitiesover 0.5 reveal that the neuron’s response is higher for trialswhen monkey chooses the target representing its preferredstimulus than for null choice trials with identical stimuli.
In contrast to previous studies, we did not find a systematiccorrelation between firing rate and behavioral decision. For oursample of 90 neurons, the average choice probability was 0.513(not significant, P � 0.05, 2-tailed t-test; Fig. 13). We used apermutation test to determine significance for the individualchoice probabilities. The choice probability was significant for20% (18/90) of cells; for one-half of these, the effect wasbackward, indicating an anti-correlation.
Despite the difference in threshold ratios between the twomonkeys, there was no corresponding difference between thechoice probabilities for the two monkeys. On average, monkeyF had higher choice probabilities (mean � 0.52) than monkeyH (mean � 0.501), but these distributions were not signifi-cantly different. This indicates that the lack of choice proba-bility is not a reflection of differing behavioral strategies be-tween the two monkeys.
Our observed choice probabilities were not related to neu-ronal response properties. There was no trend for more sensi-tive neurons to exhibit higher choice probabilities, as previ-ously seen (e.g., Fig. 8, Celebrini and Newsome 1994). Simi-larly, there was no correlation between choice probability andthreshold ratio. Intuitively, it would seem likely that cells withsensitivities most similar to the behavioral sensitivity wouldhave a higher choice probability, but we did not observe thisrelationship in our data. We also examined the relationshipsbetween choice probability and dynamic range, preferred di-rection, and direction selectivity of the neuron under study.None of these response properties showed a significant corre-lation with choice probability. This suggests that the lack ofsignificant choice probability in our data set was not due to theinclusion of insensitive or irrelevant neuronal signals.
These choice probabilities were calculated with the spikecounts from the full stimulus duration, which could obscuresubtleties in the time course of neuronal firing. Therefore wealso investigated choice probabilities as a function of time,using the same 50-ms bins as we did for the sensitivity anal-ysis. Previous investigations that reported significant choiceprobabilities in the population found that the signal accumu-lated early and remained constant for the duration of the trial(e.g., Britten et al. 1996). However, given that much of theobserved sensitivity accumulated within the first 500 ms of thetrial, it was possible that choice probabilities would be higherduring the early portion of the trial, reflecting the most potentneuronal signal. Alternatively, significant choice probabilitiescould occur late in the trial, perhaps reflecting the upcomingdecision. Neither of these possibilities was seen clearly in thedata (data not shown); choice probabilities were noisy butgenerally flat across the trial duration. This suggests that thelack of significant choice probabilities was not a result of thetime window used for analysis; choice-related activity was notconsistently seen in any part of the trial.
D I S C U S S I O N
Our experiments produced two main results. When testedwith stimuli optimized in “spiral space,” neurons in MSTexhibited a wide range of sensitivities. Many cells had thresh-olds similar or superior to those measured behaviorally. Whilethe two monkeys in this study differed substantially in theirperceptual thresholds, the neurons from these animals weremore similar. Another measure of neuronal involvement in atask—the choice probability—was weak or nonexistent in ourdata. From this pattern of results, we can assert that MSTneurons are largely sufficient to support perceptual perfor-mance on such optic flow tasks, but in all likelihood, are notlimiting for performance. It is likely that area MST works inconcert with other areas to support task performance.
FIG. 13. Population distribution of choice probabilities. Solid bars indicatecases where the choice probability was significantly different from chance(0.5).
1323OPTIC FLOW DISCRIMINATION IN MST
J Neurophysiol • VOL 91 • MARCH 2004 • www.jn.org
on April 7, 2008
jn.physiology.orgD
ownloaded from

Complex motion analysis in MST
The neuronal sensitivities we observed support the idea thatMST can provide sufficient information for perceptual analysisof optic flow. However, this does not necessarily imply thatMST is specialized for optic flow processing, nor that theprocessing optic flow must occur only within MST. Instead, webelieve that the wide range of relative sensitivities we obtainedis likely to be a common observation at the higher levels ofcortical hierarchies and may reflect the multitude of sensoryprocesses supported by activity within MST.
While many studies have focused on the role of MST invisual motion perception, neurons in MST also respond toextraretinal signals, including eye position within the orbit(Squatrito and Maioli 1997), ocular following or pursuit eyemovements (Kawano et al. 1994; Newsome et al. 1988), andvestibular input (Bremmer et al. 1999; Thier and Erickson1992). Additionally, many neurons show selective responses tocombinations of retinal motion image and extraretinal signals(Bradley et al. 1996; Duffy 1998; Upadhyay et al. 2000).Individual neurons in MST may be quite sensitive for one typeof signal while being responsive but insensitive to another.This would result in a wide range of sensitivities when only asingle stimulus type is explored and is consistent with ourobservations.
The diversity of sensory signals within MST need not implythat the representation of optic flow is “sparse,” with only asmall fraction of neurons actively contributing at any one time.Instead, large numbers of neurons are responsive to optic flow,with widely varying sensitivities relative to the monkey. Underthese circumstances, two different pooling and decision rulesare possible if the monkey is relying on the signals from MSTfor its perceptual judgment. First, the monkey could be usingonly a portion of the active neurons—those that have sensitiv-ities close to his own. In both of our monkeys, these well-matched neurons are not the most sensitive ones, which exceedbehavioral capabilities. Thus this rule would conform poorly tothe “lower envelope principle” (Mountcastle et al. 1972). Al-ternately, the monkey could pool broadly over the populationand use signal averaging to achieve higher sensitivity. Thelatter model is broadly consistent with our observations.
Missing choice probability
In several related experiments in the motion pathway, sig-nificant choice probabilities have been interpreted as a signa-ture of neuronal involvement in the perceptual task. One studyin particular is quite comparable to ours. Celebrini and New-some (1994) measured both sensitivity and choice probabilityfor MST neurons in the context of a linear direction-discrim-ination task. Their analysis of neuronal sensitivity revealed apattern of results not very different from ours. Neurons wereslightly more sensitive in that context, relative to the monkey,but again showed a range of sensitivities. However, choiceprobabilities were much larger in their study, suggesting anassociation between area MST and linear motion discrimina-tions.
This difference in choice probability for two related tasks ispuzzling. There are two main differences between the twotasks. The most conspicuous one lies in the stimuli: complexversus translational motion. The other difference is more sub-
tle—our monkeys were given “matching” saccade targets atthe end of the trial. These targets contained motion in theneuron’s preferred and null direction. We do not believe thatthis latter task difference explains the lack of significant choiceprobabilities in our study. Significant choice probabilities havebeen seen during the sample period of a delayed match-to-sample task in area MT (T. Pasternak, personal communica-tion), indicating that matching tasks do not eliminate the trial-by-trial correlation between neuronal activity and behavioralchoice. Additionally, after initial inspection of the targets at thebeginning of the block, the monkeys could use the position ofthe target for their response; target locations were constantthroughout a block of trials. It seems probable that the mon-keys switched to such a position strategy early in each block,since their response latencies were very short. Therefore itseems unlikely that the monkeys were performing a truematching task. Given this, we conclude that the difference inchoice probabilities reflects a qualitatively different involve-ment in tasks requiring the analysis of complex motion.
The weak or nonexistent choice probability in our data alsoappears to contradict the results of microstimulation in MSTduring a heading discrimination task (Britten and Van Wezel2002). Microstimulation influenced perceptual judgments ofsimulated heading, and those effects have been interpreted tosupport MST’s involvement in complex motion perception.However, a number of significant effects in the microstimula-tion were backwards from the expected direction, suggestingthat the relationship between MST activity and perception wasnot straightforward. Second, the horizontal headings used inthose experiments contained substantial translational flow. Asdemonstrated by Celebrini and Newsome (1995), microstimu-lation in MST also affected linear discriminations. The micro-stimulation effects observed in the heading task may be par-tially due to the strong translational components in the stimuli.Taken together, these results suggest that the relationship be-tween neuronal activity in MST and complex motion percep-tion may be weaker than the relationship for linear motionanalysis.
Interanimal differences
A curious feature of our data was that, while neuronalthresholds were on average similar for the two monkeys,behavioral thresholds were not. Monkey H had higher behav-ioral thresholds, resulting in lower threshold ratios. The differ-ences between monkeys may be due to differing perceptualabilities or behavioral control issues. In three cases, monkey Hhad unusually high thresholds; these were sessions when theneuron’s response properties dictated stimulus parameters thatwere less commonly encountered during training. For the re-maining cases, monkey H’s performance was consistent withthresholds obtained during the final stages of training, whichwere asymptotic against time. This indicates that the observedthresholds were an accurate reflection of perceptual ability. Wealso confirmed that monkey H was not strictly using local cuesby testing with a foveally centered stimulus that should haveencouraged such a strategy. Further support was provided bythe slopes of the psychometric functions, which will be lowerfor monkeys inadequately motivated or performing poorly.Slopes were similar between the two monkeys and fell into anacceptable range. Therefore the observed differences between
1324 H. W HEUER AND K. H. BRITTEN
J Neurophysiol • VOL 91 • MARCH 2004 • www.jn.org
on April 7, 2008
jn.physiology.orgD
ownloaded from

the two monkeys cannot be attributed to differing behavioralcontrol, and presumably, they reflect differing perceptual abil-ities.
Although the perceptual thresholds differed between the twoanimals, the neuronal thresholds did not. This contrasts withprevious observations for a linear direction discrimination taskin area MT (Britten et al. 1992), where both neuronal andpsychophysical thresholds varied between animals in a corre-lated manner—animals with more sensitive behavioral thresh-olds also had more sensitive neurons. The difference in per-ceptual thresholds for our task, unaccounted for by neuronalthreshold differences, strongly suggests that other areas con-tribute to performance and might even limit it. The additionalinfluences on performance may lie in downstream decisionmechanisms or else in the contributions of other sensory rep-resentations of optic flow information. It could be argued thatthe decoupling between neuronal and perceptual thresholds weobserve would be consistent with MST being completely un-involved in this task. While this is possible, it would requirethat perception was not using a source of sufficient signals forperformance, and we find this idea less than parsimonious.
Optic flow signals in other cortical areas
Although MST clearly contains suitable neuronal signals foroptic flow processing, our results suggest that optic flow per-ception is likely to be based on activity in multiple corticalareas, including the ventral parietal area (VIP) and parietal area7a. Both of these areas contain neurons with similar selectiv-ities for spiral space motion as those in MST (Schaafsma andDuysens 1996; Siegel and Read 1997), and are also goodcandidates for the neuronal substrate of optic flow perception.Additionally, the anterior portion of the superior temporalpolysensory area (STPa) contains neurons that respond selec-tively to optic flow components, although they appear to bemore restricted to the cardinal axes of radial and rotary motion(Anderson and Siegel 1999). Perception of complex motionspatterns may depend on activity in all four areas, either hier-archically or in parallel. MST projects to VIP, 7a, and STPa(Andersen et al. 1990; Baizer et al. 1991; Boussaoud et al.1990), suggesting sequential processing. Intuitively, this wouldsuggest that sensitivities in one of these other areas might begreater and that neurons in these areas might exhibit higherchoice probabilities than we observed in MST. Alternatively, ifsignals from multiple cortical areas are pooled for the task,choice probabilities would be reduced due to lesser interneu-ronal correlation across the areas (Shadlen et al. 1996) There-fore the most sensible conclusion to draw from our results isthat MST contributes to complex motion perception, but it islikely to do so in concert with other cortical areas.
A C K N O W L E D G M E N T S
We thank R. E. Tarbet, J. L. Moore, and M. R. Nilsson for technicalassistance and monkey training. A. L. Jones wrote the stimulus presentationsoftware. We thank A. M. Churchland, K. A. McAllister, G. H. Recanzone,and W. M. Usrey for valuable comments on earlier versions of the manuscript.
G R A N T S
This work was supported by National Institutes of Health Grants EY-10562and EY-12576 to K. H. Britten and MH-11700 to H. W. Heuer.
R E F E R E N C E S
Anderson KC and Siegel RM. Optic flow selectivity in the anterior superiortemporal polysensory area, STPa, of the behaving monkey. J Neurosci 19:2681–2692, 1999.
Andersen R, Snowden R, Treue S, and Graziano M. Hierarchical process-ing of motion in the visual cortex of monkey. In: Cold Spring HarborSymposia on Quantitative Biology, Vol. LV, The Brain. Plain View, NY:Cold Spring Harbor Laboratory Press, 1990, p. 741–748.
Baizer JS, Ungerleider LG, and Desimone R. Organization of visual inputsto inferior temporal and posterior parietal cortex in macaques. J Neurosci11: 168–190, 1991.
Boussaoud D, Ungerleider LG, and Desimone R. Pathways for motionanalysis: cortical connections of the medial superior temporal and fundus ofthe superior temporal visual areas in the macaque. J Comp Neurol 296:462–495, 1990.
Bradley A, Skottun BC, Ohzawa I, Sclar G, and Freeman RD. Visualorientation and spatial frequency discrimination: a comparison of singlecells and behavior. J Neurophysiol 57: 755–772, 1987.
Bradley DC, Maxwell M, Andersen RA, Banks MS, and Shenoy KV.Mechanisms of heading perception in primate visual cortex. Science 273:1544–1547, 1996.
Bremmer F, Kubischik M, Pekel M, Lappe M, and Hoffmann KP. Linearvestibular self-motion signals in monkey medial superior temporal area. AnnNY Acad Sci 871: 272–281, 1999.
Britten KH, Newsome WT, Shadlen MN, Celebrini S, and Movshon JA. Arelationship between behavioral choice and the visual responses of neuronsin macaque MT. Vis Neurosci 13: 87–100, 1996.
Britten KH, Shadlen MN, Newsome WT, and Movshon JA. The analysis ofvisual motion: a comparison of neuronal and psychophysical performance.J Neurosci 12: 4745–4765, 1992.
Britten KH and Van Wezel RJA. Electrical microstimulation of cortical areaMST biases heading perception in monkeys. Nature Neurosci 1: 1–5, 1998.
Britten KH and Van Wezel RJA. Area MST and heading perception inMacaque monkeys. Cereb Cortex 12: 692–701, 2002.
Celebrini S and Newsome WT. Neuronal and psychophysical sensitivity tomotion signals in extrastriate area MST of the macaque monkey. J Neurosci14: 4109–4124, 1994.
Celebrini S and Newsome WT. Microstimulation of extrastriate area MSTinfluences performance on a direction discrimination task. J Neurophysiol73: 437–448, 1995.
Chandler JP. STEPIT: University of Indiana Quantum Chemistry ProgramExchange, 1965.
Crist CF, Yamasaki DSG, Komatsu H, and Wurtz RH. A grid system anda microsyringe for single cell recording. J Neurosci Methods 26: 117–122,1988.
DeAngelis GC and Uka T. Coding of horizontal disparity and velocity by MTneurons in the alert macaque. J Neurophysiol 89: 1094–1111, 2003.
Desimone R and Ungerleider LG. Multiple visual areas in the caudal superiortemporal sulcus of the macaque. J Comp Neurol 248: 164–189, 1986.
Dodd JV, Krug K, Cumming BG, and Parker AJ. Perceptually bistable 3-Dfigures evoke high choice probabilities in cortical area MT. J Neurosci 21:4809–4821, 2001.
Duffy CJ. MST neurons respond to optic flow and translational movement.J Neurophysiol 80: 1816–1827, 1998.
Duffy CJ and Wurtz RH. Sensitivity of MST neurons to optic flow stimuli.I. A continuum of response selectivity of large-field stimuli. J Neurophysiol65: 1329–1345, 1991a.
Duffy CJ and Wurtz RH. Sensitivity of MST neurons to optic flow stimuli.II. Mechanisms of response revealed by small-field stimuli. J Neurophysiol65: 1346–1359, 1991b.
Duffy CJ and Wurtz RH. Response of monkey MST neurons to optic flowstimuli with shifted centers of motion. J Neurosci 15: 5192–5208, 1995.
Froehler MT and Duffy CJ. Cortical neurons encoding path and place: whereyou go is where you are. Science 295: 2462–2465, 2002.
Geesaman BJ and Andersen RA. The analysis of complex motion patterns byform/cue invariant MSTd neurons. J Neurosci 16: 4716–4732, 1996.
Gibson JJ. Perception of the Visual World. Boston, MA: Houghton-Mifflin,1950.
Gold JI and Shadlen MN. Banburismus and the brain: decoding the relation-ship between sensory stimuli, decisions, and reward. Neuron 36: 299–308,2002.
Graziano MSA, Andersen RA, and Snowden RJ. Tuning of MST neuronsto spiral motions. J Neurosci 14: 54–67, 1994.
1325OPTIC FLOW DISCRIMINATION IN MST
J Neurophysiol • VOL 91 • MARCH 2004 • www.jn.org
on April 7, 2008
jn.physiology.orgD
ownloaded from

Green DM and Swets JA. Signal Detection Theory and Psychophysics. NewYork: John Wiley, 1966.
Hays AV, Richmond BJ, and Optican LM. A UNIX-based multiple processsystem for real-time data acquisition and control. WESCON Conf Proc 2:1–10, 1982.
Heuer HW and Britten KH. Comparison of perceptual and neural sensitivityto optic flow patterns in macaque area MST. Soc Neurosci Abstr 25, 1999.
Heuer HW and Britten KH. The relationship between behavioral choice andneuronal activity in extrastriate area MST during a complex motion dis-crimination task. Soc Neurosci Abstr 251.5, 2000.
Hoel P, Port S, and Stone C. Introduction to Statistical Theory. Boston, MA:Houghton Mifflin Company, 1971.
Judge SJ, Richmond BJ, and Chu FC. Implantation of magnetic search coilsfor measurement of eye position: an improved method. Vision Res 20:535–538, 1980.
Kawano K, Shidara M, Watanabe Y, and Yamane S. Neural activity incortical area MST of alert monkey during ocular following responses.J Neurophysiol 71: 2305–2324, 1994.
Mardia KV and Jupp PE. Directional Statistics. New York: Chichester,2000.
Mountcastle V, LaMotte R, and Carli G. Detection thresholds for vibratorystimuli in humans and monkeys; comparison with threshold events inmechanoreceptive first order afferent nerve fibrers innervating monkeyhands. J Neurophysiol 35: 122, 1972.
Newsome WT, Wurtz RH, and Komatsu H. Relation of cortical areas MTand MST to pursuit eye movements. II. Differentiation of retinal fromextraretinal inputs. J Neurophysiol 60: 604–620, 1988.
Orban GA. Visual processing in macaque area MT/V5 and its satellites(MSTd and MSTv). In: Cerebral Cortex, edited by Rockland KS, Kaas JH,and Peters A. New York: Plenum, 1997, p. 359–434.
Page WK and Duffy CJ. MST neuronal responses to heading direction duringpursuit eye movements. J Neurophysiol 81: 596–610, 1999.
Paolini M, Distler C, Bremmer F, Lappe M, and Hoffmann KP. Responsesto continuously changing optic flow in area MST. J Neurophysiol 84:730–743, 2000.
Parker AJ, Krug K, and Cumming BG. Neuronal activity and its links withthe perception of multi-stable figures. Philos Trans R Soc Lond B Biol Sci357: 1053–1062, 2002.
Quick RF. A vector magnitude model of contrast detection. Kybernetik 16:65–67, 1974.
Saito H, Yukie M, Tanaka K, Hikosaka K, Fukada Y, and Iwai E.Integration of direction signals of image motion in the superior temporalsulcus of the macaque monkey. J Neurosci 6: 145–157, 1986.
Schaafsma SJ and Duysens J. Neurons in the ventral intraparietal area ofawake macaque monkey closely resemble neurons in the dorsal part of themedial superior temporal area in their responses to optic flow patterns.J Neurophysiol 76: 4056–4068, 1996.
Shadlen MN, Britten KH, Newsome WT, and Movshon JA. A computa-tional analysis of the relationship between neuronal and behavioral re-sponses to visual motion. J Neurosci 16: 1486–1510, 1996.
Siegel RM and Read HL. Analysis of optic flow in the monkey parietal area7a. Cereb Cortex 7: 327–346, 1997.
Squatrito S and Maioli MG. Gaze field properties of eye position neuronesin areas MST and 7a of the macaque monkey. Vis Neurosci 13: 385–398,1996.
Squatrito S and Maioli MG. Encoding of smooth pursuit direction and eyeposition by neurons of area MSTd of macaque monkey. J Neurosci 17:3847–3860, 1997.
Tanaka K, Fukada Y, and Saito H. Underlying mechanisms of the responsespecificity of expansion/contraction and rotation cells in the dorsal part ofthe medial superior temporal area of the Macaque monkey. J Neurophysiol62: 642–656, 1989.
Tanaka K, Hikosaka H, Saito H, Yukie Y, Fukada Y, and Iwai E. Analysisof local and wide-field movements in the superior temporal visual areas ofthe macaque monkey. J Neurosci 6: 134–144, 1986.
Tanaka K and Saito H. Analysis of motion of the visual field by direction,expansion/contraction and rotation cells clustered in the dorsal part of themedial superior temporal area of the Macaque monkey. J Neurophysiol 62:626–641, 1989.
Thier P and Erickson RG. Vestibular input to visual-tracking neurons in areaMST of awake rhesus monkeys. Ann NY Acad Sci 656: 960–963, 1992.
Upadhyay UD, Page WK, and Duffy CJ. MST responses to pursuit acrossoptic flow with motion parallax. J Neurophysiol 84: 818–826, 2000.
Van Essen DC, Maunsell JHR, and Bixby JL. The middle temporal visualarea in the macaque: myeloarchitecture, connections, functional propertiesand topographic representation. J Comp Neurol 199: 293–326, 1981.
1326 H. W HEUER AND K. H. BRITTEN
J Neurophysiol • VOL 91 • MARCH 2004 • www.jn.org
on April 7, 2008
jn.physiology.orgD
ownloaded from