HIGHWAY REST AREA SURVEY REPORT - B.C. Homepage - … · HIGHWAY REST AREA SURVEY REPORT Page 1 1...
28
TRUCK STOP SERVICES IN B.C. MARKET RESEARCH HIGHWAY REST AREA SURVEY REPORT September 2016 Davies Transportation Consulting Inc. Wave Point Consulting Ltd. S5 Services Site Economics
Transcript of HIGHWAY REST AREA SURVEY REPORT - B.C. Homepage - … · HIGHWAY REST AREA SURVEY REPORT Page 1 1...

TRUCK STOPSERVICES IN B.C.MARKET RESEARCH
HIGHWAY REST AREASURVEY REPORT September 2016
Davies Transportation Consulting Inc.
Wave Point Consulting Ltd.
S5 Services
Site Economics


H I G H W A Y R E S T A R E A S U R V E Y R E P O R T P a g e i
TABLE OF CONTENTS
1.0 EXECUTIVE SUMMARY . . . . . . . . . . . . . . . . . . . . . . . . . . . . . . . . . 1
2.0 INTRODUCTION . . . . . . . . . . . . . . . . . . . . . . . . . . . . . . . . . . . . . . 2
3.0 SURVEY DEMOGRAPHICS . . . . . . . . . . . . . . . . . . . . . . . . . . . . . . 4
3.1 Demographics . . . . . . . . . . . . . . . . . . . . . . . . . . . . . . . . . . . . 4
3.2 Industry Sector . . . . . . . . . . . . . . . . . . . . . . . . . . . . . . . . . . . . 5
3.3 Employment Status . . . . . . . . . . . . . . . . . . . . . . . . . . . . . . . . 5
3.4 Experience . . . . . . . . . . . . . . . . . . . . . . . . . . . . . . . . . . . . . . . 6
4.0 TRIP PROFILES . . . . . . . . . . . . . . . . . . . . . . . . . . . . . . . . . . . . . . . 7
4.1 Trip Types . . . . . . . . . . . . . . . . . . . . . . . . . . . . . . . . . . . . . . . . 7
4.2 Trip Origins . . . . . . . . . . . . . . . . . . . . . . . . . . . . . . . . . . . . . . 8
4.3 Trip Destinations . . . . . . . . . . . . . . . . . . . . . . . . . . . . . . . . . . 8
4.4 Trip Origins vs Destinations . . . . . . . . . . . . . . . . . . . . . . . . . . 9
4.5 Highways Used on the Most Recent Trip . . . . . . . . . . . . . . . . . 9
5.0 DRIVER STOPS ON THE LAST TRIP . . . . . . . . . . . . . . . . . . . . . . . . 10
5.1 First Stop . . . . . . . . . . . . . . . . . . . . . . . . . . . . . . . . . . . . . . . 10
5.2 Second Stop . . . . . . . . . . . . . . . . . . . . . . . . . . . . . . . . . . . . 11
6.0 REST AREA LOCATIONS . . . . . . . . . . . . . . . . . . . . . . . . . . . . . . . 12
7.0 REST AREA AMENITIES . . . . . . . . . . . . . . . . . . . . . . . . . . . . . . . . 13
7.1 Current Rest Area Amenities . . . . . . . . . . . . . . . . . . . . . . . . . 13
7.2 Rest Area Improvements . . . . . . . . . . . . . . . . . . . . . . . . . . . 13
7.3 Improvements to Existing Services . . . . . . . . . . . . . . . . . . . . 14
7.4 Paid Services at Rest Areas . . . . . . . . . . . . . . . . . . . . . . . . . . 14
8.0 OPEN-ENDED RESPONSES . . . . . . . . . . . . . . . . . . . . . . . . . . . . . 15
8.1 Examples of Good Rest Areas . . . . . . . . . . . . . . . . . . . . . . . . 15
8.2 Attributes of a Good Rest Area . . . . . . . . . . . . . . . . . . . . . . . 15
8.3 Locations for Rest Area Improvements in B.C. . . . . . . . . . . . . 17
8.4 Final Comments . . . . . . . . . . . . . . . . . . . . . . . . . . . . . . . . . . 18
APPENDIX: SURVEY QUESTIONS . . . . . . . . . . . . . . . . . . . . . . . . . . . . . . 19
P a g e i i H I G H W A Y R E S T A R E A S U R V E Y R E P O R T

H I G H W A Y R E S T A R E A S U R V E Y R E P O R T P a g e 1
1 EXECUTIVE SUMMARY The British Columbia Rest Area Survey was commissioned by the B.C. Ministry
of Transportation and Infrastructure to gather information on commercial
truck drivers’ use of private truck stops and highway Rest Areas, to identify
the Rest Area services which are most important to them, and obtain their
views on potential additional Rest Area locations and services. The consulting
team engaged to undertake the project was led by Davies Transportation
Consulting Inc. (DTCI), in collaboration with Wave Point Consulting Ltd.,
S5 Services and Site Economics Ltd.
The on-line survey was conducted between January 11 and January 31, 2016
The survey generated interest among commercial truck drivers, with 835
respondents participating and 574 completing all questions including those
that required providing written remarks. Key findings of the survey included:
• 90% of respondents indicated that they would support additional
paid services such as fast food restaurants, convenience stores,
showers, and fuel stations.
• 83% of those surveyed wanted better rest area amenities.
The highest ranked improvements (in order of priority) were
more truck parking, upgraded restroom with flush toilets,
and improved lighting.
• 82% of respondents would like more rest areas.
These, and the greater detail within the report, will assist the Ministry of
Transportation and Infrastructure in planning for Rest Area improvements
and further help expand the services available at B.C.’s public Rest Areas.
P a g e 2 H I G H W A Y R E S T A R E A S U R V E Y R E P O R T
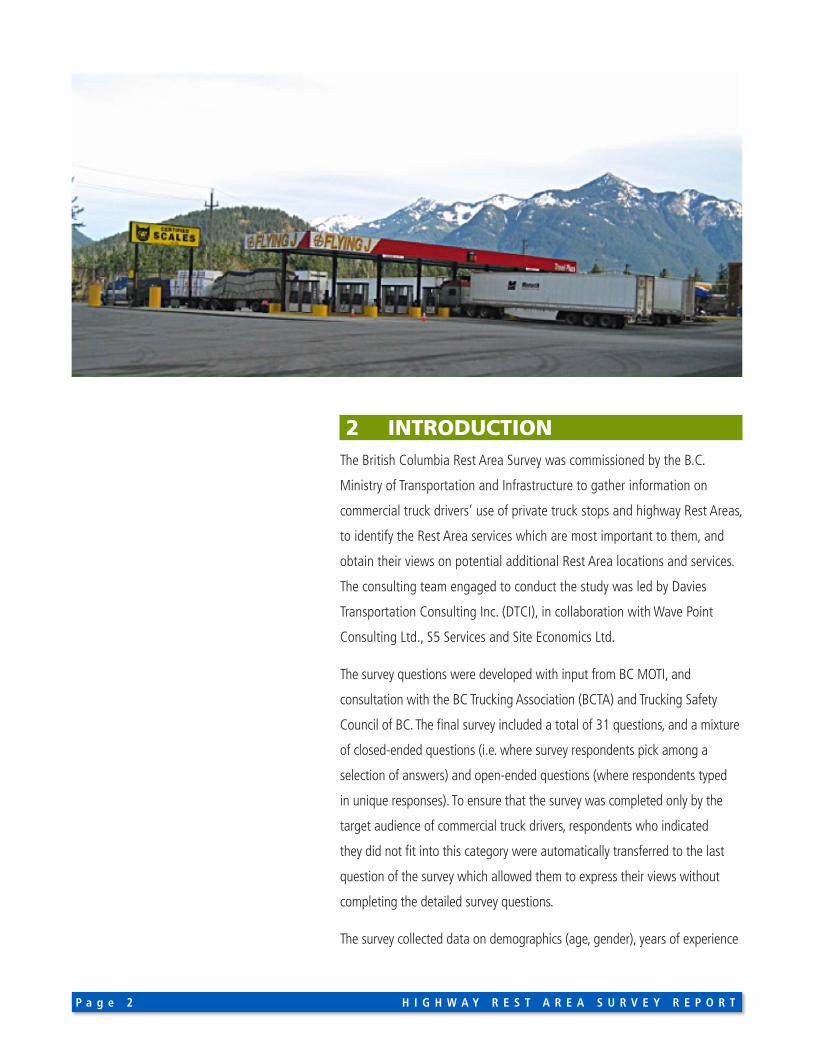
2 INTRODUCTIONThe British Columbia Rest Area Survey was commissioned by the B.C.
Ministry of Transportation and Infrastructure to gather information on
commercial truck drivers’ use of private truck stops and highway Rest Areas,
to identify the Rest Area services which are most important to them, and
obtain their views on potential additional Rest Area locations and services.
The consulting team engaged to conduct the study was led by Davies
Transportation Consulting Inc. (DTCI), in collaboration with Wave Point
Consulting Ltd., S5 Services and Site Economics Ltd.
The survey questions were developed with input from BC MOTI, and
consultation with the BC Trucking Association (BCTA) and Trucking Safety
Council of BC. The final survey included a total of 31 questions, and a mixture
of closed-ended questions (i.e. where survey respondents pick among a
selection of answers) and open-ended questions (where respondents typed
in unique responses). To ensure that the survey was completed only by the
target audience of commercial truck drivers, respondents who indicated
they did not fit into this category were automatically transferred to the last
question of the survey which allowed them to express their views without
completing the detailed survey questions.
The survey collected data on demographics (age, gender), years of experience

H I G H W A Y R E S T A R E A S U R V E Y R E P O R T P a g e 3
of the respondents and basic information about the vehicle type. It also
collected data on their most recent trip in B.C., including trip origin and
destination, type of location and purpose of first and second stops (if
applicable), rankings of current Rest Area locations and services, and
commercial services which drivers might like to see made available at Rest
Areas.
The on-line survey was conducted between January 11 and January 31, 2016.
The average time required to complete the survey was 12 minutes.
The survey communications strategy included cooperation from BCTA and
provincial associations in promoting the survey to their members; social
media; and printed handouts. BCTA used their electronic newsletter and
website to request industry participation in the study. In addition, Ministry
of Transportation and Infrastructure officials from the communications
branch and at regional level used social media and distributed a handout to
truck drivers at commercial weigh scales. In addition, the study team used
both free and paid social media tools to promote awareness of the study.
Of the 1,740 individuals who viewed the landing page summarizing the
survey’s purpose, 835 started the survey. Since none of the questions were
mandatory, respondents could choose their level of survey participation. As
a result, 574 individuals completed the entire survey for a 68% completion
rate. The open-ended questions were generally the ones where some of
the survey respondents chose not to provide a response. While the focus of
the survey was on commercial truck drivers, the survey did provide an open
ended question that allowed anyone to provide their views by way of a
written response. This feature was used by 274 individuals.
The sample size provides assurance that the views expressed in the survey
responses are broadly representative of commercial truck drivers using the
B.C. highway network.
Acknowledging the following associations:
Alberta Motor Transport Association
Saskatchewan Trucking Association
Manitoba Trucking Association
Ontario Trucking Association
Quebec Trucking Association
Atlantic Provinces Trucking Association
Northern BC Truckers Association
Washington Trucking Association

P a g e 4 H I G H W A Y R E S T A R E A S U R V E Y R E P O R T
3 SURVEY DEMOGRAPHICS
3.1 Demographics Drivers over 40 years old accounted for 75% of the survey
respondents, with drivers between 25 and 39 accounting
for an additional 23%. There were very few respondents
under 25.
The age distribution of the survey sample relative to the
Canadian industry can be seen in the figure below, which
shows the Rest Area survey demographic data and that
reported in a major survey conducted for the Canadian
Trucking Human Resource Council (CTHRC) in 2012 to
develop an industry-wide profile of the trucking labour
force in Canada.
Note that the age categories reported in the CTHRC
survey do not exactly match those in the Rest Area
survey, except for the oldest category (over 55). This age
group accounted for 27% of the Rest Area survey sample
compared to 22% for the CTHRC study. The low level of
participation in the Rest Area survey by younger drivers is
consistent with industry demographics. In the Rest Area
sample, 93% of survey respondents indicated they are
male and 7% indicated they were female. In comparison,
the CTHRC survey results indicated the share of female
drivers in the Class1/AZ category was only 4%. Thus, we
were able to capture a high rate of female participation in
this current survey.
24 or younger 25 to 39 40 to 54 55 or older0
20
40
60
1%
23%
48%
27%
Fig. 1 Rest Area Survey Respondent Age Profile
Under 30 31-44 45-55 Over 55 0
20
40
60
13%
30%
36%
22%
Fig. 2 CTHRC Survey Respondent Age Profile(Class 1/AZ) Drivers

H I G H W A Y R E S T A R E A S U R V E Y R E P O R T P a g e 5
3.2 Industry Sector Eighty-two percent (82%) of respondents indicated they
are commercial truck drivers. For purposes of the study,
it was important to categorize drivers between long haul
drivers (defined as drivers who sleep away from home for
work) and short haul drivers because it affects the type
of services that may be desired; i.e. long haul drivers are
more likely to make use of long term parking options
for mandatory rest periods required by Hours of Service
(HOS) regulations. In the Rest Area survey sample, 72%
indicated that they are long haul drivers (i.e. they sleep
away from home for work, and 19% indicated they are
short haul drivers (sleep at home).
In order to take advantage of private truck stops or Rest
Areas for rest periods, the truck must be equipped with
a sleeper cab. In the survey sample, 84% of respondents
indicated their truck is equipped with a sleeper cab.
3.3 Employment Status Drivers typically belong to one of two employment
categories. Employee drivers drive their employer’s
equipment and are paid a wage or salary. Owner-operators
own their own truck (and sometimes the trailer as well) and
are paid on a trip or mileage basis. For the Rest Area survey,
60% of drivers identified themselves as employees and
40% identified themselves as owner-operators.
Overall, 87% of drivers indicated they have complete
freedom to decide where to stop on their trip. Of the
remainder, 4% indicated they can choose from an
approved list of stops, 3% indicated that their company
specifies the locations where they are allowed to stop and
6% had other options.
0
20
40
60
80
100
72%
19%
4% 5%
Fig. 3 What type of commercial driver are you?
Long-haul
(sleep awayfrom home)
Short-haul
(sleepat home)
LocalDelivery
Other

P a g e 6 H I G H W A Y R E S T A R E A S U R V E Y R E P O R T
3.4 Experience By far the largest share (71%) of survey respondents
indicated they have over 10 years of experience as a
commercial driver. As such, these drivers had extensive
experience with the Highway Rest Areas in B.C. and in
other jurisdictions in which to make comparisons and
form opinions on what makes for a good Rest Area.
The trucking industry has for some years expressed
concern regarding difficulties in recruiting new drivers
to the industry. The composition of the survey sample
provides some evidence of this, as the vast majority of
drivers have been in the industry for 6 years or more, and
only 15% for 5 years or less.
0
20
40
60
80
100
2%
13% 15%
71%
Fig. 4 How long have you been a commercial driver?
Less thanone year
One to fiveyears
Six to tenyears
Over tenyears

H I G H W A Y R E S T A R E A S U R V E Y R E P O R T P a g e 7
4 TRIP PROFILES The survey included questions on respondents’ most
recent trip as a commercial truck driver in B.C. The
purpose of these questions was to assess the responses
regarding specific truck stop or Rest Area locations
relative to the number of respondents using a particular
highway, and to gather data on drivers’ actual use of
private truck stops and/or public Rest Areas on their last
trip. In addition, data on trip origins and destinations
provides an indication of trip lengths.
4.1 Trip Types The distribution of trips by type (intraprovincial,
interprovincial or international) is shown below.
Intraprovincial trips (i.e. trips within B.C.) accounted for
71% of total trips, compared to 26% for interprovincial
trips (primarily to or from Alberta) and 3% international
trips with either the origin or destination in the U.S.
Fig. 5 Rest Area Survey Trip Types
Interprovincial (26%)
International (3%)
Intraprovincial (71%)
P a g e 8 H I G H W A Y R E S T A R E A S U R V E Y R E P O R T
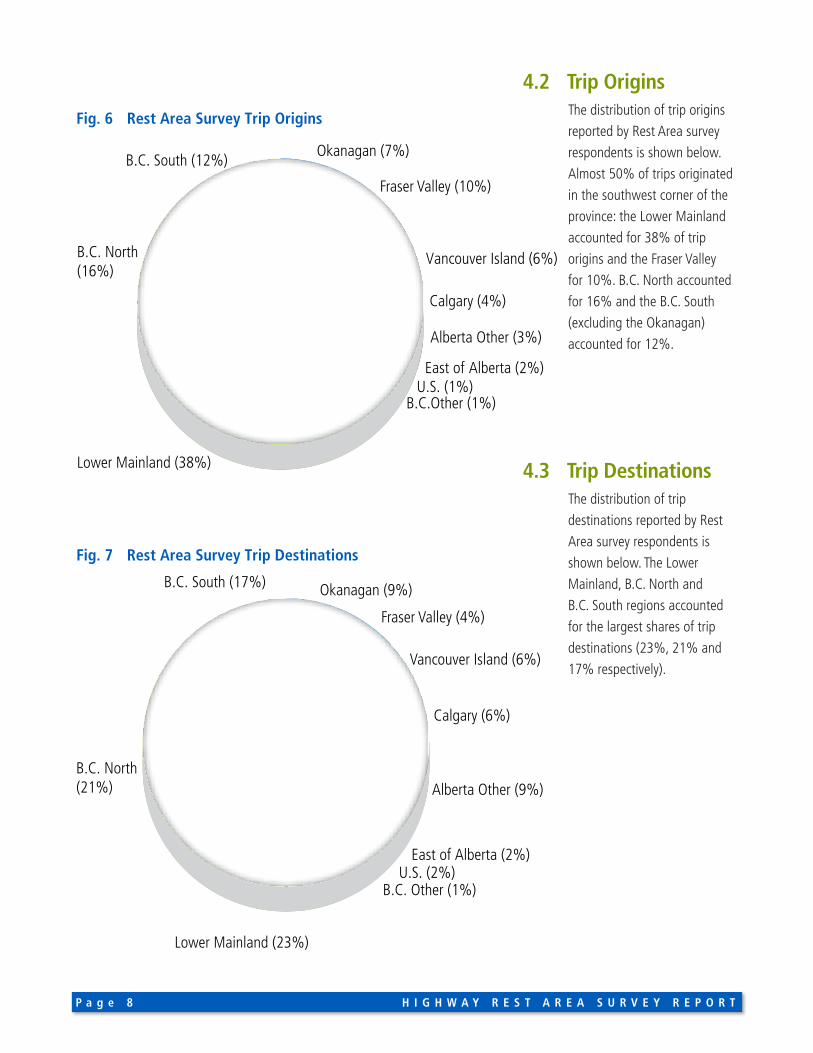
4.2 Trip Origins The distribution of trip origins
reported by Rest Area survey
respondents is shown below.
Almost 50% of trips originated
in the southwest corner of the
province: the Lower Mainland
accounted for 38% of trip
origins and the Fraser Valley
for 10%. B.C. North accounted
for 16% and the B.C. South
(excluding the Okanagan)
accounted for 12%.
4.3 Trip Destinations The distribution of trip
destinations reported by Rest
Area survey respondents is
shown below. The Lower
Mainland, B.C. North and
B.C. South regions accounted
for the largest shares of trip
destinations (23%, 21% and
17% respectively).
Okanagan (7%)
Fraser Valley (10%)
Vancouver Island (6%)
Calgary (4%)
Alberta Other (3%)
East of Alberta (2%)U.S. (1%)
B.C.Other (1%)
Lower Mainland (38%)
B.C. North (16%)
B.C. South (12%)
Fig. 6 Rest Area Survey Trip Origins
Okanagan (9%)
Fraser Valley (4%)
Vancouver Island (6%)
Calgary (6%)
Alberta Other (9%)
East of Alberta (2%) U.S. (2%)
B.C. Other (1%)
Lower Mainland (23%)
B.C. North(21%)
B.C. South (17%)
Fig. 7 Rest Area Survey Trip Destinations

H I G H W A Y R E S T A R E A S U R V E Y R E P O R T P a g e 9
4.4 Trip Origins vs Destinations A comparison of regional trip origin and destination
shares is shown below. The data indicates that The Lower
Mainland and Fraser Valley accounted for a much larger
share of trip origins than destinations, while the reverse
was true for all other regions except Vancouver Island,
where the shares are approximately evenly balanced.
4.5 Highways Used on the Most Recent Trip The main highways used by survey respondents on their
most recent trips are shown below.
The pattern is similar to that indicated by BC MOTI
traffic count data for heavy trucks, which shows the
highest level of heavy truck traffic on Highway 1, with an
Average Annual Daily Traffic (AADT) level of over 5,000
heavy trucks per day on Highway 1 in the Fraser Valley;
approximately 2,500 on the Coquihalla Highway
(Highway 5) linking Highway 1 in the Fraser Valley and
Kamloops; and about 700 on Highway 97 between
Kamloops and Prince George.
Lower Mainland
B.C. North
B.C. South
Okanagan
Fraser Valley
Vancouver Island
Calgary
Alberta Other
East of Alberta
U.S.B.C. Other
0
5
10
15
20
25
30
35
40 38
23
16
21
12
17
79
10
4
6 64
6
3
9
2 2 1 2 1 1
Origins
Destinations
Fig. 8 Origin and Destination Trips by Region (%)
0
10
20
30
40
50
60
7064%
16
24%
11%
2% 2%
17%
5%
Hwy1
Hwy3
Hwy5
Hwy16
Hwy19
Hwy95
Hwy97
Other
Fig. 9 Identify the main B.C. highways used on your last trip.

P a g e 1 0 H I G H W A Y R E S T A R E A S U R V E Y R E P O R T
5 DRIVER STOPS ON THE LAST TRIP The survey included questions on driver behaviour with regard to stops
made in the course of their most recent trip.
5.1 First Stop Most drivers (81%) indicated that they stopped at least
once on their most recent trip. The distribution of stops by
facility type is shown below.
The “Other” category included a variety of different
locations, including street parking, restaurants, parking
lots, and the side of the highway.
The most common reason for stopping was use of the
restroom. Public highway Rest Areas were the least
frequently mentioned location for a driver’s first stop in
British Columbia. Female drivers were more likely than
male drivers to use a private truck stop as the location of
their first stop in British Columbia.
Checks on the truck (brakes) or load (cargo securement),
chaining up for winter driving, or pulling in to a weigh
scale accounted for 32% of stops. Close to 20% stopped
to sleep overnight or to take a rest break required by
Hours of Service regulations. Food was the primary reason
reported for stopping for only 14% of respondents, and
fuel for only 6%. “Other” reasons for stopping included
compliance with permit restrictions and rest breaks
mandated by employers.
Most drivers stopped only briefly at their first stop, staying
for less than an hour. The share who reported staying for
8 hours or more is 19%, the same share as the drivers
who reported stopping to sleep overnight or take a rest
required by the HOS regulations.
fFig. 11 What was the primary purpose of your first stop in B.C.?
Brake Check/
Chain-up/Weigh Scale
Food FuelRest-room
Sleepover-night
Hours of
Service RestRequirement
OtherCargosecure-mentCheck
Bad weather
0
5
10
15
20
25
2%
19%
13%14%
6%
23%
13%
6%3%
Less than1 hour
1 hour to4 hours
4 hours to8 hours
8 hoursor more
0
20
40
60
80
64%
9% 8%
19%
Fig. 12 How much time did you spend at your first stop?
0
10
20
30
40
50
39%
32%
13%17%
Fig. 10 During your last trip, what type of facility did you use on your first stop in B.C.?
Brake CheckPull-out/Chain-up Pull-out/
Weigh Scale
CommercialTruckStop
HighwayRestArea
Other

H I G H W A Y R E S T A R E A S U R V E Y R E P O R T P a g e 1 1
5.2 Second Stop The majority of long-haul commercial truck drivers have
a need to make a second stop on their journey in British
Columbia. Of the drivers who made at least one stop on
their last trip, 73% made a second stop. The distribution
of these stops between different types of facilities is
shown below.
For the second stop, a private truck stop was the most
popular choice, followed by a highway pull-out or weigh
scale. Public highway Rest Areas were used by only 13%
of respondents for their second stop, the same share as
for the first stop.
The primary reasons for stopping reported for the second
stop were similar to those for the first stop, though a
larger share of drivers indicated food was the primary
purpose for the second stop (19%) than the first (14%).
The distribution of responses regarding time spent at the
second stop was also similar to that for the first stop, with
60% staying for an hour or less.
The survey results indicated that female drivers are more
reliant on public highway Rest Areas as the location of
their second stop in B.C. than the male drivers. Younger
drivers also had a greater need to sleep overnight as the
reason for their second stop in B.C.
0
10
20
30
40
25%
35%
13%
27%
Fig. 13 During your last trip, what type of facility did you use on your second stop?
Brake CheckPull-out/Chain-up Pull-out/
Weigh Scale
CommercialTruckStop
HighwayRestArea
Other
0
10
20
30
2%
12% 12%
19%
8%
25%
12%
5% 5%
Fig. 14 What was the primary purpose of your second stop?
Brake Check/
Chain-up/Weigh Scale
Food FuelRest-room
Sleepover-night
Hoursof
ServiceRest
Require-ment
OtherCargosecure-mentCheck
Bad weather
0
10
20
30
40
50
60
7060%
14%10%
16%
Less than1 hour
1 hour to4 hours
4 hours to8 hours
8 hoursor more
Fig. 15 How much time did you spend at your second stop?

P a g e 1 2 H I G H W A Y R E S T A R E A S U R V E Y R E P O R T
6 REST AREA LOCATIONS Drivers were asked several questions regarding the
number and locations of existing public Rest Areas, and
potential sites for new facilities.
Drivers were asked whether there were enough Rest
Areas on the route taken on their most recent trip. The
responses suggest that drivers want more public Rest
Areas throughout the province, as most (82%) of those
who responded disagreed or strongly disagreed with the
statement “there were enough Rest Areas along my route.”
The survey results show that 75% of respondents feel
the existing public rest areas could be in better locations.
Responses varied little between individual highways
StronglyAgree
Agree Disagree StronglyDisagree
0
10
20
30
40
50
3%
15%
38%
44%
Fig. 16 Were there enough Rest Areas along my route?
StronglyAgree
Agree Disagree StronglyDisagree
0
10
20
30
40
50
2%
23%
39%36%
Fig. 17 Rest Areas were located in suitable locations.
H I G H W A Y R E S T A R E A S U R V E Y R E P O R T P a g e 1 3
7 REST AREA AMENITIES
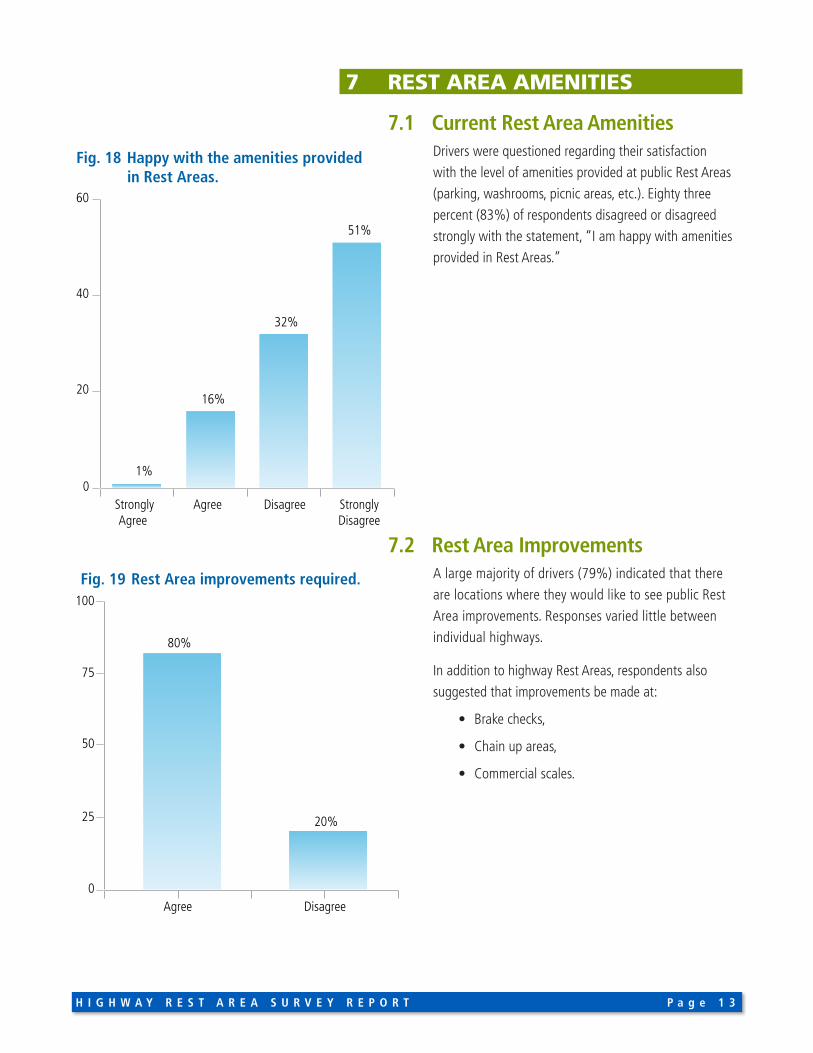
7.1 Current Rest Area Amenities Drivers were questioned regarding their satisfaction
with the level of amenities provided at public Rest Areas
(parking, washrooms, picnic areas, etc.). Eighty three
percent (83%) of respondents disagreed or disagreed
strongly with the statement, “I am happy with amenities
provided in Rest Areas.”
7.2 Rest Area Improvements A large majority of drivers (79%) indicated that there
are locations where they would like to see public Rest
Area improvements. Responses varied little between
individual highways.
In addition to highway Rest Areas, respondents also
suggested that improvements be made at:
• Brake checks,
• Chain up areas,
• Commercial scales.
0
20
40
60
1%
16%
32%
51%
StronglyAgree
Agree Disagree StronglyDisagree
Fig. 18 Happy with the amenities provided in Rest Areas.
0
50
25
75
100
80%
20%
Agree Disagree
Fig. 19 Rest Area improvements required.

P a g e 1 4 H I G H W A Y R E S T A R E A S U R V E Y R E P O R T
7.3 Improvements to Existing Services Drivers were asked to rank the improvements they
would like to see at existing Rest Areas. The figure below
shows the percentage of respondents who ranked each
of the suggested improvements either first or second.
The most popular suggestions were more truck parking
and upgrading restrooms to flush toilets, followed by
improved lighting.
7.4 Paid Services at Rest Areas 90% of respondents indicated they would support
additional paid services, such as a fast food restaurant,
convenience store, and fuel station, being available at
some Rest Areas, in addition to existing free services
(parking, restrooms, and picnic spaces). This positive
response supports the conclusion that drivers would be
generally supportive of additional paid services.
Drivers were asked to rank the types of services they
would like to see offered at Rest Areas. Based on the
services which respondents identified as their first or
second choice, the most popular services would be a
convenience store and showers, followed by a fast food
restaurant and fuel station.
Moretruck
parking
Improvedaccess for
limitedmobility
users
Improvelighting
Improvesite
security
Providefree wi-fiaccess
Upgraderestroomsto flushtoilets
0
20
40
60
80 76%
8%
27%
13% 13%
64%
Fig. 20 Improvements to existing Rest Areasdrivers would like to see.
Convenience Store
Exercise facility
Electricity/Plug-in
Fast food restaurant
Showers
Hotel/Motel
0
20
40
60
50%
8%
14%
36%34%
49%
8%
Fig. 21 Paid Services Drivers would like to see at Rest Areas
Fuel Station

H I G H W A Y R E S T A R E A S U R V E Y R E P O R T P a g e 1 5
8 OPEN-ENDED RESPONSES The survey included a number of open-ended questions
which allowed respondents to type in extended answers
which provided unique feedback.
8.1 Examples of Good Rest Areas Drivers were asked to identify examples of good
Rest Areas and 417 responded. Public Rest Areas cited as
good examples include Bradner (Highway 1), Britton
Creek (Highway 5), Terry Fox (Highway 16) and Zopkios
(Highway 5).
In addition, many cited American highway Rest Areas
as good examples (examples include Interstate 90
and Interstate 5).
8.2 Attributes of a Good Rest Area The following site specific attributes emerged from
the open-ended questions. Recurring themes among
respondents’ answers included:
Location:
• Preferably at the top of a hill
• A short distance from the highway
• Good sound-proofing such as thick vegetation
between the highway and Rest Area
Access:
• Easy access when exiting the highway, preferably
slightly uphill
• Easy access when entering the highway, preferably
slightly downhill
• Good sightlines when exiting/entering the highway
Washroom:
• Clean washrooms
• Flush toilets
• Heated washrooms
• Running water

P a g e 1 6 H I G H W A Y R E S T A R E A S U R V E Y R E P O R T
Lighting and Security:
• If drivers have chains on then they prefer to take
them off in a well lit Rest Area
• Lighting to aid in inspecting the truck for safety
issues, and to increase site safety
Parking:
• Ample parking area
• Plowed and sanded in the winter
• Separation and parking enforcement for
recreational vehicles
• 4+ hour parking in a quiet corner
Size:
• Parking spaces for up to 40 to 50 trucks but no
less than 10 truck parking spaces
Other Features:
• Cellular service
• Wi-fi
• Garbage removal
• Pet run area

H I G H W A Y R E S T A R E A S U R V E Y R E P O R T P a g e 1 7
8.3 Locations for Rest Area Improvements in B.C.Survey respondents’ views on locations for new highway
Rest Areas were mixed. Respondents suggested optimal
spacing of Rest Areas 50 km, 80 km, 100 km, 150 km
and 300 km intervals. Other drivers suggested that
spacing of Rest Areas based on 2-hour driving time
intervals is appropriate. No clear pattern emerged with
regards to where in the Province new or upgraded Rest
Areas are needed.
A number of survey respondents specifically mentioned
that commercial trucks sometimes have no place to stop
because rest areas are full of recreational vehicles.

P a g e 1 8 H I G H W A Y R E S T A R E A S U R V E Y R E P O R T
8.4 Final CommentsTwo-hundred and seventy-four individuals responded to
the last survey question. This question was the only survey
question that was open to any respondent regardless of
whether they were a commercial truck driver or not.
The vast majority of responses in this section reiterated
topics discussed earlier in the report. This included
clean washrooms, security, lighting, parking, location,
and availability of flush toilets. Still, from the remaining
comments, three noteworthy themes emerged:
Rest area signage:
• Placed well ahead of the Rest Area
• Distance to the next Rest Area shown
• Indicate if the site can accommodate trucks
• Display the name of the Rest Area
Urban centers:
• Rest Areas/truck parking are needed near
urban centers
Winter service levels:
• Seasonal sites should not be those that can
accommodate trucks
• Ensure washrooms are not blocked by snowbanks
• Buildings should be heated
• Toilet seats not made of metal
• Sites placed ahead of road sections that are often
closed due to adverse weather

H I G H W A Y R E S T A R E A S U R V E Y R E P O R T P a g e 1 9
APPENDICES

P a g e 2 0 H I G H W A Y R E S T A R E A S U R V E Y R E P O R T
SURVEY: REST AREA TRUCK SURVEY
Rest Area Survey – Commercial Truck DriversThe British Columbia Ministry of Transportation and Infrastructure is seeking feedback from truck drivers regarding
Rest Areas along the provincial highway network. This feedback is being undertaken as part of the Ministry’s 10-year
transportation plan titled ‘B.C. on the Move’. This survey will take about 12 minutes to complete. Your participation is
entirely voluntary. Your responses will be strictly confidential, and results from this research will only be reported as part of
the total. Thank you for choosing to participate.
1. Are you a commercial truck driver? n Yes
n No
DEMOGRAPHICS
2. What type of commercial driver are you? n Long-haul (sleep away from home for work)
n Short-haul (sleep at home)
n Local delivery
n Other ________________________
3. Which of the following drive categories best describes you? n Company driver
n Owner-operator/independent
4. How long have you been a commercial driver? n Less than one year
n One to five years
n Six to ten years
n Over ten years
5. Does your cab have a sleeper berth? n Yes
n No
6. What is your sex? n Male
n Female
7. What is your age? n 24 or younger
n 25 to 39
n 40 to 54
n 55 or older

H I G H W A Y R E S T A R E A S U R V E Y R E P O R T P a g e 2 1
SURVEY: REST AREA TRUCK SURVEY
YOUR LAST TRIP IN BRITISH COLUMBIA
8. What was the city of origin of your last trip in British Columbia?
9. What was the destination city of your last trip in British Columbia?
10. Please identify the main B.C. highway(s) that you used on your last trip (Select all that apply)? n Highway 1
n Highway 3
n Highway 5
n Highway 16
n Highway 19
n Highway 95
n Highway 97
n Other ___________
11. During your last trip in British Columbia, did you stop anywhere other than your origin or destination? n Yes
n No
12. Is deciding where you will stop on your last trip in British Columbia, did you have: n Complete freedom
n Some freedom (must choose from a company approved list)
n Little freedom (company chooses most stops)
n Other ___________
13. If you slept overnight on your last trip in British Columbia, when did you make the decision? (Select all that apply) n As I was driving
n Before I started driving
n I didn’t stop to sleep away from home
n Other ___________
14. During your last trip, what was the geographic location of your first stop?
15. During your last trip, what type of facility did you use on your first stop? n Brake Check Pull-Out / Chain-Up Pull-Out / Weigh Scales
n Commercial truck stop
n Highway Rest Area
n Other ___________

P a g e 2 2 H I G H W A Y R E S T A R E A S U R V E Y R E P O R T
SURVEY: REST AREA TRUCK SURVEY16. What was the primary purpose of your first stop? (select all that apply)
n Bad weather
n Brake check Pull-Out / Chain-Up Pull-Out / Weigh Scales
n Cargo securement check
n Food
n Fuel
n Restroom
n Sleep overnight
n To take minimum required off-duty time (out of hours of service)
n Other ___________
17. How much time did you spend at this first stop? n less than 1 hour
n 1 to 4 hours
n 4 to 8 hours
n 8 hours or more
18. During your last trip in British Columbia did you make a second stop between your origin and destination? n Yes
n No
19. What was the geographic location of your second stop?
20. During your last trip, what type of facility did you use on your second stop? (select all that apply) n Brake Check Pull-Out / Chain-Up Pull-Out / Weigh Scales
n Commercial truck stop
n Highway Rest Area
n Other ___________
21. What was the primary purpose of your second stop? n Bad weather
n Brake check Pull-Out / Chain-UP Pull-Out / Weigh Scales
n Cargo securement check
n Food
n Fuel
n Restroom
n Sleep overnight
n To take minimum required off-duty time (out of hours of service)
n Other ___________

H I G H W A Y R E S T A R E A S U R V E Y R E P O R T P a g e 2 3
SURVEY: REST AREA TRUCK SURVEY22. How much time did you spend at this second stop?
n less than 1 hour
n 1 to 4 hours
n 4 to 8 hours
n 8 hours or more
REST AREAS
23. Considering your last trip in British Columbia, to what extent do you agree or disagree with the following statements about Rest Areas?
Strongly
AgreeAgree Disagree
Strongly
DisagreeN/A
There are enough Rest Areas along
my route n n n n n
Rest Areas were located in
suitable locations n n n n n
24. Please rank the importance of the following potential improvements to Rest Areas in British Columbia. Number one (1) being the most important and six (6) being the least important. (Click and drag to sort)?
n Create more truck parking
n Improve access for those with limited mobility
n Improve lighting
n Improve truck parking layout
n Provide free Wi-Fi access
n Upgrade restrooms to flush toilets
25. Is there a location where you would like to see Rest Area improvements? n Yes
n No
26. Is there a location where you think a new Rest Area is needed? n Yes
n No
P a g e 2 4 H I G H W A Y R E S T A R E A S U R V E Y R E P O R T
SURVEY: REST AREA TRUCK SURVEY27. Provide an example of a good Rest Area. What makes it good?
28. Would you support additional paid services, such as fast food restaurant, convenience store, and fuel station being available at some Rest Areas, in addition to free parking, restrooms and picnic spaces? n Yes
n No
29. Please rank in importance the paid services that you would like to have available at Rest Areas. Number one (1) being the most important and seven (7) being the least important (Click and drag to sort)
n Convenience Store/Groceries
n Showers
n Fast food restaurant
n Fuel Station
n Electrification/Plug in
n Exercise facility
n Hotel/motel
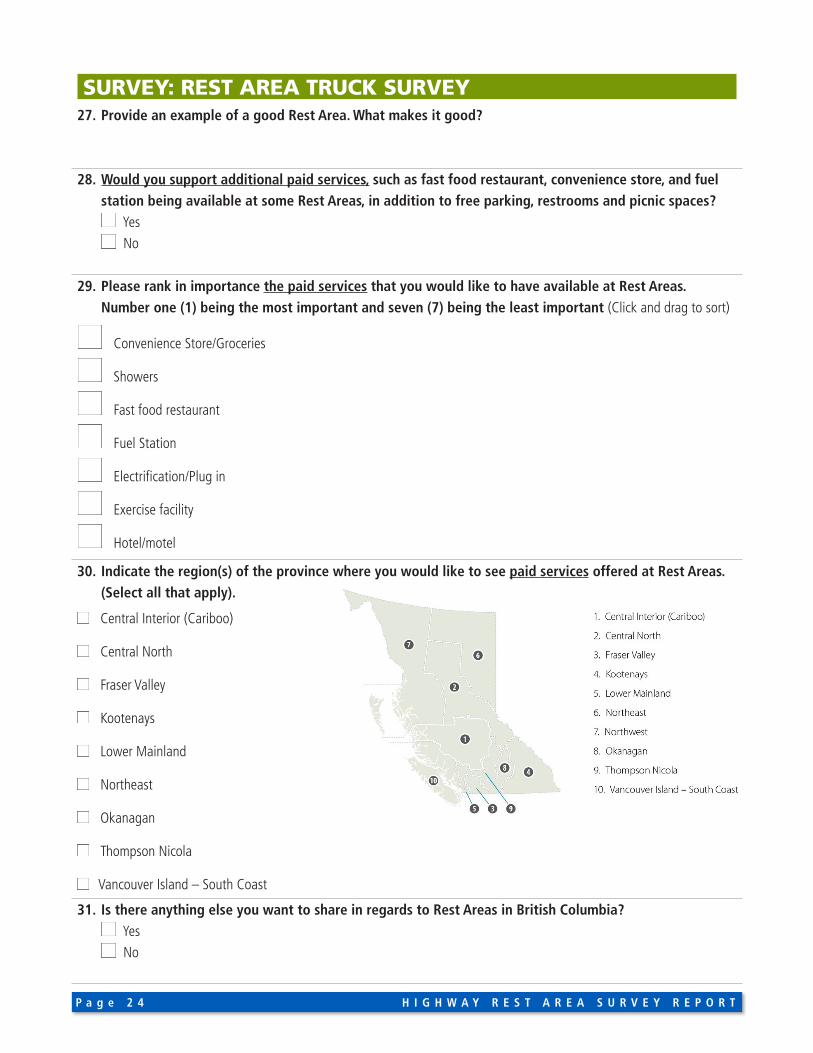
30. Indicate the region(s) of the province where you would like to see paid services offered at Rest Areas. (Select all that apply).
n Central Interior (Cariboo)
n Central North
n Fraser Valley
n Kootenays
n Lower Mainland
n Northeast
n Okanagan
n Thompson Nicola
n Vancouver Island – South Coast
31. Is there anything else you want to share in regards to Rest Areas in British Columbia? n Yes
n No


![B.C. Dental Survey of Aboriginal Kindergarten …...[2] Executive Summary This sub-report presents survey findings related to the early childhood dental health of Aboriginal1 children](https://static.fdocuments.in/doc/165x107/5ed2b8456492e416a8444c19/bc-dental-survey-of-aboriginal-kindergarten-2-executive-summary-this-sub-report.jpg)