Highway 50 - Caltrans · I accept this Corridor System Management Plan for the Highway 50 Corridor...
68
Highway 50 Corridor System Management Plan May 2009
Transcript of Highway 50 - Caltrans · I accept this Corridor System Management Plan for the Highway 50 Corridor...
Highway 50
Corridor System Management Plan
May 2009
Hmiddotghway 50 Corridor Syste Management a
APPROVED BY
Date ~ District 3 Director California Department of Transportation
I accept this Corridor System Management Plan for the Highway 50 Corridor as a document informing the regional transportation planning process
ACCEPTED BY ACCEPTED BY
4k1J~ ampl3oiD~ (ftiJOPJ MIKE MCKEEVER Date ate ~ Executive Director Executive Director Sacramento Area Council of Governments El Dorado County Transportation
Commission
interstate 80
reg
reg
highway 50 corridor system management plan
Corridor System Management Plan
May 2009
stakeholder acknowledgement District 3 wishes to acknowledge the time and contributions of many stakeholders and partner agencies These representatives participated in project development team and focused group meetings and provided essential information advice and feedback for the preparation of this CSMP The stakeholderspartners include
bull California Highway Patrol
bull Sacramento Area Bicycle Advocates
bull Sacramento Area Council of Governments El Dorado County Transportation Commission and Sacramento Transportation Authority
bull Sacramento Metropolitan Air Quality Management District
bull Sacramento Metropolitan Chamber of Commerce
bull The Cities of West Sacramento Sacramento Rancho Cordova Folsom and Placerville
bull The Counties of Yolo Sacramento and El Dorado
bull The Highway 50 Corridor Mobility Partnership (Partnership)
bull The Ports of West Sacramento and Sacramento
bull Transit service providers Yolo County Transportation District Sacramento Regional Transit District El Dorado County Transit Authority University of California Davis Capital Corridor Joint Powers Authority and Amtrak
bull Transportation Management Associations representing employers property owners and residents of Yolo County and the 50 Corridor
a website wwwcorridormobilityorg has been created to support the development of the CSMPs and to provide stakeshyholders and the public with more information and an opportunity to provide input and review documents
Disclaimer The information opinions commitments policies and strategies detailed in this document are those of Caltrans District 3 and do not necessarily represent the information opinions commitments policies and strategies of partner agencies or other organizations identified in this document
[ iv ] HigHway 50 corridor system management plan
c h a p t e r o n e w h a t i s a C S M P
table of contents
Executive Summary 1 Chapter 1 what is a CSMP3 Chapter 2 Need Purpose goal and Objectives 9 Chapter 3 Current Corridor System Management Strategies 11 Chapter 4 Major Corridor Mobility Challenges 21 Chapter 5 Performance Measures 25 Chapter 6 Planned Corridor System Management Strategies 35 Chapter 7 Congestion and Bottleneck Analysis47
LiSt of figureS
Figure 1 US 50 CSMP Transportation Network 5 Figure 2 CSMP Corridors in District 3 8 Figure 3 Strategic Growth Plan Strategy 10 Figure 4 Existing Traffic Operations Systems Elements17 Figure 5 US 50 CSMP Network Transit Routes 18 Figure 6 US 50 CSMP Network Bicycle Routes 19 Figure 7 US 50 CSMP Network Bicycle Routes (Sacramento Insert) 20 Figure 8 US 50 AM Peak Period Bottleneck Locations 22 Figure 9 US 50 PM Peak Period Bottleneck Locations 22
LiSt of tabLeS
Table 1 US 50 CSMP Transportation Network6 Table 2 Existing US 50 TOS Elements 12 Table 3 Park and Ride Lots 14 Table 4 Current and Forecasted Traffic Data 23 Table 5 Performance Measures ndash Definitions and Applicability 26 Table 6 US 50 Performance Measures 29 Table 7 Parallel and Connecting Roadways Performance Measures 30 Table 8 Transit Performance Measure 33 Table 9 US 50 Concept LOS and Facility Type 37 Table 10 US 50 CSMP Strategies 38 Table 11 Key Capital Projects 40 Table 12 50 Mobility Partnership Key Capital Projects 44 Table 13 Visionary Projects 45 Table 14 US 50 Eastbound Bottleneck Summary 48 Table 15 US 50 Westbound Bottleneck Summary51
HigHway 50 corridor system management plan [ v ]
executive summary
Caltrans and its partners are taking a dynamic turn in transportation planning and operations with the creation of Corridor System Management Plans (CSMPs) for corshyridors associated with the Corridor Mobility improvement Account (CMIA) and Highway 99 Bond Program projects Californians rely on transportation facilities and services to get to business recreational and service destinations regardless of which agency may operate or fund a facility or service CSMPs are being developed to plan and manage transportation across modes and jurisdictional boundaries The CSMP approach is consistent with the goals and objecshytives of the governorrsquos Strategic growth Plan including public accountability for bond funded projects
The CSMP outlines a foundation to support the partnership based integrated corridor management of all travel modes (transit cars trucks bicycles) and infrastructure (rail tracks roads highways information systems bike routes) to provide mobility in the most efficient and effective man shyner possible This approach brings facility operations and transportation service provision together with capital projshyects into a coordinated system management strategy that focuses on high demand travel corridors such as Highway 50 (US 50)
This CSMP directly supports the implementation of the three CMIA projects in the US 50 corridor (1) High Occushypancy Vehicle (HOV) Lanes on US 50 from Watt Avenue to
Sunrise Boulevard (2) White Rock Road Expansion from
Grant Line Road to Prairie City Road and (3) HOV Lanes on
US 50 from El Dorado Hills Boulevard to Bass Lake Road
The objectives of the CSMP are to improve safety on the transportation system reduce
CSMPs are beingtravel time or delay on all
developed to planmodes reduce traffic congesshy
and managetion improve connectivity transportationbetween modes and facilities
improve travel time reliability across modes and expand mobility options and jurisdictional along the corridor in a cost efshy boundaries fective manner
The CSMP includes the following sections
bull Current Corridor System Management Strategies
bull Major Corridor Mobility Challenges
bull Performance Measures
bull Planned Corridor System Management Strategies
bull Congestion and Bottleneck Analysis
The US 50 CSMP Transportation Network includes US 50 from the US 50interstate 80 interchange in the City of West Sacramento to the US 50Cedar Grove exit in the El Dorado County community of Camino as well as select parallel roads transit services and bike routes
HigHway 50 corridor system management plan [ 1 ]
e x e c u t i v e s u m m a r y
[ 2 ] HigHway 50 corridor system management plan
Together these facilities comprise the CSMP managed network
Major mobility challenges along the corridor include highway and roadway traffic congestion a lack of parallel roadway capacity transit facilities approaching ridership capacity inadequate transit capital and operations fundshying needed to grow transit ridership an incomplete HOV network gaps and barriers within the bicycle network and lengthy barriers restricting cross corridor travel by all modes
Additionally the El Dorado County Transportation Commisshysion (EDCTC) has identified safety and operational issues
between the Smith Flat interchange and east of the Upper Carson RoadCamino intersection in the Camino Area Par-allel CapacitySafety Study including at-grade access to US 50 left turn conflicts across US 50 increasing local and
interregional traffic due to area growth a lack of alternate
routes seasonal traffic to and from Apple Hill and other local events and seasonal access to recreation in the Lake
Tahoe Region
The bottleneck analysis identifies major bottlenecks in the
eastbound direction during the aM peak period at Howe avshyenue and during the PM peak period at 48th Street Howe Avenue Mayhew Road Routier Road Sunrise Boulevard and El Dorado Hills Boulevard Major bottlenecks in the westbound direction during the AM peak period are at El Dorado Hills Boulevard Hazel Avenue Zinfandel Drive Bradshaw Road and Howe Avenue
and major bottleneck locations during the PM peak period are at Zinfandel Drive Routier Road Bradshaw Road Howe
avenue and interstate 5 Causes range from weaving entering and merging traffic lane drops poorly coordinated
traffic signals and an off-ramp queue (Sunrise Boulevard)
Existing highway operations data shows that for the US
50 corridor almost all segments are forecasted to opershyate under Level of Service (LOS) ldquoFrdquo conditions in 20 years
under the No-Build and Build scenarios However with the
implementation of operational strategies and key capital projects the severity and the duration of the traffic congesshytion can be significantly reduced
This CSMP identifies corridor management strategies to be
applied on a network wide basis To implement some of these strategies key capital projects are identified The list is not meant to be inclusive of all projects in the corridor rather the CSMP incorporates by reference all projects contained in the Sacramento area Council of governments (SACOG) Metropolitan Transportation Plan (MTP) and the
EDCTC Regional Transportation Plan (RTP)
The system will be continuously monitored using identified
performance measures and Traffic Operations Systems
(TOS) data and will be reported in an annual State of the
Corridor Report and subsequent CSMP updates This
information will be used to continually improve system performance
what is a CSMP
chapter one
a CSMP is a foundation document supporting the partner-
ship based integrated management of all travel modes
(transit cars trucks bicycles) and infrastructure (rail tracks roads highways information systems bike routes) in a corridor so that mobility along the corridor is provided in the most efficient and effective manner possible
CSMP success is based on the premise of managing a seshylected set of transportation components within a designatshyed corridor as a system rather than as independent units
Caltrans has traditionally prepared a Transportation Conshycept Corridor Report (TCCR) that served as the long range
planning document for US 50 The TCCR would identify existing route conditions and future needs including existshying and forecasted travel data concept LOS standard and
the facility needed to maintain the concept LOS over the
next 20 years With the development of the more compreshyhensive CSMP the need for a separate TCCR is eliminated This CSMP will serve as the TCCR for the segment of US
50 within the CSMP boundaries and includes information regarding the future facility needed to maintain an acceptshyable LOS (Concept LOS and Concept Facility see page 35)
The uS 50 CSMP transportation Network includes US 50 from the US 50interstate 80 interchange in the City of West Sacramento to the US 50Cedar Grove exit in the
El Dorado County community of Camino as well as select parallel roads transit services and bike routes Together
these facilities comprise the CSMP managed network as indicated in Figure 1 and Table 1
The parallel roadway transit and bike route components of the managed network were selected in consultation with the respective local agency it is anticipated that as the CSMP concept matures additional facilities will be added to the managed CSMP transportation network
The CSMP focuses on The CSMP focuses strengthening institushy on strengthening tional partnerships institutional partnerships gathering and analyzshy
gathering and analyzinging data monitoring
data monitoringsystem performance
system performanceimplementing opshyimplementing operationalerational strategies
and identifying and strategies and identifying implementing stra- and implementing tegic capital investshy strategic capital ments The CSMP will investments evolve with changing development patterns travel demands and technological innovations
HigHway 50 corridor system management plan [ 3 ]
c h a p t e r o n e w h a t i s a C S M P
[ 4 ] HigHway 50 corridor system management plan
An annual State of the Corridor Report will be produced to
document system performance and track CSMP implemenshytation progress and the CSMP will be updated every two years
CSMPs are being created for corridors associated with the Corridor Mobility Improvement Account (CMIA) and Highway 99 Bond Programs supported by the Highway Safety Traf-fic Reduction Air Quality and Port Security Bond Act of 2006 Proposition 1B Figure 2 shows the general location
of each of the CSMP corridors within the Caltrans District 3 area and identifies Proposition 1B projects associated with
the respective CSMP
Each CSMP identifies current system management stratshyegies existing travel conditions corridor performance
management management strategies and capital imshyprovements
The CSMP is consistent with The CSMP is the SACOG MTP the EDCTC consistent with the RTP city and county general
SACOG MTP theplans and regional blueprint
EDCTC RTP cityplanning The CSMP by refershy
and county generalence incorporates all projects plans and regionallisted in the current MTP and
RTP Because the CSMP is blueprint planning corridor focused it highlights key locations where modes interact and land use decisions may have the greatest potential of reducing the need for travel and influencing modal choice
CSMPs will assist in fulfilling the goals of recently enacted
legislation such as Assembly Bill 32 that addressed air quality and green house gas emissions and Senate Bill 375
that addresses land use by
bull Improving mobility on the state highway system to more optimum speeds to reduce vehicle emissions and
bull Providing viable transportation alternatives and accesshysibility across modes to encourage transit and bicycling and decrease single occupant auto use
The CSMP also supports Caltrans policies such as Deputy
Directive (DD) 64 Complete StreetsndashIntegrating the
Transportation System and DD 98 Integrating Bus Rapid
Transit into State Facilities by bringing many modes under the same active management effort thereby ensuring that each mode is analyzed and optimized to work together
The CSMP is based on technical information depicted in four supporting working papers
bull working Paper 1 provided an overview of the corridor system management planning process and a definition of the CSMP transportation network including a ratioshynale for the selection of the specific corridor limits and modes to be included in the corridor planning process
bull working Paper 2 defined current services being proshyvided by the CSMP transportation network proposed performance measures for the corridor and provided baseline data regarding the current CSMP transportashytion network for the proposed performance measures
bull working Paper 3 described existing corridor manageshyment activities including all facilities and services curshyrently in use to maximize mobility within and through the corridor such as traffic operations systems elements facilities such as high occupancy vehicle lanes traveler information services and transportation demand manshyagement programs
bull working Paper 4 provided an assessment of current corridor performance by identifying the major problems inhibiting efficient corridor operations for each element (mode) of the CSMP transportation network
Sacramento Regional Transit Bus with Bicycle Racks
5
W STX ST
WATT AVE
MAROCKINGHAM
DR
OLD PLACER
BRADSHAW RD
VILLE RDTHER FIELD RD
INTERNA TIONAL DR
ZINF ANDEL DR
WHITE ROCK RD FOLSOM BLVD FOLSOM BLVD
SUNRISE BLVD BLU
E RAV
INE R
D
WHITE ROCK RD
SC
OTT R
D
PR
AIR
IEC
ITY R
D
SCOTT RD
GREEN V ALLEY RD
PLACER VILLE DR
FORNI RDM
AIN ST
BROADWAY
CEDAR GROVE EXIT
c h a p t e r o n e w h a t i s a C S M P
Figure 1 US 50 CSMP Transportation Network
Highway 50 Corridor Auburn System Management Plan
193 Transportation Network
US Highway 50 (I-80 to Cedar Grove Exit) 193 80
CSMP Parallel Roads
Light Rail STation Loomis 49
Light Rail
Current HOV Coverage
Express Bus Service Placerville
Corridor Mobility Improvement Account
Class I Bikeways Other State Highways
County Lines Folsom
50
80 HOV Lanes El Dorado Hills Blvd to Bass Lake Rd
HOV Lanes Watt Ave Sacramento to Sunrise Blvd
50 White Rock Rd Expansion Grant Line80 Rd to Prairie City RdWest
Rancho Cordova
4 9
1 6
Sacramento
5 99
84 160
Elk Grove 0 1 2 3 4 5
49 Miles 124 10
HigHway 50 corridor system management plans [ 5 ]
c h a p t e r o n e w h a t i s a C S M P
Table 1 US 50 CSMP TranSPorTaTion neTwork
location US 50 ParallelConnecting roadways Mass Transit bike routes
Heavy rail and light rail bus
route From To County City From To roadway From To operator
Services From To operator
Services From To
yolo City of west Sacramento interstate 80 yoloSacramento
County Line west Capitol Enterprise Boulevard Capitol Mall yCTD 39
Davis Express
west Sacramento
Davis Sacramento west Capitol
avenue yolo
Causeway Tower Bridge
Sacramento City of Sacramento
yoloSacramento County Line
State Routes 99 and 51 wX Streets 5th Street 26th Street RT Downtown
Sacramento Folsom
RT 109 Express
Downtown Sacramento Hazel ave Jedediah Smith Memorial Trail
State Routes 99 and 51 watt avenue mdash mdash mdash
amtrak Capital Corridor
(intercity Rail)
401 i Street Sacramento
auburn CaSan Jose Ca
amtrak Thruway Bus
401 i Street Sacramento
Main Street Placerville
Sacramento UnincorporatedCity of Rancho Cordova
watt avenue Zinfandel Drive
Folsom Boulevard watt avenue Sunrise Boulevard RT Downtown Sacramento Folsom RT 72 Mather Mills
LRT Station watt-Manlove LRT Station Jedediah Smith Memorial Trail
watt avenue Folsom Boulevard US 50
RT Downtown Sacramento Folsom RT 21 Mather Mills
LRT Station Louis Ln
Orlando ave Jedediah Smith Memorial Trail
Bradshaw Road Folsom Boulevard Old Placerville Road
Old Placerville Road Bradshaw Road Rockingham Drive
Rockingham Drive Old Placerville Road Mather Field Road
Mather Field Road Rockingham Drive Zinfandel Drive
Zinfandel Drive international Drive Folsom Boulevard
white Rock Road Zinfandel Drive Sunrise Boulevard
Sunrise Boulevard US 50 Folsom Boulevard
Zinfandel Drive Sunrise Boulevard
white Rock Road Sunrise Prairie City
RT Downtown Sacramento Folsom RT 109
Express Downtown
Sacramento Hazel ave Jedediah Smith Memorial Trail
Folsom Boulevard Sunrise iron Point Road
Notes F = Freeway E = Expressway RT = Sacramento Regional Transit District EDT = El Dorado Transit and FSL = Folsom Stage Lines LR = Light Rail EB = Express Bus LT = Limited LRF = Light Rail Feeder YCTD = Yolo County Transportation District FTS = FairfieldSuisun Transit System UCD = UC Davis Medical Center Shuttle
HigHway 50 corridor system management plans [ 6 ]
c h a p t e r o n e w h a t i s a C S M P
Table 1 US 50 CSMP TranSPorTaTion neTwork (ConTinUed)
location US 50 ParallelConnecting roadways Mass Transit bike routes
Heavy rail and light rail bus
route From To County City From To roadway From To operator
Services From To operator
Services From To
Sacramento
UnincorporatedCity of Folsom
Sunrise Boulevard
Folsom Boulevard
iron Point Road Folsom Boulevard East BidwellScott Road
RT Downtown Sacramento Folsom
iron Point Road Folsom Boulevard Empire Ranch
Scott Road iron Point Road white Rock Road Blue Ravine Road
Folsom Boulevard
green Valley Road
Sacramento Folsom Boulevard
Sacramento El Dorado
County Line
Folsom Boulevard iron Point Road Blue Ravine Road
green Valley Road
SacramentoEl Dorado County
Line
Cameron Park Drive
Blue Ravine Road Folsom Boulevard green Valley Road
Prairie City Road US 50 white Rock Road ED County Transit
authority-iron Point Connector
iron Point Light Rail Station
Missouri Flat Transfer
Center white Rock Road EDSac County Line
Sacramento El Dorado County Line
El Dorado Na Sacramento
El Dorado County Line
Cameron Park Drive
green Valley Road Blue Ravine Road Cameron Park Drive
ED County Transit
authority-Sacramento Commuter
El Dorado County
Sac County
green Valley Road
Cameron Park Drive
Placerville Drive
white Rock Road EDSac County Line Latrobe Road
white Rock Road Latrobe Road Silva Valley Parkway
Silva Valley Parkway white Rock Road Serrano Parkway
El Dorado Na Cameron Park Drive
Missouri Flat Road
green Valley Road Cameron Park Drive Missouri Flat Road
ED County Transit
authority
Cambridge Road
Missouri Flat Road
Ray Lawyer Drive
Placerville Drive Forni Road
Durock Road Cameron Park Drive South Shingle Road
Cameron Park Drive Durock Road US 50
Forni Road Ray Lawyer Drive Forni Road
South Shingle Road Durock Road US 50
El Dorado Na Missouri Flat Road
End of Freeway in Placerville
green Valley Road Missouri Flat Road Placerville Drive
ED County Transit
authority
Missouri Flat Road
Placerville Drive
Main Street Forni Road Clay Street Forni Road Placerville Drive Main Street
Placerville Drive Forni Road US 50
El Dorado Placerville End of Freeway in Placerville
Bedford avenue Start of
Freeway Main Street Placerville Drive Bedford avenue
ED County Transit
authority
Placerville Drive SR 49 ED Bike Trail Clay Street Los Trampas
Road
El Dorado Na Bedford
avenue Start of Freeway
Cedar grove Exit
Main Street Bedford avenue Broadway amtrak
Thruway Bus
Mosquito Road
Placerville
401 i St Sac CaCarson
City Ca Broadway Main Street Point View Drive
HigHway 50 corridor system management plans [ 7 ]
WHITE ROCK RD
c h a p t e r o n e w h a t i s a C S M P
Figure 2 CSMP Corridors in District 3
Corridor System Management Plan
Corridors in District 3 Interstate 80 I-80 between SR 113 and Sierra College Boulevard SR 51 between Highway 50SR 99 and I-8020
Highway 5053 Between I-80 and Cedar Grove Exit
Interstate 5 amp State Route 99 I-5 between Hood-Franklin Rd and State Route 113 SR 99 between San Joaquin County Line and Highway 50 SR 99 between I-5 and SR 20
State Route 99 North29 Between Southgate and Esplanade (in Chico area see inset)
State Route 49 Between I-80 and SR 20
State Route 65 Between I-80 and SR 70
CMIA and State Route 99 Bond Projects
20
Colusa
20
Yuba City Marysville
Grass Valley
La Barr Meadows Widening Project
49 80
Widen to 4 Lanes SR 70 to Feather River Bridge
99
70 Wheatland
65
113 Lincoln Bypass
5
Construct Interchange Operations Improvements Placerville at Elverta Rd HOV Lanes El Dorado
Hills Blvd to Bass Lake Rd
80 Folsom Woodland Rancho 50
Auburn Lincoln
Construct Interchange at Riego Rd Rocklin 49
99 Roseville Roseville Capacity and
Cordova 113 49 505 Sacramento 51
99 Chico Add Auxiliary Lanes
SR 32 to 1st Ave
32 Davis 80
West Sacramento
5
HOV Lanes Watt Ave to Sunrise Blvd
Operational Improvements Mack Rd to Florin Rd
White Rock Rd Expansion Grant Line Rd to Prairie City rd
29 221
113
99
0 105 2 3 4 5 Miles
Galt 0 5 10 15 20
Miles
HigHway 50 corridor system management plans [ 8 ]
need purpose goal and objectives
chapter two
There is a need for a planning approach that brings facility operations and transportation service provision together with capital projects into one coordinated system manageshyment strategy that focuses on high demand travel corridors such as US 50
a CSMP is needed for the US 50 corridor to address severe traffic congestion that often exceeds the capacity of existshying facilities transit ridership demands that exceed the
capacity of the transit system and bicycle facilities that do not provide a fully linked network of bike routes
The purpose of the CSMP is to create a partnership planshyning process that focuses on system management strateshygies and coordinated capital investments so that all the pieces of the corridor function as an efficient transportashytion system and performance evaluation measures are implemented to track the effectiveness of strategies and projects
the CSMP directly supports the implementation of the
three CMia projects on the corridor
bull High Occupancy Vehicle (HOV) Lanes on US 50 from Watt avenue to Sunrise boulevard
bull White Rock Road Expansion from Grant Line Road to Prairie City road
bull HOV Lanes on US 50 from El Dorado Hills Boulevard to bass Lake road
The goal of the CSMP is to improve mobility along the US 50 corridor by focusing on the integrated management of a
subset of the entire transporta- The CSMP directly tion network within the corshy supports the ridor including select freeway implementation and parallel roadways transit
of the three CMIA and bicycle components of the
projects in thecorridor corridor
The objectives of the CSMP are to reduce travel time or delay on all modes improve
connectivity between modes and facilities improve travel
time reliability improve safety on the transportation system and expand mobility options along the corridor in a cost effective manner implementation of the CSMP will increase access to jobs housing and commerce
consistency with other state transportation plans anD policies The CSMP approach is consistent with the goals and objectives of the governorrsquos Strategic Growth Plan which among other things commits to minimizing increases in traffic congestion Key elements of the strategy are illusshytrated in Figure 3
at the base of the pyramid and the foundation of transshyportation system management is system monitoring and evaluation it is essential to understand what is happening on the transportation system so that the best decisions can be made based on reliable data The next few layers up
the pyramid are focused on making the best use of existing
resources and reducing the demand for transportation
HigHway 50 corridor system management plan [ 9 ]
c h a p t e r t w o n e e d p u r p o s e g o a l a n d o b j e c t i v e s
[ 10 ] HigHway 50 corridor system management plan
particularly during peak travel hours The top layer of the pyramid is system expansion This layer assumes that all the underlying components are being addressed and that system capacity expansion investments are necessary
Corridor system management is consistent with the Caltrans Mission
Improve Mobility Across California Corridor system management is consistent with Caltransrsquo goals
bull SafetY Provide the safest transportation system in the nation for users and workers
bull MobiLitY Maximize transportation system performance and accessibility
bull DELIVERY Efficiently deliver quality transportation projshyects and services
bull STEWARDSHIP Preserve and enhance Californiarsquos resources and assets
bull SERVICE Promote quality service through an excellent workforce
The CSMP is also consistent with the California Transportashytion Plan (CTP) the statewide long-range transportation
plan for meeting future mobility needs The CTP defines
goals policies and strategies to achieve our collective vishysion for Californiarsquos future transportation system
Figure 3 Strategic Growth Plan StrategyAir
Quality Planning Corridor System Management seeks to create conditions where vehicle flow on highways and roads occurs at a
steady pace and travelers have a range of mobility options that enable them to travel other than by single occupant vehicle System expansion is focused only where needed
when travel demand exceeds the capacity of the well manshyaged existing system These conditions are beneficial to
attaining air quality goals and reducing green house gas emissions
current corridor system management strategies
chapter three
US 50 is a transcontinental highway that originates in west Sacramento California and terminates in Ocean City Maryland it is a key transportation artery connecting yolo County Sacramento County and fast growing sub regions within Sacramento and El Dorado Counties
The corridor provides access to world renowned recreation areas in the Sierra Nevada Mountains and Lake Tahoe
Basin Peak commute and recreational travel periods are
heavily congested with demand for travel often exceedshying the capacity of existing facilities and services Severe
traffic congestion is common and commute transit services
often operate at maximum ridership capacity There is
extensive and expanding urban development along many parts of the corridor which suggests increased future transportation demand
Given the complexity of the corridor and its extensive geoshygraphic range there are a wide variety of system manageshyment strategies and elements currently being implemented by jurisdictions and transportation service providers Strategies and elements range from vehicle detection deshyvices to traveler information systems to traffic flow control mechanisms a common element among all the strategies and elements is data collection and analysis There is presshyently some system management coordination and intershyjurisdictional partnerships among the entities such as the Sacramento Transportation Area Network (STARNET)
The STARNET web application initial release is anticipated
for the late fall of 2009 Features to be included in the
initial release will include Changeable Message Sign (CMS) display a chain control application integration of Regional Transit data California Highway Patrol incident data connectivity to the 511 systems (web and telephone) Closed Circuit Television (CCTV) display and interagency messaging and coordination [Caltrans Transportation Management Center (TMC) Kingvale Operation Center City of Sacramento Traffic Operation Center (TOC) Sacramento
County TOC Roseville TOC and Elk Grove TOC] STARNETrsquos
associated management There are a widestrategies can and will variety of systemevolve as the application is
implemented throughout management
the region and as addi- strategies and tional features are added elements currently in annual releases being implemented
by jurisdictions and state highway sys-
tem transportation service
providerswith the construction of Californiarsquos state highshyway system virtually complete in the Sacramento region Caltransrsquo major emphasis on highway projects has largely shifted from new construction to focused capacity expanshysions reconstruction operation and maintenance of existshying facilities
The State Highway System has an extensive set of system
management strategies in operation Some cities coun-
HigHway 50 corridor system management plan [ 11 ]
c h a p t e r t h r e e c u r r e n t c o r r i d o r s y s t e m m a n a g e m e n t s t r a t e g i e s
tabLe 2 exiStiNg uS 50 toS eLeMeNtS
County Location PM toS elements
tMS rM HAR rWiS CMS eMS VS CCTV WiM
yolo i-80 to yoloSaC County Line
000 - 316 4 ndash ndash 1 1 ndash ndash 2 2
SaC
YoloSAC County Line to SR99 SR51
L000 - L248 R000
8 7 ndash ndash 3 ndash ndash 7 ndash
SR99SR51 ndash Watt Avenue R000 ndash R534 5 8 ndash ndash 1 1 ndash 3 ndash
watt avenue to Zinfandel Drive R534 ndash R1092 8 7 1 ndash ndash 2 ndash ndash ndash
Zinfandel Drive to Sunrise Blvd R1092 ndash 1250 1 4 ndash ndash ndash 1 ndash ndash ndash
Sunrise Blvd to Folsom Blvd 1250 ndash 1701 4 6 ndash ndash ndash ndash ndash 2 ndash
Folsom Blvd to SACED County Line
1701 ndash 2314 2 8 ndash ndash 1 ndash 1 ndash ndash
ED
SACED County Line to Cameron Park Dr 000 ndash R657 5 ndash ndash ndash 1 ndash 2 ndash ndash
Cameron Park Dr to Missouri Flat Rd R657 ndash R1506 7 ndash ndash ndash ndash ndash ndash ndash ndash
Missouri Flat Rd to End of Freeway R1506 ndash 1725 1 ndash ndash ndash ndash 1 ndash ndash ndash
ED End of Freeway to Bedford Ave 1725 ndash 1811 ndash ndash 1 ndash ndash ndash ndash ndash ndash
ED Bedford Ave to Cedar Grove Rd 1811 ndash R2595 ndash ndash ndash ndash 1 1 ndash ndash ndash
totaL 45 40 2 1 8 6 3 14 2
Notes PM = Post Mile TMS = Traffic Monitoring Station RM = Ramp Meter HAR = Highway Advisory Radio RWIS = Roadside Weather Information System CMS = Changeable Message Sign EMS = Extinguishable Message Sign VS = Visibility Sensor CCTV = Closed Circuit Television System WIM = weigh in Motion Existing TOS Elements as of April 2009
ties and transit operators also have robust system manshyagement elements and programs applied to their facilities or services
There are also specific instances of system management linkages among transportation modes and services at particular locations
Existing management strategies are depicted on Figure 4
and summarized in Table 2
US 50 BusCarpool Lanes in El Dorado County
[ 12 ] HigHway 50 corridor system management plan
c h a p t e r t h r e e c u r r e n t c o r r i d o r s y s t e m m a n a g e m e n t s t r a t e g i e s
These strategies work as a system to gather analyze and disseminate information through the Caltrans TMC inforshymation about collisions other incidents road closures and emergency notifications are fed into this information hub
and disseminated to public and private information users The TMC operates 24 hours a day seven days a week
parallel anD connecting roaDways City of West Sacramento has one CCTV located on west Capitol Avenue between Enterprise Boulevard and Capitol Mall
City of Sacramento operates a TOC Sensors in the street detect the passage of vehicles vehicle speed and the level of congestion
This information is received on a second-by-second (real-time) basis and is analyzed at the TOC
Sacramento County also operates a TOC by gathering information through CCTV cameras CMS HAR and a Fiber Optics (FO) network placed along major traffic
corridors throughout the county
City of rancho Cordova will be installing CCTV cameras and a FO network on Folsom Boulevard in 2009 Currently one CCTV exists on Sunrise Boulevard
between US 50 and Folsom Boulevard Most major traffic corridors are on the network or will be by the end of 2009 The City contracts with the County of Sacramento to operate their systems through the Countyrsquos TOC
City of folsom recently completed installing a FO system
Changeable Message Sign on US 50 at Scott Road
on all of the Cityrsquos major corridors Currently the sole intersection that is monitored via camera is located on iron Point Road and East Bidwell
El Dorado County has three coordinated signals along Francisco Drive at Green Valley Road the Market Place
entrance (east side Safeway Centerwest side Lake
Forest Plaza) and Village Center Drive
City of Placerville utilizes traditional control devices traffic signals and stop signs
transit anD riDesharing Yolo County Transit District (YCTD) uses a Global Positionshying System (GPS) for locating buses in route referred to as
an Automatic Vehicle Location (AVL) system
The AVL System allows users to see where their bus is
located within the last minute
El Dorado Transit Authority utilizes the gPS Zonar System for pre-trip inspections maintenance and real-time vehicle tracking
Sacramento Regional Transit District (SacRT) has in shystalled pre-emptive traffic signals at at-grade intersections
along the Light Rail routes SacRT has a GPS however it is only utilized for analysis purposes
Computer-aided dispatch and Bus Rapid Transit are in
the planning stages In addition SacRT has an online Trip
Planning application to assist transit users During special events such as the California State Fair the Jazz Festival
65th Street Light Rail Station and Transit Oriented Development
HigHway 50 corridor system management plan [ 13 ]
c h a p t e r t h r e e c u r r e n t c o r r i d o r s y s t e m m a n a g e m e n t s t r a t e g i e s
TABLE 3 PARk AnD RIDE LOTS
County Post Mile Facility name Description
Lot use transit Connection
Spaces Spaces occupied
occupancy Rate () Provider and route No
SaC 70 Butterfield Sacramento Regional Transit Gold Line Station
406 129 318 SacRT SacRT LRT Gold Line
SaC 125 Sunrise Sacramento Regional Transit Gold Line Station
487 389 799 RSacRT SacRT LRT Gold Line
SaC 158 Hazel 432 135 306 SacRT SacRT LRT Gold Line
SaC 158 Hazel 33 6 24 SacRT Route 109
SaC 171 Folsom Boulevard 70 58 829 ED Iron Point Connector SacRT LRT Gold Line
ED 2 El Dorado Hills (Latrobe RoadWhite Rock Road) 123 138 1122 ED Iron Point Connector ED Routes
156781112
ED 5 Cambridge Road 59 40 678 ED Iron Point Connector ED Routes 14567891112
ED 86 Ponderosa Road Northeast 28 15 536 ED Iron Point Connector ED Routes 23679101112
ED 86 Ponderosa Road Northwest 111 61 55 ED Iron Point Connector ED Routes 23679101112
ED 86 Durock Road 57 21 368 Na
ED 149 Shingle Springs Drive 19 4 211 Na
ED 122 Greenstone Road 21 4 19 Na
ED 15 Missouri Flat Road 73 44 603 ED Iron Point Connector
ED 158 Fairgrounds Park-and-Ride 200 40 20 ED Iron Point Connector
ED 185 Placerville Station (Mosquito Park- and-Ride) 130 50 385 ED Iron Point Connector
ED Commuter Service
ED 233 Camino Heights 24 1 42 Na
SacRT = Sacramento Regional Transit District ED = El Dorado County Transit Authority Lrt = Light rail train
Survey 2007
the holiday seasons and the Mather Field Air Show SacRT
operates additional service to connect events to light rail stations and offer free service to promote transit use durshying select events The transit routes identified in the CSMP
network are shown in Figure 5
The Sacramento Valley Station in downtown Sacramento is
the 7th busiest station in the national amtrak system and serves as a multi-modal transfer facility There are over 11 million passenger trips annually
Passengers can make connections with numerous local bus services as well as the SacRT light rail system
[ 14 ] HigHway 50 corridor system management plan
c h a p t e r t h r e e c u r r e n t c o r r i d o r s y s t e m m a n a g e m e n t s t r a t e g i e s
Try Transit Changeable Message Sign in Sacramento County
Sacramento County installed pre-emptive traffic signals to give preferential signal timing to transit buses at selected locations that serve high priority transit corridors
SACOG manages the 511 and rideshare programs that cost approximately $1 million per year region-wide to foster carpooling transit ridership vanpooling and bicycling in all areas and corridors The Regional Rideshare Program covers Placer El Dorado Sacramento yolo yuba and Sut-ter counties it is part of a statewide network of rideshare agencies which encourage alternative transportation modes for traveling
Park and Ride lots are located adjacent to or nearby the US 50 corridor utilized by commuters to connect with transit vanpool or carpool Of the sixteen lots many are adjacent to the SacRT Light Rail gold Line providing access for commuters to park their vehicles and commute the re-mainder of their trip via Light Rail El Dorado County Transit authority also uses the park and ride lots as transit stops for their Commuter Buses The locations capacity and occupancy rates of the Park and Ride lots are displayed in Table 3
Bicycle Facilities Bicycle facilities in the corridor are not actively managed in the same manner as motor vehicle facilities
However there are traffic operation systems that serve bicyclists such as dedicated bicycle lanes bicycle detec-tion loops at signalized intersections video detection other non-loop type detection and bicyclist activated signal change buttons The City of Sacramento is installing video detection at some locations
SacRT buses and the new light rail trains are equipped with bicycle racks There are over 170 weatherproof bicycle lock-ers at 23 light rail stations yCTD has the Bikes on Buses Program that allows bicycles to travel on any yOLOBUS
The Sacramento area Bicycle advocates maintain an on-line hazard reporting system to allow users to report hazardous locations for bicyclist such as potholes inad-equate signal timing hazardous railroad crossings insuf-ficient shoulder and inadequate bikeway markings The reports are then sent to the applicable jurisdiction SaCOg is creating an on-line route planning system for bicyclists in addition SaCOg maintains bicycle maps on their website which are currently being updated
The bicycle routes included in the CSMP network are shown on Figures 6 and 7
Pedestrian Facilities Pedestrian facilities are not included as part of the man-aged network because they do not directly provide corridor mobility However complete and safe pedestrian access to appropriate corridor modes such as bike routes and transit services is an important component of corridor system management Therefore subsequent updates of the CSMP will seek to identify key pedestrian facilities and barriers to pedestrian mobility with regard to access and modal con-nectivity
HigHway 50 corridor system management plan [ 15 ]
c h a p t e r t h r e e c u r r e n t c o r r i d o r s y s t e m m a n a g e m e n t s t r a t e g i e s
[ 16 ] HigHway 50 corridor system management plan
Page Inte
ntionally
Left
Blank
MAIN ST
MA
RB
LE V
ALL
EY
RD
65TH ST EXPY
FLYING
C R
D
STATE
HW
Y 16
MA
RB
LE VA
LLEY R
D
CAM
BRID
GE R
D
GREEN VALLEY RD
RIV
ERSI
DE
BLVD
11T
H S
T
RIV
ERSI
DE
BLVD
HO
WE
AV
E
EL DORADO
HILLS BLVD
EL DORADO H
ILLS BLV
D
HORNET DR
JEFF
ERSO
N BL
VD
CAM
ERO
N PAR
K DR
PO
WE
R IN
N R
D
CO
UN
TY HW
Y E3
BRADSHAW RD
MATHER FIELD RD
ZINFAN
DEL D
R
11TH
ST
VD
FOLSOM BLFOLSOM BLVD
FOLSOM BLVD
FOLSO
M BLVD
WHITE ROCK RD
FOLSOM BLVD
FOLS
OM
BLV
D
LATRO
BE RD
CANAL ST
16TH
ST
JACQ
UIER
RD
15TH
ST
HARBOR BLV
D
STOCKTON BLVD
FORNI RD BIDW
ELL DR
WATT AVE
PLACERVILLE DR
TOW
ER G
ATEW
AY
SHIN
GLE SPR
ING
S DR G
REEN
STON
E RD
59TH
ST
SUN
RISE BLVD
EL D
OR
AD
O R
D
HAZEL AVE
SOUT
H RI
VER
RD
PON
DER
OSA R
D
SHIN
GLE SPR
ING
S RD
SHIN
GLE
SPR
ING
S R
D
CARSON RD
MISSO
URI FLAT RD
BASS LAKE RD
N SH
ING
LE RD
PRAIR
IE CITY R
D
S SHIN
GLE R
D
SHIN
GLE
RD
SCOTT RD
W S
T AT
5TH
ST
65TH
ST
5TH
ST
X
ST A
T 27
TH
80
CEDAR GROVE EXIT
MO
SQU
ITO R
D
PLACERVILLE DRMISSOURI
FLAT RD
FORNIRD
EL D
OR
AD
OR
D
POIN
T VIEW D
RSM
ITH FLAT R
D
SCH
NELL SC
HO
OL R
D
MO
NTER
EY RD
c h a p t e r t h r e e c u r r e n t c o r r i d o r s y s t e m m a n a g e m e n t s t r a t e g i e s
Figure 4 Existing Traffic Operations Systems Elements
Highway 50 Corridor Systems Management Plan Existing Traffic Operations Systems Excluding Ramp Meters
TOS ndash Traffic Operations Systems
Stations Continuous Coverage
EMS ndash Extinguishable Message Sign WIM ndash Weigh-in-Motion Location (EMS Usually Refers Motorist to HAR)
Television System
19365TMS ndash Traffic Monitoring99 US Highway 50VS ndash Fog (Visibility) Sensor
CCTV ndash Closed Circuit
I-80 to Cedar Grove Exit HAR ndash Highway Advisory Radio Local Road Interchange Access
White Rock RdRWIS ndash Roadside WeatherCMS ndash Changeable Sunrise Blvd to Latrobe Rd
Message Sign Information System
50
80
51
49 160
50
Placerville to Cedar Grove Exit
50
1935
16 49
99
84 160
49 MilesMiles 0 1 2 3 4 50 1 2 3 4 5 10
HigHway 50 corridor system management plans [ 17 ]
124 49
MOTHER LODE DR
MATHER FIELD RD
West Terminus
RAMP
RAMP
RAMPRAMP
RAM
P
RAMP
RAM
P RAMP
RAMPRAMP
RA
MP
RAM
P RAM
P
RAMP
RAM
P
RAM
P
RA
MP
RAM
P
RAM
P
YoloBus Express Routes Plus Routes 42A and 42B
RAMPBROADWAY
65TH
ST
PCE
65
SCRY42A
Y44Y4343
242 IPC
5
W STX ST
WATT AVE
MAROCKINGHAM
DR
OLD PLACER
BRADSHAW RD
VILLE RDTHER FIELD RD
INTERNATIONAL DR
ZINFANDEL DR
WHITE ROCK RD FOLSOM BLVD FOLSOM BLVD
SUNRISE BLVD
BLUE R
AVIN
E RD
WHITE ROCK RD
SC
OTT R
D
PR
AIR
IEC
ITY R
D
LATROBE RD
GREEN V ALLEY RD
PLACERVILLE DR
FORNI RDM
AIN ST
BROADWAY
CEDAR GROVE EXIT
WEST
CAPTOL AVE
(WESTMOST
STOP)
(WESTMOST STOP)
SCR
SCR
IPC
IPC
c h a p t e r t h r e e c u r r e n t c o r r i d o r s y s t e m m a n a g e m e n t s t r a t e g i e s
Figure 5 US 50 CSMP Network Transit Routes
Highway 50 Corridor System Management Plan 80
CSMP Commuter Transit Network
El Dorado County Transit Authority 65
IPC Iron Point Connector
SCR Sacramento Commuter Route 193
Sacramento Regional Transit District 109ndashHazel Express
Yolo Bus (Express) Y43 Y44 Y230 Y231 and Y232
Yolo Bus (All-Day Intercity amp Airport Service) Y42A (Clockwise) Y42B (Counter-clockwise)
LATROBE RD
Park-and-Ride Lots
193 65
49 US Highway 50 (I-80 to Cedar Grove Exit)
Parallel Roads
Light Rail STation
Light Rail
Class I Bikeways Other State Highways
County Lines
80
49
50
80160
50
5 84 16
4999
Miles 0 5 10160
HigHway 50 corridor system management plans [ 18 ]
K
5
FOLSOM BIKE TRAIL
SEE CENTRAL CITY BICYCLENETWORK MAP FOR BICYCLE
F ACILITY NAMES
AMERICAN RIVER PARKWAY TRAIL SYSTEM
(INCLUDING JE
DEDIAH SMITH MEMORIAL T
RAIL)
FOLSOM BLVD
WHITE ROCK RDSIL V A V ALLEY PKWY
EL D
OR
AD
O H
ILLS B
L VD
GREEN VALLEY RD
AMERICAN R
IVER PARKWAY
TRAIL
SYSTEM
(INCLU
DING JE
DEDIAH SMITH
MEMORIA
L TRAIL)
NATOMA ST
FOLSOM BLVD
EL DORADO TRAIL
CARSON RD
PLACER VILLE RD
RAY
LAW
YER
DR
c h a p t e r t h r e e c u r r e n t c o r r i d o r s y s t e m m a n a g e m e n t s t r a t e g i e s
Figure 6 US 50 CSMP Network Bicycle Routes
Highway 50 Corridor System Management Plan
Bicycle Route Network
Class I Bicycle Facilities
Class II Bicycle Facilities
193
Lincoln
65
Rocklin
Auburn
Folsom 49
193
Light Rail Stations
Light Rail Loomis50
RosevilleUS Highway 50 CSMP Corridor
Other State Highways Miles
County Lines 0 1 2 3
99
49 80
50
160 80 193
Placerville 50
West Rancho 50 Sacramento Cordova
5 0 49
8 4
9 9 Sacramento
1 6 4 9
0 1 2 Miles
3
1 6 0 Elk Grove 210 210 44 66 88
Miles 10 Miles
10 1 2 4
4 9
HigHway 50 corridor system management plans [ 19 ]
13TH
ST
H ST E ST BELVEDERE AVE
51ST
ST
BROADWAY H ST
48TH
ST
11TH
ST
PO
WE
R IN
N R
D
28TH
ST
STOC
KTON
BLVD3R
D ST
ALH
AMBR
AFR
ON
T BLV
D S
T
W CAPITOL A VE
DISCOVER Y
P ARK BRIDGE
JEDED
IAH
N ST
T ST
K ST
11TH
ST
RIV
ERSI
DE
BLV
D
18TH
ST
R S
T17
TH S
TO
ST
18TH
ST
20TH ST
CAPITOL AVE
T ST
28TH
ST
34TH
ST
39TH
ST
M ST
BROADWAY
T ST
FOLSOM BLVD
58TH
ST
J ST
65TH
ST
CSU
S
CO
NN
ECTIO
NS
SR 16JACKSON HWY
FOLSOM BLVD
LA RIVIERA DR
W ATT AV
E
HO
WE A
VE
GUY W
EST B
RIDE
COLLEGE TOWN DR
c h a p t e r t h r e e c u r r e n t c o r r i d o r s y s t e m m a n a g e m e n t s t r a t e g i e s
Figure 7 US 50 CSMP Network Bicycle Routes (Sacramento Insert)
5 Sacramento
8 0
8 0
160
West Sacramento
80
SMITH MEMORIAL TRAIL
50
US Highway 50 Corridor System Management Plan 50
Central City Bicycle Route Network 50
Bikeway and Multi-Use Network
US Highway 50 (I-80 to Cedar Grove Exit)
Class I Bicycle Facilities
Class II Bicycle Facilities
Connecting Routesndashno Bicycle Designation
80 16 5
BROADWAY
FLOR
IN-P
ER
KIN
S R
D
Light Rail STation 99
Light Rail
Other State Highways
County Lines
HigHway 50 corridor system management plans [ 20 ]
major corridor mobility challenges
chapter four
High demand for mobility services especially during peak commute periods is creating significant traffic congestion
and impairing mobility in the corridor Heavy congestion and stop-and-go traffic contributes to increased vehicle
emissions and added travel costs Many transit services are operating at maximum passenger carrying capacity and buses often must contend with the same congestion as autos in many locations bicyclists have to compete for space on these same facilities
Much of the congestion can be attributed to population growth residential and commercial development job housing imbalances work schedules that require commute trips during peak travel times recreational trip generators and truck traffic
The overall amount of travel in the corridor has increased dramatically over the past ten years and is expected to
continue to increase as the region adds approximately
one million new residents over the next 25 years per the current SACOG MTP 2035 Traffic congestion per houseshyhold is expected to increase 18 percent over 2005 levels
by the year 2035
in the general area of eastern Sacramento County and western El Dorado County the Highway 50 Partnership
has projected growth of 78000 more dwelling units and 53000 new jobs over the next 25 years Current and foreshycasted data is depicted in Table 4
The sections of US 50 with particularly severe traffic
congestion are depicted in Figures 8 and 9 These are
also summarized in greater detail in Tables 14 and 15 in Chapter 7 Table 14 shows a summary of the US 50 eastbound bottlenecks while the tables that follow discuss each bottleneck including location and possible causality Table 15 shows a summary of the US 50 westbound bottleshynecks while the tables that follow discuss each bottleneck including location and possible causality Minor or hidden bottlenecks are those that are not as defined (or severe) as the major bottlenecks Please note that the graphics acshycompanying the bottlenecks are not to scale
a critical component of identifying and resolving Traffic congestion per corridor mobility challenges household is expected is the need for detailed to increase 18 percent data analysis and comshy over 2005 levels by the munication regarding
year 2035system performance Data collection is insufficient to
fully meet these needs but still provides useful information as detailed in the following pages improving data gathershying analysis and dissemination of information is a major challenge for this corridor and is a component of intelligent Transportation Systems planning
HigHway 50 corridor system management plan [ 21 ]
c h a p t e r f o u r m a j o r c o r r i d o r m o b i l i t y c h a l l e n g e s
[ 22 ] HigHway 50 corridor system management plan
Figure 8 US 50 AM Peak Period Bottleneck Locations
Figure 9 US 50 PM Peak Period Bottleneck Locations
Challenges along the corridor include
bull severe recurrent highway and roadway traffic congestion
bull an incomplete buscarpool lane system
bull an incomplete set of freeway auxiliary lanes
bull loss or dropping of freeway lanes at specific locations
bull incomplete ramp metering
bull limited parallel roadway capacity
bull lack of signal coordination on key arterials and freeway ramp intersections
bull transit facilities approaching capacity
bull inadequate transit capital and operations funding needed to grow transit ridership
bull light rail at-grade crossings
bull lack of adequate access to transit across US 50
bull lack of double tracking of the light rail Gold Line to Folsom
bull poor pavement and road and bicycle route maintenancesweeping
bull lack of sufficient bicycle activated signal change devices
bull motorist driving behavior
bull inadequate bicycle storage
bull inadequate bicycle and pedestrian access to transit and
bull gaps and barriers within the bicycle route network
Additionally the EDCTC has identified safety and operashytional issues between the Smith Flat interchange and east of the Upper Carson RoadCamino intersection in the
Camino Area Parallel CapacitySafety Study Transporshytation issues include at-grade access to US 50 left turn conflicts across US 50 increasing average daily local and
interregional traffic growth in the area lack of alternate
routes seasonal traffic to and from Apple Hill and other local events and seasonal access to recreation in the Lake
Tahoe Region
c h a p t e r f o u r m a j o r c o r r i d o r m o b i l i t y c h a l l e n g e s
Table 4 CUrrenT and ForeCaSTed TraFFiC daTa
location Current Traffic data ndash 2007 Future Traffic data ndash 2027 (no build) Future Traffic data ndash 2027 (build)
County description amp location of Trucks
Peak directional
Split
Peak Hour Traffic
average annual daily
Traffic2
Volume over Capacity3
Peak Hour Traffic
average annual daily Traffic2
Volume over Capacity3
(no-build)
Peak Hour Traffic
average annual daily
Traffic2
Volume over Capacity3
(build)
yOL interstate 80 to yoloSacramento County Line
6 60 15500 180000 109 23911 277032 169 24070 278880 136
SaC yoloSacramento County Line to State Routes 99 and 51
4 59 21000 253000 135 28080 312480 186 29153 324415 193
SaC State Routes 99 and 51 to watt avenue 4 59 20600 225000 145 27942 286230 189 30648 313950 166
SaC watt avenue to Zinfandel Drive 4 59 16700 187000 115 24783 274540 163 25885 286750 136
SaC Zinfandel Drive to Sunrise Boulevard 4 60 13500 149000 093 20331 224394 133 20925 230950 110
SaC Sunrise Boulevard to Folsom Boulevard 4 66 11900 125000 089 18888 198247 131 20086 210820 140
SaC Folsom Boulevard to SacramentoEl Dorado County Line
3 66 8800 95000 087 13341 151311 133 13612 154380 136
ED SacramentoEl Dorado County Line to Cameron Park Drive
4 61 6900 70000 095 11454 116200 165 11834 120050 114
ED Cameron Park Drive to Missouri Flat Road
4 62 5700 62000 092 8647 94054 132 9462 102920 096
ED Missouri Flat Road to End of Freeway in Placerville
4 57 4850 59000 069 7101 76245 098 7363 79050 102
ED End of Freeway in Placerville to Bedford avenue
4 55 4800 52000 Na 4 6595 74196 Na4 6648 74790 Na4
ED Bedford avenue to Cedar grove Exit 4 62 3800 38500 077 5474 50782 099 5520 51205 099
1 Peak Directional Split The percentage of total traffic in the heaviest traveled direction during the peak hour2 Average Annual Daily Traffic (AADT) The average number of vehicles per day in both directions 3 Volume over Capacity (VC) The volume of traffic compared to the capacity of the roadway4 Volume over Capacity does not determine LOS for two- or three-lane facilities or segments with intersection delay 5 Reported Collision Rate index ( Compared to State average) The percentage by which each segmentrsquos reported collisions rate (fatal injury and property damage only) is above or below the statewide average reported collisions rate on comparable facilities
Source 3-Year Caltrans Traffic Accident Surveillance and Analysis System data
HigHway 50 corridor system management plans [ 23 ]
c h a p t e r f i v e p e r f o r m a n c e m e a s u r e s
Page Inte
ntionally
Left
Blank
[ 24 ] HigHway 50 corridor system management plan
performance measures
chapter five
Continuing corridor monitoring and performance mea-
sures are an integral part of corridor management and investment decision making and help identify immediate efficient and effective system operational strategies and
capital improvements Performance measures provide the
important dynamic daily information needed to rapidly
address operational problems caused by recurrent and
non-recurrent traffic congestion Measures are also used to identify the best improvement actions to generate the desired results
Table 5 identifies the performance measures to be used as
part of the corridor system management process
Baseline Data For perFormance measures Tables 6 7 and 8 display baseline data for the perforshymance measures for the CSMP transportation network
The performance data was primarily compiled from the SACMET demand based traffic model the year 2007
edition of the Traffic Volumes Manual the year 2000 edition of the Highway Capacity Manual Caltrans Traffic
Accident Surveillance and Analysis System (TASAS) the 2007 Caltrans Division of Maintenance Pavement Summary Report and ridership records provided by the transit providers
additional performance Performance Measures data was derived from the provide the important Performance Measurement dynamic dailySystem (PeMS) tool an
information needed internet based tool used to
to rapidly addresshost process retrieve and operational problemsanalyze road traffic condishy
tions information from caused by recurrent
real-time and historical and non-recurrent data PeMS obtains 30-sec- traffic congestion ond loop detector data in real-time from detectors installed along the highway corridor
It should be noted that Average Daily Traffic (ADT) and LOS
for some ParallelConnecting Roadways segment locations
in Table 7 was not available These are noted ldquoNo Datardquo
Data collection for non-auto modes is not as robust as what is needed for active system management Subsequent updates of this CSMP will seek to expand the
availability of transit and bicycle performance data collection
HigHway 50 corridor system management plan [ 25 ]
mdash
c h a p t e r f i v e p e r f o r m a n c e m e a s u r e s
TABLE 5 PERFORmAnCE mEASURES DEFInITIOnS AnD APPLICABILITY
Performance Measure Definition of Performance measure applicability to Corridor
STATE HIGHWAY SYSTEm
LOS A ldquoreport cardrdquo measurement with ldquoArdquo being the least amount of
congestion and ldquoFrdquo being the most congestion LOS is a relatively simple and widely used measure which
offers comparison opportunities
Total Vehicle Hours of Delay The additional travel time in hours experienced by all vehicles on the highway segment per day or at peak hour due to congestion
This measurement is used to determine the cost in time which congestion can add to the regular travel time that it takes to traverse a segment of road and is useful in
quantifying the performance of a particular roadway in an understandable format
Total Person Minutes of Delay The additional travel time in minutes experienced by all persons in vehicles on the highway segment per day or at peak hour due
to congestion
This measurement is used to determine the cost in time which congestion can add to the regular travel time that it takes to traverse a given segment of road and is useful in quantifying the performance of a particular roadway in an
understandable format and for comparison of improvement options
Minutes of Delay per Vehicle The additional travel time in minutes experienced by each vehicle on the highway segment at peak hour due to congestion
This measurement is used to determine the cost in time which congestion can add to the regular travel time that it
takes to traverse a given segment of road
Minutes of Delay per Person The additional travel time in minutes experienced by each person in vehicles on the highway segment at peak hour due to congesshy
tion
This measurement is used to determine the cost in time which congestion can add to the regular travel time that it
takes to traverse a given segment of road
Vehicle Travel Time (Minutes) The average time spent by vehicles traversing between two points on a road or highway
Travel time is a measure used to quantify travel time deficienshycies and provide a personal indicator of congestion impacts
Distressed Pavement Pavement that rides rougher than established maximums and or exhibits substantial structural problems as determined by the
Pavement Condition Survey
This measurement provides a ride quality indicator and an indicator for structural roadway problems
Reported Collision Rate Comparison of the actual total collision rate () along a highway segment above or below the statewide average for fatal injury
and property damage-only collisions on comparable facilities
Comparing the total collision and rate with statewide average rate provides an opportunity to assess safety conditions
through the corridor
Reliability Identifies day-to-day variation in travel time for the same trip at the same time of day Focuses on the predictability of travel time
particularly for repetitive trips
Estimates reliability by defining the extra time travelers must add to their average travel time when planning trips to ensure on-time arrival (0 percent no day-to-day variations
100 percent double allotted travel time)
Lost Productivity Measures the capacity of the corridor to accommodate vehicle or person throughput and is calculated as actual volume divided by
the capacity of the highway
As traffic volumes increase to roadway capacity speeds decline rapidly and vehicle throughput drops dramatically which increases traffic congestion and delay and results in
lost productivity
[ 26 ] HigHway 50 corridor system management plan
mdash
c h a p t e r f i v e p e r f o r m a n c e m e a s u r e s
HigHway 50 corridor system management plan [ 27 ]
TABLE 5 PERFORmAnCE mEASURES DEFInITIOnS AnD APPLICABILITY (ConTInued)
Performance Measure Definition of Performance measure applicability to Corridor
PARALLEL AnD COnnECTInG ROADWAYS
LOS A ldquoreport cardrdquo measurement with ldquoArdquo being the least amount of
congestion and ldquoFrdquo being the most congestion LOS is a relatively simple and often used measure which
offers comparison opportunities
traNSit
available Capacity Ratio () of available transit capacity alternatives within the corridor
This measure indicates the available capacity to accommoshydate diverted travelers from single occupant vehicles
c h a p t e r f i v e p e r f o r m a n c e m e a s u r e s
[ 28 ] HigHway 50 corridor system management plan
Page Inte
ntionally
Left
Blank
c h a p t e r f i v e p e r f o r m a n c e m e a s u r e s
Table 6 US 50 PerForManCe MeaSUreS
County location Post Miles
distance (Miles)
average annual daily Traffic1
PerForManCe MeaSUreS
loS1
Total Vehicle Hours of delay2
Total Person Minutes of delay2
Minutes of delay per Vehicle2
Minutes of delay per Person2
Vehicle Travel Time (Minutes)2 distressed
Pavement (lane
Miles)4
reported Col-lision rate
Comparison ()5
reliability6 lost Productivity7
daily Peak Hour3 daily Peak
Hour3 Peak Hour3 Peak Hour3 Peak Hour3 eastbound westbound lost lane Miles aM
Peak Period
lost lane Miles PM
Peak Period
STaTe HigHway SySTeM
yOL interstate 80 to yolo Sacramento County Line
000 to 316 316 180000 F 1169 126 95363 8061 049 046 36 9 26 62 22 01 0
SaC
yoloSacramento County Line to State Routes 99
and 51
L000 to L248 R000
248 253000 F 4993 653 407455 41746 186 175 43 7 20 64 60 53 76
State Routes 99 and 51 to watt avenue
R000 to R534 534 225000 F 10097 1362 823883 87105 397 372 93 15 24 60 48 81 68
watt avenue to Zinfandel Drive
R534 to R1092 558 187000 F 8075 977 658886 62506 351 329 91 19 -32 56 42 44 23
Zinfandel Drive to Sunrise Boulevard
R1092 to 1250 158 149000 E 1271 197 103727 12610 088 082 25 9 -33 46 13 0 16
Sunrise Boulevard to Folsom Boulevard
1250 to 1701 451 125000 E 3087 356 251940 25832 180 149 63 5 -14 60 46 1 45
Folsom Boulevard to SacramentoEl Dorado
County Line
1701 to 2314 613 95000 D 583 122 47537 8867 083 069 70 0 -11 19 55 0 08
ED
SacramentoEl Dorado County Line to Cameron
Park Dr
000 to R657 657 70000 E 504 126 41150 9138 110 091 77 1 -35 PeMS Data
Unavailable PeMS Data Unavailable
PeMS Data Unavailable
PeMS Data Unavailable
Cameron Park Drive to Missouri Flat Road
R657 to R1506 849 62000 E 302 75 24633 4827 079 075 93 2 -61 PeMS Data
Unavailable PeMS Data Unavailable
PeMS Data Unavailable
PeMS Data Unavailable
Missouri Flat Road to End of Freeway in Placerville
R1506 to 1725 219 59000 D 66 16 5376 1053 020 019 24 1 20 PeMS Data
Unavailable PeMS Data Unavailable
PeMS Data Unavailable
PeMS Data Unavailable
End of Freeway in Placerville to Bedford avenue
1725 to 1811 086 52000 D 68 17 5585 1094 021 020 15 2 81 PeMS Data
Unavailable PeMS Data Unavailable
PeMS Data Unavailable
PeMS Data Unavailable
Bedford avenue to Cedar grove Road
1811 to R2595 784 38500 D 58 15 4758 932 023 022 85 10 6 PeMS Data
Unavailable PeMS Data Unavailable
PeMS Data Unavailable
PeMS Data Unavailable
TOTaL mdash 5473 mdash mdash 30273 4042 2470293 263771 1587 1449 7150 80 mdash mdash mdash mdash mdash
1 Source Average Annual Daily Traffic and Level of Service (LOS) calculated is based on 2007 Caltrans Traffic Volumes on California State Highways and Highway Capacity Manual and Cambridge Systematics from 2008 Reported LOS is for the typical most congested daily peak travel period 2 Source Delay is the average additional travel time by vehiclespersons traveling under 60 mph Data derived from 2007 HICOMP report SACMET Travel Demand Model PeMSs traffic data and Caltrans District 3 Traffic Operations Probe vehicle Tach runs 3 Peak Hour is during PM 4 Source 2007 Caltrans Division of Maintenance Pavement Summary Report 5 Source 2004 through 2007 Caltrans Traffic Accident Surveillance and Analysis System summary data of the percentage above or below the statewide average for fatal injury and property damage-only collisions on comparable facilities 6 Reliability The Planning Time Index is a measure of the reliability of the travel time on a particular route It is the ratio of the 95th percentile of travel time on a route to the median free-flow travel time This means itrsquos the amount of time a traveler needs to allocate for a route if they want to show up on time 19 out of 20 trips Reliability and Planning Time data was taken from April 2007 The data covered a 24-hour period of time on each Tuesday wednesday and Thursday of that month That data was then aggregated into a single average 24-hour day it was then analyzed to determine the highest average aM and PM travel time That time was then compared to the best possible average travel time to determine the additional time that was spent traveling the same seg-ment 7 Lost Productivity Data taken April 2007 PeMS As traffic increases to the capacity of the highway speeds decline throughput drops dramatically and the efficiency of the highway to provide mobility decreases This decline in the potential carrying-capacity of the freeway is expressed in terms of how many equivalent lane miles of roadway are lost
HigHway 50 corridor system management plans [ 29 ]
c h a p t e r f i v e p e r f o r m a n c e m e a s u r e s
Table 7 Parallel and ConneCTing roadwayS PerForManCe MeaSUreS
County location average
daily Traffic1
PerForManCe MeaSUreS
loS1
Total Vehicle Hours of delay2
Total Person Minutes of delay2
Minutes of delay per Vehicle2
Minutes of delay per Person2
Vehicle Travel Time (Minutes)2
distressed Pavement
(lane Miles)4
daily Peak Hour3 daily Peak
Hour3 Peak Hour3 Peak Hour3 Peak Hour3
Parallel and ConneCTing roadwayS
yOL west Capitol Enterprise Boulevard to Capitol Mall 13737 No Data
Data is unavailable for these performance measures at this time however will be pursued in the next phase of the CSMP
SaC
w 5th Street to 26th Street 9194 a
X 5th Street to 26th Street 9154 a
Folsom Boulevard watt avenue to Bradshaw Road 25600 C
watt avenue Folsom Boulevard to US 50 63900 F
Bradshaw Road Folsom Boulevard to US 50 22400 a
Folsom Boulevard Bradshaw Road to Sunrise Boulevard 20400 a
Bradshaw Road Old Placerville to US 50 54405 F
Old Placerville Road Bradshaw Road to Rockingham Drive 11864ndash18365 a
Rockingham Drive Old Placerville Road to Mather Boulevard 16516 E
Mather Boulevard Rockingham Drive to Folsom Boulevard 21732 C
international Drive Rockingham Drive to Zinfandel Drive 12808 a
Zinfandel Drive international Drive to Folsom Boulevard 22298ndash47032 BE
white Rock Road Zinfandel Drive to Sunrise Boulevard 25459 a
Sunrise Boulevard US 50 to Folsom Boulevard No Data No Data
white Rock Road Sunrise Boulevard to Prairie City Road 3400 B
Folsom Boulevard Sunrise Boulevard to iron Point Road 17200 a
white Rock Road grant Line Road to EDSaC County Line 6700 D
iron Point Road Folsom Boulevard to East BidwellScott Road 13984 No Data
Scott Road iron Point Road to white Rock Road No Data No Data
Folsom Boulevard iron Point Road to Blue Ravine Road No Data No Data
Blue Ravine Road Folsom Boulevard to green Valley Road No Data No Data
Prairie City Road US 50 to white Rock Road 6000 D
HigHway 50 corridor system management plans [ 30 ]
c h a p t e r f i v e p e r f o r m a n c e m e a s u r e s
Table 7 Parallel and ConneCTing roadwayS PerForManCe MeaSUreS (ConTinUed)
County location average
daily Traffic1
PerForManCe MeaSUreS
loS1
Total Vehicle Hours of delay2
Total Person Minutes of delay2
Minutes of delay per Vehicle2
Minutes of delay per Person2
Vehicle Travel Time (Minutes)2
distressed Pavement
(lane Miles)4
daily Peak Hour3 daily Peak
Hour3 Peak Hour3 Peak Hour3 Peak Hour3
Parallel and ConneCTing roadwayS
ED
green Valley Road EDSaC County Line to Francisco Drive 22600 D
Data is unavailable for these performance measures at this time however will be pursued in the next phase of the CSMP
green Valley Road Francisco Drive to Silva Valley Parkway 13077 D
green Valley Road Silva Valley Parkway to Cameron Park 9849 C
green Valley Road Cameron Park Drive to Deer Valley Road 5278 C
green Valley Road Deer Valley Road (East) to Lotus Road 8381 D
green Valley Road Lotus Road to Placerville Drive 4669 C
Latrobe Road white Rock Road to US 50 24742 C
Durock Road Cameron Park Dr to South Shingle Road 7278 C
Cameron Park Drive Durock Road to US 50 (Durock Road to Coach Lane Coach Lane to US 50) 9544 26603 CD
South Shingle Road Durock Road to US 50 11390 D
white Rock Road EDSaC County Line to Latrobe 12808 D
white Rock Road Latrobe Rd to Silva Valley Pkwy (Latrobe to PostPost to Silva Vlly Pkwy) 10124 CD
Silva Valley Parkway white Rock Rd to Serrano Pkwy (white Rock to Entrada Entrada to Serrano Pkwy) 13708 9328 DC
Forni Road Placerville Drive to Main Street 9049 8379 No Data
Placerville Drive Forni Road to US 50 No Data No Data
Main Street Placerville Drive to Bedford avenue No Data No Data
Main Street Bedford avenue to Broadway No Data No Data
Broadway Main Street to Point View Drive No Data No Data
1 Source Average Daily Traffic and Level of Service (LOS) calculated are based on City of Sacramento between 2001 and 2007 Sacramento County from 20072008 City of Rancho Cordova between 2004 and 2007 and El Dorado County from 2007
HigHway 50 corridor system management plans [ 31 ]
c h a p t e r f i v e p e r f o r m a n c e m e a s u r e s
Page Inte
ntionally
Left
Blank
[ 32 ] HigHway 50 corridor system management plan
c h a p t e r f i v e p e r f o r m a n c e m e a s u r e s
tabLe 8 traNSit PerforMaNCe MeaSure
County transit Provider route Performance Measure
available daily Capacity ()1 available Peak Hour Capacity1
traNSit
SaC
SacRT (Bus)
Route 21 70 10
Route 28 76 59
Route 36 83 74
Route 38 66 44
Route 72 56 20
Route 73 79 45
Route 74 82 43
Route 109 47 22
SacRT (Light Rail) Gold Line 31 Exceeds Capacity
EDSAC ED County Transit Authority
Commuter Express Bus Service Not applicablendashOperates Peak Hour
Only 405
iron Point Connector 764 Not available
Reverse Commuter Not applicablendashOperates Peak Hour Only 982
yoloSaC yolo County Transit District Not applicablendashOperates Peak Hour Only 498
biKe3
1 Source average Daily and Peak Hour available Capacity calculated from each transit providerrsquos route ridership data 2 The Reverse Commuter service is offered on vehicles that are returning to El Dorado County (Commuter Express Buses) 3 Bicycle performance measure(s) will be identified applied and included in the subsequent CSMPs
HigHway 50 corridor system management plan [ 33 ]
c h a p t e r f i v e p e r f o r m a n c e m e a s u r e s
[ 34 ] HigHway 50 corridor system management plan
Page Inte
ntionally
Left
Blank
planned corridor system management strategies
chapter six
ConCept LoS and ConCept FaCiLit y ldquoConcept LOSrdquo and ldquoConcept Facilityrdquo have traditionally been used in Caltrans TCCRs to reflect the minimum level or quality of operations acceptable for each route segment within the 20-year planning period and the highway facility needed in the next 20 years to maintain the Concept LOS
Typical Concept LOS standards in Caltrans District 3 are LOS ldquoDrdquo in rural areas and LOS ldquoErdquo in urban areas how-ever some heavily congested route segments now have a Concept LOS ldquoFrdquo because the improvements required to bring the LOS to ldquoErdquo are not feasible due to environmental right of way financial and other constraints The applica-tion of multi-modal corridor management strategies should reduce the severity and duration of congestion and provide viable travel options and information that will enable a traveler to avoid severe freeway congestion
The Concept LOS and Concept Facility for US 50 are shown in Table 9 almost all US 50 segments are forecasted to operate under LOS ldquoFrdquo conditions in 20 years under the No-Build and Build scenarios
Corridor ManageMent StrategieS The US 50 CSMP also proposes specific strategies to enhance corridor mobility (see Table 10) based on the fol-lowing principles
bull Manage all modes and facilities in the corridor as a single system beginning with the transportation net-work defined in this CSMP
bull Implement comprehensive and dynamic multimodal monitoring and reporting for the system and for all modes
bull Develop and use micro-simulation modeling to identify mobility challenges and to evaluate proposed solutions
bull Complete the projects included in the regional trans-portation plans with an emphasis on the completion of the key mobility improvement projects identified in this CSMP (see Tables 11 and 12)
bull Implement the specific strategies outlined in this CSMP
Key CapitaL projeCtS Tables 11 and 12 contain key capital projects that have been identified as the most critical to corridor mobility These are also included in the SaCOg MTP for 2035 and are either planned without any funding yet programmed are partially programmed
The US 50 CSMPor are entirely programmed SACOG conducted significant proposes specific
public attitude research strategies to enhance for the MTP for 2035 to corridor mobility complement comprehensive outreach efforts through community workshops the TALL Order Moving the Region Forward event the televised Town Hall Road Map for the Future and associated public polling The results of the SaCOg analyses and public out-reach for the MTP were
highway 50 corridor system management plan [ 35 ]
c h a p t e r s i x p l a n n e d c o r r i d o r s y s t e m m a n a g e m e n t s t r a t e g i e s
[ 36 ] HigHway 50 corridor system management plan
used when selecting the key projects for identification in
the CSMP and to ensure consistency Not all corridor projshyects in the MTP are included in the CSMP since the CSMP focuses on the managed network and the SaCOg MTP considers all streets and roads bike routes and transit services in the corridor
highway 50 partnership The Highway 50 Partnership is a cooperative public-private effort among the County of Sacramento City of Rancho
Cordova City of Folsom County of El Dorado and several major landowners that recognize the need to consider corrishydor mobility needs holistically
The Partnership has collaborated effectively to develop a Plan to improve mobility in the US 50 Corridor from Rancho
Cordova to El Dorado Hills an area identified as approprishyate for growth in the SACOG Blueprint Recognizing the
need to generate private investment the Partnership is seeking to implement a regional Highway 50 Corridor fee program to fund these projects
in addition to the key projects indicated in Table 11 Table 12 displays the key projects identified by the
Partnership
These projects include (1) Near-Term Priority Improvement Projects and (2) Near-Term Expected Roadway Improveshyments
The Near-term Priority improvement Projects would proshyvide several new roadway connections for people to travel within and through the area to avoid congestion They also include new transit routes and widening existing roadways
viewed by the Partnership as a package that would provide system-wide travel benefits These improvements targeted
for completion through 2012 would reduce vehicle hours of delay during commute hours by 30 percent
The near-Term Expected Roadway Improvements are conshysidered by the Partnership to be readily expected since they are tied to expected development or are part of a near-term
capital improvements program
Visionary projects Visionary projects are not yet included in the SaCOg MTP or EDCTC RTP but appear to offer considerable corridor mobilshyity benefits and merit further analysis and consideration for inclusion in the next MTP and RTP These are displayed in
Table 13
The ldquoPlus 10 Listrdquo in the SACOG MTP identifies projects
that are attractive from a performance standpoint but could not be included in the Final Project Lists because of financial constraint The ldquoPlus 10 Listrdquo element offers the
opportunity to include projects that would not be affordshyable without additional funding Some projects identified in
the Visionary Projects List were analyzed by SACOG during
development of the current MTP Some of these are included in the ldquoPlus 10 Listrdquo
Watt Avenue Light Rail Station Improvement Project
c h a p t e r s i x p l a n n e d c o r r i d o r s y s t e m m a n a g e m e n t s t r a t e g i e s
Table 9 US 50 ConCePT loS and FaCiliTy TyPe
location Forecasted level of Service1 (loS) and Facility Type
County description and location From Post Mile To Post Mile Current
loS1 20-year no build loS12
20-year build loS12
20-year Concept
loS13 existing Facility4 Concept Facility456 Ultimate Facility457
yOL interstate 80 to yoloSacramento County Line
000 316 F F F F 8F (6F between Jefferson Blvd ramps)
8F+2HOV+aux Lanes 8F+2HOV+aux Lanes
SaC yoloSacramento County Line to SR 99 and 51
L000 L248 = R000 F F F F 8F 8F+2HOV+aux Lanes 8F+2HOV+aux Lanes
SaC State Routes 99 and 51 to watt avenue R000 R534 F F F F 8F 8F+2HOV+aux Lanes 8F+2HOV+aux Lanes
SaC watt avenue to Zinfandel Drive R534 R1092 F F F F 8F 8F+2HOV+aux Lanes 8F+2HOV+aux Lanes
SaC Zinfandel Drive to Sunrise Boulevard R1092 1250 E F F F 8F 8F+2HOV+aux Lanes 8F+2HOV+aux Lanes
SaC Sunrise Boulevard to Folsom Boulevard 1250 1701 E F F F 6F+2HOV to Hazel ave 4F+2HOV
to Folsom Blvd
6F+2HOV+aux Lanes to Hazel ave 4F+2HOV+aux
Lanes to Folsom Blvd
8F+2HOV+aux Lanes
SaC Folsom Boulevard to SaCED County Line 1701 2314 D F F F 4F+2HOV 4F+2HOV+aux Lanes 6F+2HOV+aux Lanes
ED SacramentoEl Dorado County Line to Cameron Park Drive
000 R657 E F F F 4F 4F+2HOV+aux Lanes 6F+2HOV+aux Lanes
ED Cameron Park Drive to Missouri Flat Road R657 R1506 E F E E 4F 4F+2HOV+aux Lanes to greenstone 4F+aux Lanes
to Missouri Flat
6F+2HOV+aux Lanes to greenstone 4F+2HOV+aux Lanes
to Missouri Flat
ED Missouri Flat Road to End of Freeway in Placerville
R1506 1725 D F F F 4F 4F+aux Lanes 4F+aux Lanes
ED End of Freeway in Placerville to Bedford avenue
1725 1811 D E E E 4E 4E 4E
ED Bedford avenue to Cedar grove Exit 1811 R2595 D F F F 4F to Smith Flat 4E to Camino 4F+aux Lanes to Smith Flat 4E to Camino
4F+aux Lanes
1 Level of Service (LOS) A ldquoreport cardrdquo for evaluating traffic flow with ldquoArdquo being the best and ldquoFrdquo being the worst 2 20-year LOS (No Build) The LOS that would be expected at 20 years with no improvements 3 20-year Concept LOS The minimum acceptable LOS over the next 20 years 4 Facility Type Codes C=Conventional Highway E=Expressway F=Freeway HOV=High Occupancy Vehicle Lanes aux=auxiliary Lanes 5 Operational improvements are included in future facilities for all segments Examples of operational improvements include TOS improvements and auxiliary lanes 6 Concept Facility the future roadway with improvements needed in the next 20 years if LOS ldquoFrdquo no further degradation of service from existing ldquoFrdquo is acceptable as indicated by delay performance measurement 7 Ultimate Facility The future roadway with improvements needed beyond a 20 year timeframe
HigHway 50 corridor system management plans [ 37 ]
c h a p t e r f i v e p e r f o r m a n c e m e a s u r e s
Table 10 US 50 CSMP STraTegieS
Strategy description implementation Challenges
Maintain and operate the existing corridor multi-modal trans-
portation infrastructure
Maintain the existing investment in all modes of the transportation system and provide adequate resources for daily operations including operating
revenues for transit services
Funding availability funding competition within the region
Fully coordinate the delivery of transportation services and facili-ties in the corridor including daily operations and system planning
for enhancements
Interagency operational coordination to maximize the efficiency and effec-tiveness of all modes operating in the corridor with a focus on the CSMP transportation network defined in this CSMP Use of an existing group or
committee to provide initial oversight for this strategy
Diverse interests and competing priorities and limited resources
Construct planned and pro-grammed corridor capital improve-
ment projects
implementation of the capital improvements in the corridor included within the approved Metropolitan Transportation Plan and Regional Transportation
Plan for all transportation modes within the scope schedule and cost specified
Funding availability funding competition within the region
Comprehensive daily monitoring of the status of all modes providing service on the CSMP transporta-
tion network
Full deployment of multimodal transportation service status detection systems for all CSMP network components
Funding availability funding competition within region
Provide traveler information to the public
Provide the public with real-time easily accessible information regarding the status of all CSMP transportation system components so as to allow travel-
ers to make informed decisions about trip mode time and routing options
Funding availability funding competition within region
Continually monitor and analyze the CSMP transportation network to improve system performance
Monitor transportation performance measures and make system modifica-tions as appropriate on a frequent and timely basis Staff resources and data availability
Decrease the duration of non-recurrent traffic congestion
Expand and enhance the Freeway Service Patrol to respond to automobile accidents and vehicle break-downs
Funding availability funding competition within the region
Timely implementation of STaRNET
Expedite the implementation of the STaRNET operators of transportation facilities and emergency responders in the Sacramento region through real-time sharing of data and live video refinement of joint procedures
pertaining to the operation of roadways and public transit and public safety activities as well as enhance the regionrsquos 511 web site and interactive
telephone service to provide more traveler information
Developmental time acceptance by agencies and integration into daily use and identifica-
tion of maintenance and operations funding
Enhance transit and rail service increase transit service frequency provide express transit services imple-
ment bus rapid transit routes reduce headways for light rail and buses and construct planned light rail line extensions
Funding availability funding competition within the region
Complete Bus Carpool lane network
Complete the regional buscarpool lane network including freeway-to-freeway HOV lane connectors
Funding availability funding competition within the region Public agency and public
acceptance of network
[ 38 ] HigHway 50 corridor system management plan
c h a p t e r s i x p l a n n e d c o r r i d o r s y s t e m m a n a g e m e n t s t r a t e g i e s
tabLe 10 uS 50 CSMP StrategieS (ConTInued)
Strategy Description implementation Challenges
Enhance Transportation Demand Management strategies
Encourage employers to provide telecommuting and flexible working hour options to employees
acceptance by employers and resources to participate
Optimize the timing and synchronishyzation of traffic signals
Coordinate the optimization and timing of traffic signals on freeway ramps and along parallel and connecting roadways within and between jurisdicshytions to improve traffic flow and reduce congestion Provide signal priority
systems for transit vehicles
Funding availability and coordination among cities counties and Caltrans
improve access management of freeways and parallel connecting roadways
Develop and implement access management strategies to maintain the operational efficiency of freeways and parallelconnecting roadways
agreement between responsible jurisdicshytions as to where increased access control is needed increased access control on some parallelconnecting roadways may increase
traffic volumes on non-corridor roads
Develop innovative use of CMSs (eg travel times)
Potential uses of CMSs to improve system efficiency include the use of CMSs along portions of all corridors near transit station to indicate travel
times based on real-time existing traffic conditions on the freeway as well as on parallel roadways and express bus and light rail services CMS can also be used to identify the number of parking spaces that are still available at
the light-rail stations
Funding availability funding competition within the region
Implement amp expand Transit AVLTransit status information
enhancements for system users
Expand the use of AVL systems utilizing GPS technology to track in real-time the location of transit vehicles monitor transit schedules dispatch transit vehicles and provide real-time passenger information such as ldquonext busrdquo or
ldquonext trainrdquo arrival times
Funding availability funding competition within region
Expand Park-and-Ride lots at key locations
Add additional capacity to existing park-and-ride lots near transit stations and other locations that are approaching capacity
Funding availability funding competition within the region and available land
improve bike-pedestrian access in the CSMP
transportation network
Plan and program for construction of additional bicycle paths lanes and related improvements for access and connectivity to transit park and ride
lots and destination points
Funding availability funding competition within the region
Provide ldquoBike-SharingrdquordquoCar-Sharingrdquo tofrom transit (ldquoCarlinkrdquo) and from
neighborhoods
Expand the Regional Rideshare and Spare-the-Air programs to include bicycle and car sharing opportunities
Funding availability and coordination between SaCOg TMa air Districts employers developshyers property managers and local government
officials
Provide parking management stratshyegies in interested jurisdictions where applicable to discourage
use of single-occupant vehicles
in higher-density areas provide preferential parking for carpools and vanshypools require residential parking permits remove on-street parking and or provide graduated parking fees for metered on-street parking based on
vehicle type and time of day for SOV spaces to encourage transit use
Acceptance by businesses local officials and the general public
Expand bicycle commute amp transit fare strategiessubsidies
increase participation by large employers in programs that subsidize transit fares for employees during peak-hour commute times and provide bicycling
to work incentives
Voluntary participation by large employers to pay subsidy to transit providers
HigHway 50 corridor system management plan [ 39 ]
c h a p t e r s i x p l a n n e d c o r r i d o r s y s t e m m a n a g e m e n t s t r a t e g i e s
tabLe 11 KeY CaPitaL ProjeCtS
CountyLead agency
route roadway from to Project
Description Programmed
funds
additional funding Needed
total Cost estimate (x $1000)
Comp Year (FFY)
uS 50
Sacramento Caltrans District 3
US 50 Downtown watt avenue HOV Lanes $0 $75000 $75000 2020
Sacramento Caltrans District 3
US 50 watt avenue Sunrise Blvd HOV Lanes $165000 $0 $165000 2013
Sacramento Caltrans District 3
US 50 Bradshaw Road
Mather Field Road
Eastbound and Westbound Auxiliary Lanes
$0 $3700 $3700 2016
Sacramento Caltrans District 3
US 50 State Route 99
(Oak Park Interchange) interchange improvements including buscarpool lane
connectors $0 $150000 $150000 2014
Sacramento Caltrans District 3
US 50 interstate 5
(Riverfront Interchange) Riverfront Interchange
improvements including bus carpool lane connectors
$30000 $170000 $200000 2016
ED Caltrans District 3 US 50 Camino
Operational Safety improvements Construct an
undercrossing median barrier modify local road connections andor associated operational improvements on and adjacent
to US 50
$15000 $0 $15000 2012
ED ED County DOT US 50
west of Latrobe Road
west of Bass Lake
grade HOV Lanes (Ph1) $47141 $0 $47141 2010
ED Caltrans District 3 US 50
west of Bass Lake Road
Ponderosa Road
HOV Lanes (Ph2) $55000 $0 $55000 2011
ED Caltrans District 3 US 50 Ponderosa
Road greenstone
Road HOV Lanes (Ph3) $22357 $0 $22357 2013
ED ED County DOT US 50 Future Silva
Valley iC
Future Empire Ranch IC
Mainline Widening construct new WB lane within the
median from proposed Silva Valley IC to proposed Empire
Ranch IC
$2950 $0 $2950 2013
[ 40 ] HigHway 50 corridor system management plan
c h a p t e r s i x p l a n n e d c o r r i d o r s y s t e m m a n a g e m e n t s t r a t e g i e s
tabLe 11 KeY CaPitaL ProjeCtS (ConTInued)
CountyLead agency
route roadway from to Project
Description Programmed
funds
additional funding Needed
total Cost estimate (x $1000)
Comp Year (FFY)
PARALLEL AnD COnnECTInG ROADWAYS
ED ED County DOT
Silva Valley Parkway
Entrada Drive
Future US 50
Silva Valley Parkway iC
Widen Silva Valley Road from 2 lanes to 4 lanes includes
Class ii bike lanes and left turn storage pockets
$2921 $0 $2921 2010
ED ED County DOT
Silva Valley Parkway US 50
US50 Silva Valley Parkway (Phase 2) Includes constructshying overcrossing and ramps
signalization at EB and WB on off ramps
$57817 $0 $57817 2016
ED ED County DOT
Headington Road
Missouri Flat Road
El Dorado Road
Extend 2 lanes with median $9878 $0 $9878 2012
ED ED County DOT
Durock Road
Robin Lane South
Shingle Road
Extend 2 lanes with median $1239 $9214 $10453 2015
ED ED County DOT
Durock Road
Business Center Drive intersection signalization
includes adding turn pockets on Durock Road
$4333 $0 $4333 2009
ED City of Placerville
Point View Drive Broadway Smith Flat
Road Extend 2 lanes $1300 $0 $1300 2020
ED City of Placerville
western Placerville
US 50 interchange
Forni Road Ray Lawyer
Drive
Placerville Drive
Interchange Reconstruction convert Ray Lawyer Dr
Overcrossing to full IC Auxiliary Lanes
$5059 $34741 $39800 2020
Sacramento City of Rancho
Cordova
Mather Boulevard
Rockingham Road
Zinfandel Drive widen to 4 lanes $0 $8617 $8617 2020
Sacramento Rancho Cordova
Parkway ii
Grant Line Road
White Rock Road
New 6-lane expressway includshying intersection improvements at Kiefer Blvd amp White Rock
Road
$0 $44518 $44518 2020
Sacramento City of Folsom
Scott Road US 50 White Rock Rd
widen from 2 to 6 lanes $16000 $0 $16000 2020
Sacramento Sacramento County DOT
White Rock Road
Grant Line Rd
Prairie City Rd
Widen from 2 to 4 lanes realign near Nike and Nimbus Roads and connect with existshying alignment west of Prairie City Rd Realign Grant Line Rd to intersect with realigned
White Rock Rd
$26600 $0 $26600 2020
Sacramento Sacramento County DOT
Hazel avenue
US 50 Hazel Madison
Widen American River Bridge and approaches from 4 to 6 lanes Widen Hazel Avenue from AR Bridge to Madison from 4 to 6 lanes with Bike
LanesSignals
$83530 $0 $83530 2020
HigHway 50 corridor system management plan [ 41 ]
c h a p t e r s i x p l a n n e d c o r r i d o r s y s t e m m a n a g e m e n t s t r a t e g i e s
tabLe 11 KeY CaPitaL ProjeCtS (ConTInued)
CountyLead agency
route roadway from to Project
Description Programmed
funds
additional funding Needed
total Cost Estimate (x $1000)
Comp Year (FFY)
PARALLEL AnD COnnECTInG ROADWAYS
ED ED County DOT
green Valley Road
Salmon Falls Road
east
Deer Valley Road
widen from 2 to 4 lanes $0 $14576 $14576 2025
ED ED County DOT
green Valley Road
Deer Valley Road east Lotus Road widen $958 $4513 $5471 2015
ED ED County DOT
green Valley Road
Francisco Drive
Salmon Falls Road
widen from 2 to 4 lanes divided $412 $3491 $3903 2015
ED ED County DOT
Latrobe Road
investment Boulevard
golden Foothill Parkway
widen from 2 lanes undivided to 4 lanes
divided $1076 $8792 $9868 2015
ED ED County DOT
Latrobe Road
Carson Creek
White Rock Road
widen from 4 to 6 lanes $0 $23755 $23755 2025
ED ED County DOT
white Rock Road
EDSac County Line
Manchester Drive
widen 2 to 4 lanes divided includes signal interconnect and coorshy
dination
$0 $23755 $23755 2025
Sacramento City of Rancho
Cordova
Easton Valley
Parkway
Prairie City Road
Empire Ranch Road extenshysion south of
US 50
Construct new 4 lane road $0 $45000 $45000 2020
Sacramento Sacramento County DOT
Hazel avenue
Easton Valley
Parkway
Grant Line RoadWhite Rock Road
New road extension 4 lane limited access
through aerojet property $0 $18000 $18000 2018
Sacramento Sacramento County DOT
white Rock Road
Prairie City Road
ED County Line
widen to 4 lanes $8330 $64773 $73103 2018
Sacramento Sacramento County DOT
green Valley Road
East Natoma Sacramento ED County
line widen to 4 lanes $0 $3000 $3000 2018
Sacramento City of Rancho
Cordova
Zinfandel Drive
international Drive
Folsom Boulevard
widen to 4 lanes $0 $12000 $12000 2020
[ 42 ] HigHway 50 corridor system management plan
c h a p t e r s i x p l a n n e d c o r r i d o r s y s t e m m a n a g e m e n t s t r a t e g i e s
tabLe 11 KeY CaPitaL ProjeCtS (ConTInued)
CountyLead agency
route roadway from to Project
Description
Pro-grammed
funds
addi-tional
funding Needed
total Cost estimate (x $1000)
Comp Year (FFY)
traNSit
yolo amp Sacramento City of west Sacramento
amp City of Sacramento
Sacramento River
Crossing
15th Street in the City
of west Sacramento
Broadway in the City of
Sacramento
New all-modal river crossing (Auto Transit Bike amp Pedestrian)
from Sacramento across the Sacramento River to West
Sacramento The crossing was modeled between Broadway in Sacramento amp 15th Street in
West Sacramento but final alignshyment options will be studied in subsequent planning efforts
$800 $99200 $100000 2019
Sacramento Cal State University
Sacramento
CSUS Campus mdash mdash
Sac State Tram adjoining City streets and SRTD 65th Street light railbus transfer station Bus Rapid Transit System
$23574 $0 $23574 2013
Sacramento City of Rancho
Cordova
Rancho Cordova Various Various
New Service Rancho Cordova Pilot Transit Shuttle System new transit service for connection to
RTs Gold Line
$2380 $1500 $38880 2014
yolo amp Sacramento City of west Sacramento
TBD west
Sacramento Sacramento Streetcar Service between west
Sacramento and Downtown Sacramento
$17400 $54700 $72100 2014
Sacramento City of Rancho
Cordova RT Gold Line
RT Gold Line Tracks
Mather Field Road
Light Rail Grade Separations $0 $52888 $52888 2025
Sacramento City of Rancho
Cordova RT Gold Line
RT Gold Line Tracks Zinfandel Drive Light Rail Grade Separations $0 $52888 $52888 2025
Sacramento City of Rancho
Cordova RT Gold Line
RT Gold Line Tracks
Bradshaw Road
Light Rail Grade Separations $0 $35260 $35260 2025
Sacramento City of Rancho
Cordova RT Gold Line
RT Gold Line Tracks Routier Road Light Rail Grade Separations $0 $35260 $35260 2025
Sacramento City of
Sacramento Sacramento Valley Station
Sacramento intermodal Transportation Facility (Phase 1) - Develop intermodal transportashytion terminal for heavy rail light
rail and bus service
$77799 $0 $77799 2010
Sacramento City of
Sacramento Sacramento Valley Station
Sacramento intermodal Transportation Facility (Phase 2) - Develop intermodal transportashytion terminal for heavy rail light
rail and bus service
$24101 $1000 $25101 2014
HigHway 50 corridor system management plan [ 43 ]
c h a p t e r s i x p l a n n e d c o r r i d o r s y s t e m m a n a g e m e n t s t r a t e g i e s
TABLE 11 KEY CAPITAL PROJECTS (CONTINUED)
CountyLead Agency
Route Roadway From To Project
Description Programmed
Funds
Additional Funding Needed
Total Cost Es-timate (x $1000)
Comp Year (FFY)
BICYCLE ROUTES
Sacramento City of Rancho
Cordova
US 50Mather Field Road IC US 50 Mather
Field Road
US 50Mather Field Road PedestrianBike Crossing along
the Mather Airport RR Spur alignment
$0 $820 $1055 2015
ED ED County DOT
Sacramento Placerville
Transportation Corridor
Forni Rd
Missouri Flat Rd Class I Bike Trail $1423 $111 $1534 2009
ED City of Placerville
El Dorado Trail Western
Extension
Canal Street Main Street
Ray Lawyer DriveForni
Road Class 1 Bike Trail $1850 $0 $1850 2010
ED ED County DOT
US 50ED Hills Blvd IC US 50
El Dorado Hills Blvd
Latrobe Road
US 50El Dorado Hills Blvd Pedestrian Overcrossing $5508 $66 $5574 2014
TABLE 12 50 MOBILITY PARTNERSHIP KEY CAPITAL PROJECTS
RouteRoadway From To Project Description
NEAR TERM PRIORITY IMPROVEMENT PROJECTS
US 50 Sunrise Scott Road Auxiliary Lane
US 50 Hazel Avenue Interchange Improvements
Hazel Avenue Folsom Boulevard Easton Valley Parkway New 4 Lane Road
Easton Valley Parkway Hazel Avenue Rancho Cordova Parkway New 6 Lane Road
Rancho Cordova Parkway Easton Valley Parkway White Rock Road New 4 Lane Road
White Rock Road Sunrise Boulevard Silva Valley Parkway Widen to 4 Lanes
RT Gold Line Hazel Iron Point Station Passing Tracks
US 50 Rancho Cordova Parkway New Interchange
Zinfandel Drive South of International Douglas Road New 4 Lane Road
International Drive Kilgore Road Rancho Cordova Parkway New 6 Lane Road
Douglas Road Zinfandel Extension Sunrise Boulevard Widen to 4 Lanes
Sunrise LRT Citrus Road Sunrise Mall Bus Rapid TransitExpress Bus
[ 44 ] HIGHWAY 50 corridor system management plan
c h a p t e r s i x p l a n n e d c o r r i d o r s y s t e m m a n a g e m e n t s t r a t e g i e s
TABLE 12 50 mOBILITY PARTnERSHIP kEY CAPITAL PROjECTS (COnTInUED)
routeroadway from to Project Description
US 50 nEAR TERm PRIORITY ImPROVEmEnT PROjECTS
US 50 Empire Ranch Road New interchange
US 50 Silva Valley New interchange
US 50 Scott Road Empire Ranch Road Aux Lanes
US 50 Empire Ranch Road El Dorado Hills Boulevard Aux lanes and climbing lanes
US 50 El Dorado Hills Boulevard Silva Valley Parkway Aux lanes and climbing lanes
US 50 Silva Valley Parkway Bass Lake Road Aux lanes
Sunrise Boulevard White Rock Road Douglas Boulevard widen to 6 lanes
Sunrise Boulevard Douglas Boulevard Jackson Road widen to 4 lanes
White Rock Road Sunrise Boulevard Future Rancho Cordova Parkway and El Dorado County Line to Latrobe Road
widen to 4 lanes
Douglas Boulevard Sunrise Boulevard Grant Line Road widen to 4 lanes
Rancho Cordova Parkway Douglas Boulevard Rio del Oro Parkway New 2 lane road
Rancho Cordova Parkway Rio del Oro Parkway White Rock Road New 6 lane road
Jaeger Road Douglas Road Kiefer Boulevard New 4 lane road
Chrysanthy Sunrise Boulevard Americanos Boulevard New 4 lane road
Kiefer Boulevard Sunrise Boulevard Jaeger Road New 4 lane road
Grant Line Road Douglas Road Chrysanthy Road widen to 4 lanes
Hazel avenue Gold Country Boulevard Madison avenue widen to 6 lanes
Latrobe Road South of White Rock Road widen to 4 lanes
TABLE 13 VISIOnARY PROjECTS
County routeroadway from to Project Description
Sac yolo US 50 Enterprise Downtown Sacramento HOV Lanes
ED TBD Folsom Placerville Transit ndash Type TBD
ED New Road Latrobe Road White Rock Road (poten shy
tially US 50) New 2-lane road
HigHway 50 corridor system management plan [ 45 ]
c h a p t e r s i x p l a n n e d c o r r i d o r s y s t e m m a n a g e m e n t s t r a t e g i e s
[ 46 ] HigHway 50 corridor system management plan
Page Inte
ntionally
Left
Blank
congestion and bottleneck analysis
chapter seven
The 2000 Highway Capacity Manual defines a bottleneck
as ldquoa road element on which demand exceeds capacityrdquo
The bottleneck analysis evaluates specific causes of existshying recurrent traffic congestion in the corridor Freeway bottleneck locations that create mobility constraints are identified and documented and their relative contribution
to corridor-wide congestion is reported The bottleneck locations were determined based on a combination of the use of 2006 PeMS data HiCOMP report probe vehicle tach runs and field observations
Traffic congestion can be categorized as either recurrent
or non-recurrent
recurrent congestion occurs repeatedly at the same place and time of day in a predictable pattern Recurrent congesshytion is often associated with facility capacity limitations changes in capacity conflicting vehicle movements such
as lane merges inadequate number of transit vehicles to handle passenger loads or other persistent physical condishytions of the transportation facility
Non-recurrent congestion is usually attributed to collishysions equipment malfunction community events weather construction projects and other occasional occurrences When transportation systems are close to their maximum
carrying capacity non-recurrent congestion is more likely to occur as there is little excess capacity in the system
The location and extent of the bottlenecks on US 50 found
in the aM and PM peak periods are summarized in Tables 14 and 15 These depictions should be considered a snapshyshot view and not a comprehensive analysis of all bottleshynecks in the corridor Further work is being conducted to
refine the identification and causality of bottlenecks within
the corridor Table 14 shows a summary of the US 50 eastbound bottlenecks while the tables that follow discuss each bottleneck including location and possible causality Table 15 shows a summary of the US 50 westbound bottleshynecks while the tables that follow discuss each bottleneck including location and possible causality Minor or hidden bottlenecks are those Freeway bottleneck
that are not as defined locations that create (or severe) as the major mobility constraints bottlenecks Please note are identified and that the graphics accomshy documented and their panying the bottlenecks
relative contribution to are not to scale
corridor-wide congestion Major bottlenecks in the is reported eastbound direction during the aM peak period are at Howe avenue and during the PM peak period are at 48th Street Howe Avenue Mayhew Road Routier Road Sunrise Boulevard and El Dorado Hills Boulevard Major bottlenecks in the westbound direction during the aM peak period are at El Dorado Hills Boulevard Hazel Avenue Zinfandel Drive
HigHway 50 corridor system management plan [ 47 ]
c h a p t e r s e v e n c o n g e s t i o n a n d b o t t l e n e c k a n a l y s i s
Bradshaw Road and Howe Avenue and major bottleneck
locations during the PM peak period are at Zinfandel Drive Routier Road Bradshaw Road Howe Avenue and Intershystate 5
Causalities for these bottlenecks range from high-traffic
demand (congestion) heavy weavingmerging areas or physical constraints such as lane drops lack of ramp meters incomplete HOV network incomplete Auxiliary Lane
network poorly coordinated traffic signals and an off-ramp
queue (Sunrise Boulevard) US 50 Westbound Onramp
TABLE 14 US 50 EASTBOUnD BOTTLEnECk SUmmARY Source PeMS Caltrans tach runs and
Cambridge Systematics field observations
bottleneck Location PeMS Speed Contours Caltrans Probe Vehicle Runs
Cause aM PM aM PM
A Jefferson Blvd PM 25 Minor Minor Traffic weaving truck volumes and grade
B 48th St PM 7 Minor Major Minor Minor Merge from SR 51 and SR 99
C Howe ave PM 9 Major Major Major weave between Howe and watt
D Mayhew Rd PM 12 Major Minor Major Weaving before Bradshaw Exit
E Routier Rd PM 14 Minor Major Weaving before Mather Field Rd Exit
F Sunrise Blvd PM 185 Minor Major Lane drop HOV add off-ramp queue
G Folsom Blvd PM 22 Minor Minor Lane drop 4 to 3
H El Dorado Hills Blvd PM 275 Major
Poorly coordinated traffic signal on arterial causes spillback onto freeway
a jefferson blvd bottleneck The bottleneck approximately located at Jefferson Blvd is due to weaving traffic as those entershying the freeway from Jefferson Blvd must cross those attempting to exit the freeway to I 5 There is a large number of trucks in the stream which struggle with the grade at this location exacerbatshying the bottleneck
[ 48 ] HigHway 50 corridor system management plan
c h a p t e r s e v e n c o n g e s t i o n a n d b o t t l e n e c k a n a l y s i s
b 48th St bottleneck The bottleneck approximately located at 48th St is due to the additional traffic merging from SR 51 and SR 99 combined with the eventual lane drop at 59th St This queue extends upstream past the off-ramp to SR 5199 These off-ramps are bottlenecks in themselves which spill back and choke the US 50 mainline
C Howe Ave Bottleneck The bottleneck at Howe ave is due to the entering traffic from Howe Ave Two Howe Ave on-ramps feed into US 50 eastbound southbound Howe ave loop on-ramp and northbound Howe ave direct ramp approximately 300 feet apart The watt avenue off-ramp is just down stream with heavy exiting volumes therefore the segment between Howe and watt is characterized by heavy weaving
D mayhew Rd Bottleneck The bottleneck approximately located at Mayhew Rd most likely begins with the additional traffic entering from Watt Ave and ends with the exiting traffic at Bradshaw Rd It is possible that there is a high proportion of weaving traffic with in this section (Watt Ave traffic moving to the left lane and those exiting at Bradshaw Rd moving to the right lane)
HigHway 50 corridor system management plan [ 49 ]
c h a p t e r s e v e n c o n g e s t i o n a n d b o t t l e n e c k a n a l y s i s
[ 50 ] HigHway 50 corridor system management plan
e routier rd bottleneck It is likely that the bottleneck at Routier Rd is due to the same merging conditions associated with Mayhew Rd The area is comprised of both residential and light industrialoffice land uses therefore during the PM peak period there are large volumes of vehicles entering at Bradshaw Rd moving to the left lanes and large volumes of vehicles moving to the right lane to exit at Mather Field Rd
f Sunrise blvd bottleneck At Sunrise Blvd the right-most lane exits while an HOV lane is added as the median lane The bottleneck is formed from vehicles shifting left to avoid exiting at Sunrise Blvd and to enter the HOV lane There is a large volume of vehicles queued at the Sunrise off-ramp which spills back and negatively affects the US 50 mainline
g folsom blvd bottleneck The right-most lane exits to Folsom Blvd leaving one HOV lane and two regular lanes along the US 50 The bottleneck is caused by this lane drop as well as the quick merge at the Folsom on-ramp
c h a p t e r s e v e n c o n g e s t i o n a n d b o t t l e n e c k a n a l y s i s
H The eastbound US 50 at El Dorado Hills Blvd Bottleneck The eastbound El Dorado Hills Blvd bottleneck is caused by a traffic signal on the arterial that often causes spillbacks on the EB loop offramp onto the freeway mainlines
TABLE 15 US 50 WESTBOUnD BOTTLEnECk SUmmARY Source PeMS Caltrans tach runs and Cambridge Systematics field observations
bottleneck Location PeMS Speed Contours Caltrans Probe Vehicle Runs
Cause aM PM aM PM
A El Dorado Hills Blvd PM 275 Major Poorly coordinated traffic
signal on El Dorado Hills Blvd
B Hazel Ave PM 21 Major Entering traffic
C Zinfandel Dr PM 16 Minor Major Major Major Entering traffic
D Routier Rd PM 14 Minor Major Minor Weaving traffic
E Bradshaw PM 13 Major Major Major Merging traffic and curve
F Howe Ave PM 9 Minor Major Major Major Weaving traffic and grade
G SR 51SR 99 PM 6 Minor Lane drop weaving traffic
H i-5 PM 3 Major Weaving traffic
HigHway 50 corridor system management plan [ 51 ]
c h a p t e r s e v e n c o n g e s t i o n a n d b o t t l e n e c k a n a l y s i s
[ 52 ] HigHway 50 corridor system management plan
A El Dorado Hills Blvd Bottleneck The minor bottleneck at El Dorado Hills Boulevard is caused by the traffic signal on El Dorado Hills Blvd that causes spillback on the westbound offramp onto the freeway mainlines
B Hazel Avenue Bottleneck In 2006 the Hazel Ave Bottleneck is caused by the traffic entering at both Hazel Ave and Folsom Blvd (the two on-ramps are separated by about one mile) The bottleneck that would appear at Folsom Blvd combines with the bottleneck at Hazel ave to form a large bottleneck that does not clear until after Hazel ave Sometimes causshying spillbacks as far as Prairies City Road this bottleneck was mitigated in 2007 as part of the GO CALIFORNIA program
C Zinfandel Dr Bottleneck There is heavy traffic coming from Sunrise Blvd but the lane addition immediately after the westbound on-ramp prevents a bottleneck from forming but as traffic flows westward the heavy traffic entering from Zinfandel Dr causes a bottleshyneck here
D Routier Rd Bottleneck The bottleneck at Routier Rd is caused by weaving traffic between Mather Field Rd and Bradshaw Rd This highway segment represents a transition area where vehicles that have been traveling in the left lanes begin to shift to the right lanes to exit while the entering traffic tries to shift to the left lanes
W eav in gLan e Dr o p
c h a p t e r s e v e n c o n g e s t i o n a n d b o t t l e n e c k a n a l y s i s
e bradshaw rd bottleneck The Bradshaw Rd bottleneck is caused by the entering traffic from Bradshaw Road the high truck volumes and the curve west of Bradshaw Two Bradshaw Rd on-ramps feed into US 50 westshybound southbound Bradshaw Rd direct on-ramp and northbound Bradshaw Rd loop on-ramp approximately 400 feet apart
F Howe Ave Bottleneck The Howe ave bottleneck is caused by a grade change and the weaving traffic entering from Howe ave and Hornet Dr competing for the right-most lane with those wanting to exit at 65th Street
G amp H SR 51SR 99 amp I-5 Bottleneck The bottleneck at I 5 is caused by the conflict between entering SR 99 and SR 51 traffic and exiting I-5 traffic as well as the queues formed on the ramps to i-5 which spill back onto US 50 The number of lanes in this section reaches a maximum of 6 and then drops to 4 as two lanes exit at the I-5 freeway This bottleneck is exacershybated during the peak periods when it stretches upstream to the lane drop before SR 99
W ea v in g
Lan e Dr o p
HigHway 50 corridor system management plan [ 53 ]

c h a p t e r o n e w h a t i s a C S M P
table of contents
Executive Summary 1 Chapter 1 what is a CSMP3 Chapter 2 Need Purpose goal and Objectives 9 Chapter 3 Current Corridor System Management Strategies 11 Chapter 4 Major Corridor Mobility Challenges 21 Chapter 5 Performance Measures 25 Chapter 6 Planned Corridor System Management Strategies 35 Chapter 7 Congestion and Bottleneck Analysis47
LiSt of figureS
Figure 1 US 50 CSMP Transportation Network 5 Figure 2 CSMP Corridors in District 3 8 Figure 3 Strategic Growth Plan Strategy 10 Figure 4 Existing Traffic Operations Systems Elements17 Figure 5 US 50 CSMP Network Transit Routes 18 Figure 6 US 50 CSMP Network Bicycle Routes 19 Figure 7 US 50 CSMP Network Bicycle Routes (Sacramento Insert) 20 Figure 8 US 50 AM Peak Period Bottleneck Locations 22 Figure 9 US 50 PM Peak Period Bottleneck Locations 22
LiSt of tabLeS
Table 1 US 50 CSMP Transportation Network6 Table 2 Existing US 50 TOS Elements 12 Table 3 Park and Ride Lots 14 Table 4 Current and Forecasted Traffic Data 23 Table 5 Performance Measures ndash Definitions and Applicability 26 Table 6 US 50 Performance Measures 29 Table 7 Parallel and Connecting Roadways Performance Measures 30 Table 8 Transit Performance Measure 33 Table 9 US 50 Concept LOS and Facility Type 37 Table 10 US 50 CSMP Strategies 38 Table 11 Key Capital Projects 40 Table 12 50 Mobility Partnership Key Capital Projects 44 Table 13 Visionary Projects 45 Table 14 US 50 Eastbound Bottleneck Summary 48 Table 15 US 50 Westbound Bottleneck Summary51
HigHway 50 corridor system management plan [ v ]
executive summary
Caltrans and its partners are taking a dynamic turn in transportation planning and operations with the creation of Corridor System Management Plans (CSMPs) for corshyridors associated with the Corridor Mobility improvement Account (CMIA) and Highway 99 Bond Program projects Californians rely on transportation facilities and services to get to business recreational and service destinations regardless of which agency may operate or fund a facility or service CSMPs are being developed to plan and manage transportation across modes and jurisdictional boundaries The CSMP approach is consistent with the goals and objecshytives of the governorrsquos Strategic growth Plan including public accountability for bond funded projects
The CSMP outlines a foundation to support the partnership based integrated corridor management of all travel modes (transit cars trucks bicycles) and infrastructure (rail tracks roads highways information systems bike routes) to provide mobility in the most efficient and effective man shyner possible This approach brings facility operations and transportation service provision together with capital projshyects into a coordinated system management strategy that focuses on high demand travel corridors such as Highway 50 (US 50)
This CSMP directly supports the implementation of the three CMIA projects in the US 50 corridor (1) High Occushypancy Vehicle (HOV) Lanes on US 50 from Watt Avenue to
Sunrise Boulevard (2) White Rock Road Expansion from
Grant Line Road to Prairie City Road and (3) HOV Lanes on
US 50 from El Dorado Hills Boulevard to Bass Lake Road
The objectives of the CSMP are to improve safety on the transportation system reduce
CSMPs are beingtravel time or delay on all
developed to planmodes reduce traffic congesshy
and managetion improve connectivity transportationbetween modes and facilities
improve travel time reliability across modes and expand mobility options and jurisdictional along the corridor in a cost efshy boundaries fective manner
The CSMP includes the following sections
bull Current Corridor System Management Strategies
bull Major Corridor Mobility Challenges
bull Performance Measures
bull Planned Corridor System Management Strategies
bull Congestion and Bottleneck Analysis
The US 50 CSMP Transportation Network includes US 50 from the US 50interstate 80 interchange in the City of West Sacramento to the US 50Cedar Grove exit in the El Dorado County community of Camino as well as select parallel roads transit services and bike routes
HigHway 50 corridor system management plan [ 1 ]
e x e c u t i v e s u m m a r y
[ 2 ] HigHway 50 corridor system management plan
Together these facilities comprise the CSMP managed network
Major mobility challenges along the corridor include highway and roadway traffic congestion a lack of parallel roadway capacity transit facilities approaching ridership capacity inadequate transit capital and operations fundshying needed to grow transit ridership an incomplete HOV network gaps and barriers within the bicycle network and lengthy barriers restricting cross corridor travel by all modes
Additionally the El Dorado County Transportation Commisshysion (EDCTC) has identified safety and operational issues
between the Smith Flat interchange and east of the Upper Carson RoadCamino intersection in the Camino Area Par-allel CapacitySafety Study including at-grade access to US 50 left turn conflicts across US 50 increasing local and
interregional traffic due to area growth a lack of alternate
routes seasonal traffic to and from Apple Hill and other local events and seasonal access to recreation in the Lake
Tahoe Region
The bottleneck analysis identifies major bottlenecks in the
eastbound direction during the aM peak period at Howe avshyenue and during the PM peak period at 48th Street Howe Avenue Mayhew Road Routier Road Sunrise Boulevard and El Dorado Hills Boulevard Major bottlenecks in the westbound direction during the AM peak period are at El Dorado Hills Boulevard Hazel Avenue Zinfandel Drive Bradshaw Road and Howe Avenue
and major bottleneck locations during the PM peak period are at Zinfandel Drive Routier Road Bradshaw Road Howe
avenue and interstate 5 Causes range from weaving entering and merging traffic lane drops poorly coordinated
traffic signals and an off-ramp queue (Sunrise Boulevard)
Existing highway operations data shows that for the US
50 corridor almost all segments are forecasted to opershyate under Level of Service (LOS) ldquoFrdquo conditions in 20 years
under the No-Build and Build scenarios However with the
implementation of operational strategies and key capital projects the severity and the duration of the traffic congesshytion can be significantly reduced
This CSMP identifies corridor management strategies to be
applied on a network wide basis To implement some of these strategies key capital projects are identified The list is not meant to be inclusive of all projects in the corridor rather the CSMP incorporates by reference all projects contained in the Sacramento area Council of governments (SACOG) Metropolitan Transportation Plan (MTP) and the
EDCTC Regional Transportation Plan (RTP)
The system will be continuously monitored using identified
performance measures and Traffic Operations Systems
(TOS) data and will be reported in an annual State of the
Corridor Report and subsequent CSMP updates This
information will be used to continually improve system performance
what is a CSMP
chapter one
a CSMP is a foundation document supporting the partner-
ship based integrated management of all travel modes
(transit cars trucks bicycles) and infrastructure (rail tracks roads highways information systems bike routes) in a corridor so that mobility along the corridor is provided in the most efficient and effective manner possible
CSMP success is based on the premise of managing a seshylected set of transportation components within a designatshyed corridor as a system rather than as independent units
Caltrans has traditionally prepared a Transportation Conshycept Corridor Report (TCCR) that served as the long range
planning document for US 50 The TCCR would identify existing route conditions and future needs including existshying and forecasted travel data concept LOS standard and
the facility needed to maintain the concept LOS over the
next 20 years With the development of the more compreshyhensive CSMP the need for a separate TCCR is eliminated This CSMP will serve as the TCCR for the segment of US
50 within the CSMP boundaries and includes information regarding the future facility needed to maintain an acceptshyable LOS (Concept LOS and Concept Facility see page 35)
The uS 50 CSMP transportation Network includes US 50 from the US 50interstate 80 interchange in the City of West Sacramento to the US 50Cedar Grove exit in the
El Dorado County community of Camino as well as select parallel roads transit services and bike routes Together
these facilities comprise the CSMP managed network as indicated in Figure 1 and Table 1
The parallel roadway transit and bike route components of the managed network were selected in consultation with the respective local agency it is anticipated that as the CSMP concept matures additional facilities will be added to the managed CSMP transportation network
The CSMP focuses on The CSMP focuses strengthening institushy on strengthening tional partnerships institutional partnerships gathering and analyzshy
gathering and analyzinging data monitoring
data monitoringsystem performance
system performanceimplementing opshyimplementing operationalerational strategies
and identifying and strategies and identifying implementing stra- and implementing tegic capital investshy strategic capital ments The CSMP will investments evolve with changing development patterns travel demands and technological innovations
HigHway 50 corridor system management plan [ 3 ]
c h a p t e r o n e w h a t i s a C S M P
[ 4 ] HigHway 50 corridor system management plan
An annual State of the Corridor Report will be produced to
document system performance and track CSMP implemenshytation progress and the CSMP will be updated every two years
CSMPs are being created for corridors associated with the Corridor Mobility Improvement Account (CMIA) and Highway 99 Bond Programs supported by the Highway Safety Traf-fic Reduction Air Quality and Port Security Bond Act of 2006 Proposition 1B Figure 2 shows the general location
of each of the CSMP corridors within the Caltrans District 3 area and identifies Proposition 1B projects associated with
the respective CSMP
Each CSMP identifies current system management stratshyegies existing travel conditions corridor performance
management management strategies and capital imshyprovements
The CSMP is consistent with The CSMP is the SACOG MTP the EDCTC consistent with the RTP city and county general
SACOG MTP theplans and regional blueprint
EDCTC RTP cityplanning The CSMP by refershy
and county generalence incorporates all projects plans and regionallisted in the current MTP and
RTP Because the CSMP is blueprint planning corridor focused it highlights key locations where modes interact and land use decisions may have the greatest potential of reducing the need for travel and influencing modal choice
CSMPs will assist in fulfilling the goals of recently enacted
legislation such as Assembly Bill 32 that addressed air quality and green house gas emissions and Senate Bill 375
that addresses land use by
bull Improving mobility on the state highway system to more optimum speeds to reduce vehicle emissions and
bull Providing viable transportation alternatives and accesshysibility across modes to encourage transit and bicycling and decrease single occupant auto use
The CSMP also supports Caltrans policies such as Deputy
Directive (DD) 64 Complete StreetsndashIntegrating the
Transportation System and DD 98 Integrating Bus Rapid
Transit into State Facilities by bringing many modes under the same active management effort thereby ensuring that each mode is analyzed and optimized to work together
The CSMP is based on technical information depicted in four supporting working papers
bull working Paper 1 provided an overview of the corridor system management planning process and a definition of the CSMP transportation network including a ratioshynale for the selection of the specific corridor limits and modes to be included in the corridor planning process
bull working Paper 2 defined current services being proshyvided by the CSMP transportation network proposed performance measures for the corridor and provided baseline data regarding the current CSMP transportashytion network for the proposed performance measures
bull working Paper 3 described existing corridor manageshyment activities including all facilities and services curshyrently in use to maximize mobility within and through the corridor such as traffic operations systems elements facilities such as high occupancy vehicle lanes traveler information services and transportation demand manshyagement programs
bull working Paper 4 provided an assessment of current corridor performance by identifying the major problems inhibiting efficient corridor operations for each element (mode) of the CSMP transportation network
Sacramento Regional Transit Bus with Bicycle Racks
5
W STX ST
WATT AVE
MAROCKINGHAM
DR
OLD PLACER
BRADSHAW RD
VILLE RDTHER FIELD RD
INTERNA TIONAL DR
ZINF ANDEL DR
WHITE ROCK RD FOLSOM BLVD FOLSOM BLVD
SUNRISE BLVD BLU
E RAV
INE R
D
WHITE ROCK RD
SC
OTT R
D
PR
AIR
IEC
ITY R
D
SCOTT RD
GREEN V ALLEY RD
PLACER VILLE DR
FORNI RDM
AIN ST
BROADWAY
CEDAR GROVE EXIT
c h a p t e r o n e w h a t i s a C S M P
Figure 1 US 50 CSMP Transportation Network
Highway 50 Corridor Auburn System Management Plan
193 Transportation Network
US Highway 50 (I-80 to Cedar Grove Exit) 193 80
CSMP Parallel Roads
Light Rail STation Loomis 49
Light Rail
Current HOV Coverage
Express Bus Service Placerville
Corridor Mobility Improvement Account
Class I Bikeways Other State Highways
County Lines Folsom
50
80 HOV Lanes El Dorado Hills Blvd to Bass Lake Rd
HOV Lanes Watt Ave Sacramento to Sunrise Blvd
50 White Rock Rd Expansion Grant Line80 Rd to Prairie City RdWest
Rancho Cordova
4 9
1 6
Sacramento
5 99
84 160
Elk Grove 0 1 2 3 4 5
49 Miles 124 10
HigHway 50 corridor system management plans [ 5 ]
c h a p t e r o n e w h a t i s a C S M P
Table 1 US 50 CSMP TranSPorTaTion neTwork
location US 50 ParallelConnecting roadways Mass Transit bike routes
Heavy rail and light rail bus
route From To County City From To roadway From To operator
Services From To operator
Services From To
yolo City of west Sacramento interstate 80 yoloSacramento
County Line west Capitol Enterprise Boulevard Capitol Mall yCTD 39
Davis Express
west Sacramento
Davis Sacramento west Capitol
avenue yolo
Causeway Tower Bridge
Sacramento City of Sacramento
yoloSacramento County Line
State Routes 99 and 51 wX Streets 5th Street 26th Street RT Downtown
Sacramento Folsom
RT 109 Express
Downtown Sacramento Hazel ave Jedediah Smith Memorial Trail
State Routes 99 and 51 watt avenue mdash mdash mdash
amtrak Capital Corridor
(intercity Rail)
401 i Street Sacramento
auburn CaSan Jose Ca
amtrak Thruway Bus
401 i Street Sacramento
Main Street Placerville
Sacramento UnincorporatedCity of Rancho Cordova
watt avenue Zinfandel Drive
Folsom Boulevard watt avenue Sunrise Boulevard RT Downtown Sacramento Folsom RT 72 Mather Mills
LRT Station watt-Manlove LRT Station Jedediah Smith Memorial Trail
watt avenue Folsom Boulevard US 50
RT Downtown Sacramento Folsom RT 21 Mather Mills
LRT Station Louis Ln
Orlando ave Jedediah Smith Memorial Trail
Bradshaw Road Folsom Boulevard Old Placerville Road
Old Placerville Road Bradshaw Road Rockingham Drive
Rockingham Drive Old Placerville Road Mather Field Road
Mather Field Road Rockingham Drive Zinfandel Drive
Zinfandel Drive international Drive Folsom Boulevard
white Rock Road Zinfandel Drive Sunrise Boulevard
Sunrise Boulevard US 50 Folsom Boulevard
Zinfandel Drive Sunrise Boulevard
white Rock Road Sunrise Prairie City
RT Downtown Sacramento Folsom RT 109
Express Downtown
Sacramento Hazel ave Jedediah Smith Memorial Trail
Folsom Boulevard Sunrise iron Point Road
Notes F = Freeway E = Expressway RT = Sacramento Regional Transit District EDT = El Dorado Transit and FSL = Folsom Stage Lines LR = Light Rail EB = Express Bus LT = Limited LRF = Light Rail Feeder YCTD = Yolo County Transportation District FTS = FairfieldSuisun Transit System UCD = UC Davis Medical Center Shuttle
HigHway 50 corridor system management plans [ 6 ]
c h a p t e r o n e w h a t i s a C S M P
Table 1 US 50 CSMP TranSPorTaTion neTwork (ConTinUed)
location US 50 ParallelConnecting roadways Mass Transit bike routes
Heavy rail and light rail bus
route From To County City From To roadway From To operator
Services From To operator
Services From To
Sacramento
UnincorporatedCity of Folsom
Sunrise Boulevard
Folsom Boulevard
iron Point Road Folsom Boulevard East BidwellScott Road
RT Downtown Sacramento Folsom
iron Point Road Folsom Boulevard Empire Ranch
Scott Road iron Point Road white Rock Road Blue Ravine Road
Folsom Boulevard
green Valley Road
Sacramento Folsom Boulevard
Sacramento El Dorado
County Line
Folsom Boulevard iron Point Road Blue Ravine Road
green Valley Road
SacramentoEl Dorado County
Line
Cameron Park Drive
Blue Ravine Road Folsom Boulevard green Valley Road
Prairie City Road US 50 white Rock Road ED County Transit
authority-iron Point Connector
iron Point Light Rail Station
Missouri Flat Transfer
Center white Rock Road EDSac County Line
Sacramento El Dorado County Line
El Dorado Na Sacramento
El Dorado County Line
Cameron Park Drive
green Valley Road Blue Ravine Road Cameron Park Drive
ED County Transit
authority-Sacramento Commuter
El Dorado County
Sac County
green Valley Road
Cameron Park Drive
Placerville Drive
white Rock Road EDSac County Line Latrobe Road
white Rock Road Latrobe Road Silva Valley Parkway
Silva Valley Parkway white Rock Road Serrano Parkway
El Dorado Na Cameron Park Drive
Missouri Flat Road
green Valley Road Cameron Park Drive Missouri Flat Road
ED County Transit
authority
Cambridge Road
Missouri Flat Road
Ray Lawyer Drive
Placerville Drive Forni Road
Durock Road Cameron Park Drive South Shingle Road
Cameron Park Drive Durock Road US 50
Forni Road Ray Lawyer Drive Forni Road
South Shingle Road Durock Road US 50
El Dorado Na Missouri Flat Road
End of Freeway in Placerville
green Valley Road Missouri Flat Road Placerville Drive
ED County Transit
authority
Missouri Flat Road
Placerville Drive
Main Street Forni Road Clay Street Forni Road Placerville Drive Main Street
Placerville Drive Forni Road US 50
El Dorado Placerville End of Freeway in Placerville
Bedford avenue Start of
Freeway Main Street Placerville Drive Bedford avenue
ED County Transit
authority
Placerville Drive SR 49 ED Bike Trail Clay Street Los Trampas
Road
El Dorado Na Bedford
avenue Start of Freeway
Cedar grove Exit
Main Street Bedford avenue Broadway amtrak
Thruway Bus
Mosquito Road
Placerville
401 i St Sac CaCarson
City Ca Broadway Main Street Point View Drive
HigHway 50 corridor system management plans [ 7 ]
WHITE ROCK RD
c h a p t e r o n e w h a t i s a C S M P
Figure 2 CSMP Corridors in District 3
Corridor System Management Plan
Corridors in District 3 Interstate 80 I-80 between SR 113 and Sierra College Boulevard SR 51 between Highway 50SR 99 and I-8020
Highway 5053 Between I-80 and Cedar Grove Exit
Interstate 5 amp State Route 99 I-5 between Hood-Franklin Rd and State Route 113 SR 99 between San Joaquin County Line and Highway 50 SR 99 between I-5 and SR 20
State Route 99 North29 Between Southgate and Esplanade (in Chico area see inset)
State Route 49 Between I-80 and SR 20
State Route 65 Between I-80 and SR 70
CMIA and State Route 99 Bond Projects
20
Colusa
20
Yuba City Marysville
Grass Valley
La Barr Meadows Widening Project
49 80
Widen to 4 Lanes SR 70 to Feather River Bridge
99
70 Wheatland
65
113 Lincoln Bypass
5
Construct Interchange Operations Improvements Placerville at Elverta Rd HOV Lanes El Dorado
Hills Blvd to Bass Lake Rd
80 Folsom Woodland Rancho 50
Auburn Lincoln
Construct Interchange at Riego Rd Rocklin 49
99 Roseville Roseville Capacity and
Cordova 113 49 505 Sacramento 51
99 Chico Add Auxiliary Lanes
SR 32 to 1st Ave
32 Davis 80
West Sacramento
5
HOV Lanes Watt Ave to Sunrise Blvd
Operational Improvements Mack Rd to Florin Rd
White Rock Rd Expansion Grant Line Rd to Prairie City rd
29 221
113
99
0 105 2 3 4 5 Miles
Galt 0 5 10 15 20
Miles
HigHway 50 corridor system management plans [ 8 ]
need purpose goal and objectives
chapter two
There is a need for a planning approach that brings facility operations and transportation service provision together with capital projects into one coordinated system manageshyment strategy that focuses on high demand travel corridors such as US 50
a CSMP is needed for the US 50 corridor to address severe traffic congestion that often exceeds the capacity of existshying facilities transit ridership demands that exceed the
capacity of the transit system and bicycle facilities that do not provide a fully linked network of bike routes
The purpose of the CSMP is to create a partnership planshyning process that focuses on system management strateshygies and coordinated capital investments so that all the pieces of the corridor function as an efficient transportashytion system and performance evaluation measures are implemented to track the effectiveness of strategies and projects
the CSMP directly supports the implementation of the
three CMia projects on the corridor
bull High Occupancy Vehicle (HOV) Lanes on US 50 from Watt avenue to Sunrise boulevard
bull White Rock Road Expansion from Grant Line Road to Prairie City road
bull HOV Lanes on US 50 from El Dorado Hills Boulevard to bass Lake road
The goal of the CSMP is to improve mobility along the US 50 corridor by focusing on the integrated management of a
subset of the entire transporta- The CSMP directly tion network within the corshy supports the ridor including select freeway implementation and parallel roadways transit
of the three CMIA and bicycle components of the
projects in thecorridor corridor
The objectives of the CSMP are to reduce travel time or delay on all modes improve
connectivity between modes and facilities improve travel
time reliability improve safety on the transportation system and expand mobility options along the corridor in a cost effective manner implementation of the CSMP will increase access to jobs housing and commerce
consistency with other state transportation plans anD policies The CSMP approach is consistent with the goals and objectives of the governorrsquos Strategic Growth Plan which among other things commits to minimizing increases in traffic congestion Key elements of the strategy are illusshytrated in Figure 3
at the base of the pyramid and the foundation of transshyportation system management is system monitoring and evaluation it is essential to understand what is happening on the transportation system so that the best decisions can be made based on reliable data The next few layers up
the pyramid are focused on making the best use of existing
resources and reducing the demand for transportation
HigHway 50 corridor system management plan [ 9 ]
c h a p t e r t w o n e e d p u r p o s e g o a l a n d o b j e c t i v e s
[ 10 ] HigHway 50 corridor system management plan
particularly during peak travel hours The top layer of the pyramid is system expansion This layer assumes that all the underlying components are being addressed and that system capacity expansion investments are necessary
Corridor system management is consistent with the Caltrans Mission
Improve Mobility Across California Corridor system management is consistent with Caltransrsquo goals
bull SafetY Provide the safest transportation system in the nation for users and workers
bull MobiLitY Maximize transportation system performance and accessibility
bull DELIVERY Efficiently deliver quality transportation projshyects and services
bull STEWARDSHIP Preserve and enhance Californiarsquos resources and assets
bull SERVICE Promote quality service through an excellent workforce
The CSMP is also consistent with the California Transportashytion Plan (CTP) the statewide long-range transportation
plan for meeting future mobility needs The CTP defines
goals policies and strategies to achieve our collective vishysion for Californiarsquos future transportation system
Figure 3 Strategic Growth Plan StrategyAir
Quality Planning Corridor System Management seeks to create conditions where vehicle flow on highways and roads occurs at a
steady pace and travelers have a range of mobility options that enable them to travel other than by single occupant vehicle System expansion is focused only where needed
when travel demand exceeds the capacity of the well manshyaged existing system These conditions are beneficial to
attaining air quality goals and reducing green house gas emissions
current corridor system management strategies
chapter three
US 50 is a transcontinental highway that originates in west Sacramento California and terminates in Ocean City Maryland it is a key transportation artery connecting yolo County Sacramento County and fast growing sub regions within Sacramento and El Dorado Counties
The corridor provides access to world renowned recreation areas in the Sierra Nevada Mountains and Lake Tahoe
Basin Peak commute and recreational travel periods are
heavily congested with demand for travel often exceedshying the capacity of existing facilities and services Severe
traffic congestion is common and commute transit services
often operate at maximum ridership capacity There is
extensive and expanding urban development along many parts of the corridor which suggests increased future transportation demand
Given the complexity of the corridor and its extensive geoshygraphic range there are a wide variety of system manageshyment strategies and elements currently being implemented by jurisdictions and transportation service providers Strategies and elements range from vehicle detection deshyvices to traveler information systems to traffic flow control mechanisms a common element among all the strategies and elements is data collection and analysis There is presshyently some system management coordination and intershyjurisdictional partnerships among the entities such as the Sacramento Transportation Area Network (STARNET)
The STARNET web application initial release is anticipated
for the late fall of 2009 Features to be included in the
initial release will include Changeable Message Sign (CMS) display a chain control application integration of Regional Transit data California Highway Patrol incident data connectivity to the 511 systems (web and telephone) Closed Circuit Television (CCTV) display and interagency messaging and coordination [Caltrans Transportation Management Center (TMC) Kingvale Operation Center City of Sacramento Traffic Operation Center (TOC) Sacramento
County TOC Roseville TOC and Elk Grove TOC] STARNETrsquos
associated management There are a widestrategies can and will variety of systemevolve as the application is
implemented throughout management
the region and as addi- strategies and tional features are added elements currently in annual releases being implemented
by jurisdictions and state highway sys-
tem transportation service
providerswith the construction of Californiarsquos state highshyway system virtually complete in the Sacramento region Caltransrsquo major emphasis on highway projects has largely shifted from new construction to focused capacity expanshysions reconstruction operation and maintenance of existshying facilities
The State Highway System has an extensive set of system
management strategies in operation Some cities coun-
HigHway 50 corridor system management plan [ 11 ]
c h a p t e r t h r e e c u r r e n t c o r r i d o r s y s t e m m a n a g e m e n t s t r a t e g i e s
tabLe 2 exiStiNg uS 50 toS eLeMeNtS
County Location PM toS elements
tMS rM HAR rWiS CMS eMS VS CCTV WiM
yolo i-80 to yoloSaC County Line
000 - 316 4 ndash ndash 1 1 ndash ndash 2 2
SaC
YoloSAC County Line to SR99 SR51
L000 - L248 R000
8 7 ndash ndash 3 ndash ndash 7 ndash
SR99SR51 ndash Watt Avenue R000 ndash R534 5 8 ndash ndash 1 1 ndash 3 ndash
watt avenue to Zinfandel Drive R534 ndash R1092 8 7 1 ndash ndash 2 ndash ndash ndash
Zinfandel Drive to Sunrise Blvd R1092 ndash 1250 1 4 ndash ndash ndash 1 ndash ndash ndash
Sunrise Blvd to Folsom Blvd 1250 ndash 1701 4 6 ndash ndash ndash ndash ndash 2 ndash
Folsom Blvd to SACED County Line
1701 ndash 2314 2 8 ndash ndash 1 ndash 1 ndash ndash
ED
SACED County Line to Cameron Park Dr 000 ndash R657 5 ndash ndash ndash 1 ndash 2 ndash ndash
Cameron Park Dr to Missouri Flat Rd R657 ndash R1506 7 ndash ndash ndash ndash ndash ndash ndash ndash
Missouri Flat Rd to End of Freeway R1506 ndash 1725 1 ndash ndash ndash ndash 1 ndash ndash ndash
ED End of Freeway to Bedford Ave 1725 ndash 1811 ndash ndash 1 ndash ndash ndash ndash ndash ndash
ED Bedford Ave to Cedar Grove Rd 1811 ndash R2595 ndash ndash ndash ndash 1 1 ndash ndash ndash
totaL 45 40 2 1 8 6 3 14 2
Notes PM = Post Mile TMS = Traffic Monitoring Station RM = Ramp Meter HAR = Highway Advisory Radio RWIS = Roadside Weather Information System CMS = Changeable Message Sign EMS = Extinguishable Message Sign VS = Visibility Sensor CCTV = Closed Circuit Television System WIM = weigh in Motion Existing TOS Elements as of April 2009
ties and transit operators also have robust system manshyagement elements and programs applied to their facilities or services
There are also specific instances of system management linkages among transportation modes and services at particular locations
Existing management strategies are depicted on Figure 4
and summarized in Table 2
US 50 BusCarpool Lanes in El Dorado County
[ 12 ] HigHway 50 corridor system management plan
c h a p t e r t h r e e c u r r e n t c o r r i d o r s y s t e m m a n a g e m e n t s t r a t e g i e s
These strategies work as a system to gather analyze and disseminate information through the Caltrans TMC inforshymation about collisions other incidents road closures and emergency notifications are fed into this information hub
and disseminated to public and private information users The TMC operates 24 hours a day seven days a week
parallel anD connecting roaDways City of West Sacramento has one CCTV located on west Capitol Avenue between Enterprise Boulevard and Capitol Mall
City of Sacramento operates a TOC Sensors in the street detect the passage of vehicles vehicle speed and the level of congestion
This information is received on a second-by-second (real-time) basis and is analyzed at the TOC
Sacramento County also operates a TOC by gathering information through CCTV cameras CMS HAR and a Fiber Optics (FO) network placed along major traffic
corridors throughout the county
City of rancho Cordova will be installing CCTV cameras and a FO network on Folsom Boulevard in 2009 Currently one CCTV exists on Sunrise Boulevard
between US 50 and Folsom Boulevard Most major traffic corridors are on the network or will be by the end of 2009 The City contracts with the County of Sacramento to operate their systems through the Countyrsquos TOC
City of folsom recently completed installing a FO system
Changeable Message Sign on US 50 at Scott Road
on all of the Cityrsquos major corridors Currently the sole intersection that is monitored via camera is located on iron Point Road and East Bidwell
El Dorado County has three coordinated signals along Francisco Drive at Green Valley Road the Market Place
entrance (east side Safeway Centerwest side Lake
Forest Plaza) and Village Center Drive
City of Placerville utilizes traditional control devices traffic signals and stop signs
transit anD riDesharing Yolo County Transit District (YCTD) uses a Global Positionshying System (GPS) for locating buses in route referred to as
an Automatic Vehicle Location (AVL) system
The AVL System allows users to see where their bus is
located within the last minute
El Dorado Transit Authority utilizes the gPS Zonar System for pre-trip inspections maintenance and real-time vehicle tracking
Sacramento Regional Transit District (SacRT) has in shystalled pre-emptive traffic signals at at-grade intersections
along the Light Rail routes SacRT has a GPS however it is only utilized for analysis purposes
Computer-aided dispatch and Bus Rapid Transit are in
the planning stages In addition SacRT has an online Trip
Planning application to assist transit users During special events such as the California State Fair the Jazz Festival
65th Street Light Rail Station and Transit Oriented Development
HigHway 50 corridor system management plan [ 13 ]
c h a p t e r t h r e e c u r r e n t c o r r i d o r s y s t e m m a n a g e m e n t s t r a t e g i e s
TABLE 3 PARk AnD RIDE LOTS
County Post Mile Facility name Description
Lot use transit Connection
Spaces Spaces occupied
occupancy Rate () Provider and route No
SaC 70 Butterfield Sacramento Regional Transit Gold Line Station
406 129 318 SacRT SacRT LRT Gold Line
SaC 125 Sunrise Sacramento Regional Transit Gold Line Station
487 389 799 RSacRT SacRT LRT Gold Line
SaC 158 Hazel 432 135 306 SacRT SacRT LRT Gold Line
SaC 158 Hazel 33 6 24 SacRT Route 109
SaC 171 Folsom Boulevard 70 58 829 ED Iron Point Connector SacRT LRT Gold Line
ED 2 El Dorado Hills (Latrobe RoadWhite Rock Road) 123 138 1122 ED Iron Point Connector ED Routes
156781112
ED 5 Cambridge Road 59 40 678 ED Iron Point Connector ED Routes 14567891112
ED 86 Ponderosa Road Northeast 28 15 536 ED Iron Point Connector ED Routes 23679101112
ED 86 Ponderosa Road Northwest 111 61 55 ED Iron Point Connector ED Routes 23679101112
ED 86 Durock Road 57 21 368 Na
ED 149 Shingle Springs Drive 19 4 211 Na
ED 122 Greenstone Road 21 4 19 Na
ED 15 Missouri Flat Road 73 44 603 ED Iron Point Connector
ED 158 Fairgrounds Park-and-Ride 200 40 20 ED Iron Point Connector
ED 185 Placerville Station (Mosquito Park- and-Ride) 130 50 385 ED Iron Point Connector
ED Commuter Service
ED 233 Camino Heights 24 1 42 Na
SacRT = Sacramento Regional Transit District ED = El Dorado County Transit Authority Lrt = Light rail train
Survey 2007
the holiday seasons and the Mather Field Air Show SacRT
operates additional service to connect events to light rail stations and offer free service to promote transit use durshying select events The transit routes identified in the CSMP
network are shown in Figure 5
The Sacramento Valley Station in downtown Sacramento is
the 7th busiest station in the national amtrak system and serves as a multi-modal transfer facility There are over 11 million passenger trips annually
Passengers can make connections with numerous local bus services as well as the SacRT light rail system
[ 14 ] HigHway 50 corridor system management plan
c h a p t e r t h r e e c u r r e n t c o r r i d o r s y s t e m m a n a g e m e n t s t r a t e g i e s
Try Transit Changeable Message Sign in Sacramento County
Sacramento County installed pre-emptive traffic signals to give preferential signal timing to transit buses at selected locations that serve high priority transit corridors
SACOG manages the 511 and rideshare programs that cost approximately $1 million per year region-wide to foster carpooling transit ridership vanpooling and bicycling in all areas and corridors The Regional Rideshare Program covers Placer El Dorado Sacramento yolo yuba and Sut-ter counties it is part of a statewide network of rideshare agencies which encourage alternative transportation modes for traveling
Park and Ride lots are located adjacent to or nearby the US 50 corridor utilized by commuters to connect with transit vanpool or carpool Of the sixteen lots many are adjacent to the SacRT Light Rail gold Line providing access for commuters to park their vehicles and commute the re-mainder of their trip via Light Rail El Dorado County Transit authority also uses the park and ride lots as transit stops for their Commuter Buses The locations capacity and occupancy rates of the Park and Ride lots are displayed in Table 3
Bicycle Facilities Bicycle facilities in the corridor are not actively managed in the same manner as motor vehicle facilities
However there are traffic operation systems that serve bicyclists such as dedicated bicycle lanes bicycle detec-tion loops at signalized intersections video detection other non-loop type detection and bicyclist activated signal change buttons The City of Sacramento is installing video detection at some locations
SacRT buses and the new light rail trains are equipped with bicycle racks There are over 170 weatherproof bicycle lock-ers at 23 light rail stations yCTD has the Bikes on Buses Program that allows bicycles to travel on any yOLOBUS
The Sacramento area Bicycle advocates maintain an on-line hazard reporting system to allow users to report hazardous locations for bicyclist such as potholes inad-equate signal timing hazardous railroad crossings insuf-ficient shoulder and inadequate bikeway markings The reports are then sent to the applicable jurisdiction SaCOg is creating an on-line route planning system for bicyclists in addition SaCOg maintains bicycle maps on their website which are currently being updated
The bicycle routes included in the CSMP network are shown on Figures 6 and 7
Pedestrian Facilities Pedestrian facilities are not included as part of the man-aged network because they do not directly provide corridor mobility However complete and safe pedestrian access to appropriate corridor modes such as bike routes and transit services is an important component of corridor system management Therefore subsequent updates of the CSMP will seek to identify key pedestrian facilities and barriers to pedestrian mobility with regard to access and modal con-nectivity
HigHway 50 corridor system management plan [ 15 ]
c h a p t e r t h r e e c u r r e n t c o r r i d o r s y s t e m m a n a g e m e n t s t r a t e g i e s
[ 16 ] HigHway 50 corridor system management plan
Page Inte
ntionally
Left
Blank
MAIN ST
MA
RB
LE V
ALL
EY
RD
65TH ST EXPY
FLYING
C R
D
STATE
HW
Y 16
MA
RB
LE VA
LLEY R
D
CAM
BRID
GE R
D
GREEN VALLEY RD
RIV
ERSI
DE
BLVD
11T
H S
T
RIV
ERSI
DE
BLVD
HO
WE
AV
E
EL DORADO
HILLS BLVD
EL DORADO H
ILLS BLV
D
HORNET DR
JEFF
ERSO
N BL
VD
CAM
ERO
N PAR
K DR
PO
WE
R IN
N R
D
CO
UN
TY HW
Y E3
BRADSHAW RD
MATHER FIELD RD
ZINFAN
DEL D
R
11TH
ST
VD
FOLSOM BLFOLSOM BLVD
FOLSOM BLVD
FOLSO
M BLVD
WHITE ROCK RD
FOLSOM BLVD
FOLS
OM
BLV
D
LATRO
BE RD
CANAL ST
16TH
ST
JACQ
UIER
RD
15TH
ST
HARBOR BLV
D
STOCKTON BLVD
FORNI RD BIDW
ELL DR
WATT AVE
PLACERVILLE DR
TOW
ER G
ATEW
AY
SHIN
GLE SPR
ING
S DR G
REEN
STON
E RD
59TH
ST
SUN
RISE BLVD
EL D
OR
AD
O R
D
HAZEL AVE
SOUT
H RI
VER
RD
PON
DER
OSA R
D
SHIN
GLE SPR
ING
S RD
SHIN
GLE
SPR
ING
S R
D
CARSON RD
MISSO
URI FLAT RD
BASS LAKE RD
N SH
ING
LE RD
PRAIR
IE CITY R
D
S SHIN
GLE R
D
SHIN
GLE
RD
SCOTT RD
W S
T AT
5TH
ST
65TH
ST
5TH
ST
X
ST A
T 27
TH
80
CEDAR GROVE EXIT
MO
SQU
ITO R
D
PLACERVILLE DRMISSOURI
FLAT RD
FORNIRD
EL D
OR
AD
OR
D
POIN
T VIEW D
RSM
ITH FLAT R
D
SCH
NELL SC
HO
OL R
D
MO
NTER
EY RD
c h a p t e r t h r e e c u r r e n t c o r r i d o r s y s t e m m a n a g e m e n t s t r a t e g i e s
Figure 4 Existing Traffic Operations Systems Elements
Highway 50 Corridor Systems Management Plan Existing Traffic Operations Systems Excluding Ramp Meters
TOS ndash Traffic Operations Systems
Stations Continuous Coverage
EMS ndash Extinguishable Message Sign WIM ndash Weigh-in-Motion Location (EMS Usually Refers Motorist to HAR)
Television System
19365TMS ndash Traffic Monitoring99 US Highway 50VS ndash Fog (Visibility) Sensor
CCTV ndash Closed Circuit
I-80 to Cedar Grove Exit HAR ndash Highway Advisory Radio Local Road Interchange Access
White Rock RdRWIS ndash Roadside WeatherCMS ndash Changeable Sunrise Blvd to Latrobe Rd
Message Sign Information System
50
80
51
49 160
50
Placerville to Cedar Grove Exit
50
1935
16 49
99
84 160
49 MilesMiles 0 1 2 3 4 50 1 2 3 4 5 10
HigHway 50 corridor system management plans [ 17 ]
124 49
MOTHER LODE DR
MATHER FIELD RD
West Terminus
RAMP
RAMP
RAMPRAMP
RAM
P
RAMP
RAM
P RAMP
RAMPRAMP
RA
MP
RAM
P RAM
P
RAMP
RAM
P
RAM
P
RA
MP
RAM
P
RAM
P
YoloBus Express Routes Plus Routes 42A and 42B
RAMPBROADWAY
65TH
ST
PCE
65
SCRY42A
Y44Y4343
242 IPC
5
W STX ST
WATT AVE
MAROCKINGHAM
DR
OLD PLACER
BRADSHAW RD
VILLE RDTHER FIELD RD
INTERNATIONAL DR
ZINFANDEL DR
WHITE ROCK RD FOLSOM BLVD FOLSOM BLVD
SUNRISE BLVD
BLUE R
AVIN
E RD
WHITE ROCK RD
SC
OTT R
D
PR
AIR
IEC
ITY R
D
LATROBE RD
GREEN V ALLEY RD
PLACERVILLE DR
FORNI RDM
AIN ST
BROADWAY
CEDAR GROVE EXIT
WEST
CAPTOL AVE
(WESTMOST
STOP)
(WESTMOST STOP)
SCR
SCR
IPC
IPC
c h a p t e r t h r e e c u r r e n t c o r r i d o r s y s t e m m a n a g e m e n t s t r a t e g i e s
Figure 5 US 50 CSMP Network Transit Routes
Highway 50 Corridor System Management Plan 80
CSMP Commuter Transit Network
El Dorado County Transit Authority 65
IPC Iron Point Connector
SCR Sacramento Commuter Route 193
Sacramento Regional Transit District 109ndashHazel Express
Yolo Bus (Express) Y43 Y44 Y230 Y231 and Y232
Yolo Bus (All-Day Intercity amp Airport Service) Y42A (Clockwise) Y42B (Counter-clockwise)
LATROBE RD
Park-and-Ride Lots
193 65
49 US Highway 50 (I-80 to Cedar Grove Exit)
Parallel Roads
Light Rail STation
Light Rail
Class I Bikeways Other State Highways
County Lines
80
49
50
80160
50
5 84 16
4999
Miles 0 5 10160
HigHway 50 corridor system management plans [ 18 ]
K
5
FOLSOM BIKE TRAIL
SEE CENTRAL CITY BICYCLENETWORK MAP FOR BICYCLE
F ACILITY NAMES
AMERICAN RIVER PARKWAY TRAIL SYSTEM
(INCLUDING JE
DEDIAH SMITH MEMORIAL T
RAIL)
FOLSOM BLVD
WHITE ROCK RDSIL V A V ALLEY PKWY
EL D
OR
AD
O H
ILLS B
L VD
GREEN VALLEY RD
AMERICAN R
IVER PARKWAY
TRAIL
SYSTEM
(INCLU
DING JE
DEDIAH SMITH
MEMORIA
L TRAIL)
NATOMA ST
FOLSOM BLVD
EL DORADO TRAIL
CARSON RD
PLACER VILLE RD
RAY
LAW
YER
DR
c h a p t e r t h r e e c u r r e n t c o r r i d o r s y s t e m m a n a g e m e n t s t r a t e g i e s
Figure 6 US 50 CSMP Network Bicycle Routes
Highway 50 Corridor System Management Plan
Bicycle Route Network
Class I Bicycle Facilities
Class II Bicycle Facilities
193
Lincoln
65
Rocklin
Auburn
Folsom 49
193
Light Rail Stations
Light Rail Loomis50
RosevilleUS Highway 50 CSMP Corridor
Other State Highways Miles
County Lines 0 1 2 3
99
49 80
50
160 80 193
Placerville 50
West Rancho 50 Sacramento Cordova
5 0 49
8 4
9 9 Sacramento
1 6 4 9
0 1 2 Miles
3
1 6 0 Elk Grove 210 210 44 66 88
Miles 10 Miles
10 1 2 4
4 9
HigHway 50 corridor system management plans [ 19 ]
13TH
ST
H ST E ST BELVEDERE AVE
51ST
ST
BROADWAY H ST
48TH
ST
11TH
ST
PO
WE
R IN
N R
D
28TH
ST
STOC
KTON
BLVD3R
D ST
ALH
AMBR
AFR
ON
T BLV
D S
T
W CAPITOL A VE
DISCOVER Y
P ARK BRIDGE
JEDED
IAH
N ST
T ST
K ST
11TH
ST
RIV
ERSI
DE
BLV
D
18TH
ST
R S
T17
TH S
TO
ST
18TH
ST
20TH ST
CAPITOL AVE
T ST
28TH
ST
34TH
ST
39TH
ST
M ST
BROADWAY
T ST
FOLSOM BLVD
58TH
ST
J ST
65TH
ST
CSU
S
CO
NN
ECTIO
NS
SR 16JACKSON HWY
FOLSOM BLVD
LA RIVIERA DR
W ATT AV
E
HO
WE A
VE
GUY W
EST B
RIDE
COLLEGE TOWN DR
c h a p t e r t h r e e c u r r e n t c o r r i d o r s y s t e m m a n a g e m e n t s t r a t e g i e s
Figure 7 US 50 CSMP Network Bicycle Routes (Sacramento Insert)
5 Sacramento
8 0
8 0
160
West Sacramento
80
SMITH MEMORIAL TRAIL
50
US Highway 50 Corridor System Management Plan 50
Central City Bicycle Route Network 50
Bikeway and Multi-Use Network
US Highway 50 (I-80 to Cedar Grove Exit)
Class I Bicycle Facilities
Class II Bicycle Facilities
Connecting Routesndashno Bicycle Designation
80 16 5
BROADWAY
FLOR
IN-P
ER
KIN
S R
D
Light Rail STation 99
Light Rail
Other State Highways
County Lines
HigHway 50 corridor system management plans [ 20 ]
major corridor mobility challenges
chapter four
High demand for mobility services especially during peak commute periods is creating significant traffic congestion
and impairing mobility in the corridor Heavy congestion and stop-and-go traffic contributes to increased vehicle
emissions and added travel costs Many transit services are operating at maximum passenger carrying capacity and buses often must contend with the same congestion as autos in many locations bicyclists have to compete for space on these same facilities
Much of the congestion can be attributed to population growth residential and commercial development job housing imbalances work schedules that require commute trips during peak travel times recreational trip generators and truck traffic
The overall amount of travel in the corridor has increased dramatically over the past ten years and is expected to
continue to increase as the region adds approximately
one million new residents over the next 25 years per the current SACOG MTP 2035 Traffic congestion per houseshyhold is expected to increase 18 percent over 2005 levels
by the year 2035
in the general area of eastern Sacramento County and western El Dorado County the Highway 50 Partnership
has projected growth of 78000 more dwelling units and 53000 new jobs over the next 25 years Current and foreshycasted data is depicted in Table 4
The sections of US 50 with particularly severe traffic
congestion are depicted in Figures 8 and 9 These are
also summarized in greater detail in Tables 14 and 15 in Chapter 7 Table 14 shows a summary of the US 50 eastbound bottlenecks while the tables that follow discuss each bottleneck including location and possible causality Table 15 shows a summary of the US 50 westbound bottleshynecks while the tables that follow discuss each bottleneck including location and possible causality Minor or hidden bottlenecks are those that are not as defined (or severe) as the major bottlenecks Please note that the graphics acshycompanying the bottlenecks are not to scale
a critical component of identifying and resolving Traffic congestion per corridor mobility challenges household is expected is the need for detailed to increase 18 percent data analysis and comshy over 2005 levels by the munication regarding
year 2035system performance Data collection is insufficient to
fully meet these needs but still provides useful information as detailed in the following pages improving data gathershying analysis and dissemination of information is a major challenge for this corridor and is a component of intelligent Transportation Systems planning
HigHway 50 corridor system management plan [ 21 ]
c h a p t e r f o u r m a j o r c o r r i d o r m o b i l i t y c h a l l e n g e s
[ 22 ] HigHway 50 corridor system management plan
Figure 8 US 50 AM Peak Period Bottleneck Locations
Figure 9 US 50 PM Peak Period Bottleneck Locations
Challenges along the corridor include
bull severe recurrent highway and roadway traffic congestion
bull an incomplete buscarpool lane system
bull an incomplete set of freeway auxiliary lanes
bull loss or dropping of freeway lanes at specific locations
bull incomplete ramp metering
bull limited parallel roadway capacity
bull lack of signal coordination on key arterials and freeway ramp intersections
bull transit facilities approaching capacity
bull inadequate transit capital and operations funding needed to grow transit ridership
bull light rail at-grade crossings
bull lack of adequate access to transit across US 50
bull lack of double tracking of the light rail Gold Line to Folsom
bull poor pavement and road and bicycle route maintenancesweeping
bull lack of sufficient bicycle activated signal change devices
bull motorist driving behavior
bull inadequate bicycle storage
bull inadequate bicycle and pedestrian access to transit and
bull gaps and barriers within the bicycle route network
Additionally the EDCTC has identified safety and operashytional issues between the Smith Flat interchange and east of the Upper Carson RoadCamino intersection in the
Camino Area Parallel CapacitySafety Study Transporshytation issues include at-grade access to US 50 left turn conflicts across US 50 increasing average daily local and
interregional traffic growth in the area lack of alternate
routes seasonal traffic to and from Apple Hill and other local events and seasonal access to recreation in the Lake
Tahoe Region
c h a p t e r f o u r m a j o r c o r r i d o r m o b i l i t y c h a l l e n g e s
Table 4 CUrrenT and ForeCaSTed TraFFiC daTa
location Current Traffic data ndash 2007 Future Traffic data ndash 2027 (no build) Future Traffic data ndash 2027 (build)
County description amp location of Trucks
Peak directional
Split
Peak Hour Traffic
average annual daily
Traffic2
Volume over Capacity3
Peak Hour Traffic
average annual daily Traffic2
Volume over Capacity3
(no-build)
Peak Hour Traffic
average annual daily
Traffic2
Volume over Capacity3
(build)
yOL interstate 80 to yoloSacramento County Line
6 60 15500 180000 109 23911 277032 169 24070 278880 136
SaC yoloSacramento County Line to State Routes 99 and 51
4 59 21000 253000 135 28080 312480 186 29153 324415 193
SaC State Routes 99 and 51 to watt avenue 4 59 20600 225000 145 27942 286230 189 30648 313950 166
SaC watt avenue to Zinfandel Drive 4 59 16700 187000 115 24783 274540 163 25885 286750 136
SaC Zinfandel Drive to Sunrise Boulevard 4 60 13500 149000 093 20331 224394 133 20925 230950 110
SaC Sunrise Boulevard to Folsom Boulevard 4 66 11900 125000 089 18888 198247 131 20086 210820 140
SaC Folsom Boulevard to SacramentoEl Dorado County Line
3 66 8800 95000 087 13341 151311 133 13612 154380 136
ED SacramentoEl Dorado County Line to Cameron Park Drive
4 61 6900 70000 095 11454 116200 165 11834 120050 114
ED Cameron Park Drive to Missouri Flat Road
4 62 5700 62000 092 8647 94054 132 9462 102920 096
ED Missouri Flat Road to End of Freeway in Placerville
4 57 4850 59000 069 7101 76245 098 7363 79050 102
ED End of Freeway in Placerville to Bedford avenue
4 55 4800 52000 Na 4 6595 74196 Na4 6648 74790 Na4
ED Bedford avenue to Cedar grove Exit 4 62 3800 38500 077 5474 50782 099 5520 51205 099
1 Peak Directional Split The percentage of total traffic in the heaviest traveled direction during the peak hour2 Average Annual Daily Traffic (AADT) The average number of vehicles per day in both directions 3 Volume over Capacity (VC) The volume of traffic compared to the capacity of the roadway4 Volume over Capacity does not determine LOS for two- or three-lane facilities or segments with intersection delay 5 Reported Collision Rate index ( Compared to State average) The percentage by which each segmentrsquos reported collisions rate (fatal injury and property damage only) is above or below the statewide average reported collisions rate on comparable facilities
Source 3-Year Caltrans Traffic Accident Surveillance and Analysis System data
HigHway 50 corridor system management plans [ 23 ]
c h a p t e r f i v e p e r f o r m a n c e m e a s u r e s
Page Inte
ntionally
Left
Blank
[ 24 ] HigHway 50 corridor system management plan
performance measures
chapter five
Continuing corridor monitoring and performance mea-
sures are an integral part of corridor management and investment decision making and help identify immediate efficient and effective system operational strategies and
capital improvements Performance measures provide the
important dynamic daily information needed to rapidly
address operational problems caused by recurrent and
non-recurrent traffic congestion Measures are also used to identify the best improvement actions to generate the desired results
Table 5 identifies the performance measures to be used as
part of the corridor system management process
Baseline Data For perFormance measures Tables 6 7 and 8 display baseline data for the perforshymance measures for the CSMP transportation network
The performance data was primarily compiled from the SACMET demand based traffic model the year 2007
edition of the Traffic Volumes Manual the year 2000 edition of the Highway Capacity Manual Caltrans Traffic
Accident Surveillance and Analysis System (TASAS) the 2007 Caltrans Division of Maintenance Pavement Summary Report and ridership records provided by the transit providers
additional performance Performance Measures data was derived from the provide the important Performance Measurement dynamic dailySystem (PeMS) tool an
information needed internet based tool used to
to rapidly addresshost process retrieve and operational problemsanalyze road traffic condishy
tions information from caused by recurrent
real-time and historical and non-recurrent data PeMS obtains 30-sec- traffic congestion ond loop detector data in real-time from detectors installed along the highway corridor
It should be noted that Average Daily Traffic (ADT) and LOS
for some ParallelConnecting Roadways segment locations
in Table 7 was not available These are noted ldquoNo Datardquo
Data collection for non-auto modes is not as robust as what is needed for active system management Subsequent updates of this CSMP will seek to expand the
availability of transit and bicycle performance data collection
HigHway 50 corridor system management plan [ 25 ]
mdash
c h a p t e r f i v e p e r f o r m a n c e m e a s u r e s
TABLE 5 PERFORmAnCE mEASURES DEFInITIOnS AnD APPLICABILITY
Performance Measure Definition of Performance measure applicability to Corridor
STATE HIGHWAY SYSTEm
LOS A ldquoreport cardrdquo measurement with ldquoArdquo being the least amount of
congestion and ldquoFrdquo being the most congestion LOS is a relatively simple and widely used measure which
offers comparison opportunities
Total Vehicle Hours of Delay The additional travel time in hours experienced by all vehicles on the highway segment per day or at peak hour due to congestion
This measurement is used to determine the cost in time which congestion can add to the regular travel time that it takes to traverse a segment of road and is useful in
quantifying the performance of a particular roadway in an understandable format
Total Person Minutes of Delay The additional travel time in minutes experienced by all persons in vehicles on the highway segment per day or at peak hour due
to congestion
This measurement is used to determine the cost in time which congestion can add to the regular travel time that it takes to traverse a given segment of road and is useful in quantifying the performance of a particular roadway in an
understandable format and for comparison of improvement options
Minutes of Delay per Vehicle The additional travel time in minutes experienced by each vehicle on the highway segment at peak hour due to congestion
This measurement is used to determine the cost in time which congestion can add to the regular travel time that it
takes to traverse a given segment of road
Minutes of Delay per Person The additional travel time in minutes experienced by each person in vehicles on the highway segment at peak hour due to congesshy
tion
This measurement is used to determine the cost in time which congestion can add to the regular travel time that it
takes to traverse a given segment of road
Vehicle Travel Time (Minutes) The average time spent by vehicles traversing between two points on a road or highway
Travel time is a measure used to quantify travel time deficienshycies and provide a personal indicator of congestion impacts
Distressed Pavement Pavement that rides rougher than established maximums and or exhibits substantial structural problems as determined by the
Pavement Condition Survey
This measurement provides a ride quality indicator and an indicator for structural roadway problems
Reported Collision Rate Comparison of the actual total collision rate () along a highway segment above or below the statewide average for fatal injury
and property damage-only collisions on comparable facilities
Comparing the total collision and rate with statewide average rate provides an opportunity to assess safety conditions
through the corridor
Reliability Identifies day-to-day variation in travel time for the same trip at the same time of day Focuses on the predictability of travel time
particularly for repetitive trips
Estimates reliability by defining the extra time travelers must add to their average travel time when planning trips to ensure on-time arrival (0 percent no day-to-day variations
100 percent double allotted travel time)
Lost Productivity Measures the capacity of the corridor to accommodate vehicle or person throughput and is calculated as actual volume divided by
the capacity of the highway
As traffic volumes increase to roadway capacity speeds decline rapidly and vehicle throughput drops dramatically which increases traffic congestion and delay and results in
lost productivity
[ 26 ] HigHway 50 corridor system management plan
mdash
c h a p t e r f i v e p e r f o r m a n c e m e a s u r e s
HigHway 50 corridor system management plan [ 27 ]
TABLE 5 PERFORmAnCE mEASURES DEFInITIOnS AnD APPLICABILITY (ConTInued)
Performance Measure Definition of Performance measure applicability to Corridor
PARALLEL AnD COnnECTInG ROADWAYS
LOS A ldquoreport cardrdquo measurement with ldquoArdquo being the least amount of
congestion and ldquoFrdquo being the most congestion LOS is a relatively simple and often used measure which
offers comparison opportunities
traNSit
available Capacity Ratio () of available transit capacity alternatives within the corridor
This measure indicates the available capacity to accommoshydate diverted travelers from single occupant vehicles
c h a p t e r f i v e p e r f o r m a n c e m e a s u r e s
[ 28 ] HigHway 50 corridor system management plan
Page Inte
ntionally
Left
Blank
c h a p t e r f i v e p e r f o r m a n c e m e a s u r e s
Table 6 US 50 PerForManCe MeaSUreS
County location Post Miles
distance (Miles)
average annual daily Traffic1
PerForManCe MeaSUreS
loS1
Total Vehicle Hours of delay2
Total Person Minutes of delay2
Minutes of delay per Vehicle2
Minutes of delay per Person2
Vehicle Travel Time (Minutes)2 distressed
Pavement (lane
Miles)4
reported Col-lision rate
Comparison ()5
reliability6 lost Productivity7
daily Peak Hour3 daily Peak
Hour3 Peak Hour3 Peak Hour3 Peak Hour3 eastbound westbound lost lane Miles aM
Peak Period
lost lane Miles PM
Peak Period
STaTe HigHway SySTeM
yOL interstate 80 to yolo Sacramento County Line
000 to 316 316 180000 F 1169 126 95363 8061 049 046 36 9 26 62 22 01 0
SaC
yoloSacramento County Line to State Routes 99
and 51
L000 to L248 R000
248 253000 F 4993 653 407455 41746 186 175 43 7 20 64 60 53 76
State Routes 99 and 51 to watt avenue
R000 to R534 534 225000 F 10097 1362 823883 87105 397 372 93 15 24 60 48 81 68
watt avenue to Zinfandel Drive
R534 to R1092 558 187000 F 8075 977 658886 62506 351 329 91 19 -32 56 42 44 23
Zinfandel Drive to Sunrise Boulevard
R1092 to 1250 158 149000 E 1271 197 103727 12610 088 082 25 9 -33 46 13 0 16
Sunrise Boulevard to Folsom Boulevard
1250 to 1701 451 125000 E 3087 356 251940 25832 180 149 63 5 -14 60 46 1 45
Folsom Boulevard to SacramentoEl Dorado
County Line
1701 to 2314 613 95000 D 583 122 47537 8867 083 069 70 0 -11 19 55 0 08
ED
SacramentoEl Dorado County Line to Cameron
Park Dr
000 to R657 657 70000 E 504 126 41150 9138 110 091 77 1 -35 PeMS Data
Unavailable PeMS Data Unavailable
PeMS Data Unavailable
PeMS Data Unavailable
Cameron Park Drive to Missouri Flat Road
R657 to R1506 849 62000 E 302 75 24633 4827 079 075 93 2 -61 PeMS Data
Unavailable PeMS Data Unavailable
PeMS Data Unavailable
PeMS Data Unavailable
Missouri Flat Road to End of Freeway in Placerville
R1506 to 1725 219 59000 D 66 16 5376 1053 020 019 24 1 20 PeMS Data
Unavailable PeMS Data Unavailable
PeMS Data Unavailable
PeMS Data Unavailable
End of Freeway in Placerville to Bedford avenue
1725 to 1811 086 52000 D 68 17 5585 1094 021 020 15 2 81 PeMS Data
Unavailable PeMS Data Unavailable
PeMS Data Unavailable
PeMS Data Unavailable
Bedford avenue to Cedar grove Road
1811 to R2595 784 38500 D 58 15 4758 932 023 022 85 10 6 PeMS Data
Unavailable PeMS Data Unavailable
PeMS Data Unavailable
PeMS Data Unavailable
TOTaL mdash 5473 mdash mdash 30273 4042 2470293 263771 1587 1449 7150 80 mdash mdash mdash mdash mdash
1 Source Average Annual Daily Traffic and Level of Service (LOS) calculated is based on 2007 Caltrans Traffic Volumes on California State Highways and Highway Capacity Manual and Cambridge Systematics from 2008 Reported LOS is for the typical most congested daily peak travel period 2 Source Delay is the average additional travel time by vehiclespersons traveling under 60 mph Data derived from 2007 HICOMP report SACMET Travel Demand Model PeMSs traffic data and Caltrans District 3 Traffic Operations Probe vehicle Tach runs 3 Peak Hour is during PM 4 Source 2007 Caltrans Division of Maintenance Pavement Summary Report 5 Source 2004 through 2007 Caltrans Traffic Accident Surveillance and Analysis System summary data of the percentage above or below the statewide average for fatal injury and property damage-only collisions on comparable facilities 6 Reliability The Planning Time Index is a measure of the reliability of the travel time on a particular route It is the ratio of the 95th percentile of travel time on a route to the median free-flow travel time This means itrsquos the amount of time a traveler needs to allocate for a route if they want to show up on time 19 out of 20 trips Reliability and Planning Time data was taken from April 2007 The data covered a 24-hour period of time on each Tuesday wednesday and Thursday of that month That data was then aggregated into a single average 24-hour day it was then analyzed to determine the highest average aM and PM travel time That time was then compared to the best possible average travel time to determine the additional time that was spent traveling the same seg-ment 7 Lost Productivity Data taken April 2007 PeMS As traffic increases to the capacity of the highway speeds decline throughput drops dramatically and the efficiency of the highway to provide mobility decreases This decline in the potential carrying-capacity of the freeway is expressed in terms of how many equivalent lane miles of roadway are lost
HigHway 50 corridor system management plans [ 29 ]
c h a p t e r f i v e p e r f o r m a n c e m e a s u r e s
Table 7 Parallel and ConneCTing roadwayS PerForManCe MeaSUreS
County location average
daily Traffic1
PerForManCe MeaSUreS
loS1
Total Vehicle Hours of delay2
Total Person Minutes of delay2
Minutes of delay per Vehicle2
Minutes of delay per Person2
Vehicle Travel Time (Minutes)2
distressed Pavement
(lane Miles)4
daily Peak Hour3 daily Peak
Hour3 Peak Hour3 Peak Hour3 Peak Hour3
Parallel and ConneCTing roadwayS
yOL west Capitol Enterprise Boulevard to Capitol Mall 13737 No Data
Data is unavailable for these performance measures at this time however will be pursued in the next phase of the CSMP
SaC
w 5th Street to 26th Street 9194 a
X 5th Street to 26th Street 9154 a
Folsom Boulevard watt avenue to Bradshaw Road 25600 C
watt avenue Folsom Boulevard to US 50 63900 F
Bradshaw Road Folsom Boulevard to US 50 22400 a
Folsom Boulevard Bradshaw Road to Sunrise Boulevard 20400 a
Bradshaw Road Old Placerville to US 50 54405 F
Old Placerville Road Bradshaw Road to Rockingham Drive 11864ndash18365 a
Rockingham Drive Old Placerville Road to Mather Boulevard 16516 E
Mather Boulevard Rockingham Drive to Folsom Boulevard 21732 C
international Drive Rockingham Drive to Zinfandel Drive 12808 a
Zinfandel Drive international Drive to Folsom Boulevard 22298ndash47032 BE
white Rock Road Zinfandel Drive to Sunrise Boulevard 25459 a
Sunrise Boulevard US 50 to Folsom Boulevard No Data No Data
white Rock Road Sunrise Boulevard to Prairie City Road 3400 B
Folsom Boulevard Sunrise Boulevard to iron Point Road 17200 a
white Rock Road grant Line Road to EDSaC County Line 6700 D
iron Point Road Folsom Boulevard to East BidwellScott Road 13984 No Data
Scott Road iron Point Road to white Rock Road No Data No Data
Folsom Boulevard iron Point Road to Blue Ravine Road No Data No Data
Blue Ravine Road Folsom Boulevard to green Valley Road No Data No Data
Prairie City Road US 50 to white Rock Road 6000 D
HigHway 50 corridor system management plans [ 30 ]
c h a p t e r f i v e p e r f o r m a n c e m e a s u r e s
Table 7 Parallel and ConneCTing roadwayS PerForManCe MeaSUreS (ConTinUed)
County location average
daily Traffic1
PerForManCe MeaSUreS
loS1
Total Vehicle Hours of delay2
Total Person Minutes of delay2
Minutes of delay per Vehicle2
Minutes of delay per Person2
Vehicle Travel Time (Minutes)2
distressed Pavement
(lane Miles)4
daily Peak Hour3 daily Peak
Hour3 Peak Hour3 Peak Hour3 Peak Hour3
Parallel and ConneCTing roadwayS
ED
green Valley Road EDSaC County Line to Francisco Drive 22600 D
Data is unavailable for these performance measures at this time however will be pursued in the next phase of the CSMP
green Valley Road Francisco Drive to Silva Valley Parkway 13077 D
green Valley Road Silva Valley Parkway to Cameron Park 9849 C
green Valley Road Cameron Park Drive to Deer Valley Road 5278 C
green Valley Road Deer Valley Road (East) to Lotus Road 8381 D
green Valley Road Lotus Road to Placerville Drive 4669 C
Latrobe Road white Rock Road to US 50 24742 C
Durock Road Cameron Park Dr to South Shingle Road 7278 C
Cameron Park Drive Durock Road to US 50 (Durock Road to Coach Lane Coach Lane to US 50) 9544 26603 CD
South Shingle Road Durock Road to US 50 11390 D
white Rock Road EDSaC County Line to Latrobe 12808 D
white Rock Road Latrobe Rd to Silva Valley Pkwy (Latrobe to PostPost to Silva Vlly Pkwy) 10124 CD
Silva Valley Parkway white Rock Rd to Serrano Pkwy (white Rock to Entrada Entrada to Serrano Pkwy) 13708 9328 DC
Forni Road Placerville Drive to Main Street 9049 8379 No Data
Placerville Drive Forni Road to US 50 No Data No Data
Main Street Placerville Drive to Bedford avenue No Data No Data
Main Street Bedford avenue to Broadway No Data No Data
Broadway Main Street to Point View Drive No Data No Data
1 Source Average Daily Traffic and Level of Service (LOS) calculated are based on City of Sacramento between 2001 and 2007 Sacramento County from 20072008 City of Rancho Cordova between 2004 and 2007 and El Dorado County from 2007
HigHway 50 corridor system management plans [ 31 ]
c h a p t e r f i v e p e r f o r m a n c e m e a s u r e s
Page Inte
ntionally
Left
Blank
[ 32 ] HigHway 50 corridor system management plan
c h a p t e r f i v e p e r f o r m a n c e m e a s u r e s
tabLe 8 traNSit PerforMaNCe MeaSure
County transit Provider route Performance Measure
available daily Capacity ()1 available Peak Hour Capacity1
traNSit
SaC
SacRT (Bus)
Route 21 70 10
Route 28 76 59
Route 36 83 74
Route 38 66 44
Route 72 56 20
Route 73 79 45
Route 74 82 43
Route 109 47 22
SacRT (Light Rail) Gold Line 31 Exceeds Capacity
EDSAC ED County Transit Authority
Commuter Express Bus Service Not applicablendashOperates Peak Hour
Only 405
iron Point Connector 764 Not available
Reverse Commuter Not applicablendashOperates Peak Hour Only 982
yoloSaC yolo County Transit District Not applicablendashOperates Peak Hour Only 498
biKe3
1 Source average Daily and Peak Hour available Capacity calculated from each transit providerrsquos route ridership data 2 The Reverse Commuter service is offered on vehicles that are returning to El Dorado County (Commuter Express Buses) 3 Bicycle performance measure(s) will be identified applied and included in the subsequent CSMPs
HigHway 50 corridor system management plan [ 33 ]
c h a p t e r f i v e p e r f o r m a n c e m e a s u r e s
[ 34 ] HigHway 50 corridor system management plan
Page Inte
ntionally
Left
Blank
planned corridor system management strategies
chapter six
ConCept LoS and ConCept FaCiLit y ldquoConcept LOSrdquo and ldquoConcept Facilityrdquo have traditionally been used in Caltrans TCCRs to reflect the minimum level or quality of operations acceptable for each route segment within the 20-year planning period and the highway facility needed in the next 20 years to maintain the Concept LOS
Typical Concept LOS standards in Caltrans District 3 are LOS ldquoDrdquo in rural areas and LOS ldquoErdquo in urban areas how-ever some heavily congested route segments now have a Concept LOS ldquoFrdquo because the improvements required to bring the LOS to ldquoErdquo are not feasible due to environmental right of way financial and other constraints The applica-tion of multi-modal corridor management strategies should reduce the severity and duration of congestion and provide viable travel options and information that will enable a traveler to avoid severe freeway congestion
The Concept LOS and Concept Facility for US 50 are shown in Table 9 almost all US 50 segments are forecasted to operate under LOS ldquoFrdquo conditions in 20 years under the No-Build and Build scenarios
Corridor ManageMent StrategieS The US 50 CSMP also proposes specific strategies to enhance corridor mobility (see Table 10) based on the fol-lowing principles
bull Manage all modes and facilities in the corridor as a single system beginning with the transportation net-work defined in this CSMP
bull Implement comprehensive and dynamic multimodal monitoring and reporting for the system and for all modes
bull Develop and use micro-simulation modeling to identify mobility challenges and to evaluate proposed solutions
bull Complete the projects included in the regional trans-portation plans with an emphasis on the completion of the key mobility improvement projects identified in this CSMP (see Tables 11 and 12)
bull Implement the specific strategies outlined in this CSMP
Key CapitaL projeCtS Tables 11 and 12 contain key capital projects that have been identified as the most critical to corridor mobility These are also included in the SaCOg MTP for 2035 and are either planned without any funding yet programmed are partially programmed
The US 50 CSMPor are entirely programmed SACOG conducted significant proposes specific
public attitude research strategies to enhance for the MTP for 2035 to corridor mobility complement comprehensive outreach efforts through community workshops the TALL Order Moving the Region Forward event the televised Town Hall Road Map for the Future and associated public polling The results of the SaCOg analyses and public out-reach for the MTP were
highway 50 corridor system management plan [ 35 ]
c h a p t e r s i x p l a n n e d c o r r i d o r s y s t e m m a n a g e m e n t s t r a t e g i e s
[ 36 ] HigHway 50 corridor system management plan
used when selecting the key projects for identification in
the CSMP and to ensure consistency Not all corridor projshyects in the MTP are included in the CSMP since the CSMP focuses on the managed network and the SaCOg MTP considers all streets and roads bike routes and transit services in the corridor
highway 50 partnership The Highway 50 Partnership is a cooperative public-private effort among the County of Sacramento City of Rancho
Cordova City of Folsom County of El Dorado and several major landowners that recognize the need to consider corrishydor mobility needs holistically
The Partnership has collaborated effectively to develop a Plan to improve mobility in the US 50 Corridor from Rancho
Cordova to El Dorado Hills an area identified as approprishyate for growth in the SACOG Blueprint Recognizing the
need to generate private investment the Partnership is seeking to implement a regional Highway 50 Corridor fee program to fund these projects
in addition to the key projects indicated in Table 11 Table 12 displays the key projects identified by the
Partnership
These projects include (1) Near-Term Priority Improvement Projects and (2) Near-Term Expected Roadway Improveshyments
The Near-term Priority improvement Projects would proshyvide several new roadway connections for people to travel within and through the area to avoid congestion They also include new transit routes and widening existing roadways
viewed by the Partnership as a package that would provide system-wide travel benefits These improvements targeted
for completion through 2012 would reduce vehicle hours of delay during commute hours by 30 percent
The near-Term Expected Roadway Improvements are conshysidered by the Partnership to be readily expected since they are tied to expected development or are part of a near-term
capital improvements program
Visionary projects Visionary projects are not yet included in the SaCOg MTP or EDCTC RTP but appear to offer considerable corridor mobilshyity benefits and merit further analysis and consideration for inclusion in the next MTP and RTP These are displayed in
Table 13
The ldquoPlus 10 Listrdquo in the SACOG MTP identifies projects
that are attractive from a performance standpoint but could not be included in the Final Project Lists because of financial constraint The ldquoPlus 10 Listrdquo element offers the
opportunity to include projects that would not be affordshyable without additional funding Some projects identified in
the Visionary Projects List were analyzed by SACOG during
development of the current MTP Some of these are included in the ldquoPlus 10 Listrdquo
Watt Avenue Light Rail Station Improvement Project
c h a p t e r s i x p l a n n e d c o r r i d o r s y s t e m m a n a g e m e n t s t r a t e g i e s
Table 9 US 50 ConCePT loS and FaCiliTy TyPe
location Forecasted level of Service1 (loS) and Facility Type
County description and location From Post Mile To Post Mile Current
loS1 20-year no build loS12
20-year build loS12
20-year Concept
loS13 existing Facility4 Concept Facility456 Ultimate Facility457
yOL interstate 80 to yoloSacramento County Line
000 316 F F F F 8F (6F between Jefferson Blvd ramps)
8F+2HOV+aux Lanes 8F+2HOV+aux Lanes
SaC yoloSacramento County Line to SR 99 and 51
L000 L248 = R000 F F F F 8F 8F+2HOV+aux Lanes 8F+2HOV+aux Lanes
SaC State Routes 99 and 51 to watt avenue R000 R534 F F F F 8F 8F+2HOV+aux Lanes 8F+2HOV+aux Lanes
SaC watt avenue to Zinfandel Drive R534 R1092 F F F F 8F 8F+2HOV+aux Lanes 8F+2HOV+aux Lanes
SaC Zinfandel Drive to Sunrise Boulevard R1092 1250 E F F F 8F 8F+2HOV+aux Lanes 8F+2HOV+aux Lanes
SaC Sunrise Boulevard to Folsom Boulevard 1250 1701 E F F F 6F+2HOV to Hazel ave 4F+2HOV
to Folsom Blvd
6F+2HOV+aux Lanes to Hazel ave 4F+2HOV+aux
Lanes to Folsom Blvd
8F+2HOV+aux Lanes
SaC Folsom Boulevard to SaCED County Line 1701 2314 D F F F 4F+2HOV 4F+2HOV+aux Lanes 6F+2HOV+aux Lanes
ED SacramentoEl Dorado County Line to Cameron Park Drive
000 R657 E F F F 4F 4F+2HOV+aux Lanes 6F+2HOV+aux Lanes
ED Cameron Park Drive to Missouri Flat Road R657 R1506 E F E E 4F 4F+2HOV+aux Lanes to greenstone 4F+aux Lanes
to Missouri Flat
6F+2HOV+aux Lanes to greenstone 4F+2HOV+aux Lanes
to Missouri Flat
ED Missouri Flat Road to End of Freeway in Placerville
R1506 1725 D F F F 4F 4F+aux Lanes 4F+aux Lanes
ED End of Freeway in Placerville to Bedford avenue
1725 1811 D E E E 4E 4E 4E
ED Bedford avenue to Cedar grove Exit 1811 R2595 D F F F 4F to Smith Flat 4E to Camino 4F+aux Lanes to Smith Flat 4E to Camino
4F+aux Lanes
1 Level of Service (LOS) A ldquoreport cardrdquo for evaluating traffic flow with ldquoArdquo being the best and ldquoFrdquo being the worst 2 20-year LOS (No Build) The LOS that would be expected at 20 years with no improvements 3 20-year Concept LOS The minimum acceptable LOS over the next 20 years 4 Facility Type Codes C=Conventional Highway E=Expressway F=Freeway HOV=High Occupancy Vehicle Lanes aux=auxiliary Lanes 5 Operational improvements are included in future facilities for all segments Examples of operational improvements include TOS improvements and auxiliary lanes 6 Concept Facility the future roadway with improvements needed in the next 20 years if LOS ldquoFrdquo no further degradation of service from existing ldquoFrdquo is acceptable as indicated by delay performance measurement 7 Ultimate Facility The future roadway with improvements needed beyond a 20 year timeframe
HigHway 50 corridor system management plans [ 37 ]
c h a p t e r f i v e p e r f o r m a n c e m e a s u r e s
Table 10 US 50 CSMP STraTegieS
Strategy description implementation Challenges
Maintain and operate the existing corridor multi-modal trans-
portation infrastructure
Maintain the existing investment in all modes of the transportation system and provide adequate resources for daily operations including operating
revenues for transit services
Funding availability funding competition within the region
Fully coordinate the delivery of transportation services and facili-ties in the corridor including daily operations and system planning
for enhancements
Interagency operational coordination to maximize the efficiency and effec-tiveness of all modes operating in the corridor with a focus on the CSMP transportation network defined in this CSMP Use of an existing group or
committee to provide initial oversight for this strategy
Diverse interests and competing priorities and limited resources
Construct planned and pro-grammed corridor capital improve-
ment projects
implementation of the capital improvements in the corridor included within the approved Metropolitan Transportation Plan and Regional Transportation
Plan for all transportation modes within the scope schedule and cost specified
Funding availability funding competition within the region
Comprehensive daily monitoring of the status of all modes providing service on the CSMP transporta-
tion network
Full deployment of multimodal transportation service status detection systems for all CSMP network components
Funding availability funding competition within region
Provide traveler information to the public
Provide the public with real-time easily accessible information regarding the status of all CSMP transportation system components so as to allow travel-
ers to make informed decisions about trip mode time and routing options
Funding availability funding competition within region
Continually monitor and analyze the CSMP transportation network to improve system performance
Monitor transportation performance measures and make system modifica-tions as appropriate on a frequent and timely basis Staff resources and data availability
Decrease the duration of non-recurrent traffic congestion
Expand and enhance the Freeway Service Patrol to respond to automobile accidents and vehicle break-downs
Funding availability funding competition within the region
Timely implementation of STaRNET
Expedite the implementation of the STaRNET operators of transportation facilities and emergency responders in the Sacramento region through real-time sharing of data and live video refinement of joint procedures
pertaining to the operation of roadways and public transit and public safety activities as well as enhance the regionrsquos 511 web site and interactive
telephone service to provide more traveler information
Developmental time acceptance by agencies and integration into daily use and identifica-
tion of maintenance and operations funding
Enhance transit and rail service increase transit service frequency provide express transit services imple-
ment bus rapid transit routes reduce headways for light rail and buses and construct planned light rail line extensions
Funding availability funding competition within the region
Complete Bus Carpool lane network
Complete the regional buscarpool lane network including freeway-to-freeway HOV lane connectors
Funding availability funding competition within the region Public agency and public
acceptance of network
[ 38 ] HigHway 50 corridor system management plan
c h a p t e r s i x p l a n n e d c o r r i d o r s y s t e m m a n a g e m e n t s t r a t e g i e s
tabLe 10 uS 50 CSMP StrategieS (ConTInued)
Strategy Description implementation Challenges
Enhance Transportation Demand Management strategies
Encourage employers to provide telecommuting and flexible working hour options to employees
acceptance by employers and resources to participate
Optimize the timing and synchronishyzation of traffic signals
Coordinate the optimization and timing of traffic signals on freeway ramps and along parallel and connecting roadways within and between jurisdicshytions to improve traffic flow and reduce congestion Provide signal priority
systems for transit vehicles
Funding availability and coordination among cities counties and Caltrans
improve access management of freeways and parallel connecting roadways
Develop and implement access management strategies to maintain the operational efficiency of freeways and parallelconnecting roadways
agreement between responsible jurisdicshytions as to where increased access control is needed increased access control on some parallelconnecting roadways may increase
traffic volumes on non-corridor roads
Develop innovative use of CMSs (eg travel times)
Potential uses of CMSs to improve system efficiency include the use of CMSs along portions of all corridors near transit station to indicate travel
times based on real-time existing traffic conditions on the freeway as well as on parallel roadways and express bus and light rail services CMS can also be used to identify the number of parking spaces that are still available at
the light-rail stations
Funding availability funding competition within the region
Implement amp expand Transit AVLTransit status information
enhancements for system users
Expand the use of AVL systems utilizing GPS technology to track in real-time the location of transit vehicles monitor transit schedules dispatch transit vehicles and provide real-time passenger information such as ldquonext busrdquo or
ldquonext trainrdquo arrival times
Funding availability funding competition within region
Expand Park-and-Ride lots at key locations
Add additional capacity to existing park-and-ride lots near transit stations and other locations that are approaching capacity
Funding availability funding competition within the region and available land
improve bike-pedestrian access in the CSMP
transportation network
Plan and program for construction of additional bicycle paths lanes and related improvements for access and connectivity to transit park and ride
lots and destination points
Funding availability funding competition within the region
Provide ldquoBike-SharingrdquordquoCar-Sharingrdquo tofrom transit (ldquoCarlinkrdquo) and from
neighborhoods
Expand the Regional Rideshare and Spare-the-Air programs to include bicycle and car sharing opportunities
Funding availability and coordination between SaCOg TMa air Districts employers developshyers property managers and local government
officials
Provide parking management stratshyegies in interested jurisdictions where applicable to discourage
use of single-occupant vehicles
in higher-density areas provide preferential parking for carpools and vanshypools require residential parking permits remove on-street parking and or provide graduated parking fees for metered on-street parking based on
vehicle type and time of day for SOV spaces to encourage transit use
Acceptance by businesses local officials and the general public
Expand bicycle commute amp transit fare strategiessubsidies
increase participation by large employers in programs that subsidize transit fares for employees during peak-hour commute times and provide bicycling
to work incentives
Voluntary participation by large employers to pay subsidy to transit providers
HigHway 50 corridor system management plan [ 39 ]
c h a p t e r s i x p l a n n e d c o r r i d o r s y s t e m m a n a g e m e n t s t r a t e g i e s
tabLe 11 KeY CaPitaL ProjeCtS
CountyLead agency
route roadway from to Project
Description Programmed
funds
additional funding Needed
total Cost estimate (x $1000)
Comp Year (FFY)
uS 50
Sacramento Caltrans District 3
US 50 Downtown watt avenue HOV Lanes $0 $75000 $75000 2020
Sacramento Caltrans District 3
US 50 watt avenue Sunrise Blvd HOV Lanes $165000 $0 $165000 2013
Sacramento Caltrans District 3
US 50 Bradshaw Road
Mather Field Road
Eastbound and Westbound Auxiliary Lanes
$0 $3700 $3700 2016
Sacramento Caltrans District 3
US 50 State Route 99
(Oak Park Interchange) interchange improvements including buscarpool lane
connectors $0 $150000 $150000 2014
Sacramento Caltrans District 3
US 50 interstate 5
(Riverfront Interchange) Riverfront Interchange
improvements including bus carpool lane connectors
$30000 $170000 $200000 2016
ED Caltrans District 3 US 50 Camino
Operational Safety improvements Construct an
undercrossing median barrier modify local road connections andor associated operational improvements on and adjacent
to US 50
$15000 $0 $15000 2012
ED ED County DOT US 50
west of Latrobe Road
west of Bass Lake
grade HOV Lanes (Ph1) $47141 $0 $47141 2010
ED Caltrans District 3 US 50
west of Bass Lake Road
Ponderosa Road
HOV Lanes (Ph2) $55000 $0 $55000 2011
ED Caltrans District 3 US 50 Ponderosa
Road greenstone
Road HOV Lanes (Ph3) $22357 $0 $22357 2013
ED ED County DOT US 50 Future Silva
Valley iC
Future Empire Ranch IC
Mainline Widening construct new WB lane within the
median from proposed Silva Valley IC to proposed Empire
Ranch IC
$2950 $0 $2950 2013
[ 40 ] HigHway 50 corridor system management plan
c h a p t e r s i x p l a n n e d c o r r i d o r s y s t e m m a n a g e m e n t s t r a t e g i e s
tabLe 11 KeY CaPitaL ProjeCtS (ConTInued)
CountyLead agency
route roadway from to Project
Description Programmed
funds
additional funding Needed
total Cost estimate (x $1000)
Comp Year (FFY)
PARALLEL AnD COnnECTInG ROADWAYS
ED ED County DOT
Silva Valley Parkway
Entrada Drive
Future US 50
Silva Valley Parkway iC
Widen Silva Valley Road from 2 lanes to 4 lanes includes
Class ii bike lanes and left turn storage pockets
$2921 $0 $2921 2010
ED ED County DOT
Silva Valley Parkway US 50
US50 Silva Valley Parkway (Phase 2) Includes constructshying overcrossing and ramps
signalization at EB and WB on off ramps
$57817 $0 $57817 2016
ED ED County DOT
Headington Road
Missouri Flat Road
El Dorado Road
Extend 2 lanes with median $9878 $0 $9878 2012
ED ED County DOT
Durock Road
Robin Lane South
Shingle Road
Extend 2 lanes with median $1239 $9214 $10453 2015
ED ED County DOT
Durock Road
Business Center Drive intersection signalization
includes adding turn pockets on Durock Road
$4333 $0 $4333 2009
ED City of Placerville
Point View Drive Broadway Smith Flat
Road Extend 2 lanes $1300 $0 $1300 2020
ED City of Placerville
western Placerville
US 50 interchange
Forni Road Ray Lawyer
Drive
Placerville Drive
Interchange Reconstruction convert Ray Lawyer Dr
Overcrossing to full IC Auxiliary Lanes
$5059 $34741 $39800 2020
Sacramento City of Rancho
Cordova
Mather Boulevard
Rockingham Road
Zinfandel Drive widen to 4 lanes $0 $8617 $8617 2020
Sacramento Rancho Cordova
Parkway ii
Grant Line Road
White Rock Road
New 6-lane expressway includshying intersection improvements at Kiefer Blvd amp White Rock
Road
$0 $44518 $44518 2020
Sacramento City of Folsom
Scott Road US 50 White Rock Rd
widen from 2 to 6 lanes $16000 $0 $16000 2020
Sacramento Sacramento County DOT
White Rock Road
Grant Line Rd
Prairie City Rd
Widen from 2 to 4 lanes realign near Nike and Nimbus Roads and connect with existshying alignment west of Prairie City Rd Realign Grant Line Rd to intersect with realigned
White Rock Rd
$26600 $0 $26600 2020
Sacramento Sacramento County DOT
Hazel avenue
US 50 Hazel Madison
Widen American River Bridge and approaches from 4 to 6 lanes Widen Hazel Avenue from AR Bridge to Madison from 4 to 6 lanes with Bike
LanesSignals
$83530 $0 $83530 2020
HigHway 50 corridor system management plan [ 41 ]
c h a p t e r s i x p l a n n e d c o r r i d o r s y s t e m m a n a g e m e n t s t r a t e g i e s
tabLe 11 KeY CaPitaL ProjeCtS (ConTInued)
CountyLead agency
route roadway from to Project
Description Programmed
funds
additional funding Needed
total Cost Estimate (x $1000)
Comp Year (FFY)
PARALLEL AnD COnnECTInG ROADWAYS
ED ED County DOT
green Valley Road
Salmon Falls Road
east
Deer Valley Road
widen from 2 to 4 lanes $0 $14576 $14576 2025
ED ED County DOT
green Valley Road
Deer Valley Road east Lotus Road widen $958 $4513 $5471 2015
ED ED County DOT
green Valley Road
Francisco Drive
Salmon Falls Road
widen from 2 to 4 lanes divided $412 $3491 $3903 2015
ED ED County DOT
Latrobe Road
investment Boulevard
golden Foothill Parkway
widen from 2 lanes undivided to 4 lanes
divided $1076 $8792 $9868 2015
ED ED County DOT
Latrobe Road
Carson Creek
White Rock Road
widen from 4 to 6 lanes $0 $23755 $23755 2025
ED ED County DOT
white Rock Road
EDSac County Line
Manchester Drive
widen 2 to 4 lanes divided includes signal interconnect and coorshy
dination
$0 $23755 $23755 2025
Sacramento City of Rancho
Cordova
Easton Valley
Parkway
Prairie City Road
Empire Ranch Road extenshysion south of
US 50
Construct new 4 lane road $0 $45000 $45000 2020
Sacramento Sacramento County DOT
Hazel avenue
Easton Valley
Parkway
Grant Line RoadWhite Rock Road
New road extension 4 lane limited access
through aerojet property $0 $18000 $18000 2018
Sacramento Sacramento County DOT
white Rock Road
Prairie City Road
ED County Line
widen to 4 lanes $8330 $64773 $73103 2018
Sacramento Sacramento County DOT
green Valley Road
East Natoma Sacramento ED County
line widen to 4 lanes $0 $3000 $3000 2018
Sacramento City of Rancho
Cordova
Zinfandel Drive
international Drive
Folsom Boulevard
widen to 4 lanes $0 $12000 $12000 2020
[ 42 ] HigHway 50 corridor system management plan
c h a p t e r s i x p l a n n e d c o r r i d o r s y s t e m m a n a g e m e n t s t r a t e g i e s
tabLe 11 KeY CaPitaL ProjeCtS (ConTInued)
CountyLead agency
route roadway from to Project
Description
Pro-grammed
funds
addi-tional
funding Needed
total Cost estimate (x $1000)
Comp Year (FFY)
traNSit
yolo amp Sacramento City of west Sacramento
amp City of Sacramento
Sacramento River
Crossing
15th Street in the City
of west Sacramento
Broadway in the City of
Sacramento
New all-modal river crossing (Auto Transit Bike amp Pedestrian)
from Sacramento across the Sacramento River to West
Sacramento The crossing was modeled between Broadway in Sacramento amp 15th Street in
West Sacramento but final alignshyment options will be studied in subsequent planning efforts
$800 $99200 $100000 2019
Sacramento Cal State University
Sacramento
CSUS Campus mdash mdash
Sac State Tram adjoining City streets and SRTD 65th Street light railbus transfer station Bus Rapid Transit System
$23574 $0 $23574 2013
Sacramento City of Rancho
Cordova
Rancho Cordova Various Various
New Service Rancho Cordova Pilot Transit Shuttle System new transit service for connection to
RTs Gold Line
$2380 $1500 $38880 2014
yolo amp Sacramento City of west Sacramento
TBD west
Sacramento Sacramento Streetcar Service between west
Sacramento and Downtown Sacramento
$17400 $54700 $72100 2014
Sacramento City of Rancho
Cordova RT Gold Line
RT Gold Line Tracks
Mather Field Road
Light Rail Grade Separations $0 $52888 $52888 2025
Sacramento City of Rancho
Cordova RT Gold Line
RT Gold Line Tracks Zinfandel Drive Light Rail Grade Separations $0 $52888 $52888 2025
Sacramento City of Rancho
Cordova RT Gold Line
RT Gold Line Tracks
Bradshaw Road
Light Rail Grade Separations $0 $35260 $35260 2025
Sacramento City of Rancho
Cordova RT Gold Line
RT Gold Line Tracks Routier Road Light Rail Grade Separations $0 $35260 $35260 2025
Sacramento City of
Sacramento Sacramento Valley Station
Sacramento intermodal Transportation Facility (Phase 1) - Develop intermodal transportashytion terminal for heavy rail light
rail and bus service
$77799 $0 $77799 2010
Sacramento City of
Sacramento Sacramento Valley Station
Sacramento intermodal Transportation Facility (Phase 2) - Develop intermodal transportashytion terminal for heavy rail light
rail and bus service
$24101 $1000 $25101 2014
HigHway 50 corridor system management plan [ 43 ]
c h a p t e r s i x p l a n n e d c o r r i d o r s y s t e m m a n a g e m e n t s t r a t e g i e s
TABLE 11 KEY CAPITAL PROJECTS (CONTINUED)
CountyLead Agency
Route Roadway From To Project
Description Programmed
Funds
Additional Funding Needed
Total Cost Es-timate (x $1000)
Comp Year (FFY)
BICYCLE ROUTES
Sacramento City of Rancho
Cordova
US 50Mather Field Road IC US 50 Mather
Field Road
US 50Mather Field Road PedestrianBike Crossing along
the Mather Airport RR Spur alignment
$0 $820 $1055 2015
ED ED County DOT
Sacramento Placerville
Transportation Corridor
Forni Rd
Missouri Flat Rd Class I Bike Trail $1423 $111 $1534 2009
ED City of Placerville
El Dorado Trail Western
Extension
Canal Street Main Street
Ray Lawyer DriveForni
Road Class 1 Bike Trail $1850 $0 $1850 2010
ED ED County DOT
US 50ED Hills Blvd IC US 50
El Dorado Hills Blvd
Latrobe Road
US 50El Dorado Hills Blvd Pedestrian Overcrossing $5508 $66 $5574 2014
TABLE 12 50 MOBILITY PARTNERSHIP KEY CAPITAL PROJECTS
RouteRoadway From To Project Description
NEAR TERM PRIORITY IMPROVEMENT PROJECTS
US 50 Sunrise Scott Road Auxiliary Lane
US 50 Hazel Avenue Interchange Improvements
Hazel Avenue Folsom Boulevard Easton Valley Parkway New 4 Lane Road
Easton Valley Parkway Hazel Avenue Rancho Cordova Parkway New 6 Lane Road
Rancho Cordova Parkway Easton Valley Parkway White Rock Road New 4 Lane Road
White Rock Road Sunrise Boulevard Silva Valley Parkway Widen to 4 Lanes
RT Gold Line Hazel Iron Point Station Passing Tracks
US 50 Rancho Cordova Parkway New Interchange
Zinfandel Drive South of International Douglas Road New 4 Lane Road
International Drive Kilgore Road Rancho Cordova Parkway New 6 Lane Road
Douglas Road Zinfandel Extension Sunrise Boulevard Widen to 4 Lanes
Sunrise LRT Citrus Road Sunrise Mall Bus Rapid TransitExpress Bus
[ 44 ] HIGHWAY 50 corridor system management plan
c h a p t e r s i x p l a n n e d c o r r i d o r s y s t e m m a n a g e m e n t s t r a t e g i e s
TABLE 12 50 mOBILITY PARTnERSHIP kEY CAPITAL PROjECTS (COnTInUED)
routeroadway from to Project Description
US 50 nEAR TERm PRIORITY ImPROVEmEnT PROjECTS
US 50 Empire Ranch Road New interchange
US 50 Silva Valley New interchange
US 50 Scott Road Empire Ranch Road Aux Lanes
US 50 Empire Ranch Road El Dorado Hills Boulevard Aux lanes and climbing lanes
US 50 El Dorado Hills Boulevard Silva Valley Parkway Aux lanes and climbing lanes
US 50 Silva Valley Parkway Bass Lake Road Aux lanes
Sunrise Boulevard White Rock Road Douglas Boulevard widen to 6 lanes
Sunrise Boulevard Douglas Boulevard Jackson Road widen to 4 lanes
White Rock Road Sunrise Boulevard Future Rancho Cordova Parkway and El Dorado County Line to Latrobe Road
widen to 4 lanes
Douglas Boulevard Sunrise Boulevard Grant Line Road widen to 4 lanes
Rancho Cordova Parkway Douglas Boulevard Rio del Oro Parkway New 2 lane road
Rancho Cordova Parkway Rio del Oro Parkway White Rock Road New 6 lane road
Jaeger Road Douglas Road Kiefer Boulevard New 4 lane road
Chrysanthy Sunrise Boulevard Americanos Boulevard New 4 lane road
Kiefer Boulevard Sunrise Boulevard Jaeger Road New 4 lane road
Grant Line Road Douglas Road Chrysanthy Road widen to 4 lanes
Hazel avenue Gold Country Boulevard Madison avenue widen to 6 lanes
Latrobe Road South of White Rock Road widen to 4 lanes
TABLE 13 VISIOnARY PROjECTS
County routeroadway from to Project Description
Sac yolo US 50 Enterprise Downtown Sacramento HOV Lanes
ED TBD Folsom Placerville Transit ndash Type TBD
ED New Road Latrobe Road White Rock Road (poten shy
tially US 50) New 2-lane road
HigHway 50 corridor system management plan [ 45 ]
c h a p t e r s i x p l a n n e d c o r r i d o r s y s t e m m a n a g e m e n t s t r a t e g i e s
[ 46 ] HigHway 50 corridor system management plan
Page Inte
ntionally
Left
Blank
congestion and bottleneck analysis
chapter seven
The 2000 Highway Capacity Manual defines a bottleneck
as ldquoa road element on which demand exceeds capacityrdquo
The bottleneck analysis evaluates specific causes of existshying recurrent traffic congestion in the corridor Freeway bottleneck locations that create mobility constraints are identified and documented and their relative contribution
to corridor-wide congestion is reported The bottleneck locations were determined based on a combination of the use of 2006 PeMS data HiCOMP report probe vehicle tach runs and field observations
Traffic congestion can be categorized as either recurrent
or non-recurrent
recurrent congestion occurs repeatedly at the same place and time of day in a predictable pattern Recurrent congesshytion is often associated with facility capacity limitations changes in capacity conflicting vehicle movements such
as lane merges inadequate number of transit vehicles to handle passenger loads or other persistent physical condishytions of the transportation facility
Non-recurrent congestion is usually attributed to collishysions equipment malfunction community events weather construction projects and other occasional occurrences When transportation systems are close to their maximum
carrying capacity non-recurrent congestion is more likely to occur as there is little excess capacity in the system
The location and extent of the bottlenecks on US 50 found
in the aM and PM peak periods are summarized in Tables 14 and 15 These depictions should be considered a snapshyshot view and not a comprehensive analysis of all bottleshynecks in the corridor Further work is being conducted to
refine the identification and causality of bottlenecks within
the corridor Table 14 shows a summary of the US 50 eastbound bottlenecks while the tables that follow discuss each bottleneck including location and possible causality Table 15 shows a summary of the US 50 westbound bottleshynecks while the tables that follow discuss each bottleneck including location and possible causality Minor or hidden bottlenecks are those Freeway bottleneck
that are not as defined locations that create (or severe) as the major mobility constraints bottlenecks Please note are identified and that the graphics accomshy documented and their panying the bottlenecks
relative contribution to are not to scale
corridor-wide congestion Major bottlenecks in the is reported eastbound direction during the aM peak period are at Howe avenue and during the PM peak period are at 48th Street Howe Avenue Mayhew Road Routier Road Sunrise Boulevard and El Dorado Hills Boulevard Major bottlenecks in the westbound direction during the aM peak period are at El Dorado Hills Boulevard Hazel Avenue Zinfandel Drive
HigHway 50 corridor system management plan [ 47 ]
c h a p t e r s e v e n c o n g e s t i o n a n d b o t t l e n e c k a n a l y s i s
Bradshaw Road and Howe Avenue and major bottleneck
locations during the PM peak period are at Zinfandel Drive Routier Road Bradshaw Road Howe Avenue and Intershystate 5
Causalities for these bottlenecks range from high-traffic
demand (congestion) heavy weavingmerging areas or physical constraints such as lane drops lack of ramp meters incomplete HOV network incomplete Auxiliary Lane
network poorly coordinated traffic signals and an off-ramp
queue (Sunrise Boulevard) US 50 Westbound Onramp
TABLE 14 US 50 EASTBOUnD BOTTLEnECk SUmmARY Source PeMS Caltrans tach runs and
Cambridge Systematics field observations
bottleneck Location PeMS Speed Contours Caltrans Probe Vehicle Runs
Cause aM PM aM PM
A Jefferson Blvd PM 25 Minor Minor Traffic weaving truck volumes and grade
B 48th St PM 7 Minor Major Minor Minor Merge from SR 51 and SR 99
C Howe ave PM 9 Major Major Major weave between Howe and watt
D Mayhew Rd PM 12 Major Minor Major Weaving before Bradshaw Exit
E Routier Rd PM 14 Minor Major Weaving before Mather Field Rd Exit
F Sunrise Blvd PM 185 Minor Major Lane drop HOV add off-ramp queue
G Folsom Blvd PM 22 Minor Minor Lane drop 4 to 3
H El Dorado Hills Blvd PM 275 Major
Poorly coordinated traffic signal on arterial causes spillback onto freeway
a jefferson blvd bottleneck The bottleneck approximately located at Jefferson Blvd is due to weaving traffic as those entershying the freeway from Jefferson Blvd must cross those attempting to exit the freeway to I 5 There is a large number of trucks in the stream which struggle with the grade at this location exacerbatshying the bottleneck
[ 48 ] HigHway 50 corridor system management plan
c h a p t e r s e v e n c o n g e s t i o n a n d b o t t l e n e c k a n a l y s i s
b 48th St bottleneck The bottleneck approximately located at 48th St is due to the additional traffic merging from SR 51 and SR 99 combined with the eventual lane drop at 59th St This queue extends upstream past the off-ramp to SR 5199 These off-ramps are bottlenecks in themselves which spill back and choke the US 50 mainline
C Howe Ave Bottleneck The bottleneck at Howe ave is due to the entering traffic from Howe Ave Two Howe Ave on-ramps feed into US 50 eastbound southbound Howe ave loop on-ramp and northbound Howe ave direct ramp approximately 300 feet apart The watt avenue off-ramp is just down stream with heavy exiting volumes therefore the segment between Howe and watt is characterized by heavy weaving
D mayhew Rd Bottleneck The bottleneck approximately located at Mayhew Rd most likely begins with the additional traffic entering from Watt Ave and ends with the exiting traffic at Bradshaw Rd It is possible that there is a high proportion of weaving traffic with in this section (Watt Ave traffic moving to the left lane and those exiting at Bradshaw Rd moving to the right lane)
HigHway 50 corridor system management plan [ 49 ]
c h a p t e r s e v e n c o n g e s t i o n a n d b o t t l e n e c k a n a l y s i s
[ 50 ] HigHway 50 corridor system management plan
e routier rd bottleneck It is likely that the bottleneck at Routier Rd is due to the same merging conditions associated with Mayhew Rd The area is comprised of both residential and light industrialoffice land uses therefore during the PM peak period there are large volumes of vehicles entering at Bradshaw Rd moving to the left lanes and large volumes of vehicles moving to the right lane to exit at Mather Field Rd
f Sunrise blvd bottleneck At Sunrise Blvd the right-most lane exits while an HOV lane is added as the median lane The bottleneck is formed from vehicles shifting left to avoid exiting at Sunrise Blvd and to enter the HOV lane There is a large volume of vehicles queued at the Sunrise off-ramp which spills back and negatively affects the US 50 mainline
g folsom blvd bottleneck The right-most lane exits to Folsom Blvd leaving one HOV lane and two regular lanes along the US 50 The bottleneck is caused by this lane drop as well as the quick merge at the Folsom on-ramp
c h a p t e r s e v e n c o n g e s t i o n a n d b o t t l e n e c k a n a l y s i s
H The eastbound US 50 at El Dorado Hills Blvd Bottleneck The eastbound El Dorado Hills Blvd bottleneck is caused by a traffic signal on the arterial that often causes spillbacks on the EB loop offramp onto the freeway mainlines
TABLE 15 US 50 WESTBOUnD BOTTLEnECk SUmmARY Source PeMS Caltrans tach runs and Cambridge Systematics field observations
bottleneck Location PeMS Speed Contours Caltrans Probe Vehicle Runs
Cause aM PM aM PM
A El Dorado Hills Blvd PM 275 Major Poorly coordinated traffic
signal on El Dorado Hills Blvd
B Hazel Ave PM 21 Major Entering traffic
C Zinfandel Dr PM 16 Minor Major Major Major Entering traffic
D Routier Rd PM 14 Minor Major Minor Weaving traffic
E Bradshaw PM 13 Major Major Major Merging traffic and curve
F Howe Ave PM 9 Minor Major Major Major Weaving traffic and grade
G SR 51SR 99 PM 6 Minor Lane drop weaving traffic
H i-5 PM 3 Major Weaving traffic
HigHway 50 corridor system management plan [ 51 ]
c h a p t e r s e v e n c o n g e s t i o n a n d b o t t l e n e c k a n a l y s i s
[ 52 ] HigHway 50 corridor system management plan
A El Dorado Hills Blvd Bottleneck The minor bottleneck at El Dorado Hills Boulevard is caused by the traffic signal on El Dorado Hills Blvd that causes spillback on the westbound offramp onto the freeway mainlines
B Hazel Avenue Bottleneck In 2006 the Hazel Ave Bottleneck is caused by the traffic entering at both Hazel Ave and Folsom Blvd (the two on-ramps are separated by about one mile) The bottleneck that would appear at Folsom Blvd combines with the bottleneck at Hazel ave to form a large bottleneck that does not clear until after Hazel ave Sometimes causshying spillbacks as far as Prairies City Road this bottleneck was mitigated in 2007 as part of the GO CALIFORNIA program
C Zinfandel Dr Bottleneck There is heavy traffic coming from Sunrise Blvd but the lane addition immediately after the westbound on-ramp prevents a bottleneck from forming but as traffic flows westward the heavy traffic entering from Zinfandel Dr causes a bottleshyneck here
D Routier Rd Bottleneck The bottleneck at Routier Rd is caused by weaving traffic between Mather Field Rd and Bradshaw Rd This highway segment represents a transition area where vehicles that have been traveling in the left lanes begin to shift to the right lanes to exit while the entering traffic tries to shift to the left lanes
W eav in gLan e Dr o p
c h a p t e r s e v e n c o n g e s t i o n a n d b o t t l e n e c k a n a l y s i s
e bradshaw rd bottleneck The Bradshaw Rd bottleneck is caused by the entering traffic from Bradshaw Road the high truck volumes and the curve west of Bradshaw Two Bradshaw Rd on-ramps feed into US 50 westshybound southbound Bradshaw Rd direct on-ramp and northbound Bradshaw Rd loop on-ramp approximately 400 feet apart
F Howe Ave Bottleneck The Howe ave bottleneck is caused by a grade change and the weaving traffic entering from Howe ave and Hornet Dr competing for the right-most lane with those wanting to exit at 65th Street
G amp H SR 51SR 99 amp I-5 Bottleneck The bottleneck at I 5 is caused by the conflict between entering SR 99 and SR 51 traffic and exiting I-5 traffic as well as the queues formed on the ramps to i-5 which spill back onto US 50 The number of lanes in this section reaches a maximum of 6 and then drops to 4 as two lanes exit at the I-5 freeway This bottleneck is exacershybated during the peak periods when it stretches upstream to the lane drop before SR 99
W ea v in g
Lan e Dr o p
HigHway 50 corridor system management plan [ 53 ]
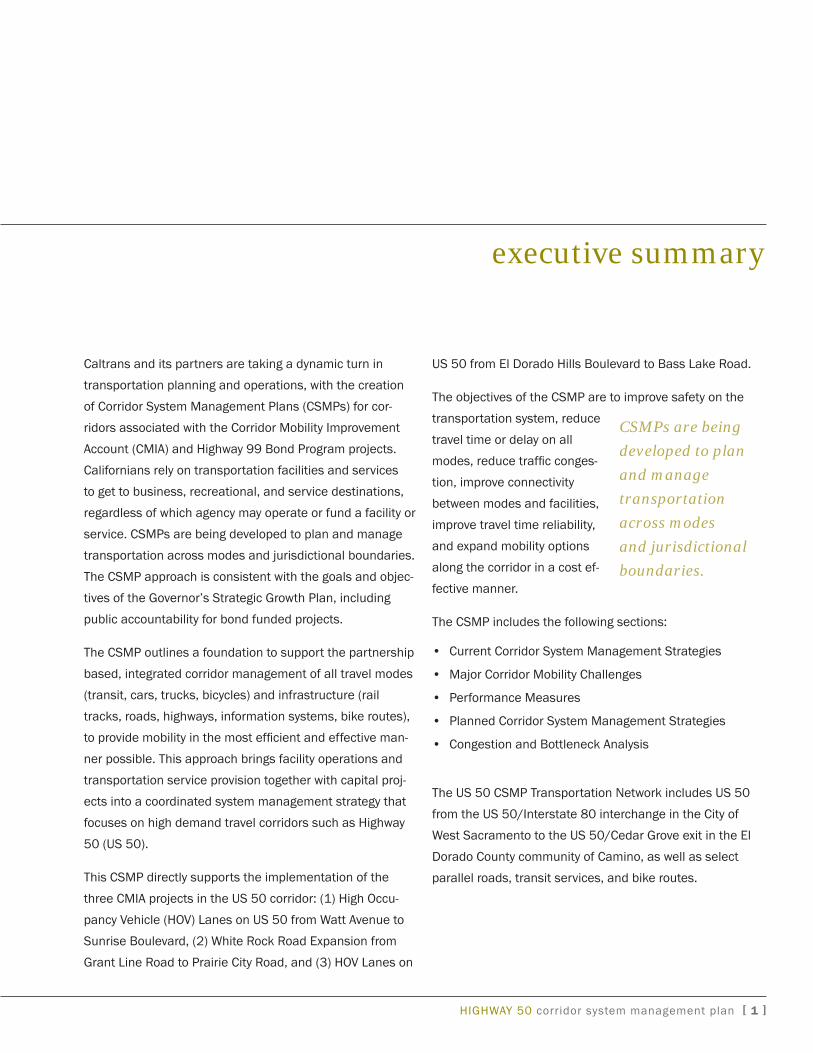
c h a p t e r o n e w h a t i s a C S M P
[ 4 ] HigHway 50 corridor system management plan
An annual State of the Corridor Report will be produced to
document system performance and track CSMP implemenshytation progress and the CSMP will be updated every two years
CSMPs are being created for corridors associated with the Corridor Mobility Improvement Account (CMIA) and Highway 99 Bond Programs supported by the Highway Safety Traf-fic Reduction Air Quality and Port Security Bond Act of 2006 Proposition 1B Figure 2 shows the general location
of each of the CSMP corridors within the Caltrans District 3 area and identifies Proposition 1B projects associated with
the respective CSMP
Each CSMP identifies current system management stratshyegies existing travel conditions corridor performance
management management strategies and capital imshyprovements
The CSMP is consistent with The CSMP is the SACOG MTP the EDCTC consistent with the RTP city and county general
SACOG MTP theplans and regional blueprint
EDCTC RTP cityplanning The CSMP by refershy
and county generalence incorporates all projects plans and regionallisted in the current MTP and
RTP Because the CSMP is blueprint planning corridor focused it highlights key locations where modes interact and land use decisions may have the greatest potential of reducing the need for travel and influencing modal choice
CSMPs will assist in fulfilling the goals of recently enacted
legislation such as Assembly Bill 32 that addressed air quality and green house gas emissions and Senate Bill 375
that addresses land use by
bull Improving mobility on the state highway system to more optimum speeds to reduce vehicle emissions and
bull Providing viable transportation alternatives and accesshysibility across modes to encourage transit and bicycling and decrease single occupant auto use
The CSMP also supports Caltrans policies such as Deputy
Directive (DD) 64 Complete StreetsndashIntegrating the
Transportation System and DD 98 Integrating Bus Rapid
Transit into State Facilities by bringing many modes under the same active management effort thereby ensuring that each mode is analyzed and optimized to work together
The CSMP is based on technical information depicted in four supporting working papers
bull working Paper 1 provided an overview of the corridor system management planning process and a definition of the CSMP transportation network including a ratioshynale for the selection of the specific corridor limits and modes to be included in the corridor planning process
bull working Paper 2 defined current services being proshyvided by the CSMP transportation network proposed performance measures for the corridor and provided baseline data regarding the current CSMP transportashytion network for the proposed performance measures
bull working Paper 3 described existing corridor manageshyment activities including all facilities and services curshyrently in use to maximize mobility within and through the corridor such as traffic operations systems elements facilities such as high occupancy vehicle lanes traveler information services and transportation demand manshyagement programs
bull working Paper 4 provided an assessment of current corridor performance by identifying the major problems inhibiting efficient corridor operations for each element (mode) of the CSMP transportation network
Sacramento Regional Transit Bus with Bicycle Racks
5
W STX ST
WATT AVE
MAROCKINGHAM
DR
OLD PLACER
BRADSHAW RD
VILLE RDTHER FIELD RD
INTERNA TIONAL DR
ZINF ANDEL DR
WHITE ROCK RD FOLSOM BLVD FOLSOM BLVD
SUNRISE BLVD BLU
E RAV
INE R
D
WHITE ROCK RD
SC
OTT R
D
PR
AIR
IEC
ITY R
D
SCOTT RD
GREEN V ALLEY RD
PLACER VILLE DR
FORNI RDM
AIN ST
BROADWAY
CEDAR GROVE EXIT
c h a p t e r o n e w h a t i s a C S M P
Figure 1 US 50 CSMP Transportation Network
Highway 50 Corridor Auburn System Management Plan
193 Transportation Network
US Highway 50 (I-80 to Cedar Grove Exit) 193 80
CSMP Parallel Roads
Light Rail STation Loomis 49
Light Rail
Current HOV Coverage
Express Bus Service Placerville
Corridor Mobility Improvement Account
Class I Bikeways Other State Highways
County Lines Folsom
50
80 HOV Lanes El Dorado Hills Blvd to Bass Lake Rd
HOV Lanes Watt Ave Sacramento to Sunrise Blvd
50 White Rock Rd Expansion Grant Line80 Rd to Prairie City RdWest
Rancho Cordova
4 9
1 6
Sacramento
5 99
84 160
Elk Grove 0 1 2 3 4 5
49 Miles 124 10
HigHway 50 corridor system management plans [ 5 ]
c h a p t e r o n e w h a t i s a C S M P
Table 1 US 50 CSMP TranSPorTaTion neTwork
location US 50 ParallelConnecting roadways Mass Transit bike routes
Heavy rail and light rail bus
route From To County City From To roadway From To operator
Services From To operator
Services From To
yolo City of west Sacramento interstate 80 yoloSacramento
County Line west Capitol Enterprise Boulevard Capitol Mall yCTD 39
Davis Express
west Sacramento
Davis Sacramento west Capitol
avenue yolo
Causeway Tower Bridge
Sacramento City of Sacramento
yoloSacramento County Line
State Routes 99 and 51 wX Streets 5th Street 26th Street RT Downtown
Sacramento Folsom
RT 109 Express
Downtown Sacramento Hazel ave Jedediah Smith Memorial Trail
State Routes 99 and 51 watt avenue mdash mdash mdash
amtrak Capital Corridor
(intercity Rail)
401 i Street Sacramento
auburn CaSan Jose Ca
amtrak Thruway Bus
401 i Street Sacramento
Main Street Placerville
Sacramento UnincorporatedCity of Rancho Cordova
watt avenue Zinfandel Drive
Folsom Boulevard watt avenue Sunrise Boulevard RT Downtown Sacramento Folsom RT 72 Mather Mills
LRT Station watt-Manlove LRT Station Jedediah Smith Memorial Trail
watt avenue Folsom Boulevard US 50
RT Downtown Sacramento Folsom RT 21 Mather Mills
LRT Station Louis Ln
Orlando ave Jedediah Smith Memorial Trail
Bradshaw Road Folsom Boulevard Old Placerville Road
Old Placerville Road Bradshaw Road Rockingham Drive
Rockingham Drive Old Placerville Road Mather Field Road
Mather Field Road Rockingham Drive Zinfandel Drive
Zinfandel Drive international Drive Folsom Boulevard
white Rock Road Zinfandel Drive Sunrise Boulevard
Sunrise Boulevard US 50 Folsom Boulevard
Zinfandel Drive Sunrise Boulevard
white Rock Road Sunrise Prairie City
RT Downtown Sacramento Folsom RT 109
Express Downtown
Sacramento Hazel ave Jedediah Smith Memorial Trail
Folsom Boulevard Sunrise iron Point Road
Notes F = Freeway E = Expressway RT = Sacramento Regional Transit District EDT = El Dorado Transit and FSL = Folsom Stage Lines LR = Light Rail EB = Express Bus LT = Limited LRF = Light Rail Feeder YCTD = Yolo County Transportation District FTS = FairfieldSuisun Transit System UCD = UC Davis Medical Center Shuttle
HigHway 50 corridor system management plans [ 6 ]
c h a p t e r o n e w h a t i s a C S M P
Table 1 US 50 CSMP TranSPorTaTion neTwork (ConTinUed)
location US 50 ParallelConnecting roadways Mass Transit bike routes
Heavy rail and light rail bus
route From To County City From To roadway From To operator
Services From To operator
Services From To
Sacramento
UnincorporatedCity of Folsom
Sunrise Boulevard
Folsom Boulevard
iron Point Road Folsom Boulevard East BidwellScott Road
RT Downtown Sacramento Folsom
iron Point Road Folsom Boulevard Empire Ranch
Scott Road iron Point Road white Rock Road Blue Ravine Road
Folsom Boulevard
green Valley Road
Sacramento Folsom Boulevard
Sacramento El Dorado
County Line
Folsom Boulevard iron Point Road Blue Ravine Road
green Valley Road
SacramentoEl Dorado County
Line
Cameron Park Drive
Blue Ravine Road Folsom Boulevard green Valley Road
Prairie City Road US 50 white Rock Road ED County Transit
authority-iron Point Connector
iron Point Light Rail Station
Missouri Flat Transfer
Center white Rock Road EDSac County Line
Sacramento El Dorado County Line
El Dorado Na Sacramento
El Dorado County Line
Cameron Park Drive
green Valley Road Blue Ravine Road Cameron Park Drive
ED County Transit
authority-Sacramento Commuter
El Dorado County
Sac County
green Valley Road
Cameron Park Drive
Placerville Drive
white Rock Road EDSac County Line Latrobe Road
white Rock Road Latrobe Road Silva Valley Parkway
Silva Valley Parkway white Rock Road Serrano Parkway
El Dorado Na Cameron Park Drive
Missouri Flat Road
green Valley Road Cameron Park Drive Missouri Flat Road
ED County Transit
authority
Cambridge Road
Missouri Flat Road
Ray Lawyer Drive
Placerville Drive Forni Road
Durock Road Cameron Park Drive South Shingle Road
Cameron Park Drive Durock Road US 50
Forni Road Ray Lawyer Drive Forni Road
South Shingle Road Durock Road US 50
El Dorado Na Missouri Flat Road
End of Freeway in Placerville
green Valley Road Missouri Flat Road Placerville Drive
ED County Transit
authority
Missouri Flat Road
Placerville Drive
Main Street Forni Road Clay Street Forni Road Placerville Drive Main Street
Placerville Drive Forni Road US 50
El Dorado Placerville End of Freeway in Placerville
Bedford avenue Start of
Freeway Main Street Placerville Drive Bedford avenue
ED County Transit
authority
Placerville Drive SR 49 ED Bike Trail Clay Street Los Trampas
Road
El Dorado Na Bedford
avenue Start of Freeway
Cedar grove Exit
Main Street Bedford avenue Broadway amtrak
Thruway Bus
Mosquito Road
Placerville
401 i St Sac CaCarson
City Ca Broadway Main Street Point View Drive
HigHway 50 corridor system management plans [ 7 ]
WHITE ROCK RD
c h a p t e r o n e w h a t i s a C S M P
Figure 2 CSMP Corridors in District 3
Corridor System Management Plan
Corridors in District 3 Interstate 80 I-80 between SR 113 and Sierra College Boulevard SR 51 between Highway 50SR 99 and I-8020
Highway 5053 Between I-80 and Cedar Grove Exit
Interstate 5 amp State Route 99 I-5 between Hood-Franklin Rd and State Route 113 SR 99 between San Joaquin County Line and Highway 50 SR 99 between I-5 and SR 20
State Route 99 North29 Between Southgate and Esplanade (in Chico area see inset)
State Route 49 Between I-80 and SR 20
State Route 65 Between I-80 and SR 70
CMIA and State Route 99 Bond Projects
20
Colusa
20
Yuba City Marysville
Grass Valley
La Barr Meadows Widening Project
49 80
Widen to 4 Lanes SR 70 to Feather River Bridge
99
70 Wheatland
65
113 Lincoln Bypass
5
Construct Interchange Operations Improvements Placerville at Elverta Rd HOV Lanes El Dorado
Hills Blvd to Bass Lake Rd
80 Folsom Woodland Rancho 50
Auburn Lincoln
Construct Interchange at Riego Rd Rocklin 49
99 Roseville Roseville Capacity and
Cordova 113 49 505 Sacramento 51
99 Chico Add Auxiliary Lanes
SR 32 to 1st Ave
32 Davis 80
West Sacramento
5
HOV Lanes Watt Ave to Sunrise Blvd
Operational Improvements Mack Rd to Florin Rd
White Rock Rd Expansion Grant Line Rd to Prairie City rd
29 221
113
99
0 105 2 3 4 5 Miles
Galt 0 5 10 15 20
Miles
HigHway 50 corridor system management plans [ 8 ]
need purpose goal and objectives
chapter two
There is a need for a planning approach that brings facility operations and transportation service provision together with capital projects into one coordinated system manageshyment strategy that focuses on high demand travel corridors such as US 50
a CSMP is needed for the US 50 corridor to address severe traffic congestion that often exceeds the capacity of existshying facilities transit ridership demands that exceed the
capacity of the transit system and bicycle facilities that do not provide a fully linked network of bike routes
The purpose of the CSMP is to create a partnership planshyning process that focuses on system management strateshygies and coordinated capital investments so that all the pieces of the corridor function as an efficient transportashytion system and performance evaluation measures are implemented to track the effectiveness of strategies and projects
the CSMP directly supports the implementation of the
three CMia projects on the corridor
bull High Occupancy Vehicle (HOV) Lanes on US 50 from Watt avenue to Sunrise boulevard
bull White Rock Road Expansion from Grant Line Road to Prairie City road
bull HOV Lanes on US 50 from El Dorado Hills Boulevard to bass Lake road
The goal of the CSMP is to improve mobility along the US 50 corridor by focusing on the integrated management of a
subset of the entire transporta- The CSMP directly tion network within the corshy supports the ridor including select freeway implementation and parallel roadways transit
of the three CMIA and bicycle components of the
projects in thecorridor corridor
The objectives of the CSMP are to reduce travel time or delay on all modes improve
connectivity between modes and facilities improve travel
time reliability improve safety on the transportation system and expand mobility options along the corridor in a cost effective manner implementation of the CSMP will increase access to jobs housing and commerce
consistency with other state transportation plans anD policies The CSMP approach is consistent with the goals and objectives of the governorrsquos Strategic Growth Plan which among other things commits to minimizing increases in traffic congestion Key elements of the strategy are illusshytrated in Figure 3
at the base of the pyramid and the foundation of transshyportation system management is system monitoring and evaluation it is essential to understand what is happening on the transportation system so that the best decisions can be made based on reliable data The next few layers up
the pyramid are focused on making the best use of existing
resources and reducing the demand for transportation
HigHway 50 corridor system management plan [ 9 ]
c h a p t e r t w o n e e d p u r p o s e g o a l a n d o b j e c t i v e s
[ 10 ] HigHway 50 corridor system management plan
particularly during peak travel hours The top layer of the pyramid is system expansion This layer assumes that all the underlying components are being addressed and that system capacity expansion investments are necessary
Corridor system management is consistent with the Caltrans Mission
Improve Mobility Across California Corridor system management is consistent with Caltransrsquo goals
bull SafetY Provide the safest transportation system in the nation for users and workers
bull MobiLitY Maximize transportation system performance and accessibility
bull DELIVERY Efficiently deliver quality transportation projshyects and services
bull STEWARDSHIP Preserve and enhance Californiarsquos resources and assets
bull SERVICE Promote quality service through an excellent workforce
The CSMP is also consistent with the California Transportashytion Plan (CTP) the statewide long-range transportation
plan for meeting future mobility needs The CTP defines
goals policies and strategies to achieve our collective vishysion for Californiarsquos future transportation system
Figure 3 Strategic Growth Plan StrategyAir
Quality Planning Corridor System Management seeks to create conditions where vehicle flow on highways and roads occurs at a
steady pace and travelers have a range of mobility options that enable them to travel other than by single occupant vehicle System expansion is focused only where needed
when travel demand exceeds the capacity of the well manshyaged existing system These conditions are beneficial to
attaining air quality goals and reducing green house gas emissions
current corridor system management strategies
chapter three
US 50 is a transcontinental highway that originates in west Sacramento California and terminates in Ocean City Maryland it is a key transportation artery connecting yolo County Sacramento County and fast growing sub regions within Sacramento and El Dorado Counties
The corridor provides access to world renowned recreation areas in the Sierra Nevada Mountains and Lake Tahoe
Basin Peak commute and recreational travel periods are
heavily congested with demand for travel often exceedshying the capacity of existing facilities and services Severe
traffic congestion is common and commute transit services
often operate at maximum ridership capacity There is
extensive and expanding urban development along many parts of the corridor which suggests increased future transportation demand
Given the complexity of the corridor and its extensive geoshygraphic range there are a wide variety of system manageshyment strategies and elements currently being implemented by jurisdictions and transportation service providers Strategies and elements range from vehicle detection deshyvices to traveler information systems to traffic flow control mechanisms a common element among all the strategies and elements is data collection and analysis There is presshyently some system management coordination and intershyjurisdictional partnerships among the entities such as the Sacramento Transportation Area Network (STARNET)
The STARNET web application initial release is anticipated
for the late fall of 2009 Features to be included in the
initial release will include Changeable Message Sign (CMS) display a chain control application integration of Regional Transit data California Highway Patrol incident data connectivity to the 511 systems (web and telephone) Closed Circuit Television (CCTV) display and interagency messaging and coordination [Caltrans Transportation Management Center (TMC) Kingvale Operation Center City of Sacramento Traffic Operation Center (TOC) Sacramento
County TOC Roseville TOC and Elk Grove TOC] STARNETrsquos
associated management There are a widestrategies can and will variety of systemevolve as the application is
implemented throughout management
the region and as addi- strategies and tional features are added elements currently in annual releases being implemented
by jurisdictions and state highway sys-
tem transportation service
providerswith the construction of Californiarsquos state highshyway system virtually complete in the Sacramento region Caltransrsquo major emphasis on highway projects has largely shifted from new construction to focused capacity expanshysions reconstruction operation and maintenance of existshying facilities
The State Highway System has an extensive set of system
management strategies in operation Some cities coun-
HigHway 50 corridor system management plan [ 11 ]
c h a p t e r t h r e e c u r r e n t c o r r i d o r s y s t e m m a n a g e m e n t s t r a t e g i e s
tabLe 2 exiStiNg uS 50 toS eLeMeNtS
County Location PM toS elements
tMS rM HAR rWiS CMS eMS VS CCTV WiM
yolo i-80 to yoloSaC County Line
000 - 316 4 ndash ndash 1 1 ndash ndash 2 2
SaC
YoloSAC County Line to SR99 SR51
L000 - L248 R000
8 7 ndash ndash 3 ndash ndash 7 ndash
SR99SR51 ndash Watt Avenue R000 ndash R534 5 8 ndash ndash 1 1 ndash 3 ndash
watt avenue to Zinfandel Drive R534 ndash R1092 8 7 1 ndash ndash 2 ndash ndash ndash
Zinfandel Drive to Sunrise Blvd R1092 ndash 1250 1 4 ndash ndash ndash 1 ndash ndash ndash
Sunrise Blvd to Folsom Blvd 1250 ndash 1701 4 6 ndash ndash ndash ndash ndash 2 ndash
Folsom Blvd to SACED County Line
1701 ndash 2314 2 8 ndash ndash 1 ndash 1 ndash ndash
ED
SACED County Line to Cameron Park Dr 000 ndash R657 5 ndash ndash ndash 1 ndash 2 ndash ndash
Cameron Park Dr to Missouri Flat Rd R657 ndash R1506 7 ndash ndash ndash ndash ndash ndash ndash ndash
Missouri Flat Rd to End of Freeway R1506 ndash 1725 1 ndash ndash ndash ndash 1 ndash ndash ndash
ED End of Freeway to Bedford Ave 1725 ndash 1811 ndash ndash 1 ndash ndash ndash ndash ndash ndash
ED Bedford Ave to Cedar Grove Rd 1811 ndash R2595 ndash ndash ndash ndash 1 1 ndash ndash ndash
totaL 45 40 2 1 8 6 3 14 2
Notes PM = Post Mile TMS = Traffic Monitoring Station RM = Ramp Meter HAR = Highway Advisory Radio RWIS = Roadside Weather Information System CMS = Changeable Message Sign EMS = Extinguishable Message Sign VS = Visibility Sensor CCTV = Closed Circuit Television System WIM = weigh in Motion Existing TOS Elements as of April 2009
ties and transit operators also have robust system manshyagement elements and programs applied to their facilities or services
There are also specific instances of system management linkages among transportation modes and services at particular locations
Existing management strategies are depicted on Figure 4
and summarized in Table 2
US 50 BusCarpool Lanes in El Dorado County
[ 12 ] HigHway 50 corridor system management plan
c h a p t e r t h r e e c u r r e n t c o r r i d o r s y s t e m m a n a g e m e n t s t r a t e g i e s
These strategies work as a system to gather analyze and disseminate information through the Caltrans TMC inforshymation about collisions other incidents road closures and emergency notifications are fed into this information hub
and disseminated to public and private information users The TMC operates 24 hours a day seven days a week
parallel anD connecting roaDways City of West Sacramento has one CCTV located on west Capitol Avenue between Enterprise Boulevard and Capitol Mall
City of Sacramento operates a TOC Sensors in the street detect the passage of vehicles vehicle speed and the level of congestion
This information is received on a second-by-second (real-time) basis and is analyzed at the TOC
Sacramento County also operates a TOC by gathering information through CCTV cameras CMS HAR and a Fiber Optics (FO) network placed along major traffic
corridors throughout the county
City of rancho Cordova will be installing CCTV cameras and a FO network on Folsom Boulevard in 2009 Currently one CCTV exists on Sunrise Boulevard
between US 50 and Folsom Boulevard Most major traffic corridors are on the network or will be by the end of 2009 The City contracts with the County of Sacramento to operate their systems through the Countyrsquos TOC
City of folsom recently completed installing a FO system
Changeable Message Sign on US 50 at Scott Road
on all of the Cityrsquos major corridors Currently the sole intersection that is monitored via camera is located on iron Point Road and East Bidwell
El Dorado County has three coordinated signals along Francisco Drive at Green Valley Road the Market Place
entrance (east side Safeway Centerwest side Lake
Forest Plaza) and Village Center Drive
City of Placerville utilizes traditional control devices traffic signals and stop signs
transit anD riDesharing Yolo County Transit District (YCTD) uses a Global Positionshying System (GPS) for locating buses in route referred to as
an Automatic Vehicle Location (AVL) system
The AVL System allows users to see where their bus is
located within the last minute
El Dorado Transit Authority utilizes the gPS Zonar System for pre-trip inspections maintenance and real-time vehicle tracking
Sacramento Regional Transit District (SacRT) has in shystalled pre-emptive traffic signals at at-grade intersections
along the Light Rail routes SacRT has a GPS however it is only utilized for analysis purposes
Computer-aided dispatch and Bus Rapid Transit are in
the planning stages In addition SacRT has an online Trip
Planning application to assist transit users During special events such as the California State Fair the Jazz Festival
65th Street Light Rail Station and Transit Oriented Development
HigHway 50 corridor system management plan [ 13 ]
c h a p t e r t h r e e c u r r e n t c o r r i d o r s y s t e m m a n a g e m e n t s t r a t e g i e s
TABLE 3 PARk AnD RIDE LOTS
County Post Mile Facility name Description
Lot use transit Connection
Spaces Spaces occupied
occupancy Rate () Provider and route No
SaC 70 Butterfield Sacramento Regional Transit Gold Line Station
406 129 318 SacRT SacRT LRT Gold Line
SaC 125 Sunrise Sacramento Regional Transit Gold Line Station
487 389 799 RSacRT SacRT LRT Gold Line
SaC 158 Hazel 432 135 306 SacRT SacRT LRT Gold Line
SaC 158 Hazel 33 6 24 SacRT Route 109
SaC 171 Folsom Boulevard 70 58 829 ED Iron Point Connector SacRT LRT Gold Line
ED 2 El Dorado Hills (Latrobe RoadWhite Rock Road) 123 138 1122 ED Iron Point Connector ED Routes
156781112
ED 5 Cambridge Road 59 40 678 ED Iron Point Connector ED Routes 14567891112
ED 86 Ponderosa Road Northeast 28 15 536 ED Iron Point Connector ED Routes 23679101112
ED 86 Ponderosa Road Northwest 111 61 55 ED Iron Point Connector ED Routes 23679101112
ED 86 Durock Road 57 21 368 Na
ED 149 Shingle Springs Drive 19 4 211 Na
ED 122 Greenstone Road 21 4 19 Na
ED 15 Missouri Flat Road 73 44 603 ED Iron Point Connector
ED 158 Fairgrounds Park-and-Ride 200 40 20 ED Iron Point Connector
ED 185 Placerville Station (Mosquito Park- and-Ride) 130 50 385 ED Iron Point Connector
ED Commuter Service
ED 233 Camino Heights 24 1 42 Na
SacRT = Sacramento Regional Transit District ED = El Dorado County Transit Authority Lrt = Light rail train
Survey 2007
the holiday seasons and the Mather Field Air Show SacRT
operates additional service to connect events to light rail stations and offer free service to promote transit use durshying select events The transit routes identified in the CSMP
network are shown in Figure 5
The Sacramento Valley Station in downtown Sacramento is
the 7th busiest station in the national amtrak system and serves as a multi-modal transfer facility There are over 11 million passenger trips annually
Passengers can make connections with numerous local bus services as well as the SacRT light rail system
[ 14 ] HigHway 50 corridor system management plan
c h a p t e r t h r e e c u r r e n t c o r r i d o r s y s t e m m a n a g e m e n t s t r a t e g i e s
Try Transit Changeable Message Sign in Sacramento County
Sacramento County installed pre-emptive traffic signals to give preferential signal timing to transit buses at selected locations that serve high priority transit corridors
SACOG manages the 511 and rideshare programs that cost approximately $1 million per year region-wide to foster carpooling transit ridership vanpooling and bicycling in all areas and corridors The Regional Rideshare Program covers Placer El Dorado Sacramento yolo yuba and Sut-ter counties it is part of a statewide network of rideshare agencies which encourage alternative transportation modes for traveling
Park and Ride lots are located adjacent to or nearby the US 50 corridor utilized by commuters to connect with transit vanpool or carpool Of the sixteen lots many are adjacent to the SacRT Light Rail gold Line providing access for commuters to park their vehicles and commute the re-mainder of their trip via Light Rail El Dorado County Transit authority also uses the park and ride lots as transit stops for their Commuter Buses The locations capacity and occupancy rates of the Park and Ride lots are displayed in Table 3
Bicycle Facilities Bicycle facilities in the corridor are not actively managed in the same manner as motor vehicle facilities
However there are traffic operation systems that serve bicyclists such as dedicated bicycle lanes bicycle detec-tion loops at signalized intersections video detection other non-loop type detection and bicyclist activated signal change buttons The City of Sacramento is installing video detection at some locations
SacRT buses and the new light rail trains are equipped with bicycle racks There are over 170 weatherproof bicycle lock-ers at 23 light rail stations yCTD has the Bikes on Buses Program that allows bicycles to travel on any yOLOBUS
The Sacramento area Bicycle advocates maintain an on-line hazard reporting system to allow users to report hazardous locations for bicyclist such as potholes inad-equate signal timing hazardous railroad crossings insuf-ficient shoulder and inadequate bikeway markings The reports are then sent to the applicable jurisdiction SaCOg is creating an on-line route planning system for bicyclists in addition SaCOg maintains bicycle maps on their website which are currently being updated
The bicycle routes included in the CSMP network are shown on Figures 6 and 7
Pedestrian Facilities Pedestrian facilities are not included as part of the man-aged network because they do not directly provide corridor mobility However complete and safe pedestrian access to appropriate corridor modes such as bike routes and transit services is an important component of corridor system management Therefore subsequent updates of the CSMP will seek to identify key pedestrian facilities and barriers to pedestrian mobility with regard to access and modal con-nectivity
HigHway 50 corridor system management plan [ 15 ]
c h a p t e r t h r e e c u r r e n t c o r r i d o r s y s t e m m a n a g e m e n t s t r a t e g i e s
[ 16 ] HigHway 50 corridor system management plan
Page Inte
ntionally
Left
Blank
MAIN ST
MA
RB
LE V
ALL
EY
RD
65TH ST EXPY
FLYING
C R
D
STATE
HW
Y 16
MA
RB
LE VA
LLEY R
D
CAM
BRID
GE R
D
GREEN VALLEY RD
RIV
ERSI
DE
BLVD
11T
H S
T
RIV
ERSI
DE
BLVD
HO
WE
AV
E
EL DORADO
HILLS BLVD
EL DORADO H
ILLS BLV
D
HORNET DR
JEFF
ERSO
N BL
VD
CAM
ERO
N PAR
K DR
PO
WE
R IN
N R
D
CO
UN
TY HW
Y E3
BRADSHAW RD
MATHER FIELD RD
ZINFAN
DEL D
R
11TH
ST
VD
FOLSOM BLFOLSOM BLVD
FOLSOM BLVD
FOLSO
M BLVD
WHITE ROCK RD
FOLSOM BLVD
FOLS
OM
BLV
D
LATRO
BE RD
CANAL ST
16TH
ST
JACQ
UIER
RD
15TH
ST
HARBOR BLV
D
STOCKTON BLVD
FORNI RD BIDW
ELL DR
WATT AVE
PLACERVILLE DR
TOW
ER G
ATEW
AY
SHIN
GLE SPR
ING
S DR G
REEN
STON
E RD
59TH
ST
SUN
RISE BLVD
EL D
OR
AD
O R
D
HAZEL AVE
SOUT
H RI
VER
RD
PON
DER
OSA R
D
SHIN
GLE SPR
ING
S RD
SHIN
GLE
SPR
ING
S R
D
CARSON RD
MISSO
URI FLAT RD
BASS LAKE RD
N SH
ING
LE RD
PRAIR
IE CITY R
D
S SHIN
GLE R
D
SHIN
GLE
RD
SCOTT RD
W S
T AT
5TH
ST
65TH
ST
5TH
ST
X
ST A
T 27
TH
80
CEDAR GROVE EXIT
MO
SQU
ITO R
D
PLACERVILLE DRMISSOURI
FLAT RD
FORNIRD
EL D
OR
AD
OR
D
POIN
T VIEW D
RSM
ITH FLAT R
D
SCH
NELL SC
HO
OL R
D
MO
NTER
EY RD
c h a p t e r t h r e e c u r r e n t c o r r i d o r s y s t e m m a n a g e m e n t s t r a t e g i e s
Figure 4 Existing Traffic Operations Systems Elements
Highway 50 Corridor Systems Management Plan Existing Traffic Operations Systems Excluding Ramp Meters
TOS ndash Traffic Operations Systems
Stations Continuous Coverage
EMS ndash Extinguishable Message Sign WIM ndash Weigh-in-Motion Location (EMS Usually Refers Motorist to HAR)
Television System
19365TMS ndash Traffic Monitoring99 US Highway 50VS ndash Fog (Visibility) Sensor
CCTV ndash Closed Circuit
I-80 to Cedar Grove Exit HAR ndash Highway Advisory Radio Local Road Interchange Access
White Rock RdRWIS ndash Roadside WeatherCMS ndash Changeable Sunrise Blvd to Latrobe Rd
Message Sign Information System
50
80
51
49 160
50
Placerville to Cedar Grove Exit
50
1935
16 49
99
84 160
49 MilesMiles 0 1 2 3 4 50 1 2 3 4 5 10
HigHway 50 corridor system management plans [ 17 ]
124 49
MOTHER LODE DR
MATHER FIELD RD
West Terminus
RAMP
RAMP
RAMPRAMP
RAM
P
RAMP
RAM
P RAMP
RAMPRAMP
RA
MP
RAM
P RAM
P
RAMP
RAM
P
RAM
P
RA
MP
RAM
P
RAM
P
YoloBus Express Routes Plus Routes 42A and 42B
RAMPBROADWAY
65TH
ST
PCE
65
SCRY42A
Y44Y4343
242 IPC
5
W STX ST
WATT AVE
MAROCKINGHAM
DR
OLD PLACER
BRADSHAW RD
VILLE RDTHER FIELD RD
INTERNATIONAL DR
ZINFANDEL DR
WHITE ROCK RD FOLSOM BLVD FOLSOM BLVD
SUNRISE BLVD
BLUE R
AVIN
E RD
WHITE ROCK RD
SC
OTT R
D
PR
AIR
IEC
ITY R
D
LATROBE RD
GREEN V ALLEY RD
PLACERVILLE DR
FORNI RDM
AIN ST
BROADWAY
CEDAR GROVE EXIT
WEST
CAPTOL AVE
(WESTMOST
STOP)
(WESTMOST STOP)
SCR
SCR
IPC
IPC
c h a p t e r t h r e e c u r r e n t c o r r i d o r s y s t e m m a n a g e m e n t s t r a t e g i e s
Figure 5 US 50 CSMP Network Transit Routes
Highway 50 Corridor System Management Plan 80
CSMP Commuter Transit Network
El Dorado County Transit Authority 65
IPC Iron Point Connector
SCR Sacramento Commuter Route 193
Sacramento Regional Transit District 109ndashHazel Express
Yolo Bus (Express) Y43 Y44 Y230 Y231 and Y232
Yolo Bus (All-Day Intercity amp Airport Service) Y42A (Clockwise) Y42B (Counter-clockwise)
LATROBE RD
Park-and-Ride Lots
193 65
49 US Highway 50 (I-80 to Cedar Grove Exit)
Parallel Roads
Light Rail STation
Light Rail
Class I Bikeways Other State Highways
County Lines
80
49
50
80160
50
5 84 16
4999
Miles 0 5 10160
HigHway 50 corridor system management plans [ 18 ]
K
5
FOLSOM BIKE TRAIL
SEE CENTRAL CITY BICYCLENETWORK MAP FOR BICYCLE
F ACILITY NAMES
AMERICAN RIVER PARKWAY TRAIL SYSTEM
(INCLUDING JE
DEDIAH SMITH MEMORIAL T
RAIL)
FOLSOM BLVD
WHITE ROCK RDSIL V A V ALLEY PKWY
EL D
OR
AD
O H
ILLS B
L VD
GREEN VALLEY RD
AMERICAN R
IVER PARKWAY
TRAIL
SYSTEM
(INCLU
DING JE
DEDIAH SMITH
MEMORIA
L TRAIL)
NATOMA ST
FOLSOM BLVD
EL DORADO TRAIL
CARSON RD
PLACER VILLE RD
RAY
LAW
YER
DR
c h a p t e r t h r e e c u r r e n t c o r r i d o r s y s t e m m a n a g e m e n t s t r a t e g i e s
Figure 6 US 50 CSMP Network Bicycle Routes
Highway 50 Corridor System Management Plan
Bicycle Route Network
Class I Bicycle Facilities
Class II Bicycle Facilities
193
Lincoln
65
Rocklin
Auburn
Folsom 49
193
Light Rail Stations
Light Rail Loomis50
RosevilleUS Highway 50 CSMP Corridor
Other State Highways Miles
County Lines 0 1 2 3
99
49 80
50
160 80 193
Placerville 50
West Rancho 50 Sacramento Cordova
5 0 49
8 4
9 9 Sacramento
1 6 4 9
0 1 2 Miles
3
1 6 0 Elk Grove 210 210 44 66 88
Miles 10 Miles
10 1 2 4
4 9
HigHway 50 corridor system management plans [ 19 ]
13TH
ST
H ST E ST BELVEDERE AVE
51ST
ST
BROADWAY H ST
48TH
ST
11TH
ST
PO
WE
R IN
N R
D
28TH
ST
STOC
KTON
BLVD3R
D ST
ALH
AMBR
AFR
ON
T BLV
D S
T
W CAPITOL A VE
DISCOVER Y
P ARK BRIDGE
JEDED
IAH
N ST
T ST
K ST
11TH
ST
RIV
ERSI
DE
BLV
D
18TH
ST
R S
T17
TH S
TO
ST
18TH
ST
20TH ST
CAPITOL AVE
T ST
28TH
ST
34TH
ST
39TH
ST
M ST
BROADWAY
T ST
FOLSOM BLVD
58TH
ST
J ST
65TH
ST
CSU
S
CO
NN
ECTIO
NS
SR 16JACKSON HWY
FOLSOM BLVD
LA RIVIERA DR
W ATT AV
E
HO
WE A
VE
GUY W
EST B
RIDE
COLLEGE TOWN DR
c h a p t e r t h r e e c u r r e n t c o r r i d o r s y s t e m m a n a g e m e n t s t r a t e g i e s
Figure 7 US 50 CSMP Network Bicycle Routes (Sacramento Insert)
5 Sacramento
8 0
8 0
160
West Sacramento
80
SMITH MEMORIAL TRAIL
50
US Highway 50 Corridor System Management Plan 50
Central City Bicycle Route Network 50
Bikeway and Multi-Use Network
US Highway 50 (I-80 to Cedar Grove Exit)
Class I Bicycle Facilities
Class II Bicycle Facilities
Connecting Routesndashno Bicycle Designation
80 16 5
BROADWAY
FLOR
IN-P
ER
KIN
S R
D
Light Rail STation 99
Light Rail
Other State Highways
County Lines
HigHway 50 corridor system management plans [ 20 ]
major corridor mobility challenges
chapter four
High demand for mobility services especially during peak commute periods is creating significant traffic congestion
and impairing mobility in the corridor Heavy congestion and stop-and-go traffic contributes to increased vehicle
emissions and added travel costs Many transit services are operating at maximum passenger carrying capacity and buses often must contend with the same congestion as autos in many locations bicyclists have to compete for space on these same facilities
Much of the congestion can be attributed to population growth residential and commercial development job housing imbalances work schedules that require commute trips during peak travel times recreational trip generators and truck traffic
The overall amount of travel in the corridor has increased dramatically over the past ten years and is expected to
continue to increase as the region adds approximately
one million new residents over the next 25 years per the current SACOG MTP 2035 Traffic congestion per houseshyhold is expected to increase 18 percent over 2005 levels
by the year 2035
in the general area of eastern Sacramento County and western El Dorado County the Highway 50 Partnership
has projected growth of 78000 more dwelling units and 53000 new jobs over the next 25 years Current and foreshycasted data is depicted in Table 4
The sections of US 50 with particularly severe traffic
congestion are depicted in Figures 8 and 9 These are
also summarized in greater detail in Tables 14 and 15 in Chapter 7 Table 14 shows a summary of the US 50 eastbound bottlenecks while the tables that follow discuss each bottleneck including location and possible causality Table 15 shows a summary of the US 50 westbound bottleshynecks while the tables that follow discuss each bottleneck including location and possible causality Minor or hidden bottlenecks are those that are not as defined (or severe) as the major bottlenecks Please note that the graphics acshycompanying the bottlenecks are not to scale
a critical component of identifying and resolving Traffic congestion per corridor mobility challenges household is expected is the need for detailed to increase 18 percent data analysis and comshy over 2005 levels by the munication regarding
year 2035system performance Data collection is insufficient to
fully meet these needs but still provides useful information as detailed in the following pages improving data gathershying analysis and dissemination of information is a major challenge for this corridor and is a component of intelligent Transportation Systems planning
HigHway 50 corridor system management plan [ 21 ]
c h a p t e r f o u r m a j o r c o r r i d o r m o b i l i t y c h a l l e n g e s
[ 22 ] HigHway 50 corridor system management plan
Figure 8 US 50 AM Peak Period Bottleneck Locations
Figure 9 US 50 PM Peak Period Bottleneck Locations
Challenges along the corridor include
bull severe recurrent highway and roadway traffic congestion
bull an incomplete buscarpool lane system
bull an incomplete set of freeway auxiliary lanes
bull loss or dropping of freeway lanes at specific locations
bull incomplete ramp metering
bull limited parallel roadway capacity
bull lack of signal coordination on key arterials and freeway ramp intersections
bull transit facilities approaching capacity
bull inadequate transit capital and operations funding needed to grow transit ridership
bull light rail at-grade crossings
bull lack of adequate access to transit across US 50
bull lack of double tracking of the light rail Gold Line to Folsom
bull poor pavement and road and bicycle route maintenancesweeping
bull lack of sufficient bicycle activated signal change devices
bull motorist driving behavior
bull inadequate bicycle storage
bull inadequate bicycle and pedestrian access to transit and
bull gaps and barriers within the bicycle route network
Additionally the EDCTC has identified safety and operashytional issues between the Smith Flat interchange and east of the Upper Carson RoadCamino intersection in the
Camino Area Parallel CapacitySafety Study Transporshytation issues include at-grade access to US 50 left turn conflicts across US 50 increasing average daily local and
interregional traffic growth in the area lack of alternate
routes seasonal traffic to and from Apple Hill and other local events and seasonal access to recreation in the Lake
Tahoe Region
c h a p t e r f o u r m a j o r c o r r i d o r m o b i l i t y c h a l l e n g e s
Table 4 CUrrenT and ForeCaSTed TraFFiC daTa
location Current Traffic data ndash 2007 Future Traffic data ndash 2027 (no build) Future Traffic data ndash 2027 (build)
County description amp location of Trucks
Peak directional
Split
Peak Hour Traffic
average annual daily
Traffic2
Volume over Capacity3
Peak Hour Traffic
average annual daily Traffic2
Volume over Capacity3
(no-build)
Peak Hour Traffic
average annual daily
Traffic2
Volume over Capacity3
(build)
yOL interstate 80 to yoloSacramento County Line
6 60 15500 180000 109 23911 277032 169 24070 278880 136
SaC yoloSacramento County Line to State Routes 99 and 51
4 59 21000 253000 135 28080 312480 186 29153 324415 193
SaC State Routes 99 and 51 to watt avenue 4 59 20600 225000 145 27942 286230 189 30648 313950 166
SaC watt avenue to Zinfandel Drive 4 59 16700 187000 115 24783 274540 163 25885 286750 136
SaC Zinfandel Drive to Sunrise Boulevard 4 60 13500 149000 093 20331 224394 133 20925 230950 110
SaC Sunrise Boulevard to Folsom Boulevard 4 66 11900 125000 089 18888 198247 131 20086 210820 140
SaC Folsom Boulevard to SacramentoEl Dorado County Line
3 66 8800 95000 087 13341 151311 133 13612 154380 136
ED SacramentoEl Dorado County Line to Cameron Park Drive
4 61 6900 70000 095 11454 116200 165 11834 120050 114
ED Cameron Park Drive to Missouri Flat Road
4 62 5700 62000 092 8647 94054 132 9462 102920 096
ED Missouri Flat Road to End of Freeway in Placerville
4 57 4850 59000 069 7101 76245 098 7363 79050 102
ED End of Freeway in Placerville to Bedford avenue
4 55 4800 52000 Na 4 6595 74196 Na4 6648 74790 Na4
ED Bedford avenue to Cedar grove Exit 4 62 3800 38500 077 5474 50782 099 5520 51205 099
1 Peak Directional Split The percentage of total traffic in the heaviest traveled direction during the peak hour2 Average Annual Daily Traffic (AADT) The average number of vehicles per day in both directions 3 Volume over Capacity (VC) The volume of traffic compared to the capacity of the roadway4 Volume over Capacity does not determine LOS for two- or three-lane facilities or segments with intersection delay 5 Reported Collision Rate index ( Compared to State average) The percentage by which each segmentrsquos reported collisions rate (fatal injury and property damage only) is above or below the statewide average reported collisions rate on comparable facilities
Source 3-Year Caltrans Traffic Accident Surveillance and Analysis System data
HigHway 50 corridor system management plans [ 23 ]
c h a p t e r f i v e p e r f o r m a n c e m e a s u r e s
Page Inte
ntionally
Left
Blank
[ 24 ] HigHway 50 corridor system management plan
performance measures
chapter five
Continuing corridor monitoring and performance mea-
sures are an integral part of corridor management and investment decision making and help identify immediate efficient and effective system operational strategies and
capital improvements Performance measures provide the
important dynamic daily information needed to rapidly
address operational problems caused by recurrent and
non-recurrent traffic congestion Measures are also used to identify the best improvement actions to generate the desired results
Table 5 identifies the performance measures to be used as
part of the corridor system management process
Baseline Data For perFormance measures Tables 6 7 and 8 display baseline data for the perforshymance measures for the CSMP transportation network
The performance data was primarily compiled from the SACMET demand based traffic model the year 2007
edition of the Traffic Volumes Manual the year 2000 edition of the Highway Capacity Manual Caltrans Traffic
Accident Surveillance and Analysis System (TASAS) the 2007 Caltrans Division of Maintenance Pavement Summary Report and ridership records provided by the transit providers
additional performance Performance Measures data was derived from the provide the important Performance Measurement dynamic dailySystem (PeMS) tool an
information needed internet based tool used to
to rapidly addresshost process retrieve and operational problemsanalyze road traffic condishy
tions information from caused by recurrent
real-time and historical and non-recurrent data PeMS obtains 30-sec- traffic congestion ond loop detector data in real-time from detectors installed along the highway corridor
It should be noted that Average Daily Traffic (ADT) and LOS
for some ParallelConnecting Roadways segment locations
in Table 7 was not available These are noted ldquoNo Datardquo
Data collection for non-auto modes is not as robust as what is needed for active system management Subsequent updates of this CSMP will seek to expand the
availability of transit and bicycle performance data collection
HigHway 50 corridor system management plan [ 25 ]
mdash
c h a p t e r f i v e p e r f o r m a n c e m e a s u r e s
TABLE 5 PERFORmAnCE mEASURES DEFInITIOnS AnD APPLICABILITY
Performance Measure Definition of Performance measure applicability to Corridor
STATE HIGHWAY SYSTEm
LOS A ldquoreport cardrdquo measurement with ldquoArdquo being the least amount of
congestion and ldquoFrdquo being the most congestion LOS is a relatively simple and widely used measure which
offers comparison opportunities
Total Vehicle Hours of Delay The additional travel time in hours experienced by all vehicles on the highway segment per day or at peak hour due to congestion
This measurement is used to determine the cost in time which congestion can add to the regular travel time that it takes to traverse a segment of road and is useful in
quantifying the performance of a particular roadway in an understandable format
Total Person Minutes of Delay The additional travel time in minutes experienced by all persons in vehicles on the highway segment per day or at peak hour due
to congestion
This measurement is used to determine the cost in time which congestion can add to the regular travel time that it takes to traverse a given segment of road and is useful in quantifying the performance of a particular roadway in an
understandable format and for comparison of improvement options
Minutes of Delay per Vehicle The additional travel time in minutes experienced by each vehicle on the highway segment at peak hour due to congestion
This measurement is used to determine the cost in time which congestion can add to the regular travel time that it
takes to traverse a given segment of road
Minutes of Delay per Person The additional travel time in minutes experienced by each person in vehicles on the highway segment at peak hour due to congesshy
tion
This measurement is used to determine the cost in time which congestion can add to the regular travel time that it
takes to traverse a given segment of road
Vehicle Travel Time (Minutes) The average time spent by vehicles traversing between two points on a road or highway
Travel time is a measure used to quantify travel time deficienshycies and provide a personal indicator of congestion impacts
Distressed Pavement Pavement that rides rougher than established maximums and or exhibits substantial structural problems as determined by the
Pavement Condition Survey
This measurement provides a ride quality indicator and an indicator for structural roadway problems
Reported Collision Rate Comparison of the actual total collision rate () along a highway segment above or below the statewide average for fatal injury
and property damage-only collisions on comparable facilities
Comparing the total collision and rate with statewide average rate provides an opportunity to assess safety conditions
through the corridor
Reliability Identifies day-to-day variation in travel time for the same trip at the same time of day Focuses on the predictability of travel time
particularly for repetitive trips
Estimates reliability by defining the extra time travelers must add to their average travel time when planning trips to ensure on-time arrival (0 percent no day-to-day variations
100 percent double allotted travel time)
Lost Productivity Measures the capacity of the corridor to accommodate vehicle or person throughput and is calculated as actual volume divided by
the capacity of the highway
As traffic volumes increase to roadway capacity speeds decline rapidly and vehicle throughput drops dramatically which increases traffic congestion and delay and results in
lost productivity
[ 26 ] HigHway 50 corridor system management plan
mdash
c h a p t e r f i v e p e r f o r m a n c e m e a s u r e s
HigHway 50 corridor system management plan [ 27 ]
TABLE 5 PERFORmAnCE mEASURES DEFInITIOnS AnD APPLICABILITY (ConTInued)
Performance Measure Definition of Performance measure applicability to Corridor
PARALLEL AnD COnnECTInG ROADWAYS
LOS A ldquoreport cardrdquo measurement with ldquoArdquo being the least amount of
congestion and ldquoFrdquo being the most congestion LOS is a relatively simple and often used measure which
offers comparison opportunities
traNSit
available Capacity Ratio () of available transit capacity alternatives within the corridor
This measure indicates the available capacity to accommoshydate diverted travelers from single occupant vehicles
c h a p t e r f i v e p e r f o r m a n c e m e a s u r e s
[ 28 ] HigHway 50 corridor system management plan
Page Inte
ntionally
Left
Blank
c h a p t e r f i v e p e r f o r m a n c e m e a s u r e s
Table 6 US 50 PerForManCe MeaSUreS
County location Post Miles
distance (Miles)
average annual daily Traffic1
PerForManCe MeaSUreS
loS1
Total Vehicle Hours of delay2
Total Person Minutes of delay2
Minutes of delay per Vehicle2
Minutes of delay per Person2
Vehicle Travel Time (Minutes)2 distressed
Pavement (lane
Miles)4
reported Col-lision rate
Comparison ()5
reliability6 lost Productivity7
daily Peak Hour3 daily Peak
Hour3 Peak Hour3 Peak Hour3 Peak Hour3 eastbound westbound lost lane Miles aM
Peak Period
lost lane Miles PM
Peak Period
STaTe HigHway SySTeM
yOL interstate 80 to yolo Sacramento County Line
000 to 316 316 180000 F 1169 126 95363 8061 049 046 36 9 26 62 22 01 0
SaC
yoloSacramento County Line to State Routes 99
and 51
L000 to L248 R000
248 253000 F 4993 653 407455 41746 186 175 43 7 20 64 60 53 76
State Routes 99 and 51 to watt avenue
R000 to R534 534 225000 F 10097 1362 823883 87105 397 372 93 15 24 60 48 81 68
watt avenue to Zinfandel Drive
R534 to R1092 558 187000 F 8075 977 658886 62506 351 329 91 19 -32 56 42 44 23
Zinfandel Drive to Sunrise Boulevard
R1092 to 1250 158 149000 E 1271 197 103727 12610 088 082 25 9 -33 46 13 0 16
Sunrise Boulevard to Folsom Boulevard
1250 to 1701 451 125000 E 3087 356 251940 25832 180 149 63 5 -14 60 46 1 45
Folsom Boulevard to SacramentoEl Dorado
County Line
1701 to 2314 613 95000 D 583 122 47537 8867 083 069 70 0 -11 19 55 0 08
ED
SacramentoEl Dorado County Line to Cameron
Park Dr
000 to R657 657 70000 E 504 126 41150 9138 110 091 77 1 -35 PeMS Data
Unavailable PeMS Data Unavailable
PeMS Data Unavailable
PeMS Data Unavailable
Cameron Park Drive to Missouri Flat Road
R657 to R1506 849 62000 E 302 75 24633 4827 079 075 93 2 -61 PeMS Data
Unavailable PeMS Data Unavailable
PeMS Data Unavailable
PeMS Data Unavailable
Missouri Flat Road to End of Freeway in Placerville
R1506 to 1725 219 59000 D 66 16 5376 1053 020 019 24 1 20 PeMS Data
Unavailable PeMS Data Unavailable
PeMS Data Unavailable
PeMS Data Unavailable
End of Freeway in Placerville to Bedford avenue
1725 to 1811 086 52000 D 68 17 5585 1094 021 020 15 2 81 PeMS Data
Unavailable PeMS Data Unavailable
PeMS Data Unavailable
PeMS Data Unavailable
Bedford avenue to Cedar grove Road
1811 to R2595 784 38500 D 58 15 4758 932 023 022 85 10 6 PeMS Data
Unavailable PeMS Data Unavailable
PeMS Data Unavailable
PeMS Data Unavailable
TOTaL mdash 5473 mdash mdash 30273 4042 2470293 263771 1587 1449 7150 80 mdash mdash mdash mdash mdash
1 Source Average Annual Daily Traffic and Level of Service (LOS) calculated is based on 2007 Caltrans Traffic Volumes on California State Highways and Highway Capacity Manual and Cambridge Systematics from 2008 Reported LOS is for the typical most congested daily peak travel period 2 Source Delay is the average additional travel time by vehiclespersons traveling under 60 mph Data derived from 2007 HICOMP report SACMET Travel Demand Model PeMSs traffic data and Caltrans District 3 Traffic Operations Probe vehicle Tach runs 3 Peak Hour is during PM 4 Source 2007 Caltrans Division of Maintenance Pavement Summary Report 5 Source 2004 through 2007 Caltrans Traffic Accident Surveillance and Analysis System summary data of the percentage above or below the statewide average for fatal injury and property damage-only collisions on comparable facilities 6 Reliability The Planning Time Index is a measure of the reliability of the travel time on a particular route It is the ratio of the 95th percentile of travel time on a route to the median free-flow travel time This means itrsquos the amount of time a traveler needs to allocate for a route if they want to show up on time 19 out of 20 trips Reliability and Planning Time data was taken from April 2007 The data covered a 24-hour period of time on each Tuesday wednesday and Thursday of that month That data was then aggregated into a single average 24-hour day it was then analyzed to determine the highest average aM and PM travel time That time was then compared to the best possible average travel time to determine the additional time that was spent traveling the same seg-ment 7 Lost Productivity Data taken April 2007 PeMS As traffic increases to the capacity of the highway speeds decline throughput drops dramatically and the efficiency of the highway to provide mobility decreases This decline in the potential carrying-capacity of the freeway is expressed in terms of how many equivalent lane miles of roadway are lost
HigHway 50 corridor system management plans [ 29 ]
c h a p t e r f i v e p e r f o r m a n c e m e a s u r e s
Table 7 Parallel and ConneCTing roadwayS PerForManCe MeaSUreS
County location average
daily Traffic1
PerForManCe MeaSUreS
loS1
Total Vehicle Hours of delay2
Total Person Minutes of delay2
Minutes of delay per Vehicle2
Minutes of delay per Person2
Vehicle Travel Time (Minutes)2
distressed Pavement
(lane Miles)4
daily Peak Hour3 daily Peak
Hour3 Peak Hour3 Peak Hour3 Peak Hour3
Parallel and ConneCTing roadwayS
yOL west Capitol Enterprise Boulevard to Capitol Mall 13737 No Data
Data is unavailable for these performance measures at this time however will be pursued in the next phase of the CSMP
SaC
w 5th Street to 26th Street 9194 a
X 5th Street to 26th Street 9154 a
Folsom Boulevard watt avenue to Bradshaw Road 25600 C
watt avenue Folsom Boulevard to US 50 63900 F
Bradshaw Road Folsom Boulevard to US 50 22400 a
Folsom Boulevard Bradshaw Road to Sunrise Boulevard 20400 a
Bradshaw Road Old Placerville to US 50 54405 F
Old Placerville Road Bradshaw Road to Rockingham Drive 11864ndash18365 a
Rockingham Drive Old Placerville Road to Mather Boulevard 16516 E
Mather Boulevard Rockingham Drive to Folsom Boulevard 21732 C
international Drive Rockingham Drive to Zinfandel Drive 12808 a
Zinfandel Drive international Drive to Folsom Boulevard 22298ndash47032 BE
white Rock Road Zinfandel Drive to Sunrise Boulevard 25459 a
Sunrise Boulevard US 50 to Folsom Boulevard No Data No Data
white Rock Road Sunrise Boulevard to Prairie City Road 3400 B
Folsom Boulevard Sunrise Boulevard to iron Point Road 17200 a
white Rock Road grant Line Road to EDSaC County Line 6700 D
iron Point Road Folsom Boulevard to East BidwellScott Road 13984 No Data
Scott Road iron Point Road to white Rock Road No Data No Data
Folsom Boulevard iron Point Road to Blue Ravine Road No Data No Data
Blue Ravine Road Folsom Boulevard to green Valley Road No Data No Data
Prairie City Road US 50 to white Rock Road 6000 D
HigHway 50 corridor system management plans [ 30 ]
c h a p t e r f i v e p e r f o r m a n c e m e a s u r e s
Table 7 Parallel and ConneCTing roadwayS PerForManCe MeaSUreS (ConTinUed)
County location average
daily Traffic1
PerForManCe MeaSUreS
loS1
Total Vehicle Hours of delay2
Total Person Minutes of delay2
Minutes of delay per Vehicle2
Minutes of delay per Person2
Vehicle Travel Time (Minutes)2
distressed Pavement
(lane Miles)4
daily Peak Hour3 daily Peak
Hour3 Peak Hour3 Peak Hour3 Peak Hour3
Parallel and ConneCTing roadwayS
ED
green Valley Road EDSaC County Line to Francisco Drive 22600 D
Data is unavailable for these performance measures at this time however will be pursued in the next phase of the CSMP
green Valley Road Francisco Drive to Silva Valley Parkway 13077 D
green Valley Road Silva Valley Parkway to Cameron Park 9849 C
green Valley Road Cameron Park Drive to Deer Valley Road 5278 C
green Valley Road Deer Valley Road (East) to Lotus Road 8381 D
green Valley Road Lotus Road to Placerville Drive 4669 C
Latrobe Road white Rock Road to US 50 24742 C
Durock Road Cameron Park Dr to South Shingle Road 7278 C
Cameron Park Drive Durock Road to US 50 (Durock Road to Coach Lane Coach Lane to US 50) 9544 26603 CD
South Shingle Road Durock Road to US 50 11390 D
white Rock Road EDSaC County Line to Latrobe 12808 D
white Rock Road Latrobe Rd to Silva Valley Pkwy (Latrobe to PostPost to Silva Vlly Pkwy) 10124 CD
Silva Valley Parkway white Rock Rd to Serrano Pkwy (white Rock to Entrada Entrada to Serrano Pkwy) 13708 9328 DC
Forni Road Placerville Drive to Main Street 9049 8379 No Data
Placerville Drive Forni Road to US 50 No Data No Data
Main Street Placerville Drive to Bedford avenue No Data No Data
Main Street Bedford avenue to Broadway No Data No Data
Broadway Main Street to Point View Drive No Data No Data
1 Source Average Daily Traffic and Level of Service (LOS) calculated are based on City of Sacramento between 2001 and 2007 Sacramento County from 20072008 City of Rancho Cordova between 2004 and 2007 and El Dorado County from 2007
HigHway 50 corridor system management plans [ 31 ]
c h a p t e r f i v e p e r f o r m a n c e m e a s u r e s
Page Inte
ntionally
Left
Blank
[ 32 ] HigHway 50 corridor system management plan
c h a p t e r f i v e p e r f o r m a n c e m e a s u r e s
tabLe 8 traNSit PerforMaNCe MeaSure
County transit Provider route Performance Measure
available daily Capacity ()1 available Peak Hour Capacity1
traNSit
SaC
SacRT (Bus)
Route 21 70 10
Route 28 76 59
Route 36 83 74
Route 38 66 44
Route 72 56 20
Route 73 79 45
Route 74 82 43
Route 109 47 22
SacRT (Light Rail) Gold Line 31 Exceeds Capacity
EDSAC ED County Transit Authority
Commuter Express Bus Service Not applicablendashOperates Peak Hour
Only 405
iron Point Connector 764 Not available
Reverse Commuter Not applicablendashOperates Peak Hour Only 982
yoloSaC yolo County Transit District Not applicablendashOperates Peak Hour Only 498
biKe3
1 Source average Daily and Peak Hour available Capacity calculated from each transit providerrsquos route ridership data 2 The Reverse Commuter service is offered on vehicles that are returning to El Dorado County (Commuter Express Buses) 3 Bicycle performance measure(s) will be identified applied and included in the subsequent CSMPs
HigHway 50 corridor system management plan [ 33 ]
c h a p t e r f i v e p e r f o r m a n c e m e a s u r e s
[ 34 ] HigHway 50 corridor system management plan
Page Inte
ntionally
Left
Blank
planned corridor system management strategies
chapter six
ConCept LoS and ConCept FaCiLit y ldquoConcept LOSrdquo and ldquoConcept Facilityrdquo have traditionally been used in Caltrans TCCRs to reflect the minimum level or quality of operations acceptable for each route segment within the 20-year planning period and the highway facility needed in the next 20 years to maintain the Concept LOS
Typical Concept LOS standards in Caltrans District 3 are LOS ldquoDrdquo in rural areas and LOS ldquoErdquo in urban areas how-ever some heavily congested route segments now have a Concept LOS ldquoFrdquo because the improvements required to bring the LOS to ldquoErdquo are not feasible due to environmental right of way financial and other constraints The applica-tion of multi-modal corridor management strategies should reduce the severity and duration of congestion and provide viable travel options and information that will enable a traveler to avoid severe freeway congestion
The Concept LOS and Concept Facility for US 50 are shown in Table 9 almost all US 50 segments are forecasted to operate under LOS ldquoFrdquo conditions in 20 years under the No-Build and Build scenarios
Corridor ManageMent StrategieS The US 50 CSMP also proposes specific strategies to enhance corridor mobility (see Table 10) based on the fol-lowing principles
bull Manage all modes and facilities in the corridor as a single system beginning with the transportation net-work defined in this CSMP
bull Implement comprehensive and dynamic multimodal monitoring and reporting for the system and for all modes
bull Develop and use micro-simulation modeling to identify mobility challenges and to evaluate proposed solutions
bull Complete the projects included in the regional trans-portation plans with an emphasis on the completion of the key mobility improvement projects identified in this CSMP (see Tables 11 and 12)
bull Implement the specific strategies outlined in this CSMP
Key CapitaL projeCtS Tables 11 and 12 contain key capital projects that have been identified as the most critical to corridor mobility These are also included in the SaCOg MTP for 2035 and are either planned without any funding yet programmed are partially programmed
The US 50 CSMPor are entirely programmed SACOG conducted significant proposes specific
public attitude research strategies to enhance for the MTP for 2035 to corridor mobility complement comprehensive outreach efforts through community workshops the TALL Order Moving the Region Forward event the televised Town Hall Road Map for the Future and associated public polling The results of the SaCOg analyses and public out-reach for the MTP were
highway 50 corridor system management plan [ 35 ]
c h a p t e r s i x p l a n n e d c o r r i d o r s y s t e m m a n a g e m e n t s t r a t e g i e s
[ 36 ] HigHway 50 corridor system management plan
used when selecting the key projects for identification in
the CSMP and to ensure consistency Not all corridor projshyects in the MTP are included in the CSMP since the CSMP focuses on the managed network and the SaCOg MTP considers all streets and roads bike routes and transit services in the corridor
highway 50 partnership The Highway 50 Partnership is a cooperative public-private effort among the County of Sacramento City of Rancho
Cordova City of Folsom County of El Dorado and several major landowners that recognize the need to consider corrishydor mobility needs holistically
The Partnership has collaborated effectively to develop a Plan to improve mobility in the US 50 Corridor from Rancho
Cordova to El Dorado Hills an area identified as approprishyate for growth in the SACOG Blueprint Recognizing the
need to generate private investment the Partnership is seeking to implement a regional Highway 50 Corridor fee program to fund these projects
in addition to the key projects indicated in Table 11 Table 12 displays the key projects identified by the
Partnership
These projects include (1) Near-Term Priority Improvement Projects and (2) Near-Term Expected Roadway Improveshyments
The Near-term Priority improvement Projects would proshyvide several new roadway connections for people to travel within and through the area to avoid congestion They also include new transit routes and widening existing roadways
viewed by the Partnership as a package that would provide system-wide travel benefits These improvements targeted
for completion through 2012 would reduce vehicle hours of delay during commute hours by 30 percent
The near-Term Expected Roadway Improvements are conshysidered by the Partnership to be readily expected since they are tied to expected development or are part of a near-term
capital improvements program
Visionary projects Visionary projects are not yet included in the SaCOg MTP or EDCTC RTP but appear to offer considerable corridor mobilshyity benefits and merit further analysis and consideration for inclusion in the next MTP and RTP These are displayed in
Table 13
The ldquoPlus 10 Listrdquo in the SACOG MTP identifies projects
that are attractive from a performance standpoint but could not be included in the Final Project Lists because of financial constraint The ldquoPlus 10 Listrdquo element offers the
opportunity to include projects that would not be affordshyable without additional funding Some projects identified in
the Visionary Projects List were analyzed by SACOG during
development of the current MTP Some of these are included in the ldquoPlus 10 Listrdquo
Watt Avenue Light Rail Station Improvement Project
c h a p t e r s i x p l a n n e d c o r r i d o r s y s t e m m a n a g e m e n t s t r a t e g i e s
Table 9 US 50 ConCePT loS and FaCiliTy TyPe
location Forecasted level of Service1 (loS) and Facility Type
County description and location From Post Mile To Post Mile Current
loS1 20-year no build loS12
20-year build loS12
20-year Concept
loS13 existing Facility4 Concept Facility456 Ultimate Facility457
yOL interstate 80 to yoloSacramento County Line
000 316 F F F F 8F (6F between Jefferson Blvd ramps)
8F+2HOV+aux Lanes 8F+2HOV+aux Lanes
SaC yoloSacramento County Line to SR 99 and 51
L000 L248 = R000 F F F F 8F 8F+2HOV+aux Lanes 8F+2HOV+aux Lanes
SaC State Routes 99 and 51 to watt avenue R000 R534 F F F F 8F 8F+2HOV+aux Lanes 8F+2HOV+aux Lanes
SaC watt avenue to Zinfandel Drive R534 R1092 F F F F 8F 8F+2HOV+aux Lanes 8F+2HOV+aux Lanes
SaC Zinfandel Drive to Sunrise Boulevard R1092 1250 E F F F 8F 8F+2HOV+aux Lanes 8F+2HOV+aux Lanes
SaC Sunrise Boulevard to Folsom Boulevard 1250 1701 E F F F 6F+2HOV to Hazel ave 4F+2HOV
to Folsom Blvd
6F+2HOV+aux Lanes to Hazel ave 4F+2HOV+aux
Lanes to Folsom Blvd
8F+2HOV+aux Lanes
SaC Folsom Boulevard to SaCED County Line 1701 2314 D F F F 4F+2HOV 4F+2HOV+aux Lanes 6F+2HOV+aux Lanes
ED SacramentoEl Dorado County Line to Cameron Park Drive
000 R657 E F F F 4F 4F+2HOV+aux Lanes 6F+2HOV+aux Lanes
ED Cameron Park Drive to Missouri Flat Road R657 R1506 E F E E 4F 4F+2HOV+aux Lanes to greenstone 4F+aux Lanes
to Missouri Flat
6F+2HOV+aux Lanes to greenstone 4F+2HOV+aux Lanes
to Missouri Flat
ED Missouri Flat Road to End of Freeway in Placerville
R1506 1725 D F F F 4F 4F+aux Lanes 4F+aux Lanes
ED End of Freeway in Placerville to Bedford avenue
1725 1811 D E E E 4E 4E 4E
ED Bedford avenue to Cedar grove Exit 1811 R2595 D F F F 4F to Smith Flat 4E to Camino 4F+aux Lanes to Smith Flat 4E to Camino
4F+aux Lanes
1 Level of Service (LOS) A ldquoreport cardrdquo for evaluating traffic flow with ldquoArdquo being the best and ldquoFrdquo being the worst 2 20-year LOS (No Build) The LOS that would be expected at 20 years with no improvements 3 20-year Concept LOS The minimum acceptable LOS over the next 20 years 4 Facility Type Codes C=Conventional Highway E=Expressway F=Freeway HOV=High Occupancy Vehicle Lanes aux=auxiliary Lanes 5 Operational improvements are included in future facilities for all segments Examples of operational improvements include TOS improvements and auxiliary lanes 6 Concept Facility the future roadway with improvements needed in the next 20 years if LOS ldquoFrdquo no further degradation of service from existing ldquoFrdquo is acceptable as indicated by delay performance measurement 7 Ultimate Facility The future roadway with improvements needed beyond a 20 year timeframe
HigHway 50 corridor system management plans [ 37 ]
c h a p t e r f i v e p e r f o r m a n c e m e a s u r e s
Table 10 US 50 CSMP STraTegieS
Strategy description implementation Challenges
Maintain and operate the existing corridor multi-modal trans-
portation infrastructure
Maintain the existing investment in all modes of the transportation system and provide adequate resources for daily operations including operating
revenues for transit services
Funding availability funding competition within the region
Fully coordinate the delivery of transportation services and facili-ties in the corridor including daily operations and system planning
for enhancements
Interagency operational coordination to maximize the efficiency and effec-tiveness of all modes operating in the corridor with a focus on the CSMP transportation network defined in this CSMP Use of an existing group or
committee to provide initial oversight for this strategy
Diverse interests and competing priorities and limited resources
Construct planned and pro-grammed corridor capital improve-
ment projects
implementation of the capital improvements in the corridor included within the approved Metropolitan Transportation Plan and Regional Transportation
Plan for all transportation modes within the scope schedule and cost specified
Funding availability funding competition within the region
Comprehensive daily monitoring of the status of all modes providing service on the CSMP transporta-
tion network
Full deployment of multimodal transportation service status detection systems for all CSMP network components
Funding availability funding competition within region
Provide traveler information to the public
Provide the public with real-time easily accessible information regarding the status of all CSMP transportation system components so as to allow travel-
ers to make informed decisions about trip mode time and routing options
Funding availability funding competition within region
Continually monitor and analyze the CSMP transportation network to improve system performance
Monitor transportation performance measures and make system modifica-tions as appropriate on a frequent and timely basis Staff resources and data availability
Decrease the duration of non-recurrent traffic congestion
Expand and enhance the Freeway Service Patrol to respond to automobile accidents and vehicle break-downs
Funding availability funding competition within the region
Timely implementation of STaRNET
Expedite the implementation of the STaRNET operators of transportation facilities and emergency responders in the Sacramento region through real-time sharing of data and live video refinement of joint procedures
pertaining to the operation of roadways and public transit and public safety activities as well as enhance the regionrsquos 511 web site and interactive
telephone service to provide more traveler information
Developmental time acceptance by agencies and integration into daily use and identifica-
tion of maintenance and operations funding
Enhance transit and rail service increase transit service frequency provide express transit services imple-
ment bus rapid transit routes reduce headways for light rail and buses and construct planned light rail line extensions
Funding availability funding competition within the region
Complete Bus Carpool lane network
Complete the regional buscarpool lane network including freeway-to-freeway HOV lane connectors
Funding availability funding competition within the region Public agency and public
acceptance of network
[ 38 ] HigHway 50 corridor system management plan
c h a p t e r s i x p l a n n e d c o r r i d o r s y s t e m m a n a g e m e n t s t r a t e g i e s
tabLe 10 uS 50 CSMP StrategieS (ConTInued)
Strategy Description implementation Challenges
Enhance Transportation Demand Management strategies
Encourage employers to provide telecommuting and flexible working hour options to employees
acceptance by employers and resources to participate
Optimize the timing and synchronishyzation of traffic signals
Coordinate the optimization and timing of traffic signals on freeway ramps and along parallel and connecting roadways within and between jurisdicshytions to improve traffic flow and reduce congestion Provide signal priority
systems for transit vehicles
Funding availability and coordination among cities counties and Caltrans
improve access management of freeways and parallel connecting roadways
Develop and implement access management strategies to maintain the operational efficiency of freeways and parallelconnecting roadways
agreement between responsible jurisdicshytions as to where increased access control is needed increased access control on some parallelconnecting roadways may increase
traffic volumes on non-corridor roads
Develop innovative use of CMSs (eg travel times)
Potential uses of CMSs to improve system efficiency include the use of CMSs along portions of all corridors near transit station to indicate travel
times based on real-time existing traffic conditions on the freeway as well as on parallel roadways and express bus and light rail services CMS can also be used to identify the number of parking spaces that are still available at
the light-rail stations
Funding availability funding competition within the region
Implement amp expand Transit AVLTransit status information
enhancements for system users
Expand the use of AVL systems utilizing GPS technology to track in real-time the location of transit vehicles monitor transit schedules dispatch transit vehicles and provide real-time passenger information such as ldquonext busrdquo or
ldquonext trainrdquo arrival times
Funding availability funding competition within region
Expand Park-and-Ride lots at key locations
Add additional capacity to existing park-and-ride lots near transit stations and other locations that are approaching capacity
Funding availability funding competition within the region and available land
improve bike-pedestrian access in the CSMP
transportation network
Plan and program for construction of additional bicycle paths lanes and related improvements for access and connectivity to transit park and ride
lots and destination points
Funding availability funding competition within the region
Provide ldquoBike-SharingrdquordquoCar-Sharingrdquo tofrom transit (ldquoCarlinkrdquo) and from
neighborhoods
Expand the Regional Rideshare and Spare-the-Air programs to include bicycle and car sharing opportunities
Funding availability and coordination between SaCOg TMa air Districts employers developshyers property managers and local government
officials
Provide parking management stratshyegies in interested jurisdictions where applicable to discourage
use of single-occupant vehicles
in higher-density areas provide preferential parking for carpools and vanshypools require residential parking permits remove on-street parking and or provide graduated parking fees for metered on-street parking based on
vehicle type and time of day for SOV spaces to encourage transit use
Acceptance by businesses local officials and the general public
Expand bicycle commute amp transit fare strategiessubsidies
increase participation by large employers in programs that subsidize transit fares for employees during peak-hour commute times and provide bicycling
to work incentives
Voluntary participation by large employers to pay subsidy to transit providers
HigHway 50 corridor system management plan [ 39 ]
c h a p t e r s i x p l a n n e d c o r r i d o r s y s t e m m a n a g e m e n t s t r a t e g i e s
tabLe 11 KeY CaPitaL ProjeCtS
CountyLead agency
route roadway from to Project
Description Programmed
funds
additional funding Needed
total Cost estimate (x $1000)
Comp Year (FFY)
uS 50
Sacramento Caltrans District 3
US 50 Downtown watt avenue HOV Lanes $0 $75000 $75000 2020
Sacramento Caltrans District 3
US 50 watt avenue Sunrise Blvd HOV Lanes $165000 $0 $165000 2013
Sacramento Caltrans District 3
US 50 Bradshaw Road
Mather Field Road
Eastbound and Westbound Auxiliary Lanes
$0 $3700 $3700 2016
Sacramento Caltrans District 3
US 50 State Route 99
(Oak Park Interchange) interchange improvements including buscarpool lane
connectors $0 $150000 $150000 2014
Sacramento Caltrans District 3
US 50 interstate 5
(Riverfront Interchange) Riverfront Interchange
improvements including bus carpool lane connectors
$30000 $170000 $200000 2016
ED Caltrans District 3 US 50 Camino
Operational Safety improvements Construct an
undercrossing median barrier modify local road connections andor associated operational improvements on and adjacent
to US 50
$15000 $0 $15000 2012
ED ED County DOT US 50
west of Latrobe Road
west of Bass Lake
grade HOV Lanes (Ph1) $47141 $0 $47141 2010
ED Caltrans District 3 US 50
west of Bass Lake Road
Ponderosa Road
HOV Lanes (Ph2) $55000 $0 $55000 2011
ED Caltrans District 3 US 50 Ponderosa
Road greenstone
Road HOV Lanes (Ph3) $22357 $0 $22357 2013
ED ED County DOT US 50 Future Silva
Valley iC
Future Empire Ranch IC
Mainline Widening construct new WB lane within the
median from proposed Silva Valley IC to proposed Empire
Ranch IC
$2950 $0 $2950 2013
[ 40 ] HigHway 50 corridor system management plan
c h a p t e r s i x p l a n n e d c o r r i d o r s y s t e m m a n a g e m e n t s t r a t e g i e s
tabLe 11 KeY CaPitaL ProjeCtS (ConTInued)
CountyLead agency
route roadway from to Project
Description Programmed
funds
additional funding Needed
total Cost estimate (x $1000)
Comp Year (FFY)
PARALLEL AnD COnnECTInG ROADWAYS
ED ED County DOT
Silva Valley Parkway
Entrada Drive
Future US 50
Silva Valley Parkway iC
Widen Silva Valley Road from 2 lanes to 4 lanes includes
Class ii bike lanes and left turn storage pockets
$2921 $0 $2921 2010
ED ED County DOT
Silva Valley Parkway US 50
US50 Silva Valley Parkway (Phase 2) Includes constructshying overcrossing and ramps
signalization at EB and WB on off ramps
$57817 $0 $57817 2016
ED ED County DOT
Headington Road
Missouri Flat Road
El Dorado Road
Extend 2 lanes with median $9878 $0 $9878 2012
ED ED County DOT
Durock Road
Robin Lane South
Shingle Road
Extend 2 lanes with median $1239 $9214 $10453 2015
ED ED County DOT
Durock Road
Business Center Drive intersection signalization
includes adding turn pockets on Durock Road
$4333 $0 $4333 2009
ED City of Placerville
Point View Drive Broadway Smith Flat
Road Extend 2 lanes $1300 $0 $1300 2020
ED City of Placerville
western Placerville
US 50 interchange
Forni Road Ray Lawyer
Drive
Placerville Drive
Interchange Reconstruction convert Ray Lawyer Dr
Overcrossing to full IC Auxiliary Lanes
$5059 $34741 $39800 2020
Sacramento City of Rancho
Cordova
Mather Boulevard
Rockingham Road
Zinfandel Drive widen to 4 lanes $0 $8617 $8617 2020
Sacramento Rancho Cordova
Parkway ii
Grant Line Road
White Rock Road
New 6-lane expressway includshying intersection improvements at Kiefer Blvd amp White Rock
Road
$0 $44518 $44518 2020
Sacramento City of Folsom
Scott Road US 50 White Rock Rd
widen from 2 to 6 lanes $16000 $0 $16000 2020
Sacramento Sacramento County DOT
White Rock Road
Grant Line Rd
Prairie City Rd
Widen from 2 to 4 lanes realign near Nike and Nimbus Roads and connect with existshying alignment west of Prairie City Rd Realign Grant Line Rd to intersect with realigned
White Rock Rd
$26600 $0 $26600 2020
Sacramento Sacramento County DOT
Hazel avenue
US 50 Hazel Madison
Widen American River Bridge and approaches from 4 to 6 lanes Widen Hazel Avenue from AR Bridge to Madison from 4 to 6 lanes with Bike
LanesSignals
$83530 $0 $83530 2020
HigHway 50 corridor system management plan [ 41 ]
c h a p t e r s i x p l a n n e d c o r r i d o r s y s t e m m a n a g e m e n t s t r a t e g i e s
tabLe 11 KeY CaPitaL ProjeCtS (ConTInued)
CountyLead agency
route roadway from to Project
Description Programmed
funds
additional funding Needed
total Cost Estimate (x $1000)
Comp Year (FFY)
PARALLEL AnD COnnECTInG ROADWAYS
ED ED County DOT
green Valley Road
Salmon Falls Road
east
Deer Valley Road
widen from 2 to 4 lanes $0 $14576 $14576 2025
ED ED County DOT
green Valley Road
Deer Valley Road east Lotus Road widen $958 $4513 $5471 2015
ED ED County DOT
green Valley Road
Francisco Drive
Salmon Falls Road
widen from 2 to 4 lanes divided $412 $3491 $3903 2015
ED ED County DOT
Latrobe Road
investment Boulevard
golden Foothill Parkway
widen from 2 lanes undivided to 4 lanes
divided $1076 $8792 $9868 2015
ED ED County DOT
Latrobe Road
Carson Creek
White Rock Road
widen from 4 to 6 lanes $0 $23755 $23755 2025
ED ED County DOT
white Rock Road
EDSac County Line
Manchester Drive
widen 2 to 4 lanes divided includes signal interconnect and coorshy
dination
$0 $23755 $23755 2025
Sacramento City of Rancho
Cordova
Easton Valley
Parkway
Prairie City Road
Empire Ranch Road extenshysion south of
US 50
Construct new 4 lane road $0 $45000 $45000 2020
Sacramento Sacramento County DOT
Hazel avenue
Easton Valley
Parkway
Grant Line RoadWhite Rock Road
New road extension 4 lane limited access
through aerojet property $0 $18000 $18000 2018
Sacramento Sacramento County DOT
white Rock Road
Prairie City Road
ED County Line
widen to 4 lanes $8330 $64773 $73103 2018
Sacramento Sacramento County DOT
green Valley Road
East Natoma Sacramento ED County
line widen to 4 lanes $0 $3000 $3000 2018
Sacramento City of Rancho
Cordova
Zinfandel Drive
international Drive
Folsom Boulevard
widen to 4 lanes $0 $12000 $12000 2020
[ 42 ] HigHway 50 corridor system management plan
c h a p t e r s i x p l a n n e d c o r r i d o r s y s t e m m a n a g e m e n t s t r a t e g i e s
tabLe 11 KeY CaPitaL ProjeCtS (ConTInued)
CountyLead agency
route roadway from to Project
Description
Pro-grammed
funds
addi-tional
funding Needed
total Cost estimate (x $1000)
Comp Year (FFY)
traNSit
yolo amp Sacramento City of west Sacramento
amp City of Sacramento
Sacramento River
Crossing
15th Street in the City
of west Sacramento
Broadway in the City of
Sacramento
New all-modal river crossing (Auto Transit Bike amp Pedestrian)
from Sacramento across the Sacramento River to West
Sacramento The crossing was modeled between Broadway in Sacramento amp 15th Street in
West Sacramento but final alignshyment options will be studied in subsequent planning efforts
$800 $99200 $100000 2019
Sacramento Cal State University
Sacramento
CSUS Campus mdash mdash
Sac State Tram adjoining City streets and SRTD 65th Street light railbus transfer station Bus Rapid Transit System
$23574 $0 $23574 2013
Sacramento City of Rancho
Cordova
Rancho Cordova Various Various
New Service Rancho Cordova Pilot Transit Shuttle System new transit service for connection to
RTs Gold Line
$2380 $1500 $38880 2014
yolo amp Sacramento City of west Sacramento
TBD west
Sacramento Sacramento Streetcar Service between west
Sacramento and Downtown Sacramento
$17400 $54700 $72100 2014
Sacramento City of Rancho
Cordova RT Gold Line
RT Gold Line Tracks
Mather Field Road
Light Rail Grade Separations $0 $52888 $52888 2025
Sacramento City of Rancho
Cordova RT Gold Line
RT Gold Line Tracks Zinfandel Drive Light Rail Grade Separations $0 $52888 $52888 2025
Sacramento City of Rancho
Cordova RT Gold Line
RT Gold Line Tracks
Bradshaw Road
Light Rail Grade Separations $0 $35260 $35260 2025
Sacramento City of Rancho
Cordova RT Gold Line
RT Gold Line Tracks Routier Road Light Rail Grade Separations $0 $35260 $35260 2025
Sacramento City of
Sacramento Sacramento Valley Station
Sacramento intermodal Transportation Facility (Phase 1) - Develop intermodal transportashytion terminal for heavy rail light
rail and bus service
$77799 $0 $77799 2010
Sacramento City of
Sacramento Sacramento Valley Station
Sacramento intermodal Transportation Facility (Phase 2) - Develop intermodal transportashytion terminal for heavy rail light
rail and bus service
$24101 $1000 $25101 2014
HigHway 50 corridor system management plan [ 43 ]
c h a p t e r s i x p l a n n e d c o r r i d o r s y s t e m m a n a g e m e n t s t r a t e g i e s
TABLE 11 KEY CAPITAL PROJECTS (CONTINUED)
CountyLead Agency
Route Roadway From To Project
Description Programmed
Funds
Additional Funding Needed
Total Cost Es-timate (x $1000)
Comp Year (FFY)
BICYCLE ROUTES
Sacramento City of Rancho
Cordova
US 50Mather Field Road IC US 50 Mather
Field Road
US 50Mather Field Road PedestrianBike Crossing along
the Mather Airport RR Spur alignment
$0 $820 $1055 2015
ED ED County DOT
Sacramento Placerville
Transportation Corridor
Forni Rd
Missouri Flat Rd Class I Bike Trail $1423 $111 $1534 2009
ED City of Placerville
El Dorado Trail Western
Extension
Canal Street Main Street
Ray Lawyer DriveForni
Road Class 1 Bike Trail $1850 $0 $1850 2010
ED ED County DOT
US 50ED Hills Blvd IC US 50
El Dorado Hills Blvd
Latrobe Road
US 50El Dorado Hills Blvd Pedestrian Overcrossing $5508 $66 $5574 2014
TABLE 12 50 MOBILITY PARTNERSHIP KEY CAPITAL PROJECTS
RouteRoadway From To Project Description
NEAR TERM PRIORITY IMPROVEMENT PROJECTS
US 50 Sunrise Scott Road Auxiliary Lane
US 50 Hazel Avenue Interchange Improvements
Hazel Avenue Folsom Boulevard Easton Valley Parkway New 4 Lane Road
Easton Valley Parkway Hazel Avenue Rancho Cordova Parkway New 6 Lane Road
Rancho Cordova Parkway Easton Valley Parkway White Rock Road New 4 Lane Road
White Rock Road Sunrise Boulevard Silva Valley Parkway Widen to 4 Lanes
RT Gold Line Hazel Iron Point Station Passing Tracks
US 50 Rancho Cordova Parkway New Interchange
Zinfandel Drive South of International Douglas Road New 4 Lane Road
International Drive Kilgore Road Rancho Cordova Parkway New 6 Lane Road
Douglas Road Zinfandel Extension Sunrise Boulevard Widen to 4 Lanes
Sunrise LRT Citrus Road Sunrise Mall Bus Rapid TransitExpress Bus
[ 44 ] HIGHWAY 50 corridor system management plan
c h a p t e r s i x p l a n n e d c o r r i d o r s y s t e m m a n a g e m e n t s t r a t e g i e s
TABLE 12 50 mOBILITY PARTnERSHIP kEY CAPITAL PROjECTS (COnTInUED)
routeroadway from to Project Description
US 50 nEAR TERm PRIORITY ImPROVEmEnT PROjECTS
US 50 Empire Ranch Road New interchange
US 50 Silva Valley New interchange
US 50 Scott Road Empire Ranch Road Aux Lanes
US 50 Empire Ranch Road El Dorado Hills Boulevard Aux lanes and climbing lanes
US 50 El Dorado Hills Boulevard Silva Valley Parkway Aux lanes and climbing lanes
US 50 Silva Valley Parkway Bass Lake Road Aux lanes
Sunrise Boulevard White Rock Road Douglas Boulevard widen to 6 lanes
Sunrise Boulevard Douglas Boulevard Jackson Road widen to 4 lanes
White Rock Road Sunrise Boulevard Future Rancho Cordova Parkway and El Dorado County Line to Latrobe Road
widen to 4 lanes
Douglas Boulevard Sunrise Boulevard Grant Line Road widen to 4 lanes
Rancho Cordova Parkway Douglas Boulevard Rio del Oro Parkway New 2 lane road
Rancho Cordova Parkway Rio del Oro Parkway White Rock Road New 6 lane road
Jaeger Road Douglas Road Kiefer Boulevard New 4 lane road
Chrysanthy Sunrise Boulevard Americanos Boulevard New 4 lane road
Kiefer Boulevard Sunrise Boulevard Jaeger Road New 4 lane road
Grant Line Road Douglas Road Chrysanthy Road widen to 4 lanes
Hazel avenue Gold Country Boulevard Madison avenue widen to 6 lanes
Latrobe Road South of White Rock Road widen to 4 lanes
TABLE 13 VISIOnARY PROjECTS
County routeroadway from to Project Description
Sac yolo US 50 Enterprise Downtown Sacramento HOV Lanes
ED TBD Folsom Placerville Transit ndash Type TBD
ED New Road Latrobe Road White Rock Road (poten shy
tially US 50) New 2-lane road
HigHway 50 corridor system management plan [ 45 ]
c h a p t e r s i x p l a n n e d c o r r i d o r s y s t e m m a n a g e m e n t s t r a t e g i e s
[ 46 ] HigHway 50 corridor system management plan
Page Inte
ntionally
Left
Blank
congestion and bottleneck analysis
chapter seven
The 2000 Highway Capacity Manual defines a bottleneck
as ldquoa road element on which demand exceeds capacityrdquo
The bottleneck analysis evaluates specific causes of existshying recurrent traffic congestion in the corridor Freeway bottleneck locations that create mobility constraints are identified and documented and their relative contribution
to corridor-wide congestion is reported The bottleneck locations were determined based on a combination of the use of 2006 PeMS data HiCOMP report probe vehicle tach runs and field observations
Traffic congestion can be categorized as either recurrent
or non-recurrent
recurrent congestion occurs repeatedly at the same place and time of day in a predictable pattern Recurrent congesshytion is often associated with facility capacity limitations changes in capacity conflicting vehicle movements such
as lane merges inadequate number of transit vehicles to handle passenger loads or other persistent physical condishytions of the transportation facility
Non-recurrent congestion is usually attributed to collishysions equipment malfunction community events weather construction projects and other occasional occurrences When transportation systems are close to their maximum
carrying capacity non-recurrent congestion is more likely to occur as there is little excess capacity in the system
The location and extent of the bottlenecks on US 50 found
in the aM and PM peak periods are summarized in Tables 14 and 15 These depictions should be considered a snapshyshot view and not a comprehensive analysis of all bottleshynecks in the corridor Further work is being conducted to
refine the identification and causality of bottlenecks within
the corridor Table 14 shows a summary of the US 50 eastbound bottlenecks while the tables that follow discuss each bottleneck including location and possible causality Table 15 shows a summary of the US 50 westbound bottleshynecks while the tables that follow discuss each bottleneck including location and possible causality Minor or hidden bottlenecks are those Freeway bottleneck
that are not as defined locations that create (or severe) as the major mobility constraints bottlenecks Please note are identified and that the graphics accomshy documented and their panying the bottlenecks
relative contribution to are not to scale
corridor-wide congestion Major bottlenecks in the is reported eastbound direction during the aM peak period are at Howe avenue and during the PM peak period are at 48th Street Howe Avenue Mayhew Road Routier Road Sunrise Boulevard and El Dorado Hills Boulevard Major bottlenecks in the westbound direction during the aM peak period are at El Dorado Hills Boulevard Hazel Avenue Zinfandel Drive
HigHway 50 corridor system management plan [ 47 ]
c h a p t e r s e v e n c o n g e s t i o n a n d b o t t l e n e c k a n a l y s i s
Bradshaw Road and Howe Avenue and major bottleneck
locations during the PM peak period are at Zinfandel Drive Routier Road Bradshaw Road Howe Avenue and Intershystate 5
Causalities for these bottlenecks range from high-traffic
demand (congestion) heavy weavingmerging areas or physical constraints such as lane drops lack of ramp meters incomplete HOV network incomplete Auxiliary Lane
network poorly coordinated traffic signals and an off-ramp
queue (Sunrise Boulevard) US 50 Westbound Onramp
TABLE 14 US 50 EASTBOUnD BOTTLEnECk SUmmARY Source PeMS Caltrans tach runs and
Cambridge Systematics field observations
bottleneck Location PeMS Speed Contours Caltrans Probe Vehicle Runs
Cause aM PM aM PM
A Jefferson Blvd PM 25 Minor Minor Traffic weaving truck volumes and grade
B 48th St PM 7 Minor Major Minor Minor Merge from SR 51 and SR 99
C Howe ave PM 9 Major Major Major weave between Howe and watt
D Mayhew Rd PM 12 Major Minor Major Weaving before Bradshaw Exit
E Routier Rd PM 14 Minor Major Weaving before Mather Field Rd Exit
F Sunrise Blvd PM 185 Minor Major Lane drop HOV add off-ramp queue
G Folsom Blvd PM 22 Minor Minor Lane drop 4 to 3
H El Dorado Hills Blvd PM 275 Major
Poorly coordinated traffic signal on arterial causes spillback onto freeway
a jefferson blvd bottleneck The bottleneck approximately located at Jefferson Blvd is due to weaving traffic as those entershying the freeway from Jefferson Blvd must cross those attempting to exit the freeway to I 5 There is a large number of trucks in the stream which struggle with the grade at this location exacerbatshying the bottleneck
[ 48 ] HigHway 50 corridor system management plan
c h a p t e r s e v e n c o n g e s t i o n a n d b o t t l e n e c k a n a l y s i s
b 48th St bottleneck The bottleneck approximately located at 48th St is due to the additional traffic merging from SR 51 and SR 99 combined with the eventual lane drop at 59th St This queue extends upstream past the off-ramp to SR 5199 These off-ramps are bottlenecks in themselves which spill back and choke the US 50 mainline
C Howe Ave Bottleneck The bottleneck at Howe ave is due to the entering traffic from Howe Ave Two Howe Ave on-ramps feed into US 50 eastbound southbound Howe ave loop on-ramp and northbound Howe ave direct ramp approximately 300 feet apart The watt avenue off-ramp is just down stream with heavy exiting volumes therefore the segment between Howe and watt is characterized by heavy weaving
D mayhew Rd Bottleneck The bottleneck approximately located at Mayhew Rd most likely begins with the additional traffic entering from Watt Ave and ends with the exiting traffic at Bradshaw Rd It is possible that there is a high proportion of weaving traffic with in this section (Watt Ave traffic moving to the left lane and those exiting at Bradshaw Rd moving to the right lane)
HigHway 50 corridor system management plan [ 49 ]
c h a p t e r s e v e n c o n g e s t i o n a n d b o t t l e n e c k a n a l y s i s
[ 50 ] HigHway 50 corridor system management plan
e routier rd bottleneck It is likely that the bottleneck at Routier Rd is due to the same merging conditions associated with Mayhew Rd The area is comprised of both residential and light industrialoffice land uses therefore during the PM peak period there are large volumes of vehicles entering at Bradshaw Rd moving to the left lanes and large volumes of vehicles moving to the right lane to exit at Mather Field Rd
f Sunrise blvd bottleneck At Sunrise Blvd the right-most lane exits while an HOV lane is added as the median lane The bottleneck is formed from vehicles shifting left to avoid exiting at Sunrise Blvd and to enter the HOV lane There is a large volume of vehicles queued at the Sunrise off-ramp which spills back and negatively affects the US 50 mainline
g folsom blvd bottleneck The right-most lane exits to Folsom Blvd leaving one HOV lane and two regular lanes along the US 50 The bottleneck is caused by this lane drop as well as the quick merge at the Folsom on-ramp
c h a p t e r s e v e n c o n g e s t i o n a n d b o t t l e n e c k a n a l y s i s
H The eastbound US 50 at El Dorado Hills Blvd Bottleneck The eastbound El Dorado Hills Blvd bottleneck is caused by a traffic signal on the arterial that often causes spillbacks on the EB loop offramp onto the freeway mainlines
TABLE 15 US 50 WESTBOUnD BOTTLEnECk SUmmARY Source PeMS Caltrans tach runs and Cambridge Systematics field observations
bottleneck Location PeMS Speed Contours Caltrans Probe Vehicle Runs
Cause aM PM aM PM
A El Dorado Hills Blvd PM 275 Major Poorly coordinated traffic
signal on El Dorado Hills Blvd
B Hazel Ave PM 21 Major Entering traffic
C Zinfandel Dr PM 16 Minor Major Major Major Entering traffic
D Routier Rd PM 14 Minor Major Minor Weaving traffic
E Bradshaw PM 13 Major Major Major Merging traffic and curve
F Howe Ave PM 9 Minor Major Major Major Weaving traffic and grade
G SR 51SR 99 PM 6 Minor Lane drop weaving traffic
H i-5 PM 3 Major Weaving traffic
HigHway 50 corridor system management plan [ 51 ]
c h a p t e r s e v e n c o n g e s t i o n a n d b o t t l e n e c k a n a l y s i s
[ 52 ] HigHway 50 corridor system management plan
A El Dorado Hills Blvd Bottleneck The minor bottleneck at El Dorado Hills Boulevard is caused by the traffic signal on El Dorado Hills Blvd that causes spillback on the westbound offramp onto the freeway mainlines
B Hazel Avenue Bottleneck In 2006 the Hazel Ave Bottleneck is caused by the traffic entering at both Hazel Ave and Folsom Blvd (the two on-ramps are separated by about one mile) The bottleneck that would appear at Folsom Blvd combines with the bottleneck at Hazel ave to form a large bottleneck that does not clear until after Hazel ave Sometimes causshying spillbacks as far as Prairies City Road this bottleneck was mitigated in 2007 as part of the GO CALIFORNIA program
C Zinfandel Dr Bottleneck There is heavy traffic coming from Sunrise Blvd but the lane addition immediately after the westbound on-ramp prevents a bottleneck from forming but as traffic flows westward the heavy traffic entering from Zinfandel Dr causes a bottleshyneck here
D Routier Rd Bottleneck The bottleneck at Routier Rd is caused by weaving traffic between Mather Field Rd and Bradshaw Rd This highway segment represents a transition area where vehicles that have been traveling in the left lanes begin to shift to the right lanes to exit while the entering traffic tries to shift to the left lanes
W eav in gLan e Dr o p
c h a p t e r s e v e n c o n g e s t i o n a n d b o t t l e n e c k a n a l y s i s
e bradshaw rd bottleneck The Bradshaw Rd bottleneck is caused by the entering traffic from Bradshaw Road the high truck volumes and the curve west of Bradshaw Two Bradshaw Rd on-ramps feed into US 50 westshybound southbound Bradshaw Rd direct on-ramp and northbound Bradshaw Rd loop on-ramp approximately 400 feet apart
F Howe Ave Bottleneck The Howe ave bottleneck is caused by a grade change and the weaving traffic entering from Howe ave and Hornet Dr competing for the right-most lane with those wanting to exit at 65th Street
G amp H SR 51SR 99 amp I-5 Bottleneck The bottleneck at I 5 is caused by the conflict between entering SR 99 and SR 51 traffic and exiting I-5 traffic as well as the queues formed on the ramps to i-5 which spill back onto US 50 The number of lanes in this section reaches a maximum of 6 and then drops to 4 as two lanes exit at the I-5 freeway This bottleneck is exacershybated during the peak periods when it stretches upstream to the lane drop before SR 99
W ea v in g
Lan e Dr o p
HigHway 50 corridor system management plan [ 53 ]
5
W STX ST
WATT AVE
MAROCKINGHAM
DR
OLD PLACER
BRADSHAW RD
VILLE RDTHER FIELD RD
INTERNA TIONAL DR
ZINF ANDEL DR
WHITE ROCK RD FOLSOM BLVD FOLSOM BLVD
SUNRISE BLVD BLU
E RAV
INE R
D
WHITE ROCK RD
SC
OTT R
D
PR
AIR
IEC
ITY R
D
SCOTT RD
GREEN V ALLEY RD
PLACER VILLE DR
FORNI RDM
AIN ST
BROADWAY
CEDAR GROVE EXIT
c h a p t e r o n e w h a t i s a C S M P
Figure 1 US 50 CSMP Transportation Network
Highway 50 Corridor Auburn System Management Plan
193 Transportation Network
US Highway 50 (I-80 to Cedar Grove Exit) 193 80
CSMP Parallel Roads
Light Rail STation Loomis 49
Light Rail
Current HOV Coverage
Express Bus Service Placerville
Corridor Mobility Improvement Account
Class I Bikeways Other State Highways
County Lines Folsom
50
80 HOV Lanes El Dorado Hills Blvd to Bass Lake Rd
HOV Lanes Watt Ave Sacramento to Sunrise Blvd
50 White Rock Rd Expansion Grant Line80 Rd to Prairie City RdWest
Rancho Cordova
4 9
1 6
Sacramento
5 99
84 160
Elk Grove 0 1 2 3 4 5
49 Miles 124 10
HigHway 50 corridor system management plans [ 5 ]
c h a p t e r o n e w h a t i s a C S M P
Table 1 US 50 CSMP TranSPorTaTion neTwork
location US 50 ParallelConnecting roadways Mass Transit bike routes
Heavy rail and light rail bus
route From To County City From To roadway From To operator
Services From To operator
Services From To
yolo City of west Sacramento interstate 80 yoloSacramento
County Line west Capitol Enterprise Boulevard Capitol Mall yCTD 39
Davis Express
west Sacramento
Davis Sacramento west Capitol
avenue yolo
Causeway Tower Bridge
Sacramento City of Sacramento
yoloSacramento County Line
State Routes 99 and 51 wX Streets 5th Street 26th Street RT Downtown
Sacramento Folsom
RT 109 Express
Downtown Sacramento Hazel ave Jedediah Smith Memorial Trail
State Routes 99 and 51 watt avenue mdash mdash mdash
amtrak Capital Corridor
(intercity Rail)
401 i Street Sacramento
auburn CaSan Jose Ca
amtrak Thruway Bus
401 i Street Sacramento
Main Street Placerville
Sacramento UnincorporatedCity of Rancho Cordova
watt avenue Zinfandel Drive
Folsom Boulevard watt avenue Sunrise Boulevard RT Downtown Sacramento Folsom RT 72 Mather Mills
LRT Station watt-Manlove LRT Station Jedediah Smith Memorial Trail
watt avenue Folsom Boulevard US 50
RT Downtown Sacramento Folsom RT 21 Mather Mills
LRT Station Louis Ln
Orlando ave Jedediah Smith Memorial Trail
Bradshaw Road Folsom Boulevard Old Placerville Road
Old Placerville Road Bradshaw Road Rockingham Drive
Rockingham Drive Old Placerville Road Mather Field Road
Mather Field Road Rockingham Drive Zinfandel Drive
Zinfandel Drive international Drive Folsom Boulevard
white Rock Road Zinfandel Drive Sunrise Boulevard
Sunrise Boulevard US 50 Folsom Boulevard
Zinfandel Drive Sunrise Boulevard
white Rock Road Sunrise Prairie City
RT Downtown Sacramento Folsom RT 109
Express Downtown
Sacramento Hazel ave Jedediah Smith Memorial Trail
Folsom Boulevard Sunrise iron Point Road
Notes F = Freeway E = Expressway RT = Sacramento Regional Transit District EDT = El Dorado Transit and FSL = Folsom Stage Lines LR = Light Rail EB = Express Bus LT = Limited LRF = Light Rail Feeder YCTD = Yolo County Transportation District FTS = FairfieldSuisun Transit System UCD = UC Davis Medical Center Shuttle
HigHway 50 corridor system management plans [ 6 ]
c h a p t e r o n e w h a t i s a C S M P
Table 1 US 50 CSMP TranSPorTaTion neTwork (ConTinUed)
location US 50 ParallelConnecting roadways Mass Transit bike routes
Heavy rail and light rail bus
route From To County City From To roadway From To operator
Services From To operator
Services From To
Sacramento
UnincorporatedCity of Folsom
Sunrise Boulevard
Folsom Boulevard
iron Point Road Folsom Boulevard East BidwellScott Road
RT Downtown Sacramento Folsom
iron Point Road Folsom Boulevard Empire Ranch
Scott Road iron Point Road white Rock Road Blue Ravine Road
Folsom Boulevard
green Valley Road
Sacramento Folsom Boulevard
Sacramento El Dorado
County Line
Folsom Boulevard iron Point Road Blue Ravine Road
green Valley Road
SacramentoEl Dorado County
Line
Cameron Park Drive
Blue Ravine Road Folsom Boulevard green Valley Road
Prairie City Road US 50 white Rock Road ED County Transit
authority-iron Point Connector
iron Point Light Rail Station
Missouri Flat Transfer
Center white Rock Road EDSac County Line
Sacramento El Dorado County Line
El Dorado Na Sacramento
El Dorado County Line
Cameron Park Drive
green Valley Road Blue Ravine Road Cameron Park Drive
ED County Transit
authority-Sacramento Commuter
El Dorado County
Sac County
green Valley Road
Cameron Park Drive
Placerville Drive
white Rock Road EDSac County Line Latrobe Road
white Rock Road Latrobe Road Silva Valley Parkway
Silva Valley Parkway white Rock Road Serrano Parkway
El Dorado Na Cameron Park Drive
Missouri Flat Road
green Valley Road Cameron Park Drive Missouri Flat Road
ED County Transit
authority
Cambridge Road
Missouri Flat Road
Ray Lawyer Drive
Placerville Drive Forni Road
Durock Road Cameron Park Drive South Shingle Road
Cameron Park Drive Durock Road US 50
Forni Road Ray Lawyer Drive Forni Road
South Shingle Road Durock Road US 50
El Dorado Na Missouri Flat Road
End of Freeway in Placerville
green Valley Road Missouri Flat Road Placerville Drive
ED County Transit
authority
Missouri Flat Road
Placerville Drive
Main Street Forni Road Clay Street Forni Road Placerville Drive Main Street
Placerville Drive Forni Road US 50
El Dorado Placerville End of Freeway in Placerville
Bedford avenue Start of
Freeway Main Street Placerville Drive Bedford avenue
ED County Transit
authority
Placerville Drive SR 49 ED Bike Trail Clay Street Los Trampas
Road
El Dorado Na Bedford
avenue Start of Freeway
Cedar grove Exit
Main Street Bedford avenue Broadway amtrak
Thruway Bus
Mosquito Road
Placerville
401 i St Sac CaCarson
City Ca Broadway Main Street Point View Drive
HigHway 50 corridor system management plans [ 7 ]
WHITE ROCK RD
c h a p t e r o n e w h a t i s a C S M P
Figure 2 CSMP Corridors in District 3
Corridor System Management Plan
Corridors in District 3 Interstate 80 I-80 between SR 113 and Sierra College Boulevard SR 51 between Highway 50SR 99 and I-8020
Highway 5053 Between I-80 and Cedar Grove Exit
Interstate 5 amp State Route 99 I-5 between Hood-Franklin Rd and State Route 113 SR 99 between San Joaquin County Line and Highway 50 SR 99 between I-5 and SR 20
State Route 99 North29 Between Southgate and Esplanade (in Chico area see inset)
State Route 49 Between I-80 and SR 20
State Route 65 Between I-80 and SR 70
CMIA and State Route 99 Bond Projects
20
Colusa
20
Yuba City Marysville
Grass Valley
La Barr Meadows Widening Project
49 80
Widen to 4 Lanes SR 70 to Feather River Bridge
99
70 Wheatland
65
113 Lincoln Bypass
5
Construct Interchange Operations Improvements Placerville at Elverta Rd HOV Lanes El Dorado
Hills Blvd to Bass Lake Rd
80 Folsom Woodland Rancho 50
Auburn Lincoln
Construct Interchange at Riego Rd Rocklin 49
99 Roseville Roseville Capacity and
Cordova 113 49 505 Sacramento 51
99 Chico Add Auxiliary Lanes
SR 32 to 1st Ave
32 Davis 80
West Sacramento
5
HOV Lanes Watt Ave to Sunrise Blvd
Operational Improvements Mack Rd to Florin Rd
White Rock Rd Expansion Grant Line Rd to Prairie City rd
29 221
113
99
0 105 2 3 4 5 Miles
Galt 0 5 10 15 20
Miles
HigHway 50 corridor system management plans [ 8 ]
need purpose goal and objectives
chapter two
There is a need for a planning approach that brings facility operations and transportation service provision together with capital projects into one coordinated system manageshyment strategy that focuses on high demand travel corridors such as US 50
a CSMP is needed for the US 50 corridor to address severe traffic congestion that often exceeds the capacity of existshying facilities transit ridership demands that exceed the
capacity of the transit system and bicycle facilities that do not provide a fully linked network of bike routes
The purpose of the CSMP is to create a partnership planshyning process that focuses on system management strateshygies and coordinated capital investments so that all the pieces of the corridor function as an efficient transportashytion system and performance evaluation measures are implemented to track the effectiveness of strategies and projects
the CSMP directly supports the implementation of the
three CMia projects on the corridor
bull High Occupancy Vehicle (HOV) Lanes on US 50 from Watt avenue to Sunrise boulevard
bull White Rock Road Expansion from Grant Line Road to Prairie City road
bull HOV Lanes on US 50 from El Dorado Hills Boulevard to bass Lake road
The goal of the CSMP is to improve mobility along the US 50 corridor by focusing on the integrated management of a
subset of the entire transporta- The CSMP directly tion network within the corshy supports the ridor including select freeway implementation and parallel roadways transit
of the three CMIA and bicycle components of the
projects in thecorridor corridor
The objectives of the CSMP are to reduce travel time or delay on all modes improve
connectivity between modes and facilities improve travel
time reliability improve safety on the transportation system and expand mobility options along the corridor in a cost effective manner implementation of the CSMP will increase access to jobs housing and commerce
consistency with other state transportation plans anD policies The CSMP approach is consistent with the goals and objectives of the governorrsquos Strategic Growth Plan which among other things commits to minimizing increases in traffic congestion Key elements of the strategy are illusshytrated in Figure 3
at the base of the pyramid and the foundation of transshyportation system management is system monitoring and evaluation it is essential to understand what is happening on the transportation system so that the best decisions can be made based on reliable data The next few layers up
the pyramid are focused on making the best use of existing
resources and reducing the demand for transportation
HigHway 50 corridor system management plan [ 9 ]
c h a p t e r t w o n e e d p u r p o s e g o a l a n d o b j e c t i v e s
[ 10 ] HigHway 50 corridor system management plan
particularly during peak travel hours The top layer of the pyramid is system expansion This layer assumes that all the underlying components are being addressed and that system capacity expansion investments are necessary
Corridor system management is consistent with the Caltrans Mission
Improve Mobility Across California Corridor system management is consistent with Caltransrsquo goals
bull SafetY Provide the safest transportation system in the nation for users and workers
bull MobiLitY Maximize transportation system performance and accessibility
bull DELIVERY Efficiently deliver quality transportation projshyects and services
bull STEWARDSHIP Preserve and enhance Californiarsquos resources and assets
bull SERVICE Promote quality service through an excellent workforce
The CSMP is also consistent with the California Transportashytion Plan (CTP) the statewide long-range transportation
plan for meeting future mobility needs The CTP defines
goals policies and strategies to achieve our collective vishysion for Californiarsquos future transportation system
Figure 3 Strategic Growth Plan StrategyAir
Quality Planning Corridor System Management seeks to create conditions where vehicle flow on highways and roads occurs at a
steady pace and travelers have a range of mobility options that enable them to travel other than by single occupant vehicle System expansion is focused only where needed
when travel demand exceeds the capacity of the well manshyaged existing system These conditions are beneficial to
attaining air quality goals and reducing green house gas emissions
current corridor system management strategies
chapter three
US 50 is a transcontinental highway that originates in west Sacramento California and terminates in Ocean City Maryland it is a key transportation artery connecting yolo County Sacramento County and fast growing sub regions within Sacramento and El Dorado Counties
The corridor provides access to world renowned recreation areas in the Sierra Nevada Mountains and Lake Tahoe
Basin Peak commute and recreational travel periods are
heavily congested with demand for travel often exceedshying the capacity of existing facilities and services Severe
traffic congestion is common and commute transit services
often operate at maximum ridership capacity There is
extensive and expanding urban development along many parts of the corridor which suggests increased future transportation demand
Given the complexity of the corridor and its extensive geoshygraphic range there are a wide variety of system manageshyment strategies and elements currently being implemented by jurisdictions and transportation service providers Strategies and elements range from vehicle detection deshyvices to traveler information systems to traffic flow control mechanisms a common element among all the strategies and elements is data collection and analysis There is presshyently some system management coordination and intershyjurisdictional partnerships among the entities such as the Sacramento Transportation Area Network (STARNET)
The STARNET web application initial release is anticipated
for the late fall of 2009 Features to be included in the
initial release will include Changeable Message Sign (CMS) display a chain control application integration of Regional Transit data California Highway Patrol incident data connectivity to the 511 systems (web and telephone) Closed Circuit Television (CCTV) display and interagency messaging and coordination [Caltrans Transportation Management Center (TMC) Kingvale Operation Center City of Sacramento Traffic Operation Center (TOC) Sacramento
County TOC Roseville TOC and Elk Grove TOC] STARNETrsquos
associated management There are a widestrategies can and will variety of systemevolve as the application is
implemented throughout management
the region and as addi- strategies and tional features are added elements currently in annual releases being implemented
by jurisdictions and state highway sys-
tem transportation service
providerswith the construction of Californiarsquos state highshyway system virtually complete in the Sacramento region Caltransrsquo major emphasis on highway projects has largely shifted from new construction to focused capacity expanshysions reconstruction operation and maintenance of existshying facilities
The State Highway System has an extensive set of system
management strategies in operation Some cities coun-
HigHway 50 corridor system management plan [ 11 ]
c h a p t e r t h r e e c u r r e n t c o r r i d o r s y s t e m m a n a g e m e n t s t r a t e g i e s
tabLe 2 exiStiNg uS 50 toS eLeMeNtS
County Location PM toS elements
tMS rM HAR rWiS CMS eMS VS CCTV WiM
yolo i-80 to yoloSaC County Line
000 - 316 4 ndash ndash 1 1 ndash ndash 2 2
SaC
YoloSAC County Line to SR99 SR51
L000 - L248 R000
8 7 ndash ndash 3 ndash ndash 7 ndash
SR99SR51 ndash Watt Avenue R000 ndash R534 5 8 ndash ndash 1 1 ndash 3 ndash
watt avenue to Zinfandel Drive R534 ndash R1092 8 7 1 ndash ndash 2 ndash ndash ndash
Zinfandel Drive to Sunrise Blvd R1092 ndash 1250 1 4 ndash ndash ndash 1 ndash ndash ndash
Sunrise Blvd to Folsom Blvd 1250 ndash 1701 4 6 ndash ndash ndash ndash ndash 2 ndash
Folsom Blvd to SACED County Line
1701 ndash 2314 2 8 ndash ndash 1 ndash 1 ndash ndash
ED
SACED County Line to Cameron Park Dr 000 ndash R657 5 ndash ndash ndash 1 ndash 2 ndash ndash
Cameron Park Dr to Missouri Flat Rd R657 ndash R1506 7 ndash ndash ndash ndash ndash ndash ndash ndash
Missouri Flat Rd to End of Freeway R1506 ndash 1725 1 ndash ndash ndash ndash 1 ndash ndash ndash
ED End of Freeway to Bedford Ave 1725 ndash 1811 ndash ndash 1 ndash ndash ndash ndash ndash ndash
ED Bedford Ave to Cedar Grove Rd 1811 ndash R2595 ndash ndash ndash ndash 1 1 ndash ndash ndash
totaL 45 40 2 1 8 6 3 14 2
Notes PM = Post Mile TMS = Traffic Monitoring Station RM = Ramp Meter HAR = Highway Advisory Radio RWIS = Roadside Weather Information System CMS = Changeable Message Sign EMS = Extinguishable Message Sign VS = Visibility Sensor CCTV = Closed Circuit Television System WIM = weigh in Motion Existing TOS Elements as of April 2009
ties and transit operators also have robust system manshyagement elements and programs applied to their facilities or services
There are also specific instances of system management linkages among transportation modes and services at particular locations
Existing management strategies are depicted on Figure 4
and summarized in Table 2
US 50 BusCarpool Lanes in El Dorado County
[ 12 ] HigHway 50 corridor system management plan
c h a p t e r t h r e e c u r r e n t c o r r i d o r s y s t e m m a n a g e m e n t s t r a t e g i e s
These strategies work as a system to gather analyze and disseminate information through the Caltrans TMC inforshymation about collisions other incidents road closures and emergency notifications are fed into this information hub
and disseminated to public and private information users The TMC operates 24 hours a day seven days a week
parallel anD connecting roaDways City of West Sacramento has one CCTV located on west Capitol Avenue between Enterprise Boulevard and Capitol Mall
City of Sacramento operates a TOC Sensors in the street detect the passage of vehicles vehicle speed and the level of congestion
This information is received on a second-by-second (real-time) basis and is analyzed at the TOC
Sacramento County also operates a TOC by gathering information through CCTV cameras CMS HAR and a Fiber Optics (FO) network placed along major traffic
corridors throughout the county
City of rancho Cordova will be installing CCTV cameras and a FO network on Folsom Boulevard in 2009 Currently one CCTV exists on Sunrise Boulevard
between US 50 and Folsom Boulevard Most major traffic corridors are on the network or will be by the end of 2009 The City contracts with the County of Sacramento to operate their systems through the Countyrsquos TOC
City of folsom recently completed installing a FO system
Changeable Message Sign on US 50 at Scott Road
on all of the Cityrsquos major corridors Currently the sole intersection that is monitored via camera is located on iron Point Road and East Bidwell
El Dorado County has three coordinated signals along Francisco Drive at Green Valley Road the Market Place
entrance (east side Safeway Centerwest side Lake
Forest Plaza) and Village Center Drive
City of Placerville utilizes traditional control devices traffic signals and stop signs
transit anD riDesharing Yolo County Transit District (YCTD) uses a Global Positionshying System (GPS) for locating buses in route referred to as
an Automatic Vehicle Location (AVL) system
The AVL System allows users to see where their bus is
located within the last minute
El Dorado Transit Authority utilizes the gPS Zonar System for pre-trip inspections maintenance and real-time vehicle tracking
Sacramento Regional Transit District (SacRT) has in shystalled pre-emptive traffic signals at at-grade intersections
along the Light Rail routes SacRT has a GPS however it is only utilized for analysis purposes
Computer-aided dispatch and Bus Rapid Transit are in
the planning stages In addition SacRT has an online Trip
Planning application to assist transit users During special events such as the California State Fair the Jazz Festival
65th Street Light Rail Station and Transit Oriented Development
HigHway 50 corridor system management plan [ 13 ]
c h a p t e r t h r e e c u r r e n t c o r r i d o r s y s t e m m a n a g e m e n t s t r a t e g i e s
TABLE 3 PARk AnD RIDE LOTS
County Post Mile Facility name Description
Lot use transit Connection
Spaces Spaces occupied
occupancy Rate () Provider and route No
SaC 70 Butterfield Sacramento Regional Transit Gold Line Station
406 129 318 SacRT SacRT LRT Gold Line
SaC 125 Sunrise Sacramento Regional Transit Gold Line Station
487 389 799 RSacRT SacRT LRT Gold Line
SaC 158 Hazel 432 135 306 SacRT SacRT LRT Gold Line
SaC 158 Hazel 33 6 24 SacRT Route 109
SaC 171 Folsom Boulevard 70 58 829 ED Iron Point Connector SacRT LRT Gold Line
ED 2 El Dorado Hills (Latrobe RoadWhite Rock Road) 123 138 1122 ED Iron Point Connector ED Routes
156781112
ED 5 Cambridge Road 59 40 678 ED Iron Point Connector ED Routes 14567891112
ED 86 Ponderosa Road Northeast 28 15 536 ED Iron Point Connector ED Routes 23679101112
ED 86 Ponderosa Road Northwest 111 61 55 ED Iron Point Connector ED Routes 23679101112
ED 86 Durock Road 57 21 368 Na
ED 149 Shingle Springs Drive 19 4 211 Na
ED 122 Greenstone Road 21 4 19 Na
ED 15 Missouri Flat Road 73 44 603 ED Iron Point Connector
ED 158 Fairgrounds Park-and-Ride 200 40 20 ED Iron Point Connector
ED 185 Placerville Station (Mosquito Park- and-Ride) 130 50 385 ED Iron Point Connector
ED Commuter Service
ED 233 Camino Heights 24 1 42 Na
SacRT = Sacramento Regional Transit District ED = El Dorado County Transit Authority Lrt = Light rail train
Survey 2007
the holiday seasons and the Mather Field Air Show SacRT
operates additional service to connect events to light rail stations and offer free service to promote transit use durshying select events The transit routes identified in the CSMP
network are shown in Figure 5
The Sacramento Valley Station in downtown Sacramento is
the 7th busiest station in the national amtrak system and serves as a multi-modal transfer facility There are over 11 million passenger trips annually
Passengers can make connections with numerous local bus services as well as the SacRT light rail system
[ 14 ] HigHway 50 corridor system management plan
c h a p t e r t h r e e c u r r e n t c o r r i d o r s y s t e m m a n a g e m e n t s t r a t e g i e s
Try Transit Changeable Message Sign in Sacramento County
Sacramento County installed pre-emptive traffic signals to give preferential signal timing to transit buses at selected locations that serve high priority transit corridors
SACOG manages the 511 and rideshare programs that cost approximately $1 million per year region-wide to foster carpooling transit ridership vanpooling and bicycling in all areas and corridors The Regional Rideshare Program covers Placer El Dorado Sacramento yolo yuba and Sut-ter counties it is part of a statewide network of rideshare agencies which encourage alternative transportation modes for traveling
Park and Ride lots are located adjacent to or nearby the US 50 corridor utilized by commuters to connect with transit vanpool or carpool Of the sixteen lots many are adjacent to the SacRT Light Rail gold Line providing access for commuters to park their vehicles and commute the re-mainder of their trip via Light Rail El Dorado County Transit authority also uses the park and ride lots as transit stops for their Commuter Buses The locations capacity and occupancy rates of the Park and Ride lots are displayed in Table 3
Bicycle Facilities Bicycle facilities in the corridor are not actively managed in the same manner as motor vehicle facilities
However there are traffic operation systems that serve bicyclists such as dedicated bicycle lanes bicycle detec-tion loops at signalized intersections video detection other non-loop type detection and bicyclist activated signal change buttons The City of Sacramento is installing video detection at some locations
SacRT buses and the new light rail trains are equipped with bicycle racks There are over 170 weatherproof bicycle lock-ers at 23 light rail stations yCTD has the Bikes on Buses Program that allows bicycles to travel on any yOLOBUS
The Sacramento area Bicycle advocates maintain an on-line hazard reporting system to allow users to report hazardous locations for bicyclist such as potholes inad-equate signal timing hazardous railroad crossings insuf-ficient shoulder and inadequate bikeway markings The reports are then sent to the applicable jurisdiction SaCOg is creating an on-line route planning system for bicyclists in addition SaCOg maintains bicycle maps on their website which are currently being updated
The bicycle routes included in the CSMP network are shown on Figures 6 and 7
Pedestrian Facilities Pedestrian facilities are not included as part of the man-aged network because they do not directly provide corridor mobility However complete and safe pedestrian access to appropriate corridor modes such as bike routes and transit services is an important component of corridor system management Therefore subsequent updates of the CSMP will seek to identify key pedestrian facilities and barriers to pedestrian mobility with regard to access and modal con-nectivity
HigHway 50 corridor system management plan [ 15 ]
c h a p t e r t h r e e c u r r e n t c o r r i d o r s y s t e m m a n a g e m e n t s t r a t e g i e s
[ 16 ] HigHway 50 corridor system management plan
Page Inte
ntionally
Left
Blank
MAIN ST
MA
RB
LE V
ALL
EY
RD
65TH ST EXPY
FLYING
C R
D
STATE
HW
Y 16
MA
RB
LE VA
LLEY R
D
CAM
BRID
GE R
D
GREEN VALLEY RD
RIV
ERSI
DE
BLVD
11T
H S
T
RIV
ERSI
DE
BLVD
HO
WE
AV
E
EL DORADO
HILLS BLVD
EL DORADO H
ILLS BLV
D
HORNET DR
JEFF
ERSO
N BL
VD
CAM
ERO
N PAR
K DR
PO
WE
R IN
N R
D
CO
UN
TY HW
Y E3
BRADSHAW RD
MATHER FIELD RD
ZINFAN
DEL D
R
11TH
ST
VD
FOLSOM BLFOLSOM BLVD
FOLSOM BLVD
FOLSO
M BLVD
WHITE ROCK RD
FOLSOM BLVD
FOLS
OM
BLV
D
LATRO
BE RD
CANAL ST
16TH
ST
JACQ
UIER
RD
15TH
ST
HARBOR BLV
D
STOCKTON BLVD
FORNI RD BIDW
ELL DR
WATT AVE
PLACERVILLE DR
TOW
ER G
ATEW
AY
SHIN
GLE SPR
ING
S DR G
REEN
STON
E RD
59TH
ST
SUN
RISE BLVD
EL D
OR
AD
O R
D
HAZEL AVE
SOUT
H RI
VER
RD
PON
DER
OSA R
D
SHIN
GLE SPR
ING
S RD
SHIN
GLE
SPR
ING
S R
D
CARSON RD
MISSO
URI FLAT RD
BASS LAKE RD
N SH
ING
LE RD
PRAIR
IE CITY R
D
S SHIN
GLE R
D
SHIN
GLE
RD
SCOTT RD
W S
T AT
5TH
ST
65TH
ST
5TH
ST
X
ST A
T 27
TH
80
CEDAR GROVE EXIT
MO
SQU
ITO R
D
PLACERVILLE DRMISSOURI
FLAT RD
FORNIRD
EL D
OR
AD
OR
D
POIN
T VIEW D
RSM
ITH FLAT R
D
SCH
NELL SC
HO
OL R
D
MO
NTER
EY RD
c h a p t e r t h r e e c u r r e n t c o r r i d o r s y s t e m m a n a g e m e n t s t r a t e g i e s
Figure 4 Existing Traffic Operations Systems Elements
Highway 50 Corridor Systems Management Plan Existing Traffic Operations Systems Excluding Ramp Meters
TOS ndash Traffic Operations Systems
Stations Continuous Coverage
EMS ndash Extinguishable Message Sign WIM ndash Weigh-in-Motion Location (EMS Usually Refers Motorist to HAR)
Television System
19365TMS ndash Traffic Monitoring99 US Highway 50VS ndash Fog (Visibility) Sensor
CCTV ndash Closed Circuit
I-80 to Cedar Grove Exit HAR ndash Highway Advisory Radio Local Road Interchange Access
White Rock RdRWIS ndash Roadside WeatherCMS ndash Changeable Sunrise Blvd to Latrobe Rd
Message Sign Information System
50
80
51
49 160
50
Placerville to Cedar Grove Exit
50
1935
16 49
99
84 160
49 MilesMiles 0 1 2 3 4 50 1 2 3 4 5 10
HigHway 50 corridor system management plans [ 17 ]
124 49
MOTHER LODE DR
MATHER FIELD RD
West Terminus
RAMP
RAMP
RAMPRAMP
RAM
P
RAMP
RAM
P RAMP
RAMPRAMP
RA
MP
RAM
P RAM
P
RAMP
RAM
P
RAM
P
RA
MP
RAM
P
RAM
P
YoloBus Express Routes Plus Routes 42A and 42B
RAMPBROADWAY
65TH
ST
PCE
65
SCRY42A
Y44Y4343
242 IPC
5
W STX ST
WATT AVE
MAROCKINGHAM
DR
OLD PLACER
BRADSHAW RD
VILLE RDTHER FIELD RD
INTERNATIONAL DR
ZINFANDEL DR
WHITE ROCK RD FOLSOM BLVD FOLSOM BLVD
SUNRISE BLVD
BLUE R
AVIN
E RD
WHITE ROCK RD
SC
OTT R
D
PR
AIR
IEC
ITY R
D
LATROBE RD
GREEN V ALLEY RD
PLACERVILLE DR
FORNI RDM
AIN ST
BROADWAY
CEDAR GROVE EXIT
WEST
CAPTOL AVE
(WESTMOST
STOP)
(WESTMOST STOP)
SCR
SCR
IPC
IPC
c h a p t e r t h r e e c u r r e n t c o r r i d o r s y s t e m m a n a g e m e n t s t r a t e g i e s
Figure 5 US 50 CSMP Network Transit Routes
Highway 50 Corridor System Management Plan 80
CSMP Commuter Transit Network
El Dorado County Transit Authority 65
IPC Iron Point Connector
SCR Sacramento Commuter Route 193
Sacramento Regional Transit District 109ndashHazel Express
Yolo Bus (Express) Y43 Y44 Y230 Y231 and Y232
Yolo Bus (All-Day Intercity amp Airport Service) Y42A (Clockwise) Y42B (Counter-clockwise)
LATROBE RD
Park-and-Ride Lots
193 65
49 US Highway 50 (I-80 to Cedar Grove Exit)
Parallel Roads
Light Rail STation
Light Rail
Class I Bikeways Other State Highways
County Lines
80
49
50
80160
50
5 84 16
4999
Miles 0 5 10160
HigHway 50 corridor system management plans [ 18 ]
K
5
FOLSOM BIKE TRAIL
SEE CENTRAL CITY BICYCLENETWORK MAP FOR BICYCLE
F ACILITY NAMES
AMERICAN RIVER PARKWAY TRAIL SYSTEM
(INCLUDING JE
DEDIAH SMITH MEMORIAL T
RAIL)
FOLSOM BLVD
WHITE ROCK RDSIL V A V ALLEY PKWY
EL D
OR
AD
O H
ILLS B
L VD
GREEN VALLEY RD
AMERICAN R
IVER PARKWAY
TRAIL
SYSTEM
(INCLU
DING JE
DEDIAH SMITH
MEMORIA
L TRAIL)
NATOMA ST
FOLSOM BLVD
EL DORADO TRAIL
CARSON RD
PLACER VILLE RD
RAY
LAW
YER
DR
c h a p t e r t h r e e c u r r e n t c o r r i d o r s y s t e m m a n a g e m e n t s t r a t e g i e s
Figure 6 US 50 CSMP Network Bicycle Routes
Highway 50 Corridor System Management Plan
Bicycle Route Network
Class I Bicycle Facilities
Class II Bicycle Facilities
193
Lincoln
65
Rocklin
Auburn
Folsom 49
193
Light Rail Stations
Light Rail Loomis50
RosevilleUS Highway 50 CSMP Corridor
Other State Highways Miles
County Lines 0 1 2 3
99
49 80
50
160 80 193
Placerville 50
West Rancho 50 Sacramento Cordova
5 0 49
8 4
9 9 Sacramento
1 6 4 9
0 1 2 Miles
3
1 6 0 Elk Grove 210 210 44 66 88
Miles 10 Miles
10 1 2 4
4 9
HigHway 50 corridor system management plans [ 19 ]
13TH
ST
H ST E ST BELVEDERE AVE
51ST
ST
BROADWAY H ST
48TH
ST
11TH
ST
PO
WE
R IN
N R
D
28TH
ST
STOC
KTON
BLVD3R
D ST
ALH
AMBR
AFR
ON
T BLV
D S
T
W CAPITOL A VE
DISCOVER Y
P ARK BRIDGE
JEDED
IAH
N ST
T ST
K ST
11TH
ST
RIV
ERSI
DE
BLV
D
18TH
ST
R S
T17
TH S
TO
ST
18TH
ST
20TH ST
CAPITOL AVE
T ST
28TH
ST
34TH
ST
39TH
ST
M ST
BROADWAY
T ST
FOLSOM BLVD
58TH
ST
J ST
65TH
ST
CSU
S
CO
NN
ECTIO
NS
SR 16JACKSON HWY
FOLSOM BLVD
LA RIVIERA DR
W ATT AV
E
HO
WE A
VE
GUY W
EST B
RIDE
COLLEGE TOWN DR
c h a p t e r t h r e e c u r r e n t c o r r i d o r s y s t e m m a n a g e m e n t s t r a t e g i e s
Figure 7 US 50 CSMP Network Bicycle Routes (Sacramento Insert)
5 Sacramento
8 0
8 0
160
West Sacramento
80
SMITH MEMORIAL TRAIL
50
US Highway 50 Corridor System Management Plan 50
Central City Bicycle Route Network 50
Bikeway and Multi-Use Network
US Highway 50 (I-80 to Cedar Grove Exit)
Class I Bicycle Facilities
Class II Bicycle Facilities
Connecting Routesndashno Bicycle Designation
80 16 5
BROADWAY
FLOR
IN-P
ER
KIN
S R
D
Light Rail STation 99
Light Rail
Other State Highways
County Lines
HigHway 50 corridor system management plans [ 20 ]
major corridor mobility challenges
chapter four
High demand for mobility services especially during peak commute periods is creating significant traffic congestion
and impairing mobility in the corridor Heavy congestion and stop-and-go traffic contributes to increased vehicle
emissions and added travel costs Many transit services are operating at maximum passenger carrying capacity and buses often must contend with the same congestion as autos in many locations bicyclists have to compete for space on these same facilities
Much of the congestion can be attributed to population growth residential and commercial development job housing imbalances work schedules that require commute trips during peak travel times recreational trip generators and truck traffic
The overall amount of travel in the corridor has increased dramatically over the past ten years and is expected to
continue to increase as the region adds approximately
one million new residents over the next 25 years per the current SACOG MTP 2035 Traffic congestion per houseshyhold is expected to increase 18 percent over 2005 levels
by the year 2035
in the general area of eastern Sacramento County and western El Dorado County the Highway 50 Partnership
has projected growth of 78000 more dwelling units and 53000 new jobs over the next 25 years Current and foreshycasted data is depicted in Table 4
The sections of US 50 with particularly severe traffic
congestion are depicted in Figures 8 and 9 These are
also summarized in greater detail in Tables 14 and 15 in Chapter 7 Table 14 shows a summary of the US 50 eastbound bottlenecks while the tables that follow discuss each bottleneck including location and possible causality Table 15 shows a summary of the US 50 westbound bottleshynecks while the tables that follow discuss each bottleneck including location and possible causality Minor or hidden bottlenecks are those that are not as defined (or severe) as the major bottlenecks Please note that the graphics acshycompanying the bottlenecks are not to scale
a critical component of identifying and resolving Traffic congestion per corridor mobility challenges household is expected is the need for detailed to increase 18 percent data analysis and comshy over 2005 levels by the munication regarding
year 2035system performance Data collection is insufficient to
fully meet these needs but still provides useful information as detailed in the following pages improving data gathershying analysis and dissemination of information is a major challenge for this corridor and is a component of intelligent Transportation Systems planning
HigHway 50 corridor system management plan [ 21 ]
c h a p t e r f o u r m a j o r c o r r i d o r m o b i l i t y c h a l l e n g e s
[ 22 ] HigHway 50 corridor system management plan
Figure 8 US 50 AM Peak Period Bottleneck Locations
Figure 9 US 50 PM Peak Period Bottleneck Locations
Challenges along the corridor include
bull severe recurrent highway and roadway traffic congestion
bull an incomplete buscarpool lane system
bull an incomplete set of freeway auxiliary lanes
bull loss or dropping of freeway lanes at specific locations
bull incomplete ramp metering
bull limited parallel roadway capacity
bull lack of signal coordination on key arterials and freeway ramp intersections
bull transit facilities approaching capacity
bull inadequate transit capital and operations funding needed to grow transit ridership
bull light rail at-grade crossings
bull lack of adequate access to transit across US 50
bull lack of double tracking of the light rail Gold Line to Folsom
bull poor pavement and road and bicycle route maintenancesweeping
bull lack of sufficient bicycle activated signal change devices
bull motorist driving behavior
bull inadequate bicycle storage
bull inadequate bicycle and pedestrian access to transit and
bull gaps and barriers within the bicycle route network
Additionally the EDCTC has identified safety and operashytional issues between the Smith Flat interchange and east of the Upper Carson RoadCamino intersection in the
Camino Area Parallel CapacitySafety Study Transporshytation issues include at-grade access to US 50 left turn conflicts across US 50 increasing average daily local and
interregional traffic growth in the area lack of alternate
routes seasonal traffic to and from Apple Hill and other local events and seasonal access to recreation in the Lake
Tahoe Region
c h a p t e r f o u r m a j o r c o r r i d o r m o b i l i t y c h a l l e n g e s
Table 4 CUrrenT and ForeCaSTed TraFFiC daTa
location Current Traffic data ndash 2007 Future Traffic data ndash 2027 (no build) Future Traffic data ndash 2027 (build)
County description amp location of Trucks
Peak directional
Split
Peak Hour Traffic
average annual daily
Traffic2
Volume over Capacity3
Peak Hour Traffic
average annual daily Traffic2
Volume over Capacity3
(no-build)
Peak Hour Traffic
average annual daily
Traffic2
Volume over Capacity3
(build)
yOL interstate 80 to yoloSacramento County Line
6 60 15500 180000 109 23911 277032 169 24070 278880 136
SaC yoloSacramento County Line to State Routes 99 and 51
4 59 21000 253000 135 28080 312480 186 29153 324415 193
SaC State Routes 99 and 51 to watt avenue 4 59 20600 225000 145 27942 286230 189 30648 313950 166
SaC watt avenue to Zinfandel Drive 4 59 16700 187000 115 24783 274540 163 25885 286750 136
SaC Zinfandel Drive to Sunrise Boulevard 4 60 13500 149000 093 20331 224394 133 20925 230950 110
SaC Sunrise Boulevard to Folsom Boulevard 4 66 11900 125000 089 18888 198247 131 20086 210820 140
SaC Folsom Boulevard to SacramentoEl Dorado County Line
3 66 8800 95000 087 13341 151311 133 13612 154380 136
ED SacramentoEl Dorado County Line to Cameron Park Drive
4 61 6900 70000 095 11454 116200 165 11834 120050 114
ED Cameron Park Drive to Missouri Flat Road
4 62 5700 62000 092 8647 94054 132 9462 102920 096
ED Missouri Flat Road to End of Freeway in Placerville
4 57 4850 59000 069 7101 76245 098 7363 79050 102
ED End of Freeway in Placerville to Bedford avenue
4 55 4800 52000 Na 4 6595 74196 Na4 6648 74790 Na4
ED Bedford avenue to Cedar grove Exit 4 62 3800 38500 077 5474 50782 099 5520 51205 099
1 Peak Directional Split The percentage of total traffic in the heaviest traveled direction during the peak hour2 Average Annual Daily Traffic (AADT) The average number of vehicles per day in both directions 3 Volume over Capacity (VC) The volume of traffic compared to the capacity of the roadway4 Volume over Capacity does not determine LOS for two- or three-lane facilities or segments with intersection delay 5 Reported Collision Rate index ( Compared to State average) The percentage by which each segmentrsquos reported collisions rate (fatal injury and property damage only) is above or below the statewide average reported collisions rate on comparable facilities
Source 3-Year Caltrans Traffic Accident Surveillance and Analysis System data
HigHway 50 corridor system management plans [ 23 ]
c h a p t e r f i v e p e r f o r m a n c e m e a s u r e s
Page Inte
ntionally
Left
Blank
[ 24 ] HigHway 50 corridor system management plan
performance measures
chapter five
Continuing corridor monitoring and performance mea-
sures are an integral part of corridor management and investment decision making and help identify immediate efficient and effective system operational strategies and
capital improvements Performance measures provide the
important dynamic daily information needed to rapidly
address operational problems caused by recurrent and
non-recurrent traffic congestion Measures are also used to identify the best improvement actions to generate the desired results
Table 5 identifies the performance measures to be used as
part of the corridor system management process
Baseline Data For perFormance measures Tables 6 7 and 8 display baseline data for the perforshymance measures for the CSMP transportation network
The performance data was primarily compiled from the SACMET demand based traffic model the year 2007
edition of the Traffic Volumes Manual the year 2000 edition of the Highway Capacity Manual Caltrans Traffic
Accident Surveillance and Analysis System (TASAS) the 2007 Caltrans Division of Maintenance Pavement Summary Report and ridership records provided by the transit providers
additional performance Performance Measures data was derived from the provide the important Performance Measurement dynamic dailySystem (PeMS) tool an
information needed internet based tool used to
to rapidly addresshost process retrieve and operational problemsanalyze road traffic condishy
tions information from caused by recurrent
real-time and historical and non-recurrent data PeMS obtains 30-sec- traffic congestion ond loop detector data in real-time from detectors installed along the highway corridor
It should be noted that Average Daily Traffic (ADT) and LOS
for some ParallelConnecting Roadways segment locations
in Table 7 was not available These are noted ldquoNo Datardquo
Data collection for non-auto modes is not as robust as what is needed for active system management Subsequent updates of this CSMP will seek to expand the
availability of transit and bicycle performance data collection
HigHway 50 corridor system management plan [ 25 ]
mdash
c h a p t e r f i v e p e r f o r m a n c e m e a s u r e s
TABLE 5 PERFORmAnCE mEASURES DEFInITIOnS AnD APPLICABILITY
Performance Measure Definition of Performance measure applicability to Corridor
STATE HIGHWAY SYSTEm
LOS A ldquoreport cardrdquo measurement with ldquoArdquo being the least amount of
congestion and ldquoFrdquo being the most congestion LOS is a relatively simple and widely used measure which
offers comparison opportunities
Total Vehicle Hours of Delay The additional travel time in hours experienced by all vehicles on the highway segment per day or at peak hour due to congestion
This measurement is used to determine the cost in time which congestion can add to the regular travel time that it takes to traverse a segment of road and is useful in
quantifying the performance of a particular roadway in an understandable format
Total Person Minutes of Delay The additional travel time in minutes experienced by all persons in vehicles on the highway segment per day or at peak hour due
to congestion
This measurement is used to determine the cost in time which congestion can add to the regular travel time that it takes to traverse a given segment of road and is useful in quantifying the performance of a particular roadway in an
understandable format and for comparison of improvement options
Minutes of Delay per Vehicle The additional travel time in minutes experienced by each vehicle on the highway segment at peak hour due to congestion
This measurement is used to determine the cost in time which congestion can add to the regular travel time that it
takes to traverse a given segment of road
Minutes of Delay per Person The additional travel time in minutes experienced by each person in vehicles on the highway segment at peak hour due to congesshy
tion
This measurement is used to determine the cost in time which congestion can add to the regular travel time that it
takes to traverse a given segment of road
Vehicle Travel Time (Minutes) The average time spent by vehicles traversing between two points on a road or highway
Travel time is a measure used to quantify travel time deficienshycies and provide a personal indicator of congestion impacts
Distressed Pavement Pavement that rides rougher than established maximums and or exhibits substantial structural problems as determined by the
Pavement Condition Survey
This measurement provides a ride quality indicator and an indicator for structural roadway problems
Reported Collision Rate Comparison of the actual total collision rate () along a highway segment above or below the statewide average for fatal injury
and property damage-only collisions on comparable facilities
Comparing the total collision and rate with statewide average rate provides an opportunity to assess safety conditions
through the corridor
Reliability Identifies day-to-day variation in travel time for the same trip at the same time of day Focuses on the predictability of travel time
particularly for repetitive trips
Estimates reliability by defining the extra time travelers must add to their average travel time when planning trips to ensure on-time arrival (0 percent no day-to-day variations
100 percent double allotted travel time)
Lost Productivity Measures the capacity of the corridor to accommodate vehicle or person throughput and is calculated as actual volume divided by
the capacity of the highway
As traffic volumes increase to roadway capacity speeds decline rapidly and vehicle throughput drops dramatically which increases traffic congestion and delay and results in
lost productivity
[ 26 ] HigHway 50 corridor system management plan
mdash
c h a p t e r f i v e p e r f o r m a n c e m e a s u r e s
HigHway 50 corridor system management plan [ 27 ]
TABLE 5 PERFORmAnCE mEASURES DEFInITIOnS AnD APPLICABILITY (ConTInued)
Performance Measure Definition of Performance measure applicability to Corridor
PARALLEL AnD COnnECTInG ROADWAYS
LOS A ldquoreport cardrdquo measurement with ldquoArdquo being the least amount of
congestion and ldquoFrdquo being the most congestion LOS is a relatively simple and often used measure which
offers comparison opportunities
traNSit
available Capacity Ratio () of available transit capacity alternatives within the corridor
This measure indicates the available capacity to accommoshydate diverted travelers from single occupant vehicles
c h a p t e r f i v e p e r f o r m a n c e m e a s u r e s
[ 28 ] HigHway 50 corridor system management plan
Page Inte
ntionally
Left
Blank
c h a p t e r f i v e p e r f o r m a n c e m e a s u r e s
Table 6 US 50 PerForManCe MeaSUreS
County location Post Miles
distance (Miles)
average annual daily Traffic1
PerForManCe MeaSUreS
loS1
Total Vehicle Hours of delay2
Total Person Minutes of delay2
Minutes of delay per Vehicle2
Minutes of delay per Person2
Vehicle Travel Time (Minutes)2 distressed
Pavement (lane
Miles)4
reported Col-lision rate
Comparison ()5
reliability6 lost Productivity7
daily Peak Hour3 daily Peak
Hour3 Peak Hour3 Peak Hour3 Peak Hour3 eastbound westbound lost lane Miles aM
Peak Period
lost lane Miles PM
Peak Period
STaTe HigHway SySTeM
yOL interstate 80 to yolo Sacramento County Line
000 to 316 316 180000 F 1169 126 95363 8061 049 046 36 9 26 62 22 01 0
SaC
yoloSacramento County Line to State Routes 99
and 51
L000 to L248 R000
248 253000 F 4993 653 407455 41746 186 175 43 7 20 64 60 53 76
State Routes 99 and 51 to watt avenue
R000 to R534 534 225000 F 10097 1362 823883 87105 397 372 93 15 24 60 48 81 68
watt avenue to Zinfandel Drive
R534 to R1092 558 187000 F 8075 977 658886 62506 351 329 91 19 -32 56 42 44 23
Zinfandel Drive to Sunrise Boulevard
R1092 to 1250 158 149000 E 1271 197 103727 12610 088 082 25 9 -33 46 13 0 16
Sunrise Boulevard to Folsom Boulevard
1250 to 1701 451 125000 E 3087 356 251940 25832 180 149 63 5 -14 60 46 1 45
Folsom Boulevard to SacramentoEl Dorado
County Line
1701 to 2314 613 95000 D 583 122 47537 8867 083 069 70 0 -11 19 55 0 08
ED
SacramentoEl Dorado County Line to Cameron
Park Dr
000 to R657 657 70000 E 504 126 41150 9138 110 091 77 1 -35 PeMS Data
Unavailable PeMS Data Unavailable
PeMS Data Unavailable
PeMS Data Unavailable
Cameron Park Drive to Missouri Flat Road
R657 to R1506 849 62000 E 302 75 24633 4827 079 075 93 2 -61 PeMS Data
Unavailable PeMS Data Unavailable
PeMS Data Unavailable
PeMS Data Unavailable
Missouri Flat Road to End of Freeway in Placerville
R1506 to 1725 219 59000 D 66 16 5376 1053 020 019 24 1 20 PeMS Data
Unavailable PeMS Data Unavailable
PeMS Data Unavailable
PeMS Data Unavailable
End of Freeway in Placerville to Bedford avenue
1725 to 1811 086 52000 D 68 17 5585 1094 021 020 15 2 81 PeMS Data
Unavailable PeMS Data Unavailable
PeMS Data Unavailable
PeMS Data Unavailable
Bedford avenue to Cedar grove Road
1811 to R2595 784 38500 D 58 15 4758 932 023 022 85 10 6 PeMS Data
Unavailable PeMS Data Unavailable
PeMS Data Unavailable
PeMS Data Unavailable
TOTaL mdash 5473 mdash mdash 30273 4042 2470293 263771 1587 1449 7150 80 mdash mdash mdash mdash mdash
1 Source Average Annual Daily Traffic and Level of Service (LOS) calculated is based on 2007 Caltrans Traffic Volumes on California State Highways and Highway Capacity Manual and Cambridge Systematics from 2008 Reported LOS is for the typical most congested daily peak travel period 2 Source Delay is the average additional travel time by vehiclespersons traveling under 60 mph Data derived from 2007 HICOMP report SACMET Travel Demand Model PeMSs traffic data and Caltrans District 3 Traffic Operations Probe vehicle Tach runs 3 Peak Hour is during PM 4 Source 2007 Caltrans Division of Maintenance Pavement Summary Report 5 Source 2004 through 2007 Caltrans Traffic Accident Surveillance and Analysis System summary data of the percentage above or below the statewide average for fatal injury and property damage-only collisions on comparable facilities 6 Reliability The Planning Time Index is a measure of the reliability of the travel time on a particular route It is the ratio of the 95th percentile of travel time on a route to the median free-flow travel time This means itrsquos the amount of time a traveler needs to allocate for a route if they want to show up on time 19 out of 20 trips Reliability and Planning Time data was taken from April 2007 The data covered a 24-hour period of time on each Tuesday wednesday and Thursday of that month That data was then aggregated into a single average 24-hour day it was then analyzed to determine the highest average aM and PM travel time That time was then compared to the best possible average travel time to determine the additional time that was spent traveling the same seg-ment 7 Lost Productivity Data taken April 2007 PeMS As traffic increases to the capacity of the highway speeds decline throughput drops dramatically and the efficiency of the highway to provide mobility decreases This decline in the potential carrying-capacity of the freeway is expressed in terms of how many equivalent lane miles of roadway are lost
HigHway 50 corridor system management plans [ 29 ]
c h a p t e r f i v e p e r f o r m a n c e m e a s u r e s
Table 7 Parallel and ConneCTing roadwayS PerForManCe MeaSUreS
County location average
daily Traffic1
PerForManCe MeaSUreS
loS1
Total Vehicle Hours of delay2
Total Person Minutes of delay2
Minutes of delay per Vehicle2
Minutes of delay per Person2
Vehicle Travel Time (Minutes)2
distressed Pavement
(lane Miles)4
daily Peak Hour3 daily Peak
Hour3 Peak Hour3 Peak Hour3 Peak Hour3
Parallel and ConneCTing roadwayS
yOL west Capitol Enterprise Boulevard to Capitol Mall 13737 No Data
Data is unavailable for these performance measures at this time however will be pursued in the next phase of the CSMP
SaC
w 5th Street to 26th Street 9194 a
X 5th Street to 26th Street 9154 a
Folsom Boulevard watt avenue to Bradshaw Road 25600 C
watt avenue Folsom Boulevard to US 50 63900 F
Bradshaw Road Folsom Boulevard to US 50 22400 a
Folsom Boulevard Bradshaw Road to Sunrise Boulevard 20400 a
Bradshaw Road Old Placerville to US 50 54405 F
Old Placerville Road Bradshaw Road to Rockingham Drive 11864ndash18365 a
Rockingham Drive Old Placerville Road to Mather Boulevard 16516 E
Mather Boulevard Rockingham Drive to Folsom Boulevard 21732 C
international Drive Rockingham Drive to Zinfandel Drive 12808 a
Zinfandel Drive international Drive to Folsom Boulevard 22298ndash47032 BE
white Rock Road Zinfandel Drive to Sunrise Boulevard 25459 a
Sunrise Boulevard US 50 to Folsom Boulevard No Data No Data
white Rock Road Sunrise Boulevard to Prairie City Road 3400 B
Folsom Boulevard Sunrise Boulevard to iron Point Road 17200 a
white Rock Road grant Line Road to EDSaC County Line 6700 D
iron Point Road Folsom Boulevard to East BidwellScott Road 13984 No Data
Scott Road iron Point Road to white Rock Road No Data No Data
Folsom Boulevard iron Point Road to Blue Ravine Road No Data No Data
Blue Ravine Road Folsom Boulevard to green Valley Road No Data No Data
Prairie City Road US 50 to white Rock Road 6000 D
HigHway 50 corridor system management plans [ 30 ]
c h a p t e r f i v e p e r f o r m a n c e m e a s u r e s
Table 7 Parallel and ConneCTing roadwayS PerForManCe MeaSUreS (ConTinUed)
County location average
daily Traffic1
PerForManCe MeaSUreS
loS1
Total Vehicle Hours of delay2
Total Person Minutes of delay2
Minutes of delay per Vehicle2
Minutes of delay per Person2
Vehicle Travel Time (Minutes)2
distressed Pavement
(lane Miles)4
daily Peak Hour3 daily Peak
Hour3 Peak Hour3 Peak Hour3 Peak Hour3
Parallel and ConneCTing roadwayS
ED
green Valley Road EDSaC County Line to Francisco Drive 22600 D
Data is unavailable for these performance measures at this time however will be pursued in the next phase of the CSMP
green Valley Road Francisco Drive to Silva Valley Parkway 13077 D
green Valley Road Silva Valley Parkway to Cameron Park 9849 C
green Valley Road Cameron Park Drive to Deer Valley Road 5278 C
green Valley Road Deer Valley Road (East) to Lotus Road 8381 D
green Valley Road Lotus Road to Placerville Drive 4669 C
Latrobe Road white Rock Road to US 50 24742 C
Durock Road Cameron Park Dr to South Shingle Road 7278 C
Cameron Park Drive Durock Road to US 50 (Durock Road to Coach Lane Coach Lane to US 50) 9544 26603 CD
South Shingle Road Durock Road to US 50 11390 D
white Rock Road EDSaC County Line to Latrobe 12808 D
white Rock Road Latrobe Rd to Silva Valley Pkwy (Latrobe to PostPost to Silva Vlly Pkwy) 10124 CD
Silva Valley Parkway white Rock Rd to Serrano Pkwy (white Rock to Entrada Entrada to Serrano Pkwy) 13708 9328 DC
Forni Road Placerville Drive to Main Street 9049 8379 No Data
Placerville Drive Forni Road to US 50 No Data No Data
Main Street Placerville Drive to Bedford avenue No Data No Data
Main Street Bedford avenue to Broadway No Data No Data
Broadway Main Street to Point View Drive No Data No Data
1 Source Average Daily Traffic and Level of Service (LOS) calculated are based on City of Sacramento between 2001 and 2007 Sacramento County from 20072008 City of Rancho Cordova between 2004 and 2007 and El Dorado County from 2007
HigHway 50 corridor system management plans [ 31 ]
c h a p t e r f i v e p e r f o r m a n c e m e a s u r e s
Page Inte
ntionally
Left
Blank
[ 32 ] HigHway 50 corridor system management plan
c h a p t e r f i v e p e r f o r m a n c e m e a s u r e s
tabLe 8 traNSit PerforMaNCe MeaSure
County transit Provider route Performance Measure
available daily Capacity ()1 available Peak Hour Capacity1
traNSit
SaC
SacRT (Bus)
Route 21 70 10
Route 28 76 59
Route 36 83 74
Route 38 66 44
Route 72 56 20
Route 73 79 45
Route 74 82 43
Route 109 47 22
SacRT (Light Rail) Gold Line 31 Exceeds Capacity
EDSAC ED County Transit Authority
Commuter Express Bus Service Not applicablendashOperates Peak Hour
Only 405
iron Point Connector 764 Not available
Reverse Commuter Not applicablendashOperates Peak Hour Only 982
yoloSaC yolo County Transit District Not applicablendashOperates Peak Hour Only 498
biKe3
1 Source average Daily and Peak Hour available Capacity calculated from each transit providerrsquos route ridership data 2 The Reverse Commuter service is offered on vehicles that are returning to El Dorado County (Commuter Express Buses) 3 Bicycle performance measure(s) will be identified applied and included in the subsequent CSMPs
HigHway 50 corridor system management plan [ 33 ]
c h a p t e r f i v e p e r f o r m a n c e m e a s u r e s
[ 34 ] HigHway 50 corridor system management plan
Page Inte
ntionally
Left
Blank
planned corridor system management strategies
chapter six
ConCept LoS and ConCept FaCiLit y ldquoConcept LOSrdquo and ldquoConcept Facilityrdquo have traditionally been used in Caltrans TCCRs to reflect the minimum level or quality of operations acceptable for each route segment within the 20-year planning period and the highway facility needed in the next 20 years to maintain the Concept LOS
Typical Concept LOS standards in Caltrans District 3 are LOS ldquoDrdquo in rural areas and LOS ldquoErdquo in urban areas how-ever some heavily congested route segments now have a Concept LOS ldquoFrdquo because the improvements required to bring the LOS to ldquoErdquo are not feasible due to environmental right of way financial and other constraints The applica-tion of multi-modal corridor management strategies should reduce the severity and duration of congestion and provide viable travel options and information that will enable a traveler to avoid severe freeway congestion
The Concept LOS and Concept Facility for US 50 are shown in Table 9 almost all US 50 segments are forecasted to operate under LOS ldquoFrdquo conditions in 20 years under the No-Build and Build scenarios
Corridor ManageMent StrategieS The US 50 CSMP also proposes specific strategies to enhance corridor mobility (see Table 10) based on the fol-lowing principles
bull Manage all modes and facilities in the corridor as a single system beginning with the transportation net-work defined in this CSMP
bull Implement comprehensive and dynamic multimodal monitoring and reporting for the system and for all modes
bull Develop and use micro-simulation modeling to identify mobility challenges and to evaluate proposed solutions
bull Complete the projects included in the regional trans-portation plans with an emphasis on the completion of the key mobility improvement projects identified in this CSMP (see Tables 11 and 12)
bull Implement the specific strategies outlined in this CSMP
Key CapitaL projeCtS Tables 11 and 12 contain key capital projects that have been identified as the most critical to corridor mobility These are also included in the SaCOg MTP for 2035 and are either planned without any funding yet programmed are partially programmed
The US 50 CSMPor are entirely programmed SACOG conducted significant proposes specific
public attitude research strategies to enhance for the MTP for 2035 to corridor mobility complement comprehensive outreach efforts through community workshops the TALL Order Moving the Region Forward event the televised Town Hall Road Map for the Future and associated public polling The results of the SaCOg analyses and public out-reach for the MTP were
highway 50 corridor system management plan [ 35 ]
c h a p t e r s i x p l a n n e d c o r r i d o r s y s t e m m a n a g e m e n t s t r a t e g i e s
[ 36 ] HigHway 50 corridor system management plan
used when selecting the key projects for identification in
the CSMP and to ensure consistency Not all corridor projshyects in the MTP are included in the CSMP since the CSMP focuses on the managed network and the SaCOg MTP considers all streets and roads bike routes and transit services in the corridor
highway 50 partnership The Highway 50 Partnership is a cooperative public-private effort among the County of Sacramento City of Rancho
Cordova City of Folsom County of El Dorado and several major landowners that recognize the need to consider corrishydor mobility needs holistically
The Partnership has collaborated effectively to develop a Plan to improve mobility in the US 50 Corridor from Rancho
Cordova to El Dorado Hills an area identified as approprishyate for growth in the SACOG Blueprint Recognizing the
need to generate private investment the Partnership is seeking to implement a regional Highway 50 Corridor fee program to fund these projects
in addition to the key projects indicated in Table 11 Table 12 displays the key projects identified by the
Partnership
These projects include (1) Near-Term Priority Improvement Projects and (2) Near-Term Expected Roadway Improveshyments
The Near-term Priority improvement Projects would proshyvide several new roadway connections for people to travel within and through the area to avoid congestion They also include new transit routes and widening existing roadways
viewed by the Partnership as a package that would provide system-wide travel benefits These improvements targeted
for completion through 2012 would reduce vehicle hours of delay during commute hours by 30 percent
The near-Term Expected Roadway Improvements are conshysidered by the Partnership to be readily expected since they are tied to expected development or are part of a near-term
capital improvements program
Visionary projects Visionary projects are not yet included in the SaCOg MTP or EDCTC RTP but appear to offer considerable corridor mobilshyity benefits and merit further analysis and consideration for inclusion in the next MTP and RTP These are displayed in
Table 13
The ldquoPlus 10 Listrdquo in the SACOG MTP identifies projects
that are attractive from a performance standpoint but could not be included in the Final Project Lists because of financial constraint The ldquoPlus 10 Listrdquo element offers the
opportunity to include projects that would not be affordshyable without additional funding Some projects identified in
the Visionary Projects List were analyzed by SACOG during
development of the current MTP Some of these are included in the ldquoPlus 10 Listrdquo
Watt Avenue Light Rail Station Improvement Project
c h a p t e r s i x p l a n n e d c o r r i d o r s y s t e m m a n a g e m e n t s t r a t e g i e s
Table 9 US 50 ConCePT loS and FaCiliTy TyPe
location Forecasted level of Service1 (loS) and Facility Type
County description and location From Post Mile To Post Mile Current
loS1 20-year no build loS12
20-year build loS12
20-year Concept
loS13 existing Facility4 Concept Facility456 Ultimate Facility457
yOL interstate 80 to yoloSacramento County Line
000 316 F F F F 8F (6F between Jefferson Blvd ramps)
8F+2HOV+aux Lanes 8F+2HOV+aux Lanes
SaC yoloSacramento County Line to SR 99 and 51
L000 L248 = R000 F F F F 8F 8F+2HOV+aux Lanes 8F+2HOV+aux Lanes
SaC State Routes 99 and 51 to watt avenue R000 R534 F F F F 8F 8F+2HOV+aux Lanes 8F+2HOV+aux Lanes
SaC watt avenue to Zinfandel Drive R534 R1092 F F F F 8F 8F+2HOV+aux Lanes 8F+2HOV+aux Lanes
SaC Zinfandel Drive to Sunrise Boulevard R1092 1250 E F F F 8F 8F+2HOV+aux Lanes 8F+2HOV+aux Lanes
SaC Sunrise Boulevard to Folsom Boulevard 1250 1701 E F F F 6F+2HOV to Hazel ave 4F+2HOV
to Folsom Blvd
6F+2HOV+aux Lanes to Hazel ave 4F+2HOV+aux
Lanes to Folsom Blvd
8F+2HOV+aux Lanes
SaC Folsom Boulevard to SaCED County Line 1701 2314 D F F F 4F+2HOV 4F+2HOV+aux Lanes 6F+2HOV+aux Lanes
ED SacramentoEl Dorado County Line to Cameron Park Drive
000 R657 E F F F 4F 4F+2HOV+aux Lanes 6F+2HOV+aux Lanes
ED Cameron Park Drive to Missouri Flat Road R657 R1506 E F E E 4F 4F+2HOV+aux Lanes to greenstone 4F+aux Lanes
to Missouri Flat
6F+2HOV+aux Lanes to greenstone 4F+2HOV+aux Lanes
to Missouri Flat
ED Missouri Flat Road to End of Freeway in Placerville
R1506 1725 D F F F 4F 4F+aux Lanes 4F+aux Lanes
ED End of Freeway in Placerville to Bedford avenue
1725 1811 D E E E 4E 4E 4E
ED Bedford avenue to Cedar grove Exit 1811 R2595 D F F F 4F to Smith Flat 4E to Camino 4F+aux Lanes to Smith Flat 4E to Camino
4F+aux Lanes
1 Level of Service (LOS) A ldquoreport cardrdquo for evaluating traffic flow with ldquoArdquo being the best and ldquoFrdquo being the worst 2 20-year LOS (No Build) The LOS that would be expected at 20 years with no improvements 3 20-year Concept LOS The minimum acceptable LOS over the next 20 years 4 Facility Type Codes C=Conventional Highway E=Expressway F=Freeway HOV=High Occupancy Vehicle Lanes aux=auxiliary Lanes 5 Operational improvements are included in future facilities for all segments Examples of operational improvements include TOS improvements and auxiliary lanes 6 Concept Facility the future roadway with improvements needed in the next 20 years if LOS ldquoFrdquo no further degradation of service from existing ldquoFrdquo is acceptable as indicated by delay performance measurement 7 Ultimate Facility The future roadway with improvements needed beyond a 20 year timeframe
HigHway 50 corridor system management plans [ 37 ]
c h a p t e r f i v e p e r f o r m a n c e m e a s u r e s
Table 10 US 50 CSMP STraTegieS
Strategy description implementation Challenges
Maintain and operate the existing corridor multi-modal trans-
portation infrastructure
Maintain the existing investment in all modes of the transportation system and provide adequate resources for daily operations including operating
revenues for transit services
Funding availability funding competition within the region
Fully coordinate the delivery of transportation services and facili-ties in the corridor including daily operations and system planning
for enhancements
Interagency operational coordination to maximize the efficiency and effec-tiveness of all modes operating in the corridor with a focus on the CSMP transportation network defined in this CSMP Use of an existing group or
committee to provide initial oversight for this strategy
Diverse interests and competing priorities and limited resources
Construct planned and pro-grammed corridor capital improve-
ment projects
implementation of the capital improvements in the corridor included within the approved Metropolitan Transportation Plan and Regional Transportation
Plan for all transportation modes within the scope schedule and cost specified
Funding availability funding competition within the region
Comprehensive daily monitoring of the status of all modes providing service on the CSMP transporta-
tion network
Full deployment of multimodal transportation service status detection systems for all CSMP network components
Funding availability funding competition within region
Provide traveler information to the public
Provide the public with real-time easily accessible information regarding the status of all CSMP transportation system components so as to allow travel-
ers to make informed decisions about trip mode time and routing options
Funding availability funding competition within region
Continually monitor and analyze the CSMP transportation network to improve system performance
Monitor transportation performance measures and make system modifica-tions as appropriate on a frequent and timely basis Staff resources and data availability
Decrease the duration of non-recurrent traffic congestion
Expand and enhance the Freeway Service Patrol to respond to automobile accidents and vehicle break-downs
Funding availability funding competition within the region
Timely implementation of STaRNET
Expedite the implementation of the STaRNET operators of transportation facilities and emergency responders in the Sacramento region through real-time sharing of data and live video refinement of joint procedures
pertaining to the operation of roadways and public transit and public safety activities as well as enhance the regionrsquos 511 web site and interactive
telephone service to provide more traveler information
Developmental time acceptance by agencies and integration into daily use and identifica-
tion of maintenance and operations funding
Enhance transit and rail service increase transit service frequency provide express transit services imple-
ment bus rapid transit routes reduce headways for light rail and buses and construct planned light rail line extensions
Funding availability funding competition within the region
Complete Bus Carpool lane network
Complete the regional buscarpool lane network including freeway-to-freeway HOV lane connectors
Funding availability funding competition within the region Public agency and public
acceptance of network
[ 38 ] HigHway 50 corridor system management plan
c h a p t e r s i x p l a n n e d c o r r i d o r s y s t e m m a n a g e m e n t s t r a t e g i e s
tabLe 10 uS 50 CSMP StrategieS (ConTInued)
Strategy Description implementation Challenges
Enhance Transportation Demand Management strategies
Encourage employers to provide telecommuting and flexible working hour options to employees
acceptance by employers and resources to participate
Optimize the timing and synchronishyzation of traffic signals
Coordinate the optimization and timing of traffic signals on freeway ramps and along parallel and connecting roadways within and between jurisdicshytions to improve traffic flow and reduce congestion Provide signal priority
systems for transit vehicles
Funding availability and coordination among cities counties and Caltrans
improve access management of freeways and parallel connecting roadways
Develop and implement access management strategies to maintain the operational efficiency of freeways and parallelconnecting roadways
agreement between responsible jurisdicshytions as to where increased access control is needed increased access control on some parallelconnecting roadways may increase
traffic volumes on non-corridor roads
Develop innovative use of CMSs (eg travel times)
Potential uses of CMSs to improve system efficiency include the use of CMSs along portions of all corridors near transit station to indicate travel
times based on real-time existing traffic conditions on the freeway as well as on parallel roadways and express bus and light rail services CMS can also be used to identify the number of parking spaces that are still available at
the light-rail stations
Funding availability funding competition within the region
Implement amp expand Transit AVLTransit status information
enhancements for system users
Expand the use of AVL systems utilizing GPS technology to track in real-time the location of transit vehicles monitor transit schedules dispatch transit vehicles and provide real-time passenger information such as ldquonext busrdquo or
ldquonext trainrdquo arrival times
Funding availability funding competition within region
Expand Park-and-Ride lots at key locations
Add additional capacity to existing park-and-ride lots near transit stations and other locations that are approaching capacity
Funding availability funding competition within the region and available land
improve bike-pedestrian access in the CSMP
transportation network
Plan and program for construction of additional bicycle paths lanes and related improvements for access and connectivity to transit park and ride
lots and destination points
Funding availability funding competition within the region
Provide ldquoBike-SharingrdquordquoCar-Sharingrdquo tofrom transit (ldquoCarlinkrdquo) and from
neighborhoods
Expand the Regional Rideshare and Spare-the-Air programs to include bicycle and car sharing opportunities
Funding availability and coordination between SaCOg TMa air Districts employers developshyers property managers and local government
officials
Provide parking management stratshyegies in interested jurisdictions where applicable to discourage
use of single-occupant vehicles
in higher-density areas provide preferential parking for carpools and vanshypools require residential parking permits remove on-street parking and or provide graduated parking fees for metered on-street parking based on
vehicle type and time of day for SOV spaces to encourage transit use
Acceptance by businesses local officials and the general public
Expand bicycle commute amp transit fare strategiessubsidies
increase participation by large employers in programs that subsidize transit fares for employees during peak-hour commute times and provide bicycling
to work incentives
Voluntary participation by large employers to pay subsidy to transit providers
HigHway 50 corridor system management plan [ 39 ]
c h a p t e r s i x p l a n n e d c o r r i d o r s y s t e m m a n a g e m e n t s t r a t e g i e s
tabLe 11 KeY CaPitaL ProjeCtS
CountyLead agency
route roadway from to Project
Description Programmed
funds
additional funding Needed
total Cost estimate (x $1000)
Comp Year (FFY)
uS 50
Sacramento Caltrans District 3
US 50 Downtown watt avenue HOV Lanes $0 $75000 $75000 2020
Sacramento Caltrans District 3
US 50 watt avenue Sunrise Blvd HOV Lanes $165000 $0 $165000 2013
Sacramento Caltrans District 3
US 50 Bradshaw Road
Mather Field Road
Eastbound and Westbound Auxiliary Lanes
$0 $3700 $3700 2016
Sacramento Caltrans District 3
US 50 State Route 99
(Oak Park Interchange) interchange improvements including buscarpool lane
connectors $0 $150000 $150000 2014
Sacramento Caltrans District 3
US 50 interstate 5
(Riverfront Interchange) Riverfront Interchange
improvements including bus carpool lane connectors
$30000 $170000 $200000 2016
ED Caltrans District 3 US 50 Camino
Operational Safety improvements Construct an
undercrossing median barrier modify local road connections andor associated operational improvements on and adjacent
to US 50
$15000 $0 $15000 2012
ED ED County DOT US 50
west of Latrobe Road
west of Bass Lake
grade HOV Lanes (Ph1) $47141 $0 $47141 2010
ED Caltrans District 3 US 50
west of Bass Lake Road
Ponderosa Road
HOV Lanes (Ph2) $55000 $0 $55000 2011
ED Caltrans District 3 US 50 Ponderosa
Road greenstone
Road HOV Lanes (Ph3) $22357 $0 $22357 2013
ED ED County DOT US 50 Future Silva
Valley iC
Future Empire Ranch IC
Mainline Widening construct new WB lane within the
median from proposed Silva Valley IC to proposed Empire
Ranch IC
$2950 $0 $2950 2013
[ 40 ] HigHway 50 corridor system management plan
c h a p t e r s i x p l a n n e d c o r r i d o r s y s t e m m a n a g e m e n t s t r a t e g i e s
tabLe 11 KeY CaPitaL ProjeCtS (ConTInued)
CountyLead agency
route roadway from to Project
Description Programmed
funds
additional funding Needed
total Cost estimate (x $1000)
Comp Year (FFY)
PARALLEL AnD COnnECTInG ROADWAYS
ED ED County DOT
Silva Valley Parkway
Entrada Drive
Future US 50
Silva Valley Parkway iC
Widen Silva Valley Road from 2 lanes to 4 lanes includes
Class ii bike lanes and left turn storage pockets
$2921 $0 $2921 2010
ED ED County DOT
Silva Valley Parkway US 50
US50 Silva Valley Parkway (Phase 2) Includes constructshying overcrossing and ramps
signalization at EB and WB on off ramps
$57817 $0 $57817 2016
ED ED County DOT
Headington Road
Missouri Flat Road
El Dorado Road
Extend 2 lanes with median $9878 $0 $9878 2012
ED ED County DOT
Durock Road
Robin Lane South
Shingle Road
Extend 2 lanes with median $1239 $9214 $10453 2015
ED ED County DOT
Durock Road
Business Center Drive intersection signalization
includes adding turn pockets on Durock Road
$4333 $0 $4333 2009
ED City of Placerville
Point View Drive Broadway Smith Flat
Road Extend 2 lanes $1300 $0 $1300 2020
ED City of Placerville
western Placerville
US 50 interchange
Forni Road Ray Lawyer
Drive
Placerville Drive
Interchange Reconstruction convert Ray Lawyer Dr
Overcrossing to full IC Auxiliary Lanes
$5059 $34741 $39800 2020
Sacramento City of Rancho
Cordova
Mather Boulevard
Rockingham Road
Zinfandel Drive widen to 4 lanes $0 $8617 $8617 2020
Sacramento Rancho Cordova
Parkway ii
Grant Line Road
White Rock Road
New 6-lane expressway includshying intersection improvements at Kiefer Blvd amp White Rock
Road
$0 $44518 $44518 2020
Sacramento City of Folsom
Scott Road US 50 White Rock Rd
widen from 2 to 6 lanes $16000 $0 $16000 2020
Sacramento Sacramento County DOT
White Rock Road
Grant Line Rd
Prairie City Rd
Widen from 2 to 4 lanes realign near Nike and Nimbus Roads and connect with existshying alignment west of Prairie City Rd Realign Grant Line Rd to intersect with realigned
White Rock Rd
$26600 $0 $26600 2020
Sacramento Sacramento County DOT
Hazel avenue
US 50 Hazel Madison
Widen American River Bridge and approaches from 4 to 6 lanes Widen Hazel Avenue from AR Bridge to Madison from 4 to 6 lanes with Bike
LanesSignals
$83530 $0 $83530 2020
HigHway 50 corridor system management plan [ 41 ]
c h a p t e r s i x p l a n n e d c o r r i d o r s y s t e m m a n a g e m e n t s t r a t e g i e s
tabLe 11 KeY CaPitaL ProjeCtS (ConTInued)
CountyLead agency
route roadway from to Project
Description Programmed
funds
additional funding Needed
total Cost Estimate (x $1000)
Comp Year (FFY)
PARALLEL AnD COnnECTInG ROADWAYS
ED ED County DOT
green Valley Road
Salmon Falls Road
east
Deer Valley Road
widen from 2 to 4 lanes $0 $14576 $14576 2025
ED ED County DOT
green Valley Road
Deer Valley Road east Lotus Road widen $958 $4513 $5471 2015
ED ED County DOT
green Valley Road
Francisco Drive
Salmon Falls Road
widen from 2 to 4 lanes divided $412 $3491 $3903 2015
ED ED County DOT
Latrobe Road
investment Boulevard
golden Foothill Parkway
widen from 2 lanes undivided to 4 lanes
divided $1076 $8792 $9868 2015
ED ED County DOT
Latrobe Road
Carson Creek
White Rock Road
widen from 4 to 6 lanes $0 $23755 $23755 2025
ED ED County DOT
white Rock Road
EDSac County Line
Manchester Drive
widen 2 to 4 lanes divided includes signal interconnect and coorshy
dination
$0 $23755 $23755 2025
Sacramento City of Rancho
Cordova
Easton Valley
Parkway
Prairie City Road
Empire Ranch Road extenshysion south of
US 50
Construct new 4 lane road $0 $45000 $45000 2020
Sacramento Sacramento County DOT
Hazel avenue
Easton Valley
Parkway
Grant Line RoadWhite Rock Road
New road extension 4 lane limited access
through aerojet property $0 $18000 $18000 2018
Sacramento Sacramento County DOT
white Rock Road
Prairie City Road
ED County Line
widen to 4 lanes $8330 $64773 $73103 2018
Sacramento Sacramento County DOT
green Valley Road
East Natoma Sacramento ED County
line widen to 4 lanes $0 $3000 $3000 2018
Sacramento City of Rancho
Cordova
Zinfandel Drive
international Drive
Folsom Boulevard
widen to 4 lanes $0 $12000 $12000 2020
[ 42 ] HigHway 50 corridor system management plan
c h a p t e r s i x p l a n n e d c o r r i d o r s y s t e m m a n a g e m e n t s t r a t e g i e s
tabLe 11 KeY CaPitaL ProjeCtS (ConTInued)
CountyLead agency
route roadway from to Project
Description
Pro-grammed
funds
addi-tional
funding Needed
total Cost estimate (x $1000)
Comp Year (FFY)
traNSit
yolo amp Sacramento City of west Sacramento
amp City of Sacramento
Sacramento River
Crossing
15th Street in the City
of west Sacramento
Broadway in the City of
Sacramento
New all-modal river crossing (Auto Transit Bike amp Pedestrian)
from Sacramento across the Sacramento River to West
Sacramento The crossing was modeled between Broadway in Sacramento amp 15th Street in
West Sacramento but final alignshyment options will be studied in subsequent planning efforts
$800 $99200 $100000 2019
Sacramento Cal State University
Sacramento
CSUS Campus mdash mdash
Sac State Tram adjoining City streets and SRTD 65th Street light railbus transfer station Bus Rapid Transit System
$23574 $0 $23574 2013
Sacramento City of Rancho
Cordova
Rancho Cordova Various Various
New Service Rancho Cordova Pilot Transit Shuttle System new transit service for connection to
RTs Gold Line
$2380 $1500 $38880 2014
yolo amp Sacramento City of west Sacramento
TBD west
Sacramento Sacramento Streetcar Service between west
Sacramento and Downtown Sacramento
$17400 $54700 $72100 2014
Sacramento City of Rancho
Cordova RT Gold Line
RT Gold Line Tracks
Mather Field Road
Light Rail Grade Separations $0 $52888 $52888 2025
Sacramento City of Rancho
Cordova RT Gold Line
RT Gold Line Tracks Zinfandel Drive Light Rail Grade Separations $0 $52888 $52888 2025
Sacramento City of Rancho
Cordova RT Gold Line
RT Gold Line Tracks
Bradshaw Road
Light Rail Grade Separations $0 $35260 $35260 2025
Sacramento City of Rancho
Cordova RT Gold Line
RT Gold Line Tracks Routier Road Light Rail Grade Separations $0 $35260 $35260 2025
Sacramento City of
Sacramento Sacramento Valley Station
Sacramento intermodal Transportation Facility (Phase 1) - Develop intermodal transportashytion terminal for heavy rail light
rail and bus service
$77799 $0 $77799 2010
Sacramento City of
Sacramento Sacramento Valley Station
Sacramento intermodal Transportation Facility (Phase 2) - Develop intermodal transportashytion terminal for heavy rail light
rail and bus service
$24101 $1000 $25101 2014
HigHway 50 corridor system management plan [ 43 ]
c h a p t e r s i x p l a n n e d c o r r i d o r s y s t e m m a n a g e m e n t s t r a t e g i e s
TABLE 11 KEY CAPITAL PROJECTS (CONTINUED)
CountyLead Agency
Route Roadway From To Project
Description Programmed
Funds
Additional Funding Needed
Total Cost Es-timate (x $1000)
Comp Year (FFY)
BICYCLE ROUTES
Sacramento City of Rancho
Cordova
US 50Mather Field Road IC US 50 Mather
Field Road
US 50Mather Field Road PedestrianBike Crossing along
the Mather Airport RR Spur alignment
$0 $820 $1055 2015
ED ED County DOT
Sacramento Placerville
Transportation Corridor
Forni Rd
Missouri Flat Rd Class I Bike Trail $1423 $111 $1534 2009
ED City of Placerville
El Dorado Trail Western
Extension
Canal Street Main Street
Ray Lawyer DriveForni
Road Class 1 Bike Trail $1850 $0 $1850 2010
ED ED County DOT
US 50ED Hills Blvd IC US 50
El Dorado Hills Blvd
Latrobe Road
US 50El Dorado Hills Blvd Pedestrian Overcrossing $5508 $66 $5574 2014
TABLE 12 50 MOBILITY PARTNERSHIP KEY CAPITAL PROJECTS
RouteRoadway From To Project Description
NEAR TERM PRIORITY IMPROVEMENT PROJECTS
US 50 Sunrise Scott Road Auxiliary Lane
US 50 Hazel Avenue Interchange Improvements
Hazel Avenue Folsom Boulevard Easton Valley Parkway New 4 Lane Road
Easton Valley Parkway Hazel Avenue Rancho Cordova Parkway New 6 Lane Road
Rancho Cordova Parkway Easton Valley Parkway White Rock Road New 4 Lane Road
White Rock Road Sunrise Boulevard Silva Valley Parkway Widen to 4 Lanes
RT Gold Line Hazel Iron Point Station Passing Tracks
US 50 Rancho Cordova Parkway New Interchange
Zinfandel Drive South of International Douglas Road New 4 Lane Road
International Drive Kilgore Road Rancho Cordova Parkway New 6 Lane Road
Douglas Road Zinfandel Extension Sunrise Boulevard Widen to 4 Lanes
Sunrise LRT Citrus Road Sunrise Mall Bus Rapid TransitExpress Bus
[ 44 ] HIGHWAY 50 corridor system management plan
c h a p t e r s i x p l a n n e d c o r r i d o r s y s t e m m a n a g e m e n t s t r a t e g i e s
TABLE 12 50 mOBILITY PARTnERSHIP kEY CAPITAL PROjECTS (COnTInUED)
routeroadway from to Project Description
US 50 nEAR TERm PRIORITY ImPROVEmEnT PROjECTS
US 50 Empire Ranch Road New interchange
US 50 Silva Valley New interchange
US 50 Scott Road Empire Ranch Road Aux Lanes
US 50 Empire Ranch Road El Dorado Hills Boulevard Aux lanes and climbing lanes
US 50 El Dorado Hills Boulevard Silva Valley Parkway Aux lanes and climbing lanes
US 50 Silva Valley Parkway Bass Lake Road Aux lanes
Sunrise Boulevard White Rock Road Douglas Boulevard widen to 6 lanes
Sunrise Boulevard Douglas Boulevard Jackson Road widen to 4 lanes
White Rock Road Sunrise Boulevard Future Rancho Cordova Parkway and El Dorado County Line to Latrobe Road
widen to 4 lanes
Douglas Boulevard Sunrise Boulevard Grant Line Road widen to 4 lanes
Rancho Cordova Parkway Douglas Boulevard Rio del Oro Parkway New 2 lane road
Rancho Cordova Parkway Rio del Oro Parkway White Rock Road New 6 lane road
Jaeger Road Douglas Road Kiefer Boulevard New 4 lane road
Chrysanthy Sunrise Boulevard Americanos Boulevard New 4 lane road
Kiefer Boulevard Sunrise Boulevard Jaeger Road New 4 lane road
Grant Line Road Douglas Road Chrysanthy Road widen to 4 lanes
Hazel avenue Gold Country Boulevard Madison avenue widen to 6 lanes
Latrobe Road South of White Rock Road widen to 4 lanes
TABLE 13 VISIOnARY PROjECTS
County routeroadway from to Project Description
Sac yolo US 50 Enterprise Downtown Sacramento HOV Lanes
ED TBD Folsom Placerville Transit ndash Type TBD
ED New Road Latrobe Road White Rock Road (poten shy
tially US 50) New 2-lane road
HigHway 50 corridor system management plan [ 45 ]
c h a p t e r s i x p l a n n e d c o r r i d o r s y s t e m m a n a g e m e n t s t r a t e g i e s
[ 46 ] HigHway 50 corridor system management plan
Page Inte
ntionally
Left
Blank
congestion and bottleneck analysis
chapter seven
The 2000 Highway Capacity Manual defines a bottleneck
as ldquoa road element on which demand exceeds capacityrdquo
The bottleneck analysis evaluates specific causes of existshying recurrent traffic congestion in the corridor Freeway bottleneck locations that create mobility constraints are identified and documented and their relative contribution
to corridor-wide congestion is reported The bottleneck locations were determined based on a combination of the use of 2006 PeMS data HiCOMP report probe vehicle tach runs and field observations
Traffic congestion can be categorized as either recurrent
or non-recurrent
recurrent congestion occurs repeatedly at the same place and time of day in a predictable pattern Recurrent congesshytion is often associated with facility capacity limitations changes in capacity conflicting vehicle movements such
as lane merges inadequate number of transit vehicles to handle passenger loads or other persistent physical condishytions of the transportation facility
Non-recurrent congestion is usually attributed to collishysions equipment malfunction community events weather construction projects and other occasional occurrences When transportation systems are close to their maximum
carrying capacity non-recurrent congestion is more likely to occur as there is little excess capacity in the system
The location and extent of the bottlenecks on US 50 found
in the aM and PM peak periods are summarized in Tables 14 and 15 These depictions should be considered a snapshyshot view and not a comprehensive analysis of all bottleshynecks in the corridor Further work is being conducted to
refine the identification and causality of bottlenecks within
the corridor Table 14 shows a summary of the US 50 eastbound bottlenecks while the tables that follow discuss each bottleneck including location and possible causality Table 15 shows a summary of the US 50 westbound bottleshynecks while the tables that follow discuss each bottleneck including location and possible causality Minor or hidden bottlenecks are those Freeway bottleneck
that are not as defined locations that create (or severe) as the major mobility constraints bottlenecks Please note are identified and that the graphics accomshy documented and their panying the bottlenecks
relative contribution to are not to scale
corridor-wide congestion Major bottlenecks in the is reported eastbound direction during the aM peak period are at Howe avenue and during the PM peak period are at 48th Street Howe Avenue Mayhew Road Routier Road Sunrise Boulevard and El Dorado Hills Boulevard Major bottlenecks in the westbound direction during the aM peak period are at El Dorado Hills Boulevard Hazel Avenue Zinfandel Drive
HigHway 50 corridor system management plan [ 47 ]
c h a p t e r s e v e n c o n g e s t i o n a n d b o t t l e n e c k a n a l y s i s
Bradshaw Road and Howe Avenue and major bottleneck
locations during the PM peak period are at Zinfandel Drive Routier Road Bradshaw Road Howe Avenue and Intershystate 5
Causalities for these bottlenecks range from high-traffic
demand (congestion) heavy weavingmerging areas or physical constraints such as lane drops lack of ramp meters incomplete HOV network incomplete Auxiliary Lane
network poorly coordinated traffic signals and an off-ramp
queue (Sunrise Boulevard) US 50 Westbound Onramp
TABLE 14 US 50 EASTBOUnD BOTTLEnECk SUmmARY Source PeMS Caltrans tach runs and
Cambridge Systematics field observations
bottleneck Location PeMS Speed Contours Caltrans Probe Vehicle Runs
Cause aM PM aM PM
A Jefferson Blvd PM 25 Minor Minor Traffic weaving truck volumes and grade
B 48th St PM 7 Minor Major Minor Minor Merge from SR 51 and SR 99
C Howe ave PM 9 Major Major Major weave between Howe and watt
D Mayhew Rd PM 12 Major Minor Major Weaving before Bradshaw Exit
E Routier Rd PM 14 Minor Major Weaving before Mather Field Rd Exit
F Sunrise Blvd PM 185 Minor Major Lane drop HOV add off-ramp queue
G Folsom Blvd PM 22 Minor Minor Lane drop 4 to 3
H El Dorado Hills Blvd PM 275 Major
Poorly coordinated traffic signal on arterial causes spillback onto freeway
a jefferson blvd bottleneck The bottleneck approximately located at Jefferson Blvd is due to weaving traffic as those entershying the freeway from Jefferson Blvd must cross those attempting to exit the freeway to I 5 There is a large number of trucks in the stream which struggle with the grade at this location exacerbatshying the bottleneck
[ 48 ] HigHway 50 corridor system management plan
c h a p t e r s e v e n c o n g e s t i o n a n d b o t t l e n e c k a n a l y s i s
b 48th St bottleneck The bottleneck approximately located at 48th St is due to the additional traffic merging from SR 51 and SR 99 combined with the eventual lane drop at 59th St This queue extends upstream past the off-ramp to SR 5199 These off-ramps are bottlenecks in themselves which spill back and choke the US 50 mainline
C Howe Ave Bottleneck The bottleneck at Howe ave is due to the entering traffic from Howe Ave Two Howe Ave on-ramps feed into US 50 eastbound southbound Howe ave loop on-ramp and northbound Howe ave direct ramp approximately 300 feet apart The watt avenue off-ramp is just down stream with heavy exiting volumes therefore the segment between Howe and watt is characterized by heavy weaving
D mayhew Rd Bottleneck The bottleneck approximately located at Mayhew Rd most likely begins with the additional traffic entering from Watt Ave and ends with the exiting traffic at Bradshaw Rd It is possible that there is a high proportion of weaving traffic with in this section (Watt Ave traffic moving to the left lane and those exiting at Bradshaw Rd moving to the right lane)
HigHway 50 corridor system management plan [ 49 ]
c h a p t e r s e v e n c o n g e s t i o n a n d b o t t l e n e c k a n a l y s i s
[ 50 ] HigHway 50 corridor system management plan
e routier rd bottleneck It is likely that the bottleneck at Routier Rd is due to the same merging conditions associated with Mayhew Rd The area is comprised of both residential and light industrialoffice land uses therefore during the PM peak period there are large volumes of vehicles entering at Bradshaw Rd moving to the left lanes and large volumes of vehicles moving to the right lane to exit at Mather Field Rd
f Sunrise blvd bottleneck At Sunrise Blvd the right-most lane exits while an HOV lane is added as the median lane The bottleneck is formed from vehicles shifting left to avoid exiting at Sunrise Blvd and to enter the HOV lane There is a large volume of vehicles queued at the Sunrise off-ramp which spills back and negatively affects the US 50 mainline
g folsom blvd bottleneck The right-most lane exits to Folsom Blvd leaving one HOV lane and two regular lanes along the US 50 The bottleneck is caused by this lane drop as well as the quick merge at the Folsom on-ramp
c h a p t e r s e v e n c o n g e s t i o n a n d b o t t l e n e c k a n a l y s i s
H The eastbound US 50 at El Dorado Hills Blvd Bottleneck The eastbound El Dorado Hills Blvd bottleneck is caused by a traffic signal on the arterial that often causes spillbacks on the EB loop offramp onto the freeway mainlines
TABLE 15 US 50 WESTBOUnD BOTTLEnECk SUmmARY Source PeMS Caltrans tach runs and Cambridge Systematics field observations
bottleneck Location PeMS Speed Contours Caltrans Probe Vehicle Runs
Cause aM PM aM PM
A El Dorado Hills Blvd PM 275 Major Poorly coordinated traffic
signal on El Dorado Hills Blvd
B Hazel Ave PM 21 Major Entering traffic
C Zinfandel Dr PM 16 Minor Major Major Major Entering traffic
D Routier Rd PM 14 Minor Major Minor Weaving traffic
E Bradshaw PM 13 Major Major Major Merging traffic and curve
F Howe Ave PM 9 Minor Major Major Major Weaving traffic and grade
G SR 51SR 99 PM 6 Minor Lane drop weaving traffic
H i-5 PM 3 Major Weaving traffic
HigHway 50 corridor system management plan [ 51 ]
c h a p t e r s e v e n c o n g e s t i o n a n d b o t t l e n e c k a n a l y s i s
[ 52 ] HigHway 50 corridor system management plan
A El Dorado Hills Blvd Bottleneck The minor bottleneck at El Dorado Hills Boulevard is caused by the traffic signal on El Dorado Hills Blvd that causes spillback on the westbound offramp onto the freeway mainlines
B Hazel Avenue Bottleneck In 2006 the Hazel Ave Bottleneck is caused by the traffic entering at both Hazel Ave and Folsom Blvd (the two on-ramps are separated by about one mile) The bottleneck that would appear at Folsom Blvd combines with the bottleneck at Hazel ave to form a large bottleneck that does not clear until after Hazel ave Sometimes causshying spillbacks as far as Prairies City Road this bottleneck was mitigated in 2007 as part of the GO CALIFORNIA program
C Zinfandel Dr Bottleneck There is heavy traffic coming from Sunrise Blvd but the lane addition immediately after the westbound on-ramp prevents a bottleneck from forming but as traffic flows westward the heavy traffic entering from Zinfandel Dr causes a bottleshyneck here
D Routier Rd Bottleneck The bottleneck at Routier Rd is caused by weaving traffic between Mather Field Rd and Bradshaw Rd This highway segment represents a transition area where vehicles that have been traveling in the left lanes begin to shift to the right lanes to exit while the entering traffic tries to shift to the left lanes
W eav in gLan e Dr o p
c h a p t e r s e v e n c o n g e s t i o n a n d b o t t l e n e c k a n a l y s i s
e bradshaw rd bottleneck The Bradshaw Rd bottleneck is caused by the entering traffic from Bradshaw Road the high truck volumes and the curve west of Bradshaw Two Bradshaw Rd on-ramps feed into US 50 westshybound southbound Bradshaw Rd direct on-ramp and northbound Bradshaw Rd loop on-ramp approximately 400 feet apart
F Howe Ave Bottleneck The Howe ave bottleneck is caused by a grade change and the weaving traffic entering from Howe ave and Hornet Dr competing for the right-most lane with those wanting to exit at 65th Street
G amp H SR 51SR 99 amp I-5 Bottleneck The bottleneck at I 5 is caused by the conflict between entering SR 99 and SR 51 traffic and exiting I-5 traffic as well as the queues formed on the ramps to i-5 which spill back onto US 50 The number of lanes in this section reaches a maximum of 6 and then drops to 4 as two lanes exit at the I-5 freeway This bottleneck is exacershybated during the peak periods when it stretches upstream to the lane drop before SR 99
W ea v in g
Lan e Dr o p
HigHway 50 corridor system management plan [ 53 ]
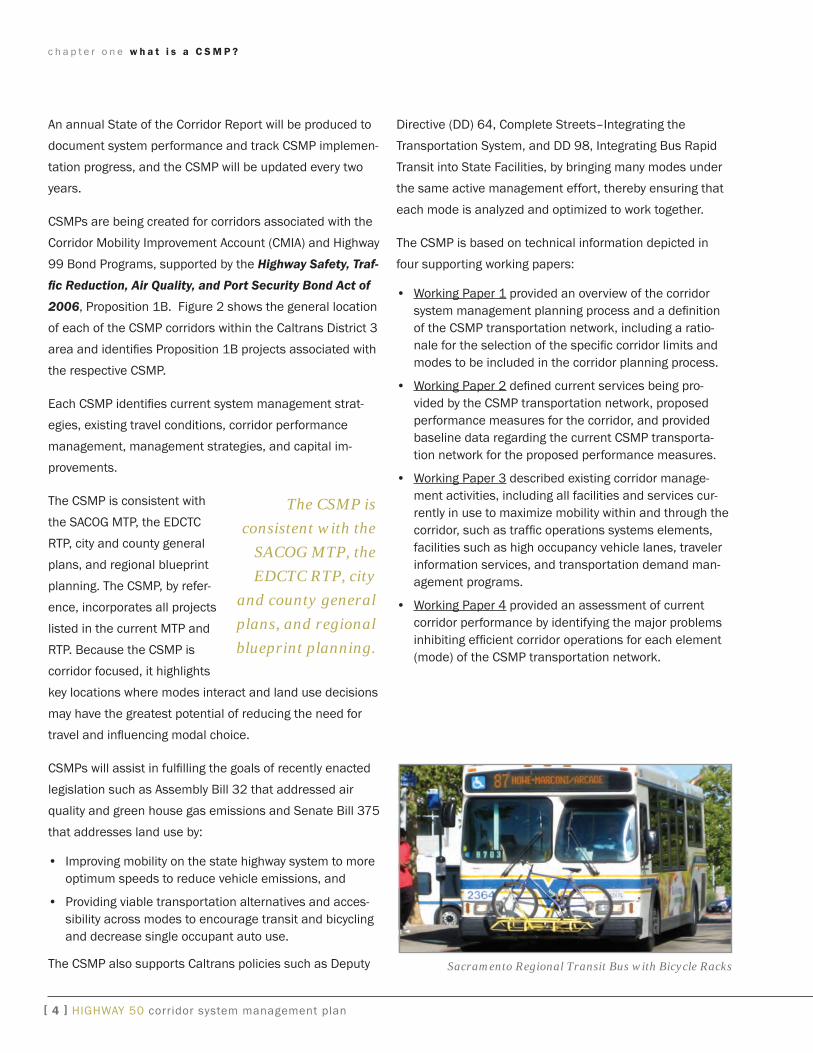
c h a p t e r o n e w h a t i s a C S M P
Table 1 US 50 CSMP TranSPorTaTion neTwork
location US 50 ParallelConnecting roadways Mass Transit bike routes
Heavy rail and light rail bus
route From To County City From To roadway From To operator
Services From To operator
Services From To
yolo City of west Sacramento interstate 80 yoloSacramento
County Line west Capitol Enterprise Boulevard Capitol Mall yCTD 39
Davis Express
west Sacramento
Davis Sacramento west Capitol
avenue yolo
Causeway Tower Bridge
Sacramento City of Sacramento
yoloSacramento County Line
State Routes 99 and 51 wX Streets 5th Street 26th Street RT Downtown
Sacramento Folsom
RT 109 Express
Downtown Sacramento Hazel ave Jedediah Smith Memorial Trail
State Routes 99 and 51 watt avenue mdash mdash mdash
amtrak Capital Corridor
(intercity Rail)
401 i Street Sacramento
auburn CaSan Jose Ca
amtrak Thruway Bus
401 i Street Sacramento
Main Street Placerville
Sacramento UnincorporatedCity of Rancho Cordova
watt avenue Zinfandel Drive
Folsom Boulevard watt avenue Sunrise Boulevard RT Downtown Sacramento Folsom RT 72 Mather Mills
LRT Station watt-Manlove LRT Station Jedediah Smith Memorial Trail
watt avenue Folsom Boulevard US 50
RT Downtown Sacramento Folsom RT 21 Mather Mills
LRT Station Louis Ln
Orlando ave Jedediah Smith Memorial Trail
Bradshaw Road Folsom Boulevard Old Placerville Road
Old Placerville Road Bradshaw Road Rockingham Drive
Rockingham Drive Old Placerville Road Mather Field Road
Mather Field Road Rockingham Drive Zinfandel Drive
Zinfandel Drive international Drive Folsom Boulevard
white Rock Road Zinfandel Drive Sunrise Boulevard
Sunrise Boulevard US 50 Folsom Boulevard
Zinfandel Drive Sunrise Boulevard
white Rock Road Sunrise Prairie City
RT Downtown Sacramento Folsom RT 109
Express Downtown
Sacramento Hazel ave Jedediah Smith Memorial Trail
Folsom Boulevard Sunrise iron Point Road
Notes F = Freeway E = Expressway RT = Sacramento Regional Transit District EDT = El Dorado Transit and FSL = Folsom Stage Lines LR = Light Rail EB = Express Bus LT = Limited LRF = Light Rail Feeder YCTD = Yolo County Transportation District FTS = FairfieldSuisun Transit System UCD = UC Davis Medical Center Shuttle
HigHway 50 corridor system management plans [ 6 ]
c h a p t e r o n e w h a t i s a C S M P
Table 1 US 50 CSMP TranSPorTaTion neTwork (ConTinUed)
location US 50 ParallelConnecting roadways Mass Transit bike routes
Heavy rail and light rail bus
route From To County City From To roadway From To operator
Services From To operator
Services From To
Sacramento
UnincorporatedCity of Folsom
Sunrise Boulevard
Folsom Boulevard
iron Point Road Folsom Boulevard East BidwellScott Road
RT Downtown Sacramento Folsom
iron Point Road Folsom Boulevard Empire Ranch
Scott Road iron Point Road white Rock Road Blue Ravine Road
Folsom Boulevard
green Valley Road
Sacramento Folsom Boulevard
Sacramento El Dorado
County Line
Folsom Boulevard iron Point Road Blue Ravine Road
green Valley Road
SacramentoEl Dorado County
Line
Cameron Park Drive
Blue Ravine Road Folsom Boulevard green Valley Road
Prairie City Road US 50 white Rock Road ED County Transit
authority-iron Point Connector
iron Point Light Rail Station
Missouri Flat Transfer
Center white Rock Road EDSac County Line
Sacramento El Dorado County Line
El Dorado Na Sacramento
El Dorado County Line
Cameron Park Drive
green Valley Road Blue Ravine Road Cameron Park Drive
ED County Transit
authority-Sacramento Commuter
El Dorado County
Sac County
green Valley Road
Cameron Park Drive
Placerville Drive
white Rock Road EDSac County Line Latrobe Road
white Rock Road Latrobe Road Silva Valley Parkway
Silva Valley Parkway white Rock Road Serrano Parkway
El Dorado Na Cameron Park Drive
Missouri Flat Road
green Valley Road Cameron Park Drive Missouri Flat Road
ED County Transit
authority
Cambridge Road
Missouri Flat Road
Ray Lawyer Drive
Placerville Drive Forni Road
Durock Road Cameron Park Drive South Shingle Road
Cameron Park Drive Durock Road US 50
Forni Road Ray Lawyer Drive Forni Road
South Shingle Road Durock Road US 50
El Dorado Na Missouri Flat Road
End of Freeway in Placerville
green Valley Road Missouri Flat Road Placerville Drive
ED County Transit
authority
Missouri Flat Road
Placerville Drive
Main Street Forni Road Clay Street Forni Road Placerville Drive Main Street
Placerville Drive Forni Road US 50
El Dorado Placerville End of Freeway in Placerville
Bedford avenue Start of
Freeway Main Street Placerville Drive Bedford avenue
ED County Transit
authority
Placerville Drive SR 49 ED Bike Trail Clay Street Los Trampas
Road
El Dorado Na Bedford
avenue Start of Freeway
Cedar grove Exit
Main Street Bedford avenue Broadway amtrak
Thruway Bus
Mosquito Road
Placerville
401 i St Sac CaCarson
City Ca Broadway Main Street Point View Drive
HigHway 50 corridor system management plans [ 7 ]
WHITE ROCK RD
c h a p t e r o n e w h a t i s a C S M P
Figure 2 CSMP Corridors in District 3
Corridor System Management Plan
Corridors in District 3 Interstate 80 I-80 between SR 113 and Sierra College Boulevard SR 51 between Highway 50SR 99 and I-8020
Highway 5053 Between I-80 and Cedar Grove Exit
Interstate 5 amp State Route 99 I-5 between Hood-Franklin Rd and State Route 113 SR 99 between San Joaquin County Line and Highway 50 SR 99 between I-5 and SR 20
State Route 99 North29 Between Southgate and Esplanade (in Chico area see inset)
State Route 49 Between I-80 and SR 20
State Route 65 Between I-80 and SR 70
CMIA and State Route 99 Bond Projects
20
Colusa
20
Yuba City Marysville
Grass Valley
La Barr Meadows Widening Project
49 80
Widen to 4 Lanes SR 70 to Feather River Bridge
99
70 Wheatland
65
113 Lincoln Bypass
5
Construct Interchange Operations Improvements Placerville at Elverta Rd HOV Lanes El Dorado
Hills Blvd to Bass Lake Rd
80 Folsom Woodland Rancho 50
Auburn Lincoln
Construct Interchange at Riego Rd Rocklin 49
99 Roseville Roseville Capacity and
Cordova 113 49 505 Sacramento 51
99 Chico Add Auxiliary Lanes
SR 32 to 1st Ave
32 Davis 80
West Sacramento
5
HOV Lanes Watt Ave to Sunrise Blvd
Operational Improvements Mack Rd to Florin Rd
White Rock Rd Expansion Grant Line Rd to Prairie City rd
29 221
113
99
0 105 2 3 4 5 Miles
Galt 0 5 10 15 20
Miles
HigHway 50 corridor system management plans [ 8 ]
need purpose goal and objectives
chapter two
There is a need for a planning approach that brings facility operations and transportation service provision together with capital projects into one coordinated system manageshyment strategy that focuses on high demand travel corridors such as US 50
a CSMP is needed for the US 50 corridor to address severe traffic congestion that often exceeds the capacity of existshying facilities transit ridership demands that exceed the
capacity of the transit system and bicycle facilities that do not provide a fully linked network of bike routes
The purpose of the CSMP is to create a partnership planshyning process that focuses on system management strateshygies and coordinated capital investments so that all the pieces of the corridor function as an efficient transportashytion system and performance evaluation measures are implemented to track the effectiveness of strategies and projects
the CSMP directly supports the implementation of the
three CMia projects on the corridor
bull High Occupancy Vehicle (HOV) Lanes on US 50 from Watt avenue to Sunrise boulevard
bull White Rock Road Expansion from Grant Line Road to Prairie City road
bull HOV Lanes on US 50 from El Dorado Hills Boulevard to bass Lake road
The goal of the CSMP is to improve mobility along the US 50 corridor by focusing on the integrated management of a
subset of the entire transporta- The CSMP directly tion network within the corshy supports the ridor including select freeway implementation and parallel roadways transit
of the three CMIA and bicycle components of the
projects in thecorridor corridor
The objectives of the CSMP are to reduce travel time or delay on all modes improve
connectivity between modes and facilities improve travel
time reliability improve safety on the transportation system and expand mobility options along the corridor in a cost effective manner implementation of the CSMP will increase access to jobs housing and commerce
consistency with other state transportation plans anD policies The CSMP approach is consistent with the goals and objectives of the governorrsquos Strategic Growth Plan which among other things commits to minimizing increases in traffic congestion Key elements of the strategy are illusshytrated in Figure 3
at the base of the pyramid and the foundation of transshyportation system management is system monitoring and evaluation it is essential to understand what is happening on the transportation system so that the best decisions can be made based on reliable data The next few layers up
the pyramid are focused on making the best use of existing
resources and reducing the demand for transportation
HigHway 50 corridor system management plan [ 9 ]
c h a p t e r t w o n e e d p u r p o s e g o a l a n d o b j e c t i v e s
[ 10 ] HigHway 50 corridor system management plan
particularly during peak travel hours The top layer of the pyramid is system expansion This layer assumes that all the underlying components are being addressed and that system capacity expansion investments are necessary
Corridor system management is consistent with the Caltrans Mission
Improve Mobility Across California Corridor system management is consistent with Caltransrsquo goals
bull SafetY Provide the safest transportation system in the nation for users and workers
bull MobiLitY Maximize transportation system performance and accessibility
bull DELIVERY Efficiently deliver quality transportation projshyects and services
bull STEWARDSHIP Preserve and enhance Californiarsquos resources and assets
bull SERVICE Promote quality service through an excellent workforce
The CSMP is also consistent with the California Transportashytion Plan (CTP) the statewide long-range transportation
plan for meeting future mobility needs The CTP defines
goals policies and strategies to achieve our collective vishysion for Californiarsquos future transportation system
Figure 3 Strategic Growth Plan StrategyAir
Quality Planning Corridor System Management seeks to create conditions where vehicle flow on highways and roads occurs at a
steady pace and travelers have a range of mobility options that enable them to travel other than by single occupant vehicle System expansion is focused only where needed
when travel demand exceeds the capacity of the well manshyaged existing system These conditions are beneficial to
attaining air quality goals and reducing green house gas emissions
current corridor system management strategies
chapter three
US 50 is a transcontinental highway that originates in west Sacramento California and terminates in Ocean City Maryland it is a key transportation artery connecting yolo County Sacramento County and fast growing sub regions within Sacramento and El Dorado Counties
The corridor provides access to world renowned recreation areas in the Sierra Nevada Mountains and Lake Tahoe
Basin Peak commute and recreational travel periods are
heavily congested with demand for travel often exceedshying the capacity of existing facilities and services Severe
traffic congestion is common and commute transit services
often operate at maximum ridership capacity There is
extensive and expanding urban development along many parts of the corridor which suggests increased future transportation demand
Given the complexity of the corridor and its extensive geoshygraphic range there are a wide variety of system manageshyment strategies and elements currently being implemented by jurisdictions and transportation service providers Strategies and elements range from vehicle detection deshyvices to traveler information systems to traffic flow control mechanisms a common element among all the strategies and elements is data collection and analysis There is presshyently some system management coordination and intershyjurisdictional partnerships among the entities such as the Sacramento Transportation Area Network (STARNET)
The STARNET web application initial release is anticipated
for the late fall of 2009 Features to be included in the
initial release will include Changeable Message Sign (CMS) display a chain control application integration of Regional Transit data California Highway Patrol incident data connectivity to the 511 systems (web and telephone) Closed Circuit Television (CCTV) display and interagency messaging and coordination [Caltrans Transportation Management Center (TMC) Kingvale Operation Center City of Sacramento Traffic Operation Center (TOC) Sacramento
County TOC Roseville TOC and Elk Grove TOC] STARNETrsquos
associated management There are a widestrategies can and will variety of systemevolve as the application is
implemented throughout management
the region and as addi- strategies and tional features are added elements currently in annual releases being implemented
by jurisdictions and state highway sys-
tem transportation service
providerswith the construction of Californiarsquos state highshyway system virtually complete in the Sacramento region Caltransrsquo major emphasis on highway projects has largely shifted from new construction to focused capacity expanshysions reconstruction operation and maintenance of existshying facilities
The State Highway System has an extensive set of system
management strategies in operation Some cities coun-
HigHway 50 corridor system management plan [ 11 ]
c h a p t e r t h r e e c u r r e n t c o r r i d o r s y s t e m m a n a g e m e n t s t r a t e g i e s
tabLe 2 exiStiNg uS 50 toS eLeMeNtS
County Location PM toS elements
tMS rM HAR rWiS CMS eMS VS CCTV WiM
yolo i-80 to yoloSaC County Line
000 - 316 4 ndash ndash 1 1 ndash ndash 2 2
SaC
YoloSAC County Line to SR99 SR51
L000 - L248 R000
8 7 ndash ndash 3 ndash ndash 7 ndash
SR99SR51 ndash Watt Avenue R000 ndash R534 5 8 ndash ndash 1 1 ndash 3 ndash
watt avenue to Zinfandel Drive R534 ndash R1092 8 7 1 ndash ndash 2 ndash ndash ndash
Zinfandel Drive to Sunrise Blvd R1092 ndash 1250 1 4 ndash ndash ndash 1 ndash ndash ndash
Sunrise Blvd to Folsom Blvd 1250 ndash 1701 4 6 ndash ndash ndash ndash ndash 2 ndash
Folsom Blvd to SACED County Line
1701 ndash 2314 2 8 ndash ndash 1 ndash 1 ndash ndash
ED
SACED County Line to Cameron Park Dr 000 ndash R657 5 ndash ndash ndash 1 ndash 2 ndash ndash
Cameron Park Dr to Missouri Flat Rd R657 ndash R1506 7 ndash ndash ndash ndash ndash ndash ndash ndash
Missouri Flat Rd to End of Freeway R1506 ndash 1725 1 ndash ndash ndash ndash 1 ndash ndash ndash
ED End of Freeway to Bedford Ave 1725 ndash 1811 ndash ndash 1 ndash ndash ndash ndash ndash ndash
ED Bedford Ave to Cedar Grove Rd 1811 ndash R2595 ndash ndash ndash ndash 1 1 ndash ndash ndash
totaL 45 40 2 1 8 6 3 14 2
Notes PM = Post Mile TMS = Traffic Monitoring Station RM = Ramp Meter HAR = Highway Advisory Radio RWIS = Roadside Weather Information System CMS = Changeable Message Sign EMS = Extinguishable Message Sign VS = Visibility Sensor CCTV = Closed Circuit Television System WIM = weigh in Motion Existing TOS Elements as of April 2009
ties and transit operators also have robust system manshyagement elements and programs applied to their facilities or services
There are also specific instances of system management linkages among transportation modes and services at particular locations
Existing management strategies are depicted on Figure 4
and summarized in Table 2
US 50 BusCarpool Lanes in El Dorado County
[ 12 ] HigHway 50 corridor system management plan
c h a p t e r t h r e e c u r r e n t c o r r i d o r s y s t e m m a n a g e m e n t s t r a t e g i e s
These strategies work as a system to gather analyze and disseminate information through the Caltrans TMC inforshymation about collisions other incidents road closures and emergency notifications are fed into this information hub
and disseminated to public and private information users The TMC operates 24 hours a day seven days a week
parallel anD connecting roaDways City of West Sacramento has one CCTV located on west Capitol Avenue between Enterprise Boulevard and Capitol Mall
City of Sacramento operates a TOC Sensors in the street detect the passage of vehicles vehicle speed and the level of congestion
This information is received on a second-by-second (real-time) basis and is analyzed at the TOC
Sacramento County also operates a TOC by gathering information through CCTV cameras CMS HAR and a Fiber Optics (FO) network placed along major traffic
corridors throughout the county
City of rancho Cordova will be installing CCTV cameras and a FO network on Folsom Boulevard in 2009 Currently one CCTV exists on Sunrise Boulevard
between US 50 and Folsom Boulevard Most major traffic corridors are on the network or will be by the end of 2009 The City contracts with the County of Sacramento to operate their systems through the Countyrsquos TOC
City of folsom recently completed installing a FO system
Changeable Message Sign on US 50 at Scott Road
on all of the Cityrsquos major corridors Currently the sole intersection that is monitored via camera is located on iron Point Road and East Bidwell
El Dorado County has three coordinated signals along Francisco Drive at Green Valley Road the Market Place
entrance (east side Safeway Centerwest side Lake
Forest Plaza) and Village Center Drive
City of Placerville utilizes traditional control devices traffic signals and stop signs
transit anD riDesharing Yolo County Transit District (YCTD) uses a Global Positionshying System (GPS) for locating buses in route referred to as
an Automatic Vehicle Location (AVL) system
The AVL System allows users to see where their bus is
located within the last minute
El Dorado Transit Authority utilizes the gPS Zonar System for pre-trip inspections maintenance and real-time vehicle tracking
Sacramento Regional Transit District (SacRT) has in shystalled pre-emptive traffic signals at at-grade intersections
along the Light Rail routes SacRT has a GPS however it is only utilized for analysis purposes
Computer-aided dispatch and Bus Rapid Transit are in
the planning stages In addition SacRT has an online Trip
Planning application to assist transit users During special events such as the California State Fair the Jazz Festival
65th Street Light Rail Station and Transit Oriented Development
HigHway 50 corridor system management plan [ 13 ]
c h a p t e r t h r e e c u r r e n t c o r r i d o r s y s t e m m a n a g e m e n t s t r a t e g i e s
TABLE 3 PARk AnD RIDE LOTS
County Post Mile Facility name Description
Lot use transit Connection
Spaces Spaces occupied
occupancy Rate () Provider and route No
SaC 70 Butterfield Sacramento Regional Transit Gold Line Station
406 129 318 SacRT SacRT LRT Gold Line
SaC 125 Sunrise Sacramento Regional Transit Gold Line Station
487 389 799 RSacRT SacRT LRT Gold Line
SaC 158 Hazel 432 135 306 SacRT SacRT LRT Gold Line
SaC 158 Hazel 33 6 24 SacRT Route 109
SaC 171 Folsom Boulevard 70 58 829 ED Iron Point Connector SacRT LRT Gold Line
ED 2 El Dorado Hills (Latrobe RoadWhite Rock Road) 123 138 1122 ED Iron Point Connector ED Routes
156781112
ED 5 Cambridge Road 59 40 678 ED Iron Point Connector ED Routes 14567891112
ED 86 Ponderosa Road Northeast 28 15 536 ED Iron Point Connector ED Routes 23679101112
ED 86 Ponderosa Road Northwest 111 61 55 ED Iron Point Connector ED Routes 23679101112
ED 86 Durock Road 57 21 368 Na
ED 149 Shingle Springs Drive 19 4 211 Na
ED 122 Greenstone Road 21 4 19 Na
ED 15 Missouri Flat Road 73 44 603 ED Iron Point Connector
ED 158 Fairgrounds Park-and-Ride 200 40 20 ED Iron Point Connector
ED 185 Placerville Station (Mosquito Park- and-Ride) 130 50 385 ED Iron Point Connector
ED Commuter Service
ED 233 Camino Heights 24 1 42 Na
SacRT = Sacramento Regional Transit District ED = El Dorado County Transit Authority Lrt = Light rail train
Survey 2007
the holiday seasons and the Mather Field Air Show SacRT
operates additional service to connect events to light rail stations and offer free service to promote transit use durshying select events The transit routes identified in the CSMP
network are shown in Figure 5
The Sacramento Valley Station in downtown Sacramento is
the 7th busiest station in the national amtrak system and serves as a multi-modal transfer facility There are over 11 million passenger trips annually
Passengers can make connections with numerous local bus services as well as the SacRT light rail system
[ 14 ] HigHway 50 corridor system management plan
c h a p t e r t h r e e c u r r e n t c o r r i d o r s y s t e m m a n a g e m e n t s t r a t e g i e s
Try Transit Changeable Message Sign in Sacramento County
Sacramento County installed pre-emptive traffic signals to give preferential signal timing to transit buses at selected locations that serve high priority transit corridors
SACOG manages the 511 and rideshare programs that cost approximately $1 million per year region-wide to foster carpooling transit ridership vanpooling and bicycling in all areas and corridors The Regional Rideshare Program covers Placer El Dorado Sacramento yolo yuba and Sut-ter counties it is part of a statewide network of rideshare agencies which encourage alternative transportation modes for traveling
Park and Ride lots are located adjacent to or nearby the US 50 corridor utilized by commuters to connect with transit vanpool or carpool Of the sixteen lots many are adjacent to the SacRT Light Rail gold Line providing access for commuters to park their vehicles and commute the re-mainder of their trip via Light Rail El Dorado County Transit authority also uses the park and ride lots as transit stops for their Commuter Buses The locations capacity and occupancy rates of the Park and Ride lots are displayed in Table 3
Bicycle Facilities Bicycle facilities in the corridor are not actively managed in the same manner as motor vehicle facilities
However there are traffic operation systems that serve bicyclists such as dedicated bicycle lanes bicycle detec-tion loops at signalized intersections video detection other non-loop type detection and bicyclist activated signal change buttons The City of Sacramento is installing video detection at some locations
SacRT buses and the new light rail trains are equipped with bicycle racks There are over 170 weatherproof bicycle lock-ers at 23 light rail stations yCTD has the Bikes on Buses Program that allows bicycles to travel on any yOLOBUS
The Sacramento area Bicycle advocates maintain an on-line hazard reporting system to allow users to report hazardous locations for bicyclist such as potholes inad-equate signal timing hazardous railroad crossings insuf-ficient shoulder and inadequate bikeway markings The reports are then sent to the applicable jurisdiction SaCOg is creating an on-line route planning system for bicyclists in addition SaCOg maintains bicycle maps on their website which are currently being updated
The bicycle routes included in the CSMP network are shown on Figures 6 and 7
Pedestrian Facilities Pedestrian facilities are not included as part of the man-aged network because they do not directly provide corridor mobility However complete and safe pedestrian access to appropriate corridor modes such as bike routes and transit services is an important component of corridor system management Therefore subsequent updates of the CSMP will seek to identify key pedestrian facilities and barriers to pedestrian mobility with regard to access and modal con-nectivity
HigHway 50 corridor system management plan [ 15 ]
c h a p t e r t h r e e c u r r e n t c o r r i d o r s y s t e m m a n a g e m e n t s t r a t e g i e s
[ 16 ] HigHway 50 corridor system management plan
Page Inte
ntionally
Left
Blank
MAIN ST
MA
RB
LE V
ALL
EY
RD
65TH ST EXPY
FLYING
C R
D
STATE
HW
Y 16
MA
RB
LE VA
LLEY R
D
CAM
BRID
GE R
D
GREEN VALLEY RD
RIV
ERSI
DE
BLVD
11T
H S
T
RIV
ERSI
DE
BLVD
HO
WE
AV
E
EL DORADO
HILLS BLVD
EL DORADO H
ILLS BLV
D
HORNET DR
JEFF
ERSO
N BL
VD
CAM
ERO
N PAR
K DR
PO
WE
R IN
N R
D
CO
UN
TY HW
Y E3
BRADSHAW RD
MATHER FIELD RD
ZINFAN
DEL D
R
11TH
ST
VD
FOLSOM BLFOLSOM BLVD
FOLSOM BLVD
FOLSO
M BLVD
WHITE ROCK RD
FOLSOM BLVD
FOLS
OM
BLV
D
LATRO
BE RD
CANAL ST
16TH
ST
JACQ
UIER
RD
15TH
ST
HARBOR BLV
D
STOCKTON BLVD
FORNI RD BIDW
ELL DR
WATT AVE
PLACERVILLE DR
TOW
ER G
ATEW
AY
SHIN
GLE SPR
ING
S DR G
REEN
STON
E RD
59TH
ST
SUN
RISE BLVD
EL D
OR
AD
O R
D
HAZEL AVE
SOUT
H RI
VER
RD
PON
DER
OSA R
D
SHIN
GLE SPR
ING
S RD
SHIN
GLE
SPR
ING
S R
D
CARSON RD
MISSO
URI FLAT RD
BASS LAKE RD
N SH
ING
LE RD
PRAIR
IE CITY R
D
S SHIN
GLE R
D
SHIN
GLE
RD
SCOTT RD
W S
T AT
5TH
ST
65TH
ST
5TH
ST
X
ST A
T 27
TH
80
CEDAR GROVE EXIT
MO
SQU
ITO R
D
PLACERVILLE DRMISSOURI
FLAT RD
FORNIRD
EL D
OR
AD
OR
D
POIN
T VIEW D
RSM
ITH FLAT R
D
SCH
NELL SC
HO
OL R
D
MO
NTER
EY RD
c h a p t e r t h r e e c u r r e n t c o r r i d o r s y s t e m m a n a g e m e n t s t r a t e g i e s
Figure 4 Existing Traffic Operations Systems Elements
Highway 50 Corridor Systems Management Plan Existing Traffic Operations Systems Excluding Ramp Meters
TOS ndash Traffic Operations Systems
Stations Continuous Coverage
EMS ndash Extinguishable Message Sign WIM ndash Weigh-in-Motion Location (EMS Usually Refers Motorist to HAR)
Television System
19365TMS ndash Traffic Monitoring99 US Highway 50VS ndash Fog (Visibility) Sensor
CCTV ndash Closed Circuit
I-80 to Cedar Grove Exit HAR ndash Highway Advisory Radio Local Road Interchange Access
White Rock RdRWIS ndash Roadside WeatherCMS ndash Changeable Sunrise Blvd to Latrobe Rd
Message Sign Information System
50
80
51
49 160
50
Placerville to Cedar Grove Exit
50
1935
16 49
99
84 160
49 MilesMiles 0 1 2 3 4 50 1 2 3 4 5 10
HigHway 50 corridor system management plans [ 17 ]
124 49
MOTHER LODE DR
MATHER FIELD RD
West Terminus
RAMP
RAMP
RAMPRAMP
RAM
P
RAMP
RAM
P RAMP
RAMPRAMP
RA
MP
RAM
P RAM
P
RAMP
RAM
P
RAM
P
RA
MP
RAM
P
RAM
P
YoloBus Express Routes Plus Routes 42A and 42B
RAMPBROADWAY
65TH
ST
PCE
65
SCRY42A
Y44Y4343
242 IPC
5
W STX ST
WATT AVE
MAROCKINGHAM
DR
OLD PLACER
BRADSHAW RD
VILLE RDTHER FIELD RD
INTERNATIONAL DR
ZINFANDEL DR
WHITE ROCK RD FOLSOM BLVD FOLSOM BLVD
SUNRISE BLVD
BLUE R
AVIN
E RD
WHITE ROCK RD
SC
OTT R
D
PR
AIR
IEC
ITY R
D
LATROBE RD
GREEN V ALLEY RD
PLACERVILLE DR
FORNI RDM
AIN ST
BROADWAY
CEDAR GROVE EXIT
WEST
CAPTOL AVE
(WESTMOST
STOP)
(WESTMOST STOP)
SCR
SCR
IPC
IPC
c h a p t e r t h r e e c u r r e n t c o r r i d o r s y s t e m m a n a g e m e n t s t r a t e g i e s
Figure 5 US 50 CSMP Network Transit Routes
Highway 50 Corridor System Management Plan 80
CSMP Commuter Transit Network
El Dorado County Transit Authority 65
IPC Iron Point Connector
SCR Sacramento Commuter Route 193
Sacramento Regional Transit District 109ndashHazel Express
Yolo Bus (Express) Y43 Y44 Y230 Y231 and Y232
Yolo Bus (All-Day Intercity amp Airport Service) Y42A (Clockwise) Y42B (Counter-clockwise)
LATROBE RD
Park-and-Ride Lots
193 65
49 US Highway 50 (I-80 to Cedar Grove Exit)
Parallel Roads
Light Rail STation
Light Rail
Class I Bikeways Other State Highways
County Lines
80
49
50
80160
50
5 84 16
4999
Miles 0 5 10160
HigHway 50 corridor system management plans [ 18 ]
K
5
FOLSOM BIKE TRAIL
SEE CENTRAL CITY BICYCLENETWORK MAP FOR BICYCLE
F ACILITY NAMES
AMERICAN RIVER PARKWAY TRAIL SYSTEM
(INCLUDING JE
DEDIAH SMITH MEMORIAL T
RAIL)
FOLSOM BLVD
WHITE ROCK RDSIL V A V ALLEY PKWY
EL D
OR
AD
O H
ILLS B
L VD
GREEN VALLEY RD
AMERICAN R
IVER PARKWAY
TRAIL
SYSTEM
(INCLU
DING JE
DEDIAH SMITH
MEMORIA
L TRAIL)
NATOMA ST
FOLSOM BLVD
EL DORADO TRAIL
CARSON RD
PLACER VILLE RD
RAY
LAW
YER
DR
c h a p t e r t h r e e c u r r e n t c o r r i d o r s y s t e m m a n a g e m e n t s t r a t e g i e s
Figure 6 US 50 CSMP Network Bicycle Routes
Highway 50 Corridor System Management Plan
Bicycle Route Network
Class I Bicycle Facilities
Class II Bicycle Facilities
193
Lincoln
65
Rocklin
Auburn
Folsom 49
193
Light Rail Stations
Light Rail Loomis50
RosevilleUS Highway 50 CSMP Corridor
Other State Highways Miles
County Lines 0 1 2 3
99
49 80
50
160 80 193
Placerville 50
West Rancho 50 Sacramento Cordova
5 0 49
8 4
9 9 Sacramento
1 6 4 9
0 1 2 Miles
3
1 6 0 Elk Grove 210 210 44 66 88
Miles 10 Miles
10 1 2 4
4 9
HigHway 50 corridor system management plans [ 19 ]
13TH
ST
H ST E ST BELVEDERE AVE
51ST
ST
BROADWAY H ST
48TH
ST
11TH
ST
PO
WE
R IN
N R
D
28TH
ST
STOC
KTON
BLVD3R
D ST
ALH
AMBR
AFR
ON
T BLV
D S
T
W CAPITOL A VE
DISCOVER Y
P ARK BRIDGE
JEDED
IAH
N ST
T ST
K ST
11TH
ST
RIV
ERSI
DE
BLV
D
18TH
ST
R S
T17
TH S
TO
ST
18TH
ST
20TH ST
CAPITOL AVE
T ST
28TH
ST
34TH
ST
39TH
ST
M ST
BROADWAY
T ST
FOLSOM BLVD
58TH
ST
J ST
65TH
ST
CSU
S
CO
NN
ECTIO
NS
SR 16JACKSON HWY
FOLSOM BLVD
LA RIVIERA DR
W ATT AV
E
HO
WE A
VE
GUY W
EST B
RIDE
COLLEGE TOWN DR
c h a p t e r t h r e e c u r r e n t c o r r i d o r s y s t e m m a n a g e m e n t s t r a t e g i e s
Figure 7 US 50 CSMP Network Bicycle Routes (Sacramento Insert)
5 Sacramento
8 0
8 0
160
West Sacramento
80
SMITH MEMORIAL TRAIL
50
US Highway 50 Corridor System Management Plan 50
Central City Bicycle Route Network 50
Bikeway and Multi-Use Network
US Highway 50 (I-80 to Cedar Grove Exit)
Class I Bicycle Facilities
Class II Bicycle Facilities
Connecting Routesndashno Bicycle Designation
80 16 5
BROADWAY
FLOR
IN-P
ER
KIN
S R
D
Light Rail STation 99
Light Rail
Other State Highways
County Lines
HigHway 50 corridor system management plans [ 20 ]
major corridor mobility challenges
chapter four
High demand for mobility services especially during peak commute periods is creating significant traffic congestion
and impairing mobility in the corridor Heavy congestion and stop-and-go traffic contributes to increased vehicle
emissions and added travel costs Many transit services are operating at maximum passenger carrying capacity and buses often must contend with the same congestion as autos in many locations bicyclists have to compete for space on these same facilities
Much of the congestion can be attributed to population growth residential and commercial development job housing imbalances work schedules that require commute trips during peak travel times recreational trip generators and truck traffic
The overall amount of travel in the corridor has increased dramatically over the past ten years and is expected to
continue to increase as the region adds approximately
one million new residents over the next 25 years per the current SACOG MTP 2035 Traffic congestion per houseshyhold is expected to increase 18 percent over 2005 levels
by the year 2035
in the general area of eastern Sacramento County and western El Dorado County the Highway 50 Partnership
has projected growth of 78000 more dwelling units and 53000 new jobs over the next 25 years Current and foreshycasted data is depicted in Table 4
The sections of US 50 with particularly severe traffic
congestion are depicted in Figures 8 and 9 These are
also summarized in greater detail in Tables 14 and 15 in Chapter 7 Table 14 shows a summary of the US 50 eastbound bottlenecks while the tables that follow discuss each bottleneck including location and possible causality Table 15 shows a summary of the US 50 westbound bottleshynecks while the tables that follow discuss each bottleneck including location and possible causality Minor or hidden bottlenecks are those that are not as defined (or severe) as the major bottlenecks Please note that the graphics acshycompanying the bottlenecks are not to scale
a critical component of identifying and resolving Traffic congestion per corridor mobility challenges household is expected is the need for detailed to increase 18 percent data analysis and comshy over 2005 levels by the munication regarding
year 2035system performance Data collection is insufficient to
fully meet these needs but still provides useful information as detailed in the following pages improving data gathershying analysis and dissemination of information is a major challenge for this corridor and is a component of intelligent Transportation Systems planning
HigHway 50 corridor system management plan [ 21 ]
c h a p t e r f o u r m a j o r c o r r i d o r m o b i l i t y c h a l l e n g e s
[ 22 ] HigHway 50 corridor system management plan
Figure 8 US 50 AM Peak Period Bottleneck Locations
Figure 9 US 50 PM Peak Period Bottleneck Locations
Challenges along the corridor include
bull severe recurrent highway and roadway traffic congestion
bull an incomplete buscarpool lane system
bull an incomplete set of freeway auxiliary lanes
bull loss or dropping of freeway lanes at specific locations
bull incomplete ramp metering
bull limited parallel roadway capacity
bull lack of signal coordination on key arterials and freeway ramp intersections
bull transit facilities approaching capacity
bull inadequate transit capital and operations funding needed to grow transit ridership
bull light rail at-grade crossings
bull lack of adequate access to transit across US 50
bull lack of double tracking of the light rail Gold Line to Folsom
bull poor pavement and road and bicycle route maintenancesweeping
bull lack of sufficient bicycle activated signal change devices
bull motorist driving behavior
bull inadequate bicycle storage
bull inadequate bicycle and pedestrian access to transit and
bull gaps and barriers within the bicycle route network
Additionally the EDCTC has identified safety and operashytional issues between the Smith Flat interchange and east of the Upper Carson RoadCamino intersection in the
Camino Area Parallel CapacitySafety Study Transporshytation issues include at-grade access to US 50 left turn conflicts across US 50 increasing average daily local and
interregional traffic growth in the area lack of alternate
routes seasonal traffic to and from Apple Hill and other local events and seasonal access to recreation in the Lake
Tahoe Region
c h a p t e r f o u r m a j o r c o r r i d o r m o b i l i t y c h a l l e n g e s
Table 4 CUrrenT and ForeCaSTed TraFFiC daTa
location Current Traffic data ndash 2007 Future Traffic data ndash 2027 (no build) Future Traffic data ndash 2027 (build)
County description amp location of Trucks
Peak directional
Split
Peak Hour Traffic
average annual daily
Traffic2
Volume over Capacity3
Peak Hour Traffic
average annual daily Traffic2
Volume over Capacity3
(no-build)
Peak Hour Traffic
average annual daily
Traffic2
Volume over Capacity3
(build)
yOL interstate 80 to yoloSacramento County Line
6 60 15500 180000 109 23911 277032 169 24070 278880 136
SaC yoloSacramento County Line to State Routes 99 and 51
4 59 21000 253000 135 28080 312480 186 29153 324415 193
SaC State Routes 99 and 51 to watt avenue 4 59 20600 225000 145 27942 286230 189 30648 313950 166
SaC watt avenue to Zinfandel Drive 4 59 16700 187000 115 24783 274540 163 25885 286750 136
SaC Zinfandel Drive to Sunrise Boulevard 4 60 13500 149000 093 20331 224394 133 20925 230950 110
SaC Sunrise Boulevard to Folsom Boulevard 4 66 11900 125000 089 18888 198247 131 20086 210820 140
SaC Folsom Boulevard to SacramentoEl Dorado County Line
3 66 8800 95000 087 13341 151311 133 13612 154380 136
ED SacramentoEl Dorado County Line to Cameron Park Drive
4 61 6900 70000 095 11454 116200 165 11834 120050 114
ED Cameron Park Drive to Missouri Flat Road
4 62 5700 62000 092 8647 94054 132 9462 102920 096
ED Missouri Flat Road to End of Freeway in Placerville
4 57 4850 59000 069 7101 76245 098 7363 79050 102
ED End of Freeway in Placerville to Bedford avenue
4 55 4800 52000 Na 4 6595 74196 Na4 6648 74790 Na4
ED Bedford avenue to Cedar grove Exit 4 62 3800 38500 077 5474 50782 099 5520 51205 099
1 Peak Directional Split The percentage of total traffic in the heaviest traveled direction during the peak hour2 Average Annual Daily Traffic (AADT) The average number of vehicles per day in both directions 3 Volume over Capacity (VC) The volume of traffic compared to the capacity of the roadway4 Volume over Capacity does not determine LOS for two- or three-lane facilities or segments with intersection delay 5 Reported Collision Rate index ( Compared to State average) The percentage by which each segmentrsquos reported collisions rate (fatal injury and property damage only) is above or below the statewide average reported collisions rate on comparable facilities
Source 3-Year Caltrans Traffic Accident Surveillance and Analysis System data
HigHway 50 corridor system management plans [ 23 ]
c h a p t e r f i v e p e r f o r m a n c e m e a s u r e s
Page Inte
ntionally
Left
Blank
[ 24 ] HigHway 50 corridor system management plan
performance measures
chapter five
Continuing corridor monitoring and performance mea-
sures are an integral part of corridor management and investment decision making and help identify immediate efficient and effective system operational strategies and
capital improvements Performance measures provide the
important dynamic daily information needed to rapidly
address operational problems caused by recurrent and
non-recurrent traffic congestion Measures are also used to identify the best improvement actions to generate the desired results
Table 5 identifies the performance measures to be used as
part of the corridor system management process
Baseline Data For perFormance measures Tables 6 7 and 8 display baseline data for the perforshymance measures for the CSMP transportation network
The performance data was primarily compiled from the SACMET demand based traffic model the year 2007
edition of the Traffic Volumes Manual the year 2000 edition of the Highway Capacity Manual Caltrans Traffic
Accident Surveillance and Analysis System (TASAS) the 2007 Caltrans Division of Maintenance Pavement Summary Report and ridership records provided by the transit providers
additional performance Performance Measures data was derived from the provide the important Performance Measurement dynamic dailySystem (PeMS) tool an
information needed internet based tool used to
to rapidly addresshost process retrieve and operational problemsanalyze road traffic condishy
tions information from caused by recurrent
real-time and historical and non-recurrent data PeMS obtains 30-sec- traffic congestion ond loop detector data in real-time from detectors installed along the highway corridor
It should be noted that Average Daily Traffic (ADT) and LOS
for some ParallelConnecting Roadways segment locations
in Table 7 was not available These are noted ldquoNo Datardquo
Data collection for non-auto modes is not as robust as what is needed for active system management Subsequent updates of this CSMP will seek to expand the
availability of transit and bicycle performance data collection
HigHway 50 corridor system management plan [ 25 ]
mdash
c h a p t e r f i v e p e r f o r m a n c e m e a s u r e s
TABLE 5 PERFORmAnCE mEASURES DEFInITIOnS AnD APPLICABILITY
Performance Measure Definition of Performance measure applicability to Corridor
STATE HIGHWAY SYSTEm
LOS A ldquoreport cardrdquo measurement with ldquoArdquo being the least amount of
congestion and ldquoFrdquo being the most congestion LOS is a relatively simple and widely used measure which
offers comparison opportunities
Total Vehicle Hours of Delay The additional travel time in hours experienced by all vehicles on the highway segment per day or at peak hour due to congestion
This measurement is used to determine the cost in time which congestion can add to the regular travel time that it takes to traverse a segment of road and is useful in
quantifying the performance of a particular roadway in an understandable format
Total Person Minutes of Delay The additional travel time in minutes experienced by all persons in vehicles on the highway segment per day or at peak hour due
to congestion
This measurement is used to determine the cost in time which congestion can add to the regular travel time that it takes to traverse a given segment of road and is useful in quantifying the performance of a particular roadway in an
understandable format and for comparison of improvement options
Minutes of Delay per Vehicle The additional travel time in minutes experienced by each vehicle on the highway segment at peak hour due to congestion
This measurement is used to determine the cost in time which congestion can add to the regular travel time that it
takes to traverse a given segment of road
Minutes of Delay per Person The additional travel time in minutes experienced by each person in vehicles on the highway segment at peak hour due to congesshy
tion
This measurement is used to determine the cost in time which congestion can add to the regular travel time that it
takes to traverse a given segment of road
Vehicle Travel Time (Minutes) The average time spent by vehicles traversing between two points on a road or highway
Travel time is a measure used to quantify travel time deficienshycies and provide a personal indicator of congestion impacts
Distressed Pavement Pavement that rides rougher than established maximums and or exhibits substantial structural problems as determined by the
Pavement Condition Survey
This measurement provides a ride quality indicator and an indicator for structural roadway problems
Reported Collision Rate Comparison of the actual total collision rate () along a highway segment above or below the statewide average for fatal injury
and property damage-only collisions on comparable facilities
Comparing the total collision and rate with statewide average rate provides an opportunity to assess safety conditions
through the corridor
Reliability Identifies day-to-day variation in travel time for the same trip at the same time of day Focuses on the predictability of travel time
particularly for repetitive trips
Estimates reliability by defining the extra time travelers must add to their average travel time when planning trips to ensure on-time arrival (0 percent no day-to-day variations
100 percent double allotted travel time)
Lost Productivity Measures the capacity of the corridor to accommodate vehicle or person throughput and is calculated as actual volume divided by
the capacity of the highway
As traffic volumes increase to roadway capacity speeds decline rapidly and vehicle throughput drops dramatically which increases traffic congestion and delay and results in
lost productivity
[ 26 ] HigHway 50 corridor system management plan
mdash
c h a p t e r f i v e p e r f o r m a n c e m e a s u r e s
HigHway 50 corridor system management plan [ 27 ]
TABLE 5 PERFORmAnCE mEASURES DEFInITIOnS AnD APPLICABILITY (ConTInued)
Performance Measure Definition of Performance measure applicability to Corridor
PARALLEL AnD COnnECTInG ROADWAYS
LOS A ldquoreport cardrdquo measurement with ldquoArdquo being the least amount of
congestion and ldquoFrdquo being the most congestion LOS is a relatively simple and often used measure which
offers comparison opportunities
traNSit
available Capacity Ratio () of available transit capacity alternatives within the corridor
This measure indicates the available capacity to accommoshydate diverted travelers from single occupant vehicles
c h a p t e r f i v e p e r f o r m a n c e m e a s u r e s
[ 28 ] HigHway 50 corridor system management plan
Page Inte
ntionally
Left
Blank
c h a p t e r f i v e p e r f o r m a n c e m e a s u r e s
Table 6 US 50 PerForManCe MeaSUreS
County location Post Miles
distance (Miles)
average annual daily Traffic1
PerForManCe MeaSUreS
loS1
Total Vehicle Hours of delay2
Total Person Minutes of delay2
Minutes of delay per Vehicle2
Minutes of delay per Person2
Vehicle Travel Time (Minutes)2 distressed
Pavement (lane
Miles)4
reported Col-lision rate
Comparison ()5
reliability6 lost Productivity7
daily Peak Hour3 daily Peak
Hour3 Peak Hour3 Peak Hour3 Peak Hour3 eastbound westbound lost lane Miles aM
Peak Period
lost lane Miles PM
Peak Period
STaTe HigHway SySTeM
yOL interstate 80 to yolo Sacramento County Line
000 to 316 316 180000 F 1169 126 95363 8061 049 046 36 9 26 62 22 01 0
SaC
yoloSacramento County Line to State Routes 99
and 51
L000 to L248 R000
248 253000 F 4993 653 407455 41746 186 175 43 7 20 64 60 53 76
State Routes 99 and 51 to watt avenue
R000 to R534 534 225000 F 10097 1362 823883 87105 397 372 93 15 24 60 48 81 68
watt avenue to Zinfandel Drive
R534 to R1092 558 187000 F 8075 977 658886 62506 351 329 91 19 -32 56 42 44 23
Zinfandel Drive to Sunrise Boulevard
R1092 to 1250 158 149000 E 1271 197 103727 12610 088 082 25 9 -33 46 13 0 16
Sunrise Boulevard to Folsom Boulevard
1250 to 1701 451 125000 E 3087 356 251940 25832 180 149 63 5 -14 60 46 1 45
Folsom Boulevard to SacramentoEl Dorado
County Line
1701 to 2314 613 95000 D 583 122 47537 8867 083 069 70 0 -11 19 55 0 08
ED
SacramentoEl Dorado County Line to Cameron
Park Dr
000 to R657 657 70000 E 504 126 41150 9138 110 091 77 1 -35 PeMS Data
Unavailable PeMS Data Unavailable
PeMS Data Unavailable
PeMS Data Unavailable
Cameron Park Drive to Missouri Flat Road
R657 to R1506 849 62000 E 302 75 24633 4827 079 075 93 2 -61 PeMS Data
Unavailable PeMS Data Unavailable
PeMS Data Unavailable
PeMS Data Unavailable
Missouri Flat Road to End of Freeway in Placerville
R1506 to 1725 219 59000 D 66 16 5376 1053 020 019 24 1 20 PeMS Data
Unavailable PeMS Data Unavailable
PeMS Data Unavailable
PeMS Data Unavailable
End of Freeway in Placerville to Bedford avenue
1725 to 1811 086 52000 D 68 17 5585 1094 021 020 15 2 81 PeMS Data
Unavailable PeMS Data Unavailable
PeMS Data Unavailable
PeMS Data Unavailable
Bedford avenue to Cedar grove Road
1811 to R2595 784 38500 D 58 15 4758 932 023 022 85 10 6 PeMS Data
Unavailable PeMS Data Unavailable
PeMS Data Unavailable
PeMS Data Unavailable
TOTaL mdash 5473 mdash mdash 30273 4042 2470293 263771 1587 1449 7150 80 mdash mdash mdash mdash mdash
1 Source Average Annual Daily Traffic and Level of Service (LOS) calculated is based on 2007 Caltrans Traffic Volumes on California State Highways and Highway Capacity Manual and Cambridge Systematics from 2008 Reported LOS is for the typical most congested daily peak travel period 2 Source Delay is the average additional travel time by vehiclespersons traveling under 60 mph Data derived from 2007 HICOMP report SACMET Travel Demand Model PeMSs traffic data and Caltrans District 3 Traffic Operations Probe vehicle Tach runs 3 Peak Hour is during PM 4 Source 2007 Caltrans Division of Maintenance Pavement Summary Report 5 Source 2004 through 2007 Caltrans Traffic Accident Surveillance and Analysis System summary data of the percentage above or below the statewide average for fatal injury and property damage-only collisions on comparable facilities 6 Reliability The Planning Time Index is a measure of the reliability of the travel time on a particular route It is the ratio of the 95th percentile of travel time on a route to the median free-flow travel time This means itrsquos the amount of time a traveler needs to allocate for a route if they want to show up on time 19 out of 20 trips Reliability and Planning Time data was taken from April 2007 The data covered a 24-hour period of time on each Tuesday wednesday and Thursday of that month That data was then aggregated into a single average 24-hour day it was then analyzed to determine the highest average aM and PM travel time That time was then compared to the best possible average travel time to determine the additional time that was spent traveling the same seg-ment 7 Lost Productivity Data taken April 2007 PeMS As traffic increases to the capacity of the highway speeds decline throughput drops dramatically and the efficiency of the highway to provide mobility decreases This decline in the potential carrying-capacity of the freeway is expressed in terms of how many equivalent lane miles of roadway are lost
HigHway 50 corridor system management plans [ 29 ]
c h a p t e r f i v e p e r f o r m a n c e m e a s u r e s
Table 7 Parallel and ConneCTing roadwayS PerForManCe MeaSUreS
County location average
daily Traffic1
PerForManCe MeaSUreS
loS1
Total Vehicle Hours of delay2
Total Person Minutes of delay2
Minutes of delay per Vehicle2
Minutes of delay per Person2
Vehicle Travel Time (Minutes)2
distressed Pavement
(lane Miles)4
daily Peak Hour3 daily Peak
Hour3 Peak Hour3 Peak Hour3 Peak Hour3
Parallel and ConneCTing roadwayS
yOL west Capitol Enterprise Boulevard to Capitol Mall 13737 No Data
Data is unavailable for these performance measures at this time however will be pursued in the next phase of the CSMP
SaC
w 5th Street to 26th Street 9194 a
X 5th Street to 26th Street 9154 a
Folsom Boulevard watt avenue to Bradshaw Road 25600 C
watt avenue Folsom Boulevard to US 50 63900 F
Bradshaw Road Folsom Boulevard to US 50 22400 a
Folsom Boulevard Bradshaw Road to Sunrise Boulevard 20400 a
Bradshaw Road Old Placerville to US 50 54405 F
Old Placerville Road Bradshaw Road to Rockingham Drive 11864ndash18365 a
Rockingham Drive Old Placerville Road to Mather Boulevard 16516 E
Mather Boulevard Rockingham Drive to Folsom Boulevard 21732 C
international Drive Rockingham Drive to Zinfandel Drive 12808 a
Zinfandel Drive international Drive to Folsom Boulevard 22298ndash47032 BE
white Rock Road Zinfandel Drive to Sunrise Boulevard 25459 a
Sunrise Boulevard US 50 to Folsom Boulevard No Data No Data
white Rock Road Sunrise Boulevard to Prairie City Road 3400 B
Folsom Boulevard Sunrise Boulevard to iron Point Road 17200 a
white Rock Road grant Line Road to EDSaC County Line 6700 D
iron Point Road Folsom Boulevard to East BidwellScott Road 13984 No Data
Scott Road iron Point Road to white Rock Road No Data No Data
Folsom Boulevard iron Point Road to Blue Ravine Road No Data No Data
Blue Ravine Road Folsom Boulevard to green Valley Road No Data No Data
Prairie City Road US 50 to white Rock Road 6000 D
HigHway 50 corridor system management plans [ 30 ]
c h a p t e r f i v e p e r f o r m a n c e m e a s u r e s
Table 7 Parallel and ConneCTing roadwayS PerForManCe MeaSUreS (ConTinUed)
County location average
daily Traffic1
PerForManCe MeaSUreS
loS1
Total Vehicle Hours of delay2
Total Person Minutes of delay2
Minutes of delay per Vehicle2
Minutes of delay per Person2
Vehicle Travel Time (Minutes)2
distressed Pavement
(lane Miles)4
daily Peak Hour3 daily Peak
Hour3 Peak Hour3 Peak Hour3 Peak Hour3
Parallel and ConneCTing roadwayS
ED
green Valley Road EDSaC County Line to Francisco Drive 22600 D
Data is unavailable for these performance measures at this time however will be pursued in the next phase of the CSMP
green Valley Road Francisco Drive to Silva Valley Parkway 13077 D
green Valley Road Silva Valley Parkway to Cameron Park 9849 C
green Valley Road Cameron Park Drive to Deer Valley Road 5278 C
green Valley Road Deer Valley Road (East) to Lotus Road 8381 D
green Valley Road Lotus Road to Placerville Drive 4669 C
Latrobe Road white Rock Road to US 50 24742 C
Durock Road Cameron Park Dr to South Shingle Road 7278 C
Cameron Park Drive Durock Road to US 50 (Durock Road to Coach Lane Coach Lane to US 50) 9544 26603 CD
South Shingle Road Durock Road to US 50 11390 D
white Rock Road EDSaC County Line to Latrobe 12808 D
white Rock Road Latrobe Rd to Silva Valley Pkwy (Latrobe to PostPost to Silva Vlly Pkwy) 10124 CD
Silva Valley Parkway white Rock Rd to Serrano Pkwy (white Rock to Entrada Entrada to Serrano Pkwy) 13708 9328 DC
Forni Road Placerville Drive to Main Street 9049 8379 No Data
Placerville Drive Forni Road to US 50 No Data No Data
Main Street Placerville Drive to Bedford avenue No Data No Data
Main Street Bedford avenue to Broadway No Data No Data
Broadway Main Street to Point View Drive No Data No Data
1 Source Average Daily Traffic and Level of Service (LOS) calculated are based on City of Sacramento between 2001 and 2007 Sacramento County from 20072008 City of Rancho Cordova between 2004 and 2007 and El Dorado County from 2007
HigHway 50 corridor system management plans [ 31 ]
c h a p t e r f i v e p e r f o r m a n c e m e a s u r e s
Page Inte
ntionally
Left
Blank
[ 32 ] HigHway 50 corridor system management plan
c h a p t e r f i v e p e r f o r m a n c e m e a s u r e s
tabLe 8 traNSit PerforMaNCe MeaSure
County transit Provider route Performance Measure
available daily Capacity ()1 available Peak Hour Capacity1
traNSit
SaC
SacRT (Bus)
Route 21 70 10
Route 28 76 59
Route 36 83 74
Route 38 66 44
Route 72 56 20
Route 73 79 45
Route 74 82 43
Route 109 47 22
SacRT (Light Rail) Gold Line 31 Exceeds Capacity
EDSAC ED County Transit Authority
Commuter Express Bus Service Not applicablendashOperates Peak Hour
Only 405
iron Point Connector 764 Not available
Reverse Commuter Not applicablendashOperates Peak Hour Only 982
yoloSaC yolo County Transit District Not applicablendashOperates Peak Hour Only 498
biKe3
1 Source average Daily and Peak Hour available Capacity calculated from each transit providerrsquos route ridership data 2 The Reverse Commuter service is offered on vehicles that are returning to El Dorado County (Commuter Express Buses) 3 Bicycle performance measure(s) will be identified applied and included in the subsequent CSMPs
HigHway 50 corridor system management plan [ 33 ]
c h a p t e r f i v e p e r f o r m a n c e m e a s u r e s
[ 34 ] HigHway 50 corridor system management plan
Page Inte
ntionally
Left
Blank
planned corridor system management strategies
chapter six
ConCept LoS and ConCept FaCiLit y ldquoConcept LOSrdquo and ldquoConcept Facilityrdquo have traditionally been used in Caltrans TCCRs to reflect the minimum level or quality of operations acceptable for each route segment within the 20-year planning period and the highway facility needed in the next 20 years to maintain the Concept LOS
Typical Concept LOS standards in Caltrans District 3 are LOS ldquoDrdquo in rural areas and LOS ldquoErdquo in urban areas how-ever some heavily congested route segments now have a Concept LOS ldquoFrdquo because the improvements required to bring the LOS to ldquoErdquo are not feasible due to environmental right of way financial and other constraints The applica-tion of multi-modal corridor management strategies should reduce the severity and duration of congestion and provide viable travel options and information that will enable a traveler to avoid severe freeway congestion
The Concept LOS and Concept Facility for US 50 are shown in Table 9 almost all US 50 segments are forecasted to operate under LOS ldquoFrdquo conditions in 20 years under the No-Build and Build scenarios
Corridor ManageMent StrategieS The US 50 CSMP also proposes specific strategies to enhance corridor mobility (see Table 10) based on the fol-lowing principles
bull Manage all modes and facilities in the corridor as a single system beginning with the transportation net-work defined in this CSMP
bull Implement comprehensive and dynamic multimodal monitoring and reporting for the system and for all modes
bull Develop and use micro-simulation modeling to identify mobility challenges and to evaluate proposed solutions
bull Complete the projects included in the regional trans-portation plans with an emphasis on the completion of the key mobility improvement projects identified in this CSMP (see Tables 11 and 12)
bull Implement the specific strategies outlined in this CSMP
Key CapitaL projeCtS Tables 11 and 12 contain key capital projects that have been identified as the most critical to corridor mobility These are also included in the SaCOg MTP for 2035 and are either planned without any funding yet programmed are partially programmed
The US 50 CSMPor are entirely programmed SACOG conducted significant proposes specific
public attitude research strategies to enhance for the MTP for 2035 to corridor mobility complement comprehensive outreach efforts through community workshops the TALL Order Moving the Region Forward event the televised Town Hall Road Map for the Future and associated public polling The results of the SaCOg analyses and public out-reach for the MTP were
highway 50 corridor system management plan [ 35 ]
c h a p t e r s i x p l a n n e d c o r r i d o r s y s t e m m a n a g e m e n t s t r a t e g i e s
[ 36 ] HigHway 50 corridor system management plan
used when selecting the key projects for identification in
the CSMP and to ensure consistency Not all corridor projshyects in the MTP are included in the CSMP since the CSMP focuses on the managed network and the SaCOg MTP considers all streets and roads bike routes and transit services in the corridor
highway 50 partnership The Highway 50 Partnership is a cooperative public-private effort among the County of Sacramento City of Rancho
Cordova City of Folsom County of El Dorado and several major landowners that recognize the need to consider corrishydor mobility needs holistically
The Partnership has collaborated effectively to develop a Plan to improve mobility in the US 50 Corridor from Rancho
Cordova to El Dorado Hills an area identified as approprishyate for growth in the SACOG Blueprint Recognizing the
need to generate private investment the Partnership is seeking to implement a regional Highway 50 Corridor fee program to fund these projects
in addition to the key projects indicated in Table 11 Table 12 displays the key projects identified by the
Partnership
These projects include (1) Near-Term Priority Improvement Projects and (2) Near-Term Expected Roadway Improveshyments
The Near-term Priority improvement Projects would proshyvide several new roadway connections for people to travel within and through the area to avoid congestion They also include new transit routes and widening existing roadways
viewed by the Partnership as a package that would provide system-wide travel benefits These improvements targeted
for completion through 2012 would reduce vehicle hours of delay during commute hours by 30 percent
The near-Term Expected Roadway Improvements are conshysidered by the Partnership to be readily expected since they are tied to expected development or are part of a near-term
capital improvements program
Visionary projects Visionary projects are not yet included in the SaCOg MTP or EDCTC RTP but appear to offer considerable corridor mobilshyity benefits and merit further analysis and consideration for inclusion in the next MTP and RTP These are displayed in
Table 13
The ldquoPlus 10 Listrdquo in the SACOG MTP identifies projects
that are attractive from a performance standpoint but could not be included in the Final Project Lists because of financial constraint The ldquoPlus 10 Listrdquo element offers the
opportunity to include projects that would not be affordshyable without additional funding Some projects identified in
the Visionary Projects List were analyzed by SACOG during
development of the current MTP Some of these are included in the ldquoPlus 10 Listrdquo
Watt Avenue Light Rail Station Improvement Project
c h a p t e r s i x p l a n n e d c o r r i d o r s y s t e m m a n a g e m e n t s t r a t e g i e s
Table 9 US 50 ConCePT loS and FaCiliTy TyPe
location Forecasted level of Service1 (loS) and Facility Type
County description and location From Post Mile To Post Mile Current
loS1 20-year no build loS12
20-year build loS12
20-year Concept
loS13 existing Facility4 Concept Facility456 Ultimate Facility457
yOL interstate 80 to yoloSacramento County Line
000 316 F F F F 8F (6F between Jefferson Blvd ramps)
8F+2HOV+aux Lanes 8F+2HOV+aux Lanes
SaC yoloSacramento County Line to SR 99 and 51
L000 L248 = R000 F F F F 8F 8F+2HOV+aux Lanes 8F+2HOV+aux Lanes
SaC State Routes 99 and 51 to watt avenue R000 R534 F F F F 8F 8F+2HOV+aux Lanes 8F+2HOV+aux Lanes
SaC watt avenue to Zinfandel Drive R534 R1092 F F F F 8F 8F+2HOV+aux Lanes 8F+2HOV+aux Lanes
SaC Zinfandel Drive to Sunrise Boulevard R1092 1250 E F F F 8F 8F+2HOV+aux Lanes 8F+2HOV+aux Lanes
SaC Sunrise Boulevard to Folsom Boulevard 1250 1701 E F F F 6F+2HOV to Hazel ave 4F+2HOV
to Folsom Blvd
6F+2HOV+aux Lanes to Hazel ave 4F+2HOV+aux
Lanes to Folsom Blvd
8F+2HOV+aux Lanes
SaC Folsom Boulevard to SaCED County Line 1701 2314 D F F F 4F+2HOV 4F+2HOV+aux Lanes 6F+2HOV+aux Lanes
ED SacramentoEl Dorado County Line to Cameron Park Drive
000 R657 E F F F 4F 4F+2HOV+aux Lanes 6F+2HOV+aux Lanes
ED Cameron Park Drive to Missouri Flat Road R657 R1506 E F E E 4F 4F+2HOV+aux Lanes to greenstone 4F+aux Lanes
to Missouri Flat
6F+2HOV+aux Lanes to greenstone 4F+2HOV+aux Lanes
to Missouri Flat
ED Missouri Flat Road to End of Freeway in Placerville
R1506 1725 D F F F 4F 4F+aux Lanes 4F+aux Lanes
ED End of Freeway in Placerville to Bedford avenue
1725 1811 D E E E 4E 4E 4E
ED Bedford avenue to Cedar grove Exit 1811 R2595 D F F F 4F to Smith Flat 4E to Camino 4F+aux Lanes to Smith Flat 4E to Camino
4F+aux Lanes
1 Level of Service (LOS) A ldquoreport cardrdquo for evaluating traffic flow with ldquoArdquo being the best and ldquoFrdquo being the worst 2 20-year LOS (No Build) The LOS that would be expected at 20 years with no improvements 3 20-year Concept LOS The minimum acceptable LOS over the next 20 years 4 Facility Type Codes C=Conventional Highway E=Expressway F=Freeway HOV=High Occupancy Vehicle Lanes aux=auxiliary Lanes 5 Operational improvements are included in future facilities for all segments Examples of operational improvements include TOS improvements and auxiliary lanes 6 Concept Facility the future roadway with improvements needed in the next 20 years if LOS ldquoFrdquo no further degradation of service from existing ldquoFrdquo is acceptable as indicated by delay performance measurement 7 Ultimate Facility The future roadway with improvements needed beyond a 20 year timeframe
HigHway 50 corridor system management plans [ 37 ]
c h a p t e r f i v e p e r f o r m a n c e m e a s u r e s
Table 10 US 50 CSMP STraTegieS
Strategy description implementation Challenges
Maintain and operate the existing corridor multi-modal trans-
portation infrastructure
Maintain the existing investment in all modes of the transportation system and provide adequate resources for daily operations including operating
revenues for transit services
Funding availability funding competition within the region
Fully coordinate the delivery of transportation services and facili-ties in the corridor including daily operations and system planning
for enhancements
Interagency operational coordination to maximize the efficiency and effec-tiveness of all modes operating in the corridor with a focus on the CSMP transportation network defined in this CSMP Use of an existing group or
committee to provide initial oversight for this strategy
Diverse interests and competing priorities and limited resources
Construct planned and pro-grammed corridor capital improve-
ment projects
implementation of the capital improvements in the corridor included within the approved Metropolitan Transportation Plan and Regional Transportation
Plan for all transportation modes within the scope schedule and cost specified
Funding availability funding competition within the region
Comprehensive daily monitoring of the status of all modes providing service on the CSMP transporta-
tion network
Full deployment of multimodal transportation service status detection systems for all CSMP network components
Funding availability funding competition within region
Provide traveler information to the public
Provide the public with real-time easily accessible information regarding the status of all CSMP transportation system components so as to allow travel-
ers to make informed decisions about trip mode time and routing options
Funding availability funding competition within region
Continually monitor and analyze the CSMP transportation network to improve system performance
Monitor transportation performance measures and make system modifica-tions as appropriate on a frequent and timely basis Staff resources and data availability
Decrease the duration of non-recurrent traffic congestion
Expand and enhance the Freeway Service Patrol to respond to automobile accidents and vehicle break-downs
Funding availability funding competition within the region
Timely implementation of STaRNET
Expedite the implementation of the STaRNET operators of transportation facilities and emergency responders in the Sacramento region through real-time sharing of data and live video refinement of joint procedures
pertaining to the operation of roadways and public transit and public safety activities as well as enhance the regionrsquos 511 web site and interactive
telephone service to provide more traveler information
Developmental time acceptance by agencies and integration into daily use and identifica-
tion of maintenance and operations funding
Enhance transit and rail service increase transit service frequency provide express transit services imple-
ment bus rapid transit routes reduce headways for light rail and buses and construct planned light rail line extensions
Funding availability funding competition within the region
Complete Bus Carpool lane network
Complete the regional buscarpool lane network including freeway-to-freeway HOV lane connectors
Funding availability funding competition within the region Public agency and public
acceptance of network
[ 38 ] HigHway 50 corridor system management plan
c h a p t e r s i x p l a n n e d c o r r i d o r s y s t e m m a n a g e m e n t s t r a t e g i e s
tabLe 10 uS 50 CSMP StrategieS (ConTInued)
Strategy Description implementation Challenges
Enhance Transportation Demand Management strategies
Encourage employers to provide telecommuting and flexible working hour options to employees
acceptance by employers and resources to participate
Optimize the timing and synchronishyzation of traffic signals
Coordinate the optimization and timing of traffic signals on freeway ramps and along parallel and connecting roadways within and between jurisdicshytions to improve traffic flow and reduce congestion Provide signal priority
systems for transit vehicles
Funding availability and coordination among cities counties and Caltrans
improve access management of freeways and parallel connecting roadways
Develop and implement access management strategies to maintain the operational efficiency of freeways and parallelconnecting roadways
agreement between responsible jurisdicshytions as to where increased access control is needed increased access control on some parallelconnecting roadways may increase
traffic volumes on non-corridor roads
Develop innovative use of CMSs (eg travel times)
Potential uses of CMSs to improve system efficiency include the use of CMSs along portions of all corridors near transit station to indicate travel
times based on real-time existing traffic conditions on the freeway as well as on parallel roadways and express bus and light rail services CMS can also be used to identify the number of parking spaces that are still available at
the light-rail stations
Funding availability funding competition within the region
Implement amp expand Transit AVLTransit status information
enhancements for system users
Expand the use of AVL systems utilizing GPS technology to track in real-time the location of transit vehicles monitor transit schedules dispatch transit vehicles and provide real-time passenger information such as ldquonext busrdquo or
ldquonext trainrdquo arrival times
Funding availability funding competition within region
Expand Park-and-Ride lots at key locations
Add additional capacity to existing park-and-ride lots near transit stations and other locations that are approaching capacity
Funding availability funding competition within the region and available land
improve bike-pedestrian access in the CSMP
transportation network
Plan and program for construction of additional bicycle paths lanes and related improvements for access and connectivity to transit park and ride
lots and destination points
Funding availability funding competition within the region
Provide ldquoBike-SharingrdquordquoCar-Sharingrdquo tofrom transit (ldquoCarlinkrdquo) and from
neighborhoods
Expand the Regional Rideshare and Spare-the-Air programs to include bicycle and car sharing opportunities
Funding availability and coordination between SaCOg TMa air Districts employers developshyers property managers and local government
officials
Provide parking management stratshyegies in interested jurisdictions where applicable to discourage
use of single-occupant vehicles
in higher-density areas provide preferential parking for carpools and vanshypools require residential parking permits remove on-street parking and or provide graduated parking fees for metered on-street parking based on
vehicle type and time of day for SOV spaces to encourage transit use
Acceptance by businesses local officials and the general public
Expand bicycle commute amp transit fare strategiessubsidies
increase participation by large employers in programs that subsidize transit fares for employees during peak-hour commute times and provide bicycling
to work incentives
Voluntary participation by large employers to pay subsidy to transit providers
HigHway 50 corridor system management plan [ 39 ]
c h a p t e r s i x p l a n n e d c o r r i d o r s y s t e m m a n a g e m e n t s t r a t e g i e s
tabLe 11 KeY CaPitaL ProjeCtS
CountyLead agency
route roadway from to Project
Description Programmed
funds
additional funding Needed
total Cost estimate (x $1000)
Comp Year (FFY)
uS 50
Sacramento Caltrans District 3
US 50 Downtown watt avenue HOV Lanes $0 $75000 $75000 2020
Sacramento Caltrans District 3
US 50 watt avenue Sunrise Blvd HOV Lanes $165000 $0 $165000 2013
Sacramento Caltrans District 3
US 50 Bradshaw Road
Mather Field Road
Eastbound and Westbound Auxiliary Lanes
$0 $3700 $3700 2016
Sacramento Caltrans District 3
US 50 State Route 99
(Oak Park Interchange) interchange improvements including buscarpool lane
connectors $0 $150000 $150000 2014
Sacramento Caltrans District 3
US 50 interstate 5
(Riverfront Interchange) Riverfront Interchange
improvements including bus carpool lane connectors
$30000 $170000 $200000 2016
ED Caltrans District 3 US 50 Camino
Operational Safety improvements Construct an
undercrossing median barrier modify local road connections andor associated operational improvements on and adjacent
to US 50
$15000 $0 $15000 2012
ED ED County DOT US 50
west of Latrobe Road
west of Bass Lake
grade HOV Lanes (Ph1) $47141 $0 $47141 2010
ED Caltrans District 3 US 50
west of Bass Lake Road
Ponderosa Road
HOV Lanes (Ph2) $55000 $0 $55000 2011
ED Caltrans District 3 US 50 Ponderosa
Road greenstone
Road HOV Lanes (Ph3) $22357 $0 $22357 2013
ED ED County DOT US 50 Future Silva
Valley iC
Future Empire Ranch IC
Mainline Widening construct new WB lane within the
median from proposed Silva Valley IC to proposed Empire
Ranch IC
$2950 $0 $2950 2013
[ 40 ] HigHway 50 corridor system management plan
c h a p t e r s i x p l a n n e d c o r r i d o r s y s t e m m a n a g e m e n t s t r a t e g i e s
tabLe 11 KeY CaPitaL ProjeCtS (ConTInued)
CountyLead agency
route roadway from to Project
Description Programmed
funds
additional funding Needed
total Cost estimate (x $1000)
Comp Year (FFY)
PARALLEL AnD COnnECTInG ROADWAYS
ED ED County DOT
Silva Valley Parkway
Entrada Drive
Future US 50
Silva Valley Parkway iC
Widen Silva Valley Road from 2 lanes to 4 lanes includes
Class ii bike lanes and left turn storage pockets
$2921 $0 $2921 2010
ED ED County DOT
Silva Valley Parkway US 50
US50 Silva Valley Parkway (Phase 2) Includes constructshying overcrossing and ramps
signalization at EB and WB on off ramps
$57817 $0 $57817 2016
ED ED County DOT
Headington Road
Missouri Flat Road
El Dorado Road
Extend 2 lanes with median $9878 $0 $9878 2012
ED ED County DOT
Durock Road
Robin Lane South
Shingle Road
Extend 2 lanes with median $1239 $9214 $10453 2015
ED ED County DOT
Durock Road
Business Center Drive intersection signalization
includes adding turn pockets on Durock Road
$4333 $0 $4333 2009
ED City of Placerville
Point View Drive Broadway Smith Flat
Road Extend 2 lanes $1300 $0 $1300 2020
ED City of Placerville
western Placerville
US 50 interchange
Forni Road Ray Lawyer
Drive
Placerville Drive
Interchange Reconstruction convert Ray Lawyer Dr
Overcrossing to full IC Auxiliary Lanes
$5059 $34741 $39800 2020
Sacramento City of Rancho
Cordova
Mather Boulevard
Rockingham Road
Zinfandel Drive widen to 4 lanes $0 $8617 $8617 2020
Sacramento Rancho Cordova
Parkway ii
Grant Line Road
White Rock Road
New 6-lane expressway includshying intersection improvements at Kiefer Blvd amp White Rock
Road
$0 $44518 $44518 2020
Sacramento City of Folsom
Scott Road US 50 White Rock Rd
widen from 2 to 6 lanes $16000 $0 $16000 2020
Sacramento Sacramento County DOT
White Rock Road
Grant Line Rd
Prairie City Rd
Widen from 2 to 4 lanes realign near Nike and Nimbus Roads and connect with existshying alignment west of Prairie City Rd Realign Grant Line Rd to intersect with realigned
White Rock Rd
$26600 $0 $26600 2020
Sacramento Sacramento County DOT
Hazel avenue
US 50 Hazel Madison
Widen American River Bridge and approaches from 4 to 6 lanes Widen Hazel Avenue from AR Bridge to Madison from 4 to 6 lanes with Bike
LanesSignals
$83530 $0 $83530 2020
HigHway 50 corridor system management plan [ 41 ]
c h a p t e r s i x p l a n n e d c o r r i d o r s y s t e m m a n a g e m e n t s t r a t e g i e s
tabLe 11 KeY CaPitaL ProjeCtS (ConTInued)
CountyLead agency
route roadway from to Project
Description Programmed
funds
additional funding Needed
total Cost Estimate (x $1000)
Comp Year (FFY)
PARALLEL AnD COnnECTInG ROADWAYS
ED ED County DOT
green Valley Road
Salmon Falls Road
east
Deer Valley Road
widen from 2 to 4 lanes $0 $14576 $14576 2025
ED ED County DOT
green Valley Road
Deer Valley Road east Lotus Road widen $958 $4513 $5471 2015
ED ED County DOT
green Valley Road
Francisco Drive
Salmon Falls Road
widen from 2 to 4 lanes divided $412 $3491 $3903 2015
ED ED County DOT
Latrobe Road
investment Boulevard
golden Foothill Parkway
widen from 2 lanes undivided to 4 lanes
divided $1076 $8792 $9868 2015
ED ED County DOT
Latrobe Road
Carson Creek
White Rock Road
widen from 4 to 6 lanes $0 $23755 $23755 2025
ED ED County DOT
white Rock Road
EDSac County Line
Manchester Drive
widen 2 to 4 lanes divided includes signal interconnect and coorshy
dination
$0 $23755 $23755 2025
Sacramento City of Rancho
Cordova
Easton Valley
Parkway
Prairie City Road
Empire Ranch Road extenshysion south of
US 50
Construct new 4 lane road $0 $45000 $45000 2020
Sacramento Sacramento County DOT
Hazel avenue
Easton Valley
Parkway
Grant Line RoadWhite Rock Road
New road extension 4 lane limited access
through aerojet property $0 $18000 $18000 2018
Sacramento Sacramento County DOT
white Rock Road
Prairie City Road
ED County Line
widen to 4 lanes $8330 $64773 $73103 2018
Sacramento Sacramento County DOT
green Valley Road
East Natoma Sacramento ED County
line widen to 4 lanes $0 $3000 $3000 2018
Sacramento City of Rancho
Cordova
Zinfandel Drive
international Drive
Folsom Boulevard
widen to 4 lanes $0 $12000 $12000 2020
[ 42 ] HigHway 50 corridor system management plan
c h a p t e r s i x p l a n n e d c o r r i d o r s y s t e m m a n a g e m e n t s t r a t e g i e s
tabLe 11 KeY CaPitaL ProjeCtS (ConTInued)
CountyLead agency
route roadway from to Project
Description
Pro-grammed
funds
addi-tional
funding Needed
total Cost estimate (x $1000)
Comp Year (FFY)
traNSit
yolo amp Sacramento City of west Sacramento
amp City of Sacramento
Sacramento River
Crossing
15th Street in the City
of west Sacramento
Broadway in the City of
Sacramento
New all-modal river crossing (Auto Transit Bike amp Pedestrian)
from Sacramento across the Sacramento River to West
Sacramento The crossing was modeled between Broadway in Sacramento amp 15th Street in
West Sacramento but final alignshyment options will be studied in subsequent planning efforts
$800 $99200 $100000 2019
Sacramento Cal State University
Sacramento
CSUS Campus mdash mdash
Sac State Tram adjoining City streets and SRTD 65th Street light railbus transfer station Bus Rapid Transit System
$23574 $0 $23574 2013
Sacramento City of Rancho
Cordova
Rancho Cordova Various Various
New Service Rancho Cordova Pilot Transit Shuttle System new transit service for connection to
RTs Gold Line
$2380 $1500 $38880 2014
yolo amp Sacramento City of west Sacramento
TBD west
Sacramento Sacramento Streetcar Service between west
Sacramento and Downtown Sacramento
$17400 $54700 $72100 2014
Sacramento City of Rancho
Cordova RT Gold Line
RT Gold Line Tracks
Mather Field Road
Light Rail Grade Separations $0 $52888 $52888 2025
Sacramento City of Rancho
Cordova RT Gold Line
RT Gold Line Tracks Zinfandel Drive Light Rail Grade Separations $0 $52888 $52888 2025
Sacramento City of Rancho
Cordova RT Gold Line
RT Gold Line Tracks
Bradshaw Road
Light Rail Grade Separations $0 $35260 $35260 2025
Sacramento City of Rancho
Cordova RT Gold Line
RT Gold Line Tracks Routier Road Light Rail Grade Separations $0 $35260 $35260 2025
Sacramento City of
Sacramento Sacramento Valley Station
Sacramento intermodal Transportation Facility (Phase 1) - Develop intermodal transportashytion terminal for heavy rail light
rail and bus service
$77799 $0 $77799 2010
Sacramento City of
Sacramento Sacramento Valley Station
Sacramento intermodal Transportation Facility (Phase 2) - Develop intermodal transportashytion terminal for heavy rail light
rail and bus service
$24101 $1000 $25101 2014
HigHway 50 corridor system management plan [ 43 ]
c h a p t e r s i x p l a n n e d c o r r i d o r s y s t e m m a n a g e m e n t s t r a t e g i e s
TABLE 11 KEY CAPITAL PROJECTS (CONTINUED)
CountyLead Agency
Route Roadway From To Project
Description Programmed
Funds
Additional Funding Needed
Total Cost Es-timate (x $1000)
Comp Year (FFY)
BICYCLE ROUTES
Sacramento City of Rancho
Cordova
US 50Mather Field Road IC US 50 Mather
Field Road
US 50Mather Field Road PedestrianBike Crossing along
the Mather Airport RR Spur alignment
$0 $820 $1055 2015
ED ED County DOT
Sacramento Placerville
Transportation Corridor
Forni Rd
Missouri Flat Rd Class I Bike Trail $1423 $111 $1534 2009
ED City of Placerville
El Dorado Trail Western
Extension
Canal Street Main Street
Ray Lawyer DriveForni
Road Class 1 Bike Trail $1850 $0 $1850 2010
ED ED County DOT
US 50ED Hills Blvd IC US 50
El Dorado Hills Blvd
Latrobe Road
US 50El Dorado Hills Blvd Pedestrian Overcrossing $5508 $66 $5574 2014
TABLE 12 50 MOBILITY PARTNERSHIP KEY CAPITAL PROJECTS
RouteRoadway From To Project Description
NEAR TERM PRIORITY IMPROVEMENT PROJECTS
US 50 Sunrise Scott Road Auxiliary Lane
US 50 Hazel Avenue Interchange Improvements
Hazel Avenue Folsom Boulevard Easton Valley Parkway New 4 Lane Road
Easton Valley Parkway Hazel Avenue Rancho Cordova Parkway New 6 Lane Road
Rancho Cordova Parkway Easton Valley Parkway White Rock Road New 4 Lane Road
White Rock Road Sunrise Boulevard Silva Valley Parkway Widen to 4 Lanes
RT Gold Line Hazel Iron Point Station Passing Tracks
US 50 Rancho Cordova Parkway New Interchange
Zinfandel Drive South of International Douglas Road New 4 Lane Road
International Drive Kilgore Road Rancho Cordova Parkway New 6 Lane Road
Douglas Road Zinfandel Extension Sunrise Boulevard Widen to 4 Lanes
Sunrise LRT Citrus Road Sunrise Mall Bus Rapid TransitExpress Bus
[ 44 ] HIGHWAY 50 corridor system management plan
c h a p t e r s i x p l a n n e d c o r r i d o r s y s t e m m a n a g e m e n t s t r a t e g i e s
TABLE 12 50 mOBILITY PARTnERSHIP kEY CAPITAL PROjECTS (COnTInUED)
routeroadway from to Project Description
US 50 nEAR TERm PRIORITY ImPROVEmEnT PROjECTS
US 50 Empire Ranch Road New interchange
US 50 Silva Valley New interchange
US 50 Scott Road Empire Ranch Road Aux Lanes
US 50 Empire Ranch Road El Dorado Hills Boulevard Aux lanes and climbing lanes
US 50 El Dorado Hills Boulevard Silva Valley Parkway Aux lanes and climbing lanes
US 50 Silva Valley Parkway Bass Lake Road Aux lanes
Sunrise Boulevard White Rock Road Douglas Boulevard widen to 6 lanes
Sunrise Boulevard Douglas Boulevard Jackson Road widen to 4 lanes
White Rock Road Sunrise Boulevard Future Rancho Cordova Parkway and El Dorado County Line to Latrobe Road
widen to 4 lanes
Douglas Boulevard Sunrise Boulevard Grant Line Road widen to 4 lanes
Rancho Cordova Parkway Douglas Boulevard Rio del Oro Parkway New 2 lane road
Rancho Cordova Parkway Rio del Oro Parkway White Rock Road New 6 lane road
Jaeger Road Douglas Road Kiefer Boulevard New 4 lane road
Chrysanthy Sunrise Boulevard Americanos Boulevard New 4 lane road
Kiefer Boulevard Sunrise Boulevard Jaeger Road New 4 lane road
Grant Line Road Douglas Road Chrysanthy Road widen to 4 lanes
Hazel avenue Gold Country Boulevard Madison avenue widen to 6 lanes
Latrobe Road South of White Rock Road widen to 4 lanes
TABLE 13 VISIOnARY PROjECTS
County routeroadway from to Project Description
Sac yolo US 50 Enterprise Downtown Sacramento HOV Lanes
ED TBD Folsom Placerville Transit ndash Type TBD
ED New Road Latrobe Road White Rock Road (poten shy
tially US 50) New 2-lane road
HigHway 50 corridor system management plan [ 45 ]
c h a p t e r s i x p l a n n e d c o r r i d o r s y s t e m m a n a g e m e n t s t r a t e g i e s
[ 46 ] HigHway 50 corridor system management plan
Page Inte
ntionally
Left
Blank
congestion and bottleneck analysis
chapter seven
The 2000 Highway Capacity Manual defines a bottleneck
as ldquoa road element on which demand exceeds capacityrdquo
The bottleneck analysis evaluates specific causes of existshying recurrent traffic congestion in the corridor Freeway bottleneck locations that create mobility constraints are identified and documented and their relative contribution
to corridor-wide congestion is reported The bottleneck locations were determined based on a combination of the use of 2006 PeMS data HiCOMP report probe vehicle tach runs and field observations
Traffic congestion can be categorized as either recurrent
or non-recurrent
recurrent congestion occurs repeatedly at the same place and time of day in a predictable pattern Recurrent congesshytion is often associated with facility capacity limitations changes in capacity conflicting vehicle movements such
as lane merges inadequate number of transit vehicles to handle passenger loads or other persistent physical condishytions of the transportation facility
Non-recurrent congestion is usually attributed to collishysions equipment malfunction community events weather construction projects and other occasional occurrences When transportation systems are close to their maximum
carrying capacity non-recurrent congestion is more likely to occur as there is little excess capacity in the system
The location and extent of the bottlenecks on US 50 found
in the aM and PM peak periods are summarized in Tables 14 and 15 These depictions should be considered a snapshyshot view and not a comprehensive analysis of all bottleshynecks in the corridor Further work is being conducted to
refine the identification and causality of bottlenecks within
the corridor Table 14 shows a summary of the US 50 eastbound bottlenecks while the tables that follow discuss each bottleneck including location and possible causality Table 15 shows a summary of the US 50 westbound bottleshynecks while the tables that follow discuss each bottleneck including location and possible causality Minor or hidden bottlenecks are those Freeway bottleneck
that are not as defined locations that create (or severe) as the major mobility constraints bottlenecks Please note are identified and that the graphics accomshy documented and their panying the bottlenecks
relative contribution to are not to scale
corridor-wide congestion Major bottlenecks in the is reported eastbound direction during the aM peak period are at Howe avenue and during the PM peak period are at 48th Street Howe Avenue Mayhew Road Routier Road Sunrise Boulevard and El Dorado Hills Boulevard Major bottlenecks in the westbound direction during the aM peak period are at El Dorado Hills Boulevard Hazel Avenue Zinfandel Drive
HigHway 50 corridor system management plan [ 47 ]
c h a p t e r s e v e n c o n g e s t i o n a n d b o t t l e n e c k a n a l y s i s
Bradshaw Road and Howe Avenue and major bottleneck
locations during the PM peak period are at Zinfandel Drive Routier Road Bradshaw Road Howe Avenue and Intershystate 5
Causalities for these bottlenecks range from high-traffic
demand (congestion) heavy weavingmerging areas or physical constraints such as lane drops lack of ramp meters incomplete HOV network incomplete Auxiliary Lane
network poorly coordinated traffic signals and an off-ramp
queue (Sunrise Boulevard) US 50 Westbound Onramp
TABLE 14 US 50 EASTBOUnD BOTTLEnECk SUmmARY Source PeMS Caltrans tach runs and
Cambridge Systematics field observations
bottleneck Location PeMS Speed Contours Caltrans Probe Vehicle Runs
Cause aM PM aM PM
A Jefferson Blvd PM 25 Minor Minor Traffic weaving truck volumes and grade
B 48th St PM 7 Minor Major Minor Minor Merge from SR 51 and SR 99
C Howe ave PM 9 Major Major Major weave between Howe and watt
D Mayhew Rd PM 12 Major Minor Major Weaving before Bradshaw Exit
E Routier Rd PM 14 Minor Major Weaving before Mather Field Rd Exit
F Sunrise Blvd PM 185 Minor Major Lane drop HOV add off-ramp queue
G Folsom Blvd PM 22 Minor Minor Lane drop 4 to 3
H El Dorado Hills Blvd PM 275 Major
Poorly coordinated traffic signal on arterial causes spillback onto freeway
a jefferson blvd bottleneck The bottleneck approximately located at Jefferson Blvd is due to weaving traffic as those entershying the freeway from Jefferson Blvd must cross those attempting to exit the freeway to I 5 There is a large number of trucks in the stream which struggle with the grade at this location exacerbatshying the bottleneck
[ 48 ] HigHway 50 corridor system management plan
c h a p t e r s e v e n c o n g e s t i o n a n d b o t t l e n e c k a n a l y s i s
b 48th St bottleneck The bottleneck approximately located at 48th St is due to the additional traffic merging from SR 51 and SR 99 combined with the eventual lane drop at 59th St This queue extends upstream past the off-ramp to SR 5199 These off-ramps are bottlenecks in themselves which spill back and choke the US 50 mainline
C Howe Ave Bottleneck The bottleneck at Howe ave is due to the entering traffic from Howe Ave Two Howe Ave on-ramps feed into US 50 eastbound southbound Howe ave loop on-ramp and northbound Howe ave direct ramp approximately 300 feet apart The watt avenue off-ramp is just down stream with heavy exiting volumes therefore the segment between Howe and watt is characterized by heavy weaving
D mayhew Rd Bottleneck The bottleneck approximately located at Mayhew Rd most likely begins with the additional traffic entering from Watt Ave and ends with the exiting traffic at Bradshaw Rd It is possible that there is a high proportion of weaving traffic with in this section (Watt Ave traffic moving to the left lane and those exiting at Bradshaw Rd moving to the right lane)
HigHway 50 corridor system management plan [ 49 ]
c h a p t e r s e v e n c o n g e s t i o n a n d b o t t l e n e c k a n a l y s i s
[ 50 ] HigHway 50 corridor system management plan
e routier rd bottleneck It is likely that the bottleneck at Routier Rd is due to the same merging conditions associated with Mayhew Rd The area is comprised of both residential and light industrialoffice land uses therefore during the PM peak period there are large volumes of vehicles entering at Bradshaw Rd moving to the left lanes and large volumes of vehicles moving to the right lane to exit at Mather Field Rd
f Sunrise blvd bottleneck At Sunrise Blvd the right-most lane exits while an HOV lane is added as the median lane The bottleneck is formed from vehicles shifting left to avoid exiting at Sunrise Blvd and to enter the HOV lane There is a large volume of vehicles queued at the Sunrise off-ramp which spills back and negatively affects the US 50 mainline
g folsom blvd bottleneck The right-most lane exits to Folsom Blvd leaving one HOV lane and two regular lanes along the US 50 The bottleneck is caused by this lane drop as well as the quick merge at the Folsom on-ramp
c h a p t e r s e v e n c o n g e s t i o n a n d b o t t l e n e c k a n a l y s i s
H The eastbound US 50 at El Dorado Hills Blvd Bottleneck The eastbound El Dorado Hills Blvd bottleneck is caused by a traffic signal on the arterial that often causes spillbacks on the EB loop offramp onto the freeway mainlines
TABLE 15 US 50 WESTBOUnD BOTTLEnECk SUmmARY Source PeMS Caltrans tach runs and Cambridge Systematics field observations
bottleneck Location PeMS Speed Contours Caltrans Probe Vehicle Runs
Cause aM PM aM PM
A El Dorado Hills Blvd PM 275 Major Poorly coordinated traffic
signal on El Dorado Hills Blvd
B Hazel Ave PM 21 Major Entering traffic
C Zinfandel Dr PM 16 Minor Major Major Major Entering traffic
D Routier Rd PM 14 Minor Major Minor Weaving traffic
E Bradshaw PM 13 Major Major Major Merging traffic and curve
F Howe Ave PM 9 Minor Major Major Major Weaving traffic and grade
G SR 51SR 99 PM 6 Minor Lane drop weaving traffic
H i-5 PM 3 Major Weaving traffic
HigHway 50 corridor system management plan [ 51 ]
c h a p t e r s e v e n c o n g e s t i o n a n d b o t t l e n e c k a n a l y s i s
[ 52 ] HigHway 50 corridor system management plan
A El Dorado Hills Blvd Bottleneck The minor bottleneck at El Dorado Hills Boulevard is caused by the traffic signal on El Dorado Hills Blvd that causes spillback on the westbound offramp onto the freeway mainlines
B Hazel Avenue Bottleneck In 2006 the Hazel Ave Bottleneck is caused by the traffic entering at both Hazel Ave and Folsom Blvd (the two on-ramps are separated by about one mile) The bottleneck that would appear at Folsom Blvd combines with the bottleneck at Hazel ave to form a large bottleneck that does not clear until after Hazel ave Sometimes causshying spillbacks as far as Prairies City Road this bottleneck was mitigated in 2007 as part of the GO CALIFORNIA program
C Zinfandel Dr Bottleneck There is heavy traffic coming from Sunrise Blvd but the lane addition immediately after the westbound on-ramp prevents a bottleneck from forming but as traffic flows westward the heavy traffic entering from Zinfandel Dr causes a bottleshyneck here
D Routier Rd Bottleneck The bottleneck at Routier Rd is caused by weaving traffic between Mather Field Rd and Bradshaw Rd This highway segment represents a transition area where vehicles that have been traveling in the left lanes begin to shift to the right lanes to exit while the entering traffic tries to shift to the left lanes
W eav in gLan e Dr o p
c h a p t e r s e v e n c o n g e s t i o n a n d b o t t l e n e c k a n a l y s i s
e bradshaw rd bottleneck The Bradshaw Rd bottleneck is caused by the entering traffic from Bradshaw Road the high truck volumes and the curve west of Bradshaw Two Bradshaw Rd on-ramps feed into US 50 westshybound southbound Bradshaw Rd direct on-ramp and northbound Bradshaw Rd loop on-ramp approximately 400 feet apart
F Howe Ave Bottleneck The Howe ave bottleneck is caused by a grade change and the weaving traffic entering from Howe ave and Hornet Dr competing for the right-most lane with those wanting to exit at 65th Street
G amp H SR 51SR 99 amp I-5 Bottleneck The bottleneck at I 5 is caused by the conflict between entering SR 99 and SR 51 traffic and exiting I-5 traffic as well as the queues formed on the ramps to i-5 which spill back onto US 50 The number of lanes in this section reaches a maximum of 6 and then drops to 4 as two lanes exit at the I-5 freeway This bottleneck is exacershybated during the peak periods when it stretches upstream to the lane drop before SR 99
W ea v in g
Lan e Dr o p
HigHway 50 corridor system management plan [ 53 ]
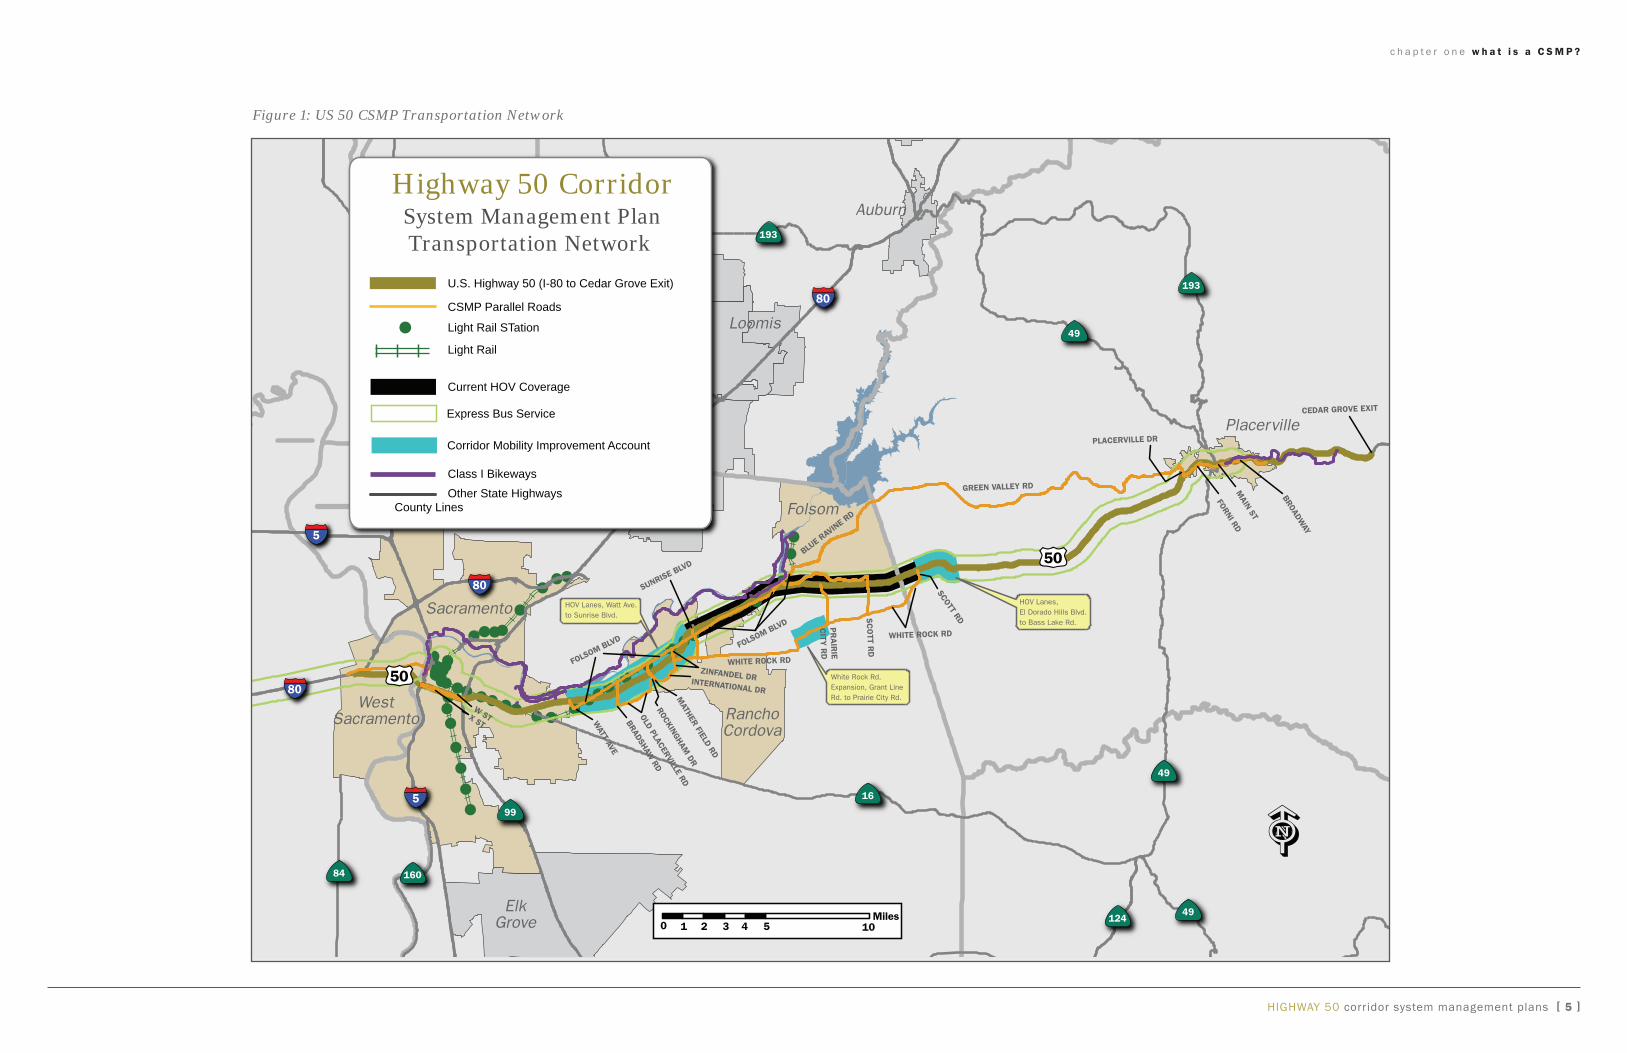
c h a p t e r o n e w h a t i s a C S M P
Table 1 US 50 CSMP TranSPorTaTion neTwork (ConTinUed)
location US 50 ParallelConnecting roadways Mass Transit bike routes
Heavy rail and light rail bus
route From To County City From To roadway From To operator
Services From To operator
Services From To
Sacramento
UnincorporatedCity of Folsom
Sunrise Boulevard
Folsom Boulevard
iron Point Road Folsom Boulevard East BidwellScott Road
RT Downtown Sacramento Folsom
iron Point Road Folsom Boulevard Empire Ranch
Scott Road iron Point Road white Rock Road Blue Ravine Road
Folsom Boulevard
green Valley Road
Sacramento Folsom Boulevard
Sacramento El Dorado
County Line
Folsom Boulevard iron Point Road Blue Ravine Road
green Valley Road
SacramentoEl Dorado County
Line
Cameron Park Drive
Blue Ravine Road Folsom Boulevard green Valley Road
Prairie City Road US 50 white Rock Road ED County Transit
authority-iron Point Connector
iron Point Light Rail Station
Missouri Flat Transfer
Center white Rock Road EDSac County Line
Sacramento El Dorado County Line
El Dorado Na Sacramento
El Dorado County Line
Cameron Park Drive
green Valley Road Blue Ravine Road Cameron Park Drive
ED County Transit
authority-Sacramento Commuter
El Dorado County
Sac County
green Valley Road
Cameron Park Drive
Placerville Drive
white Rock Road EDSac County Line Latrobe Road
white Rock Road Latrobe Road Silva Valley Parkway
Silva Valley Parkway white Rock Road Serrano Parkway
El Dorado Na Cameron Park Drive
Missouri Flat Road
green Valley Road Cameron Park Drive Missouri Flat Road
ED County Transit
authority
Cambridge Road
Missouri Flat Road
Ray Lawyer Drive
Placerville Drive Forni Road
Durock Road Cameron Park Drive South Shingle Road
Cameron Park Drive Durock Road US 50
Forni Road Ray Lawyer Drive Forni Road
South Shingle Road Durock Road US 50
El Dorado Na Missouri Flat Road
End of Freeway in Placerville
green Valley Road Missouri Flat Road Placerville Drive
ED County Transit
authority
Missouri Flat Road
Placerville Drive
Main Street Forni Road Clay Street Forni Road Placerville Drive Main Street
Placerville Drive Forni Road US 50
El Dorado Placerville End of Freeway in Placerville
Bedford avenue Start of
Freeway Main Street Placerville Drive Bedford avenue
ED County Transit
authority
Placerville Drive SR 49 ED Bike Trail Clay Street Los Trampas
Road
El Dorado Na Bedford
avenue Start of Freeway
Cedar grove Exit
Main Street Bedford avenue Broadway amtrak
Thruway Bus
Mosquito Road
Placerville
401 i St Sac CaCarson
City Ca Broadway Main Street Point View Drive
HigHway 50 corridor system management plans [ 7 ]
WHITE ROCK RD
c h a p t e r o n e w h a t i s a C S M P
Figure 2 CSMP Corridors in District 3
Corridor System Management Plan
Corridors in District 3 Interstate 80 I-80 between SR 113 and Sierra College Boulevard SR 51 between Highway 50SR 99 and I-8020
Highway 5053 Between I-80 and Cedar Grove Exit
Interstate 5 amp State Route 99 I-5 between Hood-Franklin Rd and State Route 113 SR 99 between San Joaquin County Line and Highway 50 SR 99 between I-5 and SR 20
State Route 99 North29 Between Southgate and Esplanade (in Chico area see inset)
State Route 49 Between I-80 and SR 20
State Route 65 Between I-80 and SR 70
CMIA and State Route 99 Bond Projects
20
Colusa
20
Yuba City Marysville
Grass Valley
La Barr Meadows Widening Project
49 80
Widen to 4 Lanes SR 70 to Feather River Bridge
99
70 Wheatland
65
113 Lincoln Bypass
5
Construct Interchange Operations Improvements Placerville at Elverta Rd HOV Lanes El Dorado
Hills Blvd to Bass Lake Rd
80 Folsom Woodland Rancho 50
Auburn Lincoln
Construct Interchange at Riego Rd Rocklin 49
99 Roseville Roseville Capacity and
Cordova 113 49 505 Sacramento 51
99 Chico Add Auxiliary Lanes
SR 32 to 1st Ave
32 Davis 80
West Sacramento
5
HOV Lanes Watt Ave to Sunrise Blvd
Operational Improvements Mack Rd to Florin Rd
White Rock Rd Expansion Grant Line Rd to Prairie City rd
29 221
113
99
0 105 2 3 4 5 Miles
Galt 0 5 10 15 20
Miles
HigHway 50 corridor system management plans [ 8 ]
need purpose goal and objectives
chapter two
There is a need for a planning approach that brings facility operations and transportation service provision together with capital projects into one coordinated system manageshyment strategy that focuses on high demand travel corridors such as US 50
a CSMP is needed for the US 50 corridor to address severe traffic congestion that often exceeds the capacity of existshying facilities transit ridership demands that exceed the
capacity of the transit system and bicycle facilities that do not provide a fully linked network of bike routes
The purpose of the CSMP is to create a partnership planshyning process that focuses on system management strateshygies and coordinated capital investments so that all the pieces of the corridor function as an efficient transportashytion system and performance evaluation measures are implemented to track the effectiveness of strategies and projects
the CSMP directly supports the implementation of the
three CMia projects on the corridor
bull High Occupancy Vehicle (HOV) Lanes on US 50 from Watt avenue to Sunrise boulevard
bull White Rock Road Expansion from Grant Line Road to Prairie City road
bull HOV Lanes on US 50 from El Dorado Hills Boulevard to bass Lake road
The goal of the CSMP is to improve mobility along the US 50 corridor by focusing on the integrated management of a
subset of the entire transporta- The CSMP directly tion network within the corshy supports the ridor including select freeway implementation and parallel roadways transit
of the three CMIA and bicycle components of the
projects in thecorridor corridor
The objectives of the CSMP are to reduce travel time or delay on all modes improve
connectivity between modes and facilities improve travel
time reliability improve safety on the transportation system and expand mobility options along the corridor in a cost effective manner implementation of the CSMP will increase access to jobs housing and commerce
consistency with other state transportation plans anD policies The CSMP approach is consistent with the goals and objectives of the governorrsquos Strategic Growth Plan which among other things commits to minimizing increases in traffic congestion Key elements of the strategy are illusshytrated in Figure 3
at the base of the pyramid and the foundation of transshyportation system management is system monitoring and evaluation it is essential to understand what is happening on the transportation system so that the best decisions can be made based on reliable data The next few layers up
the pyramid are focused on making the best use of existing
resources and reducing the demand for transportation
HigHway 50 corridor system management plan [ 9 ]
c h a p t e r t w o n e e d p u r p o s e g o a l a n d o b j e c t i v e s
[ 10 ] HigHway 50 corridor system management plan
particularly during peak travel hours The top layer of the pyramid is system expansion This layer assumes that all the underlying components are being addressed and that system capacity expansion investments are necessary
Corridor system management is consistent with the Caltrans Mission
Improve Mobility Across California Corridor system management is consistent with Caltransrsquo goals
bull SafetY Provide the safest transportation system in the nation for users and workers
bull MobiLitY Maximize transportation system performance and accessibility
bull DELIVERY Efficiently deliver quality transportation projshyects and services
bull STEWARDSHIP Preserve and enhance Californiarsquos resources and assets
bull SERVICE Promote quality service through an excellent workforce
The CSMP is also consistent with the California Transportashytion Plan (CTP) the statewide long-range transportation
plan for meeting future mobility needs The CTP defines
goals policies and strategies to achieve our collective vishysion for Californiarsquos future transportation system
Figure 3 Strategic Growth Plan StrategyAir
Quality Planning Corridor System Management seeks to create conditions where vehicle flow on highways and roads occurs at a
steady pace and travelers have a range of mobility options that enable them to travel other than by single occupant vehicle System expansion is focused only where needed
when travel demand exceeds the capacity of the well manshyaged existing system These conditions are beneficial to
attaining air quality goals and reducing green house gas emissions
current corridor system management strategies
chapter three
US 50 is a transcontinental highway that originates in west Sacramento California and terminates in Ocean City Maryland it is a key transportation artery connecting yolo County Sacramento County and fast growing sub regions within Sacramento and El Dorado Counties
The corridor provides access to world renowned recreation areas in the Sierra Nevada Mountains and Lake Tahoe
Basin Peak commute and recreational travel periods are
heavily congested with demand for travel often exceedshying the capacity of existing facilities and services Severe
traffic congestion is common and commute transit services
often operate at maximum ridership capacity There is
extensive and expanding urban development along many parts of the corridor which suggests increased future transportation demand
Given the complexity of the corridor and its extensive geoshygraphic range there are a wide variety of system manageshyment strategies and elements currently being implemented by jurisdictions and transportation service providers Strategies and elements range from vehicle detection deshyvices to traveler information systems to traffic flow control mechanisms a common element among all the strategies and elements is data collection and analysis There is presshyently some system management coordination and intershyjurisdictional partnerships among the entities such as the Sacramento Transportation Area Network (STARNET)
The STARNET web application initial release is anticipated
for the late fall of 2009 Features to be included in the
initial release will include Changeable Message Sign (CMS) display a chain control application integration of Regional Transit data California Highway Patrol incident data connectivity to the 511 systems (web and telephone) Closed Circuit Television (CCTV) display and interagency messaging and coordination [Caltrans Transportation Management Center (TMC) Kingvale Operation Center City of Sacramento Traffic Operation Center (TOC) Sacramento
County TOC Roseville TOC and Elk Grove TOC] STARNETrsquos
associated management There are a widestrategies can and will variety of systemevolve as the application is
implemented throughout management
the region and as addi- strategies and tional features are added elements currently in annual releases being implemented
by jurisdictions and state highway sys-
tem transportation service
providerswith the construction of Californiarsquos state highshyway system virtually complete in the Sacramento region Caltransrsquo major emphasis on highway projects has largely shifted from new construction to focused capacity expanshysions reconstruction operation and maintenance of existshying facilities
The State Highway System has an extensive set of system
management strategies in operation Some cities coun-
HigHway 50 corridor system management plan [ 11 ]
c h a p t e r t h r e e c u r r e n t c o r r i d o r s y s t e m m a n a g e m e n t s t r a t e g i e s
tabLe 2 exiStiNg uS 50 toS eLeMeNtS
County Location PM toS elements
tMS rM HAR rWiS CMS eMS VS CCTV WiM
yolo i-80 to yoloSaC County Line
000 - 316 4 ndash ndash 1 1 ndash ndash 2 2
SaC
YoloSAC County Line to SR99 SR51
L000 - L248 R000
8 7 ndash ndash 3 ndash ndash 7 ndash
SR99SR51 ndash Watt Avenue R000 ndash R534 5 8 ndash ndash 1 1 ndash 3 ndash
watt avenue to Zinfandel Drive R534 ndash R1092 8 7 1 ndash ndash 2 ndash ndash ndash
Zinfandel Drive to Sunrise Blvd R1092 ndash 1250 1 4 ndash ndash ndash 1 ndash ndash ndash
Sunrise Blvd to Folsom Blvd 1250 ndash 1701 4 6 ndash ndash ndash ndash ndash 2 ndash
Folsom Blvd to SACED County Line
1701 ndash 2314 2 8 ndash ndash 1 ndash 1 ndash ndash
ED
SACED County Line to Cameron Park Dr 000 ndash R657 5 ndash ndash ndash 1 ndash 2 ndash ndash
Cameron Park Dr to Missouri Flat Rd R657 ndash R1506 7 ndash ndash ndash ndash ndash ndash ndash ndash
Missouri Flat Rd to End of Freeway R1506 ndash 1725 1 ndash ndash ndash ndash 1 ndash ndash ndash
ED End of Freeway to Bedford Ave 1725 ndash 1811 ndash ndash 1 ndash ndash ndash ndash ndash ndash
ED Bedford Ave to Cedar Grove Rd 1811 ndash R2595 ndash ndash ndash ndash 1 1 ndash ndash ndash
totaL 45 40 2 1 8 6 3 14 2
Notes PM = Post Mile TMS = Traffic Monitoring Station RM = Ramp Meter HAR = Highway Advisory Radio RWIS = Roadside Weather Information System CMS = Changeable Message Sign EMS = Extinguishable Message Sign VS = Visibility Sensor CCTV = Closed Circuit Television System WIM = weigh in Motion Existing TOS Elements as of April 2009
ties and transit operators also have robust system manshyagement elements and programs applied to their facilities or services
There are also specific instances of system management linkages among transportation modes and services at particular locations
Existing management strategies are depicted on Figure 4
and summarized in Table 2
US 50 BusCarpool Lanes in El Dorado County
[ 12 ] HigHway 50 corridor system management plan
c h a p t e r t h r e e c u r r e n t c o r r i d o r s y s t e m m a n a g e m e n t s t r a t e g i e s
These strategies work as a system to gather analyze and disseminate information through the Caltrans TMC inforshymation about collisions other incidents road closures and emergency notifications are fed into this information hub
and disseminated to public and private information users The TMC operates 24 hours a day seven days a week
parallel anD connecting roaDways City of West Sacramento has one CCTV located on west Capitol Avenue between Enterprise Boulevard and Capitol Mall
City of Sacramento operates a TOC Sensors in the street detect the passage of vehicles vehicle speed and the level of congestion
This information is received on a second-by-second (real-time) basis and is analyzed at the TOC
Sacramento County also operates a TOC by gathering information through CCTV cameras CMS HAR and a Fiber Optics (FO) network placed along major traffic
corridors throughout the county
City of rancho Cordova will be installing CCTV cameras and a FO network on Folsom Boulevard in 2009 Currently one CCTV exists on Sunrise Boulevard
between US 50 and Folsom Boulevard Most major traffic corridors are on the network or will be by the end of 2009 The City contracts with the County of Sacramento to operate their systems through the Countyrsquos TOC
City of folsom recently completed installing a FO system
Changeable Message Sign on US 50 at Scott Road
on all of the Cityrsquos major corridors Currently the sole intersection that is monitored via camera is located on iron Point Road and East Bidwell
El Dorado County has three coordinated signals along Francisco Drive at Green Valley Road the Market Place
entrance (east side Safeway Centerwest side Lake
Forest Plaza) and Village Center Drive
City of Placerville utilizes traditional control devices traffic signals and stop signs
transit anD riDesharing Yolo County Transit District (YCTD) uses a Global Positionshying System (GPS) for locating buses in route referred to as
an Automatic Vehicle Location (AVL) system
The AVL System allows users to see where their bus is
located within the last minute
El Dorado Transit Authority utilizes the gPS Zonar System for pre-trip inspections maintenance and real-time vehicle tracking
Sacramento Regional Transit District (SacRT) has in shystalled pre-emptive traffic signals at at-grade intersections
along the Light Rail routes SacRT has a GPS however it is only utilized for analysis purposes
Computer-aided dispatch and Bus Rapid Transit are in
the planning stages In addition SacRT has an online Trip
Planning application to assist transit users During special events such as the California State Fair the Jazz Festival
65th Street Light Rail Station and Transit Oriented Development
HigHway 50 corridor system management plan [ 13 ]
c h a p t e r t h r e e c u r r e n t c o r r i d o r s y s t e m m a n a g e m e n t s t r a t e g i e s
TABLE 3 PARk AnD RIDE LOTS
County Post Mile Facility name Description
Lot use transit Connection
Spaces Spaces occupied
occupancy Rate () Provider and route No
SaC 70 Butterfield Sacramento Regional Transit Gold Line Station
406 129 318 SacRT SacRT LRT Gold Line
SaC 125 Sunrise Sacramento Regional Transit Gold Line Station
487 389 799 RSacRT SacRT LRT Gold Line
SaC 158 Hazel 432 135 306 SacRT SacRT LRT Gold Line
SaC 158 Hazel 33 6 24 SacRT Route 109
SaC 171 Folsom Boulevard 70 58 829 ED Iron Point Connector SacRT LRT Gold Line
ED 2 El Dorado Hills (Latrobe RoadWhite Rock Road) 123 138 1122 ED Iron Point Connector ED Routes
156781112
ED 5 Cambridge Road 59 40 678 ED Iron Point Connector ED Routes 14567891112
ED 86 Ponderosa Road Northeast 28 15 536 ED Iron Point Connector ED Routes 23679101112
ED 86 Ponderosa Road Northwest 111 61 55 ED Iron Point Connector ED Routes 23679101112
ED 86 Durock Road 57 21 368 Na
ED 149 Shingle Springs Drive 19 4 211 Na
ED 122 Greenstone Road 21 4 19 Na
ED 15 Missouri Flat Road 73 44 603 ED Iron Point Connector
ED 158 Fairgrounds Park-and-Ride 200 40 20 ED Iron Point Connector
ED 185 Placerville Station (Mosquito Park- and-Ride) 130 50 385 ED Iron Point Connector
ED Commuter Service
ED 233 Camino Heights 24 1 42 Na
SacRT = Sacramento Regional Transit District ED = El Dorado County Transit Authority Lrt = Light rail train
Survey 2007
the holiday seasons and the Mather Field Air Show SacRT
operates additional service to connect events to light rail stations and offer free service to promote transit use durshying select events The transit routes identified in the CSMP
network are shown in Figure 5
The Sacramento Valley Station in downtown Sacramento is
the 7th busiest station in the national amtrak system and serves as a multi-modal transfer facility There are over 11 million passenger trips annually
Passengers can make connections with numerous local bus services as well as the SacRT light rail system
[ 14 ] HigHway 50 corridor system management plan
c h a p t e r t h r e e c u r r e n t c o r r i d o r s y s t e m m a n a g e m e n t s t r a t e g i e s
Try Transit Changeable Message Sign in Sacramento County
Sacramento County installed pre-emptive traffic signals to give preferential signal timing to transit buses at selected locations that serve high priority transit corridors
SACOG manages the 511 and rideshare programs that cost approximately $1 million per year region-wide to foster carpooling transit ridership vanpooling and bicycling in all areas and corridors The Regional Rideshare Program covers Placer El Dorado Sacramento yolo yuba and Sut-ter counties it is part of a statewide network of rideshare agencies which encourage alternative transportation modes for traveling
Park and Ride lots are located adjacent to or nearby the US 50 corridor utilized by commuters to connect with transit vanpool or carpool Of the sixteen lots many are adjacent to the SacRT Light Rail gold Line providing access for commuters to park their vehicles and commute the re-mainder of their trip via Light Rail El Dorado County Transit authority also uses the park and ride lots as transit stops for their Commuter Buses The locations capacity and occupancy rates of the Park and Ride lots are displayed in Table 3
Bicycle Facilities Bicycle facilities in the corridor are not actively managed in the same manner as motor vehicle facilities
However there are traffic operation systems that serve bicyclists such as dedicated bicycle lanes bicycle detec-tion loops at signalized intersections video detection other non-loop type detection and bicyclist activated signal change buttons The City of Sacramento is installing video detection at some locations
SacRT buses and the new light rail trains are equipped with bicycle racks There are over 170 weatherproof bicycle lock-ers at 23 light rail stations yCTD has the Bikes on Buses Program that allows bicycles to travel on any yOLOBUS
The Sacramento area Bicycle advocates maintain an on-line hazard reporting system to allow users to report hazardous locations for bicyclist such as potholes inad-equate signal timing hazardous railroad crossings insuf-ficient shoulder and inadequate bikeway markings The reports are then sent to the applicable jurisdiction SaCOg is creating an on-line route planning system for bicyclists in addition SaCOg maintains bicycle maps on their website which are currently being updated
The bicycle routes included in the CSMP network are shown on Figures 6 and 7
Pedestrian Facilities Pedestrian facilities are not included as part of the man-aged network because they do not directly provide corridor mobility However complete and safe pedestrian access to appropriate corridor modes such as bike routes and transit services is an important component of corridor system management Therefore subsequent updates of the CSMP will seek to identify key pedestrian facilities and barriers to pedestrian mobility with regard to access and modal con-nectivity
HigHway 50 corridor system management plan [ 15 ]
c h a p t e r t h r e e c u r r e n t c o r r i d o r s y s t e m m a n a g e m e n t s t r a t e g i e s
[ 16 ] HigHway 50 corridor system management plan
Page Inte
ntionally
Left
Blank
MAIN ST
MA
RB
LE V
ALL
EY
RD
65TH ST EXPY
FLYING
C R
D
STATE
HW
Y 16
MA
RB
LE VA
LLEY R
D
CAM
BRID
GE R
D
GREEN VALLEY RD
RIV
ERSI
DE
BLVD
11T
H S
T
RIV
ERSI
DE
BLVD
HO
WE
AV
E
EL DORADO
HILLS BLVD
EL DORADO H
ILLS BLV
D
HORNET DR
JEFF
ERSO
N BL
VD
CAM
ERO
N PAR
K DR
PO
WE
R IN
N R
D
CO
UN
TY HW
Y E3
BRADSHAW RD
MATHER FIELD RD
ZINFAN
DEL D
R
11TH
ST
VD
FOLSOM BLFOLSOM BLVD
FOLSOM BLVD
FOLSO
M BLVD
WHITE ROCK RD
FOLSOM BLVD
FOLS
OM
BLV
D
LATRO
BE RD
CANAL ST
16TH
ST
JACQ
UIER
RD
15TH
ST
HARBOR BLV
D
STOCKTON BLVD
FORNI RD BIDW
ELL DR
WATT AVE
PLACERVILLE DR
TOW
ER G
ATEW
AY
SHIN
GLE SPR
ING
S DR G
REEN
STON
E RD
59TH
ST
SUN
RISE BLVD
EL D
OR
AD
O R
D
HAZEL AVE
SOUT
H RI
VER
RD
PON
DER
OSA R
D
SHIN
GLE SPR
ING
S RD
SHIN
GLE
SPR
ING
S R
D
CARSON RD
MISSO
URI FLAT RD
BASS LAKE RD
N SH
ING
LE RD
PRAIR
IE CITY R
D
S SHIN
GLE R
D
SHIN
GLE
RD
SCOTT RD
W S
T AT
5TH
ST
65TH
ST
5TH
ST
X
ST A
T 27
TH
80
CEDAR GROVE EXIT
MO
SQU
ITO R
D
PLACERVILLE DRMISSOURI
FLAT RD
FORNIRD
EL D
OR
AD
OR
D
POIN
T VIEW D
RSM
ITH FLAT R
D
SCH
NELL SC
HO
OL R
D
MO
NTER
EY RD
c h a p t e r t h r e e c u r r e n t c o r r i d o r s y s t e m m a n a g e m e n t s t r a t e g i e s
Figure 4 Existing Traffic Operations Systems Elements
Highway 50 Corridor Systems Management Plan Existing Traffic Operations Systems Excluding Ramp Meters
TOS ndash Traffic Operations Systems
Stations Continuous Coverage
EMS ndash Extinguishable Message Sign WIM ndash Weigh-in-Motion Location (EMS Usually Refers Motorist to HAR)
Television System
19365TMS ndash Traffic Monitoring99 US Highway 50VS ndash Fog (Visibility) Sensor
CCTV ndash Closed Circuit
I-80 to Cedar Grove Exit HAR ndash Highway Advisory Radio Local Road Interchange Access
White Rock RdRWIS ndash Roadside WeatherCMS ndash Changeable Sunrise Blvd to Latrobe Rd
Message Sign Information System
50
80
51
49 160
50
Placerville to Cedar Grove Exit
50
1935
16 49
99
84 160
49 MilesMiles 0 1 2 3 4 50 1 2 3 4 5 10
HigHway 50 corridor system management plans [ 17 ]
124 49
MOTHER LODE DR
MATHER FIELD RD
West Terminus
RAMP
RAMP
RAMPRAMP
RAM
P
RAMP
RAM
P RAMP
RAMPRAMP
RA
MP
RAM
P RAM
P
RAMP
RAM
P
RAM
P
RA
MP
RAM
P
RAM
P
YoloBus Express Routes Plus Routes 42A and 42B
RAMPBROADWAY
65TH
ST
PCE
65
SCRY42A
Y44Y4343
242 IPC
5
W STX ST
WATT AVE
MAROCKINGHAM
DR
OLD PLACER
BRADSHAW RD
VILLE RDTHER FIELD RD
INTERNATIONAL DR
ZINFANDEL DR
WHITE ROCK RD FOLSOM BLVD FOLSOM BLVD
SUNRISE BLVD
BLUE R
AVIN
E RD
WHITE ROCK RD
SC
OTT R
D
PR
AIR
IEC
ITY R
D
LATROBE RD
GREEN V ALLEY RD
PLACERVILLE DR
FORNI RDM
AIN ST
BROADWAY
CEDAR GROVE EXIT
WEST
CAPTOL AVE
(WESTMOST
STOP)
(WESTMOST STOP)
SCR
SCR
IPC
IPC
c h a p t e r t h r e e c u r r e n t c o r r i d o r s y s t e m m a n a g e m e n t s t r a t e g i e s
Figure 5 US 50 CSMP Network Transit Routes
Highway 50 Corridor System Management Plan 80
CSMP Commuter Transit Network
El Dorado County Transit Authority 65
IPC Iron Point Connector
SCR Sacramento Commuter Route 193
Sacramento Regional Transit District 109ndashHazel Express
Yolo Bus (Express) Y43 Y44 Y230 Y231 and Y232
Yolo Bus (All-Day Intercity amp Airport Service) Y42A (Clockwise) Y42B (Counter-clockwise)
LATROBE RD
Park-and-Ride Lots
193 65
49 US Highway 50 (I-80 to Cedar Grove Exit)
Parallel Roads
Light Rail STation
Light Rail
Class I Bikeways Other State Highways
County Lines
80
49
50
80160
50
5 84 16
4999
Miles 0 5 10160
HigHway 50 corridor system management plans [ 18 ]
K
5
FOLSOM BIKE TRAIL
SEE CENTRAL CITY BICYCLENETWORK MAP FOR BICYCLE
F ACILITY NAMES
AMERICAN RIVER PARKWAY TRAIL SYSTEM
(INCLUDING JE
DEDIAH SMITH MEMORIAL T
RAIL)
FOLSOM BLVD
WHITE ROCK RDSIL V A V ALLEY PKWY
EL D
OR
AD
O H
ILLS B
L VD
GREEN VALLEY RD
AMERICAN R
IVER PARKWAY
TRAIL
SYSTEM
(INCLU
DING JE
DEDIAH SMITH
MEMORIA
L TRAIL)
NATOMA ST
FOLSOM BLVD
EL DORADO TRAIL
CARSON RD
PLACER VILLE RD
RAY
LAW
YER
DR
c h a p t e r t h r e e c u r r e n t c o r r i d o r s y s t e m m a n a g e m e n t s t r a t e g i e s
Figure 6 US 50 CSMP Network Bicycle Routes
Highway 50 Corridor System Management Plan
Bicycle Route Network
Class I Bicycle Facilities
Class II Bicycle Facilities
193
Lincoln
65
Rocklin
Auburn
Folsom 49
193
Light Rail Stations
Light Rail Loomis50
RosevilleUS Highway 50 CSMP Corridor
Other State Highways Miles
County Lines 0 1 2 3
99
49 80
50
160 80 193
Placerville 50
West Rancho 50 Sacramento Cordova
5 0 49
8 4
9 9 Sacramento
1 6 4 9
0 1 2 Miles
3
1 6 0 Elk Grove 210 210 44 66 88
Miles 10 Miles
10 1 2 4
4 9
HigHway 50 corridor system management plans [ 19 ]
13TH
ST
H ST E ST BELVEDERE AVE
51ST
ST
BROADWAY H ST
48TH
ST
11TH
ST
PO
WE
R IN
N R
D
28TH
ST
STOC
KTON
BLVD3R
D ST
ALH
AMBR
AFR
ON
T BLV
D S
T
W CAPITOL A VE
DISCOVER Y
P ARK BRIDGE
JEDED
IAH
N ST
T ST
K ST
11TH
ST
RIV
ERSI
DE
BLV
D
18TH
ST
R S
T17
TH S
TO
ST
18TH
ST
20TH ST
CAPITOL AVE
T ST
28TH
ST
34TH
ST
39TH
ST
M ST
BROADWAY
T ST
FOLSOM BLVD
58TH
ST
J ST
65TH
ST
CSU
S
CO
NN
ECTIO
NS
SR 16JACKSON HWY
FOLSOM BLVD
LA RIVIERA DR
W ATT AV
E
HO
WE A
VE
GUY W
EST B
RIDE
COLLEGE TOWN DR
c h a p t e r t h r e e c u r r e n t c o r r i d o r s y s t e m m a n a g e m e n t s t r a t e g i e s
Figure 7 US 50 CSMP Network Bicycle Routes (Sacramento Insert)
5 Sacramento
8 0
8 0
160
West Sacramento
80
SMITH MEMORIAL TRAIL
50
US Highway 50 Corridor System Management Plan 50
Central City Bicycle Route Network 50
Bikeway and Multi-Use Network
US Highway 50 (I-80 to Cedar Grove Exit)
Class I Bicycle Facilities
Class II Bicycle Facilities
Connecting Routesndashno Bicycle Designation
80 16 5
BROADWAY
FLOR
IN-P
ER
KIN
S R
D
Light Rail STation 99
Light Rail
Other State Highways
County Lines
HigHway 50 corridor system management plans [ 20 ]
major corridor mobility challenges
chapter four
High demand for mobility services especially during peak commute periods is creating significant traffic congestion
and impairing mobility in the corridor Heavy congestion and stop-and-go traffic contributes to increased vehicle
emissions and added travel costs Many transit services are operating at maximum passenger carrying capacity and buses often must contend with the same congestion as autos in many locations bicyclists have to compete for space on these same facilities
Much of the congestion can be attributed to population growth residential and commercial development job housing imbalances work schedules that require commute trips during peak travel times recreational trip generators and truck traffic
The overall amount of travel in the corridor has increased dramatically over the past ten years and is expected to
continue to increase as the region adds approximately
one million new residents over the next 25 years per the current SACOG MTP 2035 Traffic congestion per houseshyhold is expected to increase 18 percent over 2005 levels
by the year 2035
in the general area of eastern Sacramento County and western El Dorado County the Highway 50 Partnership
has projected growth of 78000 more dwelling units and 53000 new jobs over the next 25 years Current and foreshycasted data is depicted in Table 4
The sections of US 50 with particularly severe traffic
congestion are depicted in Figures 8 and 9 These are
also summarized in greater detail in Tables 14 and 15 in Chapter 7 Table 14 shows a summary of the US 50 eastbound bottlenecks while the tables that follow discuss each bottleneck including location and possible causality Table 15 shows a summary of the US 50 westbound bottleshynecks while the tables that follow discuss each bottleneck including location and possible causality Minor or hidden bottlenecks are those that are not as defined (or severe) as the major bottlenecks Please note that the graphics acshycompanying the bottlenecks are not to scale
a critical component of identifying and resolving Traffic congestion per corridor mobility challenges household is expected is the need for detailed to increase 18 percent data analysis and comshy over 2005 levels by the munication regarding
year 2035system performance Data collection is insufficient to
fully meet these needs but still provides useful information as detailed in the following pages improving data gathershying analysis and dissemination of information is a major challenge for this corridor and is a component of intelligent Transportation Systems planning
HigHway 50 corridor system management plan [ 21 ]
c h a p t e r f o u r m a j o r c o r r i d o r m o b i l i t y c h a l l e n g e s
[ 22 ] HigHway 50 corridor system management plan
Figure 8 US 50 AM Peak Period Bottleneck Locations
Figure 9 US 50 PM Peak Period Bottleneck Locations
Challenges along the corridor include
bull severe recurrent highway and roadway traffic congestion
bull an incomplete buscarpool lane system
bull an incomplete set of freeway auxiliary lanes
bull loss or dropping of freeway lanes at specific locations
bull incomplete ramp metering
bull limited parallel roadway capacity
bull lack of signal coordination on key arterials and freeway ramp intersections
bull transit facilities approaching capacity
bull inadequate transit capital and operations funding needed to grow transit ridership
bull light rail at-grade crossings
bull lack of adequate access to transit across US 50
bull lack of double tracking of the light rail Gold Line to Folsom
bull poor pavement and road and bicycle route maintenancesweeping
bull lack of sufficient bicycle activated signal change devices
bull motorist driving behavior
bull inadequate bicycle storage
bull inadequate bicycle and pedestrian access to transit and
bull gaps and barriers within the bicycle route network
Additionally the EDCTC has identified safety and operashytional issues between the Smith Flat interchange and east of the Upper Carson RoadCamino intersection in the
Camino Area Parallel CapacitySafety Study Transporshytation issues include at-grade access to US 50 left turn conflicts across US 50 increasing average daily local and
interregional traffic growth in the area lack of alternate
routes seasonal traffic to and from Apple Hill and other local events and seasonal access to recreation in the Lake
Tahoe Region
c h a p t e r f o u r m a j o r c o r r i d o r m o b i l i t y c h a l l e n g e s
Table 4 CUrrenT and ForeCaSTed TraFFiC daTa
location Current Traffic data ndash 2007 Future Traffic data ndash 2027 (no build) Future Traffic data ndash 2027 (build)
County description amp location of Trucks
Peak directional
Split
Peak Hour Traffic
average annual daily
Traffic2
Volume over Capacity3
Peak Hour Traffic
average annual daily Traffic2
Volume over Capacity3
(no-build)
Peak Hour Traffic
average annual daily
Traffic2
Volume over Capacity3
(build)
yOL interstate 80 to yoloSacramento County Line
6 60 15500 180000 109 23911 277032 169 24070 278880 136
SaC yoloSacramento County Line to State Routes 99 and 51
4 59 21000 253000 135 28080 312480 186 29153 324415 193
SaC State Routes 99 and 51 to watt avenue 4 59 20600 225000 145 27942 286230 189 30648 313950 166
SaC watt avenue to Zinfandel Drive 4 59 16700 187000 115 24783 274540 163 25885 286750 136
SaC Zinfandel Drive to Sunrise Boulevard 4 60 13500 149000 093 20331 224394 133 20925 230950 110
SaC Sunrise Boulevard to Folsom Boulevard 4 66 11900 125000 089 18888 198247 131 20086 210820 140
SaC Folsom Boulevard to SacramentoEl Dorado County Line
3 66 8800 95000 087 13341 151311 133 13612 154380 136
ED SacramentoEl Dorado County Line to Cameron Park Drive
4 61 6900 70000 095 11454 116200 165 11834 120050 114
ED Cameron Park Drive to Missouri Flat Road
4 62 5700 62000 092 8647 94054 132 9462 102920 096
ED Missouri Flat Road to End of Freeway in Placerville
4 57 4850 59000 069 7101 76245 098 7363 79050 102
ED End of Freeway in Placerville to Bedford avenue
4 55 4800 52000 Na 4 6595 74196 Na4 6648 74790 Na4
ED Bedford avenue to Cedar grove Exit 4 62 3800 38500 077 5474 50782 099 5520 51205 099
1 Peak Directional Split The percentage of total traffic in the heaviest traveled direction during the peak hour2 Average Annual Daily Traffic (AADT) The average number of vehicles per day in both directions 3 Volume over Capacity (VC) The volume of traffic compared to the capacity of the roadway4 Volume over Capacity does not determine LOS for two- or three-lane facilities or segments with intersection delay 5 Reported Collision Rate index ( Compared to State average) The percentage by which each segmentrsquos reported collisions rate (fatal injury and property damage only) is above or below the statewide average reported collisions rate on comparable facilities
Source 3-Year Caltrans Traffic Accident Surveillance and Analysis System data
HigHway 50 corridor system management plans [ 23 ]
c h a p t e r f i v e p e r f o r m a n c e m e a s u r e s
Page Inte
ntionally
Left
Blank
[ 24 ] HigHway 50 corridor system management plan
performance measures
chapter five
Continuing corridor monitoring and performance mea-
sures are an integral part of corridor management and investment decision making and help identify immediate efficient and effective system operational strategies and
capital improvements Performance measures provide the
important dynamic daily information needed to rapidly
address operational problems caused by recurrent and
non-recurrent traffic congestion Measures are also used to identify the best improvement actions to generate the desired results
Table 5 identifies the performance measures to be used as
part of the corridor system management process
Baseline Data For perFormance measures Tables 6 7 and 8 display baseline data for the perforshymance measures for the CSMP transportation network
The performance data was primarily compiled from the SACMET demand based traffic model the year 2007
edition of the Traffic Volumes Manual the year 2000 edition of the Highway Capacity Manual Caltrans Traffic
Accident Surveillance and Analysis System (TASAS) the 2007 Caltrans Division of Maintenance Pavement Summary Report and ridership records provided by the transit providers
additional performance Performance Measures data was derived from the provide the important Performance Measurement dynamic dailySystem (PeMS) tool an
information needed internet based tool used to
to rapidly addresshost process retrieve and operational problemsanalyze road traffic condishy
tions information from caused by recurrent
real-time and historical and non-recurrent data PeMS obtains 30-sec- traffic congestion ond loop detector data in real-time from detectors installed along the highway corridor
It should be noted that Average Daily Traffic (ADT) and LOS
for some ParallelConnecting Roadways segment locations
in Table 7 was not available These are noted ldquoNo Datardquo
Data collection for non-auto modes is not as robust as what is needed for active system management Subsequent updates of this CSMP will seek to expand the
availability of transit and bicycle performance data collection
HigHway 50 corridor system management plan [ 25 ]
mdash
c h a p t e r f i v e p e r f o r m a n c e m e a s u r e s
TABLE 5 PERFORmAnCE mEASURES DEFInITIOnS AnD APPLICABILITY
Performance Measure Definition of Performance measure applicability to Corridor
STATE HIGHWAY SYSTEm
LOS A ldquoreport cardrdquo measurement with ldquoArdquo being the least amount of
congestion and ldquoFrdquo being the most congestion LOS is a relatively simple and widely used measure which
offers comparison opportunities
Total Vehicle Hours of Delay The additional travel time in hours experienced by all vehicles on the highway segment per day or at peak hour due to congestion
This measurement is used to determine the cost in time which congestion can add to the regular travel time that it takes to traverse a segment of road and is useful in
quantifying the performance of a particular roadway in an understandable format
Total Person Minutes of Delay The additional travel time in minutes experienced by all persons in vehicles on the highway segment per day or at peak hour due
to congestion
This measurement is used to determine the cost in time which congestion can add to the regular travel time that it takes to traverse a given segment of road and is useful in quantifying the performance of a particular roadway in an
understandable format and for comparison of improvement options
Minutes of Delay per Vehicle The additional travel time in minutes experienced by each vehicle on the highway segment at peak hour due to congestion
This measurement is used to determine the cost in time which congestion can add to the regular travel time that it
takes to traverse a given segment of road
Minutes of Delay per Person The additional travel time in minutes experienced by each person in vehicles on the highway segment at peak hour due to congesshy
tion
This measurement is used to determine the cost in time which congestion can add to the regular travel time that it
takes to traverse a given segment of road
Vehicle Travel Time (Minutes) The average time spent by vehicles traversing between two points on a road or highway
Travel time is a measure used to quantify travel time deficienshycies and provide a personal indicator of congestion impacts
Distressed Pavement Pavement that rides rougher than established maximums and or exhibits substantial structural problems as determined by the
Pavement Condition Survey
This measurement provides a ride quality indicator and an indicator for structural roadway problems
Reported Collision Rate Comparison of the actual total collision rate () along a highway segment above or below the statewide average for fatal injury
and property damage-only collisions on comparable facilities
Comparing the total collision and rate with statewide average rate provides an opportunity to assess safety conditions
through the corridor
Reliability Identifies day-to-day variation in travel time for the same trip at the same time of day Focuses on the predictability of travel time
particularly for repetitive trips
Estimates reliability by defining the extra time travelers must add to their average travel time when planning trips to ensure on-time arrival (0 percent no day-to-day variations
100 percent double allotted travel time)
Lost Productivity Measures the capacity of the corridor to accommodate vehicle or person throughput and is calculated as actual volume divided by
the capacity of the highway
As traffic volumes increase to roadway capacity speeds decline rapidly and vehicle throughput drops dramatically which increases traffic congestion and delay and results in
lost productivity
[ 26 ] HigHway 50 corridor system management plan
mdash
c h a p t e r f i v e p e r f o r m a n c e m e a s u r e s
HigHway 50 corridor system management plan [ 27 ]
TABLE 5 PERFORmAnCE mEASURES DEFInITIOnS AnD APPLICABILITY (ConTInued)
Performance Measure Definition of Performance measure applicability to Corridor
PARALLEL AnD COnnECTInG ROADWAYS
LOS A ldquoreport cardrdquo measurement with ldquoArdquo being the least amount of
congestion and ldquoFrdquo being the most congestion LOS is a relatively simple and often used measure which
offers comparison opportunities
traNSit
available Capacity Ratio () of available transit capacity alternatives within the corridor
This measure indicates the available capacity to accommoshydate diverted travelers from single occupant vehicles
c h a p t e r f i v e p e r f o r m a n c e m e a s u r e s
[ 28 ] HigHway 50 corridor system management plan
Page Inte
ntionally
Left
Blank
c h a p t e r f i v e p e r f o r m a n c e m e a s u r e s
Table 6 US 50 PerForManCe MeaSUreS
County location Post Miles
distance (Miles)
average annual daily Traffic1
PerForManCe MeaSUreS
loS1
Total Vehicle Hours of delay2
Total Person Minutes of delay2
Minutes of delay per Vehicle2
Minutes of delay per Person2
Vehicle Travel Time (Minutes)2 distressed
Pavement (lane
Miles)4
reported Col-lision rate
Comparison ()5
reliability6 lost Productivity7
daily Peak Hour3 daily Peak
Hour3 Peak Hour3 Peak Hour3 Peak Hour3 eastbound westbound lost lane Miles aM
Peak Period
lost lane Miles PM
Peak Period
STaTe HigHway SySTeM
yOL interstate 80 to yolo Sacramento County Line
000 to 316 316 180000 F 1169 126 95363 8061 049 046 36 9 26 62 22 01 0
SaC
yoloSacramento County Line to State Routes 99
and 51
L000 to L248 R000
248 253000 F 4993 653 407455 41746 186 175 43 7 20 64 60 53 76
State Routes 99 and 51 to watt avenue
R000 to R534 534 225000 F 10097 1362 823883 87105 397 372 93 15 24 60 48 81 68
watt avenue to Zinfandel Drive
R534 to R1092 558 187000 F 8075 977 658886 62506 351 329 91 19 -32 56 42 44 23
Zinfandel Drive to Sunrise Boulevard
R1092 to 1250 158 149000 E 1271 197 103727 12610 088 082 25 9 -33 46 13 0 16
Sunrise Boulevard to Folsom Boulevard
1250 to 1701 451 125000 E 3087 356 251940 25832 180 149 63 5 -14 60 46 1 45
Folsom Boulevard to SacramentoEl Dorado
County Line
1701 to 2314 613 95000 D 583 122 47537 8867 083 069 70 0 -11 19 55 0 08
ED
SacramentoEl Dorado County Line to Cameron
Park Dr
000 to R657 657 70000 E 504 126 41150 9138 110 091 77 1 -35 PeMS Data
Unavailable PeMS Data Unavailable
PeMS Data Unavailable
PeMS Data Unavailable
Cameron Park Drive to Missouri Flat Road
R657 to R1506 849 62000 E 302 75 24633 4827 079 075 93 2 -61 PeMS Data
Unavailable PeMS Data Unavailable
PeMS Data Unavailable
PeMS Data Unavailable
Missouri Flat Road to End of Freeway in Placerville
R1506 to 1725 219 59000 D 66 16 5376 1053 020 019 24 1 20 PeMS Data
Unavailable PeMS Data Unavailable
PeMS Data Unavailable
PeMS Data Unavailable
End of Freeway in Placerville to Bedford avenue
1725 to 1811 086 52000 D 68 17 5585 1094 021 020 15 2 81 PeMS Data
Unavailable PeMS Data Unavailable
PeMS Data Unavailable
PeMS Data Unavailable
Bedford avenue to Cedar grove Road
1811 to R2595 784 38500 D 58 15 4758 932 023 022 85 10 6 PeMS Data
Unavailable PeMS Data Unavailable
PeMS Data Unavailable
PeMS Data Unavailable
TOTaL mdash 5473 mdash mdash 30273 4042 2470293 263771 1587 1449 7150 80 mdash mdash mdash mdash mdash
1 Source Average Annual Daily Traffic and Level of Service (LOS) calculated is based on 2007 Caltrans Traffic Volumes on California State Highways and Highway Capacity Manual and Cambridge Systematics from 2008 Reported LOS is for the typical most congested daily peak travel period 2 Source Delay is the average additional travel time by vehiclespersons traveling under 60 mph Data derived from 2007 HICOMP report SACMET Travel Demand Model PeMSs traffic data and Caltrans District 3 Traffic Operations Probe vehicle Tach runs 3 Peak Hour is during PM 4 Source 2007 Caltrans Division of Maintenance Pavement Summary Report 5 Source 2004 through 2007 Caltrans Traffic Accident Surveillance and Analysis System summary data of the percentage above or below the statewide average for fatal injury and property damage-only collisions on comparable facilities 6 Reliability The Planning Time Index is a measure of the reliability of the travel time on a particular route It is the ratio of the 95th percentile of travel time on a route to the median free-flow travel time This means itrsquos the amount of time a traveler needs to allocate for a route if they want to show up on time 19 out of 20 trips Reliability and Planning Time data was taken from April 2007 The data covered a 24-hour period of time on each Tuesday wednesday and Thursday of that month That data was then aggregated into a single average 24-hour day it was then analyzed to determine the highest average aM and PM travel time That time was then compared to the best possible average travel time to determine the additional time that was spent traveling the same seg-ment 7 Lost Productivity Data taken April 2007 PeMS As traffic increases to the capacity of the highway speeds decline throughput drops dramatically and the efficiency of the highway to provide mobility decreases This decline in the potential carrying-capacity of the freeway is expressed in terms of how many equivalent lane miles of roadway are lost
HigHway 50 corridor system management plans [ 29 ]
c h a p t e r f i v e p e r f o r m a n c e m e a s u r e s
Table 7 Parallel and ConneCTing roadwayS PerForManCe MeaSUreS
County location average
daily Traffic1
PerForManCe MeaSUreS
loS1
Total Vehicle Hours of delay2
Total Person Minutes of delay2
Minutes of delay per Vehicle2
Minutes of delay per Person2
Vehicle Travel Time (Minutes)2
distressed Pavement
(lane Miles)4
daily Peak Hour3 daily Peak
Hour3 Peak Hour3 Peak Hour3 Peak Hour3
Parallel and ConneCTing roadwayS
yOL west Capitol Enterprise Boulevard to Capitol Mall 13737 No Data
Data is unavailable for these performance measures at this time however will be pursued in the next phase of the CSMP
SaC
w 5th Street to 26th Street 9194 a
X 5th Street to 26th Street 9154 a
Folsom Boulevard watt avenue to Bradshaw Road 25600 C
watt avenue Folsom Boulevard to US 50 63900 F
Bradshaw Road Folsom Boulevard to US 50 22400 a
Folsom Boulevard Bradshaw Road to Sunrise Boulevard 20400 a
Bradshaw Road Old Placerville to US 50 54405 F
Old Placerville Road Bradshaw Road to Rockingham Drive 11864ndash18365 a
Rockingham Drive Old Placerville Road to Mather Boulevard 16516 E
Mather Boulevard Rockingham Drive to Folsom Boulevard 21732 C
international Drive Rockingham Drive to Zinfandel Drive 12808 a
Zinfandel Drive international Drive to Folsom Boulevard 22298ndash47032 BE
white Rock Road Zinfandel Drive to Sunrise Boulevard 25459 a
Sunrise Boulevard US 50 to Folsom Boulevard No Data No Data
white Rock Road Sunrise Boulevard to Prairie City Road 3400 B
Folsom Boulevard Sunrise Boulevard to iron Point Road 17200 a
white Rock Road grant Line Road to EDSaC County Line 6700 D
iron Point Road Folsom Boulevard to East BidwellScott Road 13984 No Data
Scott Road iron Point Road to white Rock Road No Data No Data
Folsom Boulevard iron Point Road to Blue Ravine Road No Data No Data
Blue Ravine Road Folsom Boulevard to green Valley Road No Data No Data
Prairie City Road US 50 to white Rock Road 6000 D
HigHway 50 corridor system management plans [ 30 ]
c h a p t e r f i v e p e r f o r m a n c e m e a s u r e s
Table 7 Parallel and ConneCTing roadwayS PerForManCe MeaSUreS (ConTinUed)
County location average
daily Traffic1
PerForManCe MeaSUreS
loS1
Total Vehicle Hours of delay2
Total Person Minutes of delay2
Minutes of delay per Vehicle2
Minutes of delay per Person2
Vehicle Travel Time (Minutes)2
distressed Pavement
(lane Miles)4
daily Peak Hour3 daily Peak
Hour3 Peak Hour3 Peak Hour3 Peak Hour3
Parallel and ConneCTing roadwayS
ED
green Valley Road EDSaC County Line to Francisco Drive 22600 D
Data is unavailable for these performance measures at this time however will be pursued in the next phase of the CSMP
green Valley Road Francisco Drive to Silva Valley Parkway 13077 D
green Valley Road Silva Valley Parkway to Cameron Park 9849 C
green Valley Road Cameron Park Drive to Deer Valley Road 5278 C
green Valley Road Deer Valley Road (East) to Lotus Road 8381 D
green Valley Road Lotus Road to Placerville Drive 4669 C
Latrobe Road white Rock Road to US 50 24742 C
Durock Road Cameron Park Dr to South Shingle Road 7278 C
Cameron Park Drive Durock Road to US 50 (Durock Road to Coach Lane Coach Lane to US 50) 9544 26603 CD
South Shingle Road Durock Road to US 50 11390 D
white Rock Road EDSaC County Line to Latrobe 12808 D
white Rock Road Latrobe Rd to Silva Valley Pkwy (Latrobe to PostPost to Silva Vlly Pkwy) 10124 CD
Silva Valley Parkway white Rock Rd to Serrano Pkwy (white Rock to Entrada Entrada to Serrano Pkwy) 13708 9328 DC
Forni Road Placerville Drive to Main Street 9049 8379 No Data
Placerville Drive Forni Road to US 50 No Data No Data
Main Street Placerville Drive to Bedford avenue No Data No Data
Main Street Bedford avenue to Broadway No Data No Data
Broadway Main Street to Point View Drive No Data No Data
1 Source Average Daily Traffic and Level of Service (LOS) calculated are based on City of Sacramento between 2001 and 2007 Sacramento County from 20072008 City of Rancho Cordova between 2004 and 2007 and El Dorado County from 2007
HigHway 50 corridor system management plans [ 31 ]
c h a p t e r f i v e p e r f o r m a n c e m e a s u r e s
Page Inte
ntionally
Left
Blank
[ 32 ] HigHway 50 corridor system management plan
c h a p t e r f i v e p e r f o r m a n c e m e a s u r e s
tabLe 8 traNSit PerforMaNCe MeaSure
County transit Provider route Performance Measure
available daily Capacity ()1 available Peak Hour Capacity1
traNSit
SaC
SacRT (Bus)
Route 21 70 10
Route 28 76 59
Route 36 83 74
Route 38 66 44
Route 72 56 20
Route 73 79 45
Route 74 82 43
Route 109 47 22
SacRT (Light Rail) Gold Line 31 Exceeds Capacity
EDSAC ED County Transit Authority
Commuter Express Bus Service Not applicablendashOperates Peak Hour
Only 405
iron Point Connector 764 Not available
Reverse Commuter Not applicablendashOperates Peak Hour Only 982
yoloSaC yolo County Transit District Not applicablendashOperates Peak Hour Only 498
biKe3
1 Source average Daily and Peak Hour available Capacity calculated from each transit providerrsquos route ridership data 2 The Reverse Commuter service is offered on vehicles that are returning to El Dorado County (Commuter Express Buses) 3 Bicycle performance measure(s) will be identified applied and included in the subsequent CSMPs
HigHway 50 corridor system management plan [ 33 ]
c h a p t e r f i v e p e r f o r m a n c e m e a s u r e s
[ 34 ] HigHway 50 corridor system management plan
Page Inte
ntionally
Left
Blank
planned corridor system management strategies
chapter six
ConCept LoS and ConCept FaCiLit y ldquoConcept LOSrdquo and ldquoConcept Facilityrdquo have traditionally been used in Caltrans TCCRs to reflect the minimum level or quality of operations acceptable for each route segment within the 20-year planning period and the highway facility needed in the next 20 years to maintain the Concept LOS
Typical Concept LOS standards in Caltrans District 3 are LOS ldquoDrdquo in rural areas and LOS ldquoErdquo in urban areas how-ever some heavily congested route segments now have a Concept LOS ldquoFrdquo because the improvements required to bring the LOS to ldquoErdquo are not feasible due to environmental right of way financial and other constraints The applica-tion of multi-modal corridor management strategies should reduce the severity and duration of congestion and provide viable travel options and information that will enable a traveler to avoid severe freeway congestion
The Concept LOS and Concept Facility for US 50 are shown in Table 9 almost all US 50 segments are forecasted to operate under LOS ldquoFrdquo conditions in 20 years under the No-Build and Build scenarios
Corridor ManageMent StrategieS The US 50 CSMP also proposes specific strategies to enhance corridor mobility (see Table 10) based on the fol-lowing principles
bull Manage all modes and facilities in the corridor as a single system beginning with the transportation net-work defined in this CSMP
bull Implement comprehensive and dynamic multimodal monitoring and reporting for the system and for all modes
bull Develop and use micro-simulation modeling to identify mobility challenges and to evaluate proposed solutions
bull Complete the projects included in the regional trans-portation plans with an emphasis on the completion of the key mobility improvement projects identified in this CSMP (see Tables 11 and 12)
bull Implement the specific strategies outlined in this CSMP
Key CapitaL projeCtS Tables 11 and 12 contain key capital projects that have been identified as the most critical to corridor mobility These are also included in the SaCOg MTP for 2035 and are either planned without any funding yet programmed are partially programmed
The US 50 CSMPor are entirely programmed SACOG conducted significant proposes specific
public attitude research strategies to enhance for the MTP for 2035 to corridor mobility complement comprehensive outreach efforts through community workshops the TALL Order Moving the Region Forward event the televised Town Hall Road Map for the Future and associated public polling The results of the SaCOg analyses and public out-reach for the MTP were
highway 50 corridor system management plan [ 35 ]
c h a p t e r s i x p l a n n e d c o r r i d o r s y s t e m m a n a g e m e n t s t r a t e g i e s
[ 36 ] HigHway 50 corridor system management plan
used when selecting the key projects for identification in
the CSMP and to ensure consistency Not all corridor projshyects in the MTP are included in the CSMP since the CSMP focuses on the managed network and the SaCOg MTP considers all streets and roads bike routes and transit services in the corridor
highway 50 partnership The Highway 50 Partnership is a cooperative public-private effort among the County of Sacramento City of Rancho
Cordova City of Folsom County of El Dorado and several major landowners that recognize the need to consider corrishydor mobility needs holistically
The Partnership has collaborated effectively to develop a Plan to improve mobility in the US 50 Corridor from Rancho
Cordova to El Dorado Hills an area identified as approprishyate for growth in the SACOG Blueprint Recognizing the
need to generate private investment the Partnership is seeking to implement a regional Highway 50 Corridor fee program to fund these projects
in addition to the key projects indicated in Table 11 Table 12 displays the key projects identified by the
Partnership
These projects include (1) Near-Term Priority Improvement Projects and (2) Near-Term Expected Roadway Improveshyments
The Near-term Priority improvement Projects would proshyvide several new roadway connections for people to travel within and through the area to avoid congestion They also include new transit routes and widening existing roadways
viewed by the Partnership as a package that would provide system-wide travel benefits These improvements targeted
for completion through 2012 would reduce vehicle hours of delay during commute hours by 30 percent
The near-Term Expected Roadway Improvements are conshysidered by the Partnership to be readily expected since they are tied to expected development or are part of a near-term
capital improvements program
Visionary projects Visionary projects are not yet included in the SaCOg MTP or EDCTC RTP but appear to offer considerable corridor mobilshyity benefits and merit further analysis and consideration for inclusion in the next MTP and RTP These are displayed in
Table 13
The ldquoPlus 10 Listrdquo in the SACOG MTP identifies projects
that are attractive from a performance standpoint but could not be included in the Final Project Lists because of financial constraint The ldquoPlus 10 Listrdquo element offers the
opportunity to include projects that would not be affordshyable without additional funding Some projects identified in
the Visionary Projects List were analyzed by SACOG during
development of the current MTP Some of these are included in the ldquoPlus 10 Listrdquo
Watt Avenue Light Rail Station Improvement Project
c h a p t e r s i x p l a n n e d c o r r i d o r s y s t e m m a n a g e m e n t s t r a t e g i e s
Table 9 US 50 ConCePT loS and FaCiliTy TyPe
location Forecasted level of Service1 (loS) and Facility Type
County description and location From Post Mile To Post Mile Current
loS1 20-year no build loS12
20-year build loS12
20-year Concept
loS13 existing Facility4 Concept Facility456 Ultimate Facility457
yOL interstate 80 to yoloSacramento County Line
000 316 F F F F 8F (6F between Jefferson Blvd ramps)
8F+2HOV+aux Lanes 8F+2HOV+aux Lanes
SaC yoloSacramento County Line to SR 99 and 51
L000 L248 = R000 F F F F 8F 8F+2HOV+aux Lanes 8F+2HOV+aux Lanes
SaC State Routes 99 and 51 to watt avenue R000 R534 F F F F 8F 8F+2HOV+aux Lanes 8F+2HOV+aux Lanes
SaC watt avenue to Zinfandel Drive R534 R1092 F F F F 8F 8F+2HOV+aux Lanes 8F+2HOV+aux Lanes
SaC Zinfandel Drive to Sunrise Boulevard R1092 1250 E F F F 8F 8F+2HOV+aux Lanes 8F+2HOV+aux Lanes
SaC Sunrise Boulevard to Folsom Boulevard 1250 1701 E F F F 6F+2HOV to Hazel ave 4F+2HOV
to Folsom Blvd
6F+2HOV+aux Lanes to Hazel ave 4F+2HOV+aux
Lanes to Folsom Blvd
8F+2HOV+aux Lanes
SaC Folsom Boulevard to SaCED County Line 1701 2314 D F F F 4F+2HOV 4F+2HOV+aux Lanes 6F+2HOV+aux Lanes
ED SacramentoEl Dorado County Line to Cameron Park Drive
000 R657 E F F F 4F 4F+2HOV+aux Lanes 6F+2HOV+aux Lanes
ED Cameron Park Drive to Missouri Flat Road R657 R1506 E F E E 4F 4F+2HOV+aux Lanes to greenstone 4F+aux Lanes
to Missouri Flat
6F+2HOV+aux Lanes to greenstone 4F+2HOV+aux Lanes
to Missouri Flat
ED Missouri Flat Road to End of Freeway in Placerville
R1506 1725 D F F F 4F 4F+aux Lanes 4F+aux Lanes
ED End of Freeway in Placerville to Bedford avenue
1725 1811 D E E E 4E 4E 4E
ED Bedford avenue to Cedar grove Exit 1811 R2595 D F F F 4F to Smith Flat 4E to Camino 4F+aux Lanes to Smith Flat 4E to Camino
4F+aux Lanes
1 Level of Service (LOS) A ldquoreport cardrdquo for evaluating traffic flow with ldquoArdquo being the best and ldquoFrdquo being the worst 2 20-year LOS (No Build) The LOS that would be expected at 20 years with no improvements 3 20-year Concept LOS The minimum acceptable LOS over the next 20 years 4 Facility Type Codes C=Conventional Highway E=Expressway F=Freeway HOV=High Occupancy Vehicle Lanes aux=auxiliary Lanes 5 Operational improvements are included in future facilities for all segments Examples of operational improvements include TOS improvements and auxiliary lanes 6 Concept Facility the future roadway with improvements needed in the next 20 years if LOS ldquoFrdquo no further degradation of service from existing ldquoFrdquo is acceptable as indicated by delay performance measurement 7 Ultimate Facility The future roadway with improvements needed beyond a 20 year timeframe
HigHway 50 corridor system management plans [ 37 ]
c h a p t e r f i v e p e r f o r m a n c e m e a s u r e s
Table 10 US 50 CSMP STraTegieS
Strategy description implementation Challenges
Maintain and operate the existing corridor multi-modal trans-
portation infrastructure
Maintain the existing investment in all modes of the transportation system and provide adequate resources for daily operations including operating
revenues for transit services
Funding availability funding competition within the region
Fully coordinate the delivery of transportation services and facili-ties in the corridor including daily operations and system planning
for enhancements
Interagency operational coordination to maximize the efficiency and effec-tiveness of all modes operating in the corridor with a focus on the CSMP transportation network defined in this CSMP Use of an existing group or
committee to provide initial oversight for this strategy
Diverse interests and competing priorities and limited resources
Construct planned and pro-grammed corridor capital improve-
ment projects
implementation of the capital improvements in the corridor included within the approved Metropolitan Transportation Plan and Regional Transportation
Plan for all transportation modes within the scope schedule and cost specified
Funding availability funding competition within the region
Comprehensive daily monitoring of the status of all modes providing service on the CSMP transporta-
tion network
Full deployment of multimodal transportation service status detection systems for all CSMP network components
Funding availability funding competition within region
Provide traveler information to the public
Provide the public with real-time easily accessible information regarding the status of all CSMP transportation system components so as to allow travel-
ers to make informed decisions about trip mode time and routing options
Funding availability funding competition within region
Continually monitor and analyze the CSMP transportation network to improve system performance
Monitor transportation performance measures and make system modifica-tions as appropriate on a frequent and timely basis Staff resources and data availability
Decrease the duration of non-recurrent traffic congestion
Expand and enhance the Freeway Service Patrol to respond to automobile accidents and vehicle break-downs
Funding availability funding competition within the region
Timely implementation of STaRNET
Expedite the implementation of the STaRNET operators of transportation facilities and emergency responders in the Sacramento region through real-time sharing of data and live video refinement of joint procedures
pertaining to the operation of roadways and public transit and public safety activities as well as enhance the regionrsquos 511 web site and interactive
telephone service to provide more traveler information
Developmental time acceptance by agencies and integration into daily use and identifica-
tion of maintenance and operations funding
Enhance transit and rail service increase transit service frequency provide express transit services imple-
ment bus rapid transit routes reduce headways for light rail and buses and construct planned light rail line extensions
Funding availability funding competition within the region
Complete Bus Carpool lane network
Complete the regional buscarpool lane network including freeway-to-freeway HOV lane connectors
Funding availability funding competition within the region Public agency and public
acceptance of network
[ 38 ] HigHway 50 corridor system management plan
c h a p t e r s i x p l a n n e d c o r r i d o r s y s t e m m a n a g e m e n t s t r a t e g i e s
tabLe 10 uS 50 CSMP StrategieS (ConTInued)
Strategy Description implementation Challenges
Enhance Transportation Demand Management strategies
Encourage employers to provide telecommuting and flexible working hour options to employees
acceptance by employers and resources to participate
Optimize the timing and synchronishyzation of traffic signals
Coordinate the optimization and timing of traffic signals on freeway ramps and along parallel and connecting roadways within and between jurisdicshytions to improve traffic flow and reduce congestion Provide signal priority
systems for transit vehicles
Funding availability and coordination among cities counties and Caltrans
improve access management of freeways and parallel connecting roadways
Develop and implement access management strategies to maintain the operational efficiency of freeways and parallelconnecting roadways
agreement between responsible jurisdicshytions as to where increased access control is needed increased access control on some parallelconnecting roadways may increase
traffic volumes on non-corridor roads
Develop innovative use of CMSs (eg travel times)
Potential uses of CMSs to improve system efficiency include the use of CMSs along portions of all corridors near transit station to indicate travel
times based on real-time existing traffic conditions on the freeway as well as on parallel roadways and express bus and light rail services CMS can also be used to identify the number of parking spaces that are still available at
the light-rail stations
Funding availability funding competition within the region
Implement amp expand Transit AVLTransit status information
enhancements for system users
Expand the use of AVL systems utilizing GPS technology to track in real-time the location of transit vehicles monitor transit schedules dispatch transit vehicles and provide real-time passenger information such as ldquonext busrdquo or
ldquonext trainrdquo arrival times
Funding availability funding competition within region
Expand Park-and-Ride lots at key locations
Add additional capacity to existing park-and-ride lots near transit stations and other locations that are approaching capacity
Funding availability funding competition within the region and available land
improve bike-pedestrian access in the CSMP
transportation network
Plan and program for construction of additional bicycle paths lanes and related improvements for access and connectivity to transit park and ride
lots and destination points
Funding availability funding competition within the region
Provide ldquoBike-SharingrdquordquoCar-Sharingrdquo tofrom transit (ldquoCarlinkrdquo) and from
neighborhoods
Expand the Regional Rideshare and Spare-the-Air programs to include bicycle and car sharing opportunities
Funding availability and coordination between SaCOg TMa air Districts employers developshyers property managers and local government
officials
Provide parking management stratshyegies in interested jurisdictions where applicable to discourage
use of single-occupant vehicles
in higher-density areas provide preferential parking for carpools and vanshypools require residential parking permits remove on-street parking and or provide graduated parking fees for metered on-street parking based on
vehicle type and time of day for SOV spaces to encourage transit use
Acceptance by businesses local officials and the general public
Expand bicycle commute amp transit fare strategiessubsidies
increase participation by large employers in programs that subsidize transit fares for employees during peak-hour commute times and provide bicycling
to work incentives
Voluntary participation by large employers to pay subsidy to transit providers
HigHway 50 corridor system management plan [ 39 ]
c h a p t e r s i x p l a n n e d c o r r i d o r s y s t e m m a n a g e m e n t s t r a t e g i e s
tabLe 11 KeY CaPitaL ProjeCtS
CountyLead agency
route roadway from to Project
Description Programmed
funds
additional funding Needed
total Cost estimate (x $1000)
Comp Year (FFY)
uS 50
Sacramento Caltrans District 3
US 50 Downtown watt avenue HOV Lanes $0 $75000 $75000 2020
Sacramento Caltrans District 3
US 50 watt avenue Sunrise Blvd HOV Lanes $165000 $0 $165000 2013
Sacramento Caltrans District 3
US 50 Bradshaw Road
Mather Field Road
Eastbound and Westbound Auxiliary Lanes
$0 $3700 $3700 2016
Sacramento Caltrans District 3
US 50 State Route 99
(Oak Park Interchange) interchange improvements including buscarpool lane
connectors $0 $150000 $150000 2014
Sacramento Caltrans District 3
US 50 interstate 5
(Riverfront Interchange) Riverfront Interchange
improvements including bus carpool lane connectors
$30000 $170000 $200000 2016
ED Caltrans District 3 US 50 Camino
Operational Safety improvements Construct an
undercrossing median barrier modify local road connections andor associated operational improvements on and adjacent
to US 50
$15000 $0 $15000 2012
ED ED County DOT US 50
west of Latrobe Road
west of Bass Lake
grade HOV Lanes (Ph1) $47141 $0 $47141 2010
ED Caltrans District 3 US 50
west of Bass Lake Road
Ponderosa Road
HOV Lanes (Ph2) $55000 $0 $55000 2011
ED Caltrans District 3 US 50 Ponderosa
Road greenstone
Road HOV Lanes (Ph3) $22357 $0 $22357 2013
ED ED County DOT US 50 Future Silva
Valley iC
Future Empire Ranch IC
Mainline Widening construct new WB lane within the
median from proposed Silva Valley IC to proposed Empire
Ranch IC
$2950 $0 $2950 2013
[ 40 ] HigHway 50 corridor system management plan
c h a p t e r s i x p l a n n e d c o r r i d o r s y s t e m m a n a g e m e n t s t r a t e g i e s
tabLe 11 KeY CaPitaL ProjeCtS (ConTInued)
CountyLead agency
route roadway from to Project
Description Programmed
funds
additional funding Needed
total Cost estimate (x $1000)
Comp Year (FFY)
PARALLEL AnD COnnECTInG ROADWAYS
ED ED County DOT
Silva Valley Parkway
Entrada Drive
Future US 50
Silva Valley Parkway iC
Widen Silva Valley Road from 2 lanes to 4 lanes includes
Class ii bike lanes and left turn storage pockets
$2921 $0 $2921 2010
ED ED County DOT
Silva Valley Parkway US 50
US50 Silva Valley Parkway (Phase 2) Includes constructshying overcrossing and ramps
signalization at EB and WB on off ramps
$57817 $0 $57817 2016
ED ED County DOT
Headington Road
Missouri Flat Road
El Dorado Road
Extend 2 lanes with median $9878 $0 $9878 2012
ED ED County DOT
Durock Road
Robin Lane South
Shingle Road
Extend 2 lanes with median $1239 $9214 $10453 2015
ED ED County DOT
Durock Road
Business Center Drive intersection signalization
includes adding turn pockets on Durock Road
$4333 $0 $4333 2009
ED City of Placerville
Point View Drive Broadway Smith Flat
Road Extend 2 lanes $1300 $0 $1300 2020
ED City of Placerville
western Placerville
US 50 interchange
Forni Road Ray Lawyer
Drive
Placerville Drive
Interchange Reconstruction convert Ray Lawyer Dr
Overcrossing to full IC Auxiliary Lanes
$5059 $34741 $39800 2020
Sacramento City of Rancho
Cordova
Mather Boulevard
Rockingham Road
Zinfandel Drive widen to 4 lanes $0 $8617 $8617 2020
Sacramento Rancho Cordova
Parkway ii
Grant Line Road
White Rock Road
New 6-lane expressway includshying intersection improvements at Kiefer Blvd amp White Rock
Road
$0 $44518 $44518 2020
Sacramento City of Folsom
Scott Road US 50 White Rock Rd
widen from 2 to 6 lanes $16000 $0 $16000 2020
Sacramento Sacramento County DOT
White Rock Road
Grant Line Rd
Prairie City Rd
Widen from 2 to 4 lanes realign near Nike and Nimbus Roads and connect with existshying alignment west of Prairie City Rd Realign Grant Line Rd to intersect with realigned
White Rock Rd
$26600 $0 $26600 2020
Sacramento Sacramento County DOT
Hazel avenue
US 50 Hazel Madison
Widen American River Bridge and approaches from 4 to 6 lanes Widen Hazel Avenue from AR Bridge to Madison from 4 to 6 lanes with Bike
LanesSignals
$83530 $0 $83530 2020
HigHway 50 corridor system management plan [ 41 ]
c h a p t e r s i x p l a n n e d c o r r i d o r s y s t e m m a n a g e m e n t s t r a t e g i e s
tabLe 11 KeY CaPitaL ProjeCtS (ConTInued)
CountyLead agency
route roadway from to Project
Description Programmed
funds
additional funding Needed
total Cost Estimate (x $1000)
Comp Year (FFY)
PARALLEL AnD COnnECTInG ROADWAYS
ED ED County DOT
green Valley Road
Salmon Falls Road
east
Deer Valley Road
widen from 2 to 4 lanes $0 $14576 $14576 2025
ED ED County DOT
green Valley Road
Deer Valley Road east Lotus Road widen $958 $4513 $5471 2015
ED ED County DOT
green Valley Road
Francisco Drive
Salmon Falls Road
widen from 2 to 4 lanes divided $412 $3491 $3903 2015
ED ED County DOT
Latrobe Road
investment Boulevard
golden Foothill Parkway
widen from 2 lanes undivided to 4 lanes
divided $1076 $8792 $9868 2015
ED ED County DOT
Latrobe Road
Carson Creek
White Rock Road
widen from 4 to 6 lanes $0 $23755 $23755 2025
ED ED County DOT
white Rock Road
EDSac County Line
Manchester Drive
widen 2 to 4 lanes divided includes signal interconnect and coorshy
dination
$0 $23755 $23755 2025
Sacramento City of Rancho
Cordova
Easton Valley
Parkway
Prairie City Road
Empire Ranch Road extenshysion south of
US 50
Construct new 4 lane road $0 $45000 $45000 2020
Sacramento Sacramento County DOT
Hazel avenue
Easton Valley
Parkway
Grant Line RoadWhite Rock Road
New road extension 4 lane limited access
through aerojet property $0 $18000 $18000 2018
Sacramento Sacramento County DOT
white Rock Road
Prairie City Road
ED County Line
widen to 4 lanes $8330 $64773 $73103 2018
Sacramento Sacramento County DOT
green Valley Road
East Natoma Sacramento ED County
line widen to 4 lanes $0 $3000 $3000 2018
Sacramento City of Rancho
Cordova
Zinfandel Drive
international Drive
Folsom Boulevard
widen to 4 lanes $0 $12000 $12000 2020
[ 42 ] HigHway 50 corridor system management plan
c h a p t e r s i x p l a n n e d c o r r i d o r s y s t e m m a n a g e m e n t s t r a t e g i e s
tabLe 11 KeY CaPitaL ProjeCtS (ConTInued)
CountyLead agency
route roadway from to Project
Description
Pro-grammed
funds
addi-tional
funding Needed
total Cost estimate (x $1000)
Comp Year (FFY)
traNSit
yolo amp Sacramento City of west Sacramento
amp City of Sacramento
Sacramento River
Crossing
15th Street in the City
of west Sacramento
Broadway in the City of
Sacramento
New all-modal river crossing (Auto Transit Bike amp Pedestrian)
from Sacramento across the Sacramento River to West
Sacramento The crossing was modeled between Broadway in Sacramento amp 15th Street in
West Sacramento but final alignshyment options will be studied in subsequent planning efforts
$800 $99200 $100000 2019
Sacramento Cal State University
Sacramento
CSUS Campus mdash mdash
Sac State Tram adjoining City streets and SRTD 65th Street light railbus transfer station Bus Rapid Transit System
$23574 $0 $23574 2013
Sacramento City of Rancho
Cordova
Rancho Cordova Various Various
New Service Rancho Cordova Pilot Transit Shuttle System new transit service for connection to
RTs Gold Line
$2380 $1500 $38880 2014
yolo amp Sacramento City of west Sacramento
TBD west
Sacramento Sacramento Streetcar Service between west
Sacramento and Downtown Sacramento
$17400 $54700 $72100 2014
Sacramento City of Rancho
Cordova RT Gold Line
RT Gold Line Tracks
Mather Field Road
Light Rail Grade Separations $0 $52888 $52888 2025
Sacramento City of Rancho
Cordova RT Gold Line
RT Gold Line Tracks Zinfandel Drive Light Rail Grade Separations $0 $52888 $52888 2025
Sacramento City of Rancho
Cordova RT Gold Line
RT Gold Line Tracks
Bradshaw Road
Light Rail Grade Separations $0 $35260 $35260 2025
Sacramento City of Rancho
Cordova RT Gold Line
RT Gold Line Tracks Routier Road Light Rail Grade Separations $0 $35260 $35260 2025
Sacramento City of
Sacramento Sacramento Valley Station
Sacramento intermodal Transportation Facility (Phase 1) - Develop intermodal transportashytion terminal for heavy rail light
rail and bus service
$77799 $0 $77799 2010
Sacramento City of
Sacramento Sacramento Valley Station
Sacramento intermodal Transportation Facility (Phase 2) - Develop intermodal transportashytion terminal for heavy rail light
rail and bus service
$24101 $1000 $25101 2014
HigHway 50 corridor system management plan [ 43 ]
c h a p t e r s i x p l a n n e d c o r r i d o r s y s t e m m a n a g e m e n t s t r a t e g i e s
TABLE 11 KEY CAPITAL PROJECTS (CONTINUED)
CountyLead Agency
Route Roadway From To Project
Description Programmed
Funds
Additional Funding Needed
Total Cost Es-timate (x $1000)
Comp Year (FFY)
BICYCLE ROUTES
Sacramento City of Rancho
Cordova
US 50Mather Field Road IC US 50 Mather
Field Road
US 50Mather Field Road PedestrianBike Crossing along
the Mather Airport RR Spur alignment
$0 $820 $1055 2015
ED ED County DOT
Sacramento Placerville
Transportation Corridor
Forni Rd
Missouri Flat Rd Class I Bike Trail $1423 $111 $1534 2009
ED City of Placerville
El Dorado Trail Western
Extension
Canal Street Main Street
Ray Lawyer DriveForni
Road Class 1 Bike Trail $1850 $0 $1850 2010
ED ED County DOT
US 50ED Hills Blvd IC US 50
El Dorado Hills Blvd
Latrobe Road
US 50El Dorado Hills Blvd Pedestrian Overcrossing $5508 $66 $5574 2014
TABLE 12 50 MOBILITY PARTNERSHIP KEY CAPITAL PROJECTS
RouteRoadway From To Project Description
NEAR TERM PRIORITY IMPROVEMENT PROJECTS
US 50 Sunrise Scott Road Auxiliary Lane
US 50 Hazel Avenue Interchange Improvements
Hazel Avenue Folsom Boulevard Easton Valley Parkway New 4 Lane Road
Easton Valley Parkway Hazel Avenue Rancho Cordova Parkway New 6 Lane Road
Rancho Cordova Parkway Easton Valley Parkway White Rock Road New 4 Lane Road
White Rock Road Sunrise Boulevard Silva Valley Parkway Widen to 4 Lanes
RT Gold Line Hazel Iron Point Station Passing Tracks
US 50 Rancho Cordova Parkway New Interchange
Zinfandel Drive South of International Douglas Road New 4 Lane Road
International Drive Kilgore Road Rancho Cordova Parkway New 6 Lane Road
Douglas Road Zinfandel Extension Sunrise Boulevard Widen to 4 Lanes
Sunrise LRT Citrus Road Sunrise Mall Bus Rapid TransitExpress Bus
[ 44 ] HIGHWAY 50 corridor system management plan
c h a p t e r s i x p l a n n e d c o r r i d o r s y s t e m m a n a g e m e n t s t r a t e g i e s
TABLE 12 50 mOBILITY PARTnERSHIP kEY CAPITAL PROjECTS (COnTInUED)
routeroadway from to Project Description
US 50 nEAR TERm PRIORITY ImPROVEmEnT PROjECTS
US 50 Empire Ranch Road New interchange
US 50 Silva Valley New interchange
US 50 Scott Road Empire Ranch Road Aux Lanes
US 50 Empire Ranch Road El Dorado Hills Boulevard Aux lanes and climbing lanes
US 50 El Dorado Hills Boulevard Silva Valley Parkway Aux lanes and climbing lanes
US 50 Silva Valley Parkway Bass Lake Road Aux lanes
Sunrise Boulevard White Rock Road Douglas Boulevard widen to 6 lanes
Sunrise Boulevard Douglas Boulevard Jackson Road widen to 4 lanes
White Rock Road Sunrise Boulevard Future Rancho Cordova Parkway and El Dorado County Line to Latrobe Road
widen to 4 lanes
Douglas Boulevard Sunrise Boulevard Grant Line Road widen to 4 lanes
Rancho Cordova Parkway Douglas Boulevard Rio del Oro Parkway New 2 lane road
Rancho Cordova Parkway Rio del Oro Parkway White Rock Road New 6 lane road
Jaeger Road Douglas Road Kiefer Boulevard New 4 lane road
Chrysanthy Sunrise Boulevard Americanos Boulevard New 4 lane road
Kiefer Boulevard Sunrise Boulevard Jaeger Road New 4 lane road
Grant Line Road Douglas Road Chrysanthy Road widen to 4 lanes
Hazel avenue Gold Country Boulevard Madison avenue widen to 6 lanes
Latrobe Road South of White Rock Road widen to 4 lanes
TABLE 13 VISIOnARY PROjECTS
County routeroadway from to Project Description
Sac yolo US 50 Enterprise Downtown Sacramento HOV Lanes
ED TBD Folsom Placerville Transit ndash Type TBD
ED New Road Latrobe Road White Rock Road (poten shy
tially US 50) New 2-lane road
HigHway 50 corridor system management plan [ 45 ]
c h a p t e r s i x p l a n n e d c o r r i d o r s y s t e m m a n a g e m e n t s t r a t e g i e s
[ 46 ] HigHway 50 corridor system management plan
Page Inte
ntionally
Left
Blank
congestion and bottleneck analysis
chapter seven
The 2000 Highway Capacity Manual defines a bottleneck
as ldquoa road element on which demand exceeds capacityrdquo
The bottleneck analysis evaluates specific causes of existshying recurrent traffic congestion in the corridor Freeway bottleneck locations that create mobility constraints are identified and documented and their relative contribution
to corridor-wide congestion is reported The bottleneck locations were determined based on a combination of the use of 2006 PeMS data HiCOMP report probe vehicle tach runs and field observations
Traffic congestion can be categorized as either recurrent
or non-recurrent
recurrent congestion occurs repeatedly at the same place and time of day in a predictable pattern Recurrent congesshytion is often associated with facility capacity limitations changes in capacity conflicting vehicle movements such
as lane merges inadequate number of transit vehicles to handle passenger loads or other persistent physical condishytions of the transportation facility
Non-recurrent congestion is usually attributed to collishysions equipment malfunction community events weather construction projects and other occasional occurrences When transportation systems are close to their maximum
carrying capacity non-recurrent congestion is more likely to occur as there is little excess capacity in the system
The location and extent of the bottlenecks on US 50 found
in the aM and PM peak periods are summarized in Tables 14 and 15 These depictions should be considered a snapshyshot view and not a comprehensive analysis of all bottleshynecks in the corridor Further work is being conducted to
refine the identification and causality of bottlenecks within
the corridor Table 14 shows a summary of the US 50 eastbound bottlenecks while the tables that follow discuss each bottleneck including location and possible causality Table 15 shows a summary of the US 50 westbound bottleshynecks while the tables that follow discuss each bottleneck including location and possible causality Minor or hidden bottlenecks are those Freeway bottleneck
that are not as defined locations that create (or severe) as the major mobility constraints bottlenecks Please note are identified and that the graphics accomshy documented and their panying the bottlenecks
relative contribution to are not to scale
corridor-wide congestion Major bottlenecks in the is reported eastbound direction during the aM peak period are at Howe avenue and during the PM peak period are at 48th Street Howe Avenue Mayhew Road Routier Road Sunrise Boulevard and El Dorado Hills Boulevard Major bottlenecks in the westbound direction during the aM peak period are at El Dorado Hills Boulevard Hazel Avenue Zinfandel Drive
HigHway 50 corridor system management plan [ 47 ]
c h a p t e r s e v e n c o n g e s t i o n a n d b o t t l e n e c k a n a l y s i s
Bradshaw Road and Howe Avenue and major bottleneck
locations during the PM peak period are at Zinfandel Drive Routier Road Bradshaw Road Howe Avenue and Intershystate 5
Causalities for these bottlenecks range from high-traffic
demand (congestion) heavy weavingmerging areas or physical constraints such as lane drops lack of ramp meters incomplete HOV network incomplete Auxiliary Lane
network poorly coordinated traffic signals and an off-ramp
queue (Sunrise Boulevard) US 50 Westbound Onramp
TABLE 14 US 50 EASTBOUnD BOTTLEnECk SUmmARY Source PeMS Caltrans tach runs and
Cambridge Systematics field observations
bottleneck Location PeMS Speed Contours Caltrans Probe Vehicle Runs
Cause aM PM aM PM
A Jefferson Blvd PM 25 Minor Minor Traffic weaving truck volumes and grade
B 48th St PM 7 Minor Major Minor Minor Merge from SR 51 and SR 99
C Howe ave PM 9 Major Major Major weave between Howe and watt
D Mayhew Rd PM 12 Major Minor Major Weaving before Bradshaw Exit
E Routier Rd PM 14 Minor Major Weaving before Mather Field Rd Exit
F Sunrise Blvd PM 185 Minor Major Lane drop HOV add off-ramp queue
G Folsom Blvd PM 22 Minor Minor Lane drop 4 to 3
H El Dorado Hills Blvd PM 275 Major
Poorly coordinated traffic signal on arterial causes spillback onto freeway
a jefferson blvd bottleneck The bottleneck approximately located at Jefferson Blvd is due to weaving traffic as those entershying the freeway from Jefferson Blvd must cross those attempting to exit the freeway to I 5 There is a large number of trucks in the stream which struggle with the grade at this location exacerbatshying the bottleneck
[ 48 ] HigHway 50 corridor system management plan
c h a p t e r s e v e n c o n g e s t i o n a n d b o t t l e n e c k a n a l y s i s
b 48th St bottleneck The bottleneck approximately located at 48th St is due to the additional traffic merging from SR 51 and SR 99 combined with the eventual lane drop at 59th St This queue extends upstream past the off-ramp to SR 5199 These off-ramps are bottlenecks in themselves which spill back and choke the US 50 mainline
C Howe Ave Bottleneck The bottleneck at Howe ave is due to the entering traffic from Howe Ave Two Howe Ave on-ramps feed into US 50 eastbound southbound Howe ave loop on-ramp and northbound Howe ave direct ramp approximately 300 feet apart The watt avenue off-ramp is just down stream with heavy exiting volumes therefore the segment between Howe and watt is characterized by heavy weaving
D mayhew Rd Bottleneck The bottleneck approximately located at Mayhew Rd most likely begins with the additional traffic entering from Watt Ave and ends with the exiting traffic at Bradshaw Rd It is possible that there is a high proportion of weaving traffic with in this section (Watt Ave traffic moving to the left lane and those exiting at Bradshaw Rd moving to the right lane)
HigHway 50 corridor system management plan [ 49 ]
c h a p t e r s e v e n c o n g e s t i o n a n d b o t t l e n e c k a n a l y s i s
[ 50 ] HigHway 50 corridor system management plan
e routier rd bottleneck It is likely that the bottleneck at Routier Rd is due to the same merging conditions associated with Mayhew Rd The area is comprised of both residential and light industrialoffice land uses therefore during the PM peak period there are large volumes of vehicles entering at Bradshaw Rd moving to the left lanes and large volumes of vehicles moving to the right lane to exit at Mather Field Rd
f Sunrise blvd bottleneck At Sunrise Blvd the right-most lane exits while an HOV lane is added as the median lane The bottleneck is formed from vehicles shifting left to avoid exiting at Sunrise Blvd and to enter the HOV lane There is a large volume of vehicles queued at the Sunrise off-ramp which spills back and negatively affects the US 50 mainline
g folsom blvd bottleneck The right-most lane exits to Folsom Blvd leaving one HOV lane and two regular lanes along the US 50 The bottleneck is caused by this lane drop as well as the quick merge at the Folsom on-ramp
c h a p t e r s e v e n c o n g e s t i o n a n d b o t t l e n e c k a n a l y s i s
H The eastbound US 50 at El Dorado Hills Blvd Bottleneck The eastbound El Dorado Hills Blvd bottleneck is caused by a traffic signal on the arterial that often causes spillbacks on the EB loop offramp onto the freeway mainlines
TABLE 15 US 50 WESTBOUnD BOTTLEnECk SUmmARY Source PeMS Caltrans tach runs and Cambridge Systematics field observations
bottleneck Location PeMS Speed Contours Caltrans Probe Vehicle Runs
Cause aM PM aM PM
A El Dorado Hills Blvd PM 275 Major Poorly coordinated traffic
signal on El Dorado Hills Blvd
B Hazel Ave PM 21 Major Entering traffic
C Zinfandel Dr PM 16 Minor Major Major Major Entering traffic
D Routier Rd PM 14 Minor Major Minor Weaving traffic
E Bradshaw PM 13 Major Major Major Merging traffic and curve
F Howe Ave PM 9 Minor Major Major Major Weaving traffic and grade
G SR 51SR 99 PM 6 Minor Lane drop weaving traffic
H i-5 PM 3 Major Weaving traffic
HigHway 50 corridor system management plan [ 51 ]
c h a p t e r s e v e n c o n g e s t i o n a n d b o t t l e n e c k a n a l y s i s
[ 52 ] HigHway 50 corridor system management plan
A El Dorado Hills Blvd Bottleneck The minor bottleneck at El Dorado Hills Boulevard is caused by the traffic signal on El Dorado Hills Blvd that causes spillback on the westbound offramp onto the freeway mainlines
B Hazel Avenue Bottleneck In 2006 the Hazel Ave Bottleneck is caused by the traffic entering at both Hazel Ave and Folsom Blvd (the two on-ramps are separated by about one mile) The bottleneck that would appear at Folsom Blvd combines with the bottleneck at Hazel ave to form a large bottleneck that does not clear until after Hazel ave Sometimes causshying spillbacks as far as Prairies City Road this bottleneck was mitigated in 2007 as part of the GO CALIFORNIA program
C Zinfandel Dr Bottleneck There is heavy traffic coming from Sunrise Blvd but the lane addition immediately after the westbound on-ramp prevents a bottleneck from forming but as traffic flows westward the heavy traffic entering from Zinfandel Dr causes a bottleshyneck here
D Routier Rd Bottleneck The bottleneck at Routier Rd is caused by weaving traffic between Mather Field Rd and Bradshaw Rd This highway segment represents a transition area where vehicles that have been traveling in the left lanes begin to shift to the right lanes to exit while the entering traffic tries to shift to the left lanes
W eav in gLan e Dr o p
c h a p t e r s e v e n c o n g e s t i o n a n d b o t t l e n e c k a n a l y s i s
e bradshaw rd bottleneck The Bradshaw Rd bottleneck is caused by the entering traffic from Bradshaw Road the high truck volumes and the curve west of Bradshaw Two Bradshaw Rd on-ramps feed into US 50 westshybound southbound Bradshaw Rd direct on-ramp and northbound Bradshaw Rd loop on-ramp approximately 400 feet apart
F Howe Ave Bottleneck The Howe ave bottleneck is caused by a grade change and the weaving traffic entering from Howe ave and Hornet Dr competing for the right-most lane with those wanting to exit at 65th Street
G amp H SR 51SR 99 amp I-5 Bottleneck The bottleneck at I 5 is caused by the conflict between entering SR 99 and SR 51 traffic and exiting I-5 traffic as well as the queues formed on the ramps to i-5 which spill back onto US 50 The number of lanes in this section reaches a maximum of 6 and then drops to 4 as two lanes exit at the I-5 freeway This bottleneck is exacershybated during the peak periods when it stretches upstream to the lane drop before SR 99
W ea v in g
Lan e Dr o p
HigHway 50 corridor system management plan [ 53 ]

WHITE ROCK RD
c h a p t e r o n e w h a t i s a C S M P
Figure 2 CSMP Corridors in District 3
Corridor System Management Plan
Corridors in District 3 Interstate 80 I-80 between SR 113 and Sierra College Boulevard SR 51 between Highway 50SR 99 and I-8020
Highway 5053 Between I-80 and Cedar Grove Exit
Interstate 5 amp State Route 99 I-5 between Hood-Franklin Rd and State Route 113 SR 99 between San Joaquin County Line and Highway 50 SR 99 between I-5 and SR 20
State Route 99 North29 Between Southgate and Esplanade (in Chico area see inset)
State Route 49 Between I-80 and SR 20
State Route 65 Between I-80 and SR 70
CMIA and State Route 99 Bond Projects
20
Colusa
20
Yuba City Marysville
Grass Valley
La Barr Meadows Widening Project
49 80
Widen to 4 Lanes SR 70 to Feather River Bridge
99
70 Wheatland
65
113 Lincoln Bypass
5
Construct Interchange Operations Improvements Placerville at Elverta Rd HOV Lanes El Dorado
Hills Blvd to Bass Lake Rd
80 Folsom Woodland Rancho 50
Auburn Lincoln
Construct Interchange at Riego Rd Rocklin 49
99 Roseville Roseville Capacity and
Cordova 113 49 505 Sacramento 51
99 Chico Add Auxiliary Lanes
SR 32 to 1st Ave
32 Davis 80
West Sacramento
5
HOV Lanes Watt Ave to Sunrise Blvd
Operational Improvements Mack Rd to Florin Rd
White Rock Rd Expansion Grant Line Rd to Prairie City rd
29 221
113
99
0 105 2 3 4 5 Miles
Galt 0 5 10 15 20
Miles
HigHway 50 corridor system management plans [ 8 ]
need purpose goal and objectives
chapter two
There is a need for a planning approach that brings facility operations and transportation service provision together with capital projects into one coordinated system manageshyment strategy that focuses on high demand travel corridors such as US 50
a CSMP is needed for the US 50 corridor to address severe traffic congestion that often exceeds the capacity of existshying facilities transit ridership demands that exceed the
capacity of the transit system and bicycle facilities that do not provide a fully linked network of bike routes
The purpose of the CSMP is to create a partnership planshyning process that focuses on system management strateshygies and coordinated capital investments so that all the pieces of the corridor function as an efficient transportashytion system and performance evaluation measures are implemented to track the effectiveness of strategies and projects
the CSMP directly supports the implementation of the
three CMia projects on the corridor
bull High Occupancy Vehicle (HOV) Lanes on US 50 from Watt avenue to Sunrise boulevard
bull White Rock Road Expansion from Grant Line Road to Prairie City road
bull HOV Lanes on US 50 from El Dorado Hills Boulevard to bass Lake road
The goal of the CSMP is to improve mobility along the US 50 corridor by focusing on the integrated management of a
subset of the entire transporta- The CSMP directly tion network within the corshy supports the ridor including select freeway implementation and parallel roadways transit
of the three CMIA and bicycle components of the
projects in thecorridor corridor
The objectives of the CSMP are to reduce travel time or delay on all modes improve
connectivity between modes and facilities improve travel
time reliability improve safety on the transportation system and expand mobility options along the corridor in a cost effective manner implementation of the CSMP will increase access to jobs housing and commerce
consistency with other state transportation plans anD policies The CSMP approach is consistent with the goals and objectives of the governorrsquos Strategic Growth Plan which among other things commits to minimizing increases in traffic congestion Key elements of the strategy are illusshytrated in Figure 3
at the base of the pyramid and the foundation of transshyportation system management is system monitoring and evaluation it is essential to understand what is happening on the transportation system so that the best decisions can be made based on reliable data The next few layers up
the pyramid are focused on making the best use of existing
resources and reducing the demand for transportation
HigHway 50 corridor system management plan [ 9 ]
c h a p t e r t w o n e e d p u r p o s e g o a l a n d o b j e c t i v e s
[ 10 ] HigHway 50 corridor system management plan
particularly during peak travel hours The top layer of the pyramid is system expansion This layer assumes that all the underlying components are being addressed and that system capacity expansion investments are necessary
Corridor system management is consistent with the Caltrans Mission
Improve Mobility Across California Corridor system management is consistent with Caltransrsquo goals
bull SafetY Provide the safest transportation system in the nation for users and workers
bull MobiLitY Maximize transportation system performance and accessibility
bull DELIVERY Efficiently deliver quality transportation projshyects and services
bull STEWARDSHIP Preserve and enhance Californiarsquos resources and assets
bull SERVICE Promote quality service through an excellent workforce
The CSMP is also consistent with the California Transportashytion Plan (CTP) the statewide long-range transportation
plan for meeting future mobility needs The CTP defines
goals policies and strategies to achieve our collective vishysion for Californiarsquos future transportation system
Figure 3 Strategic Growth Plan StrategyAir
Quality Planning Corridor System Management seeks to create conditions where vehicle flow on highways and roads occurs at a
steady pace and travelers have a range of mobility options that enable them to travel other than by single occupant vehicle System expansion is focused only where needed
when travel demand exceeds the capacity of the well manshyaged existing system These conditions are beneficial to
attaining air quality goals and reducing green house gas emissions
current corridor system management strategies
chapter three
US 50 is a transcontinental highway that originates in west Sacramento California and terminates in Ocean City Maryland it is a key transportation artery connecting yolo County Sacramento County and fast growing sub regions within Sacramento and El Dorado Counties
The corridor provides access to world renowned recreation areas in the Sierra Nevada Mountains and Lake Tahoe
Basin Peak commute and recreational travel periods are
heavily congested with demand for travel often exceedshying the capacity of existing facilities and services Severe
traffic congestion is common and commute transit services
often operate at maximum ridership capacity There is
extensive and expanding urban development along many parts of the corridor which suggests increased future transportation demand
Given the complexity of the corridor and its extensive geoshygraphic range there are a wide variety of system manageshyment strategies and elements currently being implemented by jurisdictions and transportation service providers Strategies and elements range from vehicle detection deshyvices to traveler information systems to traffic flow control mechanisms a common element among all the strategies and elements is data collection and analysis There is presshyently some system management coordination and intershyjurisdictional partnerships among the entities such as the Sacramento Transportation Area Network (STARNET)
The STARNET web application initial release is anticipated
for the late fall of 2009 Features to be included in the
initial release will include Changeable Message Sign (CMS) display a chain control application integration of Regional Transit data California Highway Patrol incident data connectivity to the 511 systems (web and telephone) Closed Circuit Television (CCTV) display and interagency messaging and coordination [Caltrans Transportation Management Center (TMC) Kingvale Operation Center City of Sacramento Traffic Operation Center (TOC) Sacramento
County TOC Roseville TOC and Elk Grove TOC] STARNETrsquos
associated management There are a widestrategies can and will variety of systemevolve as the application is
implemented throughout management
the region and as addi- strategies and tional features are added elements currently in annual releases being implemented
by jurisdictions and state highway sys-
tem transportation service
providerswith the construction of Californiarsquos state highshyway system virtually complete in the Sacramento region Caltransrsquo major emphasis on highway projects has largely shifted from new construction to focused capacity expanshysions reconstruction operation and maintenance of existshying facilities
The State Highway System has an extensive set of system
management strategies in operation Some cities coun-
HigHway 50 corridor system management plan [ 11 ]
c h a p t e r t h r e e c u r r e n t c o r r i d o r s y s t e m m a n a g e m e n t s t r a t e g i e s
tabLe 2 exiStiNg uS 50 toS eLeMeNtS
County Location PM toS elements
tMS rM HAR rWiS CMS eMS VS CCTV WiM
yolo i-80 to yoloSaC County Line
000 - 316 4 ndash ndash 1 1 ndash ndash 2 2
SaC
YoloSAC County Line to SR99 SR51
L000 - L248 R000
8 7 ndash ndash 3 ndash ndash 7 ndash
SR99SR51 ndash Watt Avenue R000 ndash R534 5 8 ndash ndash 1 1 ndash 3 ndash
watt avenue to Zinfandel Drive R534 ndash R1092 8 7 1 ndash ndash 2 ndash ndash ndash
Zinfandel Drive to Sunrise Blvd R1092 ndash 1250 1 4 ndash ndash ndash 1 ndash ndash ndash
Sunrise Blvd to Folsom Blvd 1250 ndash 1701 4 6 ndash ndash ndash ndash ndash 2 ndash
Folsom Blvd to SACED County Line
1701 ndash 2314 2 8 ndash ndash 1 ndash 1 ndash ndash
ED
SACED County Line to Cameron Park Dr 000 ndash R657 5 ndash ndash ndash 1 ndash 2 ndash ndash
Cameron Park Dr to Missouri Flat Rd R657 ndash R1506 7 ndash ndash ndash ndash ndash ndash ndash ndash
Missouri Flat Rd to End of Freeway R1506 ndash 1725 1 ndash ndash ndash ndash 1 ndash ndash ndash
ED End of Freeway to Bedford Ave 1725 ndash 1811 ndash ndash 1 ndash ndash ndash ndash ndash ndash
ED Bedford Ave to Cedar Grove Rd 1811 ndash R2595 ndash ndash ndash ndash 1 1 ndash ndash ndash
totaL 45 40 2 1 8 6 3 14 2
Notes PM = Post Mile TMS = Traffic Monitoring Station RM = Ramp Meter HAR = Highway Advisory Radio RWIS = Roadside Weather Information System CMS = Changeable Message Sign EMS = Extinguishable Message Sign VS = Visibility Sensor CCTV = Closed Circuit Television System WIM = weigh in Motion Existing TOS Elements as of April 2009
ties and transit operators also have robust system manshyagement elements and programs applied to their facilities or services
There are also specific instances of system management linkages among transportation modes and services at particular locations
Existing management strategies are depicted on Figure 4
and summarized in Table 2
US 50 BusCarpool Lanes in El Dorado County
[ 12 ] HigHway 50 corridor system management plan
c h a p t e r t h r e e c u r r e n t c o r r i d o r s y s t e m m a n a g e m e n t s t r a t e g i e s
These strategies work as a system to gather analyze and disseminate information through the Caltrans TMC inforshymation about collisions other incidents road closures and emergency notifications are fed into this information hub
and disseminated to public and private information users The TMC operates 24 hours a day seven days a week
parallel anD connecting roaDways City of West Sacramento has one CCTV located on west Capitol Avenue between Enterprise Boulevard and Capitol Mall
City of Sacramento operates a TOC Sensors in the street detect the passage of vehicles vehicle speed and the level of congestion
This information is received on a second-by-second (real-time) basis and is analyzed at the TOC
Sacramento County also operates a TOC by gathering information through CCTV cameras CMS HAR and a Fiber Optics (FO) network placed along major traffic
corridors throughout the county
City of rancho Cordova will be installing CCTV cameras and a FO network on Folsom Boulevard in 2009 Currently one CCTV exists on Sunrise Boulevard
between US 50 and Folsom Boulevard Most major traffic corridors are on the network or will be by the end of 2009 The City contracts with the County of Sacramento to operate their systems through the Countyrsquos TOC
City of folsom recently completed installing a FO system
Changeable Message Sign on US 50 at Scott Road
on all of the Cityrsquos major corridors Currently the sole intersection that is monitored via camera is located on iron Point Road and East Bidwell
El Dorado County has three coordinated signals along Francisco Drive at Green Valley Road the Market Place
entrance (east side Safeway Centerwest side Lake
Forest Plaza) and Village Center Drive
City of Placerville utilizes traditional control devices traffic signals and stop signs
transit anD riDesharing Yolo County Transit District (YCTD) uses a Global Positionshying System (GPS) for locating buses in route referred to as
an Automatic Vehicle Location (AVL) system
The AVL System allows users to see where their bus is
located within the last minute
El Dorado Transit Authority utilizes the gPS Zonar System for pre-trip inspections maintenance and real-time vehicle tracking
Sacramento Regional Transit District (SacRT) has in shystalled pre-emptive traffic signals at at-grade intersections
along the Light Rail routes SacRT has a GPS however it is only utilized for analysis purposes
Computer-aided dispatch and Bus Rapid Transit are in
the planning stages In addition SacRT has an online Trip
Planning application to assist transit users During special events such as the California State Fair the Jazz Festival
65th Street Light Rail Station and Transit Oriented Development
HigHway 50 corridor system management plan [ 13 ]
c h a p t e r t h r e e c u r r e n t c o r r i d o r s y s t e m m a n a g e m e n t s t r a t e g i e s
TABLE 3 PARk AnD RIDE LOTS
County Post Mile Facility name Description
Lot use transit Connection
Spaces Spaces occupied
occupancy Rate () Provider and route No
SaC 70 Butterfield Sacramento Regional Transit Gold Line Station
406 129 318 SacRT SacRT LRT Gold Line
SaC 125 Sunrise Sacramento Regional Transit Gold Line Station
487 389 799 RSacRT SacRT LRT Gold Line
SaC 158 Hazel 432 135 306 SacRT SacRT LRT Gold Line
SaC 158 Hazel 33 6 24 SacRT Route 109
SaC 171 Folsom Boulevard 70 58 829 ED Iron Point Connector SacRT LRT Gold Line
ED 2 El Dorado Hills (Latrobe RoadWhite Rock Road) 123 138 1122 ED Iron Point Connector ED Routes
156781112
ED 5 Cambridge Road 59 40 678 ED Iron Point Connector ED Routes 14567891112
ED 86 Ponderosa Road Northeast 28 15 536 ED Iron Point Connector ED Routes 23679101112
ED 86 Ponderosa Road Northwest 111 61 55 ED Iron Point Connector ED Routes 23679101112
ED 86 Durock Road 57 21 368 Na
ED 149 Shingle Springs Drive 19 4 211 Na
ED 122 Greenstone Road 21 4 19 Na
ED 15 Missouri Flat Road 73 44 603 ED Iron Point Connector
ED 158 Fairgrounds Park-and-Ride 200 40 20 ED Iron Point Connector
ED 185 Placerville Station (Mosquito Park- and-Ride) 130 50 385 ED Iron Point Connector
ED Commuter Service
ED 233 Camino Heights 24 1 42 Na
SacRT = Sacramento Regional Transit District ED = El Dorado County Transit Authority Lrt = Light rail train
Survey 2007
the holiday seasons and the Mather Field Air Show SacRT
operates additional service to connect events to light rail stations and offer free service to promote transit use durshying select events The transit routes identified in the CSMP
network are shown in Figure 5
The Sacramento Valley Station in downtown Sacramento is
the 7th busiest station in the national amtrak system and serves as a multi-modal transfer facility There are over 11 million passenger trips annually
Passengers can make connections with numerous local bus services as well as the SacRT light rail system
[ 14 ] HigHway 50 corridor system management plan
c h a p t e r t h r e e c u r r e n t c o r r i d o r s y s t e m m a n a g e m e n t s t r a t e g i e s
Try Transit Changeable Message Sign in Sacramento County
Sacramento County installed pre-emptive traffic signals to give preferential signal timing to transit buses at selected locations that serve high priority transit corridors
SACOG manages the 511 and rideshare programs that cost approximately $1 million per year region-wide to foster carpooling transit ridership vanpooling and bicycling in all areas and corridors The Regional Rideshare Program covers Placer El Dorado Sacramento yolo yuba and Sut-ter counties it is part of a statewide network of rideshare agencies which encourage alternative transportation modes for traveling
Park and Ride lots are located adjacent to or nearby the US 50 corridor utilized by commuters to connect with transit vanpool or carpool Of the sixteen lots many are adjacent to the SacRT Light Rail gold Line providing access for commuters to park their vehicles and commute the re-mainder of their trip via Light Rail El Dorado County Transit authority also uses the park and ride lots as transit stops for their Commuter Buses The locations capacity and occupancy rates of the Park and Ride lots are displayed in Table 3
Bicycle Facilities Bicycle facilities in the corridor are not actively managed in the same manner as motor vehicle facilities
However there are traffic operation systems that serve bicyclists such as dedicated bicycle lanes bicycle detec-tion loops at signalized intersections video detection other non-loop type detection and bicyclist activated signal change buttons The City of Sacramento is installing video detection at some locations
SacRT buses and the new light rail trains are equipped with bicycle racks There are over 170 weatherproof bicycle lock-ers at 23 light rail stations yCTD has the Bikes on Buses Program that allows bicycles to travel on any yOLOBUS
The Sacramento area Bicycle advocates maintain an on-line hazard reporting system to allow users to report hazardous locations for bicyclist such as potholes inad-equate signal timing hazardous railroad crossings insuf-ficient shoulder and inadequate bikeway markings The reports are then sent to the applicable jurisdiction SaCOg is creating an on-line route planning system for bicyclists in addition SaCOg maintains bicycle maps on their website which are currently being updated
The bicycle routes included in the CSMP network are shown on Figures 6 and 7
Pedestrian Facilities Pedestrian facilities are not included as part of the man-aged network because they do not directly provide corridor mobility However complete and safe pedestrian access to appropriate corridor modes such as bike routes and transit services is an important component of corridor system management Therefore subsequent updates of the CSMP will seek to identify key pedestrian facilities and barriers to pedestrian mobility with regard to access and modal con-nectivity
HigHway 50 corridor system management plan [ 15 ]
c h a p t e r t h r e e c u r r e n t c o r r i d o r s y s t e m m a n a g e m e n t s t r a t e g i e s
[ 16 ] HigHway 50 corridor system management plan
Page Inte
ntionally
Left
Blank
MAIN ST
MA
RB
LE V
ALL
EY
RD
65TH ST EXPY
FLYING
C R
D
STATE
HW
Y 16
MA
RB
LE VA
LLEY R
D
CAM
BRID
GE R
D
GREEN VALLEY RD
RIV
ERSI
DE
BLVD
11T
H S
T
RIV
ERSI
DE
BLVD
HO
WE
AV
E
EL DORADO
HILLS BLVD
EL DORADO H
ILLS BLV
D
HORNET DR
JEFF
ERSO
N BL
VD
CAM
ERO
N PAR
K DR
PO
WE
R IN
N R
D
CO
UN
TY HW
Y E3
BRADSHAW RD
MATHER FIELD RD
ZINFAN
DEL D
R
11TH
ST
VD
FOLSOM BLFOLSOM BLVD
FOLSOM BLVD
FOLSO
M BLVD
WHITE ROCK RD
FOLSOM BLVD
FOLS
OM
BLV
D
LATRO
BE RD
CANAL ST
16TH
ST
JACQ
UIER
RD
15TH
ST
HARBOR BLV
D
STOCKTON BLVD
FORNI RD BIDW
ELL DR
WATT AVE
PLACERVILLE DR
TOW
ER G
ATEW
AY
SHIN
GLE SPR
ING
S DR G
REEN
STON
E RD
59TH
ST
SUN
RISE BLVD
EL D
OR
AD
O R
D
HAZEL AVE
SOUT
H RI
VER
RD
PON
DER
OSA R
D
SHIN
GLE SPR
ING
S RD
SHIN
GLE
SPR
ING
S R
D
CARSON RD
MISSO
URI FLAT RD
BASS LAKE RD
N SH
ING
LE RD
PRAIR
IE CITY R
D
S SHIN
GLE R
D
SHIN
GLE
RD
SCOTT RD
W S
T AT
5TH
ST
65TH
ST
5TH
ST
X
ST A
T 27
TH
80
CEDAR GROVE EXIT
MO
SQU
ITO R
D
PLACERVILLE DRMISSOURI
FLAT RD
FORNIRD
EL D
OR
AD
OR
D
POIN
T VIEW D
RSM
ITH FLAT R
D
SCH
NELL SC
HO
OL R
D
MO
NTER
EY RD
c h a p t e r t h r e e c u r r e n t c o r r i d o r s y s t e m m a n a g e m e n t s t r a t e g i e s
Figure 4 Existing Traffic Operations Systems Elements
Highway 50 Corridor Systems Management Plan Existing Traffic Operations Systems Excluding Ramp Meters
TOS ndash Traffic Operations Systems
Stations Continuous Coverage
EMS ndash Extinguishable Message Sign WIM ndash Weigh-in-Motion Location (EMS Usually Refers Motorist to HAR)
Television System
19365TMS ndash Traffic Monitoring99 US Highway 50VS ndash Fog (Visibility) Sensor
CCTV ndash Closed Circuit
I-80 to Cedar Grove Exit HAR ndash Highway Advisory Radio Local Road Interchange Access
White Rock RdRWIS ndash Roadside WeatherCMS ndash Changeable Sunrise Blvd to Latrobe Rd
Message Sign Information System
50
80
51
49 160
50
Placerville to Cedar Grove Exit
50
1935
16 49
99
84 160
49 MilesMiles 0 1 2 3 4 50 1 2 3 4 5 10
HigHway 50 corridor system management plans [ 17 ]
124 49
MOTHER LODE DR
MATHER FIELD RD
West Terminus
RAMP
RAMP
RAMPRAMP
RAM
P
RAMP
RAM
P RAMP
RAMPRAMP
RA
MP
RAM
P RAM
P
RAMP
RAM
P
RAM
P
RA
MP
RAM
P
RAM
P
YoloBus Express Routes Plus Routes 42A and 42B
RAMPBROADWAY
65TH
ST
PCE
65
SCRY42A
Y44Y4343
242 IPC
5
W STX ST
WATT AVE
MAROCKINGHAM
DR
OLD PLACER
BRADSHAW RD
VILLE RDTHER FIELD RD
INTERNATIONAL DR
ZINFANDEL DR
WHITE ROCK RD FOLSOM BLVD FOLSOM BLVD
SUNRISE BLVD
BLUE R
AVIN
E RD
WHITE ROCK RD
SC
OTT R
D
PR
AIR
IEC
ITY R
D
LATROBE RD
GREEN V ALLEY RD
PLACERVILLE DR
FORNI RDM
AIN ST
BROADWAY
CEDAR GROVE EXIT
WEST
CAPTOL AVE
(WESTMOST
STOP)
(WESTMOST STOP)
SCR
SCR
IPC
IPC
c h a p t e r t h r e e c u r r e n t c o r r i d o r s y s t e m m a n a g e m e n t s t r a t e g i e s
Figure 5 US 50 CSMP Network Transit Routes
Highway 50 Corridor System Management Plan 80
CSMP Commuter Transit Network
El Dorado County Transit Authority 65
IPC Iron Point Connector
SCR Sacramento Commuter Route 193
Sacramento Regional Transit District 109ndashHazel Express
Yolo Bus (Express) Y43 Y44 Y230 Y231 and Y232
Yolo Bus (All-Day Intercity amp Airport Service) Y42A (Clockwise) Y42B (Counter-clockwise)
LATROBE RD
Park-and-Ride Lots
193 65
49 US Highway 50 (I-80 to Cedar Grove Exit)
Parallel Roads
Light Rail STation
Light Rail
Class I Bikeways Other State Highways
County Lines
80
49
50
80160
50
5 84 16
4999
Miles 0 5 10160
HigHway 50 corridor system management plans [ 18 ]
K
5
FOLSOM BIKE TRAIL
SEE CENTRAL CITY BICYCLENETWORK MAP FOR BICYCLE
F ACILITY NAMES
AMERICAN RIVER PARKWAY TRAIL SYSTEM
(INCLUDING JE
DEDIAH SMITH MEMORIAL T
RAIL)
FOLSOM BLVD
WHITE ROCK RDSIL V A V ALLEY PKWY
EL D
OR
AD
O H
ILLS B
L VD
GREEN VALLEY RD
AMERICAN R
IVER PARKWAY
TRAIL
SYSTEM
(INCLU
DING JE
DEDIAH SMITH
MEMORIA
L TRAIL)
NATOMA ST
FOLSOM BLVD
EL DORADO TRAIL
CARSON RD
PLACER VILLE RD
RAY
LAW
YER
DR
c h a p t e r t h r e e c u r r e n t c o r r i d o r s y s t e m m a n a g e m e n t s t r a t e g i e s
Figure 6 US 50 CSMP Network Bicycle Routes
Highway 50 Corridor System Management Plan
Bicycle Route Network
Class I Bicycle Facilities
Class II Bicycle Facilities
193
Lincoln
65
Rocklin
Auburn
Folsom 49
193
Light Rail Stations
Light Rail Loomis50
RosevilleUS Highway 50 CSMP Corridor
Other State Highways Miles
County Lines 0 1 2 3
99
49 80
50
160 80 193
Placerville 50
West Rancho 50 Sacramento Cordova
5 0 49
8 4
9 9 Sacramento
1 6 4 9
0 1 2 Miles
3
1 6 0 Elk Grove 210 210 44 66 88
Miles 10 Miles
10 1 2 4
4 9
HigHway 50 corridor system management plans [ 19 ]
13TH
ST
H ST E ST BELVEDERE AVE
51ST
ST
BROADWAY H ST
48TH
ST
11TH
ST
PO
WE
R IN
N R
D
28TH
ST
STOC
KTON
BLVD3R
D ST
ALH
AMBR
AFR
ON
T BLV
D S
T
W CAPITOL A VE
DISCOVER Y
P ARK BRIDGE
JEDED
IAH
N ST
T ST
K ST
11TH
ST
RIV
ERSI
DE
BLV
D
18TH
ST
R S
T17
TH S
TO
ST
18TH
ST
20TH ST
CAPITOL AVE
T ST
28TH
ST
34TH
ST
39TH
ST
M ST
BROADWAY
T ST
FOLSOM BLVD
58TH
ST
J ST
65TH
ST
CSU
S
CO
NN
ECTIO
NS
SR 16JACKSON HWY
FOLSOM BLVD
LA RIVIERA DR
W ATT AV
E
HO
WE A
VE
GUY W
EST B
RIDE
COLLEGE TOWN DR
c h a p t e r t h r e e c u r r e n t c o r r i d o r s y s t e m m a n a g e m e n t s t r a t e g i e s
Figure 7 US 50 CSMP Network Bicycle Routes (Sacramento Insert)
5 Sacramento
8 0
8 0
160
West Sacramento
80
SMITH MEMORIAL TRAIL
50
US Highway 50 Corridor System Management Plan 50
Central City Bicycle Route Network 50
Bikeway and Multi-Use Network
US Highway 50 (I-80 to Cedar Grove Exit)
Class I Bicycle Facilities
Class II Bicycle Facilities
Connecting Routesndashno Bicycle Designation
80 16 5
BROADWAY
FLOR
IN-P
ER
KIN
S R
D
Light Rail STation 99
Light Rail
Other State Highways
County Lines
HigHway 50 corridor system management plans [ 20 ]
major corridor mobility challenges
chapter four
High demand for mobility services especially during peak commute periods is creating significant traffic congestion
and impairing mobility in the corridor Heavy congestion and stop-and-go traffic contributes to increased vehicle
emissions and added travel costs Many transit services are operating at maximum passenger carrying capacity and buses often must contend with the same congestion as autos in many locations bicyclists have to compete for space on these same facilities
Much of the congestion can be attributed to population growth residential and commercial development job housing imbalances work schedules that require commute trips during peak travel times recreational trip generators and truck traffic
The overall amount of travel in the corridor has increased dramatically over the past ten years and is expected to
continue to increase as the region adds approximately
one million new residents over the next 25 years per the current SACOG MTP 2035 Traffic congestion per houseshyhold is expected to increase 18 percent over 2005 levels
by the year 2035
in the general area of eastern Sacramento County and western El Dorado County the Highway 50 Partnership
has projected growth of 78000 more dwelling units and 53000 new jobs over the next 25 years Current and foreshycasted data is depicted in Table 4
The sections of US 50 with particularly severe traffic
congestion are depicted in Figures 8 and 9 These are
also summarized in greater detail in Tables 14 and 15 in Chapter 7 Table 14 shows a summary of the US 50 eastbound bottlenecks while the tables that follow discuss each bottleneck including location and possible causality Table 15 shows a summary of the US 50 westbound bottleshynecks while the tables that follow discuss each bottleneck including location and possible causality Minor or hidden bottlenecks are those that are not as defined (or severe) as the major bottlenecks Please note that the graphics acshycompanying the bottlenecks are not to scale
a critical component of identifying and resolving Traffic congestion per corridor mobility challenges household is expected is the need for detailed to increase 18 percent data analysis and comshy over 2005 levels by the munication regarding
year 2035system performance Data collection is insufficient to
fully meet these needs but still provides useful information as detailed in the following pages improving data gathershying analysis and dissemination of information is a major challenge for this corridor and is a component of intelligent Transportation Systems planning
HigHway 50 corridor system management plan [ 21 ]
c h a p t e r f o u r m a j o r c o r r i d o r m o b i l i t y c h a l l e n g e s
[ 22 ] HigHway 50 corridor system management plan
Figure 8 US 50 AM Peak Period Bottleneck Locations
Figure 9 US 50 PM Peak Period Bottleneck Locations
Challenges along the corridor include
bull severe recurrent highway and roadway traffic congestion
bull an incomplete buscarpool lane system
bull an incomplete set of freeway auxiliary lanes
bull loss or dropping of freeway lanes at specific locations
bull incomplete ramp metering
bull limited parallel roadway capacity
bull lack of signal coordination on key arterials and freeway ramp intersections
bull transit facilities approaching capacity
bull inadequate transit capital and operations funding needed to grow transit ridership
bull light rail at-grade crossings
bull lack of adequate access to transit across US 50
bull lack of double tracking of the light rail Gold Line to Folsom
bull poor pavement and road and bicycle route maintenancesweeping
bull lack of sufficient bicycle activated signal change devices
bull motorist driving behavior
bull inadequate bicycle storage
bull inadequate bicycle and pedestrian access to transit and
bull gaps and barriers within the bicycle route network
Additionally the EDCTC has identified safety and operashytional issues between the Smith Flat interchange and east of the Upper Carson RoadCamino intersection in the
Camino Area Parallel CapacitySafety Study Transporshytation issues include at-grade access to US 50 left turn conflicts across US 50 increasing average daily local and
interregional traffic growth in the area lack of alternate
routes seasonal traffic to and from Apple Hill and other local events and seasonal access to recreation in the Lake
Tahoe Region
c h a p t e r f o u r m a j o r c o r r i d o r m o b i l i t y c h a l l e n g e s
Table 4 CUrrenT and ForeCaSTed TraFFiC daTa
location Current Traffic data ndash 2007 Future Traffic data ndash 2027 (no build) Future Traffic data ndash 2027 (build)
County description amp location of Trucks
Peak directional
Split
Peak Hour Traffic
average annual daily
Traffic2
Volume over Capacity3
Peak Hour Traffic
average annual daily Traffic2
Volume over Capacity3
(no-build)
Peak Hour Traffic
average annual daily
Traffic2
Volume over Capacity3
(build)
yOL interstate 80 to yoloSacramento County Line
6 60 15500 180000 109 23911 277032 169 24070 278880 136
SaC yoloSacramento County Line to State Routes 99 and 51
4 59 21000 253000 135 28080 312480 186 29153 324415 193
SaC State Routes 99 and 51 to watt avenue 4 59 20600 225000 145 27942 286230 189 30648 313950 166
SaC watt avenue to Zinfandel Drive 4 59 16700 187000 115 24783 274540 163 25885 286750 136
SaC Zinfandel Drive to Sunrise Boulevard 4 60 13500 149000 093 20331 224394 133 20925 230950 110
SaC Sunrise Boulevard to Folsom Boulevard 4 66 11900 125000 089 18888 198247 131 20086 210820 140
SaC Folsom Boulevard to SacramentoEl Dorado County Line
3 66 8800 95000 087 13341 151311 133 13612 154380 136
ED SacramentoEl Dorado County Line to Cameron Park Drive
4 61 6900 70000 095 11454 116200 165 11834 120050 114
ED Cameron Park Drive to Missouri Flat Road
4 62 5700 62000 092 8647 94054 132 9462 102920 096
ED Missouri Flat Road to End of Freeway in Placerville
4 57 4850 59000 069 7101 76245 098 7363 79050 102
ED End of Freeway in Placerville to Bedford avenue
4 55 4800 52000 Na 4 6595 74196 Na4 6648 74790 Na4
ED Bedford avenue to Cedar grove Exit 4 62 3800 38500 077 5474 50782 099 5520 51205 099
1 Peak Directional Split The percentage of total traffic in the heaviest traveled direction during the peak hour2 Average Annual Daily Traffic (AADT) The average number of vehicles per day in both directions 3 Volume over Capacity (VC) The volume of traffic compared to the capacity of the roadway4 Volume over Capacity does not determine LOS for two- or three-lane facilities or segments with intersection delay 5 Reported Collision Rate index ( Compared to State average) The percentage by which each segmentrsquos reported collisions rate (fatal injury and property damage only) is above or below the statewide average reported collisions rate on comparable facilities
Source 3-Year Caltrans Traffic Accident Surveillance and Analysis System data
HigHway 50 corridor system management plans [ 23 ]
c h a p t e r f i v e p e r f o r m a n c e m e a s u r e s
Page Inte
ntionally
Left
Blank
[ 24 ] HigHway 50 corridor system management plan
performance measures
chapter five
Continuing corridor monitoring and performance mea-
sures are an integral part of corridor management and investment decision making and help identify immediate efficient and effective system operational strategies and
capital improvements Performance measures provide the
important dynamic daily information needed to rapidly
address operational problems caused by recurrent and
non-recurrent traffic congestion Measures are also used to identify the best improvement actions to generate the desired results
Table 5 identifies the performance measures to be used as
part of the corridor system management process
Baseline Data For perFormance measures Tables 6 7 and 8 display baseline data for the perforshymance measures for the CSMP transportation network
The performance data was primarily compiled from the SACMET demand based traffic model the year 2007
edition of the Traffic Volumes Manual the year 2000 edition of the Highway Capacity Manual Caltrans Traffic
Accident Surveillance and Analysis System (TASAS) the 2007 Caltrans Division of Maintenance Pavement Summary Report and ridership records provided by the transit providers
additional performance Performance Measures data was derived from the provide the important Performance Measurement dynamic dailySystem (PeMS) tool an
information needed internet based tool used to
to rapidly addresshost process retrieve and operational problemsanalyze road traffic condishy
tions information from caused by recurrent
real-time and historical and non-recurrent data PeMS obtains 30-sec- traffic congestion ond loop detector data in real-time from detectors installed along the highway corridor
It should be noted that Average Daily Traffic (ADT) and LOS
for some ParallelConnecting Roadways segment locations
in Table 7 was not available These are noted ldquoNo Datardquo
Data collection for non-auto modes is not as robust as what is needed for active system management Subsequent updates of this CSMP will seek to expand the
availability of transit and bicycle performance data collection
HigHway 50 corridor system management plan [ 25 ]
mdash
c h a p t e r f i v e p e r f o r m a n c e m e a s u r e s
TABLE 5 PERFORmAnCE mEASURES DEFInITIOnS AnD APPLICABILITY
Performance Measure Definition of Performance measure applicability to Corridor
STATE HIGHWAY SYSTEm
LOS A ldquoreport cardrdquo measurement with ldquoArdquo being the least amount of
congestion and ldquoFrdquo being the most congestion LOS is a relatively simple and widely used measure which
offers comparison opportunities
Total Vehicle Hours of Delay The additional travel time in hours experienced by all vehicles on the highway segment per day or at peak hour due to congestion
This measurement is used to determine the cost in time which congestion can add to the regular travel time that it takes to traverse a segment of road and is useful in
quantifying the performance of a particular roadway in an understandable format
Total Person Minutes of Delay The additional travel time in minutes experienced by all persons in vehicles on the highway segment per day or at peak hour due
to congestion
This measurement is used to determine the cost in time which congestion can add to the regular travel time that it takes to traverse a given segment of road and is useful in quantifying the performance of a particular roadway in an
understandable format and for comparison of improvement options
Minutes of Delay per Vehicle The additional travel time in minutes experienced by each vehicle on the highway segment at peak hour due to congestion
This measurement is used to determine the cost in time which congestion can add to the regular travel time that it
takes to traverse a given segment of road
Minutes of Delay per Person The additional travel time in minutes experienced by each person in vehicles on the highway segment at peak hour due to congesshy
tion
This measurement is used to determine the cost in time which congestion can add to the regular travel time that it
takes to traverse a given segment of road
Vehicle Travel Time (Minutes) The average time spent by vehicles traversing between two points on a road or highway
Travel time is a measure used to quantify travel time deficienshycies and provide a personal indicator of congestion impacts
Distressed Pavement Pavement that rides rougher than established maximums and or exhibits substantial structural problems as determined by the
Pavement Condition Survey
This measurement provides a ride quality indicator and an indicator for structural roadway problems
Reported Collision Rate Comparison of the actual total collision rate () along a highway segment above or below the statewide average for fatal injury
and property damage-only collisions on comparable facilities
Comparing the total collision and rate with statewide average rate provides an opportunity to assess safety conditions
through the corridor
Reliability Identifies day-to-day variation in travel time for the same trip at the same time of day Focuses on the predictability of travel time
particularly for repetitive trips
Estimates reliability by defining the extra time travelers must add to their average travel time when planning trips to ensure on-time arrival (0 percent no day-to-day variations
100 percent double allotted travel time)
Lost Productivity Measures the capacity of the corridor to accommodate vehicle or person throughput and is calculated as actual volume divided by
the capacity of the highway
As traffic volumes increase to roadway capacity speeds decline rapidly and vehicle throughput drops dramatically which increases traffic congestion and delay and results in
lost productivity
[ 26 ] HigHway 50 corridor system management plan
mdash
c h a p t e r f i v e p e r f o r m a n c e m e a s u r e s
HigHway 50 corridor system management plan [ 27 ]
TABLE 5 PERFORmAnCE mEASURES DEFInITIOnS AnD APPLICABILITY (ConTInued)
Performance Measure Definition of Performance measure applicability to Corridor
PARALLEL AnD COnnECTInG ROADWAYS
LOS A ldquoreport cardrdquo measurement with ldquoArdquo being the least amount of
congestion and ldquoFrdquo being the most congestion LOS is a relatively simple and often used measure which
offers comparison opportunities
traNSit
available Capacity Ratio () of available transit capacity alternatives within the corridor
This measure indicates the available capacity to accommoshydate diverted travelers from single occupant vehicles
c h a p t e r f i v e p e r f o r m a n c e m e a s u r e s
[ 28 ] HigHway 50 corridor system management plan
Page Inte
ntionally
Left
Blank
c h a p t e r f i v e p e r f o r m a n c e m e a s u r e s
Table 6 US 50 PerForManCe MeaSUreS
County location Post Miles
distance (Miles)
average annual daily Traffic1
PerForManCe MeaSUreS
loS1
Total Vehicle Hours of delay2
Total Person Minutes of delay2
Minutes of delay per Vehicle2
Minutes of delay per Person2
Vehicle Travel Time (Minutes)2 distressed
Pavement (lane
Miles)4
reported Col-lision rate
Comparison ()5
reliability6 lost Productivity7
daily Peak Hour3 daily Peak
Hour3 Peak Hour3 Peak Hour3 Peak Hour3 eastbound westbound lost lane Miles aM
Peak Period
lost lane Miles PM
Peak Period
STaTe HigHway SySTeM
yOL interstate 80 to yolo Sacramento County Line
000 to 316 316 180000 F 1169 126 95363 8061 049 046 36 9 26 62 22 01 0
SaC
yoloSacramento County Line to State Routes 99
and 51
L000 to L248 R000
248 253000 F 4993 653 407455 41746 186 175 43 7 20 64 60 53 76
State Routes 99 and 51 to watt avenue
R000 to R534 534 225000 F 10097 1362 823883 87105 397 372 93 15 24 60 48 81 68
watt avenue to Zinfandel Drive
R534 to R1092 558 187000 F 8075 977 658886 62506 351 329 91 19 -32 56 42 44 23
Zinfandel Drive to Sunrise Boulevard
R1092 to 1250 158 149000 E 1271 197 103727 12610 088 082 25 9 -33 46 13 0 16
Sunrise Boulevard to Folsom Boulevard
1250 to 1701 451 125000 E 3087 356 251940 25832 180 149 63 5 -14 60 46 1 45
Folsom Boulevard to SacramentoEl Dorado
County Line
1701 to 2314 613 95000 D 583 122 47537 8867 083 069 70 0 -11 19 55 0 08
ED
SacramentoEl Dorado County Line to Cameron
Park Dr
000 to R657 657 70000 E 504 126 41150 9138 110 091 77 1 -35 PeMS Data
Unavailable PeMS Data Unavailable
PeMS Data Unavailable
PeMS Data Unavailable
Cameron Park Drive to Missouri Flat Road
R657 to R1506 849 62000 E 302 75 24633 4827 079 075 93 2 -61 PeMS Data
Unavailable PeMS Data Unavailable
PeMS Data Unavailable
PeMS Data Unavailable
Missouri Flat Road to End of Freeway in Placerville
R1506 to 1725 219 59000 D 66 16 5376 1053 020 019 24 1 20 PeMS Data
Unavailable PeMS Data Unavailable
PeMS Data Unavailable
PeMS Data Unavailable
End of Freeway in Placerville to Bedford avenue
1725 to 1811 086 52000 D 68 17 5585 1094 021 020 15 2 81 PeMS Data
Unavailable PeMS Data Unavailable
PeMS Data Unavailable
PeMS Data Unavailable
Bedford avenue to Cedar grove Road
1811 to R2595 784 38500 D 58 15 4758 932 023 022 85 10 6 PeMS Data
Unavailable PeMS Data Unavailable
PeMS Data Unavailable
PeMS Data Unavailable
TOTaL mdash 5473 mdash mdash 30273 4042 2470293 263771 1587 1449 7150 80 mdash mdash mdash mdash mdash
1 Source Average Annual Daily Traffic and Level of Service (LOS) calculated is based on 2007 Caltrans Traffic Volumes on California State Highways and Highway Capacity Manual and Cambridge Systematics from 2008 Reported LOS is for the typical most congested daily peak travel period 2 Source Delay is the average additional travel time by vehiclespersons traveling under 60 mph Data derived from 2007 HICOMP report SACMET Travel Demand Model PeMSs traffic data and Caltrans District 3 Traffic Operations Probe vehicle Tach runs 3 Peak Hour is during PM 4 Source 2007 Caltrans Division of Maintenance Pavement Summary Report 5 Source 2004 through 2007 Caltrans Traffic Accident Surveillance and Analysis System summary data of the percentage above or below the statewide average for fatal injury and property damage-only collisions on comparable facilities 6 Reliability The Planning Time Index is a measure of the reliability of the travel time on a particular route It is the ratio of the 95th percentile of travel time on a route to the median free-flow travel time This means itrsquos the amount of time a traveler needs to allocate for a route if they want to show up on time 19 out of 20 trips Reliability and Planning Time data was taken from April 2007 The data covered a 24-hour period of time on each Tuesday wednesday and Thursday of that month That data was then aggregated into a single average 24-hour day it was then analyzed to determine the highest average aM and PM travel time That time was then compared to the best possible average travel time to determine the additional time that was spent traveling the same seg-ment 7 Lost Productivity Data taken April 2007 PeMS As traffic increases to the capacity of the highway speeds decline throughput drops dramatically and the efficiency of the highway to provide mobility decreases This decline in the potential carrying-capacity of the freeway is expressed in terms of how many equivalent lane miles of roadway are lost
HigHway 50 corridor system management plans [ 29 ]
c h a p t e r f i v e p e r f o r m a n c e m e a s u r e s
Table 7 Parallel and ConneCTing roadwayS PerForManCe MeaSUreS
County location average
daily Traffic1
PerForManCe MeaSUreS
loS1
Total Vehicle Hours of delay2
Total Person Minutes of delay2
Minutes of delay per Vehicle2
Minutes of delay per Person2
Vehicle Travel Time (Minutes)2
distressed Pavement
(lane Miles)4
daily Peak Hour3 daily Peak
Hour3 Peak Hour3 Peak Hour3 Peak Hour3
Parallel and ConneCTing roadwayS
yOL west Capitol Enterprise Boulevard to Capitol Mall 13737 No Data
Data is unavailable for these performance measures at this time however will be pursued in the next phase of the CSMP
SaC
w 5th Street to 26th Street 9194 a
X 5th Street to 26th Street 9154 a
Folsom Boulevard watt avenue to Bradshaw Road 25600 C
watt avenue Folsom Boulevard to US 50 63900 F
Bradshaw Road Folsom Boulevard to US 50 22400 a
Folsom Boulevard Bradshaw Road to Sunrise Boulevard 20400 a
Bradshaw Road Old Placerville to US 50 54405 F
Old Placerville Road Bradshaw Road to Rockingham Drive 11864ndash18365 a
Rockingham Drive Old Placerville Road to Mather Boulevard 16516 E
Mather Boulevard Rockingham Drive to Folsom Boulevard 21732 C
international Drive Rockingham Drive to Zinfandel Drive 12808 a
Zinfandel Drive international Drive to Folsom Boulevard 22298ndash47032 BE
white Rock Road Zinfandel Drive to Sunrise Boulevard 25459 a
Sunrise Boulevard US 50 to Folsom Boulevard No Data No Data
white Rock Road Sunrise Boulevard to Prairie City Road 3400 B
Folsom Boulevard Sunrise Boulevard to iron Point Road 17200 a
white Rock Road grant Line Road to EDSaC County Line 6700 D
iron Point Road Folsom Boulevard to East BidwellScott Road 13984 No Data
Scott Road iron Point Road to white Rock Road No Data No Data
Folsom Boulevard iron Point Road to Blue Ravine Road No Data No Data
Blue Ravine Road Folsom Boulevard to green Valley Road No Data No Data
Prairie City Road US 50 to white Rock Road 6000 D
HigHway 50 corridor system management plans [ 30 ]
c h a p t e r f i v e p e r f o r m a n c e m e a s u r e s
Table 7 Parallel and ConneCTing roadwayS PerForManCe MeaSUreS (ConTinUed)
County location average
daily Traffic1
PerForManCe MeaSUreS
loS1
Total Vehicle Hours of delay2
Total Person Minutes of delay2
Minutes of delay per Vehicle2
Minutes of delay per Person2
Vehicle Travel Time (Minutes)2
distressed Pavement
(lane Miles)4
daily Peak Hour3 daily Peak
Hour3 Peak Hour3 Peak Hour3 Peak Hour3
Parallel and ConneCTing roadwayS
ED
green Valley Road EDSaC County Line to Francisco Drive 22600 D
Data is unavailable for these performance measures at this time however will be pursued in the next phase of the CSMP
green Valley Road Francisco Drive to Silva Valley Parkway 13077 D
green Valley Road Silva Valley Parkway to Cameron Park 9849 C
green Valley Road Cameron Park Drive to Deer Valley Road 5278 C
green Valley Road Deer Valley Road (East) to Lotus Road 8381 D
green Valley Road Lotus Road to Placerville Drive 4669 C
Latrobe Road white Rock Road to US 50 24742 C
Durock Road Cameron Park Dr to South Shingle Road 7278 C
Cameron Park Drive Durock Road to US 50 (Durock Road to Coach Lane Coach Lane to US 50) 9544 26603 CD
South Shingle Road Durock Road to US 50 11390 D
white Rock Road EDSaC County Line to Latrobe 12808 D
white Rock Road Latrobe Rd to Silva Valley Pkwy (Latrobe to PostPost to Silva Vlly Pkwy) 10124 CD
Silva Valley Parkway white Rock Rd to Serrano Pkwy (white Rock to Entrada Entrada to Serrano Pkwy) 13708 9328 DC
Forni Road Placerville Drive to Main Street 9049 8379 No Data
Placerville Drive Forni Road to US 50 No Data No Data
Main Street Placerville Drive to Bedford avenue No Data No Data
Main Street Bedford avenue to Broadway No Data No Data
Broadway Main Street to Point View Drive No Data No Data
1 Source Average Daily Traffic and Level of Service (LOS) calculated are based on City of Sacramento between 2001 and 2007 Sacramento County from 20072008 City of Rancho Cordova between 2004 and 2007 and El Dorado County from 2007
HigHway 50 corridor system management plans [ 31 ]
c h a p t e r f i v e p e r f o r m a n c e m e a s u r e s
Page Inte
ntionally
Left
Blank
[ 32 ] HigHway 50 corridor system management plan
c h a p t e r f i v e p e r f o r m a n c e m e a s u r e s
tabLe 8 traNSit PerforMaNCe MeaSure
County transit Provider route Performance Measure
available daily Capacity ()1 available Peak Hour Capacity1
traNSit
SaC
SacRT (Bus)
Route 21 70 10
Route 28 76 59
Route 36 83 74
Route 38 66 44
Route 72 56 20
Route 73 79 45
Route 74 82 43
Route 109 47 22
SacRT (Light Rail) Gold Line 31 Exceeds Capacity
EDSAC ED County Transit Authority
Commuter Express Bus Service Not applicablendashOperates Peak Hour
Only 405
iron Point Connector 764 Not available
Reverse Commuter Not applicablendashOperates Peak Hour Only 982
yoloSaC yolo County Transit District Not applicablendashOperates Peak Hour Only 498
biKe3
1 Source average Daily and Peak Hour available Capacity calculated from each transit providerrsquos route ridership data 2 The Reverse Commuter service is offered on vehicles that are returning to El Dorado County (Commuter Express Buses) 3 Bicycle performance measure(s) will be identified applied and included in the subsequent CSMPs
HigHway 50 corridor system management plan [ 33 ]
c h a p t e r f i v e p e r f o r m a n c e m e a s u r e s
[ 34 ] HigHway 50 corridor system management plan
Page Inte
ntionally
Left
Blank
planned corridor system management strategies
chapter six
ConCept LoS and ConCept FaCiLit y ldquoConcept LOSrdquo and ldquoConcept Facilityrdquo have traditionally been used in Caltrans TCCRs to reflect the minimum level or quality of operations acceptable for each route segment within the 20-year planning period and the highway facility needed in the next 20 years to maintain the Concept LOS
Typical Concept LOS standards in Caltrans District 3 are LOS ldquoDrdquo in rural areas and LOS ldquoErdquo in urban areas how-ever some heavily congested route segments now have a Concept LOS ldquoFrdquo because the improvements required to bring the LOS to ldquoErdquo are not feasible due to environmental right of way financial and other constraints The applica-tion of multi-modal corridor management strategies should reduce the severity and duration of congestion and provide viable travel options and information that will enable a traveler to avoid severe freeway congestion
The Concept LOS and Concept Facility for US 50 are shown in Table 9 almost all US 50 segments are forecasted to operate under LOS ldquoFrdquo conditions in 20 years under the No-Build and Build scenarios
Corridor ManageMent StrategieS The US 50 CSMP also proposes specific strategies to enhance corridor mobility (see Table 10) based on the fol-lowing principles
bull Manage all modes and facilities in the corridor as a single system beginning with the transportation net-work defined in this CSMP
bull Implement comprehensive and dynamic multimodal monitoring and reporting for the system and for all modes
bull Develop and use micro-simulation modeling to identify mobility challenges and to evaluate proposed solutions
bull Complete the projects included in the regional trans-portation plans with an emphasis on the completion of the key mobility improvement projects identified in this CSMP (see Tables 11 and 12)
bull Implement the specific strategies outlined in this CSMP
Key CapitaL projeCtS Tables 11 and 12 contain key capital projects that have been identified as the most critical to corridor mobility These are also included in the SaCOg MTP for 2035 and are either planned without any funding yet programmed are partially programmed
The US 50 CSMPor are entirely programmed SACOG conducted significant proposes specific
public attitude research strategies to enhance for the MTP for 2035 to corridor mobility complement comprehensive outreach efforts through community workshops the TALL Order Moving the Region Forward event the televised Town Hall Road Map for the Future and associated public polling The results of the SaCOg analyses and public out-reach for the MTP were
highway 50 corridor system management plan [ 35 ]
c h a p t e r s i x p l a n n e d c o r r i d o r s y s t e m m a n a g e m e n t s t r a t e g i e s
[ 36 ] HigHway 50 corridor system management plan
used when selecting the key projects for identification in
the CSMP and to ensure consistency Not all corridor projshyects in the MTP are included in the CSMP since the CSMP focuses on the managed network and the SaCOg MTP considers all streets and roads bike routes and transit services in the corridor
highway 50 partnership The Highway 50 Partnership is a cooperative public-private effort among the County of Sacramento City of Rancho
Cordova City of Folsom County of El Dorado and several major landowners that recognize the need to consider corrishydor mobility needs holistically
The Partnership has collaborated effectively to develop a Plan to improve mobility in the US 50 Corridor from Rancho
Cordova to El Dorado Hills an area identified as approprishyate for growth in the SACOG Blueprint Recognizing the
need to generate private investment the Partnership is seeking to implement a regional Highway 50 Corridor fee program to fund these projects
in addition to the key projects indicated in Table 11 Table 12 displays the key projects identified by the
Partnership
These projects include (1) Near-Term Priority Improvement Projects and (2) Near-Term Expected Roadway Improveshyments
The Near-term Priority improvement Projects would proshyvide several new roadway connections for people to travel within and through the area to avoid congestion They also include new transit routes and widening existing roadways
viewed by the Partnership as a package that would provide system-wide travel benefits These improvements targeted
for completion through 2012 would reduce vehicle hours of delay during commute hours by 30 percent
The near-Term Expected Roadway Improvements are conshysidered by the Partnership to be readily expected since they are tied to expected development or are part of a near-term
capital improvements program
Visionary projects Visionary projects are not yet included in the SaCOg MTP or EDCTC RTP but appear to offer considerable corridor mobilshyity benefits and merit further analysis and consideration for inclusion in the next MTP and RTP These are displayed in
Table 13
The ldquoPlus 10 Listrdquo in the SACOG MTP identifies projects
that are attractive from a performance standpoint but could not be included in the Final Project Lists because of financial constraint The ldquoPlus 10 Listrdquo element offers the
opportunity to include projects that would not be affordshyable without additional funding Some projects identified in
the Visionary Projects List were analyzed by SACOG during
development of the current MTP Some of these are included in the ldquoPlus 10 Listrdquo
Watt Avenue Light Rail Station Improvement Project
c h a p t e r s i x p l a n n e d c o r r i d o r s y s t e m m a n a g e m e n t s t r a t e g i e s
Table 9 US 50 ConCePT loS and FaCiliTy TyPe
location Forecasted level of Service1 (loS) and Facility Type
County description and location From Post Mile To Post Mile Current
loS1 20-year no build loS12
20-year build loS12
20-year Concept
loS13 existing Facility4 Concept Facility456 Ultimate Facility457
yOL interstate 80 to yoloSacramento County Line
000 316 F F F F 8F (6F between Jefferson Blvd ramps)
8F+2HOV+aux Lanes 8F+2HOV+aux Lanes
SaC yoloSacramento County Line to SR 99 and 51
L000 L248 = R000 F F F F 8F 8F+2HOV+aux Lanes 8F+2HOV+aux Lanes
SaC State Routes 99 and 51 to watt avenue R000 R534 F F F F 8F 8F+2HOV+aux Lanes 8F+2HOV+aux Lanes
SaC watt avenue to Zinfandel Drive R534 R1092 F F F F 8F 8F+2HOV+aux Lanes 8F+2HOV+aux Lanes
SaC Zinfandel Drive to Sunrise Boulevard R1092 1250 E F F F 8F 8F+2HOV+aux Lanes 8F+2HOV+aux Lanes
SaC Sunrise Boulevard to Folsom Boulevard 1250 1701 E F F F 6F+2HOV to Hazel ave 4F+2HOV
to Folsom Blvd
6F+2HOV+aux Lanes to Hazel ave 4F+2HOV+aux
Lanes to Folsom Blvd
8F+2HOV+aux Lanes
SaC Folsom Boulevard to SaCED County Line 1701 2314 D F F F 4F+2HOV 4F+2HOV+aux Lanes 6F+2HOV+aux Lanes
ED SacramentoEl Dorado County Line to Cameron Park Drive
000 R657 E F F F 4F 4F+2HOV+aux Lanes 6F+2HOV+aux Lanes
ED Cameron Park Drive to Missouri Flat Road R657 R1506 E F E E 4F 4F+2HOV+aux Lanes to greenstone 4F+aux Lanes
to Missouri Flat
6F+2HOV+aux Lanes to greenstone 4F+2HOV+aux Lanes
to Missouri Flat
ED Missouri Flat Road to End of Freeway in Placerville
R1506 1725 D F F F 4F 4F+aux Lanes 4F+aux Lanes
ED End of Freeway in Placerville to Bedford avenue
1725 1811 D E E E 4E 4E 4E
ED Bedford avenue to Cedar grove Exit 1811 R2595 D F F F 4F to Smith Flat 4E to Camino 4F+aux Lanes to Smith Flat 4E to Camino
4F+aux Lanes
1 Level of Service (LOS) A ldquoreport cardrdquo for evaluating traffic flow with ldquoArdquo being the best and ldquoFrdquo being the worst 2 20-year LOS (No Build) The LOS that would be expected at 20 years with no improvements 3 20-year Concept LOS The minimum acceptable LOS over the next 20 years 4 Facility Type Codes C=Conventional Highway E=Expressway F=Freeway HOV=High Occupancy Vehicle Lanes aux=auxiliary Lanes 5 Operational improvements are included in future facilities for all segments Examples of operational improvements include TOS improvements and auxiliary lanes 6 Concept Facility the future roadway with improvements needed in the next 20 years if LOS ldquoFrdquo no further degradation of service from existing ldquoFrdquo is acceptable as indicated by delay performance measurement 7 Ultimate Facility The future roadway with improvements needed beyond a 20 year timeframe
HigHway 50 corridor system management plans [ 37 ]
c h a p t e r f i v e p e r f o r m a n c e m e a s u r e s
Table 10 US 50 CSMP STraTegieS
Strategy description implementation Challenges
Maintain and operate the existing corridor multi-modal trans-
portation infrastructure
Maintain the existing investment in all modes of the transportation system and provide adequate resources for daily operations including operating
revenues for transit services
Funding availability funding competition within the region
Fully coordinate the delivery of transportation services and facili-ties in the corridor including daily operations and system planning
for enhancements
Interagency operational coordination to maximize the efficiency and effec-tiveness of all modes operating in the corridor with a focus on the CSMP transportation network defined in this CSMP Use of an existing group or
committee to provide initial oversight for this strategy
Diverse interests and competing priorities and limited resources
Construct planned and pro-grammed corridor capital improve-
ment projects
implementation of the capital improvements in the corridor included within the approved Metropolitan Transportation Plan and Regional Transportation
Plan for all transportation modes within the scope schedule and cost specified
Funding availability funding competition within the region
Comprehensive daily monitoring of the status of all modes providing service on the CSMP transporta-
tion network
Full deployment of multimodal transportation service status detection systems for all CSMP network components
Funding availability funding competition within region
Provide traveler information to the public
Provide the public with real-time easily accessible information regarding the status of all CSMP transportation system components so as to allow travel-
ers to make informed decisions about trip mode time and routing options
Funding availability funding competition within region
Continually monitor and analyze the CSMP transportation network to improve system performance
Monitor transportation performance measures and make system modifica-tions as appropriate on a frequent and timely basis Staff resources and data availability
Decrease the duration of non-recurrent traffic congestion
Expand and enhance the Freeway Service Patrol to respond to automobile accidents and vehicle break-downs
Funding availability funding competition within the region
Timely implementation of STaRNET
Expedite the implementation of the STaRNET operators of transportation facilities and emergency responders in the Sacramento region through real-time sharing of data and live video refinement of joint procedures
pertaining to the operation of roadways and public transit and public safety activities as well as enhance the regionrsquos 511 web site and interactive
telephone service to provide more traveler information
Developmental time acceptance by agencies and integration into daily use and identifica-
tion of maintenance and operations funding
Enhance transit and rail service increase transit service frequency provide express transit services imple-
ment bus rapid transit routes reduce headways for light rail and buses and construct planned light rail line extensions
Funding availability funding competition within the region
Complete Bus Carpool lane network
Complete the regional buscarpool lane network including freeway-to-freeway HOV lane connectors
Funding availability funding competition within the region Public agency and public
acceptance of network
[ 38 ] HigHway 50 corridor system management plan
c h a p t e r s i x p l a n n e d c o r r i d o r s y s t e m m a n a g e m e n t s t r a t e g i e s
tabLe 10 uS 50 CSMP StrategieS (ConTInued)
Strategy Description implementation Challenges
Enhance Transportation Demand Management strategies
Encourage employers to provide telecommuting and flexible working hour options to employees
acceptance by employers and resources to participate
Optimize the timing and synchronishyzation of traffic signals
Coordinate the optimization and timing of traffic signals on freeway ramps and along parallel and connecting roadways within and between jurisdicshytions to improve traffic flow and reduce congestion Provide signal priority
systems for transit vehicles
Funding availability and coordination among cities counties and Caltrans
improve access management of freeways and parallel connecting roadways
Develop and implement access management strategies to maintain the operational efficiency of freeways and parallelconnecting roadways
agreement between responsible jurisdicshytions as to where increased access control is needed increased access control on some parallelconnecting roadways may increase
traffic volumes on non-corridor roads
Develop innovative use of CMSs (eg travel times)
Potential uses of CMSs to improve system efficiency include the use of CMSs along portions of all corridors near transit station to indicate travel
times based on real-time existing traffic conditions on the freeway as well as on parallel roadways and express bus and light rail services CMS can also be used to identify the number of parking spaces that are still available at
the light-rail stations
Funding availability funding competition within the region
Implement amp expand Transit AVLTransit status information
enhancements for system users
Expand the use of AVL systems utilizing GPS technology to track in real-time the location of transit vehicles monitor transit schedules dispatch transit vehicles and provide real-time passenger information such as ldquonext busrdquo or
ldquonext trainrdquo arrival times
Funding availability funding competition within region
Expand Park-and-Ride lots at key locations
Add additional capacity to existing park-and-ride lots near transit stations and other locations that are approaching capacity
Funding availability funding competition within the region and available land
improve bike-pedestrian access in the CSMP
transportation network
Plan and program for construction of additional bicycle paths lanes and related improvements for access and connectivity to transit park and ride
lots and destination points
Funding availability funding competition within the region
Provide ldquoBike-SharingrdquordquoCar-Sharingrdquo tofrom transit (ldquoCarlinkrdquo) and from
neighborhoods
Expand the Regional Rideshare and Spare-the-Air programs to include bicycle and car sharing opportunities
Funding availability and coordination between SaCOg TMa air Districts employers developshyers property managers and local government
officials
Provide parking management stratshyegies in interested jurisdictions where applicable to discourage
use of single-occupant vehicles
in higher-density areas provide preferential parking for carpools and vanshypools require residential parking permits remove on-street parking and or provide graduated parking fees for metered on-street parking based on
vehicle type and time of day for SOV spaces to encourage transit use
Acceptance by businesses local officials and the general public
Expand bicycle commute amp transit fare strategiessubsidies
increase participation by large employers in programs that subsidize transit fares for employees during peak-hour commute times and provide bicycling
to work incentives
Voluntary participation by large employers to pay subsidy to transit providers
HigHway 50 corridor system management plan [ 39 ]
c h a p t e r s i x p l a n n e d c o r r i d o r s y s t e m m a n a g e m e n t s t r a t e g i e s
tabLe 11 KeY CaPitaL ProjeCtS
CountyLead agency
route roadway from to Project
Description Programmed
funds
additional funding Needed
total Cost estimate (x $1000)
Comp Year (FFY)
uS 50
Sacramento Caltrans District 3
US 50 Downtown watt avenue HOV Lanes $0 $75000 $75000 2020
Sacramento Caltrans District 3
US 50 watt avenue Sunrise Blvd HOV Lanes $165000 $0 $165000 2013
Sacramento Caltrans District 3
US 50 Bradshaw Road
Mather Field Road
Eastbound and Westbound Auxiliary Lanes
$0 $3700 $3700 2016
Sacramento Caltrans District 3
US 50 State Route 99
(Oak Park Interchange) interchange improvements including buscarpool lane
connectors $0 $150000 $150000 2014
Sacramento Caltrans District 3
US 50 interstate 5
(Riverfront Interchange) Riverfront Interchange
improvements including bus carpool lane connectors
$30000 $170000 $200000 2016
ED Caltrans District 3 US 50 Camino
Operational Safety improvements Construct an
undercrossing median barrier modify local road connections andor associated operational improvements on and adjacent
to US 50
$15000 $0 $15000 2012
ED ED County DOT US 50
west of Latrobe Road
west of Bass Lake
grade HOV Lanes (Ph1) $47141 $0 $47141 2010
ED Caltrans District 3 US 50
west of Bass Lake Road
Ponderosa Road
HOV Lanes (Ph2) $55000 $0 $55000 2011
ED Caltrans District 3 US 50 Ponderosa
Road greenstone
Road HOV Lanes (Ph3) $22357 $0 $22357 2013
ED ED County DOT US 50 Future Silva
Valley iC
Future Empire Ranch IC
Mainline Widening construct new WB lane within the
median from proposed Silva Valley IC to proposed Empire
Ranch IC
$2950 $0 $2950 2013
[ 40 ] HigHway 50 corridor system management plan
c h a p t e r s i x p l a n n e d c o r r i d o r s y s t e m m a n a g e m e n t s t r a t e g i e s
tabLe 11 KeY CaPitaL ProjeCtS (ConTInued)
CountyLead agency
route roadway from to Project
Description Programmed
funds
additional funding Needed
total Cost estimate (x $1000)
Comp Year (FFY)
PARALLEL AnD COnnECTInG ROADWAYS
ED ED County DOT
Silva Valley Parkway
Entrada Drive
Future US 50
Silva Valley Parkway iC
Widen Silva Valley Road from 2 lanes to 4 lanes includes
Class ii bike lanes and left turn storage pockets
$2921 $0 $2921 2010
ED ED County DOT
Silva Valley Parkway US 50
US50 Silva Valley Parkway (Phase 2) Includes constructshying overcrossing and ramps
signalization at EB and WB on off ramps
$57817 $0 $57817 2016
ED ED County DOT
Headington Road
Missouri Flat Road
El Dorado Road
Extend 2 lanes with median $9878 $0 $9878 2012
ED ED County DOT
Durock Road
Robin Lane South
Shingle Road
Extend 2 lanes with median $1239 $9214 $10453 2015
ED ED County DOT
Durock Road
Business Center Drive intersection signalization
includes adding turn pockets on Durock Road
$4333 $0 $4333 2009
ED City of Placerville
Point View Drive Broadway Smith Flat
Road Extend 2 lanes $1300 $0 $1300 2020
ED City of Placerville
western Placerville
US 50 interchange
Forni Road Ray Lawyer
Drive
Placerville Drive
Interchange Reconstruction convert Ray Lawyer Dr
Overcrossing to full IC Auxiliary Lanes
$5059 $34741 $39800 2020
Sacramento City of Rancho
Cordova
Mather Boulevard
Rockingham Road
Zinfandel Drive widen to 4 lanes $0 $8617 $8617 2020
Sacramento Rancho Cordova
Parkway ii
Grant Line Road
White Rock Road
New 6-lane expressway includshying intersection improvements at Kiefer Blvd amp White Rock
Road
$0 $44518 $44518 2020
Sacramento City of Folsom
Scott Road US 50 White Rock Rd
widen from 2 to 6 lanes $16000 $0 $16000 2020
Sacramento Sacramento County DOT
White Rock Road
Grant Line Rd
Prairie City Rd
Widen from 2 to 4 lanes realign near Nike and Nimbus Roads and connect with existshying alignment west of Prairie City Rd Realign Grant Line Rd to intersect with realigned
White Rock Rd
$26600 $0 $26600 2020
Sacramento Sacramento County DOT
Hazel avenue
US 50 Hazel Madison
Widen American River Bridge and approaches from 4 to 6 lanes Widen Hazel Avenue from AR Bridge to Madison from 4 to 6 lanes with Bike
LanesSignals
$83530 $0 $83530 2020
HigHway 50 corridor system management plan [ 41 ]
c h a p t e r s i x p l a n n e d c o r r i d o r s y s t e m m a n a g e m e n t s t r a t e g i e s
tabLe 11 KeY CaPitaL ProjeCtS (ConTInued)
CountyLead agency
route roadway from to Project
Description Programmed
funds
additional funding Needed
total Cost Estimate (x $1000)
Comp Year (FFY)
PARALLEL AnD COnnECTInG ROADWAYS
ED ED County DOT
green Valley Road
Salmon Falls Road
east
Deer Valley Road
widen from 2 to 4 lanes $0 $14576 $14576 2025
ED ED County DOT
green Valley Road
Deer Valley Road east Lotus Road widen $958 $4513 $5471 2015
ED ED County DOT
green Valley Road
Francisco Drive
Salmon Falls Road
widen from 2 to 4 lanes divided $412 $3491 $3903 2015
ED ED County DOT
Latrobe Road
investment Boulevard
golden Foothill Parkway
widen from 2 lanes undivided to 4 lanes
divided $1076 $8792 $9868 2015
ED ED County DOT
Latrobe Road
Carson Creek
White Rock Road
widen from 4 to 6 lanes $0 $23755 $23755 2025
ED ED County DOT
white Rock Road
EDSac County Line
Manchester Drive
widen 2 to 4 lanes divided includes signal interconnect and coorshy
dination
$0 $23755 $23755 2025
Sacramento City of Rancho
Cordova
Easton Valley
Parkway
Prairie City Road
Empire Ranch Road extenshysion south of
US 50
Construct new 4 lane road $0 $45000 $45000 2020
Sacramento Sacramento County DOT
Hazel avenue
Easton Valley
Parkway
Grant Line RoadWhite Rock Road
New road extension 4 lane limited access
through aerojet property $0 $18000 $18000 2018
Sacramento Sacramento County DOT
white Rock Road
Prairie City Road
ED County Line
widen to 4 lanes $8330 $64773 $73103 2018
Sacramento Sacramento County DOT
green Valley Road
East Natoma Sacramento ED County
line widen to 4 lanes $0 $3000 $3000 2018
Sacramento City of Rancho
Cordova
Zinfandel Drive
international Drive
Folsom Boulevard
widen to 4 lanes $0 $12000 $12000 2020
[ 42 ] HigHway 50 corridor system management plan
c h a p t e r s i x p l a n n e d c o r r i d o r s y s t e m m a n a g e m e n t s t r a t e g i e s
tabLe 11 KeY CaPitaL ProjeCtS (ConTInued)
CountyLead agency
route roadway from to Project
Description
Pro-grammed
funds
addi-tional
funding Needed
total Cost estimate (x $1000)
Comp Year (FFY)
traNSit
yolo amp Sacramento City of west Sacramento
amp City of Sacramento
Sacramento River
Crossing
15th Street in the City
of west Sacramento
Broadway in the City of
Sacramento
New all-modal river crossing (Auto Transit Bike amp Pedestrian)
from Sacramento across the Sacramento River to West
Sacramento The crossing was modeled between Broadway in Sacramento amp 15th Street in
West Sacramento but final alignshyment options will be studied in subsequent planning efforts
$800 $99200 $100000 2019
Sacramento Cal State University
Sacramento
CSUS Campus mdash mdash
Sac State Tram adjoining City streets and SRTD 65th Street light railbus transfer station Bus Rapid Transit System
$23574 $0 $23574 2013
Sacramento City of Rancho
Cordova
Rancho Cordova Various Various
New Service Rancho Cordova Pilot Transit Shuttle System new transit service for connection to
RTs Gold Line
$2380 $1500 $38880 2014
yolo amp Sacramento City of west Sacramento
TBD west
Sacramento Sacramento Streetcar Service between west
Sacramento and Downtown Sacramento
$17400 $54700 $72100 2014
Sacramento City of Rancho
Cordova RT Gold Line
RT Gold Line Tracks
Mather Field Road
Light Rail Grade Separations $0 $52888 $52888 2025
Sacramento City of Rancho
Cordova RT Gold Line
RT Gold Line Tracks Zinfandel Drive Light Rail Grade Separations $0 $52888 $52888 2025
Sacramento City of Rancho
Cordova RT Gold Line
RT Gold Line Tracks
Bradshaw Road
Light Rail Grade Separations $0 $35260 $35260 2025
Sacramento City of Rancho
Cordova RT Gold Line
RT Gold Line Tracks Routier Road Light Rail Grade Separations $0 $35260 $35260 2025
Sacramento City of
Sacramento Sacramento Valley Station
Sacramento intermodal Transportation Facility (Phase 1) - Develop intermodal transportashytion terminal for heavy rail light
rail and bus service
$77799 $0 $77799 2010
Sacramento City of
Sacramento Sacramento Valley Station
Sacramento intermodal Transportation Facility (Phase 2) - Develop intermodal transportashytion terminal for heavy rail light
rail and bus service
$24101 $1000 $25101 2014
HigHway 50 corridor system management plan [ 43 ]
c h a p t e r s i x p l a n n e d c o r r i d o r s y s t e m m a n a g e m e n t s t r a t e g i e s
TABLE 11 KEY CAPITAL PROJECTS (CONTINUED)
CountyLead Agency
Route Roadway From To Project
Description Programmed
Funds
Additional Funding Needed
Total Cost Es-timate (x $1000)
Comp Year (FFY)
BICYCLE ROUTES
Sacramento City of Rancho
Cordova
US 50Mather Field Road IC US 50 Mather
Field Road
US 50Mather Field Road PedestrianBike Crossing along
the Mather Airport RR Spur alignment
$0 $820 $1055 2015
ED ED County DOT
Sacramento Placerville
Transportation Corridor
Forni Rd
Missouri Flat Rd Class I Bike Trail $1423 $111 $1534 2009
ED City of Placerville
El Dorado Trail Western
Extension
Canal Street Main Street
Ray Lawyer DriveForni
Road Class 1 Bike Trail $1850 $0 $1850 2010
ED ED County DOT
US 50ED Hills Blvd IC US 50
El Dorado Hills Blvd
Latrobe Road
US 50El Dorado Hills Blvd Pedestrian Overcrossing $5508 $66 $5574 2014
TABLE 12 50 MOBILITY PARTNERSHIP KEY CAPITAL PROJECTS
RouteRoadway From To Project Description
NEAR TERM PRIORITY IMPROVEMENT PROJECTS
US 50 Sunrise Scott Road Auxiliary Lane
US 50 Hazel Avenue Interchange Improvements
Hazel Avenue Folsom Boulevard Easton Valley Parkway New 4 Lane Road
Easton Valley Parkway Hazel Avenue Rancho Cordova Parkway New 6 Lane Road
Rancho Cordova Parkway Easton Valley Parkway White Rock Road New 4 Lane Road
White Rock Road Sunrise Boulevard Silva Valley Parkway Widen to 4 Lanes
RT Gold Line Hazel Iron Point Station Passing Tracks
US 50 Rancho Cordova Parkway New Interchange
Zinfandel Drive South of International Douglas Road New 4 Lane Road
International Drive Kilgore Road Rancho Cordova Parkway New 6 Lane Road
Douglas Road Zinfandel Extension Sunrise Boulevard Widen to 4 Lanes
Sunrise LRT Citrus Road Sunrise Mall Bus Rapid TransitExpress Bus
[ 44 ] HIGHWAY 50 corridor system management plan
c h a p t e r s i x p l a n n e d c o r r i d o r s y s t e m m a n a g e m e n t s t r a t e g i e s
TABLE 12 50 mOBILITY PARTnERSHIP kEY CAPITAL PROjECTS (COnTInUED)
routeroadway from to Project Description
US 50 nEAR TERm PRIORITY ImPROVEmEnT PROjECTS
US 50 Empire Ranch Road New interchange
US 50 Silva Valley New interchange
US 50 Scott Road Empire Ranch Road Aux Lanes
US 50 Empire Ranch Road El Dorado Hills Boulevard Aux lanes and climbing lanes
US 50 El Dorado Hills Boulevard Silva Valley Parkway Aux lanes and climbing lanes
US 50 Silva Valley Parkway Bass Lake Road Aux lanes
Sunrise Boulevard White Rock Road Douglas Boulevard widen to 6 lanes
Sunrise Boulevard Douglas Boulevard Jackson Road widen to 4 lanes
White Rock Road Sunrise Boulevard Future Rancho Cordova Parkway and El Dorado County Line to Latrobe Road
widen to 4 lanes
Douglas Boulevard Sunrise Boulevard Grant Line Road widen to 4 lanes
Rancho Cordova Parkway Douglas Boulevard Rio del Oro Parkway New 2 lane road
Rancho Cordova Parkway Rio del Oro Parkway White Rock Road New 6 lane road
Jaeger Road Douglas Road Kiefer Boulevard New 4 lane road
Chrysanthy Sunrise Boulevard Americanos Boulevard New 4 lane road
Kiefer Boulevard Sunrise Boulevard Jaeger Road New 4 lane road
Grant Line Road Douglas Road Chrysanthy Road widen to 4 lanes
Hazel avenue Gold Country Boulevard Madison avenue widen to 6 lanes
Latrobe Road South of White Rock Road widen to 4 lanes
TABLE 13 VISIOnARY PROjECTS
County routeroadway from to Project Description
Sac yolo US 50 Enterprise Downtown Sacramento HOV Lanes
ED TBD Folsom Placerville Transit ndash Type TBD
ED New Road Latrobe Road White Rock Road (poten shy
tially US 50) New 2-lane road
HigHway 50 corridor system management plan [ 45 ]
c h a p t e r s i x p l a n n e d c o r r i d o r s y s t e m m a n a g e m e n t s t r a t e g i e s
[ 46 ] HigHway 50 corridor system management plan
Page Inte
ntionally
Left
Blank
congestion and bottleneck analysis
chapter seven
The 2000 Highway Capacity Manual defines a bottleneck
as ldquoa road element on which demand exceeds capacityrdquo
The bottleneck analysis evaluates specific causes of existshying recurrent traffic congestion in the corridor Freeway bottleneck locations that create mobility constraints are identified and documented and their relative contribution
to corridor-wide congestion is reported The bottleneck locations were determined based on a combination of the use of 2006 PeMS data HiCOMP report probe vehicle tach runs and field observations
Traffic congestion can be categorized as either recurrent
or non-recurrent
recurrent congestion occurs repeatedly at the same place and time of day in a predictable pattern Recurrent congesshytion is often associated with facility capacity limitations changes in capacity conflicting vehicle movements such
as lane merges inadequate number of transit vehicles to handle passenger loads or other persistent physical condishytions of the transportation facility
Non-recurrent congestion is usually attributed to collishysions equipment malfunction community events weather construction projects and other occasional occurrences When transportation systems are close to their maximum
carrying capacity non-recurrent congestion is more likely to occur as there is little excess capacity in the system
The location and extent of the bottlenecks on US 50 found
in the aM and PM peak periods are summarized in Tables 14 and 15 These depictions should be considered a snapshyshot view and not a comprehensive analysis of all bottleshynecks in the corridor Further work is being conducted to
refine the identification and causality of bottlenecks within
the corridor Table 14 shows a summary of the US 50 eastbound bottlenecks while the tables that follow discuss each bottleneck including location and possible causality Table 15 shows a summary of the US 50 westbound bottleshynecks while the tables that follow discuss each bottleneck including location and possible causality Minor or hidden bottlenecks are those Freeway bottleneck
that are not as defined locations that create (or severe) as the major mobility constraints bottlenecks Please note are identified and that the graphics accomshy documented and their panying the bottlenecks
relative contribution to are not to scale
corridor-wide congestion Major bottlenecks in the is reported eastbound direction during the aM peak period are at Howe avenue and during the PM peak period are at 48th Street Howe Avenue Mayhew Road Routier Road Sunrise Boulevard and El Dorado Hills Boulevard Major bottlenecks in the westbound direction during the aM peak period are at El Dorado Hills Boulevard Hazel Avenue Zinfandel Drive
HigHway 50 corridor system management plan [ 47 ]
c h a p t e r s e v e n c o n g e s t i o n a n d b o t t l e n e c k a n a l y s i s
Bradshaw Road and Howe Avenue and major bottleneck
locations during the PM peak period are at Zinfandel Drive Routier Road Bradshaw Road Howe Avenue and Intershystate 5
Causalities for these bottlenecks range from high-traffic
demand (congestion) heavy weavingmerging areas or physical constraints such as lane drops lack of ramp meters incomplete HOV network incomplete Auxiliary Lane
network poorly coordinated traffic signals and an off-ramp
queue (Sunrise Boulevard) US 50 Westbound Onramp
TABLE 14 US 50 EASTBOUnD BOTTLEnECk SUmmARY Source PeMS Caltrans tach runs and
Cambridge Systematics field observations
bottleneck Location PeMS Speed Contours Caltrans Probe Vehicle Runs
Cause aM PM aM PM
A Jefferson Blvd PM 25 Minor Minor Traffic weaving truck volumes and grade
B 48th St PM 7 Minor Major Minor Minor Merge from SR 51 and SR 99
C Howe ave PM 9 Major Major Major weave between Howe and watt
D Mayhew Rd PM 12 Major Minor Major Weaving before Bradshaw Exit
E Routier Rd PM 14 Minor Major Weaving before Mather Field Rd Exit
F Sunrise Blvd PM 185 Minor Major Lane drop HOV add off-ramp queue
G Folsom Blvd PM 22 Minor Minor Lane drop 4 to 3
H El Dorado Hills Blvd PM 275 Major
Poorly coordinated traffic signal on arterial causes spillback onto freeway
a jefferson blvd bottleneck The bottleneck approximately located at Jefferson Blvd is due to weaving traffic as those entershying the freeway from Jefferson Blvd must cross those attempting to exit the freeway to I 5 There is a large number of trucks in the stream which struggle with the grade at this location exacerbatshying the bottleneck
[ 48 ] HigHway 50 corridor system management plan
c h a p t e r s e v e n c o n g e s t i o n a n d b o t t l e n e c k a n a l y s i s
b 48th St bottleneck The bottleneck approximately located at 48th St is due to the additional traffic merging from SR 51 and SR 99 combined with the eventual lane drop at 59th St This queue extends upstream past the off-ramp to SR 5199 These off-ramps are bottlenecks in themselves which spill back and choke the US 50 mainline
C Howe Ave Bottleneck The bottleneck at Howe ave is due to the entering traffic from Howe Ave Two Howe Ave on-ramps feed into US 50 eastbound southbound Howe ave loop on-ramp and northbound Howe ave direct ramp approximately 300 feet apart The watt avenue off-ramp is just down stream with heavy exiting volumes therefore the segment between Howe and watt is characterized by heavy weaving
D mayhew Rd Bottleneck The bottleneck approximately located at Mayhew Rd most likely begins with the additional traffic entering from Watt Ave and ends with the exiting traffic at Bradshaw Rd It is possible that there is a high proportion of weaving traffic with in this section (Watt Ave traffic moving to the left lane and those exiting at Bradshaw Rd moving to the right lane)
HigHway 50 corridor system management plan [ 49 ]
c h a p t e r s e v e n c o n g e s t i o n a n d b o t t l e n e c k a n a l y s i s
[ 50 ] HigHway 50 corridor system management plan
e routier rd bottleneck It is likely that the bottleneck at Routier Rd is due to the same merging conditions associated with Mayhew Rd The area is comprised of both residential and light industrialoffice land uses therefore during the PM peak period there are large volumes of vehicles entering at Bradshaw Rd moving to the left lanes and large volumes of vehicles moving to the right lane to exit at Mather Field Rd
f Sunrise blvd bottleneck At Sunrise Blvd the right-most lane exits while an HOV lane is added as the median lane The bottleneck is formed from vehicles shifting left to avoid exiting at Sunrise Blvd and to enter the HOV lane There is a large volume of vehicles queued at the Sunrise off-ramp which spills back and negatively affects the US 50 mainline
g folsom blvd bottleneck The right-most lane exits to Folsom Blvd leaving one HOV lane and two regular lanes along the US 50 The bottleneck is caused by this lane drop as well as the quick merge at the Folsom on-ramp
c h a p t e r s e v e n c o n g e s t i o n a n d b o t t l e n e c k a n a l y s i s
H The eastbound US 50 at El Dorado Hills Blvd Bottleneck The eastbound El Dorado Hills Blvd bottleneck is caused by a traffic signal on the arterial that often causes spillbacks on the EB loop offramp onto the freeway mainlines
TABLE 15 US 50 WESTBOUnD BOTTLEnECk SUmmARY Source PeMS Caltrans tach runs and Cambridge Systematics field observations
bottleneck Location PeMS Speed Contours Caltrans Probe Vehicle Runs
Cause aM PM aM PM
A El Dorado Hills Blvd PM 275 Major Poorly coordinated traffic
signal on El Dorado Hills Blvd
B Hazel Ave PM 21 Major Entering traffic
C Zinfandel Dr PM 16 Minor Major Major Major Entering traffic
D Routier Rd PM 14 Minor Major Minor Weaving traffic
E Bradshaw PM 13 Major Major Major Merging traffic and curve
F Howe Ave PM 9 Minor Major Major Major Weaving traffic and grade
G SR 51SR 99 PM 6 Minor Lane drop weaving traffic
H i-5 PM 3 Major Weaving traffic
HigHway 50 corridor system management plan [ 51 ]
c h a p t e r s e v e n c o n g e s t i o n a n d b o t t l e n e c k a n a l y s i s
[ 52 ] HigHway 50 corridor system management plan
A El Dorado Hills Blvd Bottleneck The minor bottleneck at El Dorado Hills Boulevard is caused by the traffic signal on El Dorado Hills Blvd that causes spillback on the westbound offramp onto the freeway mainlines
B Hazel Avenue Bottleneck In 2006 the Hazel Ave Bottleneck is caused by the traffic entering at both Hazel Ave and Folsom Blvd (the two on-ramps are separated by about one mile) The bottleneck that would appear at Folsom Blvd combines with the bottleneck at Hazel ave to form a large bottleneck that does not clear until after Hazel ave Sometimes causshying spillbacks as far as Prairies City Road this bottleneck was mitigated in 2007 as part of the GO CALIFORNIA program
C Zinfandel Dr Bottleneck There is heavy traffic coming from Sunrise Blvd but the lane addition immediately after the westbound on-ramp prevents a bottleneck from forming but as traffic flows westward the heavy traffic entering from Zinfandel Dr causes a bottleshyneck here
D Routier Rd Bottleneck The bottleneck at Routier Rd is caused by weaving traffic between Mather Field Rd and Bradshaw Rd This highway segment represents a transition area where vehicles that have been traveling in the left lanes begin to shift to the right lanes to exit while the entering traffic tries to shift to the left lanes
W eav in gLan e Dr o p
c h a p t e r s e v e n c o n g e s t i o n a n d b o t t l e n e c k a n a l y s i s
e bradshaw rd bottleneck The Bradshaw Rd bottleneck is caused by the entering traffic from Bradshaw Road the high truck volumes and the curve west of Bradshaw Two Bradshaw Rd on-ramps feed into US 50 westshybound southbound Bradshaw Rd direct on-ramp and northbound Bradshaw Rd loop on-ramp approximately 400 feet apart
F Howe Ave Bottleneck The Howe ave bottleneck is caused by a grade change and the weaving traffic entering from Howe ave and Hornet Dr competing for the right-most lane with those wanting to exit at 65th Street
G amp H SR 51SR 99 amp I-5 Bottleneck The bottleneck at I 5 is caused by the conflict between entering SR 99 and SR 51 traffic and exiting I-5 traffic as well as the queues formed on the ramps to i-5 which spill back onto US 50 The number of lanes in this section reaches a maximum of 6 and then drops to 4 as two lanes exit at the I-5 freeway This bottleneck is exacershybated during the peak periods when it stretches upstream to the lane drop before SR 99
W ea v in g
Lan e Dr o p
HigHway 50 corridor system management plan [ 53 ]
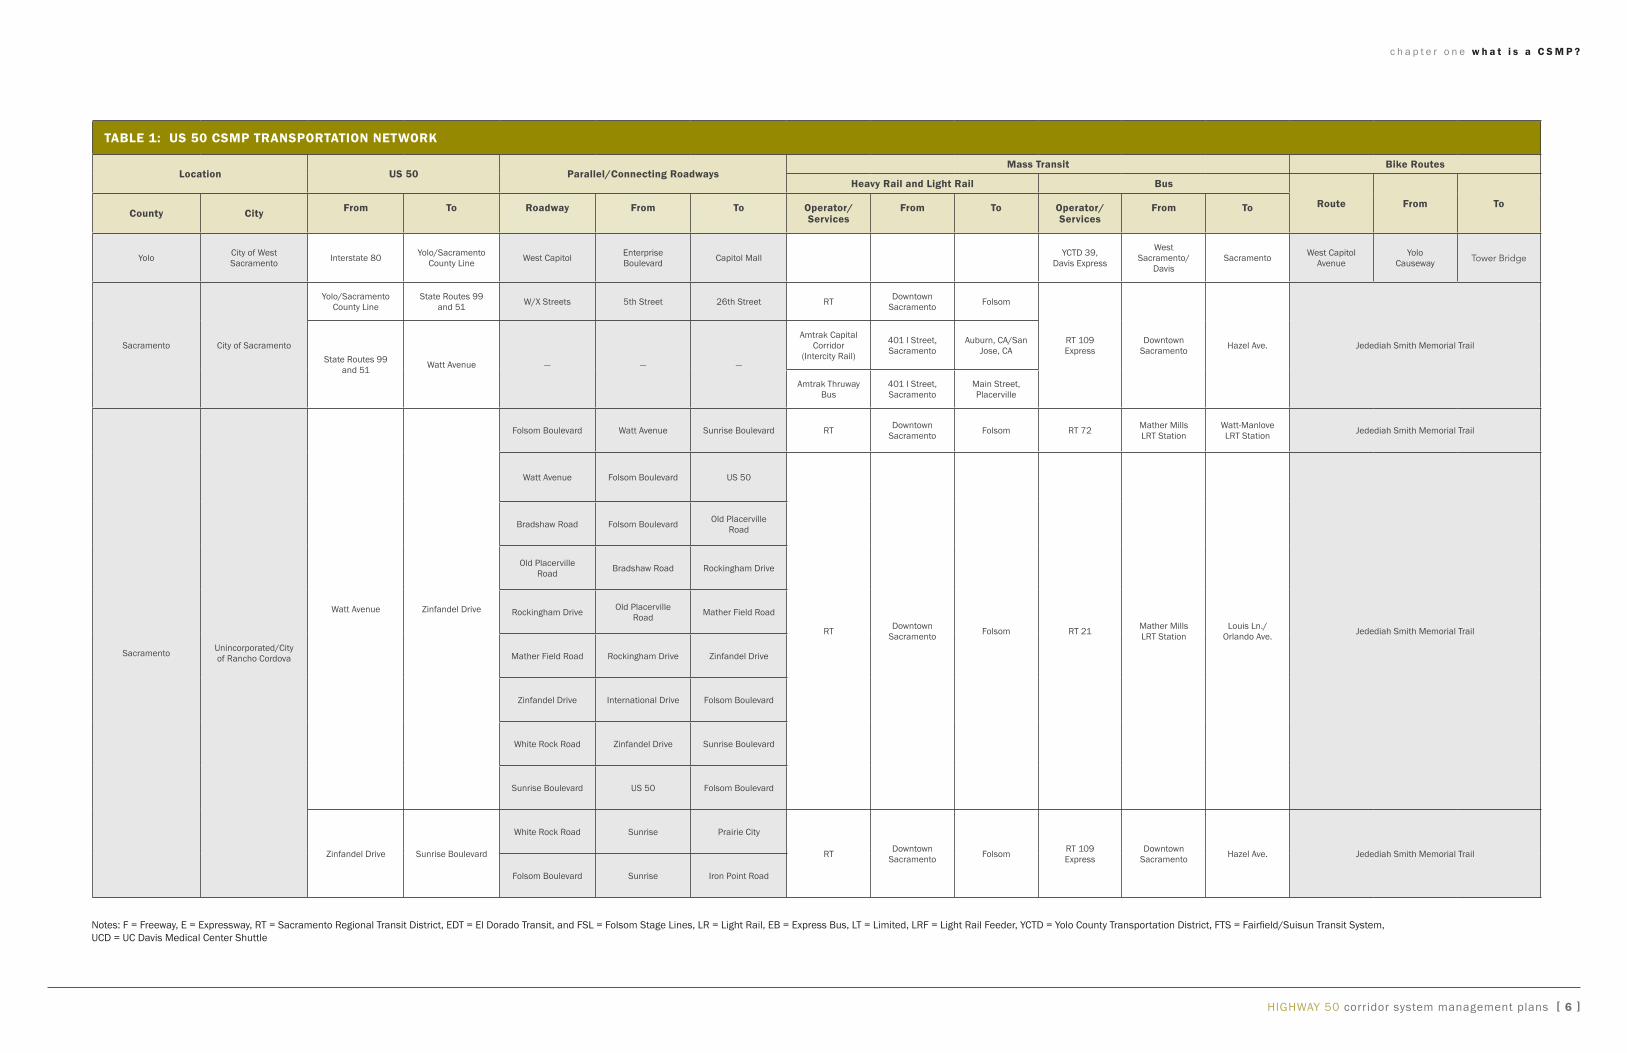
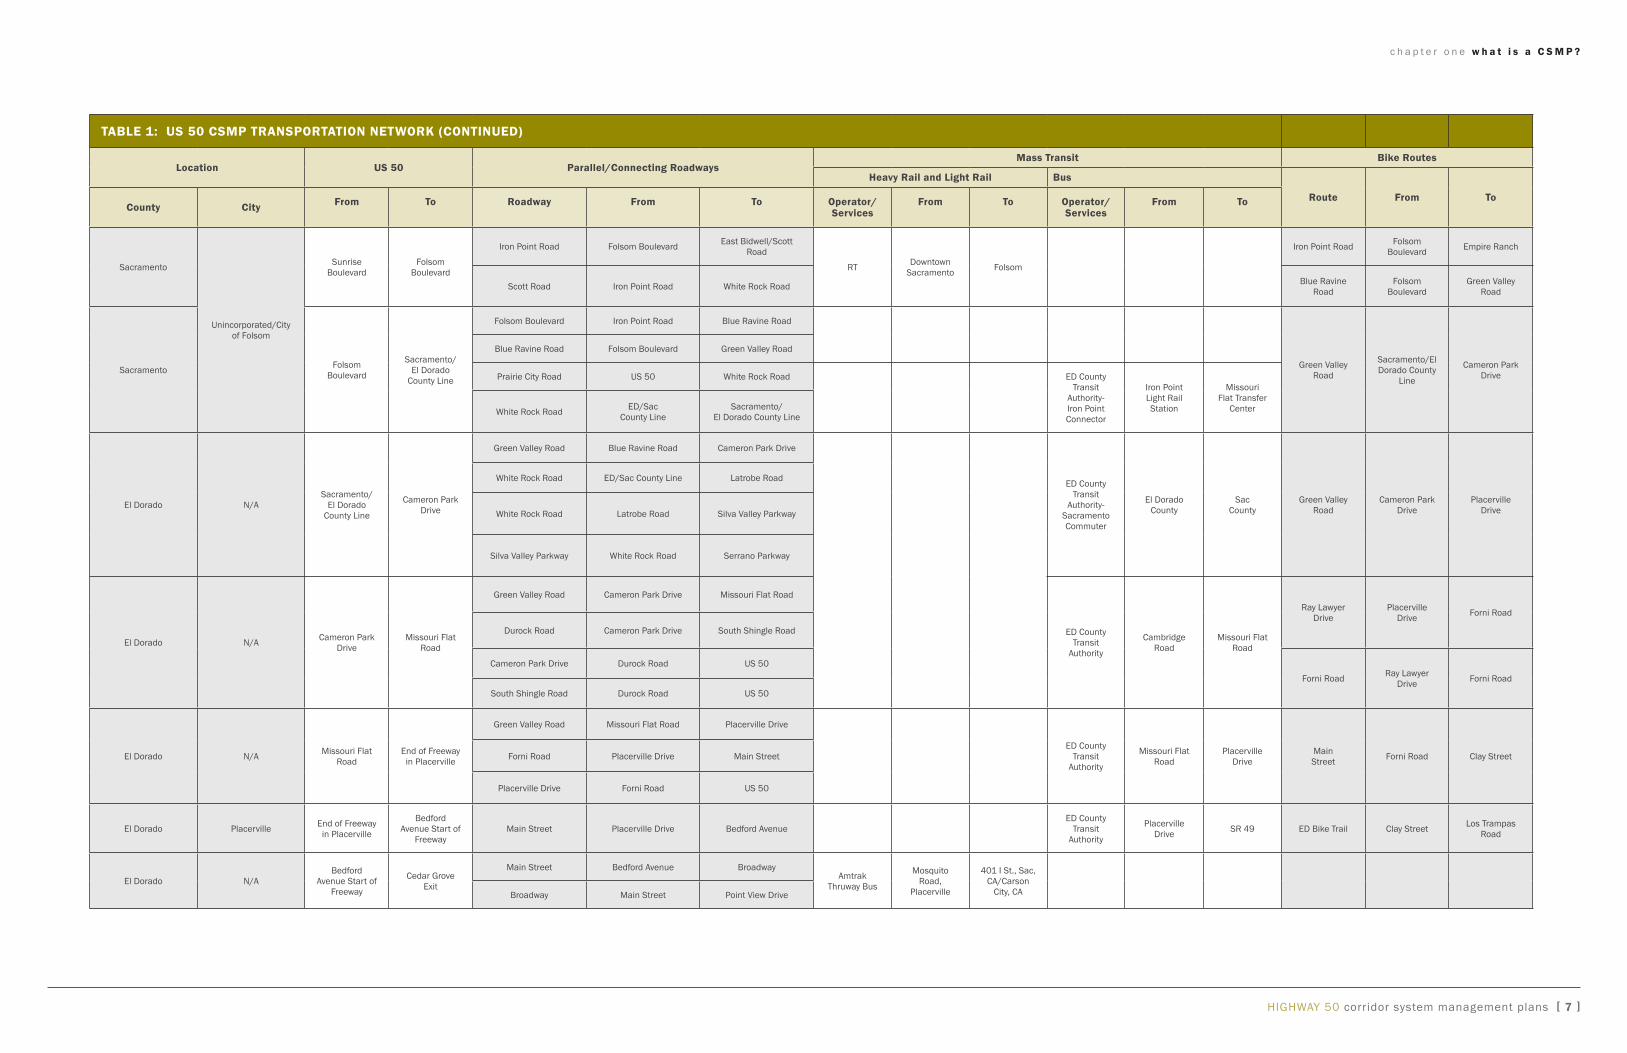

c h a p t e r t h r e e c u r r e n t c o r r i d o r s y s t e m m a n a g e m e n t s t r a t e g i e s
tabLe 2 exiStiNg uS 50 toS eLeMeNtS
County Location PM toS elements
tMS rM HAR rWiS CMS eMS VS CCTV WiM
yolo i-80 to yoloSaC County Line
000 - 316 4 ndash ndash 1 1 ndash ndash 2 2
SaC
YoloSAC County Line to SR99 SR51
L000 - L248 R000
8 7 ndash ndash 3 ndash ndash 7 ndash
SR99SR51 ndash Watt Avenue R000 ndash R534 5 8 ndash ndash 1 1 ndash 3 ndash
watt avenue to Zinfandel Drive R534 ndash R1092 8 7 1 ndash ndash 2 ndash ndash ndash
Zinfandel Drive to Sunrise Blvd R1092 ndash 1250 1 4 ndash ndash ndash 1 ndash ndash ndash
Sunrise Blvd to Folsom Blvd 1250 ndash 1701 4 6 ndash ndash ndash ndash ndash 2 ndash
Folsom Blvd to SACED County Line
1701 ndash 2314 2 8 ndash ndash 1 ndash 1 ndash ndash
ED
SACED County Line to Cameron Park Dr 000 ndash R657 5 ndash ndash ndash 1 ndash 2 ndash ndash
Cameron Park Dr to Missouri Flat Rd R657 ndash R1506 7 ndash ndash ndash ndash ndash ndash ndash ndash
Missouri Flat Rd to End of Freeway R1506 ndash 1725 1 ndash ndash ndash ndash 1 ndash ndash ndash
ED End of Freeway to Bedford Ave 1725 ndash 1811 ndash ndash 1 ndash ndash ndash ndash ndash ndash
ED Bedford Ave to Cedar Grove Rd 1811 ndash R2595 ndash ndash ndash ndash 1 1 ndash ndash ndash
totaL 45 40 2 1 8 6 3 14 2
Notes PM = Post Mile TMS = Traffic Monitoring Station RM = Ramp Meter HAR = Highway Advisory Radio RWIS = Roadside Weather Information System CMS = Changeable Message Sign EMS = Extinguishable Message Sign VS = Visibility Sensor CCTV = Closed Circuit Television System WIM = weigh in Motion Existing TOS Elements as of April 2009
ties and transit operators also have robust system manshyagement elements and programs applied to their facilities or services
There are also specific instances of system management linkages among transportation modes and services at particular locations
Existing management strategies are depicted on Figure 4
and summarized in Table 2
US 50 BusCarpool Lanes in El Dorado County
[ 12 ] HigHway 50 corridor system management plan
c h a p t e r t h r e e c u r r e n t c o r r i d o r s y s t e m m a n a g e m e n t s t r a t e g i e s
These strategies work as a system to gather analyze and disseminate information through the Caltrans TMC inforshymation about collisions other incidents road closures and emergency notifications are fed into this information hub
and disseminated to public and private information users The TMC operates 24 hours a day seven days a week
parallel anD connecting roaDways City of West Sacramento has one CCTV located on west Capitol Avenue between Enterprise Boulevard and Capitol Mall
City of Sacramento operates a TOC Sensors in the street detect the passage of vehicles vehicle speed and the level of congestion
This information is received on a second-by-second (real-time) basis and is analyzed at the TOC
Sacramento County also operates a TOC by gathering information through CCTV cameras CMS HAR and a Fiber Optics (FO) network placed along major traffic
corridors throughout the county
City of rancho Cordova will be installing CCTV cameras and a FO network on Folsom Boulevard in 2009 Currently one CCTV exists on Sunrise Boulevard
between US 50 and Folsom Boulevard Most major traffic corridors are on the network or will be by the end of 2009 The City contracts with the County of Sacramento to operate their systems through the Countyrsquos TOC
City of folsom recently completed installing a FO system
Changeable Message Sign on US 50 at Scott Road
on all of the Cityrsquos major corridors Currently the sole intersection that is monitored via camera is located on iron Point Road and East Bidwell
El Dorado County has three coordinated signals along Francisco Drive at Green Valley Road the Market Place
entrance (east side Safeway Centerwest side Lake
Forest Plaza) and Village Center Drive
City of Placerville utilizes traditional control devices traffic signals and stop signs
transit anD riDesharing Yolo County Transit District (YCTD) uses a Global Positionshying System (GPS) for locating buses in route referred to as
an Automatic Vehicle Location (AVL) system
The AVL System allows users to see where their bus is
located within the last minute
El Dorado Transit Authority utilizes the gPS Zonar System for pre-trip inspections maintenance and real-time vehicle tracking
Sacramento Regional Transit District (SacRT) has in shystalled pre-emptive traffic signals at at-grade intersections
along the Light Rail routes SacRT has a GPS however it is only utilized for analysis purposes
Computer-aided dispatch and Bus Rapid Transit are in
the planning stages In addition SacRT has an online Trip
Planning application to assist transit users During special events such as the California State Fair the Jazz Festival
65th Street Light Rail Station and Transit Oriented Development
HigHway 50 corridor system management plan [ 13 ]
c h a p t e r t h r e e c u r r e n t c o r r i d o r s y s t e m m a n a g e m e n t s t r a t e g i e s
TABLE 3 PARk AnD RIDE LOTS
County Post Mile Facility name Description
Lot use transit Connection
Spaces Spaces occupied
occupancy Rate () Provider and route No
SaC 70 Butterfield Sacramento Regional Transit Gold Line Station
406 129 318 SacRT SacRT LRT Gold Line
SaC 125 Sunrise Sacramento Regional Transit Gold Line Station
487 389 799 RSacRT SacRT LRT Gold Line
SaC 158 Hazel 432 135 306 SacRT SacRT LRT Gold Line
SaC 158 Hazel 33 6 24 SacRT Route 109
SaC 171 Folsom Boulevard 70 58 829 ED Iron Point Connector SacRT LRT Gold Line
ED 2 El Dorado Hills (Latrobe RoadWhite Rock Road) 123 138 1122 ED Iron Point Connector ED Routes
156781112
ED 5 Cambridge Road 59 40 678 ED Iron Point Connector ED Routes 14567891112
ED 86 Ponderosa Road Northeast 28 15 536 ED Iron Point Connector ED Routes 23679101112
ED 86 Ponderosa Road Northwest 111 61 55 ED Iron Point Connector ED Routes 23679101112
ED 86 Durock Road 57 21 368 Na
ED 149 Shingle Springs Drive 19 4 211 Na
ED 122 Greenstone Road 21 4 19 Na
ED 15 Missouri Flat Road 73 44 603 ED Iron Point Connector
ED 158 Fairgrounds Park-and-Ride 200 40 20 ED Iron Point Connector
ED 185 Placerville Station (Mosquito Park- and-Ride) 130 50 385 ED Iron Point Connector
ED Commuter Service
ED 233 Camino Heights 24 1 42 Na
SacRT = Sacramento Regional Transit District ED = El Dorado County Transit Authority Lrt = Light rail train
Survey 2007
the holiday seasons and the Mather Field Air Show SacRT
operates additional service to connect events to light rail stations and offer free service to promote transit use durshying select events The transit routes identified in the CSMP
network are shown in Figure 5
The Sacramento Valley Station in downtown Sacramento is
the 7th busiest station in the national amtrak system and serves as a multi-modal transfer facility There are over 11 million passenger trips annually
Passengers can make connections with numerous local bus services as well as the SacRT light rail system
[ 14 ] HigHway 50 corridor system management plan
c h a p t e r t h r e e c u r r e n t c o r r i d o r s y s t e m m a n a g e m e n t s t r a t e g i e s
Try Transit Changeable Message Sign in Sacramento County
Sacramento County installed pre-emptive traffic signals to give preferential signal timing to transit buses at selected locations that serve high priority transit corridors
SACOG manages the 511 and rideshare programs that cost approximately $1 million per year region-wide to foster carpooling transit ridership vanpooling and bicycling in all areas and corridors The Regional Rideshare Program covers Placer El Dorado Sacramento yolo yuba and Sut-ter counties it is part of a statewide network of rideshare agencies which encourage alternative transportation modes for traveling
Park and Ride lots are located adjacent to or nearby the US 50 corridor utilized by commuters to connect with transit vanpool or carpool Of the sixteen lots many are adjacent to the SacRT Light Rail gold Line providing access for commuters to park their vehicles and commute the re-mainder of their trip via Light Rail El Dorado County Transit authority also uses the park and ride lots as transit stops for their Commuter Buses The locations capacity and occupancy rates of the Park and Ride lots are displayed in Table 3
Bicycle Facilities Bicycle facilities in the corridor are not actively managed in the same manner as motor vehicle facilities
However there are traffic operation systems that serve bicyclists such as dedicated bicycle lanes bicycle detec-tion loops at signalized intersections video detection other non-loop type detection and bicyclist activated signal change buttons The City of Sacramento is installing video detection at some locations
SacRT buses and the new light rail trains are equipped with bicycle racks There are over 170 weatherproof bicycle lock-ers at 23 light rail stations yCTD has the Bikes on Buses Program that allows bicycles to travel on any yOLOBUS
The Sacramento area Bicycle advocates maintain an on-line hazard reporting system to allow users to report hazardous locations for bicyclist such as potholes inad-equate signal timing hazardous railroad crossings insuf-ficient shoulder and inadequate bikeway markings The reports are then sent to the applicable jurisdiction SaCOg is creating an on-line route planning system for bicyclists in addition SaCOg maintains bicycle maps on their website which are currently being updated
The bicycle routes included in the CSMP network are shown on Figures 6 and 7
Pedestrian Facilities Pedestrian facilities are not included as part of the man-aged network because they do not directly provide corridor mobility However complete and safe pedestrian access to appropriate corridor modes such as bike routes and transit services is an important component of corridor system management Therefore subsequent updates of the CSMP will seek to identify key pedestrian facilities and barriers to pedestrian mobility with regard to access and modal con-nectivity
HigHway 50 corridor system management plan [ 15 ]
c h a p t e r t h r e e c u r r e n t c o r r i d o r s y s t e m m a n a g e m e n t s t r a t e g i e s
[ 16 ] HigHway 50 corridor system management plan
Page Inte
ntionally
Left
Blank
MAIN ST
MA
RB
LE V
ALL
EY
RD
65TH ST EXPY
FLYING
C R
D
STATE
HW
Y 16
MA
RB
LE VA
LLEY R
D
CAM
BRID
GE R
D
GREEN VALLEY RD
RIV
ERSI
DE
BLVD
11T
H S
T
RIV
ERSI
DE
BLVD
HO
WE
AV
E
EL DORADO
HILLS BLVD
EL DORADO H
ILLS BLV
D
HORNET DR
JEFF
ERSO
N BL
VD
CAM
ERO
N PAR
K DR
PO
WE
R IN
N R
D
CO
UN
TY HW
Y E3
BRADSHAW RD
MATHER FIELD RD
ZINFAN
DEL D
R
11TH
ST
VD
FOLSOM BLFOLSOM BLVD
FOLSOM BLVD
FOLSO
M BLVD
WHITE ROCK RD
FOLSOM BLVD
FOLS
OM
BLV
D
LATRO
BE RD
CANAL ST
16TH
ST
JACQ
UIER
RD
15TH
ST
HARBOR BLV
D
STOCKTON BLVD
FORNI RD BIDW
ELL DR
WATT AVE
PLACERVILLE DR
TOW
ER G
ATEW
AY
SHIN
GLE SPR
ING
S DR G
REEN
STON
E RD
59TH
ST
SUN
RISE BLVD
EL D
OR
AD
O R
D
HAZEL AVE
SOUT
H RI
VER
RD
PON
DER
OSA R
D
SHIN
GLE SPR
ING
S RD
SHIN
GLE
SPR
ING
S R
D
CARSON RD
MISSO
URI FLAT RD
BASS LAKE RD
N SH
ING
LE RD
PRAIR
IE CITY R
D
S SHIN
GLE R
D
SHIN
GLE
RD
SCOTT RD
W S
T AT
5TH
ST
65TH
ST
5TH
ST
X
ST A
T 27
TH
80
CEDAR GROVE EXIT
MO
SQU
ITO R
D
PLACERVILLE DRMISSOURI
FLAT RD
FORNIRD
EL D
OR
AD
OR
D
POIN
T VIEW D
RSM
ITH FLAT R
D
SCH
NELL SC
HO
OL R
D
MO
NTER
EY RD
c h a p t e r t h r e e c u r r e n t c o r r i d o r s y s t e m m a n a g e m e n t s t r a t e g i e s
Figure 4 Existing Traffic Operations Systems Elements
Highway 50 Corridor Systems Management Plan Existing Traffic Operations Systems Excluding Ramp Meters
TOS ndash Traffic Operations Systems
Stations Continuous Coverage
EMS ndash Extinguishable Message Sign WIM ndash Weigh-in-Motion Location (EMS Usually Refers Motorist to HAR)
Television System
19365TMS ndash Traffic Monitoring99 US Highway 50VS ndash Fog (Visibility) Sensor
CCTV ndash Closed Circuit
I-80 to Cedar Grove Exit HAR ndash Highway Advisory Radio Local Road Interchange Access
White Rock RdRWIS ndash Roadside WeatherCMS ndash Changeable Sunrise Blvd to Latrobe Rd
Message Sign Information System
50
80
51
49 160
50
Placerville to Cedar Grove Exit
50
1935
16 49
99
84 160
49 MilesMiles 0 1 2 3 4 50 1 2 3 4 5 10
HigHway 50 corridor system management plans [ 17 ]
124 49
MOTHER LODE DR
MATHER FIELD RD
West Terminus
RAMP
RAMP
RAMPRAMP
RAM
P
RAMP
RAM
P RAMP
RAMPRAMP
RA
MP
RAM
P RAM
P
RAMP
RAM
P
RAM
P
RA
MP
RAM
P
RAM
P
YoloBus Express Routes Plus Routes 42A and 42B
RAMPBROADWAY
65TH
ST
PCE
65
SCRY42A
Y44Y4343
242 IPC
5
W STX ST
WATT AVE
MAROCKINGHAM
DR
OLD PLACER
BRADSHAW RD
VILLE RDTHER FIELD RD
INTERNATIONAL DR
ZINFANDEL DR
WHITE ROCK RD FOLSOM BLVD FOLSOM BLVD
SUNRISE BLVD
BLUE R
AVIN
E RD
WHITE ROCK RD
SC
OTT R
D
PR
AIR
IEC
ITY R
D
LATROBE RD
GREEN V ALLEY RD
PLACERVILLE DR
FORNI RDM
AIN ST
BROADWAY
CEDAR GROVE EXIT
WEST
CAPTOL AVE
(WESTMOST
STOP)
(WESTMOST STOP)
SCR
SCR
IPC
IPC
c h a p t e r t h r e e c u r r e n t c o r r i d o r s y s t e m m a n a g e m e n t s t r a t e g i e s
Figure 5 US 50 CSMP Network Transit Routes
Highway 50 Corridor System Management Plan 80
CSMP Commuter Transit Network
El Dorado County Transit Authority 65
IPC Iron Point Connector
SCR Sacramento Commuter Route 193
Sacramento Regional Transit District 109ndashHazel Express
Yolo Bus (Express) Y43 Y44 Y230 Y231 and Y232
Yolo Bus (All-Day Intercity amp Airport Service) Y42A (Clockwise) Y42B (Counter-clockwise)
LATROBE RD
Park-and-Ride Lots
193 65
49 US Highway 50 (I-80 to Cedar Grove Exit)
Parallel Roads
Light Rail STation
Light Rail
Class I Bikeways Other State Highways
County Lines
80
49
50
80160
50
5 84 16
4999
Miles 0 5 10160
HigHway 50 corridor system management plans [ 18 ]
K
5
FOLSOM BIKE TRAIL
SEE CENTRAL CITY BICYCLENETWORK MAP FOR BICYCLE
F ACILITY NAMES
AMERICAN RIVER PARKWAY TRAIL SYSTEM
(INCLUDING JE
DEDIAH SMITH MEMORIAL T
RAIL)
FOLSOM BLVD
WHITE ROCK RDSIL V A V ALLEY PKWY
EL D
OR
AD
O H
ILLS B
L VD
GREEN VALLEY RD
AMERICAN R
IVER PARKWAY
TRAIL
SYSTEM
(INCLU
DING JE
DEDIAH SMITH
MEMORIA
L TRAIL)
NATOMA ST
FOLSOM BLVD
EL DORADO TRAIL
CARSON RD
PLACER VILLE RD
RAY
LAW
YER
DR
c h a p t e r t h r e e c u r r e n t c o r r i d o r s y s t e m m a n a g e m e n t s t r a t e g i e s
Figure 6 US 50 CSMP Network Bicycle Routes
Highway 50 Corridor System Management Plan
Bicycle Route Network
Class I Bicycle Facilities
Class II Bicycle Facilities
193
Lincoln
65
Rocklin
Auburn
Folsom 49
193
Light Rail Stations
Light Rail Loomis50
RosevilleUS Highway 50 CSMP Corridor
Other State Highways Miles
County Lines 0 1 2 3
99
49 80
50
160 80 193
Placerville 50
West Rancho 50 Sacramento Cordova
5 0 49
8 4
9 9 Sacramento
1 6 4 9
0 1 2 Miles
3
1 6 0 Elk Grove 210 210 44 66 88
Miles 10 Miles
10 1 2 4
4 9
HigHway 50 corridor system management plans [ 19 ]
13TH
ST
H ST E ST BELVEDERE AVE
51ST
ST
BROADWAY H ST
48TH
ST
11TH
ST
PO
WE
R IN
N R
D
28TH
ST
STOC
KTON
BLVD3R
D ST
ALH
AMBR
AFR
ON
T BLV
D S
T
W CAPITOL A VE
DISCOVER Y
P ARK BRIDGE
JEDED
IAH
N ST
T ST
K ST
11TH
ST
RIV
ERSI
DE
BLV
D
18TH
ST
R S
T17
TH S
TO
ST
18TH
ST
20TH ST
CAPITOL AVE
T ST
28TH
ST
34TH
ST
39TH
ST
M ST
BROADWAY
T ST
FOLSOM BLVD
58TH
ST
J ST
65TH
ST
CSU
S
CO
NN
ECTIO
NS
SR 16JACKSON HWY
FOLSOM BLVD
LA RIVIERA DR
W ATT AV
E
HO
WE A
VE
GUY W
EST B
RIDE
COLLEGE TOWN DR
c h a p t e r t h r e e c u r r e n t c o r r i d o r s y s t e m m a n a g e m e n t s t r a t e g i e s
Figure 7 US 50 CSMP Network Bicycle Routes (Sacramento Insert)
5 Sacramento
8 0
8 0
160
West Sacramento
80
SMITH MEMORIAL TRAIL
50
US Highway 50 Corridor System Management Plan 50
Central City Bicycle Route Network 50
Bikeway and Multi-Use Network
US Highway 50 (I-80 to Cedar Grove Exit)
Class I Bicycle Facilities
Class II Bicycle Facilities
Connecting Routesndashno Bicycle Designation
80 16 5
BROADWAY
FLOR
IN-P
ER
KIN
S R
D
Light Rail STation 99
Light Rail
Other State Highways
County Lines
HigHway 50 corridor system management plans [ 20 ]
major corridor mobility challenges
chapter four
High demand for mobility services especially during peak commute periods is creating significant traffic congestion
and impairing mobility in the corridor Heavy congestion and stop-and-go traffic contributes to increased vehicle
emissions and added travel costs Many transit services are operating at maximum passenger carrying capacity and buses often must contend with the same congestion as autos in many locations bicyclists have to compete for space on these same facilities
Much of the congestion can be attributed to population growth residential and commercial development job housing imbalances work schedules that require commute trips during peak travel times recreational trip generators and truck traffic
The overall amount of travel in the corridor has increased dramatically over the past ten years and is expected to
continue to increase as the region adds approximately
one million new residents over the next 25 years per the current SACOG MTP 2035 Traffic congestion per houseshyhold is expected to increase 18 percent over 2005 levels
by the year 2035
in the general area of eastern Sacramento County and western El Dorado County the Highway 50 Partnership
has projected growth of 78000 more dwelling units and 53000 new jobs over the next 25 years Current and foreshycasted data is depicted in Table 4
The sections of US 50 with particularly severe traffic
congestion are depicted in Figures 8 and 9 These are
also summarized in greater detail in Tables 14 and 15 in Chapter 7 Table 14 shows a summary of the US 50 eastbound bottlenecks while the tables that follow discuss each bottleneck including location and possible causality Table 15 shows a summary of the US 50 westbound bottleshynecks while the tables that follow discuss each bottleneck including location and possible causality Minor or hidden bottlenecks are those that are not as defined (or severe) as the major bottlenecks Please note that the graphics acshycompanying the bottlenecks are not to scale
a critical component of identifying and resolving Traffic congestion per corridor mobility challenges household is expected is the need for detailed to increase 18 percent data analysis and comshy over 2005 levels by the munication regarding
year 2035system performance Data collection is insufficient to
fully meet these needs but still provides useful information as detailed in the following pages improving data gathershying analysis and dissemination of information is a major challenge for this corridor and is a component of intelligent Transportation Systems planning
HigHway 50 corridor system management plan [ 21 ]
c h a p t e r f o u r m a j o r c o r r i d o r m o b i l i t y c h a l l e n g e s
[ 22 ] HigHway 50 corridor system management plan
Figure 8 US 50 AM Peak Period Bottleneck Locations
Figure 9 US 50 PM Peak Period Bottleneck Locations
Challenges along the corridor include
bull severe recurrent highway and roadway traffic congestion
bull an incomplete buscarpool lane system
bull an incomplete set of freeway auxiliary lanes
bull loss or dropping of freeway lanes at specific locations
bull incomplete ramp metering
bull limited parallel roadway capacity
bull lack of signal coordination on key arterials and freeway ramp intersections
bull transit facilities approaching capacity
bull inadequate transit capital and operations funding needed to grow transit ridership
bull light rail at-grade crossings
bull lack of adequate access to transit across US 50
bull lack of double tracking of the light rail Gold Line to Folsom
bull poor pavement and road and bicycle route maintenancesweeping
bull lack of sufficient bicycle activated signal change devices
bull motorist driving behavior
bull inadequate bicycle storage
bull inadequate bicycle and pedestrian access to transit and
bull gaps and barriers within the bicycle route network
Additionally the EDCTC has identified safety and operashytional issues between the Smith Flat interchange and east of the Upper Carson RoadCamino intersection in the
Camino Area Parallel CapacitySafety Study Transporshytation issues include at-grade access to US 50 left turn conflicts across US 50 increasing average daily local and
interregional traffic growth in the area lack of alternate
routes seasonal traffic to and from Apple Hill and other local events and seasonal access to recreation in the Lake
Tahoe Region
c h a p t e r f o u r m a j o r c o r r i d o r m o b i l i t y c h a l l e n g e s
Table 4 CUrrenT and ForeCaSTed TraFFiC daTa
location Current Traffic data ndash 2007 Future Traffic data ndash 2027 (no build) Future Traffic data ndash 2027 (build)
County description amp location of Trucks
Peak directional
Split
Peak Hour Traffic
average annual daily
Traffic2
Volume over Capacity3
Peak Hour Traffic
average annual daily Traffic2
Volume over Capacity3
(no-build)
Peak Hour Traffic
average annual daily
Traffic2
Volume over Capacity3
(build)
yOL interstate 80 to yoloSacramento County Line
6 60 15500 180000 109 23911 277032 169 24070 278880 136
SaC yoloSacramento County Line to State Routes 99 and 51
4 59 21000 253000 135 28080 312480 186 29153 324415 193
SaC State Routes 99 and 51 to watt avenue 4 59 20600 225000 145 27942 286230 189 30648 313950 166
SaC watt avenue to Zinfandel Drive 4 59 16700 187000 115 24783 274540 163 25885 286750 136
SaC Zinfandel Drive to Sunrise Boulevard 4 60 13500 149000 093 20331 224394 133 20925 230950 110
SaC Sunrise Boulevard to Folsom Boulevard 4 66 11900 125000 089 18888 198247 131 20086 210820 140
SaC Folsom Boulevard to SacramentoEl Dorado County Line
3 66 8800 95000 087 13341 151311 133 13612 154380 136
ED SacramentoEl Dorado County Line to Cameron Park Drive
4 61 6900 70000 095 11454 116200 165 11834 120050 114
ED Cameron Park Drive to Missouri Flat Road
4 62 5700 62000 092 8647 94054 132 9462 102920 096
ED Missouri Flat Road to End of Freeway in Placerville
4 57 4850 59000 069 7101 76245 098 7363 79050 102
ED End of Freeway in Placerville to Bedford avenue
4 55 4800 52000 Na 4 6595 74196 Na4 6648 74790 Na4
ED Bedford avenue to Cedar grove Exit 4 62 3800 38500 077 5474 50782 099 5520 51205 099
1 Peak Directional Split The percentage of total traffic in the heaviest traveled direction during the peak hour2 Average Annual Daily Traffic (AADT) The average number of vehicles per day in both directions 3 Volume over Capacity (VC) The volume of traffic compared to the capacity of the roadway4 Volume over Capacity does not determine LOS for two- or three-lane facilities or segments with intersection delay 5 Reported Collision Rate index ( Compared to State average) The percentage by which each segmentrsquos reported collisions rate (fatal injury and property damage only) is above or below the statewide average reported collisions rate on comparable facilities
Source 3-Year Caltrans Traffic Accident Surveillance and Analysis System data
HigHway 50 corridor system management plans [ 23 ]
c h a p t e r f i v e p e r f o r m a n c e m e a s u r e s
Page Inte
ntionally
Left
Blank
[ 24 ] HigHway 50 corridor system management plan
performance measures
chapter five
Continuing corridor monitoring and performance mea-
sures are an integral part of corridor management and investment decision making and help identify immediate efficient and effective system operational strategies and
capital improvements Performance measures provide the
important dynamic daily information needed to rapidly
address operational problems caused by recurrent and
non-recurrent traffic congestion Measures are also used to identify the best improvement actions to generate the desired results
Table 5 identifies the performance measures to be used as
part of the corridor system management process
Baseline Data For perFormance measures Tables 6 7 and 8 display baseline data for the perforshymance measures for the CSMP transportation network
The performance data was primarily compiled from the SACMET demand based traffic model the year 2007
edition of the Traffic Volumes Manual the year 2000 edition of the Highway Capacity Manual Caltrans Traffic
Accident Surveillance and Analysis System (TASAS) the 2007 Caltrans Division of Maintenance Pavement Summary Report and ridership records provided by the transit providers
additional performance Performance Measures data was derived from the provide the important Performance Measurement dynamic dailySystem (PeMS) tool an
information needed internet based tool used to
to rapidly addresshost process retrieve and operational problemsanalyze road traffic condishy
tions information from caused by recurrent
real-time and historical and non-recurrent data PeMS obtains 30-sec- traffic congestion ond loop detector data in real-time from detectors installed along the highway corridor
It should be noted that Average Daily Traffic (ADT) and LOS
for some ParallelConnecting Roadways segment locations
in Table 7 was not available These are noted ldquoNo Datardquo
Data collection for non-auto modes is not as robust as what is needed for active system management Subsequent updates of this CSMP will seek to expand the
availability of transit and bicycle performance data collection
HigHway 50 corridor system management plan [ 25 ]
mdash
c h a p t e r f i v e p e r f o r m a n c e m e a s u r e s
TABLE 5 PERFORmAnCE mEASURES DEFInITIOnS AnD APPLICABILITY
Performance Measure Definition of Performance measure applicability to Corridor
STATE HIGHWAY SYSTEm
LOS A ldquoreport cardrdquo measurement with ldquoArdquo being the least amount of
congestion and ldquoFrdquo being the most congestion LOS is a relatively simple and widely used measure which
offers comparison opportunities
Total Vehicle Hours of Delay The additional travel time in hours experienced by all vehicles on the highway segment per day or at peak hour due to congestion
This measurement is used to determine the cost in time which congestion can add to the regular travel time that it takes to traverse a segment of road and is useful in
quantifying the performance of a particular roadway in an understandable format
Total Person Minutes of Delay The additional travel time in minutes experienced by all persons in vehicles on the highway segment per day or at peak hour due
to congestion
This measurement is used to determine the cost in time which congestion can add to the regular travel time that it takes to traverse a given segment of road and is useful in quantifying the performance of a particular roadway in an
understandable format and for comparison of improvement options
Minutes of Delay per Vehicle The additional travel time in minutes experienced by each vehicle on the highway segment at peak hour due to congestion
This measurement is used to determine the cost in time which congestion can add to the regular travel time that it
takes to traverse a given segment of road
Minutes of Delay per Person The additional travel time in minutes experienced by each person in vehicles on the highway segment at peak hour due to congesshy
tion
This measurement is used to determine the cost in time which congestion can add to the regular travel time that it
takes to traverse a given segment of road
Vehicle Travel Time (Minutes) The average time spent by vehicles traversing between two points on a road or highway
Travel time is a measure used to quantify travel time deficienshycies and provide a personal indicator of congestion impacts
Distressed Pavement Pavement that rides rougher than established maximums and or exhibits substantial structural problems as determined by the
Pavement Condition Survey
This measurement provides a ride quality indicator and an indicator for structural roadway problems
Reported Collision Rate Comparison of the actual total collision rate () along a highway segment above or below the statewide average for fatal injury
and property damage-only collisions on comparable facilities
Comparing the total collision and rate with statewide average rate provides an opportunity to assess safety conditions
through the corridor
Reliability Identifies day-to-day variation in travel time for the same trip at the same time of day Focuses on the predictability of travel time
particularly for repetitive trips
Estimates reliability by defining the extra time travelers must add to their average travel time when planning trips to ensure on-time arrival (0 percent no day-to-day variations
100 percent double allotted travel time)
Lost Productivity Measures the capacity of the corridor to accommodate vehicle or person throughput and is calculated as actual volume divided by
the capacity of the highway
As traffic volumes increase to roadway capacity speeds decline rapidly and vehicle throughput drops dramatically which increases traffic congestion and delay and results in
lost productivity
[ 26 ] HigHway 50 corridor system management plan
mdash
c h a p t e r f i v e p e r f o r m a n c e m e a s u r e s
HigHway 50 corridor system management plan [ 27 ]
TABLE 5 PERFORmAnCE mEASURES DEFInITIOnS AnD APPLICABILITY (ConTInued)
Performance Measure Definition of Performance measure applicability to Corridor
PARALLEL AnD COnnECTInG ROADWAYS
LOS A ldquoreport cardrdquo measurement with ldquoArdquo being the least amount of
congestion and ldquoFrdquo being the most congestion LOS is a relatively simple and often used measure which
offers comparison opportunities
traNSit
available Capacity Ratio () of available transit capacity alternatives within the corridor
This measure indicates the available capacity to accommoshydate diverted travelers from single occupant vehicles
c h a p t e r f i v e p e r f o r m a n c e m e a s u r e s
[ 28 ] HigHway 50 corridor system management plan
Page Inte
ntionally
Left
Blank
c h a p t e r f i v e p e r f o r m a n c e m e a s u r e s
Table 6 US 50 PerForManCe MeaSUreS
County location Post Miles
distance (Miles)
average annual daily Traffic1
PerForManCe MeaSUreS
loS1
Total Vehicle Hours of delay2
Total Person Minutes of delay2
Minutes of delay per Vehicle2
Minutes of delay per Person2
Vehicle Travel Time (Minutes)2 distressed
Pavement (lane
Miles)4
reported Col-lision rate
Comparison ()5
reliability6 lost Productivity7
daily Peak Hour3 daily Peak
Hour3 Peak Hour3 Peak Hour3 Peak Hour3 eastbound westbound lost lane Miles aM
Peak Period
lost lane Miles PM
Peak Period
STaTe HigHway SySTeM
yOL interstate 80 to yolo Sacramento County Line
000 to 316 316 180000 F 1169 126 95363 8061 049 046 36 9 26 62 22 01 0
SaC
yoloSacramento County Line to State Routes 99
and 51
L000 to L248 R000
248 253000 F 4993 653 407455 41746 186 175 43 7 20 64 60 53 76
State Routes 99 and 51 to watt avenue
R000 to R534 534 225000 F 10097 1362 823883 87105 397 372 93 15 24 60 48 81 68
watt avenue to Zinfandel Drive
R534 to R1092 558 187000 F 8075 977 658886 62506 351 329 91 19 -32 56 42 44 23
Zinfandel Drive to Sunrise Boulevard
R1092 to 1250 158 149000 E 1271 197 103727 12610 088 082 25 9 -33 46 13 0 16
Sunrise Boulevard to Folsom Boulevard
1250 to 1701 451 125000 E 3087 356 251940 25832 180 149 63 5 -14 60 46 1 45
Folsom Boulevard to SacramentoEl Dorado
County Line
1701 to 2314 613 95000 D 583 122 47537 8867 083 069 70 0 -11 19 55 0 08
ED
SacramentoEl Dorado County Line to Cameron
Park Dr
000 to R657 657 70000 E 504 126 41150 9138 110 091 77 1 -35 PeMS Data
Unavailable PeMS Data Unavailable
PeMS Data Unavailable
PeMS Data Unavailable
Cameron Park Drive to Missouri Flat Road
R657 to R1506 849 62000 E 302 75 24633 4827 079 075 93 2 -61 PeMS Data
Unavailable PeMS Data Unavailable
PeMS Data Unavailable
PeMS Data Unavailable
Missouri Flat Road to End of Freeway in Placerville
R1506 to 1725 219 59000 D 66 16 5376 1053 020 019 24 1 20 PeMS Data
Unavailable PeMS Data Unavailable
PeMS Data Unavailable
PeMS Data Unavailable
End of Freeway in Placerville to Bedford avenue
1725 to 1811 086 52000 D 68 17 5585 1094 021 020 15 2 81 PeMS Data
Unavailable PeMS Data Unavailable
PeMS Data Unavailable
PeMS Data Unavailable
Bedford avenue to Cedar grove Road
1811 to R2595 784 38500 D 58 15 4758 932 023 022 85 10 6 PeMS Data
Unavailable PeMS Data Unavailable
PeMS Data Unavailable
PeMS Data Unavailable
TOTaL mdash 5473 mdash mdash 30273 4042 2470293 263771 1587 1449 7150 80 mdash mdash mdash mdash mdash
1 Source Average Annual Daily Traffic and Level of Service (LOS) calculated is based on 2007 Caltrans Traffic Volumes on California State Highways and Highway Capacity Manual and Cambridge Systematics from 2008 Reported LOS is for the typical most congested daily peak travel period 2 Source Delay is the average additional travel time by vehiclespersons traveling under 60 mph Data derived from 2007 HICOMP report SACMET Travel Demand Model PeMSs traffic data and Caltrans District 3 Traffic Operations Probe vehicle Tach runs 3 Peak Hour is during PM 4 Source 2007 Caltrans Division of Maintenance Pavement Summary Report 5 Source 2004 through 2007 Caltrans Traffic Accident Surveillance and Analysis System summary data of the percentage above or below the statewide average for fatal injury and property damage-only collisions on comparable facilities 6 Reliability The Planning Time Index is a measure of the reliability of the travel time on a particular route It is the ratio of the 95th percentile of travel time on a route to the median free-flow travel time This means itrsquos the amount of time a traveler needs to allocate for a route if they want to show up on time 19 out of 20 trips Reliability and Planning Time data was taken from April 2007 The data covered a 24-hour period of time on each Tuesday wednesday and Thursday of that month That data was then aggregated into a single average 24-hour day it was then analyzed to determine the highest average aM and PM travel time That time was then compared to the best possible average travel time to determine the additional time that was spent traveling the same seg-ment 7 Lost Productivity Data taken April 2007 PeMS As traffic increases to the capacity of the highway speeds decline throughput drops dramatically and the efficiency of the highway to provide mobility decreases This decline in the potential carrying-capacity of the freeway is expressed in terms of how many equivalent lane miles of roadway are lost
HigHway 50 corridor system management plans [ 29 ]
c h a p t e r f i v e p e r f o r m a n c e m e a s u r e s
Table 7 Parallel and ConneCTing roadwayS PerForManCe MeaSUreS
County location average
daily Traffic1
PerForManCe MeaSUreS
loS1
Total Vehicle Hours of delay2
Total Person Minutes of delay2
Minutes of delay per Vehicle2
Minutes of delay per Person2
Vehicle Travel Time (Minutes)2
distressed Pavement
(lane Miles)4
daily Peak Hour3 daily Peak
Hour3 Peak Hour3 Peak Hour3 Peak Hour3
Parallel and ConneCTing roadwayS
yOL west Capitol Enterprise Boulevard to Capitol Mall 13737 No Data
Data is unavailable for these performance measures at this time however will be pursued in the next phase of the CSMP
SaC
w 5th Street to 26th Street 9194 a
X 5th Street to 26th Street 9154 a
Folsom Boulevard watt avenue to Bradshaw Road 25600 C
watt avenue Folsom Boulevard to US 50 63900 F
Bradshaw Road Folsom Boulevard to US 50 22400 a
Folsom Boulevard Bradshaw Road to Sunrise Boulevard 20400 a
Bradshaw Road Old Placerville to US 50 54405 F
Old Placerville Road Bradshaw Road to Rockingham Drive 11864ndash18365 a
Rockingham Drive Old Placerville Road to Mather Boulevard 16516 E
Mather Boulevard Rockingham Drive to Folsom Boulevard 21732 C
international Drive Rockingham Drive to Zinfandel Drive 12808 a
Zinfandel Drive international Drive to Folsom Boulevard 22298ndash47032 BE
white Rock Road Zinfandel Drive to Sunrise Boulevard 25459 a
Sunrise Boulevard US 50 to Folsom Boulevard No Data No Data
white Rock Road Sunrise Boulevard to Prairie City Road 3400 B
Folsom Boulevard Sunrise Boulevard to iron Point Road 17200 a
white Rock Road grant Line Road to EDSaC County Line 6700 D
iron Point Road Folsom Boulevard to East BidwellScott Road 13984 No Data
Scott Road iron Point Road to white Rock Road No Data No Data
Folsom Boulevard iron Point Road to Blue Ravine Road No Data No Data
Blue Ravine Road Folsom Boulevard to green Valley Road No Data No Data
Prairie City Road US 50 to white Rock Road 6000 D
HigHway 50 corridor system management plans [ 30 ]
c h a p t e r f i v e p e r f o r m a n c e m e a s u r e s
Table 7 Parallel and ConneCTing roadwayS PerForManCe MeaSUreS (ConTinUed)
County location average
daily Traffic1
PerForManCe MeaSUreS
loS1
Total Vehicle Hours of delay2
Total Person Minutes of delay2
Minutes of delay per Vehicle2
Minutes of delay per Person2
Vehicle Travel Time (Minutes)2
distressed Pavement
(lane Miles)4
daily Peak Hour3 daily Peak
Hour3 Peak Hour3 Peak Hour3 Peak Hour3
Parallel and ConneCTing roadwayS
ED
green Valley Road EDSaC County Line to Francisco Drive 22600 D
Data is unavailable for these performance measures at this time however will be pursued in the next phase of the CSMP
green Valley Road Francisco Drive to Silva Valley Parkway 13077 D
green Valley Road Silva Valley Parkway to Cameron Park 9849 C
green Valley Road Cameron Park Drive to Deer Valley Road 5278 C
green Valley Road Deer Valley Road (East) to Lotus Road 8381 D
green Valley Road Lotus Road to Placerville Drive 4669 C
Latrobe Road white Rock Road to US 50 24742 C
Durock Road Cameron Park Dr to South Shingle Road 7278 C
Cameron Park Drive Durock Road to US 50 (Durock Road to Coach Lane Coach Lane to US 50) 9544 26603 CD
South Shingle Road Durock Road to US 50 11390 D
white Rock Road EDSaC County Line to Latrobe 12808 D
white Rock Road Latrobe Rd to Silva Valley Pkwy (Latrobe to PostPost to Silva Vlly Pkwy) 10124 CD
Silva Valley Parkway white Rock Rd to Serrano Pkwy (white Rock to Entrada Entrada to Serrano Pkwy) 13708 9328 DC
Forni Road Placerville Drive to Main Street 9049 8379 No Data
Placerville Drive Forni Road to US 50 No Data No Data
Main Street Placerville Drive to Bedford avenue No Data No Data
Main Street Bedford avenue to Broadway No Data No Data
Broadway Main Street to Point View Drive No Data No Data
1 Source Average Daily Traffic and Level of Service (LOS) calculated are based on City of Sacramento between 2001 and 2007 Sacramento County from 20072008 City of Rancho Cordova between 2004 and 2007 and El Dorado County from 2007
HigHway 50 corridor system management plans [ 31 ]
c h a p t e r f i v e p e r f o r m a n c e m e a s u r e s
Page Inte
ntionally
Left
Blank
[ 32 ] HigHway 50 corridor system management plan
c h a p t e r f i v e p e r f o r m a n c e m e a s u r e s
tabLe 8 traNSit PerforMaNCe MeaSure
County transit Provider route Performance Measure
available daily Capacity ()1 available Peak Hour Capacity1
traNSit
SaC
SacRT (Bus)
Route 21 70 10
Route 28 76 59
Route 36 83 74
Route 38 66 44
Route 72 56 20
Route 73 79 45
Route 74 82 43
Route 109 47 22
SacRT (Light Rail) Gold Line 31 Exceeds Capacity
EDSAC ED County Transit Authority
Commuter Express Bus Service Not applicablendashOperates Peak Hour
Only 405
iron Point Connector 764 Not available
Reverse Commuter Not applicablendashOperates Peak Hour Only 982
yoloSaC yolo County Transit District Not applicablendashOperates Peak Hour Only 498
biKe3
1 Source average Daily and Peak Hour available Capacity calculated from each transit providerrsquos route ridership data 2 The Reverse Commuter service is offered on vehicles that are returning to El Dorado County (Commuter Express Buses) 3 Bicycle performance measure(s) will be identified applied and included in the subsequent CSMPs
HigHway 50 corridor system management plan [ 33 ]
c h a p t e r f i v e p e r f o r m a n c e m e a s u r e s
[ 34 ] HigHway 50 corridor system management plan
Page Inte
ntionally
Left
Blank
planned corridor system management strategies
chapter six
ConCept LoS and ConCept FaCiLit y ldquoConcept LOSrdquo and ldquoConcept Facilityrdquo have traditionally been used in Caltrans TCCRs to reflect the minimum level or quality of operations acceptable for each route segment within the 20-year planning period and the highway facility needed in the next 20 years to maintain the Concept LOS
Typical Concept LOS standards in Caltrans District 3 are LOS ldquoDrdquo in rural areas and LOS ldquoErdquo in urban areas how-ever some heavily congested route segments now have a Concept LOS ldquoFrdquo because the improvements required to bring the LOS to ldquoErdquo are not feasible due to environmental right of way financial and other constraints The applica-tion of multi-modal corridor management strategies should reduce the severity and duration of congestion and provide viable travel options and information that will enable a traveler to avoid severe freeway congestion
The Concept LOS and Concept Facility for US 50 are shown in Table 9 almost all US 50 segments are forecasted to operate under LOS ldquoFrdquo conditions in 20 years under the No-Build and Build scenarios
Corridor ManageMent StrategieS The US 50 CSMP also proposes specific strategies to enhance corridor mobility (see Table 10) based on the fol-lowing principles
bull Manage all modes and facilities in the corridor as a single system beginning with the transportation net-work defined in this CSMP
bull Implement comprehensive and dynamic multimodal monitoring and reporting for the system and for all modes
bull Develop and use micro-simulation modeling to identify mobility challenges and to evaluate proposed solutions
bull Complete the projects included in the regional trans-portation plans with an emphasis on the completion of the key mobility improvement projects identified in this CSMP (see Tables 11 and 12)
bull Implement the specific strategies outlined in this CSMP
Key CapitaL projeCtS Tables 11 and 12 contain key capital projects that have been identified as the most critical to corridor mobility These are also included in the SaCOg MTP for 2035 and are either planned without any funding yet programmed are partially programmed
The US 50 CSMPor are entirely programmed SACOG conducted significant proposes specific
public attitude research strategies to enhance for the MTP for 2035 to corridor mobility complement comprehensive outreach efforts through community workshops the TALL Order Moving the Region Forward event the televised Town Hall Road Map for the Future and associated public polling The results of the SaCOg analyses and public out-reach for the MTP were
highway 50 corridor system management plan [ 35 ]
c h a p t e r s i x p l a n n e d c o r r i d o r s y s t e m m a n a g e m e n t s t r a t e g i e s
[ 36 ] HigHway 50 corridor system management plan
used when selecting the key projects for identification in
the CSMP and to ensure consistency Not all corridor projshyects in the MTP are included in the CSMP since the CSMP focuses on the managed network and the SaCOg MTP considers all streets and roads bike routes and transit services in the corridor
highway 50 partnership The Highway 50 Partnership is a cooperative public-private effort among the County of Sacramento City of Rancho
Cordova City of Folsom County of El Dorado and several major landowners that recognize the need to consider corrishydor mobility needs holistically
The Partnership has collaborated effectively to develop a Plan to improve mobility in the US 50 Corridor from Rancho
Cordova to El Dorado Hills an area identified as approprishyate for growth in the SACOG Blueprint Recognizing the
need to generate private investment the Partnership is seeking to implement a regional Highway 50 Corridor fee program to fund these projects
in addition to the key projects indicated in Table 11 Table 12 displays the key projects identified by the
Partnership
These projects include (1) Near-Term Priority Improvement Projects and (2) Near-Term Expected Roadway Improveshyments
The Near-term Priority improvement Projects would proshyvide several new roadway connections for people to travel within and through the area to avoid congestion They also include new transit routes and widening existing roadways
viewed by the Partnership as a package that would provide system-wide travel benefits These improvements targeted
for completion through 2012 would reduce vehicle hours of delay during commute hours by 30 percent
The near-Term Expected Roadway Improvements are conshysidered by the Partnership to be readily expected since they are tied to expected development or are part of a near-term
capital improvements program
Visionary projects Visionary projects are not yet included in the SaCOg MTP or EDCTC RTP but appear to offer considerable corridor mobilshyity benefits and merit further analysis and consideration for inclusion in the next MTP and RTP These are displayed in
Table 13
The ldquoPlus 10 Listrdquo in the SACOG MTP identifies projects
that are attractive from a performance standpoint but could not be included in the Final Project Lists because of financial constraint The ldquoPlus 10 Listrdquo element offers the
opportunity to include projects that would not be affordshyable without additional funding Some projects identified in
the Visionary Projects List were analyzed by SACOG during
development of the current MTP Some of these are included in the ldquoPlus 10 Listrdquo
Watt Avenue Light Rail Station Improvement Project
c h a p t e r s i x p l a n n e d c o r r i d o r s y s t e m m a n a g e m e n t s t r a t e g i e s
Table 9 US 50 ConCePT loS and FaCiliTy TyPe
location Forecasted level of Service1 (loS) and Facility Type
County description and location From Post Mile To Post Mile Current
loS1 20-year no build loS12
20-year build loS12
20-year Concept
loS13 existing Facility4 Concept Facility456 Ultimate Facility457
yOL interstate 80 to yoloSacramento County Line
000 316 F F F F 8F (6F between Jefferson Blvd ramps)
8F+2HOV+aux Lanes 8F+2HOV+aux Lanes
SaC yoloSacramento County Line to SR 99 and 51
L000 L248 = R000 F F F F 8F 8F+2HOV+aux Lanes 8F+2HOV+aux Lanes
SaC State Routes 99 and 51 to watt avenue R000 R534 F F F F 8F 8F+2HOV+aux Lanes 8F+2HOV+aux Lanes
SaC watt avenue to Zinfandel Drive R534 R1092 F F F F 8F 8F+2HOV+aux Lanes 8F+2HOV+aux Lanes
SaC Zinfandel Drive to Sunrise Boulevard R1092 1250 E F F F 8F 8F+2HOV+aux Lanes 8F+2HOV+aux Lanes
SaC Sunrise Boulevard to Folsom Boulevard 1250 1701 E F F F 6F+2HOV to Hazel ave 4F+2HOV
to Folsom Blvd
6F+2HOV+aux Lanes to Hazel ave 4F+2HOV+aux
Lanes to Folsom Blvd
8F+2HOV+aux Lanes
SaC Folsom Boulevard to SaCED County Line 1701 2314 D F F F 4F+2HOV 4F+2HOV+aux Lanes 6F+2HOV+aux Lanes
ED SacramentoEl Dorado County Line to Cameron Park Drive
000 R657 E F F F 4F 4F+2HOV+aux Lanes 6F+2HOV+aux Lanes
ED Cameron Park Drive to Missouri Flat Road R657 R1506 E F E E 4F 4F+2HOV+aux Lanes to greenstone 4F+aux Lanes
to Missouri Flat
6F+2HOV+aux Lanes to greenstone 4F+2HOV+aux Lanes
to Missouri Flat
ED Missouri Flat Road to End of Freeway in Placerville
R1506 1725 D F F F 4F 4F+aux Lanes 4F+aux Lanes
ED End of Freeway in Placerville to Bedford avenue
1725 1811 D E E E 4E 4E 4E
ED Bedford avenue to Cedar grove Exit 1811 R2595 D F F F 4F to Smith Flat 4E to Camino 4F+aux Lanes to Smith Flat 4E to Camino
4F+aux Lanes
1 Level of Service (LOS) A ldquoreport cardrdquo for evaluating traffic flow with ldquoArdquo being the best and ldquoFrdquo being the worst 2 20-year LOS (No Build) The LOS that would be expected at 20 years with no improvements 3 20-year Concept LOS The minimum acceptable LOS over the next 20 years 4 Facility Type Codes C=Conventional Highway E=Expressway F=Freeway HOV=High Occupancy Vehicle Lanes aux=auxiliary Lanes 5 Operational improvements are included in future facilities for all segments Examples of operational improvements include TOS improvements and auxiliary lanes 6 Concept Facility the future roadway with improvements needed in the next 20 years if LOS ldquoFrdquo no further degradation of service from existing ldquoFrdquo is acceptable as indicated by delay performance measurement 7 Ultimate Facility The future roadway with improvements needed beyond a 20 year timeframe
HigHway 50 corridor system management plans [ 37 ]
c h a p t e r f i v e p e r f o r m a n c e m e a s u r e s
Table 10 US 50 CSMP STraTegieS
Strategy description implementation Challenges
Maintain and operate the existing corridor multi-modal trans-
portation infrastructure
Maintain the existing investment in all modes of the transportation system and provide adequate resources for daily operations including operating
revenues for transit services
Funding availability funding competition within the region
Fully coordinate the delivery of transportation services and facili-ties in the corridor including daily operations and system planning
for enhancements
Interagency operational coordination to maximize the efficiency and effec-tiveness of all modes operating in the corridor with a focus on the CSMP transportation network defined in this CSMP Use of an existing group or
committee to provide initial oversight for this strategy
Diverse interests and competing priorities and limited resources
Construct planned and pro-grammed corridor capital improve-
ment projects
implementation of the capital improvements in the corridor included within the approved Metropolitan Transportation Plan and Regional Transportation
Plan for all transportation modes within the scope schedule and cost specified
Funding availability funding competition within the region
Comprehensive daily monitoring of the status of all modes providing service on the CSMP transporta-
tion network
Full deployment of multimodal transportation service status detection systems for all CSMP network components
Funding availability funding competition within region
Provide traveler information to the public
Provide the public with real-time easily accessible information regarding the status of all CSMP transportation system components so as to allow travel-
ers to make informed decisions about trip mode time and routing options
Funding availability funding competition within region
Continually monitor and analyze the CSMP transportation network to improve system performance
Monitor transportation performance measures and make system modifica-tions as appropriate on a frequent and timely basis Staff resources and data availability
Decrease the duration of non-recurrent traffic congestion
Expand and enhance the Freeway Service Patrol to respond to automobile accidents and vehicle break-downs
Funding availability funding competition within the region
Timely implementation of STaRNET
Expedite the implementation of the STaRNET operators of transportation facilities and emergency responders in the Sacramento region through real-time sharing of data and live video refinement of joint procedures
pertaining to the operation of roadways and public transit and public safety activities as well as enhance the regionrsquos 511 web site and interactive
telephone service to provide more traveler information
Developmental time acceptance by agencies and integration into daily use and identifica-
tion of maintenance and operations funding
Enhance transit and rail service increase transit service frequency provide express transit services imple-
ment bus rapid transit routes reduce headways for light rail and buses and construct planned light rail line extensions
Funding availability funding competition within the region
Complete Bus Carpool lane network
Complete the regional buscarpool lane network including freeway-to-freeway HOV lane connectors
Funding availability funding competition within the region Public agency and public
acceptance of network
[ 38 ] HigHway 50 corridor system management plan
c h a p t e r s i x p l a n n e d c o r r i d o r s y s t e m m a n a g e m e n t s t r a t e g i e s
tabLe 10 uS 50 CSMP StrategieS (ConTInued)
Strategy Description implementation Challenges
Enhance Transportation Demand Management strategies
Encourage employers to provide telecommuting and flexible working hour options to employees
acceptance by employers and resources to participate
Optimize the timing and synchronishyzation of traffic signals
Coordinate the optimization and timing of traffic signals on freeway ramps and along parallel and connecting roadways within and between jurisdicshytions to improve traffic flow and reduce congestion Provide signal priority
systems for transit vehicles
Funding availability and coordination among cities counties and Caltrans
improve access management of freeways and parallel connecting roadways
Develop and implement access management strategies to maintain the operational efficiency of freeways and parallelconnecting roadways
agreement between responsible jurisdicshytions as to where increased access control is needed increased access control on some parallelconnecting roadways may increase
traffic volumes on non-corridor roads
Develop innovative use of CMSs (eg travel times)
Potential uses of CMSs to improve system efficiency include the use of CMSs along portions of all corridors near transit station to indicate travel
times based on real-time existing traffic conditions on the freeway as well as on parallel roadways and express bus and light rail services CMS can also be used to identify the number of parking spaces that are still available at
the light-rail stations
Funding availability funding competition within the region
Implement amp expand Transit AVLTransit status information
enhancements for system users
Expand the use of AVL systems utilizing GPS technology to track in real-time the location of transit vehicles monitor transit schedules dispatch transit vehicles and provide real-time passenger information such as ldquonext busrdquo or
ldquonext trainrdquo arrival times
Funding availability funding competition within region
Expand Park-and-Ride lots at key locations
Add additional capacity to existing park-and-ride lots near transit stations and other locations that are approaching capacity
Funding availability funding competition within the region and available land
improve bike-pedestrian access in the CSMP
transportation network
Plan and program for construction of additional bicycle paths lanes and related improvements for access and connectivity to transit park and ride
lots and destination points
Funding availability funding competition within the region
Provide ldquoBike-SharingrdquordquoCar-Sharingrdquo tofrom transit (ldquoCarlinkrdquo) and from
neighborhoods
Expand the Regional Rideshare and Spare-the-Air programs to include bicycle and car sharing opportunities
Funding availability and coordination between SaCOg TMa air Districts employers developshyers property managers and local government
officials
Provide parking management stratshyegies in interested jurisdictions where applicable to discourage
use of single-occupant vehicles
in higher-density areas provide preferential parking for carpools and vanshypools require residential parking permits remove on-street parking and or provide graduated parking fees for metered on-street parking based on
vehicle type and time of day for SOV spaces to encourage transit use
Acceptance by businesses local officials and the general public
Expand bicycle commute amp transit fare strategiessubsidies
increase participation by large employers in programs that subsidize transit fares for employees during peak-hour commute times and provide bicycling
to work incentives
Voluntary participation by large employers to pay subsidy to transit providers
HigHway 50 corridor system management plan [ 39 ]
c h a p t e r s i x p l a n n e d c o r r i d o r s y s t e m m a n a g e m e n t s t r a t e g i e s
tabLe 11 KeY CaPitaL ProjeCtS
CountyLead agency
route roadway from to Project
Description Programmed
funds
additional funding Needed
total Cost estimate (x $1000)
Comp Year (FFY)
uS 50
Sacramento Caltrans District 3
US 50 Downtown watt avenue HOV Lanes $0 $75000 $75000 2020
Sacramento Caltrans District 3
US 50 watt avenue Sunrise Blvd HOV Lanes $165000 $0 $165000 2013
Sacramento Caltrans District 3
US 50 Bradshaw Road
Mather Field Road
Eastbound and Westbound Auxiliary Lanes
$0 $3700 $3700 2016
Sacramento Caltrans District 3
US 50 State Route 99
(Oak Park Interchange) interchange improvements including buscarpool lane
connectors $0 $150000 $150000 2014
Sacramento Caltrans District 3
US 50 interstate 5
(Riverfront Interchange) Riverfront Interchange
improvements including bus carpool lane connectors
$30000 $170000 $200000 2016
ED Caltrans District 3 US 50 Camino
Operational Safety improvements Construct an
undercrossing median barrier modify local road connections andor associated operational improvements on and adjacent
to US 50
$15000 $0 $15000 2012
ED ED County DOT US 50
west of Latrobe Road
west of Bass Lake
grade HOV Lanes (Ph1) $47141 $0 $47141 2010
ED Caltrans District 3 US 50
west of Bass Lake Road
Ponderosa Road
HOV Lanes (Ph2) $55000 $0 $55000 2011
ED Caltrans District 3 US 50 Ponderosa
Road greenstone
Road HOV Lanes (Ph3) $22357 $0 $22357 2013
ED ED County DOT US 50 Future Silva
Valley iC
Future Empire Ranch IC
Mainline Widening construct new WB lane within the
median from proposed Silva Valley IC to proposed Empire
Ranch IC
$2950 $0 $2950 2013
[ 40 ] HigHway 50 corridor system management plan
c h a p t e r s i x p l a n n e d c o r r i d o r s y s t e m m a n a g e m e n t s t r a t e g i e s
tabLe 11 KeY CaPitaL ProjeCtS (ConTInued)
CountyLead agency
route roadway from to Project
Description Programmed
funds
additional funding Needed
total Cost estimate (x $1000)
Comp Year (FFY)
PARALLEL AnD COnnECTInG ROADWAYS
ED ED County DOT
Silva Valley Parkway
Entrada Drive
Future US 50
Silva Valley Parkway iC
Widen Silva Valley Road from 2 lanes to 4 lanes includes
Class ii bike lanes and left turn storage pockets
$2921 $0 $2921 2010
ED ED County DOT
Silva Valley Parkway US 50
US50 Silva Valley Parkway (Phase 2) Includes constructshying overcrossing and ramps
signalization at EB and WB on off ramps
$57817 $0 $57817 2016
ED ED County DOT
Headington Road
Missouri Flat Road
El Dorado Road
Extend 2 lanes with median $9878 $0 $9878 2012
ED ED County DOT
Durock Road
Robin Lane South
Shingle Road
Extend 2 lanes with median $1239 $9214 $10453 2015
ED ED County DOT
Durock Road
Business Center Drive intersection signalization
includes adding turn pockets on Durock Road
$4333 $0 $4333 2009
ED City of Placerville
Point View Drive Broadway Smith Flat
Road Extend 2 lanes $1300 $0 $1300 2020
ED City of Placerville
western Placerville
US 50 interchange
Forni Road Ray Lawyer
Drive
Placerville Drive
Interchange Reconstruction convert Ray Lawyer Dr
Overcrossing to full IC Auxiliary Lanes
$5059 $34741 $39800 2020
Sacramento City of Rancho
Cordova
Mather Boulevard
Rockingham Road
Zinfandel Drive widen to 4 lanes $0 $8617 $8617 2020
Sacramento Rancho Cordova
Parkway ii
Grant Line Road
White Rock Road
New 6-lane expressway includshying intersection improvements at Kiefer Blvd amp White Rock
Road
$0 $44518 $44518 2020
Sacramento City of Folsom
Scott Road US 50 White Rock Rd
widen from 2 to 6 lanes $16000 $0 $16000 2020
Sacramento Sacramento County DOT
White Rock Road
Grant Line Rd
Prairie City Rd
Widen from 2 to 4 lanes realign near Nike and Nimbus Roads and connect with existshying alignment west of Prairie City Rd Realign Grant Line Rd to intersect with realigned
White Rock Rd
$26600 $0 $26600 2020
Sacramento Sacramento County DOT
Hazel avenue
US 50 Hazel Madison
Widen American River Bridge and approaches from 4 to 6 lanes Widen Hazel Avenue from AR Bridge to Madison from 4 to 6 lanes with Bike
LanesSignals
$83530 $0 $83530 2020
HigHway 50 corridor system management plan [ 41 ]
c h a p t e r s i x p l a n n e d c o r r i d o r s y s t e m m a n a g e m e n t s t r a t e g i e s
tabLe 11 KeY CaPitaL ProjeCtS (ConTInued)
CountyLead agency
route roadway from to Project
Description Programmed
funds
additional funding Needed
total Cost Estimate (x $1000)
Comp Year (FFY)
PARALLEL AnD COnnECTInG ROADWAYS
ED ED County DOT
green Valley Road
Salmon Falls Road
east
Deer Valley Road
widen from 2 to 4 lanes $0 $14576 $14576 2025
ED ED County DOT
green Valley Road
Deer Valley Road east Lotus Road widen $958 $4513 $5471 2015
ED ED County DOT
green Valley Road
Francisco Drive
Salmon Falls Road
widen from 2 to 4 lanes divided $412 $3491 $3903 2015
ED ED County DOT
Latrobe Road
investment Boulevard
golden Foothill Parkway
widen from 2 lanes undivided to 4 lanes
divided $1076 $8792 $9868 2015
ED ED County DOT
Latrobe Road
Carson Creek
White Rock Road
widen from 4 to 6 lanes $0 $23755 $23755 2025
ED ED County DOT
white Rock Road
EDSac County Line
Manchester Drive
widen 2 to 4 lanes divided includes signal interconnect and coorshy
dination
$0 $23755 $23755 2025
Sacramento City of Rancho
Cordova
Easton Valley
Parkway
Prairie City Road
Empire Ranch Road extenshysion south of
US 50
Construct new 4 lane road $0 $45000 $45000 2020
Sacramento Sacramento County DOT
Hazel avenue
Easton Valley
Parkway
Grant Line RoadWhite Rock Road
New road extension 4 lane limited access
through aerojet property $0 $18000 $18000 2018
Sacramento Sacramento County DOT
white Rock Road
Prairie City Road
ED County Line
widen to 4 lanes $8330 $64773 $73103 2018
Sacramento Sacramento County DOT
green Valley Road
East Natoma Sacramento ED County
line widen to 4 lanes $0 $3000 $3000 2018
Sacramento City of Rancho
Cordova
Zinfandel Drive
international Drive
Folsom Boulevard
widen to 4 lanes $0 $12000 $12000 2020
[ 42 ] HigHway 50 corridor system management plan
c h a p t e r s i x p l a n n e d c o r r i d o r s y s t e m m a n a g e m e n t s t r a t e g i e s
tabLe 11 KeY CaPitaL ProjeCtS (ConTInued)
CountyLead agency
route roadway from to Project
Description
Pro-grammed
funds
addi-tional
funding Needed
total Cost estimate (x $1000)
Comp Year (FFY)
traNSit
yolo amp Sacramento City of west Sacramento
amp City of Sacramento
Sacramento River
Crossing
15th Street in the City
of west Sacramento
Broadway in the City of
Sacramento
New all-modal river crossing (Auto Transit Bike amp Pedestrian)
from Sacramento across the Sacramento River to West
Sacramento The crossing was modeled between Broadway in Sacramento amp 15th Street in
West Sacramento but final alignshyment options will be studied in subsequent planning efforts
$800 $99200 $100000 2019
Sacramento Cal State University
Sacramento
CSUS Campus mdash mdash
Sac State Tram adjoining City streets and SRTD 65th Street light railbus transfer station Bus Rapid Transit System
$23574 $0 $23574 2013
Sacramento City of Rancho
Cordova
Rancho Cordova Various Various
New Service Rancho Cordova Pilot Transit Shuttle System new transit service for connection to
RTs Gold Line
$2380 $1500 $38880 2014
yolo amp Sacramento City of west Sacramento
TBD west
Sacramento Sacramento Streetcar Service between west
Sacramento and Downtown Sacramento
$17400 $54700 $72100 2014
Sacramento City of Rancho
Cordova RT Gold Line
RT Gold Line Tracks
Mather Field Road
Light Rail Grade Separations $0 $52888 $52888 2025
Sacramento City of Rancho
Cordova RT Gold Line
RT Gold Line Tracks Zinfandel Drive Light Rail Grade Separations $0 $52888 $52888 2025
Sacramento City of Rancho
Cordova RT Gold Line
RT Gold Line Tracks
Bradshaw Road
Light Rail Grade Separations $0 $35260 $35260 2025
Sacramento City of Rancho
Cordova RT Gold Line
RT Gold Line Tracks Routier Road Light Rail Grade Separations $0 $35260 $35260 2025
Sacramento City of
Sacramento Sacramento Valley Station
Sacramento intermodal Transportation Facility (Phase 1) - Develop intermodal transportashytion terminal for heavy rail light
rail and bus service
$77799 $0 $77799 2010
Sacramento City of
Sacramento Sacramento Valley Station
Sacramento intermodal Transportation Facility (Phase 2) - Develop intermodal transportashytion terminal for heavy rail light
rail and bus service
$24101 $1000 $25101 2014
HigHway 50 corridor system management plan [ 43 ]
c h a p t e r s i x p l a n n e d c o r r i d o r s y s t e m m a n a g e m e n t s t r a t e g i e s
TABLE 11 KEY CAPITAL PROJECTS (CONTINUED)
CountyLead Agency
Route Roadway From To Project
Description Programmed
Funds
Additional Funding Needed
Total Cost Es-timate (x $1000)
Comp Year (FFY)
BICYCLE ROUTES
Sacramento City of Rancho
Cordova
US 50Mather Field Road IC US 50 Mather
Field Road
US 50Mather Field Road PedestrianBike Crossing along
the Mather Airport RR Spur alignment
$0 $820 $1055 2015
ED ED County DOT
Sacramento Placerville
Transportation Corridor
Forni Rd
Missouri Flat Rd Class I Bike Trail $1423 $111 $1534 2009
ED City of Placerville
El Dorado Trail Western
Extension
Canal Street Main Street
Ray Lawyer DriveForni
Road Class 1 Bike Trail $1850 $0 $1850 2010
ED ED County DOT
US 50ED Hills Blvd IC US 50
El Dorado Hills Blvd
Latrobe Road
US 50El Dorado Hills Blvd Pedestrian Overcrossing $5508 $66 $5574 2014
TABLE 12 50 MOBILITY PARTNERSHIP KEY CAPITAL PROJECTS
RouteRoadway From To Project Description
NEAR TERM PRIORITY IMPROVEMENT PROJECTS
US 50 Sunrise Scott Road Auxiliary Lane
US 50 Hazel Avenue Interchange Improvements
Hazel Avenue Folsom Boulevard Easton Valley Parkway New 4 Lane Road
Easton Valley Parkway Hazel Avenue Rancho Cordova Parkway New 6 Lane Road
Rancho Cordova Parkway Easton Valley Parkway White Rock Road New 4 Lane Road
White Rock Road Sunrise Boulevard Silva Valley Parkway Widen to 4 Lanes
RT Gold Line Hazel Iron Point Station Passing Tracks
US 50 Rancho Cordova Parkway New Interchange
Zinfandel Drive South of International Douglas Road New 4 Lane Road
International Drive Kilgore Road Rancho Cordova Parkway New 6 Lane Road
Douglas Road Zinfandel Extension Sunrise Boulevard Widen to 4 Lanes
Sunrise LRT Citrus Road Sunrise Mall Bus Rapid TransitExpress Bus
[ 44 ] HIGHWAY 50 corridor system management plan
c h a p t e r s i x p l a n n e d c o r r i d o r s y s t e m m a n a g e m e n t s t r a t e g i e s
TABLE 12 50 mOBILITY PARTnERSHIP kEY CAPITAL PROjECTS (COnTInUED)
routeroadway from to Project Description
US 50 nEAR TERm PRIORITY ImPROVEmEnT PROjECTS
US 50 Empire Ranch Road New interchange
US 50 Silva Valley New interchange
US 50 Scott Road Empire Ranch Road Aux Lanes
US 50 Empire Ranch Road El Dorado Hills Boulevard Aux lanes and climbing lanes
US 50 El Dorado Hills Boulevard Silva Valley Parkway Aux lanes and climbing lanes
US 50 Silva Valley Parkway Bass Lake Road Aux lanes
Sunrise Boulevard White Rock Road Douglas Boulevard widen to 6 lanes
Sunrise Boulevard Douglas Boulevard Jackson Road widen to 4 lanes
White Rock Road Sunrise Boulevard Future Rancho Cordova Parkway and El Dorado County Line to Latrobe Road
widen to 4 lanes
Douglas Boulevard Sunrise Boulevard Grant Line Road widen to 4 lanes
Rancho Cordova Parkway Douglas Boulevard Rio del Oro Parkway New 2 lane road
Rancho Cordova Parkway Rio del Oro Parkway White Rock Road New 6 lane road
Jaeger Road Douglas Road Kiefer Boulevard New 4 lane road
Chrysanthy Sunrise Boulevard Americanos Boulevard New 4 lane road
Kiefer Boulevard Sunrise Boulevard Jaeger Road New 4 lane road
Grant Line Road Douglas Road Chrysanthy Road widen to 4 lanes
Hazel avenue Gold Country Boulevard Madison avenue widen to 6 lanes
Latrobe Road South of White Rock Road widen to 4 lanes
TABLE 13 VISIOnARY PROjECTS
County routeroadway from to Project Description
Sac yolo US 50 Enterprise Downtown Sacramento HOV Lanes
ED TBD Folsom Placerville Transit ndash Type TBD
ED New Road Latrobe Road White Rock Road (poten shy
tially US 50) New 2-lane road
HigHway 50 corridor system management plan [ 45 ]
c h a p t e r s i x p l a n n e d c o r r i d o r s y s t e m m a n a g e m e n t s t r a t e g i e s
[ 46 ] HigHway 50 corridor system management plan
Page Inte
ntionally
Left
Blank
congestion and bottleneck analysis
chapter seven
The 2000 Highway Capacity Manual defines a bottleneck
as ldquoa road element on which demand exceeds capacityrdquo
The bottleneck analysis evaluates specific causes of existshying recurrent traffic congestion in the corridor Freeway bottleneck locations that create mobility constraints are identified and documented and their relative contribution
to corridor-wide congestion is reported The bottleneck locations were determined based on a combination of the use of 2006 PeMS data HiCOMP report probe vehicle tach runs and field observations
Traffic congestion can be categorized as either recurrent
or non-recurrent
recurrent congestion occurs repeatedly at the same place and time of day in a predictable pattern Recurrent congesshytion is often associated with facility capacity limitations changes in capacity conflicting vehicle movements such
as lane merges inadequate number of transit vehicles to handle passenger loads or other persistent physical condishytions of the transportation facility
Non-recurrent congestion is usually attributed to collishysions equipment malfunction community events weather construction projects and other occasional occurrences When transportation systems are close to their maximum
carrying capacity non-recurrent congestion is more likely to occur as there is little excess capacity in the system
The location and extent of the bottlenecks on US 50 found
in the aM and PM peak periods are summarized in Tables 14 and 15 These depictions should be considered a snapshyshot view and not a comprehensive analysis of all bottleshynecks in the corridor Further work is being conducted to
refine the identification and causality of bottlenecks within
the corridor Table 14 shows a summary of the US 50 eastbound bottlenecks while the tables that follow discuss each bottleneck including location and possible causality Table 15 shows a summary of the US 50 westbound bottleshynecks while the tables that follow discuss each bottleneck including location and possible causality Minor or hidden bottlenecks are those Freeway bottleneck
that are not as defined locations that create (or severe) as the major mobility constraints bottlenecks Please note are identified and that the graphics accomshy documented and their panying the bottlenecks
relative contribution to are not to scale
corridor-wide congestion Major bottlenecks in the is reported eastbound direction during the aM peak period are at Howe avenue and during the PM peak period are at 48th Street Howe Avenue Mayhew Road Routier Road Sunrise Boulevard and El Dorado Hills Boulevard Major bottlenecks in the westbound direction during the aM peak period are at El Dorado Hills Boulevard Hazel Avenue Zinfandel Drive
HigHway 50 corridor system management plan [ 47 ]
c h a p t e r s e v e n c o n g e s t i o n a n d b o t t l e n e c k a n a l y s i s
Bradshaw Road and Howe Avenue and major bottleneck
locations during the PM peak period are at Zinfandel Drive Routier Road Bradshaw Road Howe Avenue and Intershystate 5
Causalities for these bottlenecks range from high-traffic
demand (congestion) heavy weavingmerging areas or physical constraints such as lane drops lack of ramp meters incomplete HOV network incomplete Auxiliary Lane
network poorly coordinated traffic signals and an off-ramp
queue (Sunrise Boulevard) US 50 Westbound Onramp
TABLE 14 US 50 EASTBOUnD BOTTLEnECk SUmmARY Source PeMS Caltrans tach runs and
Cambridge Systematics field observations
bottleneck Location PeMS Speed Contours Caltrans Probe Vehicle Runs
Cause aM PM aM PM
A Jefferson Blvd PM 25 Minor Minor Traffic weaving truck volumes and grade
B 48th St PM 7 Minor Major Minor Minor Merge from SR 51 and SR 99
C Howe ave PM 9 Major Major Major weave between Howe and watt
D Mayhew Rd PM 12 Major Minor Major Weaving before Bradshaw Exit
E Routier Rd PM 14 Minor Major Weaving before Mather Field Rd Exit
F Sunrise Blvd PM 185 Minor Major Lane drop HOV add off-ramp queue
G Folsom Blvd PM 22 Minor Minor Lane drop 4 to 3
H El Dorado Hills Blvd PM 275 Major
Poorly coordinated traffic signal on arterial causes spillback onto freeway
a jefferson blvd bottleneck The bottleneck approximately located at Jefferson Blvd is due to weaving traffic as those entershying the freeway from Jefferson Blvd must cross those attempting to exit the freeway to I 5 There is a large number of trucks in the stream which struggle with the grade at this location exacerbatshying the bottleneck
[ 48 ] HigHway 50 corridor system management plan
c h a p t e r s e v e n c o n g e s t i o n a n d b o t t l e n e c k a n a l y s i s
b 48th St bottleneck The bottleneck approximately located at 48th St is due to the additional traffic merging from SR 51 and SR 99 combined with the eventual lane drop at 59th St This queue extends upstream past the off-ramp to SR 5199 These off-ramps are bottlenecks in themselves which spill back and choke the US 50 mainline
C Howe Ave Bottleneck The bottleneck at Howe ave is due to the entering traffic from Howe Ave Two Howe Ave on-ramps feed into US 50 eastbound southbound Howe ave loop on-ramp and northbound Howe ave direct ramp approximately 300 feet apart The watt avenue off-ramp is just down stream with heavy exiting volumes therefore the segment between Howe and watt is characterized by heavy weaving
D mayhew Rd Bottleneck The bottleneck approximately located at Mayhew Rd most likely begins with the additional traffic entering from Watt Ave and ends with the exiting traffic at Bradshaw Rd It is possible that there is a high proportion of weaving traffic with in this section (Watt Ave traffic moving to the left lane and those exiting at Bradshaw Rd moving to the right lane)
HigHway 50 corridor system management plan [ 49 ]
c h a p t e r s e v e n c o n g e s t i o n a n d b o t t l e n e c k a n a l y s i s
[ 50 ] HigHway 50 corridor system management plan
e routier rd bottleneck It is likely that the bottleneck at Routier Rd is due to the same merging conditions associated with Mayhew Rd The area is comprised of both residential and light industrialoffice land uses therefore during the PM peak period there are large volumes of vehicles entering at Bradshaw Rd moving to the left lanes and large volumes of vehicles moving to the right lane to exit at Mather Field Rd
f Sunrise blvd bottleneck At Sunrise Blvd the right-most lane exits while an HOV lane is added as the median lane The bottleneck is formed from vehicles shifting left to avoid exiting at Sunrise Blvd and to enter the HOV lane There is a large volume of vehicles queued at the Sunrise off-ramp which spills back and negatively affects the US 50 mainline
g folsom blvd bottleneck The right-most lane exits to Folsom Blvd leaving one HOV lane and two regular lanes along the US 50 The bottleneck is caused by this lane drop as well as the quick merge at the Folsom on-ramp
c h a p t e r s e v e n c o n g e s t i o n a n d b o t t l e n e c k a n a l y s i s
H The eastbound US 50 at El Dorado Hills Blvd Bottleneck The eastbound El Dorado Hills Blvd bottleneck is caused by a traffic signal on the arterial that often causes spillbacks on the EB loop offramp onto the freeway mainlines
TABLE 15 US 50 WESTBOUnD BOTTLEnECk SUmmARY Source PeMS Caltrans tach runs and Cambridge Systematics field observations
bottleneck Location PeMS Speed Contours Caltrans Probe Vehicle Runs
Cause aM PM aM PM
A El Dorado Hills Blvd PM 275 Major Poorly coordinated traffic
signal on El Dorado Hills Blvd
B Hazel Ave PM 21 Major Entering traffic
C Zinfandel Dr PM 16 Minor Major Major Major Entering traffic
D Routier Rd PM 14 Minor Major Minor Weaving traffic
E Bradshaw PM 13 Major Major Major Merging traffic and curve
F Howe Ave PM 9 Minor Major Major Major Weaving traffic and grade
G SR 51SR 99 PM 6 Minor Lane drop weaving traffic
H i-5 PM 3 Major Weaving traffic
HigHway 50 corridor system management plan [ 51 ]
c h a p t e r s e v e n c o n g e s t i o n a n d b o t t l e n e c k a n a l y s i s
[ 52 ] HigHway 50 corridor system management plan
A El Dorado Hills Blvd Bottleneck The minor bottleneck at El Dorado Hills Boulevard is caused by the traffic signal on El Dorado Hills Blvd that causes spillback on the westbound offramp onto the freeway mainlines
B Hazel Avenue Bottleneck In 2006 the Hazel Ave Bottleneck is caused by the traffic entering at both Hazel Ave and Folsom Blvd (the two on-ramps are separated by about one mile) The bottleneck that would appear at Folsom Blvd combines with the bottleneck at Hazel ave to form a large bottleneck that does not clear until after Hazel ave Sometimes causshying spillbacks as far as Prairies City Road this bottleneck was mitigated in 2007 as part of the GO CALIFORNIA program
C Zinfandel Dr Bottleneck There is heavy traffic coming from Sunrise Blvd but the lane addition immediately after the westbound on-ramp prevents a bottleneck from forming but as traffic flows westward the heavy traffic entering from Zinfandel Dr causes a bottleshyneck here
D Routier Rd Bottleneck The bottleneck at Routier Rd is caused by weaving traffic between Mather Field Rd and Bradshaw Rd This highway segment represents a transition area where vehicles that have been traveling in the left lanes begin to shift to the right lanes to exit while the entering traffic tries to shift to the left lanes
W eav in gLan e Dr o p
c h a p t e r s e v e n c o n g e s t i o n a n d b o t t l e n e c k a n a l y s i s
e bradshaw rd bottleneck The Bradshaw Rd bottleneck is caused by the entering traffic from Bradshaw Road the high truck volumes and the curve west of Bradshaw Two Bradshaw Rd on-ramps feed into US 50 westshybound southbound Bradshaw Rd direct on-ramp and northbound Bradshaw Rd loop on-ramp approximately 400 feet apart
F Howe Ave Bottleneck The Howe ave bottleneck is caused by a grade change and the weaving traffic entering from Howe ave and Hornet Dr competing for the right-most lane with those wanting to exit at 65th Street
G amp H SR 51SR 99 amp I-5 Bottleneck The bottleneck at I 5 is caused by the conflict between entering SR 99 and SR 51 traffic and exiting I-5 traffic as well as the queues formed on the ramps to i-5 which spill back onto US 50 The number of lanes in this section reaches a maximum of 6 and then drops to 4 as two lanes exit at the I-5 freeway This bottleneck is exacershybated during the peak periods when it stretches upstream to the lane drop before SR 99
W ea v in g
Lan e Dr o p
HigHway 50 corridor system management plan [ 53 ]
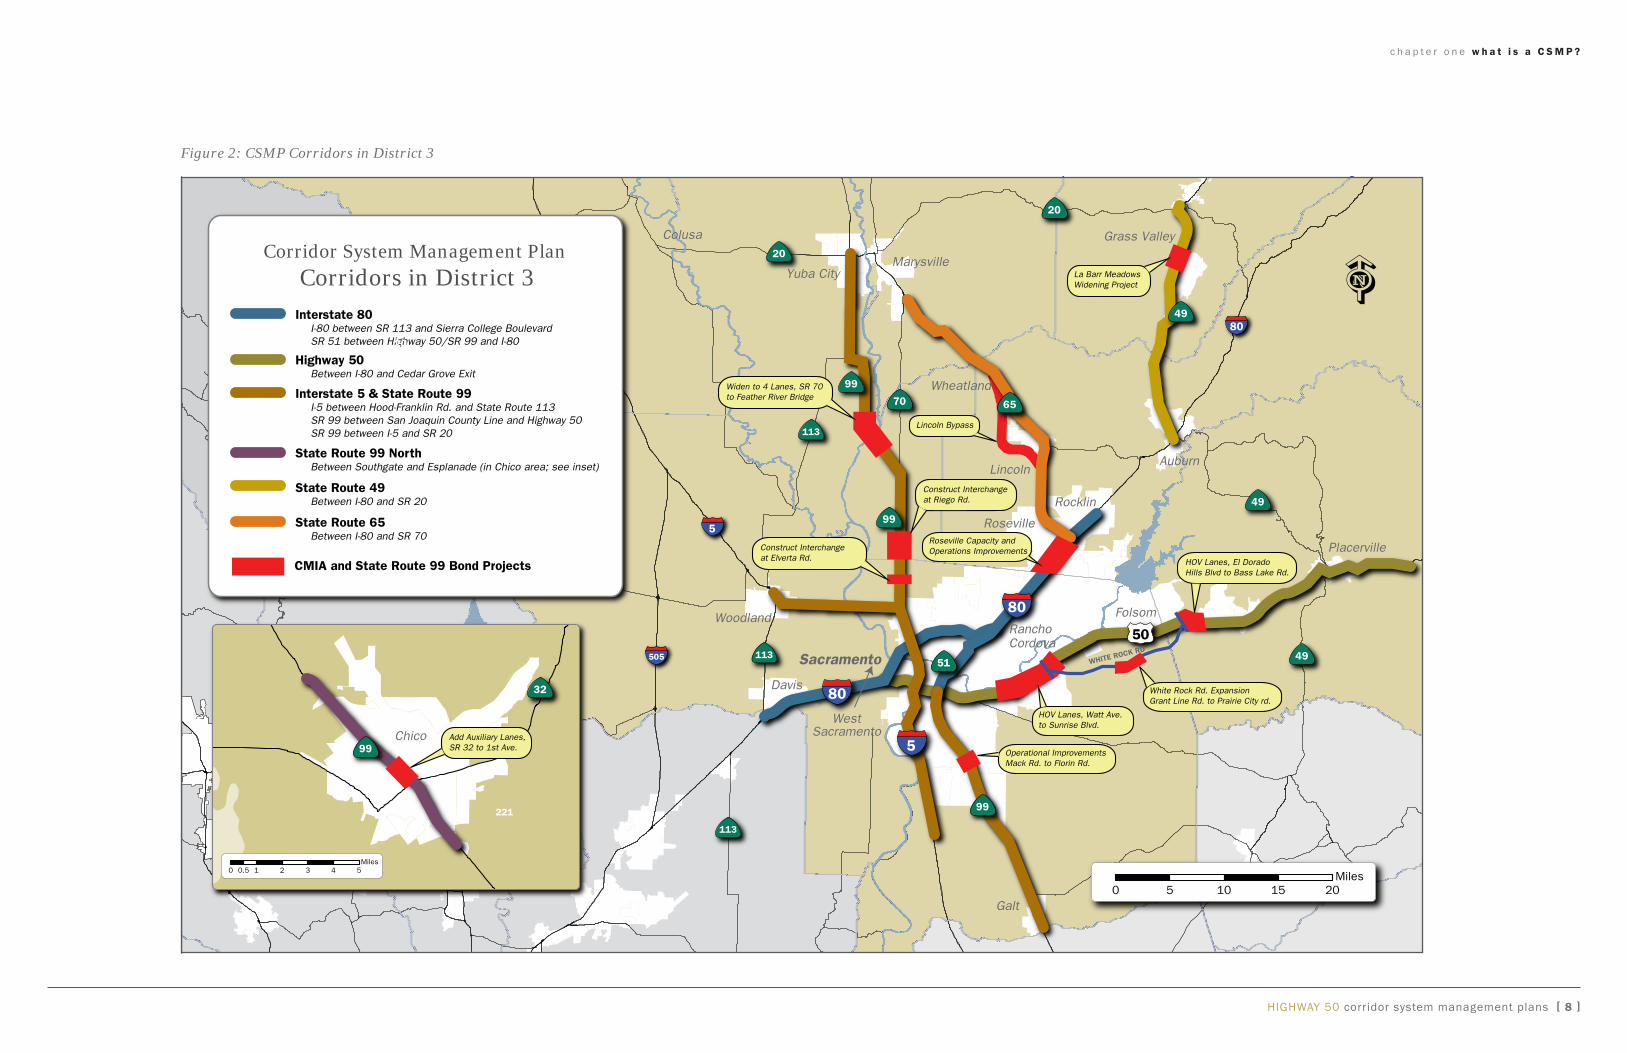
c h a p t e r t h r e e c u r r e n t c o r r i d o r s y s t e m m a n a g e m e n t s t r a t e g i e s
These strategies work as a system to gather analyze and disseminate information through the Caltrans TMC inforshymation about collisions other incidents road closures and emergency notifications are fed into this information hub
and disseminated to public and private information users The TMC operates 24 hours a day seven days a week
parallel anD connecting roaDways City of West Sacramento has one CCTV located on west Capitol Avenue between Enterprise Boulevard and Capitol Mall
City of Sacramento operates a TOC Sensors in the street detect the passage of vehicles vehicle speed and the level of congestion
This information is received on a second-by-second (real-time) basis and is analyzed at the TOC
Sacramento County also operates a TOC by gathering information through CCTV cameras CMS HAR and a Fiber Optics (FO) network placed along major traffic
corridors throughout the county
City of rancho Cordova will be installing CCTV cameras and a FO network on Folsom Boulevard in 2009 Currently one CCTV exists on Sunrise Boulevard
between US 50 and Folsom Boulevard Most major traffic corridors are on the network or will be by the end of 2009 The City contracts with the County of Sacramento to operate their systems through the Countyrsquos TOC
City of folsom recently completed installing a FO system
Changeable Message Sign on US 50 at Scott Road
on all of the Cityrsquos major corridors Currently the sole intersection that is monitored via camera is located on iron Point Road and East Bidwell
El Dorado County has three coordinated signals along Francisco Drive at Green Valley Road the Market Place
entrance (east side Safeway Centerwest side Lake
Forest Plaza) and Village Center Drive
City of Placerville utilizes traditional control devices traffic signals and stop signs
transit anD riDesharing Yolo County Transit District (YCTD) uses a Global Positionshying System (GPS) for locating buses in route referred to as
an Automatic Vehicle Location (AVL) system
The AVL System allows users to see where their bus is
located within the last minute
El Dorado Transit Authority utilizes the gPS Zonar System for pre-trip inspections maintenance and real-time vehicle tracking
Sacramento Regional Transit District (SacRT) has in shystalled pre-emptive traffic signals at at-grade intersections
along the Light Rail routes SacRT has a GPS however it is only utilized for analysis purposes
Computer-aided dispatch and Bus Rapid Transit are in
the planning stages In addition SacRT has an online Trip
Planning application to assist transit users During special events such as the California State Fair the Jazz Festival
65th Street Light Rail Station and Transit Oriented Development
HigHway 50 corridor system management plan [ 13 ]
c h a p t e r t h r e e c u r r e n t c o r r i d o r s y s t e m m a n a g e m e n t s t r a t e g i e s
TABLE 3 PARk AnD RIDE LOTS
County Post Mile Facility name Description
Lot use transit Connection
Spaces Spaces occupied
occupancy Rate () Provider and route No
SaC 70 Butterfield Sacramento Regional Transit Gold Line Station
406 129 318 SacRT SacRT LRT Gold Line
SaC 125 Sunrise Sacramento Regional Transit Gold Line Station
487 389 799 RSacRT SacRT LRT Gold Line
SaC 158 Hazel 432 135 306 SacRT SacRT LRT Gold Line
SaC 158 Hazel 33 6 24 SacRT Route 109
SaC 171 Folsom Boulevard 70 58 829 ED Iron Point Connector SacRT LRT Gold Line
ED 2 El Dorado Hills (Latrobe RoadWhite Rock Road) 123 138 1122 ED Iron Point Connector ED Routes
156781112
ED 5 Cambridge Road 59 40 678 ED Iron Point Connector ED Routes 14567891112
ED 86 Ponderosa Road Northeast 28 15 536 ED Iron Point Connector ED Routes 23679101112
ED 86 Ponderosa Road Northwest 111 61 55 ED Iron Point Connector ED Routes 23679101112
ED 86 Durock Road 57 21 368 Na
ED 149 Shingle Springs Drive 19 4 211 Na
ED 122 Greenstone Road 21 4 19 Na
ED 15 Missouri Flat Road 73 44 603 ED Iron Point Connector
ED 158 Fairgrounds Park-and-Ride 200 40 20 ED Iron Point Connector
ED 185 Placerville Station (Mosquito Park- and-Ride) 130 50 385 ED Iron Point Connector
ED Commuter Service
ED 233 Camino Heights 24 1 42 Na
SacRT = Sacramento Regional Transit District ED = El Dorado County Transit Authority Lrt = Light rail train
Survey 2007
the holiday seasons and the Mather Field Air Show SacRT
operates additional service to connect events to light rail stations and offer free service to promote transit use durshying select events The transit routes identified in the CSMP
network are shown in Figure 5
The Sacramento Valley Station in downtown Sacramento is
the 7th busiest station in the national amtrak system and serves as a multi-modal transfer facility There are over 11 million passenger trips annually
Passengers can make connections with numerous local bus services as well as the SacRT light rail system
[ 14 ] HigHway 50 corridor system management plan
c h a p t e r t h r e e c u r r e n t c o r r i d o r s y s t e m m a n a g e m e n t s t r a t e g i e s
Try Transit Changeable Message Sign in Sacramento County
Sacramento County installed pre-emptive traffic signals to give preferential signal timing to transit buses at selected locations that serve high priority transit corridors
SACOG manages the 511 and rideshare programs that cost approximately $1 million per year region-wide to foster carpooling transit ridership vanpooling and bicycling in all areas and corridors The Regional Rideshare Program covers Placer El Dorado Sacramento yolo yuba and Sut-ter counties it is part of a statewide network of rideshare agencies which encourage alternative transportation modes for traveling
Park and Ride lots are located adjacent to or nearby the US 50 corridor utilized by commuters to connect with transit vanpool or carpool Of the sixteen lots many are adjacent to the SacRT Light Rail gold Line providing access for commuters to park their vehicles and commute the re-mainder of their trip via Light Rail El Dorado County Transit authority also uses the park and ride lots as transit stops for their Commuter Buses The locations capacity and occupancy rates of the Park and Ride lots are displayed in Table 3
Bicycle Facilities Bicycle facilities in the corridor are not actively managed in the same manner as motor vehicle facilities
However there are traffic operation systems that serve bicyclists such as dedicated bicycle lanes bicycle detec-tion loops at signalized intersections video detection other non-loop type detection and bicyclist activated signal change buttons The City of Sacramento is installing video detection at some locations
SacRT buses and the new light rail trains are equipped with bicycle racks There are over 170 weatherproof bicycle lock-ers at 23 light rail stations yCTD has the Bikes on Buses Program that allows bicycles to travel on any yOLOBUS
The Sacramento area Bicycle advocates maintain an on-line hazard reporting system to allow users to report hazardous locations for bicyclist such as potholes inad-equate signal timing hazardous railroad crossings insuf-ficient shoulder and inadequate bikeway markings The reports are then sent to the applicable jurisdiction SaCOg is creating an on-line route planning system for bicyclists in addition SaCOg maintains bicycle maps on their website which are currently being updated
The bicycle routes included in the CSMP network are shown on Figures 6 and 7
Pedestrian Facilities Pedestrian facilities are not included as part of the man-aged network because they do not directly provide corridor mobility However complete and safe pedestrian access to appropriate corridor modes such as bike routes and transit services is an important component of corridor system management Therefore subsequent updates of the CSMP will seek to identify key pedestrian facilities and barriers to pedestrian mobility with regard to access and modal con-nectivity
HigHway 50 corridor system management plan [ 15 ]
c h a p t e r t h r e e c u r r e n t c o r r i d o r s y s t e m m a n a g e m e n t s t r a t e g i e s
[ 16 ] HigHway 50 corridor system management plan
Page Inte
ntionally
Left
Blank
MAIN ST
MA
RB
LE V
ALL
EY
RD
65TH ST EXPY
FLYING
C R
D
STATE
HW
Y 16
MA
RB
LE VA
LLEY R
D
CAM
BRID
GE R
D
GREEN VALLEY RD
RIV
ERSI
DE
BLVD
11T
H S
T
RIV
ERSI
DE
BLVD
HO
WE
AV
E
EL DORADO
HILLS BLVD
EL DORADO H
ILLS BLV
D
HORNET DR
JEFF
ERSO
N BL
VD
CAM
ERO
N PAR
K DR
PO
WE
R IN
N R
D
CO
UN
TY HW
Y E3
BRADSHAW RD
MATHER FIELD RD
ZINFAN
DEL D
R
11TH
ST
VD
FOLSOM BLFOLSOM BLVD
FOLSOM BLVD
FOLSO
M BLVD
WHITE ROCK RD
FOLSOM BLVD
FOLS
OM
BLV
D
LATRO
BE RD
CANAL ST
16TH
ST
JACQ
UIER
RD
15TH
ST
HARBOR BLV
D
STOCKTON BLVD
FORNI RD BIDW
ELL DR
WATT AVE
PLACERVILLE DR
TOW
ER G
ATEW
AY
SHIN
GLE SPR
ING
S DR G
REEN
STON
E RD
59TH
ST
SUN
RISE BLVD
EL D
OR
AD
O R
D
HAZEL AVE
SOUT
H RI
VER
RD
PON
DER
OSA R
D
SHIN
GLE SPR
ING
S RD
SHIN
GLE
SPR
ING
S R
D
CARSON RD
MISSO
URI FLAT RD
BASS LAKE RD
N SH
ING
LE RD
PRAIR
IE CITY R
D
S SHIN
GLE R
D
SHIN
GLE
RD
SCOTT RD
W S
T AT
5TH
ST
65TH
ST
5TH
ST
X
ST A
T 27
TH
80
CEDAR GROVE EXIT
MO
SQU
ITO R
D
PLACERVILLE DRMISSOURI
FLAT RD
FORNIRD
EL D
OR
AD
OR
D
POIN
T VIEW D
RSM
ITH FLAT R
D
SCH
NELL SC
HO
OL R
D
MO
NTER
EY RD
c h a p t e r t h r e e c u r r e n t c o r r i d o r s y s t e m m a n a g e m e n t s t r a t e g i e s
Figure 4 Existing Traffic Operations Systems Elements
Highway 50 Corridor Systems Management Plan Existing Traffic Operations Systems Excluding Ramp Meters
TOS ndash Traffic Operations Systems
Stations Continuous Coverage
EMS ndash Extinguishable Message Sign WIM ndash Weigh-in-Motion Location (EMS Usually Refers Motorist to HAR)
Television System
19365TMS ndash Traffic Monitoring99 US Highway 50VS ndash Fog (Visibility) Sensor
CCTV ndash Closed Circuit
I-80 to Cedar Grove Exit HAR ndash Highway Advisory Radio Local Road Interchange Access
White Rock RdRWIS ndash Roadside WeatherCMS ndash Changeable Sunrise Blvd to Latrobe Rd
Message Sign Information System
50
80
51
49 160
50
Placerville to Cedar Grove Exit
50
1935
16 49
99
84 160
49 MilesMiles 0 1 2 3 4 50 1 2 3 4 5 10
HigHway 50 corridor system management plans [ 17 ]
124 49
MOTHER LODE DR
MATHER FIELD RD
West Terminus
RAMP
RAMP
RAMPRAMP
RAM
P
RAMP
RAM
P RAMP
RAMPRAMP
RA
MP
RAM
P RAM
P
RAMP
RAM
P
RAM
P
RA
MP
RAM
P
RAM
P
YoloBus Express Routes Plus Routes 42A and 42B
RAMPBROADWAY
65TH
ST
PCE
65
SCRY42A
Y44Y4343
242 IPC
5
W STX ST
WATT AVE
MAROCKINGHAM
DR
OLD PLACER
BRADSHAW RD
VILLE RDTHER FIELD RD
INTERNATIONAL DR
ZINFANDEL DR
WHITE ROCK RD FOLSOM BLVD FOLSOM BLVD
SUNRISE BLVD
BLUE R
AVIN
E RD
WHITE ROCK RD
SC
OTT R
D
PR
AIR
IEC
ITY R
D
LATROBE RD
GREEN V ALLEY RD
PLACERVILLE DR
FORNI RDM
AIN ST
BROADWAY
CEDAR GROVE EXIT
WEST
CAPTOL AVE
(WESTMOST
STOP)
(WESTMOST STOP)
SCR
SCR
IPC
IPC
c h a p t e r t h r e e c u r r e n t c o r r i d o r s y s t e m m a n a g e m e n t s t r a t e g i e s
Figure 5 US 50 CSMP Network Transit Routes
Highway 50 Corridor System Management Plan 80
CSMP Commuter Transit Network
El Dorado County Transit Authority 65
IPC Iron Point Connector
SCR Sacramento Commuter Route 193
Sacramento Regional Transit District 109ndashHazel Express
Yolo Bus (Express) Y43 Y44 Y230 Y231 and Y232
Yolo Bus (All-Day Intercity amp Airport Service) Y42A (Clockwise) Y42B (Counter-clockwise)
LATROBE RD
Park-and-Ride Lots
193 65
49 US Highway 50 (I-80 to Cedar Grove Exit)
Parallel Roads
Light Rail STation
Light Rail
Class I Bikeways Other State Highways
County Lines
80
49
50
80160
50
5 84 16
4999
Miles 0 5 10160
HigHway 50 corridor system management plans [ 18 ]
K
5
FOLSOM BIKE TRAIL
SEE CENTRAL CITY BICYCLENETWORK MAP FOR BICYCLE
F ACILITY NAMES
AMERICAN RIVER PARKWAY TRAIL SYSTEM
(INCLUDING JE
DEDIAH SMITH MEMORIAL T
RAIL)
FOLSOM BLVD
WHITE ROCK RDSIL V A V ALLEY PKWY
EL D
OR
AD
O H
ILLS B
L VD
GREEN VALLEY RD
AMERICAN R
IVER PARKWAY
TRAIL
SYSTEM
(INCLU
DING JE
DEDIAH SMITH
MEMORIA
L TRAIL)
NATOMA ST
FOLSOM BLVD
EL DORADO TRAIL
CARSON RD
PLACER VILLE RD
RAY
LAW
YER
DR
c h a p t e r t h r e e c u r r e n t c o r r i d o r s y s t e m m a n a g e m e n t s t r a t e g i e s
Figure 6 US 50 CSMP Network Bicycle Routes
Highway 50 Corridor System Management Plan
Bicycle Route Network
Class I Bicycle Facilities
Class II Bicycle Facilities
193
Lincoln
65
Rocklin
Auburn
Folsom 49
193
Light Rail Stations
Light Rail Loomis50
RosevilleUS Highway 50 CSMP Corridor
Other State Highways Miles
County Lines 0 1 2 3
99
49 80
50
160 80 193
Placerville 50
West Rancho 50 Sacramento Cordova
5 0 49
8 4
9 9 Sacramento
1 6 4 9
0 1 2 Miles
3
1 6 0 Elk Grove 210 210 44 66 88
Miles 10 Miles
10 1 2 4
4 9
HigHway 50 corridor system management plans [ 19 ]
13TH
ST
H ST E ST BELVEDERE AVE
51ST
ST
BROADWAY H ST
48TH
ST
11TH
ST
PO
WE
R IN
N R
D
28TH
ST
STOC
KTON
BLVD3R
D ST
ALH
AMBR
AFR
ON
T BLV
D S
T
W CAPITOL A VE
DISCOVER Y
P ARK BRIDGE
JEDED
IAH
N ST
T ST
K ST
11TH
ST
RIV
ERSI
DE
BLV
D
18TH
ST
R S
T17
TH S
TO
ST
18TH
ST
20TH ST
CAPITOL AVE
T ST
28TH
ST
34TH
ST
39TH
ST
M ST
BROADWAY
T ST
FOLSOM BLVD
58TH
ST
J ST
65TH
ST
CSU
S
CO
NN
ECTIO
NS
SR 16JACKSON HWY
FOLSOM BLVD
LA RIVIERA DR
W ATT AV
E
HO
WE A
VE
GUY W
EST B
RIDE
COLLEGE TOWN DR
c h a p t e r t h r e e c u r r e n t c o r r i d o r s y s t e m m a n a g e m e n t s t r a t e g i e s
Figure 7 US 50 CSMP Network Bicycle Routes (Sacramento Insert)
5 Sacramento
8 0
8 0
160
West Sacramento
80
SMITH MEMORIAL TRAIL
50
US Highway 50 Corridor System Management Plan 50
Central City Bicycle Route Network 50
Bikeway and Multi-Use Network
US Highway 50 (I-80 to Cedar Grove Exit)
Class I Bicycle Facilities
Class II Bicycle Facilities
Connecting Routesndashno Bicycle Designation
80 16 5
BROADWAY
FLOR
IN-P
ER
KIN
S R
D
Light Rail STation 99
Light Rail
Other State Highways
County Lines
HigHway 50 corridor system management plans [ 20 ]
major corridor mobility challenges
chapter four
High demand for mobility services especially during peak commute periods is creating significant traffic congestion
and impairing mobility in the corridor Heavy congestion and stop-and-go traffic contributes to increased vehicle
emissions and added travel costs Many transit services are operating at maximum passenger carrying capacity and buses often must contend with the same congestion as autos in many locations bicyclists have to compete for space on these same facilities
Much of the congestion can be attributed to population growth residential and commercial development job housing imbalances work schedules that require commute trips during peak travel times recreational trip generators and truck traffic
The overall amount of travel in the corridor has increased dramatically over the past ten years and is expected to
continue to increase as the region adds approximately
one million new residents over the next 25 years per the current SACOG MTP 2035 Traffic congestion per houseshyhold is expected to increase 18 percent over 2005 levels
by the year 2035
in the general area of eastern Sacramento County and western El Dorado County the Highway 50 Partnership
has projected growth of 78000 more dwelling units and 53000 new jobs over the next 25 years Current and foreshycasted data is depicted in Table 4
The sections of US 50 with particularly severe traffic
congestion are depicted in Figures 8 and 9 These are
also summarized in greater detail in Tables 14 and 15 in Chapter 7 Table 14 shows a summary of the US 50 eastbound bottlenecks while the tables that follow discuss each bottleneck including location and possible causality Table 15 shows a summary of the US 50 westbound bottleshynecks while the tables that follow discuss each bottleneck including location and possible causality Minor or hidden bottlenecks are those that are not as defined (or severe) as the major bottlenecks Please note that the graphics acshycompanying the bottlenecks are not to scale
a critical component of identifying and resolving Traffic congestion per corridor mobility challenges household is expected is the need for detailed to increase 18 percent data analysis and comshy over 2005 levels by the munication regarding
year 2035system performance Data collection is insufficient to
fully meet these needs but still provides useful information as detailed in the following pages improving data gathershying analysis and dissemination of information is a major challenge for this corridor and is a component of intelligent Transportation Systems planning
HigHway 50 corridor system management plan [ 21 ]
c h a p t e r f o u r m a j o r c o r r i d o r m o b i l i t y c h a l l e n g e s
[ 22 ] HigHway 50 corridor system management plan
Figure 8 US 50 AM Peak Period Bottleneck Locations
Figure 9 US 50 PM Peak Period Bottleneck Locations
Challenges along the corridor include
bull severe recurrent highway and roadway traffic congestion
bull an incomplete buscarpool lane system
bull an incomplete set of freeway auxiliary lanes
bull loss or dropping of freeway lanes at specific locations
bull incomplete ramp metering
bull limited parallel roadway capacity
bull lack of signal coordination on key arterials and freeway ramp intersections
bull transit facilities approaching capacity
bull inadequate transit capital and operations funding needed to grow transit ridership
bull light rail at-grade crossings
bull lack of adequate access to transit across US 50
bull lack of double tracking of the light rail Gold Line to Folsom
bull poor pavement and road and bicycle route maintenancesweeping
bull lack of sufficient bicycle activated signal change devices
bull motorist driving behavior
bull inadequate bicycle storage
bull inadequate bicycle and pedestrian access to transit and
bull gaps and barriers within the bicycle route network
Additionally the EDCTC has identified safety and operashytional issues between the Smith Flat interchange and east of the Upper Carson RoadCamino intersection in the
Camino Area Parallel CapacitySafety Study Transporshytation issues include at-grade access to US 50 left turn conflicts across US 50 increasing average daily local and
interregional traffic growth in the area lack of alternate
routes seasonal traffic to and from Apple Hill and other local events and seasonal access to recreation in the Lake
Tahoe Region
c h a p t e r f o u r m a j o r c o r r i d o r m o b i l i t y c h a l l e n g e s
Table 4 CUrrenT and ForeCaSTed TraFFiC daTa
location Current Traffic data ndash 2007 Future Traffic data ndash 2027 (no build) Future Traffic data ndash 2027 (build)
County description amp location of Trucks
Peak directional
Split
Peak Hour Traffic
average annual daily
Traffic2
Volume over Capacity3
Peak Hour Traffic
average annual daily Traffic2
Volume over Capacity3
(no-build)
Peak Hour Traffic
average annual daily
Traffic2
Volume over Capacity3
(build)
yOL interstate 80 to yoloSacramento County Line
6 60 15500 180000 109 23911 277032 169 24070 278880 136
SaC yoloSacramento County Line to State Routes 99 and 51
4 59 21000 253000 135 28080 312480 186 29153 324415 193
SaC State Routes 99 and 51 to watt avenue 4 59 20600 225000 145 27942 286230 189 30648 313950 166
SaC watt avenue to Zinfandel Drive 4 59 16700 187000 115 24783 274540 163 25885 286750 136
SaC Zinfandel Drive to Sunrise Boulevard 4 60 13500 149000 093 20331 224394 133 20925 230950 110
SaC Sunrise Boulevard to Folsom Boulevard 4 66 11900 125000 089 18888 198247 131 20086 210820 140
SaC Folsom Boulevard to SacramentoEl Dorado County Line
3 66 8800 95000 087 13341 151311 133 13612 154380 136
ED SacramentoEl Dorado County Line to Cameron Park Drive
4 61 6900 70000 095 11454 116200 165 11834 120050 114
ED Cameron Park Drive to Missouri Flat Road
4 62 5700 62000 092 8647 94054 132 9462 102920 096
ED Missouri Flat Road to End of Freeway in Placerville
4 57 4850 59000 069 7101 76245 098 7363 79050 102
ED End of Freeway in Placerville to Bedford avenue
4 55 4800 52000 Na 4 6595 74196 Na4 6648 74790 Na4
ED Bedford avenue to Cedar grove Exit 4 62 3800 38500 077 5474 50782 099 5520 51205 099
1 Peak Directional Split The percentage of total traffic in the heaviest traveled direction during the peak hour2 Average Annual Daily Traffic (AADT) The average number of vehicles per day in both directions 3 Volume over Capacity (VC) The volume of traffic compared to the capacity of the roadway4 Volume over Capacity does not determine LOS for two- or three-lane facilities or segments with intersection delay 5 Reported Collision Rate index ( Compared to State average) The percentage by which each segmentrsquos reported collisions rate (fatal injury and property damage only) is above or below the statewide average reported collisions rate on comparable facilities
Source 3-Year Caltrans Traffic Accident Surveillance and Analysis System data
HigHway 50 corridor system management plans [ 23 ]
c h a p t e r f i v e p e r f o r m a n c e m e a s u r e s
Page Inte
ntionally
Left
Blank
[ 24 ] HigHway 50 corridor system management plan
performance measures
chapter five
Continuing corridor monitoring and performance mea-
sures are an integral part of corridor management and investment decision making and help identify immediate efficient and effective system operational strategies and
capital improvements Performance measures provide the
important dynamic daily information needed to rapidly
address operational problems caused by recurrent and
non-recurrent traffic congestion Measures are also used to identify the best improvement actions to generate the desired results
Table 5 identifies the performance measures to be used as
part of the corridor system management process
Baseline Data For perFormance measures Tables 6 7 and 8 display baseline data for the perforshymance measures for the CSMP transportation network
The performance data was primarily compiled from the SACMET demand based traffic model the year 2007
edition of the Traffic Volumes Manual the year 2000 edition of the Highway Capacity Manual Caltrans Traffic
Accident Surveillance and Analysis System (TASAS) the 2007 Caltrans Division of Maintenance Pavement Summary Report and ridership records provided by the transit providers
additional performance Performance Measures data was derived from the provide the important Performance Measurement dynamic dailySystem (PeMS) tool an
information needed internet based tool used to
to rapidly addresshost process retrieve and operational problemsanalyze road traffic condishy
tions information from caused by recurrent
real-time and historical and non-recurrent data PeMS obtains 30-sec- traffic congestion ond loop detector data in real-time from detectors installed along the highway corridor
It should be noted that Average Daily Traffic (ADT) and LOS
for some ParallelConnecting Roadways segment locations
in Table 7 was not available These are noted ldquoNo Datardquo
Data collection for non-auto modes is not as robust as what is needed for active system management Subsequent updates of this CSMP will seek to expand the
availability of transit and bicycle performance data collection
HigHway 50 corridor system management plan [ 25 ]
mdash
c h a p t e r f i v e p e r f o r m a n c e m e a s u r e s
TABLE 5 PERFORmAnCE mEASURES DEFInITIOnS AnD APPLICABILITY
Performance Measure Definition of Performance measure applicability to Corridor
STATE HIGHWAY SYSTEm
LOS A ldquoreport cardrdquo measurement with ldquoArdquo being the least amount of
congestion and ldquoFrdquo being the most congestion LOS is a relatively simple and widely used measure which
offers comparison opportunities
Total Vehicle Hours of Delay The additional travel time in hours experienced by all vehicles on the highway segment per day or at peak hour due to congestion
This measurement is used to determine the cost in time which congestion can add to the regular travel time that it takes to traverse a segment of road and is useful in
quantifying the performance of a particular roadway in an understandable format
Total Person Minutes of Delay The additional travel time in minutes experienced by all persons in vehicles on the highway segment per day or at peak hour due
to congestion
This measurement is used to determine the cost in time which congestion can add to the regular travel time that it takes to traverse a given segment of road and is useful in quantifying the performance of a particular roadway in an
understandable format and for comparison of improvement options
Minutes of Delay per Vehicle The additional travel time in minutes experienced by each vehicle on the highway segment at peak hour due to congestion
This measurement is used to determine the cost in time which congestion can add to the regular travel time that it
takes to traverse a given segment of road
Minutes of Delay per Person The additional travel time in minutes experienced by each person in vehicles on the highway segment at peak hour due to congesshy
tion
This measurement is used to determine the cost in time which congestion can add to the regular travel time that it
takes to traverse a given segment of road
Vehicle Travel Time (Minutes) The average time spent by vehicles traversing between two points on a road or highway
Travel time is a measure used to quantify travel time deficienshycies and provide a personal indicator of congestion impacts
Distressed Pavement Pavement that rides rougher than established maximums and or exhibits substantial structural problems as determined by the
Pavement Condition Survey
This measurement provides a ride quality indicator and an indicator for structural roadway problems
Reported Collision Rate Comparison of the actual total collision rate () along a highway segment above or below the statewide average for fatal injury
and property damage-only collisions on comparable facilities
Comparing the total collision and rate with statewide average rate provides an opportunity to assess safety conditions
through the corridor
Reliability Identifies day-to-day variation in travel time for the same trip at the same time of day Focuses on the predictability of travel time
particularly for repetitive trips
Estimates reliability by defining the extra time travelers must add to their average travel time when planning trips to ensure on-time arrival (0 percent no day-to-day variations
100 percent double allotted travel time)
Lost Productivity Measures the capacity of the corridor to accommodate vehicle or person throughput and is calculated as actual volume divided by
the capacity of the highway
As traffic volumes increase to roadway capacity speeds decline rapidly and vehicle throughput drops dramatically which increases traffic congestion and delay and results in
lost productivity
[ 26 ] HigHway 50 corridor system management plan
mdash
c h a p t e r f i v e p e r f o r m a n c e m e a s u r e s
HigHway 50 corridor system management plan [ 27 ]
TABLE 5 PERFORmAnCE mEASURES DEFInITIOnS AnD APPLICABILITY (ConTInued)
Performance Measure Definition of Performance measure applicability to Corridor
PARALLEL AnD COnnECTInG ROADWAYS
LOS A ldquoreport cardrdquo measurement with ldquoArdquo being the least amount of
congestion and ldquoFrdquo being the most congestion LOS is a relatively simple and often used measure which
offers comparison opportunities
traNSit
available Capacity Ratio () of available transit capacity alternatives within the corridor
This measure indicates the available capacity to accommoshydate diverted travelers from single occupant vehicles
c h a p t e r f i v e p e r f o r m a n c e m e a s u r e s
[ 28 ] HigHway 50 corridor system management plan
Page Inte
ntionally
Left
Blank
c h a p t e r f i v e p e r f o r m a n c e m e a s u r e s
Table 6 US 50 PerForManCe MeaSUreS
County location Post Miles
distance (Miles)
average annual daily Traffic1
PerForManCe MeaSUreS
loS1
Total Vehicle Hours of delay2
Total Person Minutes of delay2
Minutes of delay per Vehicle2
Minutes of delay per Person2
Vehicle Travel Time (Minutes)2 distressed
Pavement (lane
Miles)4
reported Col-lision rate
Comparison ()5
reliability6 lost Productivity7
daily Peak Hour3 daily Peak
Hour3 Peak Hour3 Peak Hour3 Peak Hour3 eastbound westbound lost lane Miles aM
Peak Period
lost lane Miles PM
Peak Period
STaTe HigHway SySTeM
yOL interstate 80 to yolo Sacramento County Line
000 to 316 316 180000 F 1169 126 95363 8061 049 046 36 9 26 62 22 01 0
SaC
yoloSacramento County Line to State Routes 99
and 51
L000 to L248 R000
248 253000 F 4993 653 407455 41746 186 175 43 7 20 64 60 53 76
State Routes 99 and 51 to watt avenue
R000 to R534 534 225000 F 10097 1362 823883 87105 397 372 93 15 24 60 48 81 68
watt avenue to Zinfandel Drive
R534 to R1092 558 187000 F 8075 977 658886 62506 351 329 91 19 -32 56 42 44 23
Zinfandel Drive to Sunrise Boulevard
R1092 to 1250 158 149000 E 1271 197 103727 12610 088 082 25 9 -33 46 13 0 16
Sunrise Boulevard to Folsom Boulevard
1250 to 1701 451 125000 E 3087 356 251940 25832 180 149 63 5 -14 60 46 1 45
Folsom Boulevard to SacramentoEl Dorado
County Line
1701 to 2314 613 95000 D 583 122 47537 8867 083 069 70 0 -11 19 55 0 08
ED
SacramentoEl Dorado County Line to Cameron
Park Dr
000 to R657 657 70000 E 504 126 41150 9138 110 091 77 1 -35 PeMS Data
Unavailable PeMS Data Unavailable
PeMS Data Unavailable
PeMS Data Unavailable
Cameron Park Drive to Missouri Flat Road
R657 to R1506 849 62000 E 302 75 24633 4827 079 075 93 2 -61 PeMS Data
Unavailable PeMS Data Unavailable
PeMS Data Unavailable
PeMS Data Unavailable
Missouri Flat Road to End of Freeway in Placerville
R1506 to 1725 219 59000 D 66 16 5376 1053 020 019 24 1 20 PeMS Data
Unavailable PeMS Data Unavailable
PeMS Data Unavailable
PeMS Data Unavailable
End of Freeway in Placerville to Bedford avenue
1725 to 1811 086 52000 D 68 17 5585 1094 021 020 15 2 81 PeMS Data
Unavailable PeMS Data Unavailable
PeMS Data Unavailable
PeMS Data Unavailable
Bedford avenue to Cedar grove Road
1811 to R2595 784 38500 D 58 15 4758 932 023 022 85 10 6 PeMS Data
Unavailable PeMS Data Unavailable
PeMS Data Unavailable
PeMS Data Unavailable
TOTaL mdash 5473 mdash mdash 30273 4042 2470293 263771 1587 1449 7150 80 mdash mdash mdash mdash mdash
1 Source Average Annual Daily Traffic and Level of Service (LOS) calculated is based on 2007 Caltrans Traffic Volumes on California State Highways and Highway Capacity Manual and Cambridge Systematics from 2008 Reported LOS is for the typical most congested daily peak travel period 2 Source Delay is the average additional travel time by vehiclespersons traveling under 60 mph Data derived from 2007 HICOMP report SACMET Travel Demand Model PeMSs traffic data and Caltrans District 3 Traffic Operations Probe vehicle Tach runs 3 Peak Hour is during PM 4 Source 2007 Caltrans Division of Maintenance Pavement Summary Report 5 Source 2004 through 2007 Caltrans Traffic Accident Surveillance and Analysis System summary data of the percentage above or below the statewide average for fatal injury and property damage-only collisions on comparable facilities 6 Reliability The Planning Time Index is a measure of the reliability of the travel time on a particular route It is the ratio of the 95th percentile of travel time on a route to the median free-flow travel time This means itrsquos the amount of time a traveler needs to allocate for a route if they want to show up on time 19 out of 20 trips Reliability and Planning Time data was taken from April 2007 The data covered a 24-hour period of time on each Tuesday wednesday and Thursday of that month That data was then aggregated into a single average 24-hour day it was then analyzed to determine the highest average aM and PM travel time That time was then compared to the best possible average travel time to determine the additional time that was spent traveling the same seg-ment 7 Lost Productivity Data taken April 2007 PeMS As traffic increases to the capacity of the highway speeds decline throughput drops dramatically and the efficiency of the highway to provide mobility decreases This decline in the potential carrying-capacity of the freeway is expressed in terms of how many equivalent lane miles of roadway are lost
HigHway 50 corridor system management plans [ 29 ]
c h a p t e r f i v e p e r f o r m a n c e m e a s u r e s
Table 7 Parallel and ConneCTing roadwayS PerForManCe MeaSUreS
County location average
daily Traffic1
PerForManCe MeaSUreS
loS1
Total Vehicle Hours of delay2
Total Person Minutes of delay2
Minutes of delay per Vehicle2
Minutes of delay per Person2
Vehicle Travel Time (Minutes)2
distressed Pavement
(lane Miles)4
daily Peak Hour3 daily Peak
Hour3 Peak Hour3 Peak Hour3 Peak Hour3
Parallel and ConneCTing roadwayS
yOL west Capitol Enterprise Boulevard to Capitol Mall 13737 No Data
Data is unavailable for these performance measures at this time however will be pursued in the next phase of the CSMP
SaC
w 5th Street to 26th Street 9194 a
X 5th Street to 26th Street 9154 a
Folsom Boulevard watt avenue to Bradshaw Road 25600 C
watt avenue Folsom Boulevard to US 50 63900 F
Bradshaw Road Folsom Boulevard to US 50 22400 a
Folsom Boulevard Bradshaw Road to Sunrise Boulevard 20400 a
Bradshaw Road Old Placerville to US 50 54405 F
Old Placerville Road Bradshaw Road to Rockingham Drive 11864ndash18365 a
Rockingham Drive Old Placerville Road to Mather Boulevard 16516 E
Mather Boulevard Rockingham Drive to Folsom Boulevard 21732 C
international Drive Rockingham Drive to Zinfandel Drive 12808 a
Zinfandel Drive international Drive to Folsom Boulevard 22298ndash47032 BE
white Rock Road Zinfandel Drive to Sunrise Boulevard 25459 a
Sunrise Boulevard US 50 to Folsom Boulevard No Data No Data
white Rock Road Sunrise Boulevard to Prairie City Road 3400 B
Folsom Boulevard Sunrise Boulevard to iron Point Road 17200 a
white Rock Road grant Line Road to EDSaC County Line 6700 D
iron Point Road Folsom Boulevard to East BidwellScott Road 13984 No Data
Scott Road iron Point Road to white Rock Road No Data No Data
Folsom Boulevard iron Point Road to Blue Ravine Road No Data No Data
Blue Ravine Road Folsom Boulevard to green Valley Road No Data No Data
Prairie City Road US 50 to white Rock Road 6000 D
HigHway 50 corridor system management plans [ 30 ]
c h a p t e r f i v e p e r f o r m a n c e m e a s u r e s
Table 7 Parallel and ConneCTing roadwayS PerForManCe MeaSUreS (ConTinUed)
County location average
daily Traffic1
PerForManCe MeaSUreS
loS1
Total Vehicle Hours of delay2
Total Person Minutes of delay2
Minutes of delay per Vehicle2
Minutes of delay per Person2
Vehicle Travel Time (Minutes)2
distressed Pavement
(lane Miles)4
daily Peak Hour3 daily Peak
Hour3 Peak Hour3 Peak Hour3 Peak Hour3
Parallel and ConneCTing roadwayS
ED
green Valley Road EDSaC County Line to Francisco Drive 22600 D
Data is unavailable for these performance measures at this time however will be pursued in the next phase of the CSMP
green Valley Road Francisco Drive to Silva Valley Parkway 13077 D
green Valley Road Silva Valley Parkway to Cameron Park 9849 C
green Valley Road Cameron Park Drive to Deer Valley Road 5278 C
green Valley Road Deer Valley Road (East) to Lotus Road 8381 D
green Valley Road Lotus Road to Placerville Drive 4669 C
Latrobe Road white Rock Road to US 50 24742 C
Durock Road Cameron Park Dr to South Shingle Road 7278 C
Cameron Park Drive Durock Road to US 50 (Durock Road to Coach Lane Coach Lane to US 50) 9544 26603 CD
South Shingle Road Durock Road to US 50 11390 D
white Rock Road EDSaC County Line to Latrobe 12808 D
white Rock Road Latrobe Rd to Silva Valley Pkwy (Latrobe to PostPost to Silva Vlly Pkwy) 10124 CD
Silva Valley Parkway white Rock Rd to Serrano Pkwy (white Rock to Entrada Entrada to Serrano Pkwy) 13708 9328 DC
Forni Road Placerville Drive to Main Street 9049 8379 No Data
Placerville Drive Forni Road to US 50 No Data No Data
Main Street Placerville Drive to Bedford avenue No Data No Data
Main Street Bedford avenue to Broadway No Data No Data
Broadway Main Street to Point View Drive No Data No Data
1 Source Average Daily Traffic and Level of Service (LOS) calculated are based on City of Sacramento between 2001 and 2007 Sacramento County from 20072008 City of Rancho Cordova between 2004 and 2007 and El Dorado County from 2007
HigHway 50 corridor system management plans [ 31 ]
c h a p t e r f i v e p e r f o r m a n c e m e a s u r e s
Page Inte
ntionally
Left
Blank
[ 32 ] HigHway 50 corridor system management plan
c h a p t e r f i v e p e r f o r m a n c e m e a s u r e s
tabLe 8 traNSit PerforMaNCe MeaSure
County transit Provider route Performance Measure
available daily Capacity ()1 available Peak Hour Capacity1
traNSit
SaC
SacRT (Bus)
Route 21 70 10
Route 28 76 59
Route 36 83 74
Route 38 66 44
Route 72 56 20
Route 73 79 45
Route 74 82 43
Route 109 47 22
SacRT (Light Rail) Gold Line 31 Exceeds Capacity
EDSAC ED County Transit Authority
Commuter Express Bus Service Not applicablendashOperates Peak Hour
Only 405
iron Point Connector 764 Not available
Reverse Commuter Not applicablendashOperates Peak Hour Only 982
yoloSaC yolo County Transit District Not applicablendashOperates Peak Hour Only 498
biKe3
1 Source average Daily and Peak Hour available Capacity calculated from each transit providerrsquos route ridership data 2 The Reverse Commuter service is offered on vehicles that are returning to El Dorado County (Commuter Express Buses) 3 Bicycle performance measure(s) will be identified applied and included in the subsequent CSMPs
HigHway 50 corridor system management plan [ 33 ]
c h a p t e r f i v e p e r f o r m a n c e m e a s u r e s
[ 34 ] HigHway 50 corridor system management plan
Page Inte
ntionally
Left
Blank
planned corridor system management strategies
chapter six
ConCept LoS and ConCept FaCiLit y ldquoConcept LOSrdquo and ldquoConcept Facilityrdquo have traditionally been used in Caltrans TCCRs to reflect the minimum level or quality of operations acceptable for each route segment within the 20-year planning period and the highway facility needed in the next 20 years to maintain the Concept LOS
Typical Concept LOS standards in Caltrans District 3 are LOS ldquoDrdquo in rural areas and LOS ldquoErdquo in urban areas how-ever some heavily congested route segments now have a Concept LOS ldquoFrdquo because the improvements required to bring the LOS to ldquoErdquo are not feasible due to environmental right of way financial and other constraints The applica-tion of multi-modal corridor management strategies should reduce the severity and duration of congestion and provide viable travel options and information that will enable a traveler to avoid severe freeway congestion
The Concept LOS and Concept Facility for US 50 are shown in Table 9 almost all US 50 segments are forecasted to operate under LOS ldquoFrdquo conditions in 20 years under the No-Build and Build scenarios
Corridor ManageMent StrategieS The US 50 CSMP also proposes specific strategies to enhance corridor mobility (see Table 10) based on the fol-lowing principles
bull Manage all modes and facilities in the corridor as a single system beginning with the transportation net-work defined in this CSMP
bull Implement comprehensive and dynamic multimodal monitoring and reporting for the system and for all modes
bull Develop and use micro-simulation modeling to identify mobility challenges and to evaluate proposed solutions
bull Complete the projects included in the regional trans-portation plans with an emphasis on the completion of the key mobility improvement projects identified in this CSMP (see Tables 11 and 12)
bull Implement the specific strategies outlined in this CSMP
Key CapitaL projeCtS Tables 11 and 12 contain key capital projects that have been identified as the most critical to corridor mobility These are also included in the SaCOg MTP for 2035 and are either planned without any funding yet programmed are partially programmed
The US 50 CSMPor are entirely programmed SACOG conducted significant proposes specific
public attitude research strategies to enhance for the MTP for 2035 to corridor mobility complement comprehensive outreach efforts through community workshops the TALL Order Moving the Region Forward event the televised Town Hall Road Map for the Future and associated public polling The results of the SaCOg analyses and public out-reach for the MTP were
highway 50 corridor system management plan [ 35 ]
c h a p t e r s i x p l a n n e d c o r r i d o r s y s t e m m a n a g e m e n t s t r a t e g i e s
[ 36 ] HigHway 50 corridor system management plan
used when selecting the key projects for identification in
the CSMP and to ensure consistency Not all corridor projshyects in the MTP are included in the CSMP since the CSMP focuses on the managed network and the SaCOg MTP considers all streets and roads bike routes and transit services in the corridor
highway 50 partnership The Highway 50 Partnership is a cooperative public-private effort among the County of Sacramento City of Rancho
Cordova City of Folsom County of El Dorado and several major landowners that recognize the need to consider corrishydor mobility needs holistically
The Partnership has collaborated effectively to develop a Plan to improve mobility in the US 50 Corridor from Rancho
Cordova to El Dorado Hills an area identified as approprishyate for growth in the SACOG Blueprint Recognizing the
need to generate private investment the Partnership is seeking to implement a regional Highway 50 Corridor fee program to fund these projects
in addition to the key projects indicated in Table 11 Table 12 displays the key projects identified by the
Partnership
These projects include (1) Near-Term Priority Improvement Projects and (2) Near-Term Expected Roadway Improveshyments
The Near-term Priority improvement Projects would proshyvide several new roadway connections for people to travel within and through the area to avoid congestion They also include new transit routes and widening existing roadways
viewed by the Partnership as a package that would provide system-wide travel benefits These improvements targeted
for completion through 2012 would reduce vehicle hours of delay during commute hours by 30 percent
The near-Term Expected Roadway Improvements are conshysidered by the Partnership to be readily expected since they are tied to expected development or are part of a near-term
capital improvements program
Visionary projects Visionary projects are not yet included in the SaCOg MTP or EDCTC RTP but appear to offer considerable corridor mobilshyity benefits and merit further analysis and consideration for inclusion in the next MTP and RTP These are displayed in
Table 13
The ldquoPlus 10 Listrdquo in the SACOG MTP identifies projects
that are attractive from a performance standpoint but could not be included in the Final Project Lists because of financial constraint The ldquoPlus 10 Listrdquo element offers the
opportunity to include projects that would not be affordshyable without additional funding Some projects identified in
the Visionary Projects List were analyzed by SACOG during
development of the current MTP Some of these are included in the ldquoPlus 10 Listrdquo
Watt Avenue Light Rail Station Improvement Project
c h a p t e r s i x p l a n n e d c o r r i d o r s y s t e m m a n a g e m e n t s t r a t e g i e s
Table 9 US 50 ConCePT loS and FaCiliTy TyPe
location Forecasted level of Service1 (loS) and Facility Type
County description and location From Post Mile To Post Mile Current
loS1 20-year no build loS12
20-year build loS12
20-year Concept
loS13 existing Facility4 Concept Facility456 Ultimate Facility457
yOL interstate 80 to yoloSacramento County Line
000 316 F F F F 8F (6F between Jefferson Blvd ramps)
8F+2HOV+aux Lanes 8F+2HOV+aux Lanes
SaC yoloSacramento County Line to SR 99 and 51
L000 L248 = R000 F F F F 8F 8F+2HOV+aux Lanes 8F+2HOV+aux Lanes
SaC State Routes 99 and 51 to watt avenue R000 R534 F F F F 8F 8F+2HOV+aux Lanes 8F+2HOV+aux Lanes
SaC watt avenue to Zinfandel Drive R534 R1092 F F F F 8F 8F+2HOV+aux Lanes 8F+2HOV+aux Lanes
SaC Zinfandel Drive to Sunrise Boulevard R1092 1250 E F F F 8F 8F+2HOV+aux Lanes 8F+2HOV+aux Lanes
SaC Sunrise Boulevard to Folsom Boulevard 1250 1701 E F F F 6F+2HOV to Hazel ave 4F+2HOV
to Folsom Blvd
6F+2HOV+aux Lanes to Hazel ave 4F+2HOV+aux
Lanes to Folsom Blvd
8F+2HOV+aux Lanes
SaC Folsom Boulevard to SaCED County Line 1701 2314 D F F F 4F+2HOV 4F+2HOV+aux Lanes 6F+2HOV+aux Lanes
ED SacramentoEl Dorado County Line to Cameron Park Drive
000 R657 E F F F 4F 4F+2HOV+aux Lanes 6F+2HOV+aux Lanes
ED Cameron Park Drive to Missouri Flat Road R657 R1506 E F E E 4F 4F+2HOV+aux Lanes to greenstone 4F+aux Lanes
to Missouri Flat
6F+2HOV+aux Lanes to greenstone 4F+2HOV+aux Lanes
to Missouri Flat
ED Missouri Flat Road to End of Freeway in Placerville
R1506 1725 D F F F 4F 4F+aux Lanes 4F+aux Lanes
ED End of Freeway in Placerville to Bedford avenue
1725 1811 D E E E 4E 4E 4E
ED Bedford avenue to Cedar grove Exit 1811 R2595 D F F F 4F to Smith Flat 4E to Camino 4F+aux Lanes to Smith Flat 4E to Camino
4F+aux Lanes
1 Level of Service (LOS) A ldquoreport cardrdquo for evaluating traffic flow with ldquoArdquo being the best and ldquoFrdquo being the worst 2 20-year LOS (No Build) The LOS that would be expected at 20 years with no improvements 3 20-year Concept LOS The minimum acceptable LOS over the next 20 years 4 Facility Type Codes C=Conventional Highway E=Expressway F=Freeway HOV=High Occupancy Vehicle Lanes aux=auxiliary Lanes 5 Operational improvements are included in future facilities for all segments Examples of operational improvements include TOS improvements and auxiliary lanes 6 Concept Facility the future roadway with improvements needed in the next 20 years if LOS ldquoFrdquo no further degradation of service from existing ldquoFrdquo is acceptable as indicated by delay performance measurement 7 Ultimate Facility The future roadway with improvements needed beyond a 20 year timeframe
HigHway 50 corridor system management plans [ 37 ]
c h a p t e r f i v e p e r f o r m a n c e m e a s u r e s
Table 10 US 50 CSMP STraTegieS
Strategy description implementation Challenges
Maintain and operate the existing corridor multi-modal trans-
portation infrastructure
Maintain the existing investment in all modes of the transportation system and provide adequate resources for daily operations including operating
revenues for transit services
Funding availability funding competition within the region
Fully coordinate the delivery of transportation services and facili-ties in the corridor including daily operations and system planning
for enhancements
Interagency operational coordination to maximize the efficiency and effec-tiveness of all modes operating in the corridor with a focus on the CSMP transportation network defined in this CSMP Use of an existing group or
committee to provide initial oversight for this strategy
Diverse interests and competing priorities and limited resources
Construct planned and pro-grammed corridor capital improve-
ment projects
implementation of the capital improvements in the corridor included within the approved Metropolitan Transportation Plan and Regional Transportation
Plan for all transportation modes within the scope schedule and cost specified
Funding availability funding competition within the region
Comprehensive daily monitoring of the status of all modes providing service on the CSMP transporta-
tion network
Full deployment of multimodal transportation service status detection systems for all CSMP network components
Funding availability funding competition within region
Provide traveler information to the public
Provide the public with real-time easily accessible information regarding the status of all CSMP transportation system components so as to allow travel-
ers to make informed decisions about trip mode time and routing options
Funding availability funding competition within region
Continually monitor and analyze the CSMP transportation network to improve system performance
Monitor transportation performance measures and make system modifica-tions as appropriate on a frequent and timely basis Staff resources and data availability
Decrease the duration of non-recurrent traffic congestion
Expand and enhance the Freeway Service Patrol to respond to automobile accidents and vehicle break-downs
Funding availability funding competition within the region
Timely implementation of STaRNET
Expedite the implementation of the STaRNET operators of transportation facilities and emergency responders in the Sacramento region through real-time sharing of data and live video refinement of joint procedures
pertaining to the operation of roadways and public transit and public safety activities as well as enhance the regionrsquos 511 web site and interactive
telephone service to provide more traveler information
Developmental time acceptance by agencies and integration into daily use and identifica-
tion of maintenance and operations funding
Enhance transit and rail service increase transit service frequency provide express transit services imple-
ment bus rapid transit routes reduce headways for light rail and buses and construct planned light rail line extensions
Funding availability funding competition within the region
Complete Bus Carpool lane network
Complete the regional buscarpool lane network including freeway-to-freeway HOV lane connectors
Funding availability funding competition within the region Public agency and public
acceptance of network
[ 38 ] HigHway 50 corridor system management plan
c h a p t e r s i x p l a n n e d c o r r i d o r s y s t e m m a n a g e m e n t s t r a t e g i e s
tabLe 10 uS 50 CSMP StrategieS (ConTInued)
Strategy Description implementation Challenges
Enhance Transportation Demand Management strategies
Encourage employers to provide telecommuting and flexible working hour options to employees
acceptance by employers and resources to participate
Optimize the timing and synchronishyzation of traffic signals
Coordinate the optimization and timing of traffic signals on freeway ramps and along parallel and connecting roadways within and between jurisdicshytions to improve traffic flow and reduce congestion Provide signal priority
systems for transit vehicles
Funding availability and coordination among cities counties and Caltrans
improve access management of freeways and parallel connecting roadways
Develop and implement access management strategies to maintain the operational efficiency of freeways and parallelconnecting roadways
agreement between responsible jurisdicshytions as to where increased access control is needed increased access control on some parallelconnecting roadways may increase
traffic volumes on non-corridor roads
Develop innovative use of CMSs (eg travel times)
Potential uses of CMSs to improve system efficiency include the use of CMSs along portions of all corridors near transit station to indicate travel
times based on real-time existing traffic conditions on the freeway as well as on parallel roadways and express bus and light rail services CMS can also be used to identify the number of parking spaces that are still available at
the light-rail stations
Funding availability funding competition within the region
Implement amp expand Transit AVLTransit status information
enhancements for system users
Expand the use of AVL systems utilizing GPS technology to track in real-time the location of transit vehicles monitor transit schedules dispatch transit vehicles and provide real-time passenger information such as ldquonext busrdquo or
ldquonext trainrdquo arrival times
Funding availability funding competition within region
Expand Park-and-Ride lots at key locations
Add additional capacity to existing park-and-ride lots near transit stations and other locations that are approaching capacity
Funding availability funding competition within the region and available land
improve bike-pedestrian access in the CSMP
transportation network
Plan and program for construction of additional bicycle paths lanes and related improvements for access and connectivity to transit park and ride
lots and destination points
Funding availability funding competition within the region
Provide ldquoBike-SharingrdquordquoCar-Sharingrdquo tofrom transit (ldquoCarlinkrdquo) and from
neighborhoods
Expand the Regional Rideshare and Spare-the-Air programs to include bicycle and car sharing opportunities
Funding availability and coordination between SaCOg TMa air Districts employers developshyers property managers and local government
officials
Provide parking management stratshyegies in interested jurisdictions where applicable to discourage
use of single-occupant vehicles
in higher-density areas provide preferential parking for carpools and vanshypools require residential parking permits remove on-street parking and or provide graduated parking fees for metered on-street parking based on
vehicle type and time of day for SOV spaces to encourage transit use
Acceptance by businesses local officials and the general public
Expand bicycle commute amp transit fare strategiessubsidies
increase participation by large employers in programs that subsidize transit fares for employees during peak-hour commute times and provide bicycling
to work incentives
Voluntary participation by large employers to pay subsidy to transit providers
HigHway 50 corridor system management plan [ 39 ]
c h a p t e r s i x p l a n n e d c o r r i d o r s y s t e m m a n a g e m e n t s t r a t e g i e s
tabLe 11 KeY CaPitaL ProjeCtS
CountyLead agency
route roadway from to Project
Description Programmed
funds
additional funding Needed
total Cost estimate (x $1000)
Comp Year (FFY)
uS 50
Sacramento Caltrans District 3
US 50 Downtown watt avenue HOV Lanes $0 $75000 $75000 2020
Sacramento Caltrans District 3
US 50 watt avenue Sunrise Blvd HOV Lanes $165000 $0 $165000 2013
Sacramento Caltrans District 3
US 50 Bradshaw Road
Mather Field Road
Eastbound and Westbound Auxiliary Lanes
$0 $3700 $3700 2016
Sacramento Caltrans District 3
US 50 State Route 99
(Oak Park Interchange) interchange improvements including buscarpool lane
connectors $0 $150000 $150000 2014
Sacramento Caltrans District 3
US 50 interstate 5
(Riverfront Interchange) Riverfront Interchange
improvements including bus carpool lane connectors
$30000 $170000 $200000 2016
ED Caltrans District 3 US 50 Camino
Operational Safety improvements Construct an
undercrossing median barrier modify local road connections andor associated operational improvements on and adjacent
to US 50
$15000 $0 $15000 2012
ED ED County DOT US 50
west of Latrobe Road
west of Bass Lake
grade HOV Lanes (Ph1) $47141 $0 $47141 2010
ED Caltrans District 3 US 50
west of Bass Lake Road
Ponderosa Road
HOV Lanes (Ph2) $55000 $0 $55000 2011
ED Caltrans District 3 US 50 Ponderosa
Road greenstone
Road HOV Lanes (Ph3) $22357 $0 $22357 2013
ED ED County DOT US 50 Future Silva
Valley iC
Future Empire Ranch IC
Mainline Widening construct new WB lane within the
median from proposed Silva Valley IC to proposed Empire
Ranch IC
$2950 $0 $2950 2013
[ 40 ] HigHway 50 corridor system management plan
c h a p t e r s i x p l a n n e d c o r r i d o r s y s t e m m a n a g e m e n t s t r a t e g i e s
tabLe 11 KeY CaPitaL ProjeCtS (ConTInued)
CountyLead agency
route roadway from to Project
Description Programmed
funds
additional funding Needed
total Cost estimate (x $1000)
Comp Year (FFY)
PARALLEL AnD COnnECTInG ROADWAYS
ED ED County DOT
Silva Valley Parkway
Entrada Drive
Future US 50
Silva Valley Parkway iC
Widen Silva Valley Road from 2 lanes to 4 lanes includes
Class ii bike lanes and left turn storage pockets
$2921 $0 $2921 2010
ED ED County DOT
Silva Valley Parkway US 50
US50 Silva Valley Parkway (Phase 2) Includes constructshying overcrossing and ramps
signalization at EB and WB on off ramps
$57817 $0 $57817 2016
ED ED County DOT
Headington Road
Missouri Flat Road
El Dorado Road
Extend 2 lanes with median $9878 $0 $9878 2012
ED ED County DOT
Durock Road
Robin Lane South
Shingle Road
Extend 2 lanes with median $1239 $9214 $10453 2015
ED ED County DOT
Durock Road
Business Center Drive intersection signalization
includes adding turn pockets on Durock Road
$4333 $0 $4333 2009
ED City of Placerville
Point View Drive Broadway Smith Flat
Road Extend 2 lanes $1300 $0 $1300 2020
ED City of Placerville
western Placerville
US 50 interchange
Forni Road Ray Lawyer
Drive
Placerville Drive
Interchange Reconstruction convert Ray Lawyer Dr
Overcrossing to full IC Auxiliary Lanes
$5059 $34741 $39800 2020
Sacramento City of Rancho
Cordova
Mather Boulevard
Rockingham Road
Zinfandel Drive widen to 4 lanes $0 $8617 $8617 2020
Sacramento Rancho Cordova
Parkway ii
Grant Line Road
White Rock Road
New 6-lane expressway includshying intersection improvements at Kiefer Blvd amp White Rock
Road
$0 $44518 $44518 2020
Sacramento City of Folsom
Scott Road US 50 White Rock Rd
widen from 2 to 6 lanes $16000 $0 $16000 2020
Sacramento Sacramento County DOT
White Rock Road
Grant Line Rd
Prairie City Rd
Widen from 2 to 4 lanes realign near Nike and Nimbus Roads and connect with existshying alignment west of Prairie City Rd Realign Grant Line Rd to intersect with realigned
White Rock Rd
$26600 $0 $26600 2020
Sacramento Sacramento County DOT
Hazel avenue
US 50 Hazel Madison
Widen American River Bridge and approaches from 4 to 6 lanes Widen Hazel Avenue from AR Bridge to Madison from 4 to 6 lanes with Bike
LanesSignals
$83530 $0 $83530 2020
HigHway 50 corridor system management plan [ 41 ]
c h a p t e r s i x p l a n n e d c o r r i d o r s y s t e m m a n a g e m e n t s t r a t e g i e s
tabLe 11 KeY CaPitaL ProjeCtS (ConTInued)
CountyLead agency
route roadway from to Project
Description Programmed
funds
additional funding Needed
total Cost Estimate (x $1000)
Comp Year (FFY)
PARALLEL AnD COnnECTInG ROADWAYS
ED ED County DOT
green Valley Road
Salmon Falls Road
east
Deer Valley Road
widen from 2 to 4 lanes $0 $14576 $14576 2025
ED ED County DOT
green Valley Road
Deer Valley Road east Lotus Road widen $958 $4513 $5471 2015
ED ED County DOT
green Valley Road
Francisco Drive
Salmon Falls Road
widen from 2 to 4 lanes divided $412 $3491 $3903 2015
ED ED County DOT
Latrobe Road
investment Boulevard
golden Foothill Parkway
widen from 2 lanes undivided to 4 lanes
divided $1076 $8792 $9868 2015
ED ED County DOT
Latrobe Road
Carson Creek
White Rock Road
widen from 4 to 6 lanes $0 $23755 $23755 2025
ED ED County DOT
white Rock Road
EDSac County Line
Manchester Drive
widen 2 to 4 lanes divided includes signal interconnect and coorshy
dination
$0 $23755 $23755 2025
Sacramento City of Rancho
Cordova
Easton Valley
Parkway
Prairie City Road
Empire Ranch Road extenshysion south of
US 50
Construct new 4 lane road $0 $45000 $45000 2020
Sacramento Sacramento County DOT
Hazel avenue
Easton Valley
Parkway
Grant Line RoadWhite Rock Road
New road extension 4 lane limited access
through aerojet property $0 $18000 $18000 2018
Sacramento Sacramento County DOT
white Rock Road
Prairie City Road
ED County Line
widen to 4 lanes $8330 $64773 $73103 2018
Sacramento Sacramento County DOT
green Valley Road
East Natoma Sacramento ED County
line widen to 4 lanes $0 $3000 $3000 2018
Sacramento City of Rancho
Cordova
Zinfandel Drive
international Drive
Folsom Boulevard
widen to 4 lanes $0 $12000 $12000 2020
[ 42 ] HigHway 50 corridor system management plan
c h a p t e r s i x p l a n n e d c o r r i d o r s y s t e m m a n a g e m e n t s t r a t e g i e s
tabLe 11 KeY CaPitaL ProjeCtS (ConTInued)
CountyLead agency
route roadway from to Project
Description
Pro-grammed
funds
addi-tional
funding Needed
total Cost estimate (x $1000)
Comp Year (FFY)
traNSit
yolo amp Sacramento City of west Sacramento
amp City of Sacramento
Sacramento River
Crossing
15th Street in the City
of west Sacramento
Broadway in the City of
Sacramento
New all-modal river crossing (Auto Transit Bike amp Pedestrian)
from Sacramento across the Sacramento River to West
Sacramento The crossing was modeled between Broadway in Sacramento amp 15th Street in
West Sacramento but final alignshyment options will be studied in subsequent planning efforts
$800 $99200 $100000 2019
Sacramento Cal State University
Sacramento
CSUS Campus mdash mdash
Sac State Tram adjoining City streets and SRTD 65th Street light railbus transfer station Bus Rapid Transit System
$23574 $0 $23574 2013
Sacramento City of Rancho
Cordova
Rancho Cordova Various Various
New Service Rancho Cordova Pilot Transit Shuttle System new transit service for connection to
RTs Gold Line
$2380 $1500 $38880 2014
yolo amp Sacramento City of west Sacramento
TBD west
Sacramento Sacramento Streetcar Service between west
Sacramento and Downtown Sacramento
$17400 $54700 $72100 2014
Sacramento City of Rancho
Cordova RT Gold Line
RT Gold Line Tracks
Mather Field Road
Light Rail Grade Separations $0 $52888 $52888 2025
Sacramento City of Rancho
Cordova RT Gold Line
RT Gold Line Tracks Zinfandel Drive Light Rail Grade Separations $0 $52888 $52888 2025
Sacramento City of Rancho
Cordova RT Gold Line
RT Gold Line Tracks
Bradshaw Road
Light Rail Grade Separations $0 $35260 $35260 2025
Sacramento City of Rancho
Cordova RT Gold Line
RT Gold Line Tracks Routier Road Light Rail Grade Separations $0 $35260 $35260 2025
Sacramento City of
Sacramento Sacramento Valley Station
Sacramento intermodal Transportation Facility (Phase 1) - Develop intermodal transportashytion terminal for heavy rail light
rail and bus service
$77799 $0 $77799 2010
Sacramento City of
Sacramento Sacramento Valley Station
Sacramento intermodal Transportation Facility (Phase 2) - Develop intermodal transportashytion terminal for heavy rail light
rail and bus service
$24101 $1000 $25101 2014
HigHway 50 corridor system management plan [ 43 ]
c h a p t e r s i x p l a n n e d c o r r i d o r s y s t e m m a n a g e m e n t s t r a t e g i e s
TABLE 11 KEY CAPITAL PROJECTS (CONTINUED)
CountyLead Agency
Route Roadway From To Project
Description Programmed
Funds
Additional Funding Needed
Total Cost Es-timate (x $1000)
Comp Year (FFY)
BICYCLE ROUTES
Sacramento City of Rancho
Cordova
US 50Mather Field Road IC US 50 Mather
Field Road
US 50Mather Field Road PedestrianBike Crossing along
the Mather Airport RR Spur alignment
$0 $820 $1055 2015
ED ED County DOT
Sacramento Placerville
Transportation Corridor
Forni Rd
Missouri Flat Rd Class I Bike Trail $1423 $111 $1534 2009
ED City of Placerville
El Dorado Trail Western
Extension
Canal Street Main Street
Ray Lawyer DriveForni
Road Class 1 Bike Trail $1850 $0 $1850 2010
ED ED County DOT
US 50ED Hills Blvd IC US 50
El Dorado Hills Blvd
Latrobe Road
US 50El Dorado Hills Blvd Pedestrian Overcrossing $5508 $66 $5574 2014
TABLE 12 50 MOBILITY PARTNERSHIP KEY CAPITAL PROJECTS
RouteRoadway From To Project Description
NEAR TERM PRIORITY IMPROVEMENT PROJECTS
US 50 Sunrise Scott Road Auxiliary Lane
US 50 Hazel Avenue Interchange Improvements
Hazel Avenue Folsom Boulevard Easton Valley Parkway New 4 Lane Road
Easton Valley Parkway Hazel Avenue Rancho Cordova Parkway New 6 Lane Road
Rancho Cordova Parkway Easton Valley Parkway White Rock Road New 4 Lane Road
White Rock Road Sunrise Boulevard Silva Valley Parkway Widen to 4 Lanes
RT Gold Line Hazel Iron Point Station Passing Tracks
US 50 Rancho Cordova Parkway New Interchange
Zinfandel Drive South of International Douglas Road New 4 Lane Road
International Drive Kilgore Road Rancho Cordova Parkway New 6 Lane Road
Douglas Road Zinfandel Extension Sunrise Boulevard Widen to 4 Lanes
Sunrise LRT Citrus Road Sunrise Mall Bus Rapid TransitExpress Bus
[ 44 ] HIGHWAY 50 corridor system management plan
c h a p t e r s i x p l a n n e d c o r r i d o r s y s t e m m a n a g e m e n t s t r a t e g i e s
TABLE 12 50 mOBILITY PARTnERSHIP kEY CAPITAL PROjECTS (COnTInUED)
routeroadway from to Project Description
US 50 nEAR TERm PRIORITY ImPROVEmEnT PROjECTS
US 50 Empire Ranch Road New interchange
US 50 Silva Valley New interchange
US 50 Scott Road Empire Ranch Road Aux Lanes
US 50 Empire Ranch Road El Dorado Hills Boulevard Aux lanes and climbing lanes
US 50 El Dorado Hills Boulevard Silva Valley Parkway Aux lanes and climbing lanes
US 50 Silva Valley Parkway Bass Lake Road Aux lanes
Sunrise Boulevard White Rock Road Douglas Boulevard widen to 6 lanes
Sunrise Boulevard Douglas Boulevard Jackson Road widen to 4 lanes
White Rock Road Sunrise Boulevard Future Rancho Cordova Parkway and El Dorado County Line to Latrobe Road
widen to 4 lanes
Douglas Boulevard Sunrise Boulevard Grant Line Road widen to 4 lanes
Rancho Cordova Parkway Douglas Boulevard Rio del Oro Parkway New 2 lane road
Rancho Cordova Parkway Rio del Oro Parkway White Rock Road New 6 lane road
Jaeger Road Douglas Road Kiefer Boulevard New 4 lane road
Chrysanthy Sunrise Boulevard Americanos Boulevard New 4 lane road
Kiefer Boulevard Sunrise Boulevard Jaeger Road New 4 lane road
Grant Line Road Douglas Road Chrysanthy Road widen to 4 lanes
Hazel avenue Gold Country Boulevard Madison avenue widen to 6 lanes
Latrobe Road South of White Rock Road widen to 4 lanes
TABLE 13 VISIOnARY PROjECTS
County routeroadway from to Project Description
Sac yolo US 50 Enterprise Downtown Sacramento HOV Lanes
ED TBD Folsom Placerville Transit ndash Type TBD
ED New Road Latrobe Road White Rock Road (poten shy
tially US 50) New 2-lane road
HigHway 50 corridor system management plan [ 45 ]
c h a p t e r s i x p l a n n e d c o r r i d o r s y s t e m m a n a g e m e n t s t r a t e g i e s
[ 46 ] HigHway 50 corridor system management plan
Page Inte
ntionally
Left
Blank
congestion and bottleneck analysis
chapter seven
The 2000 Highway Capacity Manual defines a bottleneck
as ldquoa road element on which demand exceeds capacityrdquo
The bottleneck analysis evaluates specific causes of existshying recurrent traffic congestion in the corridor Freeway bottleneck locations that create mobility constraints are identified and documented and their relative contribution
to corridor-wide congestion is reported The bottleneck locations were determined based on a combination of the use of 2006 PeMS data HiCOMP report probe vehicle tach runs and field observations
Traffic congestion can be categorized as either recurrent
or non-recurrent
recurrent congestion occurs repeatedly at the same place and time of day in a predictable pattern Recurrent congesshytion is often associated with facility capacity limitations changes in capacity conflicting vehicle movements such
as lane merges inadequate number of transit vehicles to handle passenger loads or other persistent physical condishytions of the transportation facility
Non-recurrent congestion is usually attributed to collishysions equipment malfunction community events weather construction projects and other occasional occurrences When transportation systems are close to their maximum
carrying capacity non-recurrent congestion is more likely to occur as there is little excess capacity in the system
The location and extent of the bottlenecks on US 50 found
in the aM and PM peak periods are summarized in Tables 14 and 15 These depictions should be considered a snapshyshot view and not a comprehensive analysis of all bottleshynecks in the corridor Further work is being conducted to
refine the identification and causality of bottlenecks within
the corridor Table 14 shows a summary of the US 50 eastbound bottlenecks while the tables that follow discuss each bottleneck including location and possible causality Table 15 shows a summary of the US 50 westbound bottleshynecks while the tables that follow discuss each bottleneck including location and possible causality Minor or hidden bottlenecks are those Freeway bottleneck
that are not as defined locations that create (or severe) as the major mobility constraints bottlenecks Please note are identified and that the graphics accomshy documented and their panying the bottlenecks
relative contribution to are not to scale
corridor-wide congestion Major bottlenecks in the is reported eastbound direction during the aM peak period are at Howe avenue and during the PM peak period are at 48th Street Howe Avenue Mayhew Road Routier Road Sunrise Boulevard and El Dorado Hills Boulevard Major bottlenecks in the westbound direction during the aM peak period are at El Dorado Hills Boulevard Hazel Avenue Zinfandel Drive
HigHway 50 corridor system management plan [ 47 ]
c h a p t e r s e v e n c o n g e s t i o n a n d b o t t l e n e c k a n a l y s i s
Bradshaw Road and Howe Avenue and major bottleneck
locations during the PM peak period are at Zinfandel Drive Routier Road Bradshaw Road Howe Avenue and Intershystate 5
Causalities for these bottlenecks range from high-traffic
demand (congestion) heavy weavingmerging areas or physical constraints such as lane drops lack of ramp meters incomplete HOV network incomplete Auxiliary Lane
network poorly coordinated traffic signals and an off-ramp
queue (Sunrise Boulevard) US 50 Westbound Onramp
TABLE 14 US 50 EASTBOUnD BOTTLEnECk SUmmARY Source PeMS Caltrans tach runs and
Cambridge Systematics field observations
bottleneck Location PeMS Speed Contours Caltrans Probe Vehicle Runs
Cause aM PM aM PM
A Jefferson Blvd PM 25 Minor Minor Traffic weaving truck volumes and grade
B 48th St PM 7 Minor Major Minor Minor Merge from SR 51 and SR 99
C Howe ave PM 9 Major Major Major weave between Howe and watt
D Mayhew Rd PM 12 Major Minor Major Weaving before Bradshaw Exit
E Routier Rd PM 14 Minor Major Weaving before Mather Field Rd Exit
F Sunrise Blvd PM 185 Minor Major Lane drop HOV add off-ramp queue
G Folsom Blvd PM 22 Minor Minor Lane drop 4 to 3
H El Dorado Hills Blvd PM 275 Major
Poorly coordinated traffic signal on arterial causes spillback onto freeway
a jefferson blvd bottleneck The bottleneck approximately located at Jefferson Blvd is due to weaving traffic as those entershying the freeway from Jefferson Blvd must cross those attempting to exit the freeway to I 5 There is a large number of trucks in the stream which struggle with the grade at this location exacerbatshying the bottleneck
[ 48 ] HigHway 50 corridor system management plan
c h a p t e r s e v e n c o n g e s t i o n a n d b o t t l e n e c k a n a l y s i s
b 48th St bottleneck The bottleneck approximately located at 48th St is due to the additional traffic merging from SR 51 and SR 99 combined with the eventual lane drop at 59th St This queue extends upstream past the off-ramp to SR 5199 These off-ramps are bottlenecks in themselves which spill back and choke the US 50 mainline
C Howe Ave Bottleneck The bottleneck at Howe ave is due to the entering traffic from Howe Ave Two Howe Ave on-ramps feed into US 50 eastbound southbound Howe ave loop on-ramp and northbound Howe ave direct ramp approximately 300 feet apart The watt avenue off-ramp is just down stream with heavy exiting volumes therefore the segment between Howe and watt is characterized by heavy weaving
D mayhew Rd Bottleneck The bottleneck approximately located at Mayhew Rd most likely begins with the additional traffic entering from Watt Ave and ends with the exiting traffic at Bradshaw Rd It is possible that there is a high proportion of weaving traffic with in this section (Watt Ave traffic moving to the left lane and those exiting at Bradshaw Rd moving to the right lane)
HigHway 50 corridor system management plan [ 49 ]
c h a p t e r s e v e n c o n g e s t i o n a n d b o t t l e n e c k a n a l y s i s
[ 50 ] HigHway 50 corridor system management plan
e routier rd bottleneck It is likely that the bottleneck at Routier Rd is due to the same merging conditions associated with Mayhew Rd The area is comprised of both residential and light industrialoffice land uses therefore during the PM peak period there are large volumes of vehicles entering at Bradshaw Rd moving to the left lanes and large volumes of vehicles moving to the right lane to exit at Mather Field Rd
f Sunrise blvd bottleneck At Sunrise Blvd the right-most lane exits while an HOV lane is added as the median lane The bottleneck is formed from vehicles shifting left to avoid exiting at Sunrise Blvd and to enter the HOV lane There is a large volume of vehicles queued at the Sunrise off-ramp which spills back and negatively affects the US 50 mainline
g folsom blvd bottleneck The right-most lane exits to Folsom Blvd leaving one HOV lane and two regular lanes along the US 50 The bottleneck is caused by this lane drop as well as the quick merge at the Folsom on-ramp
c h a p t e r s e v e n c o n g e s t i o n a n d b o t t l e n e c k a n a l y s i s
H The eastbound US 50 at El Dorado Hills Blvd Bottleneck The eastbound El Dorado Hills Blvd bottleneck is caused by a traffic signal on the arterial that often causes spillbacks on the EB loop offramp onto the freeway mainlines
TABLE 15 US 50 WESTBOUnD BOTTLEnECk SUmmARY Source PeMS Caltrans tach runs and Cambridge Systematics field observations
bottleneck Location PeMS Speed Contours Caltrans Probe Vehicle Runs
Cause aM PM aM PM
A El Dorado Hills Blvd PM 275 Major Poorly coordinated traffic
signal on El Dorado Hills Blvd
B Hazel Ave PM 21 Major Entering traffic
C Zinfandel Dr PM 16 Minor Major Major Major Entering traffic
D Routier Rd PM 14 Minor Major Minor Weaving traffic
E Bradshaw PM 13 Major Major Major Merging traffic and curve
F Howe Ave PM 9 Minor Major Major Major Weaving traffic and grade
G SR 51SR 99 PM 6 Minor Lane drop weaving traffic
H i-5 PM 3 Major Weaving traffic
HigHway 50 corridor system management plan [ 51 ]
c h a p t e r s e v e n c o n g e s t i o n a n d b o t t l e n e c k a n a l y s i s
[ 52 ] HigHway 50 corridor system management plan
A El Dorado Hills Blvd Bottleneck The minor bottleneck at El Dorado Hills Boulevard is caused by the traffic signal on El Dorado Hills Blvd that causes spillback on the westbound offramp onto the freeway mainlines
B Hazel Avenue Bottleneck In 2006 the Hazel Ave Bottleneck is caused by the traffic entering at both Hazel Ave and Folsom Blvd (the two on-ramps are separated by about one mile) The bottleneck that would appear at Folsom Blvd combines with the bottleneck at Hazel ave to form a large bottleneck that does not clear until after Hazel ave Sometimes causshying spillbacks as far as Prairies City Road this bottleneck was mitigated in 2007 as part of the GO CALIFORNIA program
C Zinfandel Dr Bottleneck There is heavy traffic coming from Sunrise Blvd but the lane addition immediately after the westbound on-ramp prevents a bottleneck from forming but as traffic flows westward the heavy traffic entering from Zinfandel Dr causes a bottleshyneck here
D Routier Rd Bottleneck The bottleneck at Routier Rd is caused by weaving traffic between Mather Field Rd and Bradshaw Rd This highway segment represents a transition area where vehicles that have been traveling in the left lanes begin to shift to the right lanes to exit while the entering traffic tries to shift to the left lanes
W eav in gLan e Dr o p
c h a p t e r s e v e n c o n g e s t i o n a n d b o t t l e n e c k a n a l y s i s
e bradshaw rd bottleneck The Bradshaw Rd bottleneck is caused by the entering traffic from Bradshaw Road the high truck volumes and the curve west of Bradshaw Two Bradshaw Rd on-ramps feed into US 50 westshybound southbound Bradshaw Rd direct on-ramp and northbound Bradshaw Rd loop on-ramp approximately 400 feet apart
F Howe Ave Bottleneck The Howe ave bottleneck is caused by a grade change and the weaving traffic entering from Howe ave and Hornet Dr competing for the right-most lane with those wanting to exit at 65th Street
G amp H SR 51SR 99 amp I-5 Bottleneck The bottleneck at I 5 is caused by the conflict between entering SR 99 and SR 51 traffic and exiting I-5 traffic as well as the queues formed on the ramps to i-5 which spill back onto US 50 The number of lanes in this section reaches a maximum of 6 and then drops to 4 as two lanes exit at the I-5 freeway This bottleneck is exacershybated during the peak periods when it stretches upstream to the lane drop before SR 99
W ea v in g
Lan e Dr o p
HigHway 50 corridor system management plan [ 53 ]
c h a p t e r t h r e e c u r r e n t c o r r i d o r s y s t e m m a n a g e m e n t s t r a t e g i e s
TABLE 3 PARk AnD RIDE LOTS
County Post Mile Facility name Description
Lot use transit Connection
Spaces Spaces occupied
occupancy Rate () Provider and route No
SaC 70 Butterfield Sacramento Regional Transit Gold Line Station
406 129 318 SacRT SacRT LRT Gold Line
SaC 125 Sunrise Sacramento Regional Transit Gold Line Station
487 389 799 RSacRT SacRT LRT Gold Line
SaC 158 Hazel 432 135 306 SacRT SacRT LRT Gold Line
SaC 158 Hazel 33 6 24 SacRT Route 109
SaC 171 Folsom Boulevard 70 58 829 ED Iron Point Connector SacRT LRT Gold Line
ED 2 El Dorado Hills (Latrobe RoadWhite Rock Road) 123 138 1122 ED Iron Point Connector ED Routes
156781112
ED 5 Cambridge Road 59 40 678 ED Iron Point Connector ED Routes 14567891112
ED 86 Ponderosa Road Northeast 28 15 536 ED Iron Point Connector ED Routes 23679101112
ED 86 Ponderosa Road Northwest 111 61 55 ED Iron Point Connector ED Routes 23679101112
ED 86 Durock Road 57 21 368 Na
ED 149 Shingle Springs Drive 19 4 211 Na
ED 122 Greenstone Road 21 4 19 Na
ED 15 Missouri Flat Road 73 44 603 ED Iron Point Connector
ED 158 Fairgrounds Park-and-Ride 200 40 20 ED Iron Point Connector
ED 185 Placerville Station (Mosquito Park- and-Ride) 130 50 385 ED Iron Point Connector
ED Commuter Service
ED 233 Camino Heights 24 1 42 Na
SacRT = Sacramento Regional Transit District ED = El Dorado County Transit Authority Lrt = Light rail train
Survey 2007
the holiday seasons and the Mather Field Air Show SacRT
operates additional service to connect events to light rail stations and offer free service to promote transit use durshying select events The transit routes identified in the CSMP
network are shown in Figure 5
The Sacramento Valley Station in downtown Sacramento is
the 7th busiest station in the national amtrak system and serves as a multi-modal transfer facility There are over 11 million passenger trips annually
Passengers can make connections with numerous local bus services as well as the SacRT light rail system
[ 14 ] HigHway 50 corridor system management plan
c h a p t e r t h r e e c u r r e n t c o r r i d o r s y s t e m m a n a g e m e n t s t r a t e g i e s
Try Transit Changeable Message Sign in Sacramento County
Sacramento County installed pre-emptive traffic signals to give preferential signal timing to transit buses at selected locations that serve high priority transit corridors
SACOG manages the 511 and rideshare programs that cost approximately $1 million per year region-wide to foster carpooling transit ridership vanpooling and bicycling in all areas and corridors The Regional Rideshare Program covers Placer El Dorado Sacramento yolo yuba and Sut-ter counties it is part of a statewide network of rideshare agencies which encourage alternative transportation modes for traveling
Park and Ride lots are located adjacent to or nearby the US 50 corridor utilized by commuters to connect with transit vanpool or carpool Of the sixteen lots many are adjacent to the SacRT Light Rail gold Line providing access for commuters to park their vehicles and commute the re-mainder of their trip via Light Rail El Dorado County Transit authority also uses the park and ride lots as transit stops for their Commuter Buses The locations capacity and occupancy rates of the Park and Ride lots are displayed in Table 3
Bicycle Facilities Bicycle facilities in the corridor are not actively managed in the same manner as motor vehicle facilities
However there are traffic operation systems that serve bicyclists such as dedicated bicycle lanes bicycle detec-tion loops at signalized intersections video detection other non-loop type detection and bicyclist activated signal change buttons The City of Sacramento is installing video detection at some locations
SacRT buses and the new light rail trains are equipped with bicycle racks There are over 170 weatherproof bicycle lock-ers at 23 light rail stations yCTD has the Bikes on Buses Program that allows bicycles to travel on any yOLOBUS
The Sacramento area Bicycle advocates maintain an on-line hazard reporting system to allow users to report hazardous locations for bicyclist such as potholes inad-equate signal timing hazardous railroad crossings insuf-ficient shoulder and inadequate bikeway markings The reports are then sent to the applicable jurisdiction SaCOg is creating an on-line route planning system for bicyclists in addition SaCOg maintains bicycle maps on their website which are currently being updated
The bicycle routes included in the CSMP network are shown on Figures 6 and 7
Pedestrian Facilities Pedestrian facilities are not included as part of the man-aged network because they do not directly provide corridor mobility However complete and safe pedestrian access to appropriate corridor modes such as bike routes and transit services is an important component of corridor system management Therefore subsequent updates of the CSMP will seek to identify key pedestrian facilities and barriers to pedestrian mobility with regard to access and modal con-nectivity
HigHway 50 corridor system management plan [ 15 ]
c h a p t e r t h r e e c u r r e n t c o r r i d o r s y s t e m m a n a g e m e n t s t r a t e g i e s
[ 16 ] HigHway 50 corridor system management plan
Page Inte
ntionally
Left
Blank
MAIN ST
MA
RB
LE V
ALL
EY
RD
65TH ST EXPY
FLYING
C R
D
STATE
HW
Y 16
MA
RB
LE VA
LLEY R
D
CAM
BRID
GE R
D
GREEN VALLEY RD
RIV
ERSI
DE
BLVD
11T
H S
T
RIV
ERSI
DE
BLVD
HO
WE
AV
E
EL DORADO
HILLS BLVD
EL DORADO H
ILLS BLV
D
HORNET DR
JEFF
ERSO
N BL
VD
CAM
ERO
N PAR
K DR
PO
WE
R IN
N R
D
CO
UN
TY HW
Y E3
BRADSHAW RD
MATHER FIELD RD
ZINFAN
DEL D
R
11TH
ST
VD
FOLSOM BLFOLSOM BLVD
FOLSOM BLVD
FOLSO
M BLVD
WHITE ROCK RD
FOLSOM BLVD
FOLS
OM
BLV
D
LATRO
BE RD
CANAL ST
16TH
ST
JACQ
UIER
RD
15TH
ST
HARBOR BLV
D
STOCKTON BLVD
FORNI RD BIDW
ELL DR
WATT AVE
PLACERVILLE DR
TOW
ER G
ATEW
AY
SHIN
GLE SPR
ING
S DR G
REEN
STON
E RD
59TH
ST
SUN
RISE BLVD
EL D
OR
AD
O R
D
HAZEL AVE
SOUT
H RI
VER
RD
PON
DER
OSA R
D
SHIN
GLE SPR
ING
S RD
SHIN
GLE
SPR
ING
S R
D
CARSON RD
MISSO
URI FLAT RD
BASS LAKE RD
N SH
ING
LE RD
PRAIR
IE CITY R
D
S SHIN
GLE R
D
SHIN
GLE
RD
SCOTT RD
W S
T AT
5TH
ST
65TH
ST
5TH
ST
X
ST A
T 27
TH
80
CEDAR GROVE EXIT
MO
SQU
ITO R
D
PLACERVILLE DRMISSOURI
FLAT RD
FORNIRD
EL D
OR
AD
OR
D
POIN
T VIEW D
RSM
ITH FLAT R
D
SCH
NELL SC
HO
OL R
D
MO
NTER
EY RD
c h a p t e r t h r e e c u r r e n t c o r r i d o r s y s t e m m a n a g e m e n t s t r a t e g i e s
Figure 4 Existing Traffic Operations Systems Elements
Highway 50 Corridor Systems Management Plan Existing Traffic Operations Systems Excluding Ramp Meters
TOS ndash Traffic Operations Systems
Stations Continuous Coverage
EMS ndash Extinguishable Message Sign WIM ndash Weigh-in-Motion Location (EMS Usually Refers Motorist to HAR)
Television System
19365TMS ndash Traffic Monitoring99 US Highway 50VS ndash Fog (Visibility) Sensor
CCTV ndash Closed Circuit
I-80 to Cedar Grove Exit HAR ndash Highway Advisory Radio Local Road Interchange Access
White Rock RdRWIS ndash Roadside WeatherCMS ndash Changeable Sunrise Blvd to Latrobe Rd
Message Sign Information System
50
80
51
49 160
50
Placerville to Cedar Grove Exit
50
1935
16 49
99
84 160
49 MilesMiles 0 1 2 3 4 50 1 2 3 4 5 10
HigHway 50 corridor system management plans [ 17 ]
124 49
MOTHER LODE DR
MATHER FIELD RD
West Terminus
RAMP
RAMP
RAMPRAMP
RAM
P
RAMP
RAM
P RAMP
RAMPRAMP
RA
MP
RAM
P RAM
P
RAMP
RAM
P
RAM
P
RA
MP
RAM
P
RAM
P
YoloBus Express Routes Plus Routes 42A and 42B
RAMPBROADWAY
65TH
ST
PCE
65
SCRY42A
Y44Y4343
242 IPC
5
W STX ST
WATT AVE
MAROCKINGHAM
DR
OLD PLACER
BRADSHAW RD
VILLE RDTHER FIELD RD
INTERNATIONAL DR
ZINFANDEL DR
WHITE ROCK RD FOLSOM BLVD FOLSOM BLVD
SUNRISE BLVD
BLUE R
AVIN
E RD
WHITE ROCK RD
SC
OTT R
D
PR
AIR
IEC
ITY R
D
LATROBE RD
GREEN V ALLEY RD
PLACERVILLE DR
FORNI RDM
AIN ST
BROADWAY
CEDAR GROVE EXIT
WEST
CAPTOL AVE
(WESTMOST
STOP)
(WESTMOST STOP)
SCR
SCR
IPC
IPC
c h a p t e r t h r e e c u r r e n t c o r r i d o r s y s t e m m a n a g e m e n t s t r a t e g i e s
Figure 5 US 50 CSMP Network Transit Routes
Highway 50 Corridor System Management Plan 80
CSMP Commuter Transit Network
El Dorado County Transit Authority 65
IPC Iron Point Connector
SCR Sacramento Commuter Route 193
Sacramento Regional Transit District 109ndashHazel Express
Yolo Bus (Express) Y43 Y44 Y230 Y231 and Y232
Yolo Bus (All-Day Intercity amp Airport Service) Y42A (Clockwise) Y42B (Counter-clockwise)
LATROBE RD
Park-and-Ride Lots
193 65
49 US Highway 50 (I-80 to Cedar Grove Exit)
Parallel Roads
Light Rail STation
Light Rail
Class I Bikeways Other State Highways
County Lines
80
49
50
80160
50
5 84 16
4999
Miles 0 5 10160
HigHway 50 corridor system management plans [ 18 ]
K
5
FOLSOM BIKE TRAIL
SEE CENTRAL CITY BICYCLENETWORK MAP FOR BICYCLE
F ACILITY NAMES
AMERICAN RIVER PARKWAY TRAIL SYSTEM
(INCLUDING JE
DEDIAH SMITH MEMORIAL T
RAIL)
FOLSOM BLVD
WHITE ROCK RDSIL V A V ALLEY PKWY
EL D
OR
AD
O H
ILLS B
L VD
GREEN VALLEY RD
AMERICAN R
IVER PARKWAY
TRAIL
SYSTEM
(INCLU
DING JE
DEDIAH SMITH
MEMORIA
L TRAIL)
NATOMA ST
FOLSOM BLVD
EL DORADO TRAIL
CARSON RD
PLACER VILLE RD
RAY
LAW
YER
DR
c h a p t e r t h r e e c u r r e n t c o r r i d o r s y s t e m m a n a g e m e n t s t r a t e g i e s
Figure 6 US 50 CSMP Network Bicycle Routes
Highway 50 Corridor System Management Plan
Bicycle Route Network
Class I Bicycle Facilities
Class II Bicycle Facilities
193
Lincoln
65
Rocklin
Auburn
Folsom 49
193
Light Rail Stations
Light Rail Loomis50
RosevilleUS Highway 50 CSMP Corridor
Other State Highways Miles
County Lines 0 1 2 3
99
49 80
50
160 80 193
Placerville 50
West Rancho 50 Sacramento Cordova
5 0 49
8 4
9 9 Sacramento
1 6 4 9
0 1 2 Miles
3
1 6 0 Elk Grove 210 210 44 66 88
Miles 10 Miles
10 1 2 4
4 9
HigHway 50 corridor system management plans [ 19 ]
13TH
ST
H ST E ST BELVEDERE AVE
51ST
ST
BROADWAY H ST
48TH
ST
11TH
ST
PO
WE
R IN
N R
D
28TH
ST
STOC
KTON
BLVD3R
D ST
ALH
AMBR
AFR
ON
T BLV
D S
T
W CAPITOL A VE
DISCOVER Y
P ARK BRIDGE
JEDED
IAH
N ST
T ST
K ST
11TH
ST
RIV
ERSI
DE
BLV
D
18TH
ST
R S
T17
TH S
TO
ST
18TH
ST
20TH ST
CAPITOL AVE
T ST
28TH
ST
34TH
ST
39TH
ST
M ST
BROADWAY
T ST
FOLSOM BLVD
58TH
ST
J ST
65TH
ST
CSU
S
CO
NN
ECTIO
NS
SR 16JACKSON HWY
FOLSOM BLVD
LA RIVIERA DR
W ATT AV
E
HO
WE A
VE
GUY W
EST B
RIDE
COLLEGE TOWN DR
c h a p t e r t h r e e c u r r e n t c o r r i d o r s y s t e m m a n a g e m e n t s t r a t e g i e s
Figure 7 US 50 CSMP Network Bicycle Routes (Sacramento Insert)
5 Sacramento
8 0
8 0
160
West Sacramento
80
SMITH MEMORIAL TRAIL
50
US Highway 50 Corridor System Management Plan 50
Central City Bicycle Route Network 50
Bikeway and Multi-Use Network
US Highway 50 (I-80 to Cedar Grove Exit)
Class I Bicycle Facilities
Class II Bicycle Facilities
Connecting Routesndashno Bicycle Designation
80 16 5
BROADWAY
FLOR
IN-P
ER
KIN
S R
D
Light Rail STation 99
Light Rail
Other State Highways
County Lines
HigHway 50 corridor system management plans [ 20 ]
major corridor mobility challenges
chapter four
High demand for mobility services especially during peak commute periods is creating significant traffic congestion
and impairing mobility in the corridor Heavy congestion and stop-and-go traffic contributes to increased vehicle
emissions and added travel costs Many transit services are operating at maximum passenger carrying capacity and buses often must contend with the same congestion as autos in many locations bicyclists have to compete for space on these same facilities
Much of the congestion can be attributed to population growth residential and commercial development job housing imbalances work schedules that require commute trips during peak travel times recreational trip generators and truck traffic
The overall amount of travel in the corridor has increased dramatically over the past ten years and is expected to
continue to increase as the region adds approximately
one million new residents over the next 25 years per the current SACOG MTP 2035 Traffic congestion per houseshyhold is expected to increase 18 percent over 2005 levels
by the year 2035
in the general area of eastern Sacramento County and western El Dorado County the Highway 50 Partnership
has projected growth of 78000 more dwelling units and 53000 new jobs over the next 25 years Current and foreshycasted data is depicted in Table 4
The sections of US 50 with particularly severe traffic
congestion are depicted in Figures 8 and 9 These are
also summarized in greater detail in Tables 14 and 15 in Chapter 7 Table 14 shows a summary of the US 50 eastbound bottlenecks while the tables that follow discuss each bottleneck including location and possible causality Table 15 shows a summary of the US 50 westbound bottleshynecks while the tables that follow discuss each bottleneck including location and possible causality Minor or hidden bottlenecks are those that are not as defined (or severe) as the major bottlenecks Please note that the graphics acshycompanying the bottlenecks are not to scale
a critical component of identifying and resolving Traffic congestion per corridor mobility challenges household is expected is the need for detailed to increase 18 percent data analysis and comshy over 2005 levels by the munication regarding
year 2035system performance Data collection is insufficient to
fully meet these needs but still provides useful information as detailed in the following pages improving data gathershying analysis and dissemination of information is a major challenge for this corridor and is a component of intelligent Transportation Systems planning
HigHway 50 corridor system management plan [ 21 ]
c h a p t e r f o u r m a j o r c o r r i d o r m o b i l i t y c h a l l e n g e s
[ 22 ] HigHway 50 corridor system management plan
Figure 8 US 50 AM Peak Period Bottleneck Locations
Figure 9 US 50 PM Peak Period Bottleneck Locations
Challenges along the corridor include
bull severe recurrent highway and roadway traffic congestion
bull an incomplete buscarpool lane system
bull an incomplete set of freeway auxiliary lanes
bull loss or dropping of freeway lanes at specific locations
bull incomplete ramp metering
bull limited parallel roadway capacity
bull lack of signal coordination on key arterials and freeway ramp intersections
bull transit facilities approaching capacity
bull inadequate transit capital and operations funding needed to grow transit ridership
bull light rail at-grade crossings
bull lack of adequate access to transit across US 50
bull lack of double tracking of the light rail Gold Line to Folsom
bull poor pavement and road and bicycle route maintenancesweeping
bull lack of sufficient bicycle activated signal change devices
bull motorist driving behavior
bull inadequate bicycle storage
bull inadequate bicycle and pedestrian access to transit and
bull gaps and barriers within the bicycle route network
Additionally the EDCTC has identified safety and operashytional issues between the Smith Flat interchange and east of the Upper Carson RoadCamino intersection in the
Camino Area Parallel CapacitySafety Study Transporshytation issues include at-grade access to US 50 left turn conflicts across US 50 increasing average daily local and
interregional traffic growth in the area lack of alternate
routes seasonal traffic to and from Apple Hill and other local events and seasonal access to recreation in the Lake
Tahoe Region
c h a p t e r f o u r m a j o r c o r r i d o r m o b i l i t y c h a l l e n g e s
Table 4 CUrrenT and ForeCaSTed TraFFiC daTa
location Current Traffic data ndash 2007 Future Traffic data ndash 2027 (no build) Future Traffic data ndash 2027 (build)
County description amp location of Trucks
Peak directional
Split
Peak Hour Traffic
average annual daily
Traffic2
Volume over Capacity3
Peak Hour Traffic
average annual daily Traffic2
Volume over Capacity3
(no-build)
Peak Hour Traffic
average annual daily
Traffic2
Volume over Capacity3
(build)
yOL interstate 80 to yoloSacramento County Line
6 60 15500 180000 109 23911 277032 169 24070 278880 136
SaC yoloSacramento County Line to State Routes 99 and 51
4 59 21000 253000 135 28080 312480 186 29153 324415 193
SaC State Routes 99 and 51 to watt avenue 4 59 20600 225000 145 27942 286230 189 30648 313950 166
SaC watt avenue to Zinfandel Drive 4 59 16700 187000 115 24783 274540 163 25885 286750 136
SaC Zinfandel Drive to Sunrise Boulevard 4 60 13500 149000 093 20331 224394 133 20925 230950 110
SaC Sunrise Boulevard to Folsom Boulevard 4 66 11900 125000 089 18888 198247 131 20086 210820 140
SaC Folsom Boulevard to SacramentoEl Dorado County Line
3 66 8800 95000 087 13341 151311 133 13612 154380 136
ED SacramentoEl Dorado County Line to Cameron Park Drive
4 61 6900 70000 095 11454 116200 165 11834 120050 114
ED Cameron Park Drive to Missouri Flat Road
4 62 5700 62000 092 8647 94054 132 9462 102920 096
ED Missouri Flat Road to End of Freeway in Placerville
4 57 4850 59000 069 7101 76245 098 7363 79050 102
ED End of Freeway in Placerville to Bedford avenue
4 55 4800 52000 Na 4 6595 74196 Na4 6648 74790 Na4
ED Bedford avenue to Cedar grove Exit 4 62 3800 38500 077 5474 50782 099 5520 51205 099
1 Peak Directional Split The percentage of total traffic in the heaviest traveled direction during the peak hour2 Average Annual Daily Traffic (AADT) The average number of vehicles per day in both directions 3 Volume over Capacity (VC) The volume of traffic compared to the capacity of the roadway4 Volume over Capacity does not determine LOS for two- or three-lane facilities or segments with intersection delay 5 Reported Collision Rate index ( Compared to State average) The percentage by which each segmentrsquos reported collisions rate (fatal injury and property damage only) is above or below the statewide average reported collisions rate on comparable facilities
Source 3-Year Caltrans Traffic Accident Surveillance and Analysis System data
HigHway 50 corridor system management plans [ 23 ]
c h a p t e r f i v e p e r f o r m a n c e m e a s u r e s
Page Inte
ntionally
Left
Blank
[ 24 ] HigHway 50 corridor system management plan
performance measures
chapter five
Continuing corridor monitoring and performance mea-
sures are an integral part of corridor management and investment decision making and help identify immediate efficient and effective system operational strategies and
capital improvements Performance measures provide the
important dynamic daily information needed to rapidly
address operational problems caused by recurrent and
non-recurrent traffic congestion Measures are also used to identify the best improvement actions to generate the desired results
Table 5 identifies the performance measures to be used as
part of the corridor system management process
Baseline Data For perFormance measures Tables 6 7 and 8 display baseline data for the perforshymance measures for the CSMP transportation network
The performance data was primarily compiled from the SACMET demand based traffic model the year 2007
edition of the Traffic Volumes Manual the year 2000 edition of the Highway Capacity Manual Caltrans Traffic
Accident Surveillance and Analysis System (TASAS) the 2007 Caltrans Division of Maintenance Pavement Summary Report and ridership records provided by the transit providers
additional performance Performance Measures data was derived from the provide the important Performance Measurement dynamic dailySystem (PeMS) tool an
information needed internet based tool used to
to rapidly addresshost process retrieve and operational problemsanalyze road traffic condishy
tions information from caused by recurrent
real-time and historical and non-recurrent data PeMS obtains 30-sec- traffic congestion ond loop detector data in real-time from detectors installed along the highway corridor
It should be noted that Average Daily Traffic (ADT) and LOS
for some ParallelConnecting Roadways segment locations
in Table 7 was not available These are noted ldquoNo Datardquo
Data collection for non-auto modes is not as robust as what is needed for active system management Subsequent updates of this CSMP will seek to expand the
availability of transit and bicycle performance data collection
HigHway 50 corridor system management plan [ 25 ]
mdash
c h a p t e r f i v e p e r f o r m a n c e m e a s u r e s
TABLE 5 PERFORmAnCE mEASURES DEFInITIOnS AnD APPLICABILITY
Performance Measure Definition of Performance measure applicability to Corridor
STATE HIGHWAY SYSTEm
LOS A ldquoreport cardrdquo measurement with ldquoArdquo being the least amount of
congestion and ldquoFrdquo being the most congestion LOS is a relatively simple and widely used measure which
offers comparison opportunities
Total Vehicle Hours of Delay The additional travel time in hours experienced by all vehicles on the highway segment per day or at peak hour due to congestion
This measurement is used to determine the cost in time which congestion can add to the regular travel time that it takes to traverse a segment of road and is useful in
quantifying the performance of a particular roadway in an understandable format
Total Person Minutes of Delay The additional travel time in minutes experienced by all persons in vehicles on the highway segment per day or at peak hour due
to congestion
This measurement is used to determine the cost in time which congestion can add to the regular travel time that it takes to traverse a given segment of road and is useful in quantifying the performance of a particular roadway in an
understandable format and for comparison of improvement options
Minutes of Delay per Vehicle The additional travel time in minutes experienced by each vehicle on the highway segment at peak hour due to congestion
This measurement is used to determine the cost in time which congestion can add to the regular travel time that it
takes to traverse a given segment of road
Minutes of Delay per Person The additional travel time in minutes experienced by each person in vehicles on the highway segment at peak hour due to congesshy
tion
This measurement is used to determine the cost in time which congestion can add to the regular travel time that it
takes to traverse a given segment of road
Vehicle Travel Time (Minutes) The average time spent by vehicles traversing between two points on a road or highway
Travel time is a measure used to quantify travel time deficienshycies and provide a personal indicator of congestion impacts
Distressed Pavement Pavement that rides rougher than established maximums and or exhibits substantial structural problems as determined by the
Pavement Condition Survey
This measurement provides a ride quality indicator and an indicator for structural roadway problems
Reported Collision Rate Comparison of the actual total collision rate () along a highway segment above or below the statewide average for fatal injury
and property damage-only collisions on comparable facilities
Comparing the total collision and rate with statewide average rate provides an opportunity to assess safety conditions
through the corridor
Reliability Identifies day-to-day variation in travel time for the same trip at the same time of day Focuses on the predictability of travel time
particularly for repetitive trips
Estimates reliability by defining the extra time travelers must add to their average travel time when planning trips to ensure on-time arrival (0 percent no day-to-day variations
100 percent double allotted travel time)
Lost Productivity Measures the capacity of the corridor to accommodate vehicle or person throughput and is calculated as actual volume divided by
the capacity of the highway
As traffic volumes increase to roadway capacity speeds decline rapidly and vehicle throughput drops dramatically which increases traffic congestion and delay and results in
lost productivity
[ 26 ] HigHway 50 corridor system management plan
mdash
c h a p t e r f i v e p e r f o r m a n c e m e a s u r e s
HigHway 50 corridor system management plan [ 27 ]
TABLE 5 PERFORmAnCE mEASURES DEFInITIOnS AnD APPLICABILITY (ConTInued)
Performance Measure Definition of Performance measure applicability to Corridor
PARALLEL AnD COnnECTInG ROADWAYS
LOS A ldquoreport cardrdquo measurement with ldquoArdquo being the least amount of
congestion and ldquoFrdquo being the most congestion LOS is a relatively simple and often used measure which
offers comparison opportunities
traNSit
available Capacity Ratio () of available transit capacity alternatives within the corridor
This measure indicates the available capacity to accommoshydate diverted travelers from single occupant vehicles
c h a p t e r f i v e p e r f o r m a n c e m e a s u r e s
[ 28 ] HigHway 50 corridor system management plan
Page Inte
ntionally
Left
Blank
c h a p t e r f i v e p e r f o r m a n c e m e a s u r e s
Table 6 US 50 PerForManCe MeaSUreS
County location Post Miles
distance (Miles)
average annual daily Traffic1
PerForManCe MeaSUreS
loS1
Total Vehicle Hours of delay2
Total Person Minutes of delay2
Minutes of delay per Vehicle2
Minutes of delay per Person2
Vehicle Travel Time (Minutes)2 distressed
Pavement (lane
Miles)4
reported Col-lision rate
Comparison ()5
reliability6 lost Productivity7
daily Peak Hour3 daily Peak
Hour3 Peak Hour3 Peak Hour3 Peak Hour3 eastbound westbound lost lane Miles aM
Peak Period
lost lane Miles PM
Peak Period
STaTe HigHway SySTeM
yOL interstate 80 to yolo Sacramento County Line
000 to 316 316 180000 F 1169 126 95363 8061 049 046 36 9 26 62 22 01 0
SaC
yoloSacramento County Line to State Routes 99
and 51
L000 to L248 R000
248 253000 F 4993 653 407455 41746 186 175 43 7 20 64 60 53 76
State Routes 99 and 51 to watt avenue
R000 to R534 534 225000 F 10097 1362 823883 87105 397 372 93 15 24 60 48 81 68
watt avenue to Zinfandel Drive
R534 to R1092 558 187000 F 8075 977 658886 62506 351 329 91 19 -32 56 42 44 23
Zinfandel Drive to Sunrise Boulevard
R1092 to 1250 158 149000 E 1271 197 103727 12610 088 082 25 9 -33 46 13 0 16
Sunrise Boulevard to Folsom Boulevard
1250 to 1701 451 125000 E 3087 356 251940 25832 180 149 63 5 -14 60 46 1 45
Folsom Boulevard to SacramentoEl Dorado
County Line
1701 to 2314 613 95000 D 583 122 47537 8867 083 069 70 0 -11 19 55 0 08
ED
SacramentoEl Dorado County Line to Cameron
Park Dr
000 to R657 657 70000 E 504 126 41150 9138 110 091 77 1 -35 PeMS Data
Unavailable PeMS Data Unavailable
PeMS Data Unavailable
PeMS Data Unavailable
Cameron Park Drive to Missouri Flat Road
R657 to R1506 849 62000 E 302 75 24633 4827 079 075 93 2 -61 PeMS Data
Unavailable PeMS Data Unavailable
PeMS Data Unavailable
PeMS Data Unavailable
Missouri Flat Road to End of Freeway in Placerville
R1506 to 1725 219 59000 D 66 16 5376 1053 020 019 24 1 20 PeMS Data
Unavailable PeMS Data Unavailable
PeMS Data Unavailable
PeMS Data Unavailable
End of Freeway in Placerville to Bedford avenue
1725 to 1811 086 52000 D 68 17 5585 1094 021 020 15 2 81 PeMS Data
Unavailable PeMS Data Unavailable
PeMS Data Unavailable
PeMS Data Unavailable
Bedford avenue to Cedar grove Road
1811 to R2595 784 38500 D 58 15 4758 932 023 022 85 10 6 PeMS Data
Unavailable PeMS Data Unavailable
PeMS Data Unavailable
PeMS Data Unavailable
TOTaL mdash 5473 mdash mdash 30273 4042 2470293 263771 1587 1449 7150 80 mdash mdash mdash mdash mdash
1 Source Average Annual Daily Traffic and Level of Service (LOS) calculated is based on 2007 Caltrans Traffic Volumes on California State Highways and Highway Capacity Manual and Cambridge Systematics from 2008 Reported LOS is for the typical most congested daily peak travel period 2 Source Delay is the average additional travel time by vehiclespersons traveling under 60 mph Data derived from 2007 HICOMP report SACMET Travel Demand Model PeMSs traffic data and Caltrans District 3 Traffic Operations Probe vehicle Tach runs 3 Peak Hour is during PM 4 Source 2007 Caltrans Division of Maintenance Pavement Summary Report 5 Source 2004 through 2007 Caltrans Traffic Accident Surveillance and Analysis System summary data of the percentage above or below the statewide average for fatal injury and property damage-only collisions on comparable facilities 6 Reliability The Planning Time Index is a measure of the reliability of the travel time on a particular route It is the ratio of the 95th percentile of travel time on a route to the median free-flow travel time This means itrsquos the amount of time a traveler needs to allocate for a route if they want to show up on time 19 out of 20 trips Reliability and Planning Time data was taken from April 2007 The data covered a 24-hour period of time on each Tuesday wednesday and Thursday of that month That data was then aggregated into a single average 24-hour day it was then analyzed to determine the highest average aM and PM travel time That time was then compared to the best possible average travel time to determine the additional time that was spent traveling the same seg-ment 7 Lost Productivity Data taken April 2007 PeMS As traffic increases to the capacity of the highway speeds decline throughput drops dramatically and the efficiency of the highway to provide mobility decreases This decline in the potential carrying-capacity of the freeway is expressed in terms of how many equivalent lane miles of roadway are lost
HigHway 50 corridor system management plans [ 29 ]
c h a p t e r f i v e p e r f o r m a n c e m e a s u r e s
Table 7 Parallel and ConneCTing roadwayS PerForManCe MeaSUreS
County location average
daily Traffic1
PerForManCe MeaSUreS
loS1
Total Vehicle Hours of delay2
Total Person Minutes of delay2
Minutes of delay per Vehicle2
Minutes of delay per Person2
Vehicle Travel Time (Minutes)2
distressed Pavement
(lane Miles)4
daily Peak Hour3 daily Peak
Hour3 Peak Hour3 Peak Hour3 Peak Hour3
Parallel and ConneCTing roadwayS
yOL west Capitol Enterprise Boulevard to Capitol Mall 13737 No Data
Data is unavailable for these performance measures at this time however will be pursued in the next phase of the CSMP
SaC
w 5th Street to 26th Street 9194 a
X 5th Street to 26th Street 9154 a
Folsom Boulevard watt avenue to Bradshaw Road 25600 C
watt avenue Folsom Boulevard to US 50 63900 F
Bradshaw Road Folsom Boulevard to US 50 22400 a
Folsom Boulevard Bradshaw Road to Sunrise Boulevard 20400 a
Bradshaw Road Old Placerville to US 50 54405 F
Old Placerville Road Bradshaw Road to Rockingham Drive 11864ndash18365 a
Rockingham Drive Old Placerville Road to Mather Boulevard 16516 E
Mather Boulevard Rockingham Drive to Folsom Boulevard 21732 C
international Drive Rockingham Drive to Zinfandel Drive 12808 a
Zinfandel Drive international Drive to Folsom Boulevard 22298ndash47032 BE
white Rock Road Zinfandel Drive to Sunrise Boulevard 25459 a
Sunrise Boulevard US 50 to Folsom Boulevard No Data No Data
white Rock Road Sunrise Boulevard to Prairie City Road 3400 B
Folsom Boulevard Sunrise Boulevard to iron Point Road 17200 a
white Rock Road grant Line Road to EDSaC County Line 6700 D
iron Point Road Folsom Boulevard to East BidwellScott Road 13984 No Data
Scott Road iron Point Road to white Rock Road No Data No Data
Folsom Boulevard iron Point Road to Blue Ravine Road No Data No Data
Blue Ravine Road Folsom Boulevard to green Valley Road No Data No Data
Prairie City Road US 50 to white Rock Road 6000 D
HigHway 50 corridor system management plans [ 30 ]
c h a p t e r f i v e p e r f o r m a n c e m e a s u r e s
Table 7 Parallel and ConneCTing roadwayS PerForManCe MeaSUreS (ConTinUed)
County location average
daily Traffic1
PerForManCe MeaSUreS
loS1
Total Vehicle Hours of delay2
Total Person Minutes of delay2
Minutes of delay per Vehicle2
Minutes of delay per Person2
Vehicle Travel Time (Minutes)2
distressed Pavement
(lane Miles)4
daily Peak Hour3 daily Peak
Hour3 Peak Hour3 Peak Hour3 Peak Hour3
Parallel and ConneCTing roadwayS
ED
green Valley Road EDSaC County Line to Francisco Drive 22600 D
Data is unavailable for these performance measures at this time however will be pursued in the next phase of the CSMP
green Valley Road Francisco Drive to Silva Valley Parkway 13077 D
green Valley Road Silva Valley Parkway to Cameron Park 9849 C
green Valley Road Cameron Park Drive to Deer Valley Road 5278 C
green Valley Road Deer Valley Road (East) to Lotus Road 8381 D
green Valley Road Lotus Road to Placerville Drive 4669 C
Latrobe Road white Rock Road to US 50 24742 C
Durock Road Cameron Park Dr to South Shingle Road 7278 C
Cameron Park Drive Durock Road to US 50 (Durock Road to Coach Lane Coach Lane to US 50) 9544 26603 CD
South Shingle Road Durock Road to US 50 11390 D
white Rock Road EDSaC County Line to Latrobe 12808 D
white Rock Road Latrobe Rd to Silva Valley Pkwy (Latrobe to PostPost to Silva Vlly Pkwy) 10124 CD
Silva Valley Parkway white Rock Rd to Serrano Pkwy (white Rock to Entrada Entrada to Serrano Pkwy) 13708 9328 DC
Forni Road Placerville Drive to Main Street 9049 8379 No Data
Placerville Drive Forni Road to US 50 No Data No Data
Main Street Placerville Drive to Bedford avenue No Data No Data
Main Street Bedford avenue to Broadway No Data No Data
Broadway Main Street to Point View Drive No Data No Data
1 Source Average Daily Traffic and Level of Service (LOS) calculated are based on City of Sacramento between 2001 and 2007 Sacramento County from 20072008 City of Rancho Cordova between 2004 and 2007 and El Dorado County from 2007
HigHway 50 corridor system management plans [ 31 ]
c h a p t e r f i v e p e r f o r m a n c e m e a s u r e s
Page Inte
ntionally
Left
Blank
[ 32 ] HigHway 50 corridor system management plan
c h a p t e r f i v e p e r f o r m a n c e m e a s u r e s
tabLe 8 traNSit PerforMaNCe MeaSure
County transit Provider route Performance Measure
available daily Capacity ()1 available Peak Hour Capacity1
traNSit
SaC
SacRT (Bus)
Route 21 70 10
Route 28 76 59
Route 36 83 74
Route 38 66 44
Route 72 56 20
Route 73 79 45
Route 74 82 43
Route 109 47 22
SacRT (Light Rail) Gold Line 31 Exceeds Capacity
EDSAC ED County Transit Authority
Commuter Express Bus Service Not applicablendashOperates Peak Hour
Only 405
iron Point Connector 764 Not available
Reverse Commuter Not applicablendashOperates Peak Hour Only 982
yoloSaC yolo County Transit District Not applicablendashOperates Peak Hour Only 498
biKe3
1 Source average Daily and Peak Hour available Capacity calculated from each transit providerrsquos route ridership data 2 The Reverse Commuter service is offered on vehicles that are returning to El Dorado County (Commuter Express Buses) 3 Bicycle performance measure(s) will be identified applied and included in the subsequent CSMPs
HigHway 50 corridor system management plan [ 33 ]
c h a p t e r f i v e p e r f o r m a n c e m e a s u r e s
[ 34 ] HigHway 50 corridor system management plan
Page Inte
ntionally
Left
Blank
planned corridor system management strategies
chapter six
ConCept LoS and ConCept FaCiLit y ldquoConcept LOSrdquo and ldquoConcept Facilityrdquo have traditionally been used in Caltrans TCCRs to reflect the minimum level or quality of operations acceptable for each route segment within the 20-year planning period and the highway facility needed in the next 20 years to maintain the Concept LOS
Typical Concept LOS standards in Caltrans District 3 are LOS ldquoDrdquo in rural areas and LOS ldquoErdquo in urban areas how-ever some heavily congested route segments now have a Concept LOS ldquoFrdquo because the improvements required to bring the LOS to ldquoErdquo are not feasible due to environmental right of way financial and other constraints The applica-tion of multi-modal corridor management strategies should reduce the severity and duration of congestion and provide viable travel options and information that will enable a traveler to avoid severe freeway congestion
The Concept LOS and Concept Facility for US 50 are shown in Table 9 almost all US 50 segments are forecasted to operate under LOS ldquoFrdquo conditions in 20 years under the No-Build and Build scenarios
Corridor ManageMent StrategieS The US 50 CSMP also proposes specific strategies to enhance corridor mobility (see Table 10) based on the fol-lowing principles
bull Manage all modes and facilities in the corridor as a single system beginning with the transportation net-work defined in this CSMP
bull Implement comprehensive and dynamic multimodal monitoring and reporting for the system and for all modes
bull Develop and use micro-simulation modeling to identify mobility challenges and to evaluate proposed solutions
bull Complete the projects included in the regional trans-portation plans with an emphasis on the completion of the key mobility improvement projects identified in this CSMP (see Tables 11 and 12)
bull Implement the specific strategies outlined in this CSMP
Key CapitaL projeCtS Tables 11 and 12 contain key capital projects that have been identified as the most critical to corridor mobility These are also included in the SaCOg MTP for 2035 and are either planned without any funding yet programmed are partially programmed
The US 50 CSMPor are entirely programmed SACOG conducted significant proposes specific
public attitude research strategies to enhance for the MTP for 2035 to corridor mobility complement comprehensive outreach efforts through community workshops the TALL Order Moving the Region Forward event the televised Town Hall Road Map for the Future and associated public polling The results of the SaCOg analyses and public out-reach for the MTP were
highway 50 corridor system management plan [ 35 ]
c h a p t e r s i x p l a n n e d c o r r i d o r s y s t e m m a n a g e m e n t s t r a t e g i e s
[ 36 ] HigHway 50 corridor system management plan
used when selecting the key projects for identification in
the CSMP and to ensure consistency Not all corridor projshyects in the MTP are included in the CSMP since the CSMP focuses on the managed network and the SaCOg MTP considers all streets and roads bike routes and transit services in the corridor
highway 50 partnership The Highway 50 Partnership is a cooperative public-private effort among the County of Sacramento City of Rancho
Cordova City of Folsom County of El Dorado and several major landowners that recognize the need to consider corrishydor mobility needs holistically
The Partnership has collaborated effectively to develop a Plan to improve mobility in the US 50 Corridor from Rancho
Cordova to El Dorado Hills an area identified as approprishyate for growth in the SACOG Blueprint Recognizing the
need to generate private investment the Partnership is seeking to implement a regional Highway 50 Corridor fee program to fund these projects
in addition to the key projects indicated in Table 11 Table 12 displays the key projects identified by the
Partnership
These projects include (1) Near-Term Priority Improvement Projects and (2) Near-Term Expected Roadway Improveshyments
The Near-term Priority improvement Projects would proshyvide several new roadway connections for people to travel within and through the area to avoid congestion They also include new transit routes and widening existing roadways
viewed by the Partnership as a package that would provide system-wide travel benefits These improvements targeted
for completion through 2012 would reduce vehicle hours of delay during commute hours by 30 percent
The near-Term Expected Roadway Improvements are conshysidered by the Partnership to be readily expected since they are tied to expected development or are part of a near-term
capital improvements program
Visionary projects Visionary projects are not yet included in the SaCOg MTP or EDCTC RTP but appear to offer considerable corridor mobilshyity benefits and merit further analysis and consideration for inclusion in the next MTP and RTP These are displayed in
Table 13
The ldquoPlus 10 Listrdquo in the SACOG MTP identifies projects
that are attractive from a performance standpoint but could not be included in the Final Project Lists because of financial constraint The ldquoPlus 10 Listrdquo element offers the
opportunity to include projects that would not be affordshyable without additional funding Some projects identified in
the Visionary Projects List were analyzed by SACOG during
development of the current MTP Some of these are included in the ldquoPlus 10 Listrdquo
Watt Avenue Light Rail Station Improvement Project
c h a p t e r s i x p l a n n e d c o r r i d o r s y s t e m m a n a g e m e n t s t r a t e g i e s
Table 9 US 50 ConCePT loS and FaCiliTy TyPe
location Forecasted level of Service1 (loS) and Facility Type
County description and location From Post Mile To Post Mile Current
loS1 20-year no build loS12
20-year build loS12
20-year Concept
loS13 existing Facility4 Concept Facility456 Ultimate Facility457
yOL interstate 80 to yoloSacramento County Line
000 316 F F F F 8F (6F between Jefferson Blvd ramps)
8F+2HOV+aux Lanes 8F+2HOV+aux Lanes
SaC yoloSacramento County Line to SR 99 and 51
L000 L248 = R000 F F F F 8F 8F+2HOV+aux Lanes 8F+2HOV+aux Lanes
SaC State Routes 99 and 51 to watt avenue R000 R534 F F F F 8F 8F+2HOV+aux Lanes 8F+2HOV+aux Lanes
SaC watt avenue to Zinfandel Drive R534 R1092 F F F F 8F 8F+2HOV+aux Lanes 8F+2HOV+aux Lanes
SaC Zinfandel Drive to Sunrise Boulevard R1092 1250 E F F F 8F 8F+2HOV+aux Lanes 8F+2HOV+aux Lanes
SaC Sunrise Boulevard to Folsom Boulevard 1250 1701 E F F F 6F+2HOV to Hazel ave 4F+2HOV
to Folsom Blvd
6F+2HOV+aux Lanes to Hazel ave 4F+2HOV+aux
Lanes to Folsom Blvd
8F+2HOV+aux Lanes
SaC Folsom Boulevard to SaCED County Line 1701 2314 D F F F 4F+2HOV 4F+2HOV+aux Lanes 6F+2HOV+aux Lanes
ED SacramentoEl Dorado County Line to Cameron Park Drive
000 R657 E F F F 4F 4F+2HOV+aux Lanes 6F+2HOV+aux Lanes
ED Cameron Park Drive to Missouri Flat Road R657 R1506 E F E E 4F 4F+2HOV+aux Lanes to greenstone 4F+aux Lanes
to Missouri Flat
6F+2HOV+aux Lanes to greenstone 4F+2HOV+aux Lanes
to Missouri Flat
ED Missouri Flat Road to End of Freeway in Placerville
R1506 1725 D F F F 4F 4F+aux Lanes 4F+aux Lanes
ED End of Freeway in Placerville to Bedford avenue
1725 1811 D E E E 4E 4E 4E
ED Bedford avenue to Cedar grove Exit 1811 R2595 D F F F 4F to Smith Flat 4E to Camino 4F+aux Lanes to Smith Flat 4E to Camino
4F+aux Lanes
1 Level of Service (LOS) A ldquoreport cardrdquo for evaluating traffic flow with ldquoArdquo being the best and ldquoFrdquo being the worst 2 20-year LOS (No Build) The LOS that would be expected at 20 years with no improvements 3 20-year Concept LOS The minimum acceptable LOS over the next 20 years 4 Facility Type Codes C=Conventional Highway E=Expressway F=Freeway HOV=High Occupancy Vehicle Lanes aux=auxiliary Lanes 5 Operational improvements are included in future facilities for all segments Examples of operational improvements include TOS improvements and auxiliary lanes 6 Concept Facility the future roadway with improvements needed in the next 20 years if LOS ldquoFrdquo no further degradation of service from existing ldquoFrdquo is acceptable as indicated by delay performance measurement 7 Ultimate Facility The future roadway with improvements needed beyond a 20 year timeframe
HigHway 50 corridor system management plans [ 37 ]
c h a p t e r f i v e p e r f o r m a n c e m e a s u r e s
Table 10 US 50 CSMP STraTegieS
Strategy description implementation Challenges
Maintain and operate the existing corridor multi-modal trans-
portation infrastructure
Maintain the existing investment in all modes of the transportation system and provide adequate resources for daily operations including operating
revenues for transit services
Funding availability funding competition within the region
Fully coordinate the delivery of transportation services and facili-ties in the corridor including daily operations and system planning
for enhancements
Interagency operational coordination to maximize the efficiency and effec-tiveness of all modes operating in the corridor with a focus on the CSMP transportation network defined in this CSMP Use of an existing group or
committee to provide initial oversight for this strategy
Diverse interests and competing priorities and limited resources
Construct planned and pro-grammed corridor capital improve-
ment projects
implementation of the capital improvements in the corridor included within the approved Metropolitan Transportation Plan and Regional Transportation
Plan for all transportation modes within the scope schedule and cost specified
Funding availability funding competition within the region
Comprehensive daily monitoring of the status of all modes providing service on the CSMP transporta-
tion network
Full deployment of multimodal transportation service status detection systems for all CSMP network components
Funding availability funding competition within region
Provide traveler information to the public
Provide the public with real-time easily accessible information regarding the status of all CSMP transportation system components so as to allow travel-
ers to make informed decisions about trip mode time and routing options
Funding availability funding competition within region
Continually monitor and analyze the CSMP transportation network to improve system performance
Monitor transportation performance measures and make system modifica-tions as appropriate on a frequent and timely basis Staff resources and data availability
Decrease the duration of non-recurrent traffic congestion
Expand and enhance the Freeway Service Patrol to respond to automobile accidents and vehicle break-downs
Funding availability funding competition within the region
Timely implementation of STaRNET
Expedite the implementation of the STaRNET operators of transportation facilities and emergency responders in the Sacramento region through real-time sharing of data and live video refinement of joint procedures
pertaining to the operation of roadways and public transit and public safety activities as well as enhance the regionrsquos 511 web site and interactive
telephone service to provide more traveler information
Developmental time acceptance by agencies and integration into daily use and identifica-
tion of maintenance and operations funding
Enhance transit and rail service increase transit service frequency provide express transit services imple-
ment bus rapid transit routes reduce headways for light rail and buses and construct planned light rail line extensions
Funding availability funding competition within the region
Complete Bus Carpool lane network
Complete the regional buscarpool lane network including freeway-to-freeway HOV lane connectors
Funding availability funding competition within the region Public agency and public
acceptance of network
[ 38 ] HigHway 50 corridor system management plan
c h a p t e r s i x p l a n n e d c o r r i d o r s y s t e m m a n a g e m e n t s t r a t e g i e s
tabLe 10 uS 50 CSMP StrategieS (ConTInued)
Strategy Description implementation Challenges
Enhance Transportation Demand Management strategies
Encourage employers to provide telecommuting and flexible working hour options to employees
acceptance by employers and resources to participate
Optimize the timing and synchronishyzation of traffic signals
Coordinate the optimization and timing of traffic signals on freeway ramps and along parallel and connecting roadways within and between jurisdicshytions to improve traffic flow and reduce congestion Provide signal priority
systems for transit vehicles
Funding availability and coordination among cities counties and Caltrans
improve access management of freeways and parallel connecting roadways
Develop and implement access management strategies to maintain the operational efficiency of freeways and parallelconnecting roadways
agreement between responsible jurisdicshytions as to where increased access control is needed increased access control on some parallelconnecting roadways may increase
traffic volumes on non-corridor roads
Develop innovative use of CMSs (eg travel times)
Potential uses of CMSs to improve system efficiency include the use of CMSs along portions of all corridors near transit station to indicate travel
times based on real-time existing traffic conditions on the freeway as well as on parallel roadways and express bus and light rail services CMS can also be used to identify the number of parking spaces that are still available at
the light-rail stations
Funding availability funding competition within the region
Implement amp expand Transit AVLTransit status information
enhancements for system users
Expand the use of AVL systems utilizing GPS technology to track in real-time the location of transit vehicles monitor transit schedules dispatch transit vehicles and provide real-time passenger information such as ldquonext busrdquo or
ldquonext trainrdquo arrival times
Funding availability funding competition within region
Expand Park-and-Ride lots at key locations
Add additional capacity to existing park-and-ride lots near transit stations and other locations that are approaching capacity
Funding availability funding competition within the region and available land
improve bike-pedestrian access in the CSMP
transportation network
Plan and program for construction of additional bicycle paths lanes and related improvements for access and connectivity to transit park and ride
lots and destination points
Funding availability funding competition within the region
Provide ldquoBike-SharingrdquordquoCar-Sharingrdquo tofrom transit (ldquoCarlinkrdquo) and from
neighborhoods
Expand the Regional Rideshare and Spare-the-Air programs to include bicycle and car sharing opportunities
Funding availability and coordination between SaCOg TMa air Districts employers developshyers property managers and local government
officials
Provide parking management stratshyegies in interested jurisdictions where applicable to discourage
use of single-occupant vehicles
in higher-density areas provide preferential parking for carpools and vanshypools require residential parking permits remove on-street parking and or provide graduated parking fees for metered on-street parking based on
vehicle type and time of day for SOV spaces to encourage transit use
Acceptance by businesses local officials and the general public
Expand bicycle commute amp transit fare strategiessubsidies
increase participation by large employers in programs that subsidize transit fares for employees during peak-hour commute times and provide bicycling
to work incentives
Voluntary participation by large employers to pay subsidy to transit providers
HigHway 50 corridor system management plan [ 39 ]
c h a p t e r s i x p l a n n e d c o r r i d o r s y s t e m m a n a g e m e n t s t r a t e g i e s
tabLe 11 KeY CaPitaL ProjeCtS
CountyLead agency
route roadway from to Project
Description Programmed
funds
additional funding Needed
total Cost estimate (x $1000)
Comp Year (FFY)
uS 50
Sacramento Caltrans District 3
US 50 Downtown watt avenue HOV Lanes $0 $75000 $75000 2020
Sacramento Caltrans District 3
US 50 watt avenue Sunrise Blvd HOV Lanes $165000 $0 $165000 2013
Sacramento Caltrans District 3
US 50 Bradshaw Road
Mather Field Road
Eastbound and Westbound Auxiliary Lanes
$0 $3700 $3700 2016
Sacramento Caltrans District 3
US 50 State Route 99
(Oak Park Interchange) interchange improvements including buscarpool lane
connectors $0 $150000 $150000 2014
Sacramento Caltrans District 3
US 50 interstate 5
(Riverfront Interchange) Riverfront Interchange
improvements including bus carpool lane connectors
$30000 $170000 $200000 2016
ED Caltrans District 3 US 50 Camino
Operational Safety improvements Construct an
undercrossing median barrier modify local road connections andor associated operational improvements on and adjacent
to US 50
$15000 $0 $15000 2012
ED ED County DOT US 50
west of Latrobe Road
west of Bass Lake
grade HOV Lanes (Ph1) $47141 $0 $47141 2010
ED Caltrans District 3 US 50
west of Bass Lake Road
Ponderosa Road
HOV Lanes (Ph2) $55000 $0 $55000 2011
ED Caltrans District 3 US 50 Ponderosa
Road greenstone
Road HOV Lanes (Ph3) $22357 $0 $22357 2013
ED ED County DOT US 50 Future Silva
Valley iC
Future Empire Ranch IC
Mainline Widening construct new WB lane within the
median from proposed Silva Valley IC to proposed Empire
Ranch IC
$2950 $0 $2950 2013
[ 40 ] HigHway 50 corridor system management plan
c h a p t e r s i x p l a n n e d c o r r i d o r s y s t e m m a n a g e m e n t s t r a t e g i e s
tabLe 11 KeY CaPitaL ProjeCtS (ConTInued)
CountyLead agency
route roadway from to Project
Description Programmed
funds
additional funding Needed
total Cost estimate (x $1000)
Comp Year (FFY)
PARALLEL AnD COnnECTInG ROADWAYS
ED ED County DOT
Silva Valley Parkway
Entrada Drive
Future US 50
Silva Valley Parkway iC
Widen Silva Valley Road from 2 lanes to 4 lanes includes
Class ii bike lanes and left turn storage pockets
$2921 $0 $2921 2010
ED ED County DOT
Silva Valley Parkway US 50
US50 Silva Valley Parkway (Phase 2) Includes constructshying overcrossing and ramps
signalization at EB and WB on off ramps
$57817 $0 $57817 2016
ED ED County DOT
Headington Road
Missouri Flat Road
El Dorado Road
Extend 2 lanes with median $9878 $0 $9878 2012
ED ED County DOT
Durock Road
Robin Lane South
Shingle Road
Extend 2 lanes with median $1239 $9214 $10453 2015
ED ED County DOT
Durock Road
Business Center Drive intersection signalization
includes adding turn pockets on Durock Road
$4333 $0 $4333 2009
ED City of Placerville
Point View Drive Broadway Smith Flat
Road Extend 2 lanes $1300 $0 $1300 2020
ED City of Placerville
western Placerville
US 50 interchange
Forni Road Ray Lawyer
Drive
Placerville Drive
Interchange Reconstruction convert Ray Lawyer Dr
Overcrossing to full IC Auxiliary Lanes
$5059 $34741 $39800 2020
Sacramento City of Rancho
Cordova
Mather Boulevard
Rockingham Road
Zinfandel Drive widen to 4 lanes $0 $8617 $8617 2020
Sacramento Rancho Cordova
Parkway ii
Grant Line Road
White Rock Road
New 6-lane expressway includshying intersection improvements at Kiefer Blvd amp White Rock
Road
$0 $44518 $44518 2020
Sacramento City of Folsom
Scott Road US 50 White Rock Rd
widen from 2 to 6 lanes $16000 $0 $16000 2020
Sacramento Sacramento County DOT
White Rock Road
Grant Line Rd
Prairie City Rd
Widen from 2 to 4 lanes realign near Nike and Nimbus Roads and connect with existshying alignment west of Prairie City Rd Realign Grant Line Rd to intersect with realigned
White Rock Rd
$26600 $0 $26600 2020
Sacramento Sacramento County DOT
Hazel avenue
US 50 Hazel Madison
Widen American River Bridge and approaches from 4 to 6 lanes Widen Hazel Avenue from AR Bridge to Madison from 4 to 6 lanes with Bike
LanesSignals
$83530 $0 $83530 2020
HigHway 50 corridor system management plan [ 41 ]
c h a p t e r s i x p l a n n e d c o r r i d o r s y s t e m m a n a g e m e n t s t r a t e g i e s
tabLe 11 KeY CaPitaL ProjeCtS (ConTInued)
CountyLead agency
route roadway from to Project
Description Programmed
funds
additional funding Needed
total Cost Estimate (x $1000)
Comp Year (FFY)
PARALLEL AnD COnnECTInG ROADWAYS
ED ED County DOT
green Valley Road
Salmon Falls Road
east
Deer Valley Road
widen from 2 to 4 lanes $0 $14576 $14576 2025
ED ED County DOT
green Valley Road
Deer Valley Road east Lotus Road widen $958 $4513 $5471 2015
ED ED County DOT
green Valley Road
Francisco Drive
Salmon Falls Road
widen from 2 to 4 lanes divided $412 $3491 $3903 2015
ED ED County DOT
Latrobe Road
investment Boulevard
golden Foothill Parkway
widen from 2 lanes undivided to 4 lanes
divided $1076 $8792 $9868 2015
ED ED County DOT
Latrobe Road
Carson Creek
White Rock Road
widen from 4 to 6 lanes $0 $23755 $23755 2025
ED ED County DOT
white Rock Road
EDSac County Line
Manchester Drive
widen 2 to 4 lanes divided includes signal interconnect and coorshy
dination
$0 $23755 $23755 2025
Sacramento City of Rancho
Cordova
Easton Valley
Parkway
Prairie City Road
Empire Ranch Road extenshysion south of
US 50
Construct new 4 lane road $0 $45000 $45000 2020
Sacramento Sacramento County DOT
Hazel avenue
Easton Valley
Parkway
Grant Line RoadWhite Rock Road
New road extension 4 lane limited access
through aerojet property $0 $18000 $18000 2018
Sacramento Sacramento County DOT
white Rock Road
Prairie City Road
ED County Line
widen to 4 lanes $8330 $64773 $73103 2018
Sacramento Sacramento County DOT
green Valley Road
East Natoma Sacramento ED County
line widen to 4 lanes $0 $3000 $3000 2018
Sacramento City of Rancho
Cordova
Zinfandel Drive
international Drive
Folsom Boulevard
widen to 4 lanes $0 $12000 $12000 2020
[ 42 ] HigHway 50 corridor system management plan
c h a p t e r s i x p l a n n e d c o r r i d o r s y s t e m m a n a g e m e n t s t r a t e g i e s
tabLe 11 KeY CaPitaL ProjeCtS (ConTInued)
CountyLead agency
route roadway from to Project
Description
Pro-grammed
funds
addi-tional
funding Needed
total Cost estimate (x $1000)
Comp Year (FFY)
traNSit
yolo amp Sacramento City of west Sacramento
amp City of Sacramento
Sacramento River
Crossing
15th Street in the City
of west Sacramento
Broadway in the City of
Sacramento
New all-modal river crossing (Auto Transit Bike amp Pedestrian)
from Sacramento across the Sacramento River to West
Sacramento The crossing was modeled between Broadway in Sacramento amp 15th Street in
West Sacramento but final alignshyment options will be studied in subsequent planning efforts
$800 $99200 $100000 2019
Sacramento Cal State University
Sacramento
CSUS Campus mdash mdash
Sac State Tram adjoining City streets and SRTD 65th Street light railbus transfer station Bus Rapid Transit System
$23574 $0 $23574 2013
Sacramento City of Rancho
Cordova
Rancho Cordova Various Various
New Service Rancho Cordova Pilot Transit Shuttle System new transit service for connection to
RTs Gold Line
$2380 $1500 $38880 2014
yolo amp Sacramento City of west Sacramento
TBD west
Sacramento Sacramento Streetcar Service between west
Sacramento and Downtown Sacramento
$17400 $54700 $72100 2014
Sacramento City of Rancho
Cordova RT Gold Line
RT Gold Line Tracks
Mather Field Road
Light Rail Grade Separations $0 $52888 $52888 2025
Sacramento City of Rancho
Cordova RT Gold Line
RT Gold Line Tracks Zinfandel Drive Light Rail Grade Separations $0 $52888 $52888 2025
Sacramento City of Rancho
Cordova RT Gold Line
RT Gold Line Tracks
Bradshaw Road
Light Rail Grade Separations $0 $35260 $35260 2025
Sacramento City of Rancho
Cordova RT Gold Line
RT Gold Line Tracks Routier Road Light Rail Grade Separations $0 $35260 $35260 2025
Sacramento City of
Sacramento Sacramento Valley Station
Sacramento intermodal Transportation Facility (Phase 1) - Develop intermodal transportashytion terminal for heavy rail light
rail and bus service
$77799 $0 $77799 2010
Sacramento City of
Sacramento Sacramento Valley Station
Sacramento intermodal Transportation Facility (Phase 2) - Develop intermodal transportashytion terminal for heavy rail light
rail and bus service
$24101 $1000 $25101 2014
HigHway 50 corridor system management plan [ 43 ]
c h a p t e r s i x p l a n n e d c o r r i d o r s y s t e m m a n a g e m e n t s t r a t e g i e s
TABLE 11 KEY CAPITAL PROJECTS (CONTINUED)
CountyLead Agency
Route Roadway From To Project
Description Programmed
Funds
Additional Funding Needed
Total Cost Es-timate (x $1000)
Comp Year (FFY)
BICYCLE ROUTES
Sacramento City of Rancho
Cordova
US 50Mather Field Road IC US 50 Mather
Field Road
US 50Mather Field Road PedestrianBike Crossing along
the Mather Airport RR Spur alignment
$0 $820 $1055 2015
ED ED County DOT
Sacramento Placerville
Transportation Corridor
Forni Rd
Missouri Flat Rd Class I Bike Trail $1423 $111 $1534 2009
ED City of Placerville
El Dorado Trail Western
Extension
Canal Street Main Street
Ray Lawyer DriveForni
Road Class 1 Bike Trail $1850 $0 $1850 2010
ED ED County DOT
US 50ED Hills Blvd IC US 50
El Dorado Hills Blvd
Latrobe Road
US 50El Dorado Hills Blvd Pedestrian Overcrossing $5508 $66 $5574 2014
TABLE 12 50 MOBILITY PARTNERSHIP KEY CAPITAL PROJECTS
RouteRoadway From To Project Description
NEAR TERM PRIORITY IMPROVEMENT PROJECTS
US 50 Sunrise Scott Road Auxiliary Lane
US 50 Hazel Avenue Interchange Improvements
Hazel Avenue Folsom Boulevard Easton Valley Parkway New 4 Lane Road
Easton Valley Parkway Hazel Avenue Rancho Cordova Parkway New 6 Lane Road
Rancho Cordova Parkway Easton Valley Parkway White Rock Road New 4 Lane Road
White Rock Road Sunrise Boulevard Silva Valley Parkway Widen to 4 Lanes
RT Gold Line Hazel Iron Point Station Passing Tracks
US 50 Rancho Cordova Parkway New Interchange
Zinfandel Drive South of International Douglas Road New 4 Lane Road
International Drive Kilgore Road Rancho Cordova Parkway New 6 Lane Road
Douglas Road Zinfandel Extension Sunrise Boulevard Widen to 4 Lanes
Sunrise LRT Citrus Road Sunrise Mall Bus Rapid TransitExpress Bus
[ 44 ] HIGHWAY 50 corridor system management plan
c h a p t e r s i x p l a n n e d c o r r i d o r s y s t e m m a n a g e m e n t s t r a t e g i e s
TABLE 12 50 mOBILITY PARTnERSHIP kEY CAPITAL PROjECTS (COnTInUED)
routeroadway from to Project Description
US 50 nEAR TERm PRIORITY ImPROVEmEnT PROjECTS
US 50 Empire Ranch Road New interchange
US 50 Silva Valley New interchange
US 50 Scott Road Empire Ranch Road Aux Lanes
US 50 Empire Ranch Road El Dorado Hills Boulevard Aux lanes and climbing lanes
US 50 El Dorado Hills Boulevard Silva Valley Parkway Aux lanes and climbing lanes
US 50 Silva Valley Parkway Bass Lake Road Aux lanes
Sunrise Boulevard White Rock Road Douglas Boulevard widen to 6 lanes
Sunrise Boulevard Douglas Boulevard Jackson Road widen to 4 lanes
White Rock Road Sunrise Boulevard Future Rancho Cordova Parkway and El Dorado County Line to Latrobe Road
widen to 4 lanes
Douglas Boulevard Sunrise Boulevard Grant Line Road widen to 4 lanes
Rancho Cordova Parkway Douglas Boulevard Rio del Oro Parkway New 2 lane road
Rancho Cordova Parkway Rio del Oro Parkway White Rock Road New 6 lane road
Jaeger Road Douglas Road Kiefer Boulevard New 4 lane road
Chrysanthy Sunrise Boulevard Americanos Boulevard New 4 lane road
Kiefer Boulevard Sunrise Boulevard Jaeger Road New 4 lane road
Grant Line Road Douglas Road Chrysanthy Road widen to 4 lanes
Hazel avenue Gold Country Boulevard Madison avenue widen to 6 lanes
Latrobe Road South of White Rock Road widen to 4 lanes
TABLE 13 VISIOnARY PROjECTS
County routeroadway from to Project Description
Sac yolo US 50 Enterprise Downtown Sacramento HOV Lanes
ED TBD Folsom Placerville Transit ndash Type TBD
ED New Road Latrobe Road White Rock Road (poten shy
tially US 50) New 2-lane road
HigHway 50 corridor system management plan [ 45 ]
c h a p t e r s i x p l a n n e d c o r r i d o r s y s t e m m a n a g e m e n t s t r a t e g i e s
[ 46 ] HigHway 50 corridor system management plan
Page Inte
ntionally
Left
Blank
congestion and bottleneck analysis
chapter seven
The 2000 Highway Capacity Manual defines a bottleneck
as ldquoa road element on which demand exceeds capacityrdquo
The bottleneck analysis evaluates specific causes of existshying recurrent traffic congestion in the corridor Freeway bottleneck locations that create mobility constraints are identified and documented and their relative contribution
to corridor-wide congestion is reported The bottleneck locations were determined based on a combination of the use of 2006 PeMS data HiCOMP report probe vehicle tach runs and field observations
Traffic congestion can be categorized as either recurrent
or non-recurrent
recurrent congestion occurs repeatedly at the same place and time of day in a predictable pattern Recurrent congesshytion is often associated with facility capacity limitations changes in capacity conflicting vehicle movements such
as lane merges inadequate number of transit vehicles to handle passenger loads or other persistent physical condishytions of the transportation facility
Non-recurrent congestion is usually attributed to collishysions equipment malfunction community events weather construction projects and other occasional occurrences When transportation systems are close to their maximum
carrying capacity non-recurrent congestion is more likely to occur as there is little excess capacity in the system
The location and extent of the bottlenecks on US 50 found
in the aM and PM peak periods are summarized in Tables 14 and 15 These depictions should be considered a snapshyshot view and not a comprehensive analysis of all bottleshynecks in the corridor Further work is being conducted to
refine the identification and causality of bottlenecks within
the corridor Table 14 shows a summary of the US 50 eastbound bottlenecks while the tables that follow discuss each bottleneck including location and possible causality Table 15 shows a summary of the US 50 westbound bottleshynecks while the tables that follow discuss each bottleneck including location and possible causality Minor or hidden bottlenecks are those Freeway bottleneck
that are not as defined locations that create (or severe) as the major mobility constraints bottlenecks Please note are identified and that the graphics accomshy documented and their panying the bottlenecks
relative contribution to are not to scale
corridor-wide congestion Major bottlenecks in the is reported eastbound direction during the aM peak period are at Howe avenue and during the PM peak period are at 48th Street Howe Avenue Mayhew Road Routier Road Sunrise Boulevard and El Dorado Hills Boulevard Major bottlenecks in the westbound direction during the aM peak period are at El Dorado Hills Boulevard Hazel Avenue Zinfandel Drive
HigHway 50 corridor system management plan [ 47 ]
c h a p t e r s e v e n c o n g e s t i o n a n d b o t t l e n e c k a n a l y s i s
Bradshaw Road and Howe Avenue and major bottleneck
locations during the PM peak period are at Zinfandel Drive Routier Road Bradshaw Road Howe Avenue and Intershystate 5
Causalities for these bottlenecks range from high-traffic
demand (congestion) heavy weavingmerging areas or physical constraints such as lane drops lack of ramp meters incomplete HOV network incomplete Auxiliary Lane
network poorly coordinated traffic signals and an off-ramp
queue (Sunrise Boulevard) US 50 Westbound Onramp
TABLE 14 US 50 EASTBOUnD BOTTLEnECk SUmmARY Source PeMS Caltrans tach runs and
Cambridge Systematics field observations
bottleneck Location PeMS Speed Contours Caltrans Probe Vehicle Runs
Cause aM PM aM PM
A Jefferson Blvd PM 25 Minor Minor Traffic weaving truck volumes and grade
B 48th St PM 7 Minor Major Minor Minor Merge from SR 51 and SR 99
C Howe ave PM 9 Major Major Major weave between Howe and watt
D Mayhew Rd PM 12 Major Minor Major Weaving before Bradshaw Exit
E Routier Rd PM 14 Minor Major Weaving before Mather Field Rd Exit
F Sunrise Blvd PM 185 Minor Major Lane drop HOV add off-ramp queue
G Folsom Blvd PM 22 Minor Minor Lane drop 4 to 3
H El Dorado Hills Blvd PM 275 Major
Poorly coordinated traffic signal on arterial causes spillback onto freeway
a jefferson blvd bottleneck The bottleneck approximately located at Jefferson Blvd is due to weaving traffic as those entershying the freeway from Jefferson Blvd must cross those attempting to exit the freeway to I 5 There is a large number of trucks in the stream which struggle with the grade at this location exacerbatshying the bottleneck
[ 48 ] HigHway 50 corridor system management plan
c h a p t e r s e v e n c o n g e s t i o n a n d b o t t l e n e c k a n a l y s i s
b 48th St bottleneck The bottleneck approximately located at 48th St is due to the additional traffic merging from SR 51 and SR 99 combined with the eventual lane drop at 59th St This queue extends upstream past the off-ramp to SR 5199 These off-ramps are bottlenecks in themselves which spill back and choke the US 50 mainline
C Howe Ave Bottleneck The bottleneck at Howe ave is due to the entering traffic from Howe Ave Two Howe Ave on-ramps feed into US 50 eastbound southbound Howe ave loop on-ramp and northbound Howe ave direct ramp approximately 300 feet apart The watt avenue off-ramp is just down stream with heavy exiting volumes therefore the segment between Howe and watt is characterized by heavy weaving
D mayhew Rd Bottleneck The bottleneck approximately located at Mayhew Rd most likely begins with the additional traffic entering from Watt Ave and ends with the exiting traffic at Bradshaw Rd It is possible that there is a high proportion of weaving traffic with in this section (Watt Ave traffic moving to the left lane and those exiting at Bradshaw Rd moving to the right lane)
HigHway 50 corridor system management plan [ 49 ]
c h a p t e r s e v e n c o n g e s t i o n a n d b o t t l e n e c k a n a l y s i s
[ 50 ] HigHway 50 corridor system management plan
e routier rd bottleneck It is likely that the bottleneck at Routier Rd is due to the same merging conditions associated with Mayhew Rd The area is comprised of both residential and light industrialoffice land uses therefore during the PM peak period there are large volumes of vehicles entering at Bradshaw Rd moving to the left lanes and large volumes of vehicles moving to the right lane to exit at Mather Field Rd
f Sunrise blvd bottleneck At Sunrise Blvd the right-most lane exits while an HOV lane is added as the median lane The bottleneck is formed from vehicles shifting left to avoid exiting at Sunrise Blvd and to enter the HOV lane There is a large volume of vehicles queued at the Sunrise off-ramp which spills back and negatively affects the US 50 mainline
g folsom blvd bottleneck The right-most lane exits to Folsom Blvd leaving one HOV lane and two regular lanes along the US 50 The bottleneck is caused by this lane drop as well as the quick merge at the Folsom on-ramp
c h a p t e r s e v e n c o n g e s t i o n a n d b o t t l e n e c k a n a l y s i s
H The eastbound US 50 at El Dorado Hills Blvd Bottleneck The eastbound El Dorado Hills Blvd bottleneck is caused by a traffic signal on the arterial that often causes spillbacks on the EB loop offramp onto the freeway mainlines
TABLE 15 US 50 WESTBOUnD BOTTLEnECk SUmmARY Source PeMS Caltrans tach runs and Cambridge Systematics field observations
bottleneck Location PeMS Speed Contours Caltrans Probe Vehicle Runs
Cause aM PM aM PM
A El Dorado Hills Blvd PM 275 Major Poorly coordinated traffic
signal on El Dorado Hills Blvd
B Hazel Ave PM 21 Major Entering traffic
C Zinfandel Dr PM 16 Minor Major Major Major Entering traffic
D Routier Rd PM 14 Minor Major Minor Weaving traffic
E Bradshaw PM 13 Major Major Major Merging traffic and curve
F Howe Ave PM 9 Minor Major Major Major Weaving traffic and grade
G SR 51SR 99 PM 6 Minor Lane drop weaving traffic
H i-5 PM 3 Major Weaving traffic
HigHway 50 corridor system management plan [ 51 ]
c h a p t e r s e v e n c o n g e s t i o n a n d b o t t l e n e c k a n a l y s i s
[ 52 ] HigHway 50 corridor system management plan
A El Dorado Hills Blvd Bottleneck The minor bottleneck at El Dorado Hills Boulevard is caused by the traffic signal on El Dorado Hills Blvd that causes spillback on the westbound offramp onto the freeway mainlines
B Hazel Avenue Bottleneck In 2006 the Hazel Ave Bottleneck is caused by the traffic entering at both Hazel Ave and Folsom Blvd (the two on-ramps are separated by about one mile) The bottleneck that would appear at Folsom Blvd combines with the bottleneck at Hazel ave to form a large bottleneck that does not clear until after Hazel ave Sometimes causshying spillbacks as far as Prairies City Road this bottleneck was mitigated in 2007 as part of the GO CALIFORNIA program
C Zinfandel Dr Bottleneck There is heavy traffic coming from Sunrise Blvd but the lane addition immediately after the westbound on-ramp prevents a bottleneck from forming but as traffic flows westward the heavy traffic entering from Zinfandel Dr causes a bottleshyneck here
D Routier Rd Bottleneck The bottleneck at Routier Rd is caused by weaving traffic between Mather Field Rd and Bradshaw Rd This highway segment represents a transition area where vehicles that have been traveling in the left lanes begin to shift to the right lanes to exit while the entering traffic tries to shift to the left lanes
W eav in gLan e Dr o p
c h a p t e r s e v e n c o n g e s t i o n a n d b o t t l e n e c k a n a l y s i s
e bradshaw rd bottleneck The Bradshaw Rd bottleneck is caused by the entering traffic from Bradshaw Road the high truck volumes and the curve west of Bradshaw Two Bradshaw Rd on-ramps feed into US 50 westshybound southbound Bradshaw Rd direct on-ramp and northbound Bradshaw Rd loop on-ramp approximately 400 feet apart
F Howe Ave Bottleneck The Howe ave bottleneck is caused by a grade change and the weaving traffic entering from Howe ave and Hornet Dr competing for the right-most lane with those wanting to exit at 65th Street
G amp H SR 51SR 99 amp I-5 Bottleneck The bottleneck at I 5 is caused by the conflict between entering SR 99 and SR 51 traffic and exiting I-5 traffic as well as the queues formed on the ramps to i-5 which spill back onto US 50 The number of lanes in this section reaches a maximum of 6 and then drops to 4 as two lanes exit at the I-5 freeway This bottleneck is exacershybated during the peak periods when it stretches upstream to the lane drop before SR 99
W ea v in g
Lan e Dr o p
HigHway 50 corridor system management plan [ 53 ]
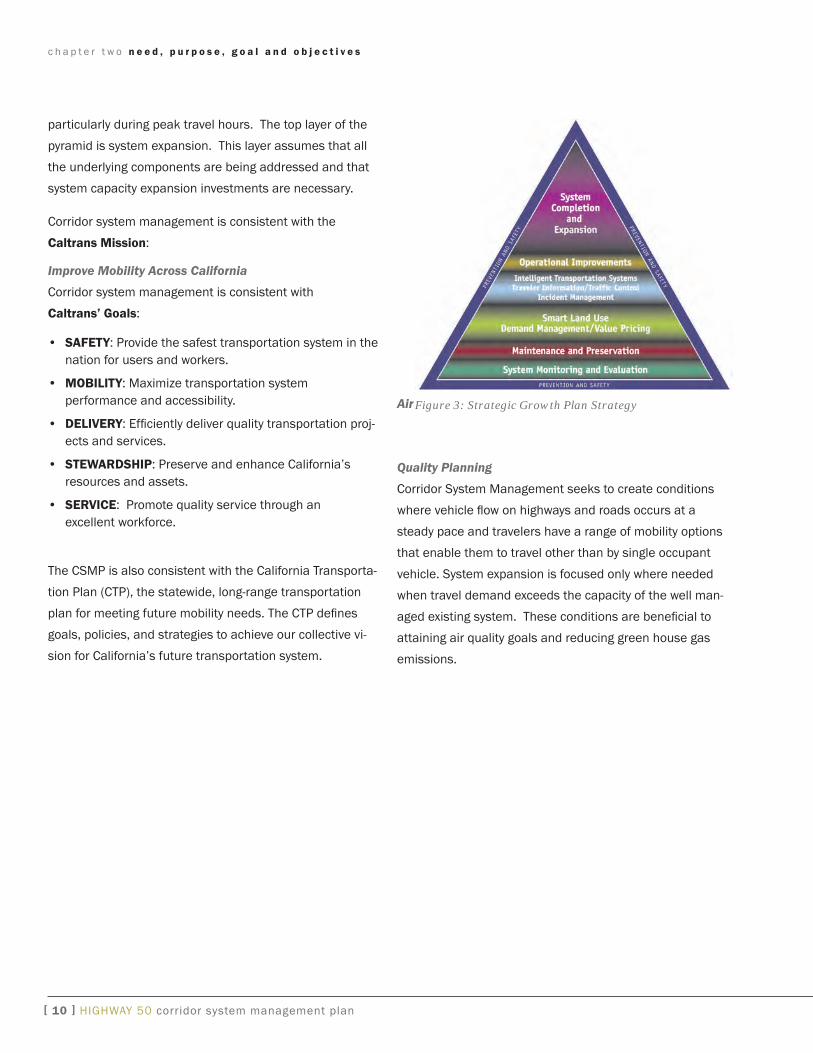
c h a p t e r t h r e e c u r r e n t c o r r i d o r s y s t e m m a n a g e m e n t s t r a t e g i e s
Try Transit Changeable Message Sign in Sacramento County
Sacramento County installed pre-emptive traffic signals to give preferential signal timing to transit buses at selected locations that serve high priority transit corridors
SACOG manages the 511 and rideshare programs that cost approximately $1 million per year region-wide to foster carpooling transit ridership vanpooling and bicycling in all areas and corridors The Regional Rideshare Program covers Placer El Dorado Sacramento yolo yuba and Sut-ter counties it is part of a statewide network of rideshare agencies which encourage alternative transportation modes for traveling
Park and Ride lots are located adjacent to or nearby the US 50 corridor utilized by commuters to connect with transit vanpool or carpool Of the sixteen lots many are adjacent to the SacRT Light Rail gold Line providing access for commuters to park their vehicles and commute the re-mainder of their trip via Light Rail El Dorado County Transit authority also uses the park and ride lots as transit stops for their Commuter Buses The locations capacity and occupancy rates of the Park and Ride lots are displayed in Table 3
Bicycle Facilities Bicycle facilities in the corridor are not actively managed in the same manner as motor vehicle facilities
However there are traffic operation systems that serve bicyclists such as dedicated bicycle lanes bicycle detec-tion loops at signalized intersections video detection other non-loop type detection and bicyclist activated signal change buttons The City of Sacramento is installing video detection at some locations
SacRT buses and the new light rail trains are equipped with bicycle racks There are over 170 weatherproof bicycle lock-ers at 23 light rail stations yCTD has the Bikes on Buses Program that allows bicycles to travel on any yOLOBUS
The Sacramento area Bicycle advocates maintain an on-line hazard reporting system to allow users to report hazardous locations for bicyclist such as potholes inad-equate signal timing hazardous railroad crossings insuf-ficient shoulder and inadequate bikeway markings The reports are then sent to the applicable jurisdiction SaCOg is creating an on-line route planning system for bicyclists in addition SaCOg maintains bicycle maps on their website which are currently being updated
The bicycle routes included in the CSMP network are shown on Figures 6 and 7
Pedestrian Facilities Pedestrian facilities are not included as part of the man-aged network because they do not directly provide corridor mobility However complete and safe pedestrian access to appropriate corridor modes such as bike routes and transit services is an important component of corridor system management Therefore subsequent updates of the CSMP will seek to identify key pedestrian facilities and barriers to pedestrian mobility with regard to access and modal con-nectivity
HigHway 50 corridor system management plan [ 15 ]
c h a p t e r t h r e e c u r r e n t c o r r i d o r s y s t e m m a n a g e m e n t s t r a t e g i e s
[ 16 ] HigHway 50 corridor system management plan
Page Inte
ntionally
Left
Blank
MAIN ST
MA
RB
LE V
ALL
EY
RD
65TH ST EXPY
FLYING
C R
D
STATE
HW
Y 16
MA
RB
LE VA
LLEY R
D
CAM
BRID
GE R
D
GREEN VALLEY RD
RIV
ERSI
DE
BLVD
11T
H S
T
RIV
ERSI
DE
BLVD
HO
WE
AV
E
EL DORADO
HILLS BLVD
EL DORADO H
ILLS BLV
D
HORNET DR
JEFF
ERSO
N BL
VD
CAM
ERO
N PAR
K DR
PO
WE
R IN
N R
D
CO
UN
TY HW
Y E3
BRADSHAW RD
MATHER FIELD RD
ZINFAN
DEL D
R
11TH
ST
VD
FOLSOM BLFOLSOM BLVD
FOLSOM BLVD
FOLSO
M BLVD
WHITE ROCK RD
FOLSOM BLVD
FOLS
OM
BLV
D
LATRO
BE RD
CANAL ST
16TH
ST
JACQ
UIER
RD
15TH
ST
HARBOR BLV
D
STOCKTON BLVD
FORNI RD BIDW
ELL DR
WATT AVE
PLACERVILLE DR
TOW
ER G
ATEW
AY
SHIN
GLE SPR
ING
S DR G
REEN
STON
E RD
59TH
ST
SUN
RISE BLVD
EL D
OR
AD
O R
D
HAZEL AVE
SOUT
H RI
VER
RD
PON
DER
OSA R
D
SHIN
GLE SPR
ING
S RD
SHIN
GLE
SPR
ING
S R
D
CARSON RD
MISSO
URI FLAT RD
BASS LAKE RD
N SH
ING
LE RD
PRAIR
IE CITY R
D
S SHIN
GLE R
D
SHIN
GLE
RD
SCOTT RD
W S
T AT
5TH
ST
65TH
ST
5TH
ST
X
ST A
T 27
TH
80
CEDAR GROVE EXIT
MO
SQU
ITO R
D
PLACERVILLE DRMISSOURI
FLAT RD
FORNIRD
EL D
OR
AD
OR
D
POIN
T VIEW D
RSM
ITH FLAT R
D
SCH
NELL SC
HO
OL R
D
MO
NTER
EY RD
c h a p t e r t h r e e c u r r e n t c o r r i d o r s y s t e m m a n a g e m e n t s t r a t e g i e s
Figure 4 Existing Traffic Operations Systems Elements
Highway 50 Corridor Systems Management Plan Existing Traffic Operations Systems Excluding Ramp Meters
TOS ndash Traffic Operations Systems
Stations Continuous Coverage
EMS ndash Extinguishable Message Sign WIM ndash Weigh-in-Motion Location (EMS Usually Refers Motorist to HAR)
Television System
19365TMS ndash Traffic Monitoring99 US Highway 50VS ndash Fog (Visibility) Sensor
CCTV ndash Closed Circuit
I-80 to Cedar Grove Exit HAR ndash Highway Advisory Radio Local Road Interchange Access
White Rock RdRWIS ndash Roadside WeatherCMS ndash Changeable Sunrise Blvd to Latrobe Rd
Message Sign Information System
50
80
51
49 160
50
Placerville to Cedar Grove Exit
50
1935
16 49
99
84 160
49 MilesMiles 0 1 2 3 4 50 1 2 3 4 5 10
HigHway 50 corridor system management plans [ 17 ]
124 49
MOTHER LODE DR
MATHER FIELD RD
West Terminus
RAMP
RAMP
RAMPRAMP
RAM
P
RAMP
RAM
P RAMP
RAMPRAMP
RA
MP
RAM
P RAM
P
RAMP
RAM
P
RAM
P
RA
MP
RAM
P
RAM
P
YoloBus Express Routes Plus Routes 42A and 42B
RAMPBROADWAY
65TH
ST
PCE
65
SCRY42A
Y44Y4343
242 IPC
5
W STX ST
WATT AVE
MAROCKINGHAM
DR
OLD PLACER
BRADSHAW RD
VILLE RDTHER FIELD RD
INTERNATIONAL DR
ZINFANDEL DR
WHITE ROCK RD FOLSOM BLVD FOLSOM BLVD
SUNRISE BLVD
BLUE R
AVIN
E RD
WHITE ROCK RD
SC
OTT R
D
PR
AIR
IEC
ITY R
D
LATROBE RD
GREEN V ALLEY RD
PLACERVILLE DR
FORNI RDM
AIN ST
BROADWAY
CEDAR GROVE EXIT
WEST
CAPTOL AVE
(WESTMOST
STOP)
(WESTMOST STOP)
SCR
SCR
IPC
IPC
c h a p t e r t h r e e c u r r e n t c o r r i d o r s y s t e m m a n a g e m e n t s t r a t e g i e s
Figure 5 US 50 CSMP Network Transit Routes
Highway 50 Corridor System Management Plan 80
CSMP Commuter Transit Network
El Dorado County Transit Authority 65
IPC Iron Point Connector
SCR Sacramento Commuter Route 193
Sacramento Regional Transit District 109ndashHazel Express
Yolo Bus (Express) Y43 Y44 Y230 Y231 and Y232
Yolo Bus (All-Day Intercity amp Airport Service) Y42A (Clockwise) Y42B (Counter-clockwise)
LATROBE RD
Park-and-Ride Lots
193 65
49 US Highway 50 (I-80 to Cedar Grove Exit)
Parallel Roads
Light Rail STation
Light Rail
Class I Bikeways Other State Highways
County Lines
80
49
50
80160
50
5 84 16
4999
Miles 0 5 10160
HigHway 50 corridor system management plans [ 18 ]
K
5
FOLSOM BIKE TRAIL
SEE CENTRAL CITY BICYCLENETWORK MAP FOR BICYCLE
F ACILITY NAMES
AMERICAN RIVER PARKWAY TRAIL SYSTEM
(INCLUDING JE
DEDIAH SMITH MEMORIAL T
RAIL)
FOLSOM BLVD
WHITE ROCK RDSIL V A V ALLEY PKWY
EL D
OR
AD
O H
ILLS B
L VD
GREEN VALLEY RD
AMERICAN R
IVER PARKWAY
TRAIL
SYSTEM
(INCLU
DING JE
DEDIAH SMITH
MEMORIA
L TRAIL)
NATOMA ST
FOLSOM BLVD
EL DORADO TRAIL
CARSON RD
PLACER VILLE RD
RAY
LAW
YER
DR
c h a p t e r t h r e e c u r r e n t c o r r i d o r s y s t e m m a n a g e m e n t s t r a t e g i e s
Figure 6 US 50 CSMP Network Bicycle Routes
Highway 50 Corridor System Management Plan
Bicycle Route Network
Class I Bicycle Facilities
Class II Bicycle Facilities
193
Lincoln
65
Rocklin
Auburn
Folsom 49
193
Light Rail Stations
Light Rail Loomis50
RosevilleUS Highway 50 CSMP Corridor
Other State Highways Miles
County Lines 0 1 2 3
99
49 80
50
160 80 193
Placerville 50
West Rancho 50 Sacramento Cordova
5 0 49
8 4
9 9 Sacramento
1 6 4 9
0 1 2 Miles
3
1 6 0 Elk Grove 210 210 44 66 88
Miles 10 Miles
10 1 2 4
4 9
HigHway 50 corridor system management plans [ 19 ]
13TH
ST
H ST E ST BELVEDERE AVE
51ST
ST
BROADWAY H ST
48TH
ST
11TH
ST
PO
WE
R IN
N R
D
28TH
ST
STOC
KTON
BLVD3R
D ST
ALH
AMBR
AFR
ON
T BLV
D S
T
W CAPITOL A VE
DISCOVER Y
P ARK BRIDGE
JEDED
IAH
N ST
T ST
K ST
11TH
ST
RIV
ERSI
DE
BLV
D
18TH
ST
R S
T17
TH S
TO
ST
18TH
ST
20TH ST
CAPITOL AVE
T ST
28TH
ST
34TH
ST
39TH
ST
M ST
BROADWAY
T ST
FOLSOM BLVD
58TH
ST
J ST
65TH
ST
CSU
S
CO
NN
ECTIO
NS
SR 16JACKSON HWY
FOLSOM BLVD
LA RIVIERA DR
W ATT AV
E
HO
WE A
VE
GUY W
EST B
RIDE
COLLEGE TOWN DR
c h a p t e r t h r e e c u r r e n t c o r r i d o r s y s t e m m a n a g e m e n t s t r a t e g i e s
Figure 7 US 50 CSMP Network Bicycle Routes (Sacramento Insert)
5 Sacramento
8 0
8 0
160
West Sacramento
80
SMITH MEMORIAL TRAIL
50
US Highway 50 Corridor System Management Plan 50
Central City Bicycle Route Network 50
Bikeway and Multi-Use Network
US Highway 50 (I-80 to Cedar Grove Exit)
Class I Bicycle Facilities
Class II Bicycle Facilities
Connecting Routesndashno Bicycle Designation
80 16 5
BROADWAY
FLOR
IN-P
ER
KIN
S R
D
Light Rail STation 99
Light Rail
Other State Highways
County Lines
HigHway 50 corridor system management plans [ 20 ]
major corridor mobility challenges
chapter four
High demand for mobility services especially during peak commute periods is creating significant traffic congestion
and impairing mobility in the corridor Heavy congestion and stop-and-go traffic contributes to increased vehicle
emissions and added travel costs Many transit services are operating at maximum passenger carrying capacity and buses often must contend with the same congestion as autos in many locations bicyclists have to compete for space on these same facilities
Much of the congestion can be attributed to population growth residential and commercial development job housing imbalances work schedules that require commute trips during peak travel times recreational trip generators and truck traffic
The overall amount of travel in the corridor has increased dramatically over the past ten years and is expected to
continue to increase as the region adds approximately
one million new residents over the next 25 years per the current SACOG MTP 2035 Traffic congestion per houseshyhold is expected to increase 18 percent over 2005 levels
by the year 2035
in the general area of eastern Sacramento County and western El Dorado County the Highway 50 Partnership
has projected growth of 78000 more dwelling units and 53000 new jobs over the next 25 years Current and foreshycasted data is depicted in Table 4
The sections of US 50 with particularly severe traffic
congestion are depicted in Figures 8 and 9 These are
also summarized in greater detail in Tables 14 and 15 in Chapter 7 Table 14 shows a summary of the US 50 eastbound bottlenecks while the tables that follow discuss each bottleneck including location and possible causality Table 15 shows a summary of the US 50 westbound bottleshynecks while the tables that follow discuss each bottleneck including location and possible causality Minor or hidden bottlenecks are those that are not as defined (or severe) as the major bottlenecks Please note that the graphics acshycompanying the bottlenecks are not to scale
a critical component of identifying and resolving Traffic congestion per corridor mobility challenges household is expected is the need for detailed to increase 18 percent data analysis and comshy over 2005 levels by the munication regarding
year 2035system performance Data collection is insufficient to
fully meet these needs but still provides useful information as detailed in the following pages improving data gathershying analysis and dissemination of information is a major challenge for this corridor and is a component of intelligent Transportation Systems planning
HigHway 50 corridor system management plan [ 21 ]
c h a p t e r f o u r m a j o r c o r r i d o r m o b i l i t y c h a l l e n g e s
[ 22 ] HigHway 50 corridor system management plan
Figure 8 US 50 AM Peak Period Bottleneck Locations
Figure 9 US 50 PM Peak Period Bottleneck Locations
Challenges along the corridor include
bull severe recurrent highway and roadway traffic congestion
bull an incomplete buscarpool lane system
bull an incomplete set of freeway auxiliary lanes
bull loss or dropping of freeway lanes at specific locations
bull incomplete ramp metering
bull limited parallel roadway capacity
bull lack of signal coordination on key arterials and freeway ramp intersections
bull transit facilities approaching capacity
bull inadequate transit capital and operations funding needed to grow transit ridership
bull light rail at-grade crossings
bull lack of adequate access to transit across US 50
bull lack of double tracking of the light rail Gold Line to Folsom
bull poor pavement and road and bicycle route maintenancesweeping
bull lack of sufficient bicycle activated signal change devices
bull motorist driving behavior
bull inadequate bicycle storage
bull inadequate bicycle and pedestrian access to transit and
bull gaps and barriers within the bicycle route network
Additionally the EDCTC has identified safety and operashytional issues between the Smith Flat interchange and east of the Upper Carson RoadCamino intersection in the
Camino Area Parallel CapacitySafety Study Transporshytation issues include at-grade access to US 50 left turn conflicts across US 50 increasing average daily local and
interregional traffic growth in the area lack of alternate
routes seasonal traffic to and from Apple Hill and other local events and seasonal access to recreation in the Lake
Tahoe Region
c h a p t e r f o u r m a j o r c o r r i d o r m o b i l i t y c h a l l e n g e s
Table 4 CUrrenT and ForeCaSTed TraFFiC daTa
location Current Traffic data ndash 2007 Future Traffic data ndash 2027 (no build) Future Traffic data ndash 2027 (build)
County description amp location of Trucks
Peak directional
Split
Peak Hour Traffic
average annual daily
Traffic2
Volume over Capacity3
Peak Hour Traffic
average annual daily Traffic2
Volume over Capacity3
(no-build)
Peak Hour Traffic
average annual daily
Traffic2
Volume over Capacity3
(build)
yOL interstate 80 to yoloSacramento County Line
6 60 15500 180000 109 23911 277032 169 24070 278880 136
SaC yoloSacramento County Line to State Routes 99 and 51
4 59 21000 253000 135 28080 312480 186 29153 324415 193
SaC State Routes 99 and 51 to watt avenue 4 59 20600 225000 145 27942 286230 189 30648 313950 166
SaC watt avenue to Zinfandel Drive 4 59 16700 187000 115 24783 274540 163 25885 286750 136
SaC Zinfandel Drive to Sunrise Boulevard 4 60 13500 149000 093 20331 224394 133 20925 230950 110
SaC Sunrise Boulevard to Folsom Boulevard 4 66 11900 125000 089 18888 198247 131 20086 210820 140
SaC Folsom Boulevard to SacramentoEl Dorado County Line
3 66 8800 95000 087 13341 151311 133 13612 154380 136
ED SacramentoEl Dorado County Line to Cameron Park Drive
4 61 6900 70000 095 11454 116200 165 11834 120050 114
ED Cameron Park Drive to Missouri Flat Road
4 62 5700 62000 092 8647 94054 132 9462 102920 096
ED Missouri Flat Road to End of Freeway in Placerville
4 57 4850 59000 069 7101 76245 098 7363 79050 102
ED End of Freeway in Placerville to Bedford avenue
4 55 4800 52000 Na 4 6595 74196 Na4 6648 74790 Na4
ED Bedford avenue to Cedar grove Exit 4 62 3800 38500 077 5474 50782 099 5520 51205 099
1 Peak Directional Split The percentage of total traffic in the heaviest traveled direction during the peak hour2 Average Annual Daily Traffic (AADT) The average number of vehicles per day in both directions 3 Volume over Capacity (VC) The volume of traffic compared to the capacity of the roadway4 Volume over Capacity does not determine LOS for two- or three-lane facilities or segments with intersection delay 5 Reported Collision Rate index ( Compared to State average) The percentage by which each segmentrsquos reported collisions rate (fatal injury and property damage only) is above or below the statewide average reported collisions rate on comparable facilities
Source 3-Year Caltrans Traffic Accident Surveillance and Analysis System data
HigHway 50 corridor system management plans [ 23 ]
c h a p t e r f i v e p e r f o r m a n c e m e a s u r e s
Page Inte
ntionally
Left
Blank
[ 24 ] HigHway 50 corridor system management plan
performance measures
chapter five
Continuing corridor monitoring and performance mea-
sures are an integral part of corridor management and investment decision making and help identify immediate efficient and effective system operational strategies and
capital improvements Performance measures provide the
important dynamic daily information needed to rapidly
address operational problems caused by recurrent and
non-recurrent traffic congestion Measures are also used to identify the best improvement actions to generate the desired results
Table 5 identifies the performance measures to be used as
part of the corridor system management process
Baseline Data For perFormance measures Tables 6 7 and 8 display baseline data for the perforshymance measures for the CSMP transportation network
The performance data was primarily compiled from the SACMET demand based traffic model the year 2007
edition of the Traffic Volumes Manual the year 2000 edition of the Highway Capacity Manual Caltrans Traffic
Accident Surveillance and Analysis System (TASAS) the 2007 Caltrans Division of Maintenance Pavement Summary Report and ridership records provided by the transit providers
additional performance Performance Measures data was derived from the provide the important Performance Measurement dynamic dailySystem (PeMS) tool an
information needed internet based tool used to
to rapidly addresshost process retrieve and operational problemsanalyze road traffic condishy
tions information from caused by recurrent
real-time and historical and non-recurrent data PeMS obtains 30-sec- traffic congestion ond loop detector data in real-time from detectors installed along the highway corridor
It should be noted that Average Daily Traffic (ADT) and LOS
for some ParallelConnecting Roadways segment locations
in Table 7 was not available These are noted ldquoNo Datardquo
Data collection for non-auto modes is not as robust as what is needed for active system management Subsequent updates of this CSMP will seek to expand the
availability of transit and bicycle performance data collection
HigHway 50 corridor system management plan [ 25 ]
mdash
c h a p t e r f i v e p e r f o r m a n c e m e a s u r e s
TABLE 5 PERFORmAnCE mEASURES DEFInITIOnS AnD APPLICABILITY
Performance Measure Definition of Performance measure applicability to Corridor
STATE HIGHWAY SYSTEm
LOS A ldquoreport cardrdquo measurement with ldquoArdquo being the least amount of
congestion and ldquoFrdquo being the most congestion LOS is a relatively simple and widely used measure which
offers comparison opportunities
Total Vehicle Hours of Delay The additional travel time in hours experienced by all vehicles on the highway segment per day or at peak hour due to congestion
This measurement is used to determine the cost in time which congestion can add to the regular travel time that it takes to traverse a segment of road and is useful in
quantifying the performance of a particular roadway in an understandable format
Total Person Minutes of Delay The additional travel time in minutes experienced by all persons in vehicles on the highway segment per day or at peak hour due
to congestion
This measurement is used to determine the cost in time which congestion can add to the regular travel time that it takes to traverse a given segment of road and is useful in quantifying the performance of a particular roadway in an
understandable format and for comparison of improvement options
Minutes of Delay per Vehicle The additional travel time in minutes experienced by each vehicle on the highway segment at peak hour due to congestion
This measurement is used to determine the cost in time which congestion can add to the regular travel time that it
takes to traverse a given segment of road
Minutes of Delay per Person The additional travel time in minutes experienced by each person in vehicles on the highway segment at peak hour due to congesshy
tion
This measurement is used to determine the cost in time which congestion can add to the regular travel time that it
takes to traverse a given segment of road
Vehicle Travel Time (Minutes) The average time spent by vehicles traversing between two points on a road or highway
Travel time is a measure used to quantify travel time deficienshycies and provide a personal indicator of congestion impacts
Distressed Pavement Pavement that rides rougher than established maximums and or exhibits substantial structural problems as determined by the
Pavement Condition Survey
This measurement provides a ride quality indicator and an indicator for structural roadway problems
Reported Collision Rate Comparison of the actual total collision rate () along a highway segment above or below the statewide average for fatal injury
and property damage-only collisions on comparable facilities
Comparing the total collision and rate with statewide average rate provides an opportunity to assess safety conditions
through the corridor
Reliability Identifies day-to-day variation in travel time for the same trip at the same time of day Focuses on the predictability of travel time
particularly for repetitive trips
Estimates reliability by defining the extra time travelers must add to their average travel time when planning trips to ensure on-time arrival (0 percent no day-to-day variations
100 percent double allotted travel time)
Lost Productivity Measures the capacity of the corridor to accommodate vehicle or person throughput and is calculated as actual volume divided by
the capacity of the highway
As traffic volumes increase to roadway capacity speeds decline rapidly and vehicle throughput drops dramatically which increases traffic congestion and delay and results in
lost productivity
[ 26 ] HigHway 50 corridor system management plan
mdash
c h a p t e r f i v e p e r f o r m a n c e m e a s u r e s
HigHway 50 corridor system management plan [ 27 ]
TABLE 5 PERFORmAnCE mEASURES DEFInITIOnS AnD APPLICABILITY (ConTInued)
Performance Measure Definition of Performance measure applicability to Corridor
PARALLEL AnD COnnECTInG ROADWAYS
LOS A ldquoreport cardrdquo measurement with ldquoArdquo being the least amount of
congestion and ldquoFrdquo being the most congestion LOS is a relatively simple and often used measure which
offers comparison opportunities
traNSit
available Capacity Ratio () of available transit capacity alternatives within the corridor
This measure indicates the available capacity to accommoshydate diverted travelers from single occupant vehicles
c h a p t e r f i v e p e r f o r m a n c e m e a s u r e s
[ 28 ] HigHway 50 corridor system management plan
Page Inte
ntionally
Left
Blank
c h a p t e r f i v e p e r f o r m a n c e m e a s u r e s
Table 6 US 50 PerForManCe MeaSUreS
County location Post Miles
distance (Miles)
average annual daily Traffic1
PerForManCe MeaSUreS
loS1
Total Vehicle Hours of delay2
Total Person Minutes of delay2
Minutes of delay per Vehicle2
Minutes of delay per Person2
Vehicle Travel Time (Minutes)2 distressed
Pavement (lane
Miles)4
reported Col-lision rate
Comparison ()5
reliability6 lost Productivity7
daily Peak Hour3 daily Peak
Hour3 Peak Hour3 Peak Hour3 Peak Hour3 eastbound westbound lost lane Miles aM
Peak Period
lost lane Miles PM
Peak Period
STaTe HigHway SySTeM
yOL interstate 80 to yolo Sacramento County Line
000 to 316 316 180000 F 1169 126 95363 8061 049 046 36 9 26 62 22 01 0
SaC
yoloSacramento County Line to State Routes 99
and 51
L000 to L248 R000
248 253000 F 4993 653 407455 41746 186 175 43 7 20 64 60 53 76
State Routes 99 and 51 to watt avenue
R000 to R534 534 225000 F 10097 1362 823883 87105 397 372 93 15 24 60 48 81 68
watt avenue to Zinfandel Drive
R534 to R1092 558 187000 F 8075 977 658886 62506 351 329 91 19 -32 56 42 44 23
Zinfandel Drive to Sunrise Boulevard
R1092 to 1250 158 149000 E 1271 197 103727 12610 088 082 25 9 -33 46 13 0 16
Sunrise Boulevard to Folsom Boulevard
1250 to 1701 451 125000 E 3087 356 251940 25832 180 149 63 5 -14 60 46 1 45
Folsom Boulevard to SacramentoEl Dorado
County Line
1701 to 2314 613 95000 D 583 122 47537 8867 083 069 70 0 -11 19 55 0 08
ED
SacramentoEl Dorado County Line to Cameron
Park Dr
000 to R657 657 70000 E 504 126 41150 9138 110 091 77 1 -35 PeMS Data
Unavailable PeMS Data Unavailable
PeMS Data Unavailable
PeMS Data Unavailable
Cameron Park Drive to Missouri Flat Road
R657 to R1506 849 62000 E 302 75 24633 4827 079 075 93 2 -61 PeMS Data
Unavailable PeMS Data Unavailable
PeMS Data Unavailable
PeMS Data Unavailable
Missouri Flat Road to End of Freeway in Placerville
R1506 to 1725 219 59000 D 66 16 5376 1053 020 019 24 1 20 PeMS Data
Unavailable PeMS Data Unavailable
PeMS Data Unavailable
PeMS Data Unavailable
End of Freeway in Placerville to Bedford avenue
1725 to 1811 086 52000 D 68 17 5585 1094 021 020 15 2 81 PeMS Data
Unavailable PeMS Data Unavailable
PeMS Data Unavailable
PeMS Data Unavailable
Bedford avenue to Cedar grove Road
1811 to R2595 784 38500 D 58 15 4758 932 023 022 85 10 6 PeMS Data
Unavailable PeMS Data Unavailable
PeMS Data Unavailable
PeMS Data Unavailable
TOTaL mdash 5473 mdash mdash 30273 4042 2470293 263771 1587 1449 7150 80 mdash mdash mdash mdash mdash
1 Source Average Annual Daily Traffic and Level of Service (LOS) calculated is based on 2007 Caltrans Traffic Volumes on California State Highways and Highway Capacity Manual and Cambridge Systematics from 2008 Reported LOS is for the typical most congested daily peak travel period 2 Source Delay is the average additional travel time by vehiclespersons traveling under 60 mph Data derived from 2007 HICOMP report SACMET Travel Demand Model PeMSs traffic data and Caltrans District 3 Traffic Operations Probe vehicle Tach runs 3 Peak Hour is during PM 4 Source 2007 Caltrans Division of Maintenance Pavement Summary Report 5 Source 2004 through 2007 Caltrans Traffic Accident Surveillance and Analysis System summary data of the percentage above or below the statewide average for fatal injury and property damage-only collisions on comparable facilities 6 Reliability The Planning Time Index is a measure of the reliability of the travel time on a particular route It is the ratio of the 95th percentile of travel time on a route to the median free-flow travel time This means itrsquos the amount of time a traveler needs to allocate for a route if they want to show up on time 19 out of 20 trips Reliability and Planning Time data was taken from April 2007 The data covered a 24-hour period of time on each Tuesday wednesday and Thursday of that month That data was then aggregated into a single average 24-hour day it was then analyzed to determine the highest average aM and PM travel time That time was then compared to the best possible average travel time to determine the additional time that was spent traveling the same seg-ment 7 Lost Productivity Data taken April 2007 PeMS As traffic increases to the capacity of the highway speeds decline throughput drops dramatically and the efficiency of the highway to provide mobility decreases This decline in the potential carrying-capacity of the freeway is expressed in terms of how many equivalent lane miles of roadway are lost
HigHway 50 corridor system management plans [ 29 ]
c h a p t e r f i v e p e r f o r m a n c e m e a s u r e s
Table 7 Parallel and ConneCTing roadwayS PerForManCe MeaSUreS
County location average
daily Traffic1
PerForManCe MeaSUreS
loS1
Total Vehicle Hours of delay2
Total Person Minutes of delay2
Minutes of delay per Vehicle2
Minutes of delay per Person2
Vehicle Travel Time (Minutes)2
distressed Pavement
(lane Miles)4
daily Peak Hour3 daily Peak
Hour3 Peak Hour3 Peak Hour3 Peak Hour3
Parallel and ConneCTing roadwayS
yOL west Capitol Enterprise Boulevard to Capitol Mall 13737 No Data
Data is unavailable for these performance measures at this time however will be pursued in the next phase of the CSMP
SaC
w 5th Street to 26th Street 9194 a
X 5th Street to 26th Street 9154 a
Folsom Boulevard watt avenue to Bradshaw Road 25600 C
watt avenue Folsom Boulevard to US 50 63900 F
Bradshaw Road Folsom Boulevard to US 50 22400 a
Folsom Boulevard Bradshaw Road to Sunrise Boulevard 20400 a
Bradshaw Road Old Placerville to US 50 54405 F
Old Placerville Road Bradshaw Road to Rockingham Drive 11864ndash18365 a
Rockingham Drive Old Placerville Road to Mather Boulevard 16516 E
Mather Boulevard Rockingham Drive to Folsom Boulevard 21732 C
international Drive Rockingham Drive to Zinfandel Drive 12808 a
Zinfandel Drive international Drive to Folsom Boulevard 22298ndash47032 BE
white Rock Road Zinfandel Drive to Sunrise Boulevard 25459 a
Sunrise Boulevard US 50 to Folsom Boulevard No Data No Data
white Rock Road Sunrise Boulevard to Prairie City Road 3400 B
Folsom Boulevard Sunrise Boulevard to iron Point Road 17200 a
white Rock Road grant Line Road to EDSaC County Line 6700 D
iron Point Road Folsom Boulevard to East BidwellScott Road 13984 No Data
Scott Road iron Point Road to white Rock Road No Data No Data
Folsom Boulevard iron Point Road to Blue Ravine Road No Data No Data
Blue Ravine Road Folsom Boulevard to green Valley Road No Data No Data
Prairie City Road US 50 to white Rock Road 6000 D
HigHway 50 corridor system management plans [ 30 ]
c h a p t e r f i v e p e r f o r m a n c e m e a s u r e s
Table 7 Parallel and ConneCTing roadwayS PerForManCe MeaSUreS (ConTinUed)
County location average
daily Traffic1
PerForManCe MeaSUreS
loS1
Total Vehicle Hours of delay2
Total Person Minutes of delay2
Minutes of delay per Vehicle2
Minutes of delay per Person2
Vehicle Travel Time (Minutes)2
distressed Pavement
(lane Miles)4
daily Peak Hour3 daily Peak
Hour3 Peak Hour3 Peak Hour3 Peak Hour3
Parallel and ConneCTing roadwayS
ED
green Valley Road EDSaC County Line to Francisco Drive 22600 D
Data is unavailable for these performance measures at this time however will be pursued in the next phase of the CSMP
green Valley Road Francisco Drive to Silva Valley Parkway 13077 D
green Valley Road Silva Valley Parkway to Cameron Park 9849 C
green Valley Road Cameron Park Drive to Deer Valley Road 5278 C
green Valley Road Deer Valley Road (East) to Lotus Road 8381 D
green Valley Road Lotus Road to Placerville Drive 4669 C
Latrobe Road white Rock Road to US 50 24742 C
Durock Road Cameron Park Dr to South Shingle Road 7278 C
Cameron Park Drive Durock Road to US 50 (Durock Road to Coach Lane Coach Lane to US 50) 9544 26603 CD
South Shingle Road Durock Road to US 50 11390 D
white Rock Road EDSaC County Line to Latrobe 12808 D
white Rock Road Latrobe Rd to Silva Valley Pkwy (Latrobe to PostPost to Silva Vlly Pkwy) 10124 CD
Silva Valley Parkway white Rock Rd to Serrano Pkwy (white Rock to Entrada Entrada to Serrano Pkwy) 13708 9328 DC
Forni Road Placerville Drive to Main Street 9049 8379 No Data
Placerville Drive Forni Road to US 50 No Data No Data
Main Street Placerville Drive to Bedford avenue No Data No Data
Main Street Bedford avenue to Broadway No Data No Data
Broadway Main Street to Point View Drive No Data No Data
1 Source Average Daily Traffic and Level of Service (LOS) calculated are based on City of Sacramento between 2001 and 2007 Sacramento County from 20072008 City of Rancho Cordova between 2004 and 2007 and El Dorado County from 2007
HigHway 50 corridor system management plans [ 31 ]
c h a p t e r f i v e p e r f o r m a n c e m e a s u r e s
Page Inte
ntionally
Left
Blank
[ 32 ] HigHway 50 corridor system management plan
c h a p t e r f i v e p e r f o r m a n c e m e a s u r e s
tabLe 8 traNSit PerforMaNCe MeaSure
County transit Provider route Performance Measure
available daily Capacity ()1 available Peak Hour Capacity1
traNSit
SaC
SacRT (Bus)
Route 21 70 10
Route 28 76 59
Route 36 83 74
Route 38 66 44
Route 72 56 20
Route 73 79 45
Route 74 82 43
Route 109 47 22
SacRT (Light Rail) Gold Line 31 Exceeds Capacity
EDSAC ED County Transit Authority
Commuter Express Bus Service Not applicablendashOperates Peak Hour
Only 405
iron Point Connector 764 Not available
Reverse Commuter Not applicablendashOperates Peak Hour Only 982
yoloSaC yolo County Transit District Not applicablendashOperates Peak Hour Only 498
biKe3
1 Source average Daily and Peak Hour available Capacity calculated from each transit providerrsquos route ridership data 2 The Reverse Commuter service is offered on vehicles that are returning to El Dorado County (Commuter Express Buses) 3 Bicycle performance measure(s) will be identified applied and included in the subsequent CSMPs
HigHway 50 corridor system management plan [ 33 ]
c h a p t e r f i v e p e r f o r m a n c e m e a s u r e s
[ 34 ] HigHway 50 corridor system management plan
Page Inte
ntionally
Left
Blank
planned corridor system management strategies
chapter six
ConCept LoS and ConCept FaCiLit y ldquoConcept LOSrdquo and ldquoConcept Facilityrdquo have traditionally been used in Caltrans TCCRs to reflect the minimum level or quality of operations acceptable for each route segment within the 20-year planning period and the highway facility needed in the next 20 years to maintain the Concept LOS
Typical Concept LOS standards in Caltrans District 3 are LOS ldquoDrdquo in rural areas and LOS ldquoErdquo in urban areas how-ever some heavily congested route segments now have a Concept LOS ldquoFrdquo because the improvements required to bring the LOS to ldquoErdquo are not feasible due to environmental right of way financial and other constraints The applica-tion of multi-modal corridor management strategies should reduce the severity and duration of congestion and provide viable travel options and information that will enable a traveler to avoid severe freeway congestion
The Concept LOS and Concept Facility for US 50 are shown in Table 9 almost all US 50 segments are forecasted to operate under LOS ldquoFrdquo conditions in 20 years under the No-Build and Build scenarios
Corridor ManageMent StrategieS The US 50 CSMP also proposes specific strategies to enhance corridor mobility (see Table 10) based on the fol-lowing principles
bull Manage all modes and facilities in the corridor as a single system beginning with the transportation net-work defined in this CSMP
bull Implement comprehensive and dynamic multimodal monitoring and reporting for the system and for all modes
bull Develop and use micro-simulation modeling to identify mobility challenges and to evaluate proposed solutions
bull Complete the projects included in the regional trans-portation plans with an emphasis on the completion of the key mobility improvement projects identified in this CSMP (see Tables 11 and 12)
bull Implement the specific strategies outlined in this CSMP
Key CapitaL projeCtS Tables 11 and 12 contain key capital projects that have been identified as the most critical to corridor mobility These are also included in the SaCOg MTP for 2035 and are either planned without any funding yet programmed are partially programmed
The US 50 CSMPor are entirely programmed SACOG conducted significant proposes specific
public attitude research strategies to enhance for the MTP for 2035 to corridor mobility complement comprehensive outreach efforts through community workshops the TALL Order Moving the Region Forward event the televised Town Hall Road Map for the Future and associated public polling The results of the SaCOg analyses and public out-reach for the MTP were
highway 50 corridor system management plan [ 35 ]
c h a p t e r s i x p l a n n e d c o r r i d o r s y s t e m m a n a g e m e n t s t r a t e g i e s
[ 36 ] HigHway 50 corridor system management plan
used when selecting the key projects for identification in
the CSMP and to ensure consistency Not all corridor projshyects in the MTP are included in the CSMP since the CSMP focuses on the managed network and the SaCOg MTP considers all streets and roads bike routes and transit services in the corridor
highway 50 partnership The Highway 50 Partnership is a cooperative public-private effort among the County of Sacramento City of Rancho
Cordova City of Folsom County of El Dorado and several major landowners that recognize the need to consider corrishydor mobility needs holistically
The Partnership has collaborated effectively to develop a Plan to improve mobility in the US 50 Corridor from Rancho
Cordova to El Dorado Hills an area identified as approprishyate for growth in the SACOG Blueprint Recognizing the
need to generate private investment the Partnership is seeking to implement a regional Highway 50 Corridor fee program to fund these projects
in addition to the key projects indicated in Table 11 Table 12 displays the key projects identified by the
Partnership
These projects include (1) Near-Term Priority Improvement Projects and (2) Near-Term Expected Roadway Improveshyments
The Near-term Priority improvement Projects would proshyvide several new roadway connections for people to travel within and through the area to avoid congestion They also include new transit routes and widening existing roadways
viewed by the Partnership as a package that would provide system-wide travel benefits These improvements targeted
for completion through 2012 would reduce vehicle hours of delay during commute hours by 30 percent
The near-Term Expected Roadway Improvements are conshysidered by the Partnership to be readily expected since they are tied to expected development or are part of a near-term
capital improvements program
Visionary projects Visionary projects are not yet included in the SaCOg MTP or EDCTC RTP but appear to offer considerable corridor mobilshyity benefits and merit further analysis and consideration for inclusion in the next MTP and RTP These are displayed in
Table 13
The ldquoPlus 10 Listrdquo in the SACOG MTP identifies projects
that are attractive from a performance standpoint but could not be included in the Final Project Lists because of financial constraint The ldquoPlus 10 Listrdquo element offers the
opportunity to include projects that would not be affordshyable without additional funding Some projects identified in
the Visionary Projects List were analyzed by SACOG during
development of the current MTP Some of these are included in the ldquoPlus 10 Listrdquo
Watt Avenue Light Rail Station Improvement Project
c h a p t e r s i x p l a n n e d c o r r i d o r s y s t e m m a n a g e m e n t s t r a t e g i e s
Table 9 US 50 ConCePT loS and FaCiliTy TyPe
location Forecasted level of Service1 (loS) and Facility Type
County description and location From Post Mile To Post Mile Current
loS1 20-year no build loS12
20-year build loS12
20-year Concept
loS13 existing Facility4 Concept Facility456 Ultimate Facility457
yOL interstate 80 to yoloSacramento County Line
000 316 F F F F 8F (6F between Jefferson Blvd ramps)
8F+2HOV+aux Lanes 8F+2HOV+aux Lanes
SaC yoloSacramento County Line to SR 99 and 51
L000 L248 = R000 F F F F 8F 8F+2HOV+aux Lanes 8F+2HOV+aux Lanes
SaC State Routes 99 and 51 to watt avenue R000 R534 F F F F 8F 8F+2HOV+aux Lanes 8F+2HOV+aux Lanes
SaC watt avenue to Zinfandel Drive R534 R1092 F F F F 8F 8F+2HOV+aux Lanes 8F+2HOV+aux Lanes
SaC Zinfandel Drive to Sunrise Boulevard R1092 1250 E F F F 8F 8F+2HOV+aux Lanes 8F+2HOV+aux Lanes
SaC Sunrise Boulevard to Folsom Boulevard 1250 1701 E F F F 6F+2HOV to Hazel ave 4F+2HOV
to Folsom Blvd
6F+2HOV+aux Lanes to Hazel ave 4F+2HOV+aux
Lanes to Folsom Blvd
8F+2HOV+aux Lanes
SaC Folsom Boulevard to SaCED County Line 1701 2314 D F F F 4F+2HOV 4F+2HOV+aux Lanes 6F+2HOV+aux Lanes
ED SacramentoEl Dorado County Line to Cameron Park Drive
000 R657 E F F F 4F 4F+2HOV+aux Lanes 6F+2HOV+aux Lanes
ED Cameron Park Drive to Missouri Flat Road R657 R1506 E F E E 4F 4F+2HOV+aux Lanes to greenstone 4F+aux Lanes
to Missouri Flat
6F+2HOV+aux Lanes to greenstone 4F+2HOV+aux Lanes
to Missouri Flat
ED Missouri Flat Road to End of Freeway in Placerville
R1506 1725 D F F F 4F 4F+aux Lanes 4F+aux Lanes
ED End of Freeway in Placerville to Bedford avenue
1725 1811 D E E E 4E 4E 4E
ED Bedford avenue to Cedar grove Exit 1811 R2595 D F F F 4F to Smith Flat 4E to Camino 4F+aux Lanes to Smith Flat 4E to Camino
4F+aux Lanes
1 Level of Service (LOS) A ldquoreport cardrdquo for evaluating traffic flow with ldquoArdquo being the best and ldquoFrdquo being the worst 2 20-year LOS (No Build) The LOS that would be expected at 20 years with no improvements 3 20-year Concept LOS The minimum acceptable LOS over the next 20 years 4 Facility Type Codes C=Conventional Highway E=Expressway F=Freeway HOV=High Occupancy Vehicle Lanes aux=auxiliary Lanes 5 Operational improvements are included in future facilities for all segments Examples of operational improvements include TOS improvements and auxiliary lanes 6 Concept Facility the future roadway with improvements needed in the next 20 years if LOS ldquoFrdquo no further degradation of service from existing ldquoFrdquo is acceptable as indicated by delay performance measurement 7 Ultimate Facility The future roadway with improvements needed beyond a 20 year timeframe
HigHway 50 corridor system management plans [ 37 ]
c h a p t e r f i v e p e r f o r m a n c e m e a s u r e s
Table 10 US 50 CSMP STraTegieS
Strategy description implementation Challenges
Maintain and operate the existing corridor multi-modal trans-
portation infrastructure
Maintain the existing investment in all modes of the transportation system and provide adequate resources for daily operations including operating
revenues for transit services
Funding availability funding competition within the region
Fully coordinate the delivery of transportation services and facili-ties in the corridor including daily operations and system planning
for enhancements
Interagency operational coordination to maximize the efficiency and effec-tiveness of all modes operating in the corridor with a focus on the CSMP transportation network defined in this CSMP Use of an existing group or
committee to provide initial oversight for this strategy
Diverse interests and competing priorities and limited resources
Construct planned and pro-grammed corridor capital improve-
ment projects
implementation of the capital improvements in the corridor included within the approved Metropolitan Transportation Plan and Regional Transportation
Plan for all transportation modes within the scope schedule and cost specified
Funding availability funding competition within the region
Comprehensive daily monitoring of the status of all modes providing service on the CSMP transporta-
tion network
Full deployment of multimodal transportation service status detection systems for all CSMP network components
Funding availability funding competition within region
Provide traveler information to the public
Provide the public with real-time easily accessible information regarding the status of all CSMP transportation system components so as to allow travel-
ers to make informed decisions about trip mode time and routing options
Funding availability funding competition within region
Continually monitor and analyze the CSMP transportation network to improve system performance
Monitor transportation performance measures and make system modifica-tions as appropriate on a frequent and timely basis Staff resources and data availability
Decrease the duration of non-recurrent traffic congestion
Expand and enhance the Freeway Service Patrol to respond to automobile accidents and vehicle break-downs
Funding availability funding competition within the region
Timely implementation of STaRNET
Expedite the implementation of the STaRNET operators of transportation facilities and emergency responders in the Sacramento region through real-time sharing of data and live video refinement of joint procedures
pertaining to the operation of roadways and public transit and public safety activities as well as enhance the regionrsquos 511 web site and interactive
telephone service to provide more traveler information
Developmental time acceptance by agencies and integration into daily use and identifica-
tion of maintenance and operations funding
Enhance transit and rail service increase transit service frequency provide express transit services imple-
ment bus rapid transit routes reduce headways for light rail and buses and construct planned light rail line extensions
Funding availability funding competition within the region
Complete Bus Carpool lane network
Complete the regional buscarpool lane network including freeway-to-freeway HOV lane connectors
Funding availability funding competition within the region Public agency and public
acceptance of network
[ 38 ] HigHway 50 corridor system management plan
c h a p t e r s i x p l a n n e d c o r r i d o r s y s t e m m a n a g e m e n t s t r a t e g i e s
tabLe 10 uS 50 CSMP StrategieS (ConTInued)
Strategy Description implementation Challenges
Enhance Transportation Demand Management strategies
Encourage employers to provide telecommuting and flexible working hour options to employees
acceptance by employers and resources to participate
Optimize the timing and synchronishyzation of traffic signals
Coordinate the optimization and timing of traffic signals on freeway ramps and along parallel and connecting roadways within and between jurisdicshytions to improve traffic flow and reduce congestion Provide signal priority
systems for transit vehicles
Funding availability and coordination among cities counties and Caltrans
improve access management of freeways and parallel connecting roadways
Develop and implement access management strategies to maintain the operational efficiency of freeways and parallelconnecting roadways
agreement between responsible jurisdicshytions as to where increased access control is needed increased access control on some parallelconnecting roadways may increase
traffic volumes on non-corridor roads
Develop innovative use of CMSs (eg travel times)
Potential uses of CMSs to improve system efficiency include the use of CMSs along portions of all corridors near transit station to indicate travel
times based on real-time existing traffic conditions on the freeway as well as on parallel roadways and express bus and light rail services CMS can also be used to identify the number of parking spaces that are still available at
the light-rail stations
Funding availability funding competition within the region
Implement amp expand Transit AVLTransit status information
enhancements for system users
Expand the use of AVL systems utilizing GPS technology to track in real-time the location of transit vehicles monitor transit schedules dispatch transit vehicles and provide real-time passenger information such as ldquonext busrdquo or
ldquonext trainrdquo arrival times
Funding availability funding competition within region
Expand Park-and-Ride lots at key locations
Add additional capacity to existing park-and-ride lots near transit stations and other locations that are approaching capacity
Funding availability funding competition within the region and available land
improve bike-pedestrian access in the CSMP
transportation network
Plan and program for construction of additional bicycle paths lanes and related improvements for access and connectivity to transit park and ride
lots and destination points
Funding availability funding competition within the region
Provide ldquoBike-SharingrdquordquoCar-Sharingrdquo tofrom transit (ldquoCarlinkrdquo) and from
neighborhoods
Expand the Regional Rideshare and Spare-the-Air programs to include bicycle and car sharing opportunities
Funding availability and coordination between SaCOg TMa air Districts employers developshyers property managers and local government
officials
Provide parking management stratshyegies in interested jurisdictions where applicable to discourage
use of single-occupant vehicles
in higher-density areas provide preferential parking for carpools and vanshypools require residential parking permits remove on-street parking and or provide graduated parking fees for metered on-street parking based on
vehicle type and time of day for SOV spaces to encourage transit use
Acceptance by businesses local officials and the general public
Expand bicycle commute amp transit fare strategiessubsidies
increase participation by large employers in programs that subsidize transit fares for employees during peak-hour commute times and provide bicycling
to work incentives
Voluntary participation by large employers to pay subsidy to transit providers
HigHway 50 corridor system management plan [ 39 ]
c h a p t e r s i x p l a n n e d c o r r i d o r s y s t e m m a n a g e m e n t s t r a t e g i e s
tabLe 11 KeY CaPitaL ProjeCtS
CountyLead agency
route roadway from to Project
Description Programmed
funds
additional funding Needed
total Cost estimate (x $1000)
Comp Year (FFY)
uS 50
Sacramento Caltrans District 3
US 50 Downtown watt avenue HOV Lanes $0 $75000 $75000 2020
Sacramento Caltrans District 3
US 50 watt avenue Sunrise Blvd HOV Lanes $165000 $0 $165000 2013
Sacramento Caltrans District 3
US 50 Bradshaw Road
Mather Field Road
Eastbound and Westbound Auxiliary Lanes
$0 $3700 $3700 2016
Sacramento Caltrans District 3
US 50 State Route 99
(Oak Park Interchange) interchange improvements including buscarpool lane
connectors $0 $150000 $150000 2014
Sacramento Caltrans District 3
US 50 interstate 5
(Riverfront Interchange) Riverfront Interchange
improvements including bus carpool lane connectors
$30000 $170000 $200000 2016
ED Caltrans District 3 US 50 Camino
Operational Safety improvements Construct an
undercrossing median barrier modify local road connections andor associated operational improvements on and adjacent
to US 50
$15000 $0 $15000 2012
ED ED County DOT US 50
west of Latrobe Road
west of Bass Lake
grade HOV Lanes (Ph1) $47141 $0 $47141 2010
ED Caltrans District 3 US 50
west of Bass Lake Road
Ponderosa Road
HOV Lanes (Ph2) $55000 $0 $55000 2011
ED Caltrans District 3 US 50 Ponderosa
Road greenstone
Road HOV Lanes (Ph3) $22357 $0 $22357 2013
ED ED County DOT US 50 Future Silva
Valley iC
Future Empire Ranch IC
Mainline Widening construct new WB lane within the
median from proposed Silva Valley IC to proposed Empire
Ranch IC
$2950 $0 $2950 2013
[ 40 ] HigHway 50 corridor system management plan
c h a p t e r s i x p l a n n e d c o r r i d o r s y s t e m m a n a g e m e n t s t r a t e g i e s
tabLe 11 KeY CaPitaL ProjeCtS (ConTInued)
CountyLead agency
route roadway from to Project
Description Programmed
funds
additional funding Needed
total Cost estimate (x $1000)
Comp Year (FFY)
PARALLEL AnD COnnECTInG ROADWAYS
ED ED County DOT
Silva Valley Parkway
Entrada Drive
Future US 50
Silva Valley Parkway iC
Widen Silva Valley Road from 2 lanes to 4 lanes includes
Class ii bike lanes and left turn storage pockets
$2921 $0 $2921 2010
ED ED County DOT
Silva Valley Parkway US 50
US50 Silva Valley Parkway (Phase 2) Includes constructshying overcrossing and ramps
signalization at EB and WB on off ramps
$57817 $0 $57817 2016
ED ED County DOT
Headington Road
Missouri Flat Road
El Dorado Road
Extend 2 lanes with median $9878 $0 $9878 2012
ED ED County DOT
Durock Road
Robin Lane South
Shingle Road
Extend 2 lanes with median $1239 $9214 $10453 2015
ED ED County DOT
Durock Road
Business Center Drive intersection signalization
includes adding turn pockets on Durock Road
$4333 $0 $4333 2009
ED City of Placerville
Point View Drive Broadway Smith Flat
Road Extend 2 lanes $1300 $0 $1300 2020
ED City of Placerville
western Placerville
US 50 interchange
Forni Road Ray Lawyer
Drive
Placerville Drive
Interchange Reconstruction convert Ray Lawyer Dr
Overcrossing to full IC Auxiliary Lanes
$5059 $34741 $39800 2020
Sacramento City of Rancho
Cordova
Mather Boulevard
Rockingham Road
Zinfandel Drive widen to 4 lanes $0 $8617 $8617 2020
Sacramento Rancho Cordova
Parkway ii
Grant Line Road
White Rock Road
New 6-lane expressway includshying intersection improvements at Kiefer Blvd amp White Rock
Road
$0 $44518 $44518 2020
Sacramento City of Folsom
Scott Road US 50 White Rock Rd
widen from 2 to 6 lanes $16000 $0 $16000 2020
Sacramento Sacramento County DOT
White Rock Road
Grant Line Rd
Prairie City Rd
Widen from 2 to 4 lanes realign near Nike and Nimbus Roads and connect with existshying alignment west of Prairie City Rd Realign Grant Line Rd to intersect with realigned
White Rock Rd
$26600 $0 $26600 2020
Sacramento Sacramento County DOT
Hazel avenue
US 50 Hazel Madison
Widen American River Bridge and approaches from 4 to 6 lanes Widen Hazel Avenue from AR Bridge to Madison from 4 to 6 lanes with Bike
LanesSignals
$83530 $0 $83530 2020
HigHway 50 corridor system management plan [ 41 ]
c h a p t e r s i x p l a n n e d c o r r i d o r s y s t e m m a n a g e m e n t s t r a t e g i e s
tabLe 11 KeY CaPitaL ProjeCtS (ConTInued)
CountyLead agency
route roadway from to Project
Description Programmed
funds
additional funding Needed
total Cost Estimate (x $1000)
Comp Year (FFY)
PARALLEL AnD COnnECTInG ROADWAYS
ED ED County DOT
green Valley Road
Salmon Falls Road
east
Deer Valley Road
widen from 2 to 4 lanes $0 $14576 $14576 2025
ED ED County DOT
green Valley Road
Deer Valley Road east Lotus Road widen $958 $4513 $5471 2015
ED ED County DOT
green Valley Road
Francisco Drive
Salmon Falls Road
widen from 2 to 4 lanes divided $412 $3491 $3903 2015
ED ED County DOT
Latrobe Road
investment Boulevard
golden Foothill Parkway
widen from 2 lanes undivided to 4 lanes
divided $1076 $8792 $9868 2015
ED ED County DOT
Latrobe Road
Carson Creek
White Rock Road
widen from 4 to 6 lanes $0 $23755 $23755 2025
ED ED County DOT
white Rock Road
EDSac County Line
Manchester Drive
widen 2 to 4 lanes divided includes signal interconnect and coorshy
dination
$0 $23755 $23755 2025
Sacramento City of Rancho
Cordova
Easton Valley
Parkway
Prairie City Road
Empire Ranch Road extenshysion south of
US 50
Construct new 4 lane road $0 $45000 $45000 2020
Sacramento Sacramento County DOT
Hazel avenue
Easton Valley
Parkway
Grant Line RoadWhite Rock Road
New road extension 4 lane limited access
through aerojet property $0 $18000 $18000 2018
Sacramento Sacramento County DOT
white Rock Road
Prairie City Road
ED County Line
widen to 4 lanes $8330 $64773 $73103 2018
Sacramento Sacramento County DOT
green Valley Road
East Natoma Sacramento ED County
line widen to 4 lanes $0 $3000 $3000 2018
Sacramento City of Rancho
Cordova
Zinfandel Drive
international Drive
Folsom Boulevard
widen to 4 lanes $0 $12000 $12000 2020
[ 42 ] HigHway 50 corridor system management plan
c h a p t e r s i x p l a n n e d c o r r i d o r s y s t e m m a n a g e m e n t s t r a t e g i e s
tabLe 11 KeY CaPitaL ProjeCtS (ConTInued)
CountyLead agency
route roadway from to Project
Description
Pro-grammed
funds
addi-tional
funding Needed
total Cost estimate (x $1000)
Comp Year (FFY)
traNSit
yolo amp Sacramento City of west Sacramento
amp City of Sacramento
Sacramento River
Crossing
15th Street in the City
of west Sacramento
Broadway in the City of
Sacramento
New all-modal river crossing (Auto Transit Bike amp Pedestrian)
from Sacramento across the Sacramento River to West
Sacramento The crossing was modeled between Broadway in Sacramento amp 15th Street in
West Sacramento but final alignshyment options will be studied in subsequent planning efforts
$800 $99200 $100000 2019
Sacramento Cal State University
Sacramento
CSUS Campus mdash mdash
Sac State Tram adjoining City streets and SRTD 65th Street light railbus transfer station Bus Rapid Transit System
$23574 $0 $23574 2013
Sacramento City of Rancho
Cordova
Rancho Cordova Various Various
New Service Rancho Cordova Pilot Transit Shuttle System new transit service for connection to
RTs Gold Line
$2380 $1500 $38880 2014
yolo amp Sacramento City of west Sacramento
TBD west
Sacramento Sacramento Streetcar Service between west
Sacramento and Downtown Sacramento
$17400 $54700 $72100 2014
Sacramento City of Rancho
Cordova RT Gold Line
RT Gold Line Tracks
Mather Field Road
Light Rail Grade Separations $0 $52888 $52888 2025
Sacramento City of Rancho
Cordova RT Gold Line
RT Gold Line Tracks Zinfandel Drive Light Rail Grade Separations $0 $52888 $52888 2025
Sacramento City of Rancho
Cordova RT Gold Line
RT Gold Line Tracks
Bradshaw Road
Light Rail Grade Separations $0 $35260 $35260 2025
Sacramento City of Rancho
Cordova RT Gold Line
RT Gold Line Tracks Routier Road Light Rail Grade Separations $0 $35260 $35260 2025
Sacramento City of
Sacramento Sacramento Valley Station
Sacramento intermodal Transportation Facility (Phase 1) - Develop intermodal transportashytion terminal for heavy rail light
rail and bus service
$77799 $0 $77799 2010
Sacramento City of
Sacramento Sacramento Valley Station
Sacramento intermodal Transportation Facility (Phase 2) - Develop intermodal transportashytion terminal for heavy rail light
rail and bus service
$24101 $1000 $25101 2014
HigHway 50 corridor system management plan [ 43 ]
c h a p t e r s i x p l a n n e d c o r r i d o r s y s t e m m a n a g e m e n t s t r a t e g i e s
TABLE 11 KEY CAPITAL PROJECTS (CONTINUED)
CountyLead Agency
Route Roadway From To Project
Description Programmed
Funds
Additional Funding Needed
Total Cost Es-timate (x $1000)
Comp Year (FFY)
BICYCLE ROUTES
Sacramento City of Rancho
Cordova
US 50Mather Field Road IC US 50 Mather
Field Road
US 50Mather Field Road PedestrianBike Crossing along
the Mather Airport RR Spur alignment
$0 $820 $1055 2015
ED ED County DOT
Sacramento Placerville
Transportation Corridor
Forni Rd
Missouri Flat Rd Class I Bike Trail $1423 $111 $1534 2009
ED City of Placerville
El Dorado Trail Western
Extension
Canal Street Main Street
Ray Lawyer DriveForni
Road Class 1 Bike Trail $1850 $0 $1850 2010
ED ED County DOT
US 50ED Hills Blvd IC US 50
El Dorado Hills Blvd
Latrobe Road
US 50El Dorado Hills Blvd Pedestrian Overcrossing $5508 $66 $5574 2014
TABLE 12 50 MOBILITY PARTNERSHIP KEY CAPITAL PROJECTS
RouteRoadway From To Project Description
NEAR TERM PRIORITY IMPROVEMENT PROJECTS
US 50 Sunrise Scott Road Auxiliary Lane
US 50 Hazel Avenue Interchange Improvements
Hazel Avenue Folsom Boulevard Easton Valley Parkway New 4 Lane Road
Easton Valley Parkway Hazel Avenue Rancho Cordova Parkway New 6 Lane Road
Rancho Cordova Parkway Easton Valley Parkway White Rock Road New 4 Lane Road
White Rock Road Sunrise Boulevard Silva Valley Parkway Widen to 4 Lanes
RT Gold Line Hazel Iron Point Station Passing Tracks
US 50 Rancho Cordova Parkway New Interchange
Zinfandel Drive South of International Douglas Road New 4 Lane Road
International Drive Kilgore Road Rancho Cordova Parkway New 6 Lane Road
Douglas Road Zinfandel Extension Sunrise Boulevard Widen to 4 Lanes
Sunrise LRT Citrus Road Sunrise Mall Bus Rapid TransitExpress Bus
[ 44 ] HIGHWAY 50 corridor system management plan
c h a p t e r s i x p l a n n e d c o r r i d o r s y s t e m m a n a g e m e n t s t r a t e g i e s
TABLE 12 50 mOBILITY PARTnERSHIP kEY CAPITAL PROjECTS (COnTInUED)
routeroadway from to Project Description
US 50 nEAR TERm PRIORITY ImPROVEmEnT PROjECTS
US 50 Empire Ranch Road New interchange
US 50 Silva Valley New interchange
US 50 Scott Road Empire Ranch Road Aux Lanes
US 50 Empire Ranch Road El Dorado Hills Boulevard Aux lanes and climbing lanes
US 50 El Dorado Hills Boulevard Silva Valley Parkway Aux lanes and climbing lanes
US 50 Silva Valley Parkway Bass Lake Road Aux lanes
Sunrise Boulevard White Rock Road Douglas Boulevard widen to 6 lanes
Sunrise Boulevard Douglas Boulevard Jackson Road widen to 4 lanes
White Rock Road Sunrise Boulevard Future Rancho Cordova Parkway and El Dorado County Line to Latrobe Road
widen to 4 lanes
Douglas Boulevard Sunrise Boulevard Grant Line Road widen to 4 lanes
Rancho Cordova Parkway Douglas Boulevard Rio del Oro Parkway New 2 lane road
Rancho Cordova Parkway Rio del Oro Parkway White Rock Road New 6 lane road
Jaeger Road Douglas Road Kiefer Boulevard New 4 lane road
Chrysanthy Sunrise Boulevard Americanos Boulevard New 4 lane road
Kiefer Boulevard Sunrise Boulevard Jaeger Road New 4 lane road
Grant Line Road Douglas Road Chrysanthy Road widen to 4 lanes
Hazel avenue Gold Country Boulevard Madison avenue widen to 6 lanes
Latrobe Road South of White Rock Road widen to 4 lanes
TABLE 13 VISIOnARY PROjECTS
County routeroadway from to Project Description
Sac yolo US 50 Enterprise Downtown Sacramento HOV Lanes
ED TBD Folsom Placerville Transit ndash Type TBD
ED New Road Latrobe Road White Rock Road (poten shy
tially US 50) New 2-lane road
HigHway 50 corridor system management plan [ 45 ]
c h a p t e r s i x p l a n n e d c o r r i d o r s y s t e m m a n a g e m e n t s t r a t e g i e s
[ 46 ] HigHway 50 corridor system management plan
Page Inte
ntionally
Left
Blank
congestion and bottleneck analysis
chapter seven
The 2000 Highway Capacity Manual defines a bottleneck
as ldquoa road element on which demand exceeds capacityrdquo
The bottleneck analysis evaluates specific causes of existshying recurrent traffic congestion in the corridor Freeway bottleneck locations that create mobility constraints are identified and documented and their relative contribution
to corridor-wide congestion is reported The bottleneck locations were determined based on a combination of the use of 2006 PeMS data HiCOMP report probe vehicle tach runs and field observations
Traffic congestion can be categorized as either recurrent
or non-recurrent
recurrent congestion occurs repeatedly at the same place and time of day in a predictable pattern Recurrent congesshytion is often associated with facility capacity limitations changes in capacity conflicting vehicle movements such
as lane merges inadequate number of transit vehicles to handle passenger loads or other persistent physical condishytions of the transportation facility
Non-recurrent congestion is usually attributed to collishysions equipment malfunction community events weather construction projects and other occasional occurrences When transportation systems are close to their maximum
carrying capacity non-recurrent congestion is more likely to occur as there is little excess capacity in the system
The location and extent of the bottlenecks on US 50 found
in the aM and PM peak periods are summarized in Tables 14 and 15 These depictions should be considered a snapshyshot view and not a comprehensive analysis of all bottleshynecks in the corridor Further work is being conducted to
refine the identification and causality of bottlenecks within
the corridor Table 14 shows a summary of the US 50 eastbound bottlenecks while the tables that follow discuss each bottleneck including location and possible causality Table 15 shows a summary of the US 50 westbound bottleshynecks while the tables that follow discuss each bottleneck including location and possible causality Minor or hidden bottlenecks are those Freeway bottleneck
that are not as defined locations that create (or severe) as the major mobility constraints bottlenecks Please note are identified and that the graphics accomshy documented and their panying the bottlenecks
relative contribution to are not to scale
corridor-wide congestion Major bottlenecks in the is reported eastbound direction during the aM peak period are at Howe avenue and during the PM peak period are at 48th Street Howe Avenue Mayhew Road Routier Road Sunrise Boulevard and El Dorado Hills Boulevard Major bottlenecks in the westbound direction during the aM peak period are at El Dorado Hills Boulevard Hazel Avenue Zinfandel Drive
HigHway 50 corridor system management plan [ 47 ]
c h a p t e r s e v e n c o n g e s t i o n a n d b o t t l e n e c k a n a l y s i s
Bradshaw Road and Howe Avenue and major bottleneck
locations during the PM peak period are at Zinfandel Drive Routier Road Bradshaw Road Howe Avenue and Intershystate 5
Causalities for these bottlenecks range from high-traffic
demand (congestion) heavy weavingmerging areas or physical constraints such as lane drops lack of ramp meters incomplete HOV network incomplete Auxiliary Lane
network poorly coordinated traffic signals and an off-ramp
queue (Sunrise Boulevard) US 50 Westbound Onramp
TABLE 14 US 50 EASTBOUnD BOTTLEnECk SUmmARY Source PeMS Caltrans tach runs and
Cambridge Systematics field observations
bottleneck Location PeMS Speed Contours Caltrans Probe Vehicle Runs
Cause aM PM aM PM
A Jefferson Blvd PM 25 Minor Minor Traffic weaving truck volumes and grade
B 48th St PM 7 Minor Major Minor Minor Merge from SR 51 and SR 99
C Howe ave PM 9 Major Major Major weave between Howe and watt
D Mayhew Rd PM 12 Major Minor Major Weaving before Bradshaw Exit
E Routier Rd PM 14 Minor Major Weaving before Mather Field Rd Exit
F Sunrise Blvd PM 185 Minor Major Lane drop HOV add off-ramp queue
G Folsom Blvd PM 22 Minor Minor Lane drop 4 to 3
H El Dorado Hills Blvd PM 275 Major
Poorly coordinated traffic signal on arterial causes spillback onto freeway
a jefferson blvd bottleneck The bottleneck approximately located at Jefferson Blvd is due to weaving traffic as those entershying the freeway from Jefferson Blvd must cross those attempting to exit the freeway to I 5 There is a large number of trucks in the stream which struggle with the grade at this location exacerbatshying the bottleneck
[ 48 ] HigHway 50 corridor system management plan
c h a p t e r s e v e n c o n g e s t i o n a n d b o t t l e n e c k a n a l y s i s
b 48th St bottleneck The bottleneck approximately located at 48th St is due to the additional traffic merging from SR 51 and SR 99 combined with the eventual lane drop at 59th St This queue extends upstream past the off-ramp to SR 5199 These off-ramps are bottlenecks in themselves which spill back and choke the US 50 mainline
C Howe Ave Bottleneck The bottleneck at Howe ave is due to the entering traffic from Howe Ave Two Howe Ave on-ramps feed into US 50 eastbound southbound Howe ave loop on-ramp and northbound Howe ave direct ramp approximately 300 feet apart The watt avenue off-ramp is just down stream with heavy exiting volumes therefore the segment between Howe and watt is characterized by heavy weaving
D mayhew Rd Bottleneck The bottleneck approximately located at Mayhew Rd most likely begins with the additional traffic entering from Watt Ave and ends with the exiting traffic at Bradshaw Rd It is possible that there is a high proportion of weaving traffic with in this section (Watt Ave traffic moving to the left lane and those exiting at Bradshaw Rd moving to the right lane)
HigHway 50 corridor system management plan [ 49 ]
c h a p t e r s e v e n c o n g e s t i o n a n d b o t t l e n e c k a n a l y s i s
[ 50 ] HigHway 50 corridor system management plan
e routier rd bottleneck It is likely that the bottleneck at Routier Rd is due to the same merging conditions associated with Mayhew Rd The area is comprised of both residential and light industrialoffice land uses therefore during the PM peak period there are large volumes of vehicles entering at Bradshaw Rd moving to the left lanes and large volumes of vehicles moving to the right lane to exit at Mather Field Rd
f Sunrise blvd bottleneck At Sunrise Blvd the right-most lane exits while an HOV lane is added as the median lane The bottleneck is formed from vehicles shifting left to avoid exiting at Sunrise Blvd and to enter the HOV lane There is a large volume of vehicles queued at the Sunrise off-ramp which spills back and negatively affects the US 50 mainline
g folsom blvd bottleneck The right-most lane exits to Folsom Blvd leaving one HOV lane and two regular lanes along the US 50 The bottleneck is caused by this lane drop as well as the quick merge at the Folsom on-ramp
c h a p t e r s e v e n c o n g e s t i o n a n d b o t t l e n e c k a n a l y s i s
H The eastbound US 50 at El Dorado Hills Blvd Bottleneck The eastbound El Dorado Hills Blvd bottleneck is caused by a traffic signal on the arterial that often causes spillbacks on the EB loop offramp onto the freeway mainlines
TABLE 15 US 50 WESTBOUnD BOTTLEnECk SUmmARY Source PeMS Caltrans tach runs and Cambridge Systematics field observations
bottleneck Location PeMS Speed Contours Caltrans Probe Vehicle Runs
Cause aM PM aM PM
A El Dorado Hills Blvd PM 275 Major Poorly coordinated traffic
signal on El Dorado Hills Blvd
B Hazel Ave PM 21 Major Entering traffic
C Zinfandel Dr PM 16 Minor Major Major Major Entering traffic
D Routier Rd PM 14 Minor Major Minor Weaving traffic
E Bradshaw PM 13 Major Major Major Merging traffic and curve
F Howe Ave PM 9 Minor Major Major Major Weaving traffic and grade
G SR 51SR 99 PM 6 Minor Lane drop weaving traffic
H i-5 PM 3 Major Weaving traffic
HigHway 50 corridor system management plan [ 51 ]
c h a p t e r s e v e n c o n g e s t i o n a n d b o t t l e n e c k a n a l y s i s
[ 52 ] HigHway 50 corridor system management plan
A El Dorado Hills Blvd Bottleneck The minor bottleneck at El Dorado Hills Boulevard is caused by the traffic signal on El Dorado Hills Blvd that causes spillback on the westbound offramp onto the freeway mainlines
B Hazel Avenue Bottleneck In 2006 the Hazel Ave Bottleneck is caused by the traffic entering at both Hazel Ave and Folsom Blvd (the two on-ramps are separated by about one mile) The bottleneck that would appear at Folsom Blvd combines with the bottleneck at Hazel ave to form a large bottleneck that does not clear until after Hazel ave Sometimes causshying spillbacks as far as Prairies City Road this bottleneck was mitigated in 2007 as part of the GO CALIFORNIA program
C Zinfandel Dr Bottleneck There is heavy traffic coming from Sunrise Blvd but the lane addition immediately after the westbound on-ramp prevents a bottleneck from forming but as traffic flows westward the heavy traffic entering from Zinfandel Dr causes a bottleshyneck here
D Routier Rd Bottleneck The bottleneck at Routier Rd is caused by weaving traffic between Mather Field Rd and Bradshaw Rd This highway segment represents a transition area where vehicles that have been traveling in the left lanes begin to shift to the right lanes to exit while the entering traffic tries to shift to the left lanes
W eav in gLan e Dr o p
c h a p t e r s e v e n c o n g e s t i o n a n d b o t t l e n e c k a n a l y s i s
e bradshaw rd bottleneck The Bradshaw Rd bottleneck is caused by the entering traffic from Bradshaw Road the high truck volumes and the curve west of Bradshaw Two Bradshaw Rd on-ramps feed into US 50 westshybound southbound Bradshaw Rd direct on-ramp and northbound Bradshaw Rd loop on-ramp approximately 400 feet apart
F Howe Ave Bottleneck The Howe ave bottleneck is caused by a grade change and the weaving traffic entering from Howe ave and Hornet Dr competing for the right-most lane with those wanting to exit at 65th Street
G amp H SR 51SR 99 amp I-5 Bottleneck The bottleneck at I 5 is caused by the conflict between entering SR 99 and SR 51 traffic and exiting I-5 traffic as well as the queues formed on the ramps to i-5 which spill back onto US 50 The number of lanes in this section reaches a maximum of 6 and then drops to 4 as two lanes exit at the I-5 freeway This bottleneck is exacershybated during the peak periods when it stretches upstream to the lane drop before SR 99
W ea v in g
Lan e Dr o p
HigHway 50 corridor system management plan [ 53 ]
c h a p t e r t h r e e c u r r e n t c o r r i d o r s y s t e m m a n a g e m e n t s t r a t e g i e s
[ 16 ] HigHway 50 corridor system management plan
Page Inte
ntionally
Left
Blank
MAIN ST
MA
RB
LE V
ALL
EY
RD
65TH ST EXPY
FLYING
C R
D
STATE
HW
Y 16
MA
RB
LE VA
LLEY R
D
CAM
BRID
GE R
D
GREEN VALLEY RD
RIV
ERSI
DE
BLVD
11T
H S
T
RIV
ERSI
DE
BLVD
HO
WE
AV
E
EL DORADO
HILLS BLVD
EL DORADO H
ILLS BLV
D
HORNET DR
JEFF
ERSO
N BL
VD
CAM
ERO
N PAR
K DR
PO
WE
R IN
N R
D
CO
UN
TY HW
Y E3
BRADSHAW RD
MATHER FIELD RD
ZINFAN
DEL D
R
11TH
ST
VD
FOLSOM BLFOLSOM BLVD
FOLSOM BLVD
FOLSO
M BLVD
WHITE ROCK RD
FOLSOM BLVD
FOLS
OM
BLV
D
LATRO
BE RD
CANAL ST
16TH
ST
JACQ
UIER
RD
15TH
ST
HARBOR BLV
D
STOCKTON BLVD
FORNI RD BIDW
ELL DR
WATT AVE
PLACERVILLE DR
TOW
ER G
ATEW
AY
SHIN
GLE SPR
ING
S DR G
REEN
STON
E RD
59TH
ST
SUN
RISE BLVD
EL D
OR
AD
O R
D
HAZEL AVE
SOUT
H RI
VER
RD
PON
DER
OSA R
D
SHIN
GLE SPR
ING
S RD
SHIN
GLE
SPR
ING
S R
D
CARSON RD
MISSO
URI FLAT RD
BASS LAKE RD
N SH
ING
LE RD
PRAIR
IE CITY R
D
S SHIN
GLE R
D
SHIN
GLE
RD
SCOTT RD
W S
T AT
5TH
ST
65TH
ST
5TH
ST
X
ST A
T 27
TH
80
CEDAR GROVE EXIT
MO
SQU
ITO R
D
PLACERVILLE DRMISSOURI
FLAT RD
FORNIRD
EL D
OR
AD
OR
D
POIN
T VIEW D
RSM
ITH FLAT R
D
SCH
NELL SC
HO
OL R
D
MO
NTER
EY RD
c h a p t e r t h r e e c u r r e n t c o r r i d o r s y s t e m m a n a g e m e n t s t r a t e g i e s
Figure 4 Existing Traffic Operations Systems Elements
Highway 50 Corridor Systems Management Plan Existing Traffic Operations Systems Excluding Ramp Meters
TOS ndash Traffic Operations Systems
Stations Continuous Coverage
EMS ndash Extinguishable Message Sign WIM ndash Weigh-in-Motion Location (EMS Usually Refers Motorist to HAR)
Television System
19365TMS ndash Traffic Monitoring99 US Highway 50VS ndash Fog (Visibility) Sensor
CCTV ndash Closed Circuit
I-80 to Cedar Grove Exit HAR ndash Highway Advisory Radio Local Road Interchange Access
White Rock RdRWIS ndash Roadside WeatherCMS ndash Changeable Sunrise Blvd to Latrobe Rd
Message Sign Information System
50
80
51
49 160
50
Placerville to Cedar Grove Exit
50
1935
16 49
99
84 160
49 MilesMiles 0 1 2 3 4 50 1 2 3 4 5 10
HigHway 50 corridor system management plans [ 17 ]
124 49
MOTHER LODE DR
MATHER FIELD RD
West Terminus
RAMP
RAMP
RAMPRAMP
RAM
P
RAMP
RAM
P RAMP
RAMPRAMP
RA
MP
RAM
P RAM
P
RAMP
RAM
P
RAM
P
RA
MP
RAM
P
RAM
P
YoloBus Express Routes Plus Routes 42A and 42B
RAMPBROADWAY
65TH
ST
PCE
65
SCRY42A
Y44Y4343
242 IPC
5
W STX ST
WATT AVE
MAROCKINGHAM
DR
OLD PLACER
BRADSHAW RD
VILLE RDTHER FIELD RD
INTERNATIONAL DR
ZINFANDEL DR
WHITE ROCK RD FOLSOM BLVD FOLSOM BLVD
SUNRISE BLVD
BLUE R
AVIN
E RD
WHITE ROCK RD
SC
OTT R
D
PR
AIR
IEC
ITY R
D
LATROBE RD
GREEN V ALLEY RD
PLACERVILLE DR
FORNI RDM
AIN ST
BROADWAY
CEDAR GROVE EXIT
WEST
CAPTOL AVE
(WESTMOST
STOP)
(WESTMOST STOP)
SCR
SCR
IPC
IPC
c h a p t e r t h r e e c u r r e n t c o r r i d o r s y s t e m m a n a g e m e n t s t r a t e g i e s
Figure 5 US 50 CSMP Network Transit Routes
Highway 50 Corridor System Management Plan 80
CSMP Commuter Transit Network
El Dorado County Transit Authority 65
IPC Iron Point Connector
SCR Sacramento Commuter Route 193
Sacramento Regional Transit District 109ndashHazel Express
Yolo Bus (Express) Y43 Y44 Y230 Y231 and Y232
Yolo Bus (All-Day Intercity amp Airport Service) Y42A (Clockwise) Y42B (Counter-clockwise)
LATROBE RD
Park-and-Ride Lots
193 65
49 US Highway 50 (I-80 to Cedar Grove Exit)
Parallel Roads
Light Rail STation
Light Rail
Class I Bikeways Other State Highways
County Lines
80
49
50
80160
50
5 84 16
4999
Miles 0 5 10160
HigHway 50 corridor system management plans [ 18 ]
K
5
FOLSOM BIKE TRAIL
SEE CENTRAL CITY BICYCLENETWORK MAP FOR BICYCLE
F ACILITY NAMES
AMERICAN RIVER PARKWAY TRAIL SYSTEM
(INCLUDING JE
DEDIAH SMITH MEMORIAL T
RAIL)
FOLSOM BLVD
WHITE ROCK RDSIL V A V ALLEY PKWY
EL D
OR
AD
O H
ILLS B
L VD
GREEN VALLEY RD
AMERICAN R
IVER PARKWAY
TRAIL
SYSTEM
(INCLU
DING JE
DEDIAH SMITH
MEMORIA
L TRAIL)
NATOMA ST
FOLSOM BLVD
EL DORADO TRAIL
CARSON RD
PLACER VILLE RD
RAY
LAW
YER
DR
c h a p t e r t h r e e c u r r e n t c o r r i d o r s y s t e m m a n a g e m e n t s t r a t e g i e s
Figure 6 US 50 CSMP Network Bicycle Routes
Highway 50 Corridor System Management Plan
Bicycle Route Network
Class I Bicycle Facilities
Class II Bicycle Facilities
193
Lincoln
65
Rocklin
Auburn
Folsom 49
193
Light Rail Stations
Light Rail Loomis50
RosevilleUS Highway 50 CSMP Corridor
Other State Highways Miles
County Lines 0 1 2 3
99
49 80
50
160 80 193
Placerville 50
West Rancho 50 Sacramento Cordova
5 0 49
8 4
9 9 Sacramento
1 6 4 9
0 1 2 Miles
3
1 6 0 Elk Grove 210 210 44 66 88
Miles 10 Miles
10 1 2 4
4 9
HigHway 50 corridor system management plans [ 19 ]
13TH
ST
H ST E ST BELVEDERE AVE
51ST
ST
BROADWAY H ST
48TH
ST
11TH
ST
PO
WE
R IN
N R
D
28TH
ST
STOC
KTON
BLVD3R
D ST
ALH
AMBR
AFR
ON
T BLV
D S
T
W CAPITOL A VE
DISCOVER Y
P ARK BRIDGE
JEDED
IAH
N ST
T ST
K ST
11TH
ST
RIV
ERSI
DE
BLV
D
18TH
ST
R S
T17
TH S
TO
ST
18TH
ST
20TH ST
CAPITOL AVE
T ST
28TH
ST
34TH
ST
39TH
ST
M ST
BROADWAY
T ST
FOLSOM BLVD
58TH
ST
J ST
65TH
ST
CSU
S
CO
NN
ECTIO
NS
SR 16JACKSON HWY
FOLSOM BLVD
LA RIVIERA DR
W ATT AV
E
HO
WE A
VE
GUY W
EST B
RIDE
COLLEGE TOWN DR
c h a p t e r t h r e e c u r r e n t c o r r i d o r s y s t e m m a n a g e m e n t s t r a t e g i e s
Figure 7 US 50 CSMP Network Bicycle Routes (Sacramento Insert)
5 Sacramento
8 0
8 0
160
West Sacramento
80
SMITH MEMORIAL TRAIL
50
US Highway 50 Corridor System Management Plan 50
Central City Bicycle Route Network 50
Bikeway and Multi-Use Network
US Highway 50 (I-80 to Cedar Grove Exit)
Class I Bicycle Facilities
Class II Bicycle Facilities
Connecting Routesndashno Bicycle Designation
80 16 5
BROADWAY
FLOR
IN-P
ER
KIN
S R
D
Light Rail STation 99
Light Rail
Other State Highways
County Lines
HigHway 50 corridor system management plans [ 20 ]
major corridor mobility challenges
chapter four
High demand for mobility services especially during peak commute periods is creating significant traffic congestion
and impairing mobility in the corridor Heavy congestion and stop-and-go traffic contributes to increased vehicle
emissions and added travel costs Many transit services are operating at maximum passenger carrying capacity and buses often must contend with the same congestion as autos in many locations bicyclists have to compete for space on these same facilities
Much of the congestion can be attributed to population growth residential and commercial development job housing imbalances work schedules that require commute trips during peak travel times recreational trip generators and truck traffic
The overall amount of travel in the corridor has increased dramatically over the past ten years and is expected to
continue to increase as the region adds approximately
one million new residents over the next 25 years per the current SACOG MTP 2035 Traffic congestion per houseshyhold is expected to increase 18 percent over 2005 levels
by the year 2035
in the general area of eastern Sacramento County and western El Dorado County the Highway 50 Partnership
has projected growth of 78000 more dwelling units and 53000 new jobs over the next 25 years Current and foreshycasted data is depicted in Table 4
The sections of US 50 with particularly severe traffic
congestion are depicted in Figures 8 and 9 These are
also summarized in greater detail in Tables 14 and 15 in Chapter 7 Table 14 shows a summary of the US 50 eastbound bottlenecks while the tables that follow discuss each bottleneck including location and possible causality Table 15 shows a summary of the US 50 westbound bottleshynecks while the tables that follow discuss each bottleneck including location and possible causality Minor or hidden bottlenecks are those that are not as defined (or severe) as the major bottlenecks Please note that the graphics acshycompanying the bottlenecks are not to scale
a critical component of identifying and resolving Traffic congestion per corridor mobility challenges household is expected is the need for detailed to increase 18 percent data analysis and comshy over 2005 levels by the munication regarding
year 2035system performance Data collection is insufficient to
fully meet these needs but still provides useful information as detailed in the following pages improving data gathershying analysis and dissemination of information is a major challenge for this corridor and is a component of intelligent Transportation Systems planning
HigHway 50 corridor system management plan [ 21 ]
c h a p t e r f o u r m a j o r c o r r i d o r m o b i l i t y c h a l l e n g e s
[ 22 ] HigHway 50 corridor system management plan
Figure 8 US 50 AM Peak Period Bottleneck Locations
Figure 9 US 50 PM Peak Period Bottleneck Locations
Challenges along the corridor include
bull severe recurrent highway and roadway traffic congestion
bull an incomplete buscarpool lane system
bull an incomplete set of freeway auxiliary lanes
bull loss or dropping of freeway lanes at specific locations
bull incomplete ramp metering
bull limited parallel roadway capacity
bull lack of signal coordination on key arterials and freeway ramp intersections
bull transit facilities approaching capacity
bull inadequate transit capital and operations funding needed to grow transit ridership
bull light rail at-grade crossings
bull lack of adequate access to transit across US 50
bull lack of double tracking of the light rail Gold Line to Folsom
bull poor pavement and road and bicycle route maintenancesweeping
bull lack of sufficient bicycle activated signal change devices
bull motorist driving behavior
bull inadequate bicycle storage
bull inadequate bicycle and pedestrian access to transit and
bull gaps and barriers within the bicycle route network
Additionally the EDCTC has identified safety and operashytional issues between the Smith Flat interchange and east of the Upper Carson RoadCamino intersection in the
Camino Area Parallel CapacitySafety Study Transporshytation issues include at-grade access to US 50 left turn conflicts across US 50 increasing average daily local and
interregional traffic growth in the area lack of alternate
routes seasonal traffic to and from Apple Hill and other local events and seasonal access to recreation in the Lake
Tahoe Region
c h a p t e r f o u r m a j o r c o r r i d o r m o b i l i t y c h a l l e n g e s
Table 4 CUrrenT and ForeCaSTed TraFFiC daTa
location Current Traffic data ndash 2007 Future Traffic data ndash 2027 (no build) Future Traffic data ndash 2027 (build)
County description amp location of Trucks
Peak directional
Split
Peak Hour Traffic
average annual daily
Traffic2
Volume over Capacity3
Peak Hour Traffic
average annual daily Traffic2
Volume over Capacity3
(no-build)
Peak Hour Traffic
average annual daily
Traffic2
Volume over Capacity3
(build)
yOL interstate 80 to yoloSacramento County Line
6 60 15500 180000 109 23911 277032 169 24070 278880 136
SaC yoloSacramento County Line to State Routes 99 and 51
4 59 21000 253000 135 28080 312480 186 29153 324415 193
SaC State Routes 99 and 51 to watt avenue 4 59 20600 225000 145 27942 286230 189 30648 313950 166
SaC watt avenue to Zinfandel Drive 4 59 16700 187000 115 24783 274540 163 25885 286750 136
SaC Zinfandel Drive to Sunrise Boulevard 4 60 13500 149000 093 20331 224394 133 20925 230950 110
SaC Sunrise Boulevard to Folsom Boulevard 4 66 11900 125000 089 18888 198247 131 20086 210820 140
SaC Folsom Boulevard to SacramentoEl Dorado County Line
3 66 8800 95000 087 13341 151311 133 13612 154380 136
ED SacramentoEl Dorado County Line to Cameron Park Drive
4 61 6900 70000 095 11454 116200 165 11834 120050 114
ED Cameron Park Drive to Missouri Flat Road
4 62 5700 62000 092 8647 94054 132 9462 102920 096
ED Missouri Flat Road to End of Freeway in Placerville
4 57 4850 59000 069 7101 76245 098 7363 79050 102
ED End of Freeway in Placerville to Bedford avenue
4 55 4800 52000 Na 4 6595 74196 Na4 6648 74790 Na4
ED Bedford avenue to Cedar grove Exit 4 62 3800 38500 077 5474 50782 099 5520 51205 099
1 Peak Directional Split The percentage of total traffic in the heaviest traveled direction during the peak hour2 Average Annual Daily Traffic (AADT) The average number of vehicles per day in both directions 3 Volume over Capacity (VC) The volume of traffic compared to the capacity of the roadway4 Volume over Capacity does not determine LOS for two- or three-lane facilities or segments with intersection delay 5 Reported Collision Rate index ( Compared to State average) The percentage by which each segmentrsquos reported collisions rate (fatal injury and property damage only) is above or below the statewide average reported collisions rate on comparable facilities
Source 3-Year Caltrans Traffic Accident Surveillance and Analysis System data
HigHway 50 corridor system management plans [ 23 ]
c h a p t e r f i v e p e r f o r m a n c e m e a s u r e s
Page Inte
ntionally
Left
Blank
[ 24 ] HigHway 50 corridor system management plan
performance measures
chapter five
Continuing corridor monitoring and performance mea-
sures are an integral part of corridor management and investment decision making and help identify immediate efficient and effective system operational strategies and
capital improvements Performance measures provide the
important dynamic daily information needed to rapidly
address operational problems caused by recurrent and
non-recurrent traffic congestion Measures are also used to identify the best improvement actions to generate the desired results
Table 5 identifies the performance measures to be used as
part of the corridor system management process
Baseline Data For perFormance measures Tables 6 7 and 8 display baseline data for the perforshymance measures for the CSMP transportation network
The performance data was primarily compiled from the SACMET demand based traffic model the year 2007
edition of the Traffic Volumes Manual the year 2000 edition of the Highway Capacity Manual Caltrans Traffic
Accident Surveillance and Analysis System (TASAS) the 2007 Caltrans Division of Maintenance Pavement Summary Report and ridership records provided by the transit providers
additional performance Performance Measures data was derived from the provide the important Performance Measurement dynamic dailySystem (PeMS) tool an
information needed internet based tool used to
to rapidly addresshost process retrieve and operational problemsanalyze road traffic condishy
tions information from caused by recurrent
real-time and historical and non-recurrent data PeMS obtains 30-sec- traffic congestion ond loop detector data in real-time from detectors installed along the highway corridor
It should be noted that Average Daily Traffic (ADT) and LOS
for some ParallelConnecting Roadways segment locations
in Table 7 was not available These are noted ldquoNo Datardquo
Data collection for non-auto modes is not as robust as what is needed for active system management Subsequent updates of this CSMP will seek to expand the
availability of transit and bicycle performance data collection
HigHway 50 corridor system management plan [ 25 ]
mdash
c h a p t e r f i v e p e r f o r m a n c e m e a s u r e s
TABLE 5 PERFORmAnCE mEASURES DEFInITIOnS AnD APPLICABILITY
Performance Measure Definition of Performance measure applicability to Corridor
STATE HIGHWAY SYSTEm
LOS A ldquoreport cardrdquo measurement with ldquoArdquo being the least amount of
congestion and ldquoFrdquo being the most congestion LOS is a relatively simple and widely used measure which
offers comparison opportunities
Total Vehicle Hours of Delay The additional travel time in hours experienced by all vehicles on the highway segment per day or at peak hour due to congestion
This measurement is used to determine the cost in time which congestion can add to the regular travel time that it takes to traverse a segment of road and is useful in
quantifying the performance of a particular roadway in an understandable format
Total Person Minutes of Delay The additional travel time in minutes experienced by all persons in vehicles on the highway segment per day or at peak hour due
to congestion
This measurement is used to determine the cost in time which congestion can add to the regular travel time that it takes to traverse a given segment of road and is useful in quantifying the performance of a particular roadway in an
understandable format and for comparison of improvement options
Minutes of Delay per Vehicle The additional travel time in minutes experienced by each vehicle on the highway segment at peak hour due to congestion
This measurement is used to determine the cost in time which congestion can add to the regular travel time that it
takes to traverse a given segment of road
Minutes of Delay per Person The additional travel time in minutes experienced by each person in vehicles on the highway segment at peak hour due to congesshy
tion
This measurement is used to determine the cost in time which congestion can add to the regular travel time that it
takes to traverse a given segment of road
Vehicle Travel Time (Minutes) The average time spent by vehicles traversing between two points on a road or highway
Travel time is a measure used to quantify travel time deficienshycies and provide a personal indicator of congestion impacts
Distressed Pavement Pavement that rides rougher than established maximums and or exhibits substantial structural problems as determined by the
Pavement Condition Survey
This measurement provides a ride quality indicator and an indicator for structural roadway problems
Reported Collision Rate Comparison of the actual total collision rate () along a highway segment above or below the statewide average for fatal injury
and property damage-only collisions on comparable facilities
Comparing the total collision and rate with statewide average rate provides an opportunity to assess safety conditions
through the corridor
Reliability Identifies day-to-day variation in travel time for the same trip at the same time of day Focuses on the predictability of travel time
particularly for repetitive trips
Estimates reliability by defining the extra time travelers must add to their average travel time when planning trips to ensure on-time arrival (0 percent no day-to-day variations
100 percent double allotted travel time)
Lost Productivity Measures the capacity of the corridor to accommodate vehicle or person throughput and is calculated as actual volume divided by
the capacity of the highway
As traffic volumes increase to roadway capacity speeds decline rapidly and vehicle throughput drops dramatically which increases traffic congestion and delay and results in
lost productivity
[ 26 ] HigHway 50 corridor system management plan
mdash
c h a p t e r f i v e p e r f o r m a n c e m e a s u r e s
HigHway 50 corridor system management plan [ 27 ]
TABLE 5 PERFORmAnCE mEASURES DEFInITIOnS AnD APPLICABILITY (ConTInued)
Performance Measure Definition of Performance measure applicability to Corridor
PARALLEL AnD COnnECTInG ROADWAYS
LOS A ldquoreport cardrdquo measurement with ldquoArdquo being the least amount of
congestion and ldquoFrdquo being the most congestion LOS is a relatively simple and often used measure which
offers comparison opportunities
traNSit
available Capacity Ratio () of available transit capacity alternatives within the corridor
This measure indicates the available capacity to accommoshydate diverted travelers from single occupant vehicles
c h a p t e r f i v e p e r f o r m a n c e m e a s u r e s
[ 28 ] HigHway 50 corridor system management plan
Page Inte
ntionally
Left
Blank
c h a p t e r f i v e p e r f o r m a n c e m e a s u r e s
Table 6 US 50 PerForManCe MeaSUreS
County location Post Miles
distance (Miles)
average annual daily Traffic1
PerForManCe MeaSUreS
loS1
Total Vehicle Hours of delay2
Total Person Minutes of delay2
Minutes of delay per Vehicle2
Minutes of delay per Person2
Vehicle Travel Time (Minutes)2 distressed
Pavement (lane
Miles)4
reported Col-lision rate
Comparison ()5
reliability6 lost Productivity7
daily Peak Hour3 daily Peak
Hour3 Peak Hour3 Peak Hour3 Peak Hour3 eastbound westbound lost lane Miles aM
Peak Period
lost lane Miles PM
Peak Period
STaTe HigHway SySTeM
yOL interstate 80 to yolo Sacramento County Line
000 to 316 316 180000 F 1169 126 95363 8061 049 046 36 9 26 62 22 01 0
SaC
yoloSacramento County Line to State Routes 99
and 51
L000 to L248 R000
248 253000 F 4993 653 407455 41746 186 175 43 7 20 64 60 53 76
State Routes 99 and 51 to watt avenue
R000 to R534 534 225000 F 10097 1362 823883 87105 397 372 93 15 24 60 48 81 68
watt avenue to Zinfandel Drive
R534 to R1092 558 187000 F 8075 977 658886 62506 351 329 91 19 -32 56 42 44 23
Zinfandel Drive to Sunrise Boulevard
R1092 to 1250 158 149000 E 1271 197 103727 12610 088 082 25 9 -33 46 13 0 16
Sunrise Boulevard to Folsom Boulevard
1250 to 1701 451 125000 E 3087 356 251940 25832 180 149 63 5 -14 60 46 1 45
Folsom Boulevard to SacramentoEl Dorado
County Line
1701 to 2314 613 95000 D 583 122 47537 8867 083 069 70 0 -11 19 55 0 08
ED
SacramentoEl Dorado County Line to Cameron
Park Dr
000 to R657 657 70000 E 504 126 41150 9138 110 091 77 1 -35 PeMS Data
Unavailable PeMS Data Unavailable
PeMS Data Unavailable
PeMS Data Unavailable
Cameron Park Drive to Missouri Flat Road
R657 to R1506 849 62000 E 302 75 24633 4827 079 075 93 2 -61 PeMS Data
Unavailable PeMS Data Unavailable
PeMS Data Unavailable
PeMS Data Unavailable
Missouri Flat Road to End of Freeway in Placerville
R1506 to 1725 219 59000 D 66 16 5376 1053 020 019 24 1 20 PeMS Data
Unavailable PeMS Data Unavailable
PeMS Data Unavailable
PeMS Data Unavailable
End of Freeway in Placerville to Bedford avenue
1725 to 1811 086 52000 D 68 17 5585 1094 021 020 15 2 81 PeMS Data
Unavailable PeMS Data Unavailable
PeMS Data Unavailable
PeMS Data Unavailable
Bedford avenue to Cedar grove Road
1811 to R2595 784 38500 D 58 15 4758 932 023 022 85 10 6 PeMS Data
Unavailable PeMS Data Unavailable
PeMS Data Unavailable
PeMS Data Unavailable
TOTaL mdash 5473 mdash mdash 30273 4042 2470293 263771 1587 1449 7150 80 mdash mdash mdash mdash mdash
1 Source Average Annual Daily Traffic and Level of Service (LOS) calculated is based on 2007 Caltrans Traffic Volumes on California State Highways and Highway Capacity Manual and Cambridge Systematics from 2008 Reported LOS is for the typical most congested daily peak travel period 2 Source Delay is the average additional travel time by vehiclespersons traveling under 60 mph Data derived from 2007 HICOMP report SACMET Travel Demand Model PeMSs traffic data and Caltrans District 3 Traffic Operations Probe vehicle Tach runs 3 Peak Hour is during PM 4 Source 2007 Caltrans Division of Maintenance Pavement Summary Report 5 Source 2004 through 2007 Caltrans Traffic Accident Surveillance and Analysis System summary data of the percentage above or below the statewide average for fatal injury and property damage-only collisions on comparable facilities 6 Reliability The Planning Time Index is a measure of the reliability of the travel time on a particular route It is the ratio of the 95th percentile of travel time on a route to the median free-flow travel time This means itrsquos the amount of time a traveler needs to allocate for a route if they want to show up on time 19 out of 20 trips Reliability and Planning Time data was taken from April 2007 The data covered a 24-hour period of time on each Tuesday wednesday and Thursday of that month That data was then aggregated into a single average 24-hour day it was then analyzed to determine the highest average aM and PM travel time That time was then compared to the best possible average travel time to determine the additional time that was spent traveling the same seg-ment 7 Lost Productivity Data taken April 2007 PeMS As traffic increases to the capacity of the highway speeds decline throughput drops dramatically and the efficiency of the highway to provide mobility decreases This decline in the potential carrying-capacity of the freeway is expressed in terms of how many equivalent lane miles of roadway are lost
HigHway 50 corridor system management plans [ 29 ]
c h a p t e r f i v e p e r f o r m a n c e m e a s u r e s
Table 7 Parallel and ConneCTing roadwayS PerForManCe MeaSUreS
County location average
daily Traffic1
PerForManCe MeaSUreS
loS1
Total Vehicle Hours of delay2
Total Person Minutes of delay2
Minutes of delay per Vehicle2
Minutes of delay per Person2
Vehicle Travel Time (Minutes)2
distressed Pavement
(lane Miles)4
daily Peak Hour3 daily Peak
Hour3 Peak Hour3 Peak Hour3 Peak Hour3
Parallel and ConneCTing roadwayS
yOL west Capitol Enterprise Boulevard to Capitol Mall 13737 No Data
Data is unavailable for these performance measures at this time however will be pursued in the next phase of the CSMP
SaC
w 5th Street to 26th Street 9194 a
X 5th Street to 26th Street 9154 a
Folsom Boulevard watt avenue to Bradshaw Road 25600 C
watt avenue Folsom Boulevard to US 50 63900 F
Bradshaw Road Folsom Boulevard to US 50 22400 a
Folsom Boulevard Bradshaw Road to Sunrise Boulevard 20400 a
Bradshaw Road Old Placerville to US 50 54405 F
Old Placerville Road Bradshaw Road to Rockingham Drive 11864ndash18365 a
Rockingham Drive Old Placerville Road to Mather Boulevard 16516 E
Mather Boulevard Rockingham Drive to Folsom Boulevard 21732 C
international Drive Rockingham Drive to Zinfandel Drive 12808 a
Zinfandel Drive international Drive to Folsom Boulevard 22298ndash47032 BE
white Rock Road Zinfandel Drive to Sunrise Boulevard 25459 a
Sunrise Boulevard US 50 to Folsom Boulevard No Data No Data
white Rock Road Sunrise Boulevard to Prairie City Road 3400 B
Folsom Boulevard Sunrise Boulevard to iron Point Road 17200 a
white Rock Road grant Line Road to EDSaC County Line 6700 D
iron Point Road Folsom Boulevard to East BidwellScott Road 13984 No Data
Scott Road iron Point Road to white Rock Road No Data No Data
Folsom Boulevard iron Point Road to Blue Ravine Road No Data No Data
Blue Ravine Road Folsom Boulevard to green Valley Road No Data No Data
Prairie City Road US 50 to white Rock Road 6000 D
HigHway 50 corridor system management plans [ 30 ]
c h a p t e r f i v e p e r f o r m a n c e m e a s u r e s
Table 7 Parallel and ConneCTing roadwayS PerForManCe MeaSUreS (ConTinUed)
County location average
daily Traffic1
PerForManCe MeaSUreS
loS1
Total Vehicle Hours of delay2
Total Person Minutes of delay2
Minutes of delay per Vehicle2
Minutes of delay per Person2
Vehicle Travel Time (Minutes)2
distressed Pavement
(lane Miles)4
daily Peak Hour3 daily Peak
Hour3 Peak Hour3 Peak Hour3 Peak Hour3
Parallel and ConneCTing roadwayS
ED
green Valley Road EDSaC County Line to Francisco Drive 22600 D
Data is unavailable for these performance measures at this time however will be pursued in the next phase of the CSMP
green Valley Road Francisco Drive to Silva Valley Parkway 13077 D
green Valley Road Silva Valley Parkway to Cameron Park 9849 C
green Valley Road Cameron Park Drive to Deer Valley Road 5278 C
green Valley Road Deer Valley Road (East) to Lotus Road 8381 D
green Valley Road Lotus Road to Placerville Drive 4669 C
Latrobe Road white Rock Road to US 50 24742 C
Durock Road Cameron Park Dr to South Shingle Road 7278 C
Cameron Park Drive Durock Road to US 50 (Durock Road to Coach Lane Coach Lane to US 50) 9544 26603 CD
South Shingle Road Durock Road to US 50 11390 D
white Rock Road EDSaC County Line to Latrobe 12808 D
white Rock Road Latrobe Rd to Silva Valley Pkwy (Latrobe to PostPost to Silva Vlly Pkwy) 10124 CD
Silva Valley Parkway white Rock Rd to Serrano Pkwy (white Rock to Entrada Entrada to Serrano Pkwy) 13708 9328 DC
Forni Road Placerville Drive to Main Street 9049 8379 No Data
Placerville Drive Forni Road to US 50 No Data No Data
Main Street Placerville Drive to Bedford avenue No Data No Data
Main Street Bedford avenue to Broadway No Data No Data
Broadway Main Street to Point View Drive No Data No Data
1 Source Average Daily Traffic and Level of Service (LOS) calculated are based on City of Sacramento between 2001 and 2007 Sacramento County from 20072008 City of Rancho Cordova between 2004 and 2007 and El Dorado County from 2007
HigHway 50 corridor system management plans [ 31 ]
c h a p t e r f i v e p e r f o r m a n c e m e a s u r e s
Page Inte
ntionally
Left
Blank
[ 32 ] HigHway 50 corridor system management plan
c h a p t e r f i v e p e r f o r m a n c e m e a s u r e s
tabLe 8 traNSit PerforMaNCe MeaSure
County transit Provider route Performance Measure
available daily Capacity ()1 available Peak Hour Capacity1
traNSit
SaC
SacRT (Bus)
Route 21 70 10
Route 28 76 59
Route 36 83 74
Route 38 66 44
Route 72 56 20
Route 73 79 45
Route 74 82 43
Route 109 47 22
SacRT (Light Rail) Gold Line 31 Exceeds Capacity
EDSAC ED County Transit Authority
Commuter Express Bus Service Not applicablendashOperates Peak Hour
Only 405
iron Point Connector 764 Not available
Reverse Commuter Not applicablendashOperates Peak Hour Only 982
yoloSaC yolo County Transit District Not applicablendashOperates Peak Hour Only 498
biKe3
1 Source average Daily and Peak Hour available Capacity calculated from each transit providerrsquos route ridership data 2 The Reverse Commuter service is offered on vehicles that are returning to El Dorado County (Commuter Express Buses) 3 Bicycle performance measure(s) will be identified applied and included in the subsequent CSMPs
HigHway 50 corridor system management plan [ 33 ]
c h a p t e r f i v e p e r f o r m a n c e m e a s u r e s
[ 34 ] HigHway 50 corridor system management plan
Page Inte
ntionally
Left
Blank
planned corridor system management strategies
chapter six
ConCept LoS and ConCept FaCiLit y ldquoConcept LOSrdquo and ldquoConcept Facilityrdquo have traditionally been used in Caltrans TCCRs to reflect the minimum level or quality of operations acceptable for each route segment within the 20-year planning period and the highway facility needed in the next 20 years to maintain the Concept LOS
Typical Concept LOS standards in Caltrans District 3 are LOS ldquoDrdquo in rural areas and LOS ldquoErdquo in urban areas how-ever some heavily congested route segments now have a Concept LOS ldquoFrdquo because the improvements required to bring the LOS to ldquoErdquo are not feasible due to environmental right of way financial and other constraints The applica-tion of multi-modal corridor management strategies should reduce the severity and duration of congestion and provide viable travel options and information that will enable a traveler to avoid severe freeway congestion
The Concept LOS and Concept Facility for US 50 are shown in Table 9 almost all US 50 segments are forecasted to operate under LOS ldquoFrdquo conditions in 20 years under the No-Build and Build scenarios
Corridor ManageMent StrategieS The US 50 CSMP also proposes specific strategies to enhance corridor mobility (see Table 10) based on the fol-lowing principles
bull Manage all modes and facilities in the corridor as a single system beginning with the transportation net-work defined in this CSMP
bull Implement comprehensive and dynamic multimodal monitoring and reporting for the system and for all modes
bull Develop and use micro-simulation modeling to identify mobility challenges and to evaluate proposed solutions
bull Complete the projects included in the regional trans-portation plans with an emphasis on the completion of the key mobility improvement projects identified in this CSMP (see Tables 11 and 12)
bull Implement the specific strategies outlined in this CSMP
Key CapitaL projeCtS Tables 11 and 12 contain key capital projects that have been identified as the most critical to corridor mobility These are also included in the SaCOg MTP for 2035 and are either planned without any funding yet programmed are partially programmed
The US 50 CSMPor are entirely programmed SACOG conducted significant proposes specific
public attitude research strategies to enhance for the MTP for 2035 to corridor mobility complement comprehensive outreach efforts through community workshops the TALL Order Moving the Region Forward event the televised Town Hall Road Map for the Future and associated public polling The results of the SaCOg analyses and public out-reach for the MTP were
highway 50 corridor system management plan [ 35 ]
c h a p t e r s i x p l a n n e d c o r r i d o r s y s t e m m a n a g e m e n t s t r a t e g i e s
[ 36 ] HigHway 50 corridor system management plan
used when selecting the key projects for identification in
the CSMP and to ensure consistency Not all corridor projshyects in the MTP are included in the CSMP since the CSMP focuses on the managed network and the SaCOg MTP considers all streets and roads bike routes and transit services in the corridor
highway 50 partnership The Highway 50 Partnership is a cooperative public-private effort among the County of Sacramento City of Rancho
Cordova City of Folsom County of El Dorado and several major landowners that recognize the need to consider corrishydor mobility needs holistically
The Partnership has collaborated effectively to develop a Plan to improve mobility in the US 50 Corridor from Rancho
Cordova to El Dorado Hills an area identified as approprishyate for growth in the SACOG Blueprint Recognizing the
need to generate private investment the Partnership is seeking to implement a regional Highway 50 Corridor fee program to fund these projects
in addition to the key projects indicated in Table 11 Table 12 displays the key projects identified by the
Partnership
These projects include (1) Near-Term Priority Improvement Projects and (2) Near-Term Expected Roadway Improveshyments
The Near-term Priority improvement Projects would proshyvide several new roadway connections for people to travel within and through the area to avoid congestion They also include new transit routes and widening existing roadways
viewed by the Partnership as a package that would provide system-wide travel benefits These improvements targeted
for completion through 2012 would reduce vehicle hours of delay during commute hours by 30 percent
The near-Term Expected Roadway Improvements are conshysidered by the Partnership to be readily expected since they are tied to expected development or are part of a near-term
capital improvements program
Visionary projects Visionary projects are not yet included in the SaCOg MTP or EDCTC RTP but appear to offer considerable corridor mobilshyity benefits and merit further analysis and consideration for inclusion in the next MTP and RTP These are displayed in
Table 13
The ldquoPlus 10 Listrdquo in the SACOG MTP identifies projects
that are attractive from a performance standpoint but could not be included in the Final Project Lists because of financial constraint The ldquoPlus 10 Listrdquo element offers the
opportunity to include projects that would not be affordshyable without additional funding Some projects identified in
the Visionary Projects List were analyzed by SACOG during
development of the current MTP Some of these are included in the ldquoPlus 10 Listrdquo
Watt Avenue Light Rail Station Improvement Project
c h a p t e r s i x p l a n n e d c o r r i d o r s y s t e m m a n a g e m e n t s t r a t e g i e s
Table 9 US 50 ConCePT loS and FaCiliTy TyPe
location Forecasted level of Service1 (loS) and Facility Type
County description and location From Post Mile To Post Mile Current
loS1 20-year no build loS12
20-year build loS12
20-year Concept
loS13 existing Facility4 Concept Facility456 Ultimate Facility457
yOL interstate 80 to yoloSacramento County Line
000 316 F F F F 8F (6F between Jefferson Blvd ramps)
8F+2HOV+aux Lanes 8F+2HOV+aux Lanes
SaC yoloSacramento County Line to SR 99 and 51
L000 L248 = R000 F F F F 8F 8F+2HOV+aux Lanes 8F+2HOV+aux Lanes
SaC State Routes 99 and 51 to watt avenue R000 R534 F F F F 8F 8F+2HOV+aux Lanes 8F+2HOV+aux Lanes
SaC watt avenue to Zinfandel Drive R534 R1092 F F F F 8F 8F+2HOV+aux Lanes 8F+2HOV+aux Lanes
SaC Zinfandel Drive to Sunrise Boulevard R1092 1250 E F F F 8F 8F+2HOV+aux Lanes 8F+2HOV+aux Lanes
SaC Sunrise Boulevard to Folsom Boulevard 1250 1701 E F F F 6F+2HOV to Hazel ave 4F+2HOV
to Folsom Blvd
6F+2HOV+aux Lanes to Hazel ave 4F+2HOV+aux
Lanes to Folsom Blvd
8F+2HOV+aux Lanes
SaC Folsom Boulevard to SaCED County Line 1701 2314 D F F F 4F+2HOV 4F+2HOV+aux Lanes 6F+2HOV+aux Lanes
ED SacramentoEl Dorado County Line to Cameron Park Drive
000 R657 E F F F 4F 4F+2HOV+aux Lanes 6F+2HOV+aux Lanes
ED Cameron Park Drive to Missouri Flat Road R657 R1506 E F E E 4F 4F+2HOV+aux Lanes to greenstone 4F+aux Lanes
to Missouri Flat
6F+2HOV+aux Lanes to greenstone 4F+2HOV+aux Lanes
to Missouri Flat
ED Missouri Flat Road to End of Freeway in Placerville
R1506 1725 D F F F 4F 4F+aux Lanes 4F+aux Lanes
ED End of Freeway in Placerville to Bedford avenue
1725 1811 D E E E 4E 4E 4E
ED Bedford avenue to Cedar grove Exit 1811 R2595 D F F F 4F to Smith Flat 4E to Camino 4F+aux Lanes to Smith Flat 4E to Camino
4F+aux Lanes
1 Level of Service (LOS) A ldquoreport cardrdquo for evaluating traffic flow with ldquoArdquo being the best and ldquoFrdquo being the worst 2 20-year LOS (No Build) The LOS that would be expected at 20 years with no improvements 3 20-year Concept LOS The minimum acceptable LOS over the next 20 years 4 Facility Type Codes C=Conventional Highway E=Expressway F=Freeway HOV=High Occupancy Vehicle Lanes aux=auxiliary Lanes 5 Operational improvements are included in future facilities for all segments Examples of operational improvements include TOS improvements and auxiliary lanes 6 Concept Facility the future roadway with improvements needed in the next 20 years if LOS ldquoFrdquo no further degradation of service from existing ldquoFrdquo is acceptable as indicated by delay performance measurement 7 Ultimate Facility The future roadway with improvements needed beyond a 20 year timeframe
HigHway 50 corridor system management plans [ 37 ]
c h a p t e r f i v e p e r f o r m a n c e m e a s u r e s
Table 10 US 50 CSMP STraTegieS
Strategy description implementation Challenges
Maintain and operate the existing corridor multi-modal trans-
portation infrastructure
Maintain the existing investment in all modes of the transportation system and provide adequate resources for daily operations including operating
revenues for transit services
Funding availability funding competition within the region
Fully coordinate the delivery of transportation services and facili-ties in the corridor including daily operations and system planning
for enhancements
Interagency operational coordination to maximize the efficiency and effec-tiveness of all modes operating in the corridor with a focus on the CSMP transportation network defined in this CSMP Use of an existing group or
committee to provide initial oversight for this strategy
Diverse interests and competing priorities and limited resources
Construct planned and pro-grammed corridor capital improve-
ment projects
implementation of the capital improvements in the corridor included within the approved Metropolitan Transportation Plan and Regional Transportation
Plan for all transportation modes within the scope schedule and cost specified
Funding availability funding competition within the region
Comprehensive daily monitoring of the status of all modes providing service on the CSMP transporta-
tion network
Full deployment of multimodal transportation service status detection systems for all CSMP network components
Funding availability funding competition within region
Provide traveler information to the public
Provide the public with real-time easily accessible information regarding the status of all CSMP transportation system components so as to allow travel-
ers to make informed decisions about trip mode time and routing options
Funding availability funding competition within region
Continually monitor and analyze the CSMP transportation network to improve system performance
Monitor transportation performance measures and make system modifica-tions as appropriate on a frequent and timely basis Staff resources and data availability
Decrease the duration of non-recurrent traffic congestion
Expand and enhance the Freeway Service Patrol to respond to automobile accidents and vehicle break-downs
Funding availability funding competition within the region
Timely implementation of STaRNET
Expedite the implementation of the STaRNET operators of transportation facilities and emergency responders in the Sacramento region through real-time sharing of data and live video refinement of joint procedures
pertaining to the operation of roadways and public transit and public safety activities as well as enhance the regionrsquos 511 web site and interactive
telephone service to provide more traveler information
Developmental time acceptance by agencies and integration into daily use and identifica-
tion of maintenance and operations funding
Enhance transit and rail service increase transit service frequency provide express transit services imple-
ment bus rapid transit routes reduce headways for light rail and buses and construct planned light rail line extensions
Funding availability funding competition within the region
Complete Bus Carpool lane network
Complete the regional buscarpool lane network including freeway-to-freeway HOV lane connectors
Funding availability funding competition within the region Public agency and public
acceptance of network
[ 38 ] HigHway 50 corridor system management plan
c h a p t e r s i x p l a n n e d c o r r i d o r s y s t e m m a n a g e m e n t s t r a t e g i e s
tabLe 10 uS 50 CSMP StrategieS (ConTInued)
Strategy Description implementation Challenges
Enhance Transportation Demand Management strategies
Encourage employers to provide telecommuting and flexible working hour options to employees
acceptance by employers and resources to participate
Optimize the timing and synchronishyzation of traffic signals
Coordinate the optimization and timing of traffic signals on freeway ramps and along parallel and connecting roadways within and between jurisdicshytions to improve traffic flow and reduce congestion Provide signal priority
systems for transit vehicles
Funding availability and coordination among cities counties and Caltrans
improve access management of freeways and parallel connecting roadways
Develop and implement access management strategies to maintain the operational efficiency of freeways and parallelconnecting roadways
agreement between responsible jurisdicshytions as to where increased access control is needed increased access control on some parallelconnecting roadways may increase
traffic volumes on non-corridor roads
Develop innovative use of CMSs (eg travel times)
Potential uses of CMSs to improve system efficiency include the use of CMSs along portions of all corridors near transit station to indicate travel
times based on real-time existing traffic conditions on the freeway as well as on parallel roadways and express bus and light rail services CMS can also be used to identify the number of parking spaces that are still available at
the light-rail stations
Funding availability funding competition within the region
Implement amp expand Transit AVLTransit status information
enhancements for system users
Expand the use of AVL systems utilizing GPS technology to track in real-time the location of transit vehicles monitor transit schedules dispatch transit vehicles and provide real-time passenger information such as ldquonext busrdquo or
ldquonext trainrdquo arrival times
Funding availability funding competition within region
Expand Park-and-Ride lots at key locations
Add additional capacity to existing park-and-ride lots near transit stations and other locations that are approaching capacity
Funding availability funding competition within the region and available land
improve bike-pedestrian access in the CSMP
transportation network
Plan and program for construction of additional bicycle paths lanes and related improvements for access and connectivity to transit park and ride
lots and destination points
Funding availability funding competition within the region
Provide ldquoBike-SharingrdquordquoCar-Sharingrdquo tofrom transit (ldquoCarlinkrdquo) and from
neighborhoods
Expand the Regional Rideshare and Spare-the-Air programs to include bicycle and car sharing opportunities
Funding availability and coordination between SaCOg TMa air Districts employers developshyers property managers and local government
officials
Provide parking management stratshyegies in interested jurisdictions where applicable to discourage
use of single-occupant vehicles
in higher-density areas provide preferential parking for carpools and vanshypools require residential parking permits remove on-street parking and or provide graduated parking fees for metered on-street parking based on
vehicle type and time of day for SOV spaces to encourage transit use
Acceptance by businesses local officials and the general public
Expand bicycle commute amp transit fare strategiessubsidies
increase participation by large employers in programs that subsidize transit fares for employees during peak-hour commute times and provide bicycling
to work incentives
Voluntary participation by large employers to pay subsidy to transit providers
HigHway 50 corridor system management plan [ 39 ]
c h a p t e r s i x p l a n n e d c o r r i d o r s y s t e m m a n a g e m e n t s t r a t e g i e s
tabLe 11 KeY CaPitaL ProjeCtS
CountyLead agency
route roadway from to Project
Description Programmed
funds
additional funding Needed
total Cost estimate (x $1000)
Comp Year (FFY)
uS 50
Sacramento Caltrans District 3
US 50 Downtown watt avenue HOV Lanes $0 $75000 $75000 2020
Sacramento Caltrans District 3
US 50 watt avenue Sunrise Blvd HOV Lanes $165000 $0 $165000 2013
Sacramento Caltrans District 3
US 50 Bradshaw Road
Mather Field Road
Eastbound and Westbound Auxiliary Lanes
$0 $3700 $3700 2016
Sacramento Caltrans District 3
US 50 State Route 99
(Oak Park Interchange) interchange improvements including buscarpool lane
connectors $0 $150000 $150000 2014
Sacramento Caltrans District 3
US 50 interstate 5
(Riverfront Interchange) Riverfront Interchange
improvements including bus carpool lane connectors
$30000 $170000 $200000 2016
ED Caltrans District 3 US 50 Camino
Operational Safety improvements Construct an
undercrossing median barrier modify local road connections andor associated operational improvements on and adjacent
to US 50
$15000 $0 $15000 2012
ED ED County DOT US 50
west of Latrobe Road
west of Bass Lake
grade HOV Lanes (Ph1) $47141 $0 $47141 2010
ED Caltrans District 3 US 50
west of Bass Lake Road
Ponderosa Road
HOV Lanes (Ph2) $55000 $0 $55000 2011
ED Caltrans District 3 US 50 Ponderosa
Road greenstone
Road HOV Lanes (Ph3) $22357 $0 $22357 2013
ED ED County DOT US 50 Future Silva
Valley iC
Future Empire Ranch IC
Mainline Widening construct new WB lane within the
median from proposed Silva Valley IC to proposed Empire
Ranch IC
$2950 $0 $2950 2013
[ 40 ] HigHway 50 corridor system management plan
c h a p t e r s i x p l a n n e d c o r r i d o r s y s t e m m a n a g e m e n t s t r a t e g i e s
tabLe 11 KeY CaPitaL ProjeCtS (ConTInued)
CountyLead agency
route roadway from to Project
Description Programmed
funds
additional funding Needed
total Cost estimate (x $1000)
Comp Year (FFY)
PARALLEL AnD COnnECTInG ROADWAYS
ED ED County DOT
Silva Valley Parkway
Entrada Drive
Future US 50
Silva Valley Parkway iC
Widen Silva Valley Road from 2 lanes to 4 lanes includes
Class ii bike lanes and left turn storage pockets
$2921 $0 $2921 2010
ED ED County DOT
Silva Valley Parkway US 50
US50 Silva Valley Parkway (Phase 2) Includes constructshying overcrossing and ramps
signalization at EB and WB on off ramps
$57817 $0 $57817 2016
ED ED County DOT
Headington Road
Missouri Flat Road
El Dorado Road
Extend 2 lanes with median $9878 $0 $9878 2012
ED ED County DOT
Durock Road
Robin Lane South
Shingle Road
Extend 2 lanes with median $1239 $9214 $10453 2015
ED ED County DOT
Durock Road
Business Center Drive intersection signalization
includes adding turn pockets on Durock Road
$4333 $0 $4333 2009
ED City of Placerville
Point View Drive Broadway Smith Flat
Road Extend 2 lanes $1300 $0 $1300 2020
ED City of Placerville
western Placerville
US 50 interchange
Forni Road Ray Lawyer
Drive
Placerville Drive
Interchange Reconstruction convert Ray Lawyer Dr
Overcrossing to full IC Auxiliary Lanes
$5059 $34741 $39800 2020
Sacramento City of Rancho
Cordova
Mather Boulevard
Rockingham Road
Zinfandel Drive widen to 4 lanes $0 $8617 $8617 2020
Sacramento Rancho Cordova
Parkway ii
Grant Line Road
White Rock Road
New 6-lane expressway includshying intersection improvements at Kiefer Blvd amp White Rock
Road
$0 $44518 $44518 2020
Sacramento City of Folsom
Scott Road US 50 White Rock Rd
widen from 2 to 6 lanes $16000 $0 $16000 2020
Sacramento Sacramento County DOT
White Rock Road
Grant Line Rd
Prairie City Rd
Widen from 2 to 4 lanes realign near Nike and Nimbus Roads and connect with existshying alignment west of Prairie City Rd Realign Grant Line Rd to intersect with realigned
White Rock Rd
$26600 $0 $26600 2020
Sacramento Sacramento County DOT
Hazel avenue
US 50 Hazel Madison
Widen American River Bridge and approaches from 4 to 6 lanes Widen Hazel Avenue from AR Bridge to Madison from 4 to 6 lanes with Bike
LanesSignals
$83530 $0 $83530 2020
HigHway 50 corridor system management plan [ 41 ]
c h a p t e r s i x p l a n n e d c o r r i d o r s y s t e m m a n a g e m e n t s t r a t e g i e s
tabLe 11 KeY CaPitaL ProjeCtS (ConTInued)
CountyLead agency
route roadway from to Project
Description Programmed
funds
additional funding Needed
total Cost Estimate (x $1000)
Comp Year (FFY)
PARALLEL AnD COnnECTInG ROADWAYS
ED ED County DOT
green Valley Road
Salmon Falls Road
east
Deer Valley Road
widen from 2 to 4 lanes $0 $14576 $14576 2025
ED ED County DOT
green Valley Road
Deer Valley Road east Lotus Road widen $958 $4513 $5471 2015
ED ED County DOT
green Valley Road
Francisco Drive
Salmon Falls Road
widen from 2 to 4 lanes divided $412 $3491 $3903 2015
ED ED County DOT
Latrobe Road
investment Boulevard
golden Foothill Parkway
widen from 2 lanes undivided to 4 lanes
divided $1076 $8792 $9868 2015
ED ED County DOT
Latrobe Road
Carson Creek
White Rock Road
widen from 4 to 6 lanes $0 $23755 $23755 2025
ED ED County DOT
white Rock Road
EDSac County Line
Manchester Drive
widen 2 to 4 lanes divided includes signal interconnect and coorshy
dination
$0 $23755 $23755 2025
Sacramento City of Rancho
Cordova
Easton Valley
Parkway
Prairie City Road
Empire Ranch Road extenshysion south of
US 50
Construct new 4 lane road $0 $45000 $45000 2020
Sacramento Sacramento County DOT
Hazel avenue
Easton Valley
Parkway
Grant Line RoadWhite Rock Road
New road extension 4 lane limited access
through aerojet property $0 $18000 $18000 2018
Sacramento Sacramento County DOT
white Rock Road
Prairie City Road
ED County Line
widen to 4 lanes $8330 $64773 $73103 2018
Sacramento Sacramento County DOT
green Valley Road
East Natoma Sacramento ED County
line widen to 4 lanes $0 $3000 $3000 2018
Sacramento City of Rancho
Cordova
Zinfandel Drive
international Drive
Folsom Boulevard
widen to 4 lanes $0 $12000 $12000 2020
[ 42 ] HigHway 50 corridor system management plan
c h a p t e r s i x p l a n n e d c o r r i d o r s y s t e m m a n a g e m e n t s t r a t e g i e s
tabLe 11 KeY CaPitaL ProjeCtS (ConTInued)
CountyLead agency
route roadway from to Project
Description
Pro-grammed
funds
addi-tional
funding Needed
total Cost estimate (x $1000)
Comp Year (FFY)
traNSit
yolo amp Sacramento City of west Sacramento
amp City of Sacramento
Sacramento River
Crossing
15th Street in the City
of west Sacramento
Broadway in the City of
Sacramento
New all-modal river crossing (Auto Transit Bike amp Pedestrian)
from Sacramento across the Sacramento River to West
Sacramento The crossing was modeled between Broadway in Sacramento amp 15th Street in
West Sacramento but final alignshyment options will be studied in subsequent planning efforts
$800 $99200 $100000 2019
Sacramento Cal State University
Sacramento
CSUS Campus mdash mdash
Sac State Tram adjoining City streets and SRTD 65th Street light railbus transfer station Bus Rapid Transit System
$23574 $0 $23574 2013
Sacramento City of Rancho
Cordova
Rancho Cordova Various Various
New Service Rancho Cordova Pilot Transit Shuttle System new transit service for connection to
RTs Gold Line
$2380 $1500 $38880 2014
yolo amp Sacramento City of west Sacramento
TBD west
Sacramento Sacramento Streetcar Service between west
Sacramento and Downtown Sacramento
$17400 $54700 $72100 2014
Sacramento City of Rancho
Cordova RT Gold Line
RT Gold Line Tracks
Mather Field Road
Light Rail Grade Separations $0 $52888 $52888 2025
Sacramento City of Rancho
Cordova RT Gold Line
RT Gold Line Tracks Zinfandel Drive Light Rail Grade Separations $0 $52888 $52888 2025
Sacramento City of Rancho
Cordova RT Gold Line
RT Gold Line Tracks
Bradshaw Road
Light Rail Grade Separations $0 $35260 $35260 2025
Sacramento City of Rancho
Cordova RT Gold Line
RT Gold Line Tracks Routier Road Light Rail Grade Separations $0 $35260 $35260 2025
Sacramento City of
Sacramento Sacramento Valley Station
Sacramento intermodal Transportation Facility (Phase 1) - Develop intermodal transportashytion terminal for heavy rail light
rail and bus service
$77799 $0 $77799 2010
Sacramento City of
Sacramento Sacramento Valley Station
Sacramento intermodal Transportation Facility (Phase 2) - Develop intermodal transportashytion terminal for heavy rail light
rail and bus service
$24101 $1000 $25101 2014
HigHway 50 corridor system management plan [ 43 ]
c h a p t e r s i x p l a n n e d c o r r i d o r s y s t e m m a n a g e m e n t s t r a t e g i e s
TABLE 11 KEY CAPITAL PROJECTS (CONTINUED)
CountyLead Agency
Route Roadway From To Project
Description Programmed
Funds
Additional Funding Needed
Total Cost Es-timate (x $1000)
Comp Year (FFY)
BICYCLE ROUTES
Sacramento City of Rancho
Cordova
US 50Mather Field Road IC US 50 Mather
Field Road
US 50Mather Field Road PedestrianBike Crossing along
the Mather Airport RR Spur alignment
$0 $820 $1055 2015
ED ED County DOT
Sacramento Placerville
Transportation Corridor
Forni Rd
Missouri Flat Rd Class I Bike Trail $1423 $111 $1534 2009
ED City of Placerville
El Dorado Trail Western
Extension
Canal Street Main Street
Ray Lawyer DriveForni
Road Class 1 Bike Trail $1850 $0 $1850 2010
ED ED County DOT
US 50ED Hills Blvd IC US 50
El Dorado Hills Blvd
Latrobe Road
US 50El Dorado Hills Blvd Pedestrian Overcrossing $5508 $66 $5574 2014
TABLE 12 50 MOBILITY PARTNERSHIP KEY CAPITAL PROJECTS
RouteRoadway From To Project Description
NEAR TERM PRIORITY IMPROVEMENT PROJECTS
US 50 Sunrise Scott Road Auxiliary Lane
US 50 Hazel Avenue Interchange Improvements
Hazel Avenue Folsom Boulevard Easton Valley Parkway New 4 Lane Road
Easton Valley Parkway Hazel Avenue Rancho Cordova Parkway New 6 Lane Road
Rancho Cordova Parkway Easton Valley Parkway White Rock Road New 4 Lane Road
White Rock Road Sunrise Boulevard Silva Valley Parkway Widen to 4 Lanes
RT Gold Line Hazel Iron Point Station Passing Tracks
US 50 Rancho Cordova Parkway New Interchange
Zinfandel Drive South of International Douglas Road New 4 Lane Road
International Drive Kilgore Road Rancho Cordova Parkway New 6 Lane Road
Douglas Road Zinfandel Extension Sunrise Boulevard Widen to 4 Lanes
Sunrise LRT Citrus Road Sunrise Mall Bus Rapid TransitExpress Bus
[ 44 ] HIGHWAY 50 corridor system management plan
c h a p t e r s i x p l a n n e d c o r r i d o r s y s t e m m a n a g e m e n t s t r a t e g i e s
TABLE 12 50 mOBILITY PARTnERSHIP kEY CAPITAL PROjECTS (COnTInUED)
routeroadway from to Project Description
US 50 nEAR TERm PRIORITY ImPROVEmEnT PROjECTS
US 50 Empire Ranch Road New interchange
US 50 Silva Valley New interchange
US 50 Scott Road Empire Ranch Road Aux Lanes
US 50 Empire Ranch Road El Dorado Hills Boulevard Aux lanes and climbing lanes
US 50 El Dorado Hills Boulevard Silva Valley Parkway Aux lanes and climbing lanes
US 50 Silva Valley Parkway Bass Lake Road Aux lanes
Sunrise Boulevard White Rock Road Douglas Boulevard widen to 6 lanes
Sunrise Boulevard Douglas Boulevard Jackson Road widen to 4 lanes
White Rock Road Sunrise Boulevard Future Rancho Cordova Parkway and El Dorado County Line to Latrobe Road
widen to 4 lanes
Douglas Boulevard Sunrise Boulevard Grant Line Road widen to 4 lanes
Rancho Cordova Parkway Douglas Boulevard Rio del Oro Parkway New 2 lane road
Rancho Cordova Parkway Rio del Oro Parkway White Rock Road New 6 lane road
Jaeger Road Douglas Road Kiefer Boulevard New 4 lane road
Chrysanthy Sunrise Boulevard Americanos Boulevard New 4 lane road
Kiefer Boulevard Sunrise Boulevard Jaeger Road New 4 lane road
Grant Line Road Douglas Road Chrysanthy Road widen to 4 lanes
Hazel avenue Gold Country Boulevard Madison avenue widen to 6 lanes
Latrobe Road South of White Rock Road widen to 4 lanes
TABLE 13 VISIOnARY PROjECTS
County routeroadway from to Project Description
Sac yolo US 50 Enterprise Downtown Sacramento HOV Lanes
ED TBD Folsom Placerville Transit ndash Type TBD
ED New Road Latrobe Road White Rock Road (poten shy
tially US 50) New 2-lane road
HigHway 50 corridor system management plan [ 45 ]
c h a p t e r s i x p l a n n e d c o r r i d o r s y s t e m m a n a g e m e n t s t r a t e g i e s
[ 46 ] HigHway 50 corridor system management plan
Page Inte
ntionally
Left
Blank
congestion and bottleneck analysis
chapter seven
The 2000 Highway Capacity Manual defines a bottleneck
as ldquoa road element on which demand exceeds capacityrdquo
The bottleneck analysis evaluates specific causes of existshying recurrent traffic congestion in the corridor Freeway bottleneck locations that create mobility constraints are identified and documented and their relative contribution
to corridor-wide congestion is reported The bottleneck locations were determined based on a combination of the use of 2006 PeMS data HiCOMP report probe vehicle tach runs and field observations
Traffic congestion can be categorized as either recurrent
or non-recurrent
recurrent congestion occurs repeatedly at the same place and time of day in a predictable pattern Recurrent congesshytion is often associated with facility capacity limitations changes in capacity conflicting vehicle movements such
as lane merges inadequate number of transit vehicles to handle passenger loads or other persistent physical condishytions of the transportation facility
Non-recurrent congestion is usually attributed to collishysions equipment malfunction community events weather construction projects and other occasional occurrences When transportation systems are close to their maximum
carrying capacity non-recurrent congestion is more likely to occur as there is little excess capacity in the system
The location and extent of the bottlenecks on US 50 found
in the aM and PM peak periods are summarized in Tables 14 and 15 These depictions should be considered a snapshyshot view and not a comprehensive analysis of all bottleshynecks in the corridor Further work is being conducted to
refine the identification and causality of bottlenecks within
the corridor Table 14 shows a summary of the US 50 eastbound bottlenecks while the tables that follow discuss each bottleneck including location and possible causality Table 15 shows a summary of the US 50 westbound bottleshynecks while the tables that follow discuss each bottleneck including location and possible causality Minor or hidden bottlenecks are those Freeway bottleneck
that are not as defined locations that create (or severe) as the major mobility constraints bottlenecks Please note are identified and that the graphics accomshy documented and their panying the bottlenecks
relative contribution to are not to scale
corridor-wide congestion Major bottlenecks in the is reported eastbound direction during the aM peak period are at Howe avenue and during the PM peak period are at 48th Street Howe Avenue Mayhew Road Routier Road Sunrise Boulevard and El Dorado Hills Boulevard Major bottlenecks in the westbound direction during the aM peak period are at El Dorado Hills Boulevard Hazel Avenue Zinfandel Drive
HigHway 50 corridor system management plan [ 47 ]
c h a p t e r s e v e n c o n g e s t i o n a n d b o t t l e n e c k a n a l y s i s
Bradshaw Road and Howe Avenue and major bottleneck
locations during the PM peak period are at Zinfandel Drive Routier Road Bradshaw Road Howe Avenue and Intershystate 5
Causalities for these bottlenecks range from high-traffic
demand (congestion) heavy weavingmerging areas or physical constraints such as lane drops lack of ramp meters incomplete HOV network incomplete Auxiliary Lane
network poorly coordinated traffic signals and an off-ramp
queue (Sunrise Boulevard) US 50 Westbound Onramp
TABLE 14 US 50 EASTBOUnD BOTTLEnECk SUmmARY Source PeMS Caltrans tach runs and
Cambridge Systematics field observations
bottleneck Location PeMS Speed Contours Caltrans Probe Vehicle Runs
Cause aM PM aM PM
A Jefferson Blvd PM 25 Minor Minor Traffic weaving truck volumes and grade
B 48th St PM 7 Minor Major Minor Minor Merge from SR 51 and SR 99
C Howe ave PM 9 Major Major Major weave between Howe and watt
D Mayhew Rd PM 12 Major Minor Major Weaving before Bradshaw Exit
E Routier Rd PM 14 Minor Major Weaving before Mather Field Rd Exit
F Sunrise Blvd PM 185 Minor Major Lane drop HOV add off-ramp queue
G Folsom Blvd PM 22 Minor Minor Lane drop 4 to 3
H El Dorado Hills Blvd PM 275 Major
Poorly coordinated traffic signal on arterial causes spillback onto freeway
a jefferson blvd bottleneck The bottleneck approximately located at Jefferson Blvd is due to weaving traffic as those entershying the freeway from Jefferson Blvd must cross those attempting to exit the freeway to I 5 There is a large number of trucks in the stream which struggle with the grade at this location exacerbatshying the bottleneck
[ 48 ] HigHway 50 corridor system management plan
c h a p t e r s e v e n c o n g e s t i o n a n d b o t t l e n e c k a n a l y s i s
b 48th St bottleneck The bottleneck approximately located at 48th St is due to the additional traffic merging from SR 51 and SR 99 combined with the eventual lane drop at 59th St This queue extends upstream past the off-ramp to SR 5199 These off-ramps are bottlenecks in themselves which spill back and choke the US 50 mainline
C Howe Ave Bottleneck The bottleneck at Howe ave is due to the entering traffic from Howe Ave Two Howe Ave on-ramps feed into US 50 eastbound southbound Howe ave loop on-ramp and northbound Howe ave direct ramp approximately 300 feet apart The watt avenue off-ramp is just down stream with heavy exiting volumes therefore the segment between Howe and watt is characterized by heavy weaving
D mayhew Rd Bottleneck The bottleneck approximately located at Mayhew Rd most likely begins with the additional traffic entering from Watt Ave and ends with the exiting traffic at Bradshaw Rd It is possible that there is a high proportion of weaving traffic with in this section (Watt Ave traffic moving to the left lane and those exiting at Bradshaw Rd moving to the right lane)
HigHway 50 corridor system management plan [ 49 ]
c h a p t e r s e v e n c o n g e s t i o n a n d b o t t l e n e c k a n a l y s i s
[ 50 ] HigHway 50 corridor system management plan
e routier rd bottleneck It is likely that the bottleneck at Routier Rd is due to the same merging conditions associated with Mayhew Rd The area is comprised of both residential and light industrialoffice land uses therefore during the PM peak period there are large volumes of vehicles entering at Bradshaw Rd moving to the left lanes and large volumes of vehicles moving to the right lane to exit at Mather Field Rd
f Sunrise blvd bottleneck At Sunrise Blvd the right-most lane exits while an HOV lane is added as the median lane The bottleneck is formed from vehicles shifting left to avoid exiting at Sunrise Blvd and to enter the HOV lane There is a large volume of vehicles queued at the Sunrise off-ramp which spills back and negatively affects the US 50 mainline
g folsom blvd bottleneck The right-most lane exits to Folsom Blvd leaving one HOV lane and two regular lanes along the US 50 The bottleneck is caused by this lane drop as well as the quick merge at the Folsom on-ramp
c h a p t e r s e v e n c o n g e s t i o n a n d b o t t l e n e c k a n a l y s i s
H The eastbound US 50 at El Dorado Hills Blvd Bottleneck The eastbound El Dorado Hills Blvd bottleneck is caused by a traffic signal on the arterial that often causes spillbacks on the EB loop offramp onto the freeway mainlines
TABLE 15 US 50 WESTBOUnD BOTTLEnECk SUmmARY Source PeMS Caltrans tach runs and Cambridge Systematics field observations
bottleneck Location PeMS Speed Contours Caltrans Probe Vehicle Runs
Cause aM PM aM PM
A El Dorado Hills Blvd PM 275 Major Poorly coordinated traffic
signal on El Dorado Hills Blvd
B Hazel Ave PM 21 Major Entering traffic
C Zinfandel Dr PM 16 Minor Major Major Major Entering traffic
D Routier Rd PM 14 Minor Major Minor Weaving traffic
E Bradshaw PM 13 Major Major Major Merging traffic and curve
F Howe Ave PM 9 Minor Major Major Major Weaving traffic and grade
G SR 51SR 99 PM 6 Minor Lane drop weaving traffic
H i-5 PM 3 Major Weaving traffic
HigHway 50 corridor system management plan [ 51 ]
c h a p t e r s e v e n c o n g e s t i o n a n d b o t t l e n e c k a n a l y s i s
[ 52 ] HigHway 50 corridor system management plan
A El Dorado Hills Blvd Bottleneck The minor bottleneck at El Dorado Hills Boulevard is caused by the traffic signal on El Dorado Hills Blvd that causes spillback on the westbound offramp onto the freeway mainlines
B Hazel Avenue Bottleneck In 2006 the Hazel Ave Bottleneck is caused by the traffic entering at both Hazel Ave and Folsom Blvd (the two on-ramps are separated by about one mile) The bottleneck that would appear at Folsom Blvd combines with the bottleneck at Hazel ave to form a large bottleneck that does not clear until after Hazel ave Sometimes causshying spillbacks as far as Prairies City Road this bottleneck was mitigated in 2007 as part of the GO CALIFORNIA program
C Zinfandel Dr Bottleneck There is heavy traffic coming from Sunrise Blvd but the lane addition immediately after the westbound on-ramp prevents a bottleneck from forming but as traffic flows westward the heavy traffic entering from Zinfandel Dr causes a bottleshyneck here
D Routier Rd Bottleneck The bottleneck at Routier Rd is caused by weaving traffic between Mather Field Rd and Bradshaw Rd This highway segment represents a transition area where vehicles that have been traveling in the left lanes begin to shift to the right lanes to exit while the entering traffic tries to shift to the left lanes
W eav in gLan e Dr o p
c h a p t e r s e v e n c o n g e s t i o n a n d b o t t l e n e c k a n a l y s i s
e bradshaw rd bottleneck The Bradshaw Rd bottleneck is caused by the entering traffic from Bradshaw Road the high truck volumes and the curve west of Bradshaw Two Bradshaw Rd on-ramps feed into US 50 westshybound southbound Bradshaw Rd direct on-ramp and northbound Bradshaw Rd loop on-ramp approximately 400 feet apart
F Howe Ave Bottleneck The Howe ave bottleneck is caused by a grade change and the weaving traffic entering from Howe ave and Hornet Dr competing for the right-most lane with those wanting to exit at 65th Street
G amp H SR 51SR 99 amp I-5 Bottleneck The bottleneck at I 5 is caused by the conflict between entering SR 99 and SR 51 traffic and exiting I-5 traffic as well as the queues formed on the ramps to i-5 which spill back onto US 50 The number of lanes in this section reaches a maximum of 6 and then drops to 4 as two lanes exit at the I-5 freeway This bottleneck is exacershybated during the peak periods when it stretches upstream to the lane drop before SR 99
W ea v in g
Lan e Dr o p
HigHway 50 corridor system management plan [ 53 ]
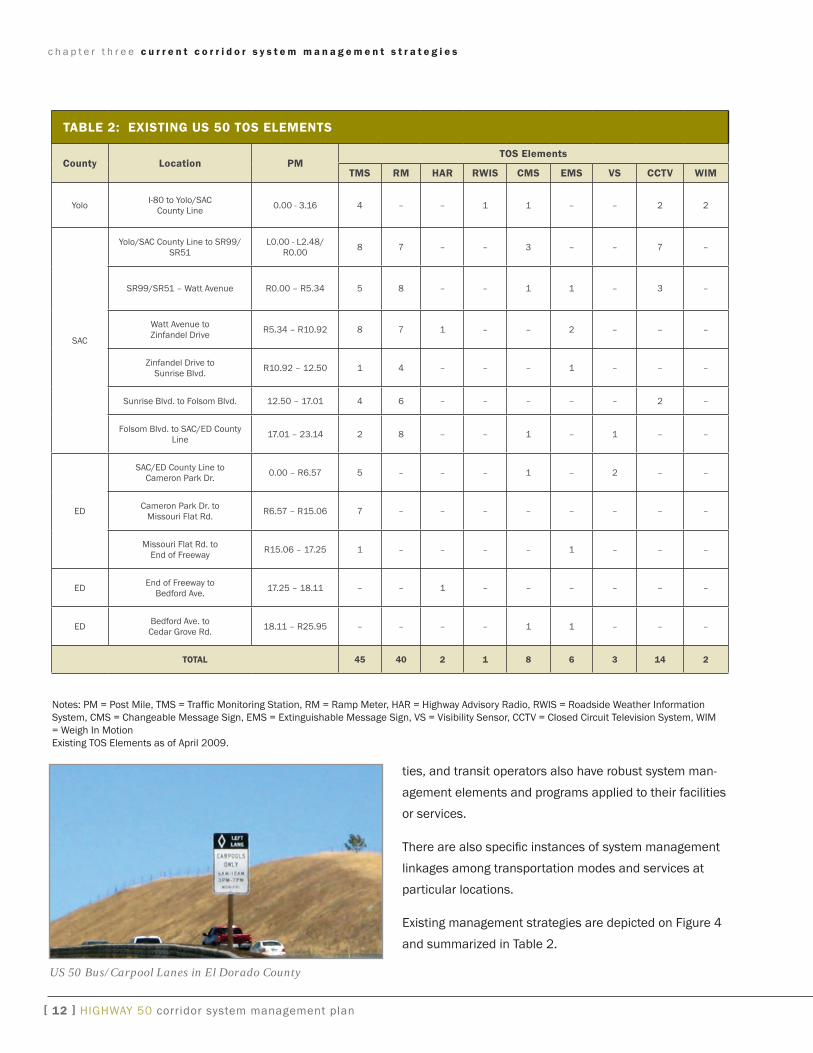
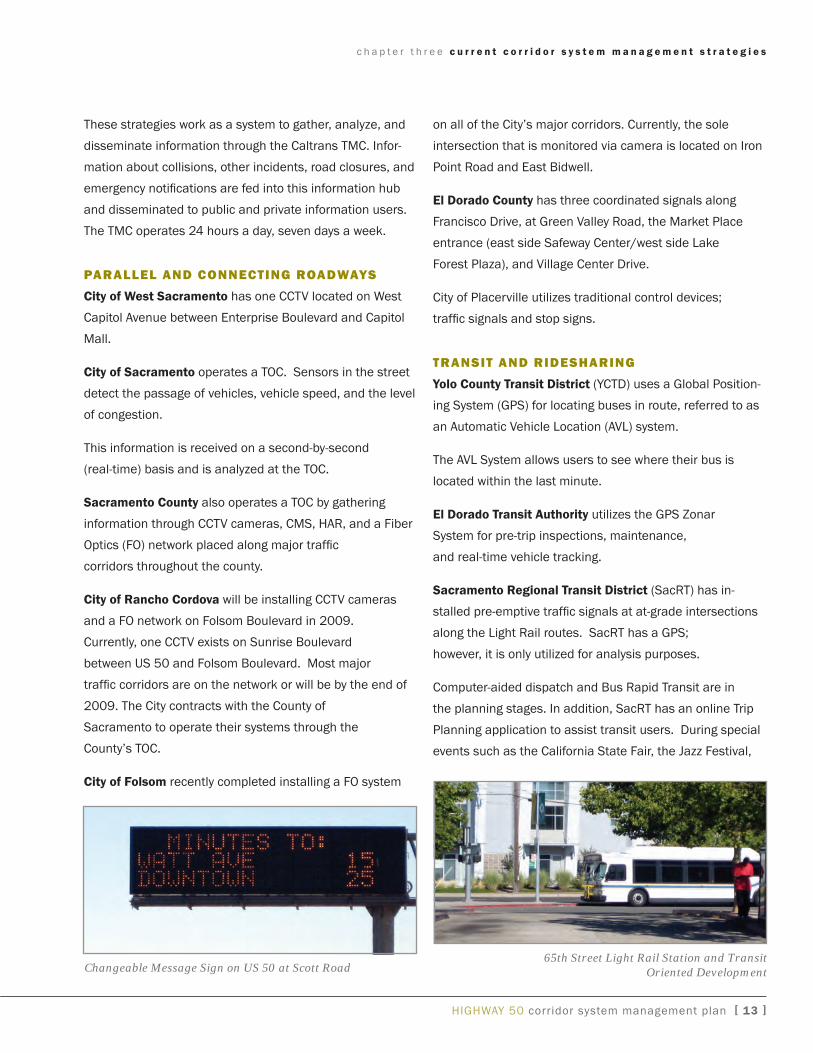
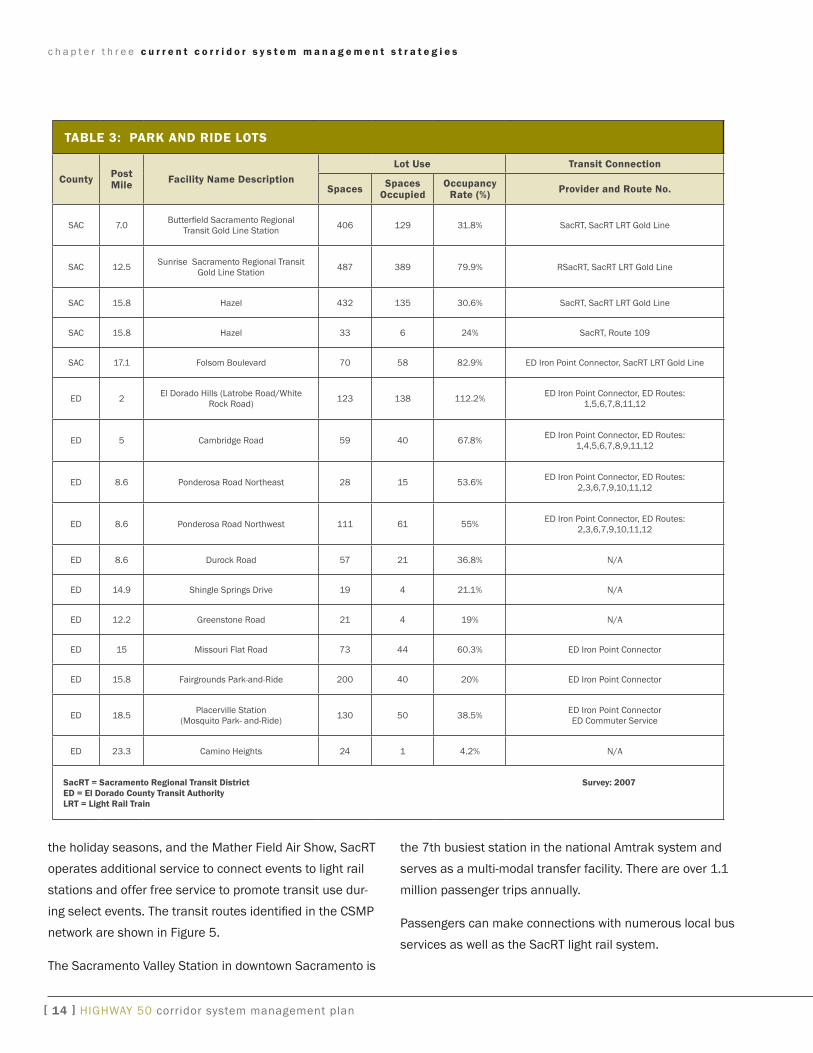
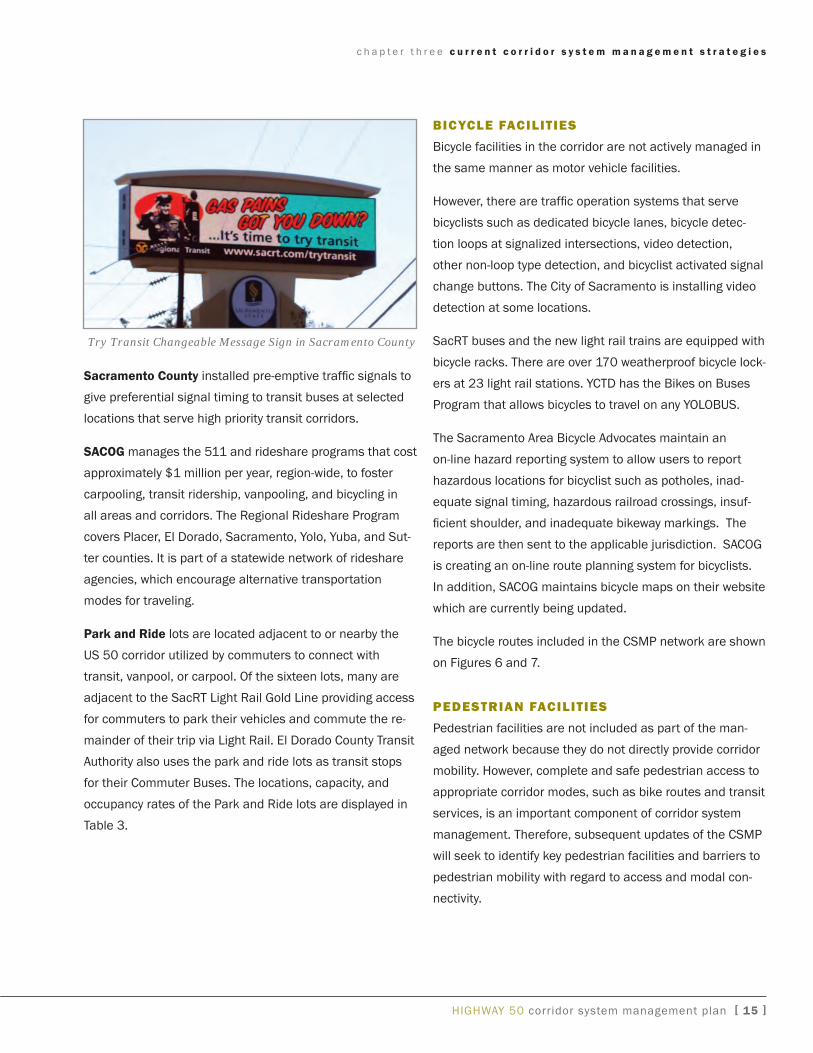

c h a p t e r f o u r m a j o r c o r r i d o r m o b i l i t y c h a l l e n g e s
Table 4 CUrrenT and ForeCaSTed TraFFiC daTa
location Current Traffic data ndash 2007 Future Traffic data ndash 2027 (no build) Future Traffic data ndash 2027 (build)
County description amp location of Trucks
Peak directional
Split
Peak Hour Traffic
average annual daily
Traffic2
Volume over Capacity3
Peak Hour Traffic
average annual daily Traffic2
Volume over Capacity3
(no-build)
Peak Hour Traffic
average annual daily
Traffic2
Volume over Capacity3
(build)
yOL interstate 80 to yoloSacramento County Line
6 60 15500 180000 109 23911 277032 169 24070 278880 136
SaC yoloSacramento County Line to State Routes 99 and 51
4 59 21000 253000 135 28080 312480 186 29153 324415 193
SaC State Routes 99 and 51 to watt avenue 4 59 20600 225000 145 27942 286230 189 30648 313950 166
SaC watt avenue to Zinfandel Drive 4 59 16700 187000 115 24783 274540 163 25885 286750 136
SaC Zinfandel Drive to Sunrise Boulevard 4 60 13500 149000 093 20331 224394 133 20925 230950 110
SaC Sunrise Boulevard to Folsom Boulevard 4 66 11900 125000 089 18888 198247 131 20086 210820 140
SaC Folsom Boulevard to SacramentoEl Dorado County Line
3 66 8800 95000 087 13341 151311 133 13612 154380 136
ED SacramentoEl Dorado County Line to Cameron Park Drive
4 61 6900 70000 095 11454 116200 165 11834 120050 114
ED Cameron Park Drive to Missouri Flat Road
4 62 5700 62000 092 8647 94054 132 9462 102920 096
ED Missouri Flat Road to End of Freeway in Placerville
4 57 4850 59000 069 7101 76245 098 7363 79050 102
ED End of Freeway in Placerville to Bedford avenue
4 55 4800 52000 Na 4 6595 74196 Na4 6648 74790 Na4
ED Bedford avenue to Cedar grove Exit 4 62 3800 38500 077 5474 50782 099 5520 51205 099
1 Peak Directional Split The percentage of total traffic in the heaviest traveled direction during the peak hour2 Average Annual Daily Traffic (AADT) The average number of vehicles per day in both directions 3 Volume over Capacity (VC) The volume of traffic compared to the capacity of the roadway4 Volume over Capacity does not determine LOS for two- or three-lane facilities or segments with intersection delay 5 Reported Collision Rate index ( Compared to State average) The percentage by which each segmentrsquos reported collisions rate (fatal injury and property damage only) is above or below the statewide average reported collisions rate on comparable facilities
Source 3-Year Caltrans Traffic Accident Surveillance and Analysis System data
HigHway 50 corridor system management plans [ 23 ]
c h a p t e r f i v e p e r f o r m a n c e m e a s u r e s
Page Inte
ntionally
Left
Blank
[ 24 ] HigHway 50 corridor system management plan
performance measures
chapter five
Continuing corridor monitoring and performance mea-
sures are an integral part of corridor management and investment decision making and help identify immediate efficient and effective system operational strategies and
capital improvements Performance measures provide the
important dynamic daily information needed to rapidly
address operational problems caused by recurrent and
non-recurrent traffic congestion Measures are also used to identify the best improvement actions to generate the desired results
Table 5 identifies the performance measures to be used as
part of the corridor system management process
Baseline Data For perFormance measures Tables 6 7 and 8 display baseline data for the perforshymance measures for the CSMP transportation network
The performance data was primarily compiled from the SACMET demand based traffic model the year 2007
edition of the Traffic Volumes Manual the year 2000 edition of the Highway Capacity Manual Caltrans Traffic
Accident Surveillance and Analysis System (TASAS) the 2007 Caltrans Division of Maintenance Pavement Summary Report and ridership records provided by the transit providers
additional performance Performance Measures data was derived from the provide the important Performance Measurement dynamic dailySystem (PeMS) tool an
information needed internet based tool used to
to rapidly addresshost process retrieve and operational problemsanalyze road traffic condishy
tions information from caused by recurrent
real-time and historical and non-recurrent data PeMS obtains 30-sec- traffic congestion ond loop detector data in real-time from detectors installed along the highway corridor
It should be noted that Average Daily Traffic (ADT) and LOS
for some ParallelConnecting Roadways segment locations
in Table 7 was not available These are noted ldquoNo Datardquo
Data collection for non-auto modes is not as robust as what is needed for active system management Subsequent updates of this CSMP will seek to expand the
availability of transit and bicycle performance data collection
HigHway 50 corridor system management plan [ 25 ]
mdash
c h a p t e r f i v e p e r f o r m a n c e m e a s u r e s
TABLE 5 PERFORmAnCE mEASURES DEFInITIOnS AnD APPLICABILITY
Performance Measure Definition of Performance measure applicability to Corridor
STATE HIGHWAY SYSTEm
LOS A ldquoreport cardrdquo measurement with ldquoArdquo being the least amount of
congestion and ldquoFrdquo being the most congestion LOS is a relatively simple and widely used measure which
offers comparison opportunities
Total Vehicle Hours of Delay The additional travel time in hours experienced by all vehicles on the highway segment per day or at peak hour due to congestion
This measurement is used to determine the cost in time which congestion can add to the regular travel time that it takes to traverse a segment of road and is useful in
quantifying the performance of a particular roadway in an understandable format
Total Person Minutes of Delay The additional travel time in minutes experienced by all persons in vehicles on the highway segment per day or at peak hour due
to congestion
This measurement is used to determine the cost in time which congestion can add to the regular travel time that it takes to traverse a given segment of road and is useful in quantifying the performance of a particular roadway in an
understandable format and for comparison of improvement options
Minutes of Delay per Vehicle The additional travel time in minutes experienced by each vehicle on the highway segment at peak hour due to congestion
This measurement is used to determine the cost in time which congestion can add to the regular travel time that it
takes to traverse a given segment of road
Minutes of Delay per Person The additional travel time in minutes experienced by each person in vehicles on the highway segment at peak hour due to congesshy
tion
This measurement is used to determine the cost in time which congestion can add to the regular travel time that it
takes to traverse a given segment of road
Vehicle Travel Time (Minutes) The average time spent by vehicles traversing between two points on a road or highway
Travel time is a measure used to quantify travel time deficienshycies and provide a personal indicator of congestion impacts
Distressed Pavement Pavement that rides rougher than established maximums and or exhibits substantial structural problems as determined by the
Pavement Condition Survey
This measurement provides a ride quality indicator and an indicator for structural roadway problems
Reported Collision Rate Comparison of the actual total collision rate () along a highway segment above or below the statewide average for fatal injury
and property damage-only collisions on comparable facilities
Comparing the total collision and rate with statewide average rate provides an opportunity to assess safety conditions
through the corridor
Reliability Identifies day-to-day variation in travel time for the same trip at the same time of day Focuses on the predictability of travel time
particularly for repetitive trips
Estimates reliability by defining the extra time travelers must add to their average travel time when planning trips to ensure on-time arrival (0 percent no day-to-day variations
100 percent double allotted travel time)
Lost Productivity Measures the capacity of the corridor to accommodate vehicle or person throughput and is calculated as actual volume divided by
the capacity of the highway
As traffic volumes increase to roadway capacity speeds decline rapidly and vehicle throughput drops dramatically which increases traffic congestion and delay and results in
lost productivity
[ 26 ] HigHway 50 corridor system management plan
mdash
c h a p t e r f i v e p e r f o r m a n c e m e a s u r e s
HigHway 50 corridor system management plan [ 27 ]
TABLE 5 PERFORmAnCE mEASURES DEFInITIOnS AnD APPLICABILITY (ConTInued)
Performance Measure Definition of Performance measure applicability to Corridor
PARALLEL AnD COnnECTInG ROADWAYS
LOS A ldquoreport cardrdquo measurement with ldquoArdquo being the least amount of
congestion and ldquoFrdquo being the most congestion LOS is a relatively simple and often used measure which
offers comparison opportunities
traNSit
available Capacity Ratio () of available transit capacity alternatives within the corridor
This measure indicates the available capacity to accommoshydate diverted travelers from single occupant vehicles
c h a p t e r f i v e p e r f o r m a n c e m e a s u r e s
[ 28 ] HigHway 50 corridor system management plan
Page Inte
ntionally
Left
Blank
c h a p t e r f i v e p e r f o r m a n c e m e a s u r e s
Table 6 US 50 PerForManCe MeaSUreS
County location Post Miles
distance (Miles)
average annual daily Traffic1
PerForManCe MeaSUreS
loS1
Total Vehicle Hours of delay2
Total Person Minutes of delay2
Minutes of delay per Vehicle2
Minutes of delay per Person2
Vehicle Travel Time (Minutes)2 distressed
Pavement (lane
Miles)4
reported Col-lision rate
Comparison ()5
reliability6 lost Productivity7
daily Peak Hour3 daily Peak
Hour3 Peak Hour3 Peak Hour3 Peak Hour3 eastbound westbound lost lane Miles aM
Peak Period
lost lane Miles PM
Peak Period
STaTe HigHway SySTeM
yOL interstate 80 to yolo Sacramento County Line
000 to 316 316 180000 F 1169 126 95363 8061 049 046 36 9 26 62 22 01 0
SaC
yoloSacramento County Line to State Routes 99
and 51
L000 to L248 R000
248 253000 F 4993 653 407455 41746 186 175 43 7 20 64 60 53 76
State Routes 99 and 51 to watt avenue
R000 to R534 534 225000 F 10097 1362 823883 87105 397 372 93 15 24 60 48 81 68
watt avenue to Zinfandel Drive
R534 to R1092 558 187000 F 8075 977 658886 62506 351 329 91 19 -32 56 42 44 23
Zinfandel Drive to Sunrise Boulevard
R1092 to 1250 158 149000 E 1271 197 103727 12610 088 082 25 9 -33 46 13 0 16
Sunrise Boulevard to Folsom Boulevard
1250 to 1701 451 125000 E 3087 356 251940 25832 180 149 63 5 -14 60 46 1 45
Folsom Boulevard to SacramentoEl Dorado
County Line
1701 to 2314 613 95000 D 583 122 47537 8867 083 069 70 0 -11 19 55 0 08
ED
SacramentoEl Dorado County Line to Cameron
Park Dr
000 to R657 657 70000 E 504 126 41150 9138 110 091 77 1 -35 PeMS Data
Unavailable PeMS Data Unavailable
PeMS Data Unavailable
PeMS Data Unavailable
Cameron Park Drive to Missouri Flat Road
R657 to R1506 849 62000 E 302 75 24633 4827 079 075 93 2 -61 PeMS Data
Unavailable PeMS Data Unavailable
PeMS Data Unavailable
PeMS Data Unavailable
Missouri Flat Road to End of Freeway in Placerville
R1506 to 1725 219 59000 D 66 16 5376 1053 020 019 24 1 20 PeMS Data
Unavailable PeMS Data Unavailable
PeMS Data Unavailable
PeMS Data Unavailable
End of Freeway in Placerville to Bedford avenue
1725 to 1811 086 52000 D 68 17 5585 1094 021 020 15 2 81 PeMS Data
Unavailable PeMS Data Unavailable
PeMS Data Unavailable
PeMS Data Unavailable
Bedford avenue to Cedar grove Road
1811 to R2595 784 38500 D 58 15 4758 932 023 022 85 10 6 PeMS Data
Unavailable PeMS Data Unavailable
PeMS Data Unavailable
PeMS Data Unavailable
TOTaL mdash 5473 mdash mdash 30273 4042 2470293 263771 1587 1449 7150 80 mdash mdash mdash mdash mdash
1 Source Average Annual Daily Traffic and Level of Service (LOS) calculated is based on 2007 Caltrans Traffic Volumes on California State Highways and Highway Capacity Manual and Cambridge Systematics from 2008 Reported LOS is for the typical most congested daily peak travel period 2 Source Delay is the average additional travel time by vehiclespersons traveling under 60 mph Data derived from 2007 HICOMP report SACMET Travel Demand Model PeMSs traffic data and Caltrans District 3 Traffic Operations Probe vehicle Tach runs 3 Peak Hour is during PM 4 Source 2007 Caltrans Division of Maintenance Pavement Summary Report 5 Source 2004 through 2007 Caltrans Traffic Accident Surveillance and Analysis System summary data of the percentage above or below the statewide average for fatal injury and property damage-only collisions on comparable facilities 6 Reliability The Planning Time Index is a measure of the reliability of the travel time on a particular route It is the ratio of the 95th percentile of travel time on a route to the median free-flow travel time This means itrsquos the amount of time a traveler needs to allocate for a route if they want to show up on time 19 out of 20 trips Reliability and Planning Time data was taken from April 2007 The data covered a 24-hour period of time on each Tuesday wednesday and Thursday of that month That data was then aggregated into a single average 24-hour day it was then analyzed to determine the highest average aM and PM travel time That time was then compared to the best possible average travel time to determine the additional time that was spent traveling the same seg-ment 7 Lost Productivity Data taken April 2007 PeMS As traffic increases to the capacity of the highway speeds decline throughput drops dramatically and the efficiency of the highway to provide mobility decreases This decline in the potential carrying-capacity of the freeway is expressed in terms of how many equivalent lane miles of roadway are lost
HigHway 50 corridor system management plans [ 29 ]
c h a p t e r f i v e p e r f o r m a n c e m e a s u r e s
Table 7 Parallel and ConneCTing roadwayS PerForManCe MeaSUreS
County location average
daily Traffic1
PerForManCe MeaSUreS
loS1
Total Vehicle Hours of delay2
Total Person Minutes of delay2
Minutes of delay per Vehicle2
Minutes of delay per Person2
Vehicle Travel Time (Minutes)2
distressed Pavement
(lane Miles)4
daily Peak Hour3 daily Peak
Hour3 Peak Hour3 Peak Hour3 Peak Hour3
Parallel and ConneCTing roadwayS
yOL west Capitol Enterprise Boulevard to Capitol Mall 13737 No Data
Data is unavailable for these performance measures at this time however will be pursued in the next phase of the CSMP
SaC
w 5th Street to 26th Street 9194 a
X 5th Street to 26th Street 9154 a
Folsom Boulevard watt avenue to Bradshaw Road 25600 C
watt avenue Folsom Boulevard to US 50 63900 F
Bradshaw Road Folsom Boulevard to US 50 22400 a
Folsom Boulevard Bradshaw Road to Sunrise Boulevard 20400 a
Bradshaw Road Old Placerville to US 50 54405 F
Old Placerville Road Bradshaw Road to Rockingham Drive 11864ndash18365 a
Rockingham Drive Old Placerville Road to Mather Boulevard 16516 E
Mather Boulevard Rockingham Drive to Folsom Boulevard 21732 C
international Drive Rockingham Drive to Zinfandel Drive 12808 a
Zinfandel Drive international Drive to Folsom Boulevard 22298ndash47032 BE
white Rock Road Zinfandel Drive to Sunrise Boulevard 25459 a
Sunrise Boulevard US 50 to Folsom Boulevard No Data No Data
white Rock Road Sunrise Boulevard to Prairie City Road 3400 B
Folsom Boulevard Sunrise Boulevard to iron Point Road 17200 a
white Rock Road grant Line Road to EDSaC County Line 6700 D
iron Point Road Folsom Boulevard to East BidwellScott Road 13984 No Data
Scott Road iron Point Road to white Rock Road No Data No Data
Folsom Boulevard iron Point Road to Blue Ravine Road No Data No Data
Blue Ravine Road Folsom Boulevard to green Valley Road No Data No Data
Prairie City Road US 50 to white Rock Road 6000 D
HigHway 50 corridor system management plans [ 30 ]
c h a p t e r f i v e p e r f o r m a n c e m e a s u r e s
Table 7 Parallel and ConneCTing roadwayS PerForManCe MeaSUreS (ConTinUed)
County location average
daily Traffic1
PerForManCe MeaSUreS
loS1
Total Vehicle Hours of delay2
Total Person Minutes of delay2
Minutes of delay per Vehicle2
Minutes of delay per Person2
Vehicle Travel Time (Minutes)2
distressed Pavement
(lane Miles)4
daily Peak Hour3 daily Peak
Hour3 Peak Hour3 Peak Hour3 Peak Hour3
Parallel and ConneCTing roadwayS
ED
green Valley Road EDSaC County Line to Francisco Drive 22600 D
Data is unavailable for these performance measures at this time however will be pursued in the next phase of the CSMP
green Valley Road Francisco Drive to Silva Valley Parkway 13077 D
green Valley Road Silva Valley Parkway to Cameron Park 9849 C
green Valley Road Cameron Park Drive to Deer Valley Road 5278 C
green Valley Road Deer Valley Road (East) to Lotus Road 8381 D
green Valley Road Lotus Road to Placerville Drive 4669 C
Latrobe Road white Rock Road to US 50 24742 C
Durock Road Cameron Park Dr to South Shingle Road 7278 C
Cameron Park Drive Durock Road to US 50 (Durock Road to Coach Lane Coach Lane to US 50) 9544 26603 CD
South Shingle Road Durock Road to US 50 11390 D
white Rock Road EDSaC County Line to Latrobe 12808 D
white Rock Road Latrobe Rd to Silva Valley Pkwy (Latrobe to PostPost to Silva Vlly Pkwy) 10124 CD
Silva Valley Parkway white Rock Rd to Serrano Pkwy (white Rock to Entrada Entrada to Serrano Pkwy) 13708 9328 DC
Forni Road Placerville Drive to Main Street 9049 8379 No Data
Placerville Drive Forni Road to US 50 No Data No Data
Main Street Placerville Drive to Bedford avenue No Data No Data
Main Street Bedford avenue to Broadway No Data No Data
Broadway Main Street to Point View Drive No Data No Data
1 Source Average Daily Traffic and Level of Service (LOS) calculated are based on City of Sacramento between 2001 and 2007 Sacramento County from 20072008 City of Rancho Cordova between 2004 and 2007 and El Dorado County from 2007
HigHway 50 corridor system management plans [ 31 ]
c h a p t e r f i v e p e r f o r m a n c e m e a s u r e s
Page Inte
ntionally
Left
Blank
[ 32 ] HigHway 50 corridor system management plan
c h a p t e r f i v e p e r f o r m a n c e m e a s u r e s
tabLe 8 traNSit PerforMaNCe MeaSure
County transit Provider route Performance Measure
available daily Capacity ()1 available Peak Hour Capacity1
traNSit
SaC
SacRT (Bus)
Route 21 70 10
Route 28 76 59
Route 36 83 74
Route 38 66 44
Route 72 56 20
Route 73 79 45
Route 74 82 43
Route 109 47 22
SacRT (Light Rail) Gold Line 31 Exceeds Capacity
EDSAC ED County Transit Authority
Commuter Express Bus Service Not applicablendashOperates Peak Hour
Only 405
iron Point Connector 764 Not available
Reverse Commuter Not applicablendashOperates Peak Hour Only 982
yoloSaC yolo County Transit District Not applicablendashOperates Peak Hour Only 498
biKe3
1 Source average Daily and Peak Hour available Capacity calculated from each transit providerrsquos route ridership data 2 The Reverse Commuter service is offered on vehicles that are returning to El Dorado County (Commuter Express Buses) 3 Bicycle performance measure(s) will be identified applied and included in the subsequent CSMPs
HigHway 50 corridor system management plan [ 33 ]
c h a p t e r f i v e p e r f o r m a n c e m e a s u r e s
[ 34 ] HigHway 50 corridor system management plan
Page Inte
ntionally
Left
Blank
planned corridor system management strategies
chapter six
ConCept LoS and ConCept FaCiLit y ldquoConcept LOSrdquo and ldquoConcept Facilityrdquo have traditionally been used in Caltrans TCCRs to reflect the minimum level or quality of operations acceptable for each route segment within the 20-year planning period and the highway facility needed in the next 20 years to maintain the Concept LOS
Typical Concept LOS standards in Caltrans District 3 are LOS ldquoDrdquo in rural areas and LOS ldquoErdquo in urban areas how-ever some heavily congested route segments now have a Concept LOS ldquoFrdquo because the improvements required to bring the LOS to ldquoErdquo are not feasible due to environmental right of way financial and other constraints The applica-tion of multi-modal corridor management strategies should reduce the severity and duration of congestion and provide viable travel options and information that will enable a traveler to avoid severe freeway congestion
The Concept LOS and Concept Facility for US 50 are shown in Table 9 almost all US 50 segments are forecasted to operate under LOS ldquoFrdquo conditions in 20 years under the No-Build and Build scenarios
Corridor ManageMent StrategieS The US 50 CSMP also proposes specific strategies to enhance corridor mobility (see Table 10) based on the fol-lowing principles
bull Manage all modes and facilities in the corridor as a single system beginning with the transportation net-work defined in this CSMP
bull Implement comprehensive and dynamic multimodal monitoring and reporting for the system and for all modes
bull Develop and use micro-simulation modeling to identify mobility challenges and to evaluate proposed solutions
bull Complete the projects included in the regional trans-portation plans with an emphasis on the completion of the key mobility improvement projects identified in this CSMP (see Tables 11 and 12)
bull Implement the specific strategies outlined in this CSMP
Key CapitaL projeCtS Tables 11 and 12 contain key capital projects that have been identified as the most critical to corridor mobility These are also included in the SaCOg MTP for 2035 and are either planned without any funding yet programmed are partially programmed
The US 50 CSMPor are entirely programmed SACOG conducted significant proposes specific
public attitude research strategies to enhance for the MTP for 2035 to corridor mobility complement comprehensive outreach efforts through community workshops the TALL Order Moving the Region Forward event the televised Town Hall Road Map for the Future and associated public polling The results of the SaCOg analyses and public out-reach for the MTP were
highway 50 corridor system management plan [ 35 ]
c h a p t e r s i x p l a n n e d c o r r i d o r s y s t e m m a n a g e m e n t s t r a t e g i e s
[ 36 ] HigHway 50 corridor system management plan
used when selecting the key projects for identification in
the CSMP and to ensure consistency Not all corridor projshyects in the MTP are included in the CSMP since the CSMP focuses on the managed network and the SaCOg MTP considers all streets and roads bike routes and transit services in the corridor
highway 50 partnership The Highway 50 Partnership is a cooperative public-private effort among the County of Sacramento City of Rancho
Cordova City of Folsom County of El Dorado and several major landowners that recognize the need to consider corrishydor mobility needs holistically
The Partnership has collaborated effectively to develop a Plan to improve mobility in the US 50 Corridor from Rancho
Cordova to El Dorado Hills an area identified as approprishyate for growth in the SACOG Blueprint Recognizing the
need to generate private investment the Partnership is seeking to implement a regional Highway 50 Corridor fee program to fund these projects
in addition to the key projects indicated in Table 11 Table 12 displays the key projects identified by the
Partnership
These projects include (1) Near-Term Priority Improvement Projects and (2) Near-Term Expected Roadway Improveshyments
The Near-term Priority improvement Projects would proshyvide several new roadway connections for people to travel within and through the area to avoid congestion They also include new transit routes and widening existing roadways
viewed by the Partnership as a package that would provide system-wide travel benefits These improvements targeted
for completion through 2012 would reduce vehicle hours of delay during commute hours by 30 percent
The near-Term Expected Roadway Improvements are conshysidered by the Partnership to be readily expected since they are tied to expected development or are part of a near-term
capital improvements program
Visionary projects Visionary projects are not yet included in the SaCOg MTP or EDCTC RTP but appear to offer considerable corridor mobilshyity benefits and merit further analysis and consideration for inclusion in the next MTP and RTP These are displayed in
Table 13
The ldquoPlus 10 Listrdquo in the SACOG MTP identifies projects
that are attractive from a performance standpoint but could not be included in the Final Project Lists because of financial constraint The ldquoPlus 10 Listrdquo element offers the
opportunity to include projects that would not be affordshyable without additional funding Some projects identified in
the Visionary Projects List were analyzed by SACOG during
development of the current MTP Some of these are included in the ldquoPlus 10 Listrdquo
Watt Avenue Light Rail Station Improvement Project
c h a p t e r s i x p l a n n e d c o r r i d o r s y s t e m m a n a g e m e n t s t r a t e g i e s
Table 9 US 50 ConCePT loS and FaCiliTy TyPe
location Forecasted level of Service1 (loS) and Facility Type
County description and location From Post Mile To Post Mile Current
loS1 20-year no build loS12
20-year build loS12
20-year Concept
loS13 existing Facility4 Concept Facility456 Ultimate Facility457
yOL interstate 80 to yoloSacramento County Line
000 316 F F F F 8F (6F between Jefferson Blvd ramps)
8F+2HOV+aux Lanes 8F+2HOV+aux Lanes
SaC yoloSacramento County Line to SR 99 and 51
L000 L248 = R000 F F F F 8F 8F+2HOV+aux Lanes 8F+2HOV+aux Lanes
SaC State Routes 99 and 51 to watt avenue R000 R534 F F F F 8F 8F+2HOV+aux Lanes 8F+2HOV+aux Lanes
SaC watt avenue to Zinfandel Drive R534 R1092 F F F F 8F 8F+2HOV+aux Lanes 8F+2HOV+aux Lanes
SaC Zinfandel Drive to Sunrise Boulevard R1092 1250 E F F F 8F 8F+2HOV+aux Lanes 8F+2HOV+aux Lanes
SaC Sunrise Boulevard to Folsom Boulevard 1250 1701 E F F F 6F+2HOV to Hazel ave 4F+2HOV
to Folsom Blvd
6F+2HOV+aux Lanes to Hazel ave 4F+2HOV+aux
Lanes to Folsom Blvd
8F+2HOV+aux Lanes
SaC Folsom Boulevard to SaCED County Line 1701 2314 D F F F 4F+2HOV 4F+2HOV+aux Lanes 6F+2HOV+aux Lanes
ED SacramentoEl Dorado County Line to Cameron Park Drive
000 R657 E F F F 4F 4F+2HOV+aux Lanes 6F+2HOV+aux Lanes
ED Cameron Park Drive to Missouri Flat Road R657 R1506 E F E E 4F 4F+2HOV+aux Lanes to greenstone 4F+aux Lanes
to Missouri Flat
6F+2HOV+aux Lanes to greenstone 4F+2HOV+aux Lanes
to Missouri Flat
ED Missouri Flat Road to End of Freeway in Placerville
R1506 1725 D F F F 4F 4F+aux Lanes 4F+aux Lanes
ED End of Freeway in Placerville to Bedford avenue
1725 1811 D E E E 4E 4E 4E
ED Bedford avenue to Cedar grove Exit 1811 R2595 D F F F 4F to Smith Flat 4E to Camino 4F+aux Lanes to Smith Flat 4E to Camino
4F+aux Lanes
1 Level of Service (LOS) A ldquoreport cardrdquo for evaluating traffic flow with ldquoArdquo being the best and ldquoFrdquo being the worst 2 20-year LOS (No Build) The LOS that would be expected at 20 years with no improvements 3 20-year Concept LOS The minimum acceptable LOS over the next 20 years 4 Facility Type Codes C=Conventional Highway E=Expressway F=Freeway HOV=High Occupancy Vehicle Lanes aux=auxiliary Lanes 5 Operational improvements are included in future facilities for all segments Examples of operational improvements include TOS improvements and auxiliary lanes 6 Concept Facility the future roadway with improvements needed in the next 20 years if LOS ldquoFrdquo no further degradation of service from existing ldquoFrdquo is acceptable as indicated by delay performance measurement 7 Ultimate Facility The future roadway with improvements needed beyond a 20 year timeframe
HigHway 50 corridor system management plans [ 37 ]
c h a p t e r f i v e p e r f o r m a n c e m e a s u r e s
Table 10 US 50 CSMP STraTegieS
Strategy description implementation Challenges
Maintain and operate the existing corridor multi-modal trans-
portation infrastructure
Maintain the existing investment in all modes of the transportation system and provide adequate resources for daily operations including operating
revenues for transit services
Funding availability funding competition within the region
Fully coordinate the delivery of transportation services and facili-ties in the corridor including daily operations and system planning
for enhancements
Interagency operational coordination to maximize the efficiency and effec-tiveness of all modes operating in the corridor with a focus on the CSMP transportation network defined in this CSMP Use of an existing group or
committee to provide initial oversight for this strategy
Diverse interests and competing priorities and limited resources
Construct planned and pro-grammed corridor capital improve-
ment projects
implementation of the capital improvements in the corridor included within the approved Metropolitan Transportation Plan and Regional Transportation
Plan for all transportation modes within the scope schedule and cost specified
Funding availability funding competition within the region
Comprehensive daily monitoring of the status of all modes providing service on the CSMP transporta-
tion network
Full deployment of multimodal transportation service status detection systems for all CSMP network components
Funding availability funding competition within region
Provide traveler information to the public
Provide the public with real-time easily accessible information regarding the status of all CSMP transportation system components so as to allow travel-
ers to make informed decisions about trip mode time and routing options
Funding availability funding competition within region
Continually monitor and analyze the CSMP transportation network to improve system performance
Monitor transportation performance measures and make system modifica-tions as appropriate on a frequent and timely basis Staff resources and data availability
Decrease the duration of non-recurrent traffic congestion
Expand and enhance the Freeway Service Patrol to respond to automobile accidents and vehicle break-downs
Funding availability funding competition within the region
Timely implementation of STaRNET
Expedite the implementation of the STaRNET operators of transportation facilities and emergency responders in the Sacramento region through real-time sharing of data and live video refinement of joint procedures
pertaining to the operation of roadways and public transit and public safety activities as well as enhance the regionrsquos 511 web site and interactive
telephone service to provide more traveler information
Developmental time acceptance by agencies and integration into daily use and identifica-
tion of maintenance and operations funding
Enhance transit and rail service increase transit service frequency provide express transit services imple-
ment bus rapid transit routes reduce headways for light rail and buses and construct planned light rail line extensions
Funding availability funding competition within the region
Complete Bus Carpool lane network
Complete the regional buscarpool lane network including freeway-to-freeway HOV lane connectors
Funding availability funding competition within the region Public agency and public
acceptance of network
[ 38 ] HigHway 50 corridor system management plan
c h a p t e r s i x p l a n n e d c o r r i d o r s y s t e m m a n a g e m e n t s t r a t e g i e s
tabLe 10 uS 50 CSMP StrategieS (ConTInued)
Strategy Description implementation Challenges
Enhance Transportation Demand Management strategies
Encourage employers to provide telecommuting and flexible working hour options to employees
acceptance by employers and resources to participate
Optimize the timing and synchronishyzation of traffic signals
Coordinate the optimization and timing of traffic signals on freeway ramps and along parallel and connecting roadways within and between jurisdicshytions to improve traffic flow and reduce congestion Provide signal priority
systems for transit vehicles
Funding availability and coordination among cities counties and Caltrans
improve access management of freeways and parallel connecting roadways
Develop and implement access management strategies to maintain the operational efficiency of freeways and parallelconnecting roadways
agreement between responsible jurisdicshytions as to where increased access control is needed increased access control on some parallelconnecting roadways may increase
traffic volumes on non-corridor roads
Develop innovative use of CMSs (eg travel times)
Potential uses of CMSs to improve system efficiency include the use of CMSs along portions of all corridors near transit station to indicate travel
times based on real-time existing traffic conditions on the freeway as well as on parallel roadways and express bus and light rail services CMS can also be used to identify the number of parking spaces that are still available at
the light-rail stations
Funding availability funding competition within the region
Implement amp expand Transit AVLTransit status information
enhancements for system users
Expand the use of AVL systems utilizing GPS technology to track in real-time the location of transit vehicles monitor transit schedules dispatch transit vehicles and provide real-time passenger information such as ldquonext busrdquo or
ldquonext trainrdquo arrival times
Funding availability funding competition within region
Expand Park-and-Ride lots at key locations
Add additional capacity to existing park-and-ride lots near transit stations and other locations that are approaching capacity
Funding availability funding competition within the region and available land
improve bike-pedestrian access in the CSMP
transportation network
Plan and program for construction of additional bicycle paths lanes and related improvements for access and connectivity to transit park and ride
lots and destination points
Funding availability funding competition within the region
Provide ldquoBike-SharingrdquordquoCar-Sharingrdquo tofrom transit (ldquoCarlinkrdquo) and from
neighborhoods
Expand the Regional Rideshare and Spare-the-Air programs to include bicycle and car sharing opportunities
Funding availability and coordination between SaCOg TMa air Districts employers developshyers property managers and local government
officials
Provide parking management stratshyegies in interested jurisdictions where applicable to discourage
use of single-occupant vehicles
in higher-density areas provide preferential parking for carpools and vanshypools require residential parking permits remove on-street parking and or provide graduated parking fees for metered on-street parking based on
vehicle type and time of day for SOV spaces to encourage transit use
Acceptance by businesses local officials and the general public
Expand bicycle commute amp transit fare strategiessubsidies
increase participation by large employers in programs that subsidize transit fares for employees during peak-hour commute times and provide bicycling
to work incentives
Voluntary participation by large employers to pay subsidy to transit providers
HigHway 50 corridor system management plan [ 39 ]
c h a p t e r s i x p l a n n e d c o r r i d o r s y s t e m m a n a g e m e n t s t r a t e g i e s
tabLe 11 KeY CaPitaL ProjeCtS
CountyLead agency
route roadway from to Project
Description Programmed
funds
additional funding Needed
total Cost estimate (x $1000)
Comp Year (FFY)
uS 50
Sacramento Caltrans District 3
US 50 Downtown watt avenue HOV Lanes $0 $75000 $75000 2020
Sacramento Caltrans District 3
US 50 watt avenue Sunrise Blvd HOV Lanes $165000 $0 $165000 2013
Sacramento Caltrans District 3
US 50 Bradshaw Road
Mather Field Road
Eastbound and Westbound Auxiliary Lanes
$0 $3700 $3700 2016
Sacramento Caltrans District 3
US 50 State Route 99
(Oak Park Interchange) interchange improvements including buscarpool lane
connectors $0 $150000 $150000 2014
Sacramento Caltrans District 3
US 50 interstate 5
(Riverfront Interchange) Riverfront Interchange
improvements including bus carpool lane connectors
$30000 $170000 $200000 2016
ED Caltrans District 3 US 50 Camino
Operational Safety improvements Construct an
undercrossing median barrier modify local road connections andor associated operational improvements on and adjacent
to US 50
$15000 $0 $15000 2012
ED ED County DOT US 50
west of Latrobe Road
west of Bass Lake
grade HOV Lanes (Ph1) $47141 $0 $47141 2010
ED Caltrans District 3 US 50
west of Bass Lake Road
Ponderosa Road
HOV Lanes (Ph2) $55000 $0 $55000 2011
ED Caltrans District 3 US 50 Ponderosa
Road greenstone
Road HOV Lanes (Ph3) $22357 $0 $22357 2013
ED ED County DOT US 50 Future Silva
Valley iC
Future Empire Ranch IC
Mainline Widening construct new WB lane within the
median from proposed Silva Valley IC to proposed Empire
Ranch IC
$2950 $0 $2950 2013
[ 40 ] HigHway 50 corridor system management plan
c h a p t e r s i x p l a n n e d c o r r i d o r s y s t e m m a n a g e m e n t s t r a t e g i e s
tabLe 11 KeY CaPitaL ProjeCtS (ConTInued)
CountyLead agency
route roadway from to Project
Description Programmed
funds
additional funding Needed
total Cost estimate (x $1000)
Comp Year (FFY)
PARALLEL AnD COnnECTInG ROADWAYS
ED ED County DOT
Silva Valley Parkway
Entrada Drive
Future US 50
Silva Valley Parkway iC
Widen Silva Valley Road from 2 lanes to 4 lanes includes
Class ii bike lanes and left turn storage pockets
$2921 $0 $2921 2010
ED ED County DOT
Silva Valley Parkway US 50
US50 Silva Valley Parkway (Phase 2) Includes constructshying overcrossing and ramps
signalization at EB and WB on off ramps
$57817 $0 $57817 2016
ED ED County DOT
Headington Road
Missouri Flat Road
El Dorado Road
Extend 2 lanes with median $9878 $0 $9878 2012
ED ED County DOT
Durock Road
Robin Lane South
Shingle Road
Extend 2 lanes with median $1239 $9214 $10453 2015
ED ED County DOT
Durock Road
Business Center Drive intersection signalization
includes adding turn pockets on Durock Road
$4333 $0 $4333 2009
ED City of Placerville
Point View Drive Broadway Smith Flat
Road Extend 2 lanes $1300 $0 $1300 2020
ED City of Placerville
western Placerville
US 50 interchange
Forni Road Ray Lawyer
Drive
Placerville Drive
Interchange Reconstruction convert Ray Lawyer Dr
Overcrossing to full IC Auxiliary Lanes
$5059 $34741 $39800 2020
Sacramento City of Rancho
Cordova
Mather Boulevard
Rockingham Road
Zinfandel Drive widen to 4 lanes $0 $8617 $8617 2020
Sacramento Rancho Cordova
Parkway ii
Grant Line Road
White Rock Road
New 6-lane expressway includshying intersection improvements at Kiefer Blvd amp White Rock
Road
$0 $44518 $44518 2020
Sacramento City of Folsom
Scott Road US 50 White Rock Rd
widen from 2 to 6 lanes $16000 $0 $16000 2020
Sacramento Sacramento County DOT
White Rock Road
Grant Line Rd
Prairie City Rd
Widen from 2 to 4 lanes realign near Nike and Nimbus Roads and connect with existshying alignment west of Prairie City Rd Realign Grant Line Rd to intersect with realigned
White Rock Rd
$26600 $0 $26600 2020
Sacramento Sacramento County DOT
Hazel avenue
US 50 Hazel Madison
Widen American River Bridge and approaches from 4 to 6 lanes Widen Hazel Avenue from AR Bridge to Madison from 4 to 6 lanes with Bike
LanesSignals
$83530 $0 $83530 2020
HigHway 50 corridor system management plan [ 41 ]
c h a p t e r s i x p l a n n e d c o r r i d o r s y s t e m m a n a g e m e n t s t r a t e g i e s
tabLe 11 KeY CaPitaL ProjeCtS (ConTInued)
CountyLead agency
route roadway from to Project
Description Programmed
funds
additional funding Needed
total Cost Estimate (x $1000)
Comp Year (FFY)
PARALLEL AnD COnnECTInG ROADWAYS
ED ED County DOT
green Valley Road
Salmon Falls Road
east
Deer Valley Road
widen from 2 to 4 lanes $0 $14576 $14576 2025
ED ED County DOT
green Valley Road
Deer Valley Road east Lotus Road widen $958 $4513 $5471 2015
ED ED County DOT
green Valley Road
Francisco Drive
Salmon Falls Road
widen from 2 to 4 lanes divided $412 $3491 $3903 2015
ED ED County DOT
Latrobe Road
investment Boulevard
golden Foothill Parkway
widen from 2 lanes undivided to 4 lanes
divided $1076 $8792 $9868 2015
ED ED County DOT
Latrobe Road
Carson Creek
White Rock Road
widen from 4 to 6 lanes $0 $23755 $23755 2025
ED ED County DOT
white Rock Road
EDSac County Line
Manchester Drive
widen 2 to 4 lanes divided includes signal interconnect and coorshy
dination
$0 $23755 $23755 2025
Sacramento City of Rancho
Cordova
Easton Valley
Parkway
Prairie City Road
Empire Ranch Road extenshysion south of
US 50
Construct new 4 lane road $0 $45000 $45000 2020
Sacramento Sacramento County DOT
Hazel avenue
Easton Valley
Parkway
Grant Line RoadWhite Rock Road
New road extension 4 lane limited access
through aerojet property $0 $18000 $18000 2018
Sacramento Sacramento County DOT
white Rock Road
Prairie City Road
ED County Line
widen to 4 lanes $8330 $64773 $73103 2018
Sacramento Sacramento County DOT
green Valley Road
East Natoma Sacramento ED County
line widen to 4 lanes $0 $3000 $3000 2018
Sacramento City of Rancho
Cordova
Zinfandel Drive
international Drive
Folsom Boulevard
widen to 4 lanes $0 $12000 $12000 2020
[ 42 ] HigHway 50 corridor system management plan
c h a p t e r s i x p l a n n e d c o r r i d o r s y s t e m m a n a g e m e n t s t r a t e g i e s
tabLe 11 KeY CaPitaL ProjeCtS (ConTInued)
CountyLead agency
route roadway from to Project
Description
Pro-grammed
funds
addi-tional
funding Needed
total Cost estimate (x $1000)
Comp Year (FFY)
traNSit
yolo amp Sacramento City of west Sacramento
amp City of Sacramento
Sacramento River
Crossing
15th Street in the City
of west Sacramento
Broadway in the City of
Sacramento
New all-modal river crossing (Auto Transit Bike amp Pedestrian)
from Sacramento across the Sacramento River to West
Sacramento The crossing was modeled between Broadway in Sacramento amp 15th Street in
West Sacramento but final alignshyment options will be studied in subsequent planning efforts
$800 $99200 $100000 2019
Sacramento Cal State University
Sacramento
CSUS Campus mdash mdash
Sac State Tram adjoining City streets and SRTD 65th Street light railbus transfer station Bus Rapid Transit System
$23574 $0 $23574 2013
Sacramento City of Rancho
Cordova
Rancho Cordova Various Various
New Service Rancho Cordova Pilot Transit Shuttle System new transit service for connection to
RTs Gold Line
$2380 $1500 $38880 2014
yolo amp Sacramento City of west Sacramento
TBD west
Sacramento Sacramento Streetcar Service between west
Sacramento and Downtown Sacramento
$17400 $54700 $72100 2014
Sacramento City of Rancho
Cordova RT Gold Line
RT Gold Line Tracks
Mather Field Road
Light Rail Grade Separations $0 $52888 $52888 2025
Sacramento City of Rancho
Cordova RT Gold Line
RT Gold Line Tracks Zinfandel Drive Light Rail Grade Separations $0 $52888 $52888 2025
Sacramento City of Rancho
Cordova RT Gold Line
RT Gold Line Tracks
Bradshaw Road
Light Rail Grade Separations $0 $35260 $35260 2025
Sacramento City of Rancho
Cordova RT Gold Line
RT Gold Line Tracks Routier Road Light Rail Grade Separations $0 $35260 $35260 2025
Sacramento City of
Sacramento Sacramento Valley Station
Sacramento intermodal Transportation Facility (Phase 1) - Develop intermodal transportashytion terminal for heavy rail light
rail and bus service
$77799 $0 $77799 2010
Sacramento City of
Sacramento Sacramento Valley Station
Sacramento intermodal Transportation Facility (Phase 2) - Develop intermodal transportashytion terminal for heavy rail light
rail and bus service
$24101 $1000 $25101 2014
HigHway 50 corridor system management plan [ 43 ]
c h a p t e r s i x p l a n n e d c o r r i d o r s y s t e m m a n a g e m e n t s t r a t e g i e s
TABLE 11 KEY CAPITAL PROJECTS (CONTINUED)
CountyLead Agency
Route Roadway From To Project
Description Programmed
Funds
Additional Funding Needed
Total Cost Es-timate (x $1000)
Comp Year (FFY)
BICYCLE ROUTES
Sacramento City of Rancho
Cordova
US 50Mather Field Road IC US 50 Mather
Field Road
US 50Mather Field Road PedestrianBike Crossing along
the Mather Airport RR Spur alignment
$0 $820 $1055 2015
ED ED County DOT
Sacramento Placerville
Transportation Corridor
Forni Rd
Missouri Flat Rd Class I Bike Trail $1423 $111 $1534 2009
ED City of Placerville
El Dorado Trail Western
Extension
Canal Street Main Street
Ray Lawyer DriveForni
Road Class 1 Bike Trail $1850 $0 $1850 2010
ED ED County DOT
US 50ED Hills Blvd IC US 50
El Dorado Hills Blvd
Latrobe Road
US 50El Dorado Hills Blvd Pedestrian Overcrossing $5508 $66 $5574 2014
TABLE 12 50 MOBILITY PARTNERSHIP KEY CAPITAL PROJECTS
RouteRoadway From To Project Description
NEAR TERM PRIORITY IMPROVEMENT PROJECTS
US 50 Sunrise Scott Road Auxiliary Lane
US 50 Hazel Avenue Interchange Improvements
Hazel Avenue Folsom Boulevard Easton Valley Parkway New 4 Lane Road
Easton Valley Parkway Hazel Avenue Rancho Cordova Parkway New 6 Lane Road
Rancho Cordova Parkway Easton Valley Parkway White Rock Road New 4 Lane Road
White Rock Road Sunrise Boulevard Silva Valley Parkway Widen to 4 Lanes
RT Gold Line Hazel Iron Point Station Passing Tracks
US 50 Rancho Cordova Parkway New Interchange
Zinfandel Drive South of International Douglas Road New 4 Lane Road
International Drive Kilgore Road Rancho Cordova Parkway New 6 Lane Road
Douglas Road Zinfandel Extension Sunrise Boulevard Widen to 4 Lanes
Sunrise LRT Citrus Road Sunrise Mall Bus Rapid TransitExpress Bus
[ 44 ] HIGHWAY 50 corridor system management plan
c h a p t e r s i x p l a n n e d c o r r i d o r s y s t e m m a n a g e m e n t s t r a t e g i e s
TABLE 12 50 mOBILITY PARTnERSHIP kEY CAPITAL PROjECTS (COnTInUED)
routeroadway from to Project Description
US 50 nEAR TERm PRIORITY ImPROVEmEnT PROjECTS
US 50 Empire Ranch Road New interchange
US 50 Silva Valley New interchange
US 50 Scott Road Empire Ranch Road Aux Lanes
US 50 Empire Ranch Road El Dorado Hills Boulevard Aux lanes and climbing lanes
US 50 El Dorado Hills Boulevard Silva Valley Parkway Aux lanes and climbing lanes
US 50 Silva Valley Parkway Bass Lake Road Aux lanes
Sunrise Boulevard White Rock Road Douglas Boulevard widen to 6 lanes
Sunrise Boulevard Douglas Boulevard Jackson Road widen to 4 lanes
White Rock Road Sunrise Boulevard Future Rancho Cordova Parkway and El Dorado County Line to Latrobe Road
widen to 4 lanes
Douglas Boulevard Sunrise Boulevard Grant Line Road widen to 4 lanes
Rancho Cordova Parkway Douglas Boulevard Rio del Oro Parkway New 2 lane road
Rancho Cordova Parkway Rio del Oro Parkway White Rock Road New 6 lane road
Jaeger Road Douglas Road Kiefer Boulevard New 4 lane road
Chrysanthy Sunrise Boulevard Americanos Boulevard New 4 lane road
Kiefer Boulevard Sunrise Boulevard Jaeger Road New 4 lane road
Grant Line Road Douglas Road Chrysanthy Road widen to 4 lanes
Hazel avenue Gold Country Boulevard Madison avenue widen to 6 lanes
Latrobe Road South of White Rock Road widen to 4 lanes
TABLE 13 VISIOnARY PROjECTS
County routeroadway from to Project Description
Sac yolo US 50 Enterprise Downtown Sacramento HOV Lanes
ED TBD Folsom Placerville Transit ndash Type TBD
ED New Road Latrobe Road White Rock Road (poten shy
tially US 50) New 2-lane road
HigHway 50 corridor system management plan [ 45 ]
c h a p t e r s i x p l a n n e d c o r r i d o r s y s t e m m a n a g e m e n t s t r a t e g i e s
[ 46 ] HigHway 50 corridor system management plan
Page Inte
ntionally
Left
Blank
congestion and bottleneck analysis
chapter seven
The 2000 Highway Capacity Manual defines a bottleneck
as ldquoa road element on which demand exceeds capacityrdquo
The bottleneck analysis evaluates specific causes of existshying recurrent traffic congestion in the corridor Freeway bottleneck locations that create mobility constraints are identified and documented and their relative contribution
to corridor-wide congestion is reported The bottleneck locations were determined based on a combination of the use of 2006 PeMS data HiCOMP report probe vehicle tach runs and field observations
Traffic congestion can be categorized as either recurrent
or non-recurrent
recurrent congestion occurs repeatedly at the same place and time of day in a predictable pattern Recurrent congesshytion is often associated with facility capacity limitations changes in capacity conflicting vehicle movements such
as lane merges inadequate number of transit vehicles to handle passenger loads or other persistent physical condishytions of the transportation facility
Non-recurrent congestion is usually attributed to collishysions equipment malfunction community events weather construction projects and other occasional occurrences When transportation systems are close to their maximum
carrying capacity non-recurrent congestion is more likely to occur as there is little excess capacity in the system
The location and extent of the bottlenecks on US 50 found
in the aM and PM peak periods are summarized in Tables 14 and 15 These depictions should be considered a snapshyshot view and not a comprehensive analysis of all bottleshynecks in the corridor Further work is being conducted to
refine the identification and causality of bottlenecks within
the corridor Table 14 shows a summary of the US 50 eastbound bottlenecks while the tables that follow discuss each bottleneck including location and possible causality Table 15 shows a summary of the US 50 westbound bottleshynecks while the tables that follow discuss each bottleneck including location and possible causality Minor or hidden bottlenecks are those Freeway bottleneck
that are not as defined locations that create (or severe) as the major mobility constraints bottlenecks Please note are identified and that the graphics accomshy documented and their panying the bottlenecks
relative contribution to are not to scale
corridor-wide congestion Major bottlenecks in the is reported eastbound direction during the aM peak period are at Howe avenue and during the PM peak period are at 48th Street Howe Avenue Mayhew Road Routier Road Sunrise Boulevard and El Dorado Hills Boulevard Major bottlenecks in the westbound direction during the aM peak period are at El Dorado Hills Boulevard Hazel Avenue Zinfandel Drive
HigHway 50 corridor system management plan [ 47 ]
c h a p t e r s e v e n c o n g e s t i o n a n d b o t t l e n e c k a n a l y s i s
Bradshaw Road and Howe Avenue and major bottleneck
locations during the PM peak period are at Zinfandel Drive Routier Road Bradshaw Road Howe Avenue and Intershystate 5
Causalities for these bottlenecks range from high-traffic
demand (congestion) heavy weavingmerging areas or physical constraints such as lane drops lack of ramp meters incomplete HOV network incomplete Auxiliary Lane
network poorly coordinated traffic signals and an off-ramp
queue (Sunrise Boulevard) US 50 Westbound Onramp
TABLE 14 US 50 EASTBOUnD BOTTLEnECk SUmmARY Source PeMS Caltrans tach runs and
Cambridge Systematics field observations
bottleneck Location PeMS Speed Contours Caltrans Probe Vehicle Runs
Cause aM PM aM PM
A Jefferson Blvd PM 25 Minor Minor Traffic weaving truck volumes and grade
B 48th St PM 7 Minor Major Minor Minor Merge from SR 51 and SR 99
C Howe ave PM 9 Major Major Major weave between Howe and watt
D Mayhew Rd PM 12 Major Minor Major Weaving before Bradshaw Exit
E Routier Rd PM 14 Minor Major Weaving before Mather Field Rd Exit
F Sunrise Blvd PM 185 Minor Major Lane drop HOV add off-ramp queue
G Folsom Blvd PM 22 Minor Minor Lane drop 4 to 3
H El Dorado Hills Blvd PM 275 Major
Poorly coordinated traffic signal on arterial causes spillback onto freeway
a jefferson blvd bottleneck The bottleneck approximately located at Jefferson Blvd is due to weaving traffic as those entershying the freeway from Jefferson Blvd must cross those attempting to exit the freeway to I 5 There is a large number of trucks in the stream which struggle with the grade at this location exacerbatshying the bottleneck
[ 48 ] HigHway 50 corridor system management plan
c h a p t e r s e v e n c o n g e s t i o n a n d b o t t l e n e c k a n a l y s i s
b 48th St bottleneck The bottleneck approximately located at 48th St is due to the additional traffic merging from SR 51 and SR 99 combined with the eventual lane drop at 59th St This queue extends upstream past the off-ramp to SR 5199 These off-ramps are bottlenecks in themselves which spill back and choke the US 50 mainline
C Howe Ave Bottleneck The bottleneck at Howe ave is due to the entering traffic from Howe Ave Two Howe Ave on-ramps feed into US 50 eastbound southbound Howe ave loop on-ramp and northbound Howe ave direct ramp approximately 300 feet apart The watt avenue off-ramp is just down stream with heavy exiting volumes therefore the segment between Howe and watt is characterized by heavy weaving
D mayhew Rd Bottleneck The bottleneck approximately located at Mayhew Rd most likely begins with the additional traffic entering from Watt Ave and ends with the exiting traffic at Bradshaw Rd It is possible that there is a high proportion of weaving traffic with in this section (Watt Ave traffic moving to the left lane and those exiting at Bradshaw Rd moving to the right lane)
HigHway 50 corridor system management plan [ 49 ]
c h a p t e r s e v e n c o n g e s t i o n a n d b o t t l e n e c k a n a l y s i s
[ 50 ] HigHway 50 corridor system management plan
e routier rd bottleneck It is likely that the bottleneck at Routier Rd is due to the same merging conditions associated with Mayhew Rd The area is comprised of both residential and light industrialoffice land uses therefore during the PM peak period there are large volumes of vehicles entering at Bradshaw Rd moving to the left lanes and large volumes of vehicles moving to the right lane to exit at Mather Field Rd
f Sunrise blvd bottleneck At Sunrise Blvd the right-most lane exits while an HOV lane is added as the median lane The bottleneck is formed from vehicles shifting left to avoid exiting at Sunrise Blvd and to enter the HOV lane There is a large volume of vehicles queued at the Sunrise off-ramp which spills back and negatively affects the US 50 mainline
g folsom blvd bottleneck The right-most lane exits to Folsom Blvd leaving one HOV lane and two regular lanes along the US 50 The bottleneck is caused by this lane drop as well as the quick merge at the Folsom on-ramp
c h a p t e r s e v e n c o n g e s t i o n a n d b o t t l e n e c k a n a l y s i s
H The eastbound US 50 at El Dorado Hills Blvd Bottleneck The eastbound El Dorado Hills Blvd bottleneck is caused by a traffic signal on the arterial that often causes spillbacks on the EB loop offramp onto the freeway mainlines
TABLE 15 US 50 WESTBOUnD BOTTLEnECk SUmmARY Source PeMS Caltrans tach runs and Cambridge Systematics field observations
bottleneck Location PeMS Speed Contours Caltrans Probe Vehicle Runs
Cause aM PM aM PM
A El Dorado Hills Blvd PM 275 Major Poorly coordinated traffic
signal on El Dorado Hills Blvd
B Hazel Ave PM 21 Major Entering traffic
C Zinfandel Dr PM 16 Minor Major Major Major Entering traffic
D Routier Rd PM 14 Minor Major Minor Weaving traffic
E Bradshaw PM 13 Major Major Major Merging traffic and curve
F Howe Ave PM 9 Minor Major Major Major Weaving traffic and grade
G SR 51SR 99 PM 6 Minor Lane drop weaving traffic
H i-5 PM 3 Major Weaving traffic
HigHway 50 corridor system management plan [ 51 ]
c h a p t e r s e v e n c o n g e s t i o n a n d b o t t l e n e c k a n a l y s i s
[ 52 ] HigHway 50 corridor system management plan
A El Dorado Hills Blvd Bottleneck The minor bottleneck at El Dorado Hills Boulevard is caused by the traffic signal on El Dorado Hills Blvd that causes spillback on the westbound offramp onto the freeway mainlines
B Hazel Avenue Bottleneck In 2006 the Hazel Ave Bottleneck is caused by the traffic entering at both Hazel Ave and Folsom Blvd (the two on-ramps are separated by about one mile) The bottleneck that would appear at Folsom Blvd combines with the bottleneck at Hazel ave to form a large bottleneck that does not clear until after Hazel ave Sometimes causshying spillbacks as far as Prairies City Road this bottleneck was mitigated in 2007 as part of the GO CALIFORNIA program
C Zinfandel Dr Bottleneck There is heavy traffic coming from Sunrise Blvd but the lane addition immediately after the westbound on-ramp prevents a bottleneck from forming but as traffic flows westward the heavy traffic entering from Zinfandel Dr causes a bottleshyneck here
D Routier Rd Bottleneck The bottleneck at Routier Rd is caused by weaving traffic between Mather Field Rd and Bradshaw Rd This highway segment represents a transition area where vehicles that have been traveling in the left lanes begin to shift to the right lanes to exit while the entering traffic tries to shift to the left lanes
W eav in gLan e Dr o p
c h a p t e r s e v e n c o n g e s t i o n a n d b o t t l e n e c k a n a l y s i s
e bradshaw rd bottleneck The Bradshaw Rd bottleneck is caused by the entering traffic from Bradshaw Road the high truck volumes and the curve west of Bradshaw Two Bradshaw Rd on-ramps feed into US 50 westshybound southbound Bradshaw Rd direct on-ramp and northbound Bradshaw Rd loop on-ramp approximately 400 feet apart
F Howe Ave Bottleneck The Howe ave bottleneck is caused by a grade change and the weaving traffic entering from Howe ave and Hornet Dr competing for the right-most lane with those wanting to exit at 65th Street
G amp H SR 51SR 99 amp I-5 Bottleneck The bottleneck at I 5 is caused by the conflict between entering SR 99 and SR 51 traffic and exiting I-5 traffic as well as the queues formed on the ramps to i-5 which spill back onto US 50 The number of lanes in this section reaches a maximum of 6 and then drops to 4 as two lanes exit at the I-5 freeway This bottleneck is exacershybated during the peak periods when it stretches upstream to the lane drop before SR 99
W ea v in g
Lan e Dr o p
HigHway 50 corridor system management plan [ 53 ]
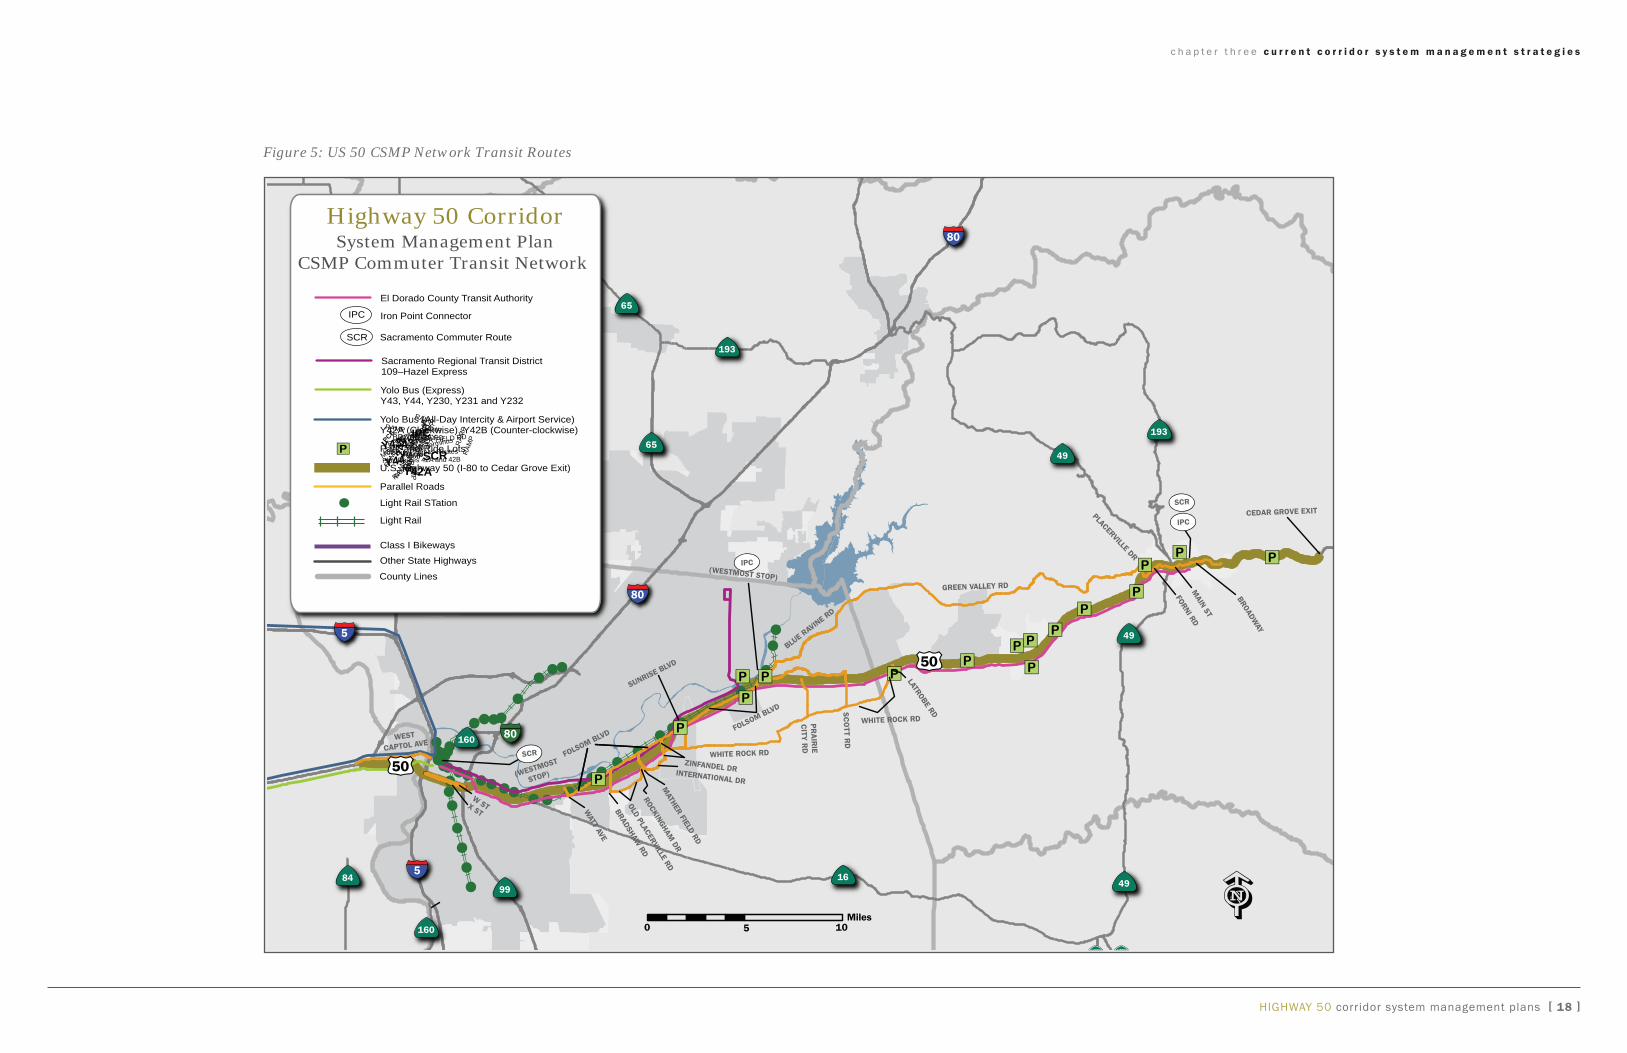
c h a p t e r f i v e p e r f o r m a n c e m e a s u r e s
Page Inte
ntionally
Left
Blank
[ 24 ] HigHway 50 corridor system management plan
performance measures
chapter five
Continuing corridor monitoring and performance mea-
sures are an integral part of corridor management and investment decision making and help identify immediate efficient and effective system operational strategies and
capital improvements Performance measures provide the
important dynamic daily information needed to rapidly
address operational problems caused by recurrent and
non-recurrent traffic congestion Measures are also used to identify the best improvement actions to generate the desired results
Table 5 identifies the performance measures to be used as
part of the corridor system management process
Baseline Data For perFormance measures Tables 6 7 and 8 display baseline data for the perforshymance measures for the CSMP transportation network
The performance data was primarily compiled from the SACMET demand based traffic model the year 2007
edition of the Traffic Volumes Manual the year 2000 edition of the Highway Capacity Manual Caltrans Traffic
Accident Surveillance and Analysis System (TASAS) the 2007 Caltrans Division of Maintenance Pavement Summary Report and ridership records provided by the transit providers
additional performance Performance Measures data was derived from the provide the important Performance Measurement dynamic dailySystem (PeMS) tool an
information needed internet based tool used to
to rapidly addresshost process retrieve and operational problemsanalyze road traffic condishy
tions information from caused by recurrent
real-time and historical and non-recurrent data PeMS obtains 30-sec- traffic congestion ond loop detector data in real-time from detectors installed along the highway corridor
It should be noted that Average Daily Traffic (ADT) and LOS
for some ParallelConnecting Roadways segment locations
in Table 7 was not available These are noted ldquoNo Datardquo
Data collection for non-auto modes is not as robust as what is needed for active system management Subsequent updates of this CSMP will seek to expand the
availability of transit and bicycle performance data collection
HigHway 50 corridor system management plan [ 25 ]
mdash
c h a p t e r f i v e p e r f o r m a n c e m e a s u r e s
TABLE 5 PERFORmAnCE mEASURES DEFInITIOnS AnD APPLICABILITY
Performance Measure Definition of Performance measure applicability to Corridor
STATE HIGHWAY SYSTEm
LOS A ldquoreport cardrdquo measurement with ldquoArdquo being the least amount of
congestion and ldquoFrdquo being the most congestion LOS is a relatively simple and widely used measure which
offers comparison opportunities
Total Vehicle Hours of Delay The additional travel time in hours experienced by all vehicles on the highway segment per day or at peak hour due to congestion
This measurement is used to determine the cost in time which congestion can add to the regular travel time that it takes to traverse a segment of road and is useful in
quantifying the performance of a particular roadway in an understandable format
Total Person Minutes of Delay The additional travel time in minutes experienced by all persons in vehicles on the highway segment per day or at peak hour due
to congestion
This measurement is used to determine the cost in time which congestion can add to the regular travel time that it takes to traverse a given segment of road and is useful in quantifying the performance of a particular roadway in an
understandable format and for comparison of improvement options
Minutes of Delay per Vehicle The additional travel time in minutes experienced by each vehicle on the highway segment at peak hour due to congestion
This measurement is used to determine the cost in time which congestion can add to the regular travel time that it
takes to traverse a given segment of road
Minutes of Delay per Person The additional travel time in minutes experienced by each person in vehicles on the highway segment at peak hour due to congesshy
tion
This measurement is used to determine the cost in time which congestion can add to the regular travel time that it
takes to traverse a given segment of road
Vehicle Travel Time (Minutes) The average time spent by vehicles traversing between two points on a road or highway
Travel time is a measure used to quantify travel time deficienshycies and provide a personal indicator of congestion impacts
Distressed Pavement Pavement that rides rougher than established maximums and or exhibits substantial structural problems as determined by the
Pavement Condition Survey
This measurement provides a ride quality indicator and an indicator for structural roadway problems
Reported Collision Rate Comparison of the actual total collision rate () along a highway segment above or below the statewide average for fatal injury
and property damage-only collisions on comparable facilities
Comparing the total collision and rate with statewide average rate provides an opportunity to assess safety conditions
through the corridor
Reliability Identifies day-to-day variation in travel time for the same trip at the same time of day Focuses on the predictability of travel time
particularly for repetitive trips
Estimates reliability by defining the extra time travelers must add to their average travel time when planning trips to ensure on-time arrival (0 percent no day-to-day variations
100 percent double allotted travel time)
Lost Productivity Measures the capacity of the corridor to accommodate vehicle or person throughput and is calculated as actual volume divided by
the capacity of the highway
As traffic volumes increase to roadway capacity speeds decline rapidly and vehicle throughput drops dramatically which increases traffic congestion and delay and results in
lost productivity
[ 26 ] HigHway 50 corridor system management plan
mdash
c h a p t e r f i v e p e r f o r m a n c e m e a s u r e s
HigHway 50 corridor system management plan [ 27 ]
TABLE 5 PERFORmAnCE mEASURES DEFInITIOnS AnD APPLICABILITY (ConTInued)
Performance Measure Definition of Performance measure applicability to Corridor
PARALLEL AnD COnnECTInG ROADWAYS
LOS A ldquoreport cardrdquo measurement with ldquoArdquo being the least amount of
congestion and ldquoFrdquo being the most congestion LOS is a relatively simple and often used measure which
offers comparison opportunities
traNSit
available Capacity Ratio () of available transit capacity alternatives within the corridor
This measure indicates the available capacity to accommoshydate diverted travelers from single occupant vehicles
c h a p t e r f i v e p e r f o r m a n c e m e a s u r e s
[ 28 ] HigHway 50 corridor system management plan
Page Inte
ntionally
Left
Blank
c h a p t e r f i v e p e r f o r m a n c e m e a s u r e s
Table 6 US 50 PerForManCe MeaSUreS
County location Post Miles
distance (Miles)
average annual daily Traffic1
PerForManCe MeaSUreS
loS1
Total Vehicle Hours of delay2
Total Person Minutes of delay2
Minutes of delay per Vehicle2
Minutes of delay per Person2
Vehicle Travel Time (Minutes)2 distressed
Pavement (lane
Miles)4
reported Col-lision rate
Comparison ()5
reliability6 lost Productivity7
daily Peak Hour3 daily Peak
Hour3 Peak Hour3 Peak Hour3 Peak Hour3 eastbound westbound lost lane Miles aM
Peak Period
lost lane Miles PM
Peak Period
STaTe HigHway SySTeM
yOL interstate 80 to yolo Sacramento County Line
000 to 316 316 180000 F 1169 126 95363 8061 049 046 36 9 26 62 22 01 0
SaC
yoloSacramento County Line to State Routes 99
and 51
L000 to L248 R000
248 253000 F 4993 653 407455 41746 186 175 43 7 20 64 60 53 76
State Routes 99 and 51 to watt avenue
R000 to R534 534 225000 F 10097 1362 823883 87105 397 372 93 15 24 60 48 81 68
watt avenue to Zinfandel Drive
R534 to R1092 558 187000 F 8075 977 658886 62506 351 329 91 19 -32 56 42 44 23
Zinfandel Drive to Sunrise Boulevard
R1092 to 1250 158 149000 E 1271 197 103727 12610 088 082 25 9 -33 46 13 0 16
Sunrise Boulevard to Folsom Boulevard
1250 to 1701 451 125000 E 3087 356 251940 25832 180 149 63 5 -14 60 46 1 45
Folsom Boulevard to SacramentoEl Dorado
County Line
1701 to 2314 613 95000 D 583 122 47537 8867 083 069 70 0 -11 19 55 0 08
ED
SacramentoEl Dorado County Line to Cameron
Park Dr
000 to R657 657 70000 E 504 126 41150 9138 110 091 77 1 -35 PeMS Data
Unavailable PeMS Data Unavailable
PeMS Data Unavailable
PeMS Data Unavailable
Cameron Park Drive to Missouri Flat Road
R657 to R1506 849 62000 E 302 75 24633 4827 079 075 93 2 -61 PeMS Data
Unavailable PeMS Data Unavailable
PeMS Data Unavailable
PeMS Data Unavailable
Missouri Flat Road to End of Freeway in Placerville
R1506 to 1725 219 59000 D 66 16 5376 1053 020 019 24 1 20 PeMS Data
Unavailable PeMS Data Unavailable
PeMS Data Unavailable
PeMS Data Unavailable
End of Freeway in Placerville to Bedford avenue
1725 to 1811 086 52000 D 68 17 5585 1094 021 020 15 2 81 PeMS Data
Unavailable PeMS Data Unavailable
PeMS Data Unavailable
PeMS Data Unavailable
Bedford avenue to Cedar grove Road
1811 to R2595 784 38500 D 58 15 4758 932 023 022 85 10 6 PeMS Data
Unavailable PeMS Data Unavailable
PeMS Data Unavailable
PeMS Data Unavailable
TOTaL mdash 5473 mdash mdash 30273 4042 2470293 263771 1587 1449 7150 80 mdash mdash mdash mdash mdash
1 Source Average Annual Daily Traffic and Level of Service (LOS) calculated is based on 2007 Caltrans Traffic Volumes on California State Highways and Highway Capacity Manual and Cambridge Systematics from 2008 Reported LOS is for the typical most congested daily peak travel period 2 Source Delay is the average additional travel time by vehiclespersons traveling under 60 mph Data derived from 2007 HICOMP report SACMET Travel Demand Model PeMSs traffic data and Caltrans District 3 Traffic Operations Probe vehicle Tach runs 3 Peak Hour is during PM 4 Source 2007 Caltrans Division of Maintenance Pavement Summary Report 5 Source 2004 through 2007 Caltrans Traffic Accident Surveillance and Analysis System summary data of the percentage above or below the statewide average for fatal injury and property damage-only collisions on comparable facilities 6 Reliability The Planning Time Index is a measure of the reliability of the travel time on a particular route It is the ratio of the 95th percentile of travel time on a route to the median free-flow travel time This means itrsquos the amount of time a traveler needs to allocate for a route if they want to show up on time 19 out of 20 trips Reliability and Planning Time data was taken from April 2007 The data covered a 24-hour period of time on each Tuesday wednesday and Thursday of that month That data was then aggregated into a single average 24-hour day it was then analyzed to determine the highest average aM and PM travel time That time was then compared to the best possible average travel time to determine the additional time that was spent traveling the same seg-ment 7 Lost Productivity Data taken April 2007 PeMS As traffic increases to the capacity of the highway speeds decline throughput drops dramatically and the efficiency of the highway to provide mobility decreases This decline in the potential carrying-capacity of the freeway is expressed in terms of how many equivalent lane miles of roadway are lost
HigHway 50 corridor system management plans [ 29 ]
c h a p t e r f i v e p e r f o r m a n c e m e a s u r e s
Table 7 Parallel and ConneCTing roadwayS PerForManCe MeaSUreS
County location average
daily Traffic1
PerForManCe MeaSUreS
loS1
Total Vehicle Hours of delay2
Total Person Minutes of delay2
Minutes of delay per Vehicle2
Minutes of delay per Person2
Vehicle Travel Time (Minutes)2
distressed Pavement
(lane Miles)4
daily Peak Hour3 daily Peak
Hour3 Peak Hour3 Peak Hour3 Peak Hour3
Parallel and ConneCTing roadwayS
yOL west Capitol Enterprise Boulevard to Capitol Mall 13737 No Data
Data is unavailable for these performance measures at this time however will be pursued in the next phase of the CSMP
SaC
w 5th Street to 26th Street 9194 a
X 5th Street to 26th Street 9154 a
Folsom Boulevard watt avenue to Bradshaw Road 25600 C
watt avenue Folsom Boulevard to US 50 63900 F
Bradshaw Road Folsom Boulevard to US 50 22400 a
Folsom Boulevard Bradshaw Road to Sunrise Boulevard 20400 a
Bradshaw Road Old Placerville to US 50 54405 F
Old Placerville Road Bradshaw Road to Rockingham Drive 11864ndash18365 a
Rockingham Drive Old Placerville Road to Mather Boulevard 16516 E
Mather Boulevard Rockingham Drive to Folsom Boulevard 21732 C
international Drive Rockingham Drive to Zinfandel Drive 12808 a
Zinfandel Drive international Drive to Folsom Boulevard 22298ndash47032 BE
white Rock Road Zinfandel Drive to Sunrise Boulevard 25459 a
Sunrise Boulevard US 50 to Folsom Boulevard No Data No Data
white Rock Road Sunrise Boulevard to Prairie City Road 3400 B
Folsom Boulevard Sunrise Boulevard to iron Point Road 17200 a
white Rock Road grant Line Road to EDSaC County Line 6700 D
iron Point Road Folsom Boulevard to East BidwellScott Road 13984 No Data
Scott Road iron Point Road to white Rock Road No Data No Data
Folsom Boulevard iron Point Road to Blue Ravine Road No Data No Data
Blue Ravine Road Folsom Boulevard to green Valley Road No Data No Data
Prairie City Road US 50 to white Rock Road 6000 D
HigHway 50 corridor system management plans [ 30 ]
c h a p t e r f i v e p e r f o r m a n c e m e a s u r e s
Table 7 Parallel and ConneCTing roadwayS PerForManCe MeaSUreS (ConTinUed)
County location average
daily Traffic1
PerForManCe MeaSUreS
loS1
Total Vehicle Hours of delay2
Total Person Minutes of delay2
Minutes of delay per Vehicle2
Minutes of delay per Person2
Vehicle Travel Time (Minutes)2
distressed Pavement
(lane Miles)4
daily Peak Hour3 daily Peak
Hour3 Peak Hour3 Peak Hour3 Peak Hour3
Parallel and ConneCTing roadwayS
ED
green Valley Road EDSaC County Line to Francisco Drive 22600 D
Data is unavailable for these performance measures at this time however will be pursued in the next phase of the CSMP
green Valley Road Francisco Drive to Silva Valley Parkway 13077 D
green Valley Road Silva Valley Parkway to Cameron Park 9849 C
green Valley Road Cameron Park Drive to Deer Valley Road 5278 C
green Valley Road Deer Valley Road (East) to Lotus Road 8381 D
green Valley Road Lotus Road to Placerville Drive 4669 C
Latrobe Road white Rock Road to US 50 24742 C
Durock Road Cameron Park Dr to South Shingle Road 7278 C
Cameron Park Drive Durock Road to US 50 (Durock Road to Coach Lane Coach Lane to US 50) 9544 26603 CD
South Shingle Road Durock Road to US 50 11390 D
white Rock Road EDSaC County Line to Latrobe 12808 D
white Rock Road Latrobe Rd to Silva Valley Pkwy (Latrobe to PostPost to Silva Vlly Pkwy) 10124 CD
Silva Valley Parkway white Rock Rd to Serrano Pkwy (white Rock to Entrada Entrada to Serrano Pkwy) 13708 9328 DC
Forni Road Placerville Drive to Main Street 9049 8379 No Data
Placerville Drive Forni Road to US 50 No Data No Data
Main Street Placerville Drive to Bedford avenue No Data No Data
Main Street Bedford avenue to Broadway No Data No Data
Broadway Main Street to Point View Drive No Data No Data
1 Source Average Daily Traffic and Level of Service (LOS) calculated are based on City of Sacramento between 2001 and 2007 Sacramento County from 20072008 City of Rancho Cordova between 2004 and 2007 and El Dorado County from 2007
HigHway 50 corridor system management plans [ 31 ]
c h a p t e r f i v e p e r f o r m a n c e m e a s u r e s
Page Inte
ntionally
Left
Blank
[ 32 ] HigHway 50 corridor system management plan
c h a p t e r f i v e p e r f o r m a n c e m e a s u r e s
tabLe 8 traNSit PerforMaNCe MeaSure
County transit Provider route Performance Measure
available daily Capacity ()1 available Peak Hour Capacity1
traNSit
SaC
SacRT (Bus)
Route 21 70 10
Route 28 76 59
Route 36 83 74
Route 38 66 44
Route 72 56 20
Route 73 79 45
Route 74 82 43
Route 109 47 22
SacRT (Light Rail) Gold Line 31 Exceeds Capacity
EDSAC ED County Transit Authority
Commuter Express Bus Service Not applicablendashOperates Peak Hour
Only 405
iron Point Connector 764 Not available
Reverse Commuter Not applicablendashOperates Peak Hour Only 982
yoloSaC yolo County Transit District Not applicablendashOperates Peak Hour Only 498
biKe3
1 Source average Daily and Peak Hour available Capacity calculated from each transit providerrsquos route ridership data 2 The Reverse Commuter service is offered on vehicles that are returning to El Dorado County (Commuter Express Buses) 3 Bicycle performance measure(s) will be identified applied and included in the subsequent CSMPs
HigHway 50 corridor system management plan [ 33 ]
c h a p t e r f i v e p e r f o r m a n c e m e a s u r e s
[ 34 ] HigHway 50 corridor system management plan
Page Inte
ntionally
Left
Blank
planned corridor system management strategies
chapter six
ConCept LoS and ConCept FaCiLit y ldquoConcept LOSrdquo and ldquoConcept Facilityrdquo have traditionally been used in Caltrans TCCRs to reflect the minimum level or quality of operations acceptable for each route segment within the 20-year planning period and the highway facility needed in the next 20 years to maintain the Concept LOS
Typical Concept LOS standards in Caltrans District 3 are LOS ldquoDrdquo in rural areas and LOS ldquoErdquo in urban areas how-ever some heavily congested route segments now have a Concept LOS ldquoFrdquo because the improvements required to bring the LOS to ldquoErdquo are not feasible due to environmental right of way financial and other constraints The applica-tion of multi-modal corridor management strategies should reduce the severity and duration of congestion and provide viable travel options and information that will enable a traveler to avoid severe freeway congestion
The Concept LOS and Concept Facility for US 50 are shown in Table 9 almost all US 50 segments are forecasted to operate under LOS ldquoFrdquo conditions in 20 years under the No-Build and Build scenarios
Corridor ManageMent StrategieS The US 50 CSMP also proposes specific strategies to enhance corridor mobility (see Table 10) based on the fol-lowing principles
bull Manage all modes and facilities in the corridor as a single system beginning with the transportation net-work defined in this CSMP
bull Implement comprehensive and dynamic multimodal monitoring and reporting for the system and for all modes
bull Develop and use micro-simulation modeling to identify mobility challenges and to evaluate proposed solutions
bull Complete the projects included in the regional trans-portation plans with an emphasis on the completion of the key mobility improvement projects identified in this CSMP (see Tables 11 and 12)
bull Implement the specific strategies outlined in this CSMP
Key CapitaL projeCtS Tables 11 and 12 contain key capital projects that have been identified as the most critical to corridor mobility These are also included in the SaCOg MTP for 2035 and are either planned without any funding yet programmed are partially programmed
The US 50 CSMPor are entirely programmed SACOG conducted significant proposes specific
public attitude research strategies to enhance for the MTP for 2035 to corridor mobility complement comprehensive outreach efforts through community workshops the TALL Order Moving the Region Forward event the televised Town Hall Road Map for the Future and associated public polling The results of the SaCOg analyses and public out-reach for the MTP were
highway 50 corridor system management plan [ 35 ]
c h a p t e r s i x p l a n n e d c o r r i d o r s y s t e m m a n a g e m e n t s t r a t e g i e s
[ 36 ] HigHway 50 corridor system management plan
used when selecting the key projects for identification in
the CSMP and to ensure consistency Not all corridor projshyects in the MTP are included in the CSMP since the CSMP focuses on the managed network and the SaCOg MTP considers all streets and roads bike routes and transit services in the corridor
highway 50 partnership The Highway 50 Partnership is a cooperative public-private effort among the County of Sacramento City of Rancho
Cordova City of Folsom County of El Dorado and several major landowners that recognize the need to consider corrishydor mobility needs holistically
The Partnership has collaborated effectively to develop a Plan to improve mobility in the US 50 Corridor from Rancho
Cordova to El Dorado Hills an area identified as approprishyate for growth in the SACOG Blueprint Recognizing the
need to generate private investment the Partnership is seeking to implement a regional Highway 50 Corridor fee program to fund these projects
in addition to the key projects indicated in Table 11 Table 12 displays the key projects identified by the
Partnership
These projects include (1) Near-Term Priority Improvement Projects and (2) Near-Term Expected Roadway Improveshyments
The Near-term Priority improvement Projects would proshyvide several new roadway connections for people to travel within and through the area to avoid congestion They also include new transit routes and widening existing roadways
viewed by the Partnership as a package that would provide system-wide travel benefits These improvements targeted
for completion through 2012 would reduce vehicle hours of delay during commute hours by 30 percent
The near-Term Expected Roadway Improvements are conshysidered by the Partnership to be readily expected since they are tied to expected development or are part of a near-term
capital improvements program
Visionary projects Visionary projects are not yet included in the SaCOg MTP or EDCTC RTP but appear to offer considerable corridor mobilshyity benefits and merit further analysis and consideration for inclusion in the next MTP and RTP These are displayed in
Table 13
The ldquoPlus 10 Listrdquo in the SACOG MTP identifies projects
that are attractive from a performance standpoint but could not be included in the Final Project Lists because of financial constraint The ldquoPlus 10 Listrdquo element offers the
opportunity to include projects that would not be affordshyable without additional funding Some projects identified in
the Visionary Projects List were analyzed by SACOG during
development of the current MTP Some of these are included in the ldquoPlus 10 Listrdquo
Watt Avenue Light Rail Station Improvement Project
c h a p t e r s i x p l a n n e d c o r r i d o r s y s t e m m a n a g e m e n t s t r a t e g i e s
Table 9 US 50 ConCePT loS and FaCiliTy TyPe
location Forecasted level of Service1 (loS) and Facility Type
County description and location From Post Mile To Post Mile Current
loS1 20-year no build loS12
20-year build loS12
20-year Concept
loS13 existing Facility4 Concept Facility456 Ultimate Facility457
yOL interstate 80 to yoloSacramento County Line
000 316 F F F F 8F (6F between Jefferson Blvd ramps)
8F+2HOV+aux Lanes 8F+2HOV+aux Lanes
SaC yoloSacramento County Line to SR 99 and 51
L000 L248 = R000 F F F F 8F 8F+2HOV+aux Lanes 8F+2HOV+aux Lanes
SaC State Routes 99 and 51 to watt avenue R000 R534 F F F F 8F 8F+2HOV+aux Lanes 8F+2HOV+aux Lanes
SaC watt avenue to Zinfandel Drive R534 R1092 F F F F 8F 8F+2HOV+aux Lanes 8F+2HOV+aux Lanes
SaC Zinfandel Drive to Sunrise Boulevard R1092 1250 E F F F 8F 8F+2HOV+aux Lanes 8F+2HOV+aux Lanes
SaC Sunrise Boulevard to Folsom Boulevard 1250 1701 E F F F 6F+2HOV to Hazel ave 4F+2HOV
to Folsom Blvd
6F+2HOV+aux Lanes to Hazel ave 4F+2HOV+aux
Lanes to Folsom Blvd
8F+2HOV+aux Lanes
SaC Folsom Boulevard to SaCED County Line 1701 2314 D F F F 4F+2HOV 4F+2HOV+aux Lanes 6F+2HOV+aux Lanes
ED SacramentoEl Dorado County Line to Cameron Park Drive
000 R657 E F F F 4F 4F+2HOV+aux Lanes 6F+2HOV+aux Lanes
ED Cameron Park Drive to Missouri Flat Road R657 R1506 E F E E 4F 4F+2HOV+aux Lanes to greenstone 4F+aux Lanes
to Missouri Flat
6F+2HOV+aux Lanes to greenstone 4F+2HOV+aux Lanes
to Missouri Flat
ED Missouri Flat Road to End of Freeway in Placerville
R1506 1725 D F F F 4F 4F+aux Lanes 4F+aux Lanes
ED End of Freeway in Placerville to Bedford avenue
1725 1811 D E E E 4E 4E 4E
ED Bedford avenue to Cedar grove Exit 1811 R2595 D F F F 4F to Smith Flat 4E to Camino 4F+aux Lanes to Smith Flat 4E to Camino
4F+aux Lanes
1 Level of Service (LOS) A ldquoreport cardrdquo for evaluating traffic flow with ldquoArdquo being the best and ldquoFrdquo being the worst 2 20-year LOS (No Build) The LOS that would be expected at 20 years with no improvements 3 20-year Concept LOS The minimum acceptable LOS over the next 20 years 4 Facility Type Codes C=Conventional Highway E=Expressway F=Freeway HOV=High Occupancy Vehicle Lanes aux=auxiliary Lanes 5 Operational improvements are included in future facilities for all segments Examples of operational improvements include TOS improvements and auxiliary lanes 6 Concept Facility the future roadway with improvements needed in the next 20 years if LOS ldquoFrdquo no further degradation of service from existing ldquoFrdquo is acceptable as indicated by delay performance measurement 7 Ultimate Facility The future roadway with improvements needed beyond a 20 year timeframe
HigHway 50 corridor system management plans [ 37 ]
c h a p t e r f i v e p e r f o r m a n c e m e a s u r e s
Table 10 US 50 CSMP STraTegieS
Strategy description implementation Challenges
Maintain and operate the existing corridor multi-modal trans-
portation infrastructure
Maintain the existing investment in all modes of the transportation system and provide adequate resources for daily operations including operating
revenues for transit services
Funding availability funding competition within the region
Fully coordinate the delivery of transportation services and facili-ties in the corridor including daily operations and system planning
for enhancements
Interagency operational coordination to maximize the efficiency and effec-tiveness of all modes operating in the corridor with a focus on the CSMP transportation network defined in this CSMP Use of an existing group or
committee to provide initial oversight for this strategy
Diverse interests and competing priorities and limited resources
Construct planned and pro-grammed corridor capital improve-
ment projects
implementation of the capital improvements in the corridor included within the approved Metropolitan Transportation Plan and Regional Transportation
Plan for all transportation modes within the scope schedule and cost specified
Funding availability funding competition within the region
Comprehensive daily monitoring of the status of all modes providing service on the CSMP transporta-
tion network
Full deployment of multimodal transportation service status detection systems for all CSMP network components
Funding availability funding competition within region
Provide traveler information to the public
Provide the public with real-time easily accessible information regarding the status of all CSMP transportation system components so as to allow travel-
ers to make informed decisions about trip mode time and routing options
Funding availability funding competition within region
Continually monitor and analyze the CSMP transportation network to improve system performance
Monitor transportation performance measures and make system modifica-tions as appropriate on a frequent and timely basis Staff resources and data availability
Decrease the duration of non-recurrent traffic congestion
Expand and enhance the Freeway Service Patrol to respond to automobile accidents and vehicle break-downs
Funding availability funding competition within the region
Timely implementation of STaRNET
Expedite the implementation of the STaRNET operators of transportation facilities and emergency responders in the Sacramento region through real-time sharing of data and live video refinement of joint procedures
pertaining to the operation of roadways and public transit and public safety activities as well as enhance the regionrsquos 511 web site and interactive
telephone service to provide more traveler information
Developmental time acceptance by agencies and integration into daily use and identifica-
tion of maintenance and operations funding
Enhance transit and rail service increase transit service frequency provide express transit services imple-
ment bus rapid transit routes reduce headways for light rail and buses and construct planned light rail line extensions
Funding availability funding competition within the region
Complete Bus Carpool lane network
Complete the regional buscarpool lane network including freeway-to-freeway HOV lane connectors
Funding availability funding competition within the region Public agency and public
acceptance of network
[ 38 ] HigHway 50 corridor system management plan
c h a p t e r s i x p l a n n e d c o r r i d o r s y s t e m m a n a g e m e n t s t r a t e g i e s
tabLe 10 uS 50 CSMP StrategieS (ConTInued)
Strategy Description implementation Challenges
Enhance Transportation Demand Management strategies
Encourage employers to provide telecommuting and flexible working hour options to employees
acceptance by employers and resources to participate
Optimize the timing and synchronishyzation of traffic signals
Coordinate the optimization and timing of traffic signals on freeway ramps and along parallel and connecting roadways within and between jurisdicshytions to improve traffic flow and reduce congestion Provide signal priority
systems for transit vehicles
Funding availability and coordination among cities counties and Caltrans
improve access management of freeways and parallel connecting roadways
Develop and implement access management strategies to maintain the operational efficiency of freeways and parallelconnecting roadways
agreement between responsible jurisdicshytions as to where increased access control is needed increased access control on some parallelconnecting roadways may increase
traffic volumes on non-corridor roads
Develop innovative use of CMSs (eg travel times)
Potential uses of CMSs to improve system efficiency include the use of CMSs along portions of all corridors near transit station to indicate travel
times based on real-time existing traffic conditions on the freeway as well as on parallel roadways and express bus and light rail services CMS can also be used to identify the number of parking spaces that are still available at
the light-rail stations
Funding availability funding competition within the region
Implement amp expand Transit AVLTransit status information
enhancements for system users
Expand the use of AVL systems utilizing GPS technology to track in real-time the location of transit vehicles monitor transit schedules dispatch transit vehicles and provide real-time passenger information such as ldquonext busrdquo or
ldquonext trainrdquo arrival times
Funding availability funding competition within region
Expand Park-and-Ride lots at key locations
Add additional capacity to existing park-and-ride lots near transit stations and other locations that are approaching capacity
Funding availability funding competition within the region and available land
improve bike-pedestrian access in the CSMP
transportation network
Plan and program for construction of additional bicycle paths lanes and related improvements for access and connectivity to transit park and ride
lots and destination points
Funding availability funding competition within the region
Provide ldquoBike-SharingrdquordquoCar-Sharingrdquo tofrom transit (ldquoCarlinkrdquo) and from
neighborhoods
Expand the Regional Rideshare and Spare-the-Air programs to include bicycle and car sharing opportunities
Funding availability and coordination between SaCOg TMa air Districts employers developshyers property managers and local government
officials
Provide parking management stratshyegies in interested jurisdictions where applicable to discourage
use of single-occupant vehicles
in higher-density areas provide preferential parking for carpools and vanshypools require residential parking permits remove on-street parking and or provide graduated parking fees for metered on-street parking based on
vehicle type and time of day for SOV spaces to encourage transit use
Acceptance by businesses local officials and the general public
Expand bicycle commute amp transit fare strategiessubsidies
increase participation by large employers in programs that subsidize transit fares for employees during peak-hour commute times and provide bicycling
to work incentives
Voluntary participation by large employers to pay subsidy to transit providers
HigHway 50 corridor system management plan [ 39 ]
c h a p t e r s i x p l a n n e d c o r r i d o r s y s t e m m a n a g e m e n t s t r a t e g i e s
tabLe 11 KeY CaPitaL ProjeCtS
CountyLead agency
route roadway from to Project
Description Programmed
funds
additional funding Needed
total Cost estimate (x $1000)
Comp Year (FFY)
uS 50
Sacramento Caltrans District 3
US 50 Downtown watt avenue HOV Lanes $0 $75000 $75000 2020
Sacramento Caltrans District 3
US 50 watt avenue Sunrise Blvd HOV Lanes $165000 $0 $165000 2013
Sacramento Caltrans District 3
US 50 Bradshaw Road
Mather Field Road
Eastbound and Westbound Auxiliary Lanes
$0 $3700 $3700 2016
Sacramento Caltrans District 3
US 50 State Route 99
(Oak Park Interchange) interchange improvements including buscarpool lane
connectors $0 $150000 $150000 2014
Sacramento Caltrans District 3
US 50 interstate 5
(Riverfront Interchange) Riverfront Interchange
improvements including bus carpool lane connectors
$30000 $170000 $200000 2016
ED Caltrans District 3 US 50 Camino
Operational Safety improvements Construct an
undercrossing median barrier modify local road connections andor associated operational improvements on and adjacent
to US 50
$15000 $0 $15000 2012
ED ED County DOT US 50
west of Latrobe Road
west of Bass Lake
grade HOV Lanes (Ph1) $47141 $0 $47141 2010
ED Caltrans District 3 US 50
west of Bass Lake Road
Ponderosa Road
HOV Lanes (Ph2) $55000 $0 $55000 2011
ED Caltrans District 3 US 50 Ponderosa
Road greenstone
Road HOV Lanes (Ph3) $22357 $0 $22357 2013
ED ED County DOT US 50 Future Silva
Valley iC
Future Empire Ranch IC
Mainline Widening construct new WB lane within the
median from proposed Silva Valley IC to proposed Empire
Ranch IC
$2950 $0 $2950 2013
[ 40 ] HigHway 50 corridor system management plan
c h a p t e r s i x p l a n n e d c o r r i d o r s y s t e m m a n a g e m e n t s t r a t e g i e s
tabLe 11 KeY CaPitaL ProjeCtS (ConTInued)
CountyLead agency
route roadway from to Project
Description Programmed
funds
additional funding Needed
total Cost estimate (x $1000)
Comp Year (FFY)
PARALLEL AnD COnnECTInG ROADWAYS
ED ED County DOT
Silva Valley Parkway
Entrada Drive
Future US 50
Silva Valley Parkway iC
Widen Silva Valley Road from 2 lanes to 4 lanes includes
Class ii bike lanes and left turn storage pockets
$2921 $0 $2921 2010
ED ED County DOT
Silva Valley Parkway US 50
US50 Silva Valley Parkway (Phase 2) Includes constructshying overcrossing and ramps
signalization at EB and WB on off ramps
$57817 $0 $57817 2016
ED ED County DOT
Headington Road
Missouri Flat Road
El Dorado Road
Extend 2 lanes with median $9878 $0 $9878 2012
ED ED County DOT
Durock Road
Robin Lane South
Shingle Road
Extend 2 lanes with median $1239 $9214 $10453 2015
ED ED County DOT
Durock Road
Business Center Drive intersection signalization
includes adding turn pockets on Durock Road
$4333 $0 $4333 2009
ED City of Placerville
Point View Drive Broadway Smith Flat
Road Extend 2 lanes $1300 $0 $1300 2020
ED City of Placerville
western Placerville
US 50 interchange
Forni Road Ray Lawyer
Drive
Placerville Drive
Interchange Reconstruction convert Ray Lawyer Dr
Overcrossing to full IC Auxiliary Lanes
$5059 $34741 $39800 2020
Sacramento City of Rancho
Cordova
Mather Boulevard
Rockingham Road
Zinfandel Drive widen to 4 lanes $0 $8617 $8617 2020
Sacramento Rancho Cordova
Parkway ii
Grant Line Road
White Rock Road
New 6-lane expressway includshying intersection improvements at Kiefer Blvd amp White Rock
Road
$0 $44518 $44518 2020
Sacramento City of Folsom
Scott Road US 50 White Rock Rd
widen from 2 to 6 lanes $16000 $0 $16000 2020
Sacramento Sacramento County DOT
White Rock Road
Grant Line Rd
Prairie City Rd
Widen from 2 to 4 lanes realign near Nike and Nimbus Roads and connect with existshying alignment west of Prairie City Rd Realign Grant Line Rd to intersect with realigned
White Rock Rd
$26600 $0 $26600 2020
Sacramento Sacramento County DOT
Hazel avenue
US 50 Hazel Madison
Widen American River Bridge and approaches from 4 to 6 lanes Widen Hazel Avenue from AR Bridge to Madison from 4 to 6 lanes with Bike
LanesSignals
$83530 $0 $83530 2020
HigHway 50 corridor system management plan [ 41 ]
c h a p t e r s i x p l a n n e d c o r r i d o r s y s t e m m a n a g e m e n t s t r a t e g i e s
tabLe 11 KeY CaPitaL ProjeCtS (ConTInued)
CountyLead agency
route roadway from to Project
Description Programmed
funds
additional funding Needed
total Cost Estimate (x $1000)
Comp Year (FFY)
PARALLEL AnD COnnECTInG ROADWAYS
ED ED County DOT
green Valley Road
Salmon Falls Road
east
Deer Valley Road
widen from 2 to 4 lanes $0 $14576 $14576 2025
ED ED County DOT
green Valley Road
Deer Valley Road east Lotus Road widen $958 $4513 $5471 2015
ED ED County DOT
green Valley Road
Francisco Drive
Salmon Falls Road
widen from 2 to 4 lanes divided $412 $3491 $3903 2015
ED ED County DOT
Latrobe Road
investment Boulevard
golden Foothill Parkway
widen from 2 lanes undivided to 4 lanes
divided $1076 $8792 $9868 2015
ED ED County DOT
Latrobe Road
Carson Creek
White Rock Road
widen from 4 to 6 lanes $0 $23755 $23755 2025
ED ED County DOT
white Rock Road
EDSac County Line
Manchester Drive
widen 2 to 4 lanes divided includes signal interconnect and coorshy
dination
$0 $23755 $23755 2025
Sacramento City of Rancho
Cordova
Easton Valley
Parkway
Prairie City Road
Empire Ranch Road extenshysion south of
US 50
Construct new 4 lane road $0 $45000 $45000 2020
Sacramento Sacramento County DOT
Hazel avenue
Easton Valley
Parkway
Grant Line RoadWhite Rock Road
New road extension 4 lane limited access
through aerojet property $0 $18000 $18000 2018
Sacramento Sacramento County DOT
white Rock Road
Prairie City Road
ED County Line
widen to 4 lanes $8330 $64773 $73103 2018
Sacramento Sacramento County DOT
green Valley Road
East Natoma Sacramento ED County
line widen to 4 lanes $0 $3000 $3000 2018
Sacramento City of Rancho
Cordova
Zinfandel Drive
international Drive
Folsom Boulevard
widen to 4 lanes $0 $12000 $12000 2020
[ 42 ] HigHway 50 corridor system management plan
c h a p t e r s i x p l a n n e d c o r r i d o r s y s t e m m a n a g e m e n t s t r a t e g i e s
tabLe 11 KeY CaPitaL ProjeCtS (ConTInued)
CountyLead agency
route roadway from to Project
Description
Pro-grammed
funds
addi-tional
funding Needed
total Cost estimate (x $1000)
Comp Year (FFY)
traNSit
yolo amp Sacramento City of west Sacramento
amp City of Sacramento
Sacramento River
Crossing
15th Street in the City
of west Sacramento
Broadway in the City of
Sacramento
New all-modal river crossing (Auto Transit Bike amp Pedestrian)
from Sacramento across the Sacramento River to West
Sacramento The crossing was modeled between Broadway in Sacramento amp 15th Street in
West Sacramento but final alignshyment options will be studied in subsequent planning efforts
$800 $99200 $100000 2019
Sacramento Cal State University
Sacramento
CSUS Campus mdash mdash
Sac State Tram adjoining City streets and SRTD 65th Street light railbus transfer station Bus Rapid Transit System
$23574 $0 $23574 2013
Sacramento City of Rancho
Cordova
Rancho Cordova Various Various
New Service Rancho Cordova Pilot Transit Shuttle System new transit service for connection to
RTs Gold Line
$2380 $1500 $38880 2014
yolo amp Sacramento City of west Sacramento
TBD west
Sacramento Sacramento Streetcar Service between west
Sacramento and Downtown Sacramento
$17400 $54700 $72100 2014
Sacramento City of Rancho
Cordova RT Gold Line
RT Gold Line Tracks
Mather Field Road
Light Rail Grade Separations $0 $52888 $52888 2025
Sacramento City of Rancho
Cordova RT Gold Line
RT Gold Line Tracks Zinfandel Drive Light Rail Grade Separations $0 $52888 $52888 2025
Sacramento City of Rancho
Cordova RT Gold Line
RT Gold Line Tracks
Bradshaw Road
Light Rail Grade Separations $0 $35260 $35260 2025
Sacramento City of Rancho
Cordova RT Gold Line
RT Gold Line Tracks Routier Road Light Rail Grade Separations $0 $35260 $35260 2025
Sacramento City of
Sacramento Sacramento Valley Station
Sacramento intermodal Transportation Facility (Phase 1) - Develop intermodal transportashytion terminal for heavy rail light
rail and bus service
$77799 $0 $77799 2010
Sacramento City of
Sacramento Sacramento Valley Station
Sacramento intermodal Transportation Facility (Phase 2) - Develop intermodal transportashytion terminal for heavy rail light
rail and bus service
$24101 $1000 $25101 2014
HigHway 50 corridor system management plan [ 43 ]
c h a p t e r s i x p l a n n e d c o r r i d o r s y s t e m m a n a g e m e n t s t r a t e g i e s
TABLE 11 KEY CAPITAL PROJECTS (CONTINUED)
CountyLead Agency
Route Roadway From To Project
Description Programmed
Funds
Additional Funding Needed
Total Cost Es-timate (x $1000)
Comp Year (FFY)
BICYCLE ROUTES
Sacramento City of Rancho
Cordova
US 50Mather Field Road IC US 50 Mather
Field Road
US 50Mather Field Road PedestrianBike Crossing along
the Mather Airport RR Spur alignment
$0 $820 $1055 2015
ED ED County DOT
Sacramento Placerville
Transportation Corridor
Forni Rd
Missouri Flat Rd Class I Bike Trail $1423 $111 $1534 2009
ED City of Placerville
El Dorado Trail Western
Extension
Canal Street Main Street
Ray Lawyer DriveForni
Road Class 1 Bike Trail $1850 $0 $1850 2010
ED ED County DOT
US 50ED Hills Blvd IC US 50
El Dorado Hills Blvd
Latrobe Road
US 50El Dorado Hills Blvd Pedestrian Overcrossing $5508 $66 $5574 2014
TABLE 12 50 MOBILITY PARTNERSHIP KEY CAPITAL PROJECTS
RouteRoadway From To Project Description
NEAR TERM PRIORITY IMPROVEMENT PROJECTS
US 50 Sunrise Scott Road Auxiliary Lane
US 50 Hazel Avenue Interchange Improvements
Hazel Avenue Folsom Boulevard Easton Valley Parkway New 4 Lane Road
Easton Valley Parkway Hazel Avenue Rancho Cordova Parkway New 6 Lane Road
Rancho Cordova Parkway Easton Valley Parkway White Rock Road New 4 Lane Road
White Rock Road Sunrise Boulevard Silva Valley Parkway Widen to 4 Lanes
RT Gold Line Hazel Iron Point Station Passing Tracks
US 50 Rancho Cordova Parkway New Interchange
Zinfandel Drive South of International Douglas Road New 4 Lane Road
International Drive Kilgore Road Rancho Cordova Parkway New 6 Lane Road
Douglas Road Zinfandel Extension Sunrise Boulevard Widen to 4 Lanes
Sunrise LRT Citrus Road Sunrise Mall Bus Rapid TransitExpress Bus
[ 44 ] HIGHWAY 50 corridor system management plan
c h a p t e r s i x p l a n n e d c o r r i d o r s y s t e m m a n a g e m e n t s t r a t e g i e s
TABLE 12 50 mOBILITY PARTnERSHIP kEY CAPITAL PROjECTS (COnTInUED)
routeroadway from to Project Description
US 50 nEAR TERm PRIORITY ImPROVEmEnT PROjECTS
US 50 Empire Ranch Road New interchange
US 50 Silva Valley New interchange
US 50 Scott Road Empire Ranch Road Aux Lanes
US 50 Empire Ranch Road El Dorado Hills Boulevard Aux lanes and climbing lanes
US 50 El Dorado Hills Boulevard Silva Valley Parkway Aux lanes and climbing lanes
US 50 Silva Valley Parkway Bass Lake Road Aux lanes
Sunrise Boulevard White Rock Road Douglas Boulevard widen to 6 lanes
Sunrise Boulevard Douglas Boulevard Jackson Road widen to 4 lanes
White Rock Road Sunrise Boulevard Future Rancho Cordova Parkway and El Dorado County Line to Latrobe Road
widen to 4 lanes
Douglas Boulevard Sunrise Boulevard Grant Line Road widen to 4 lanes
Rancho Cordova Parkway Douglas Boulevard Rio del Oro Parkway New 2 lane road
Rancho Cordova Parkway Rio del Oro Parkway White Rock Road New 6 lane road
Jaeger Road Douglas Road Kiefer Boulevard New 4 lane road
Chrysanthy Sunrise Boulevard Americanos Boulevard New 4 lane road
Kiefer Boulevard Sunrise Boulevard Jaeger Road New 4 lane road
Grant Line Road Douglas Road Chrysanthy Road widen to 4 lanes
Hazel avenue Gold Country Boulevard Madison avenue widen to 6 lanes
Latrobe Road South of White Rock Road widen to 4 lanes
TABLE 13 VISIOnARY PROjECTS
County routeroadway from to Project Description
Sac yolo US 50 Enterprise Downtown Sacramento HOV Lanes
ED TBD Folsom Placerville Transit ndash Type TBD
ED New Road Latrobe Road White Rock Road (poten shy
tially US 50) New 2-lane road
HigHway 50 corridor system management plan [ 45 ]
c h a p t e r s i x p l a n n e d c o r r i d o r s y s t e m m a n a g e m e n t s t r a t e g i e s
[ 46 ] HigHway 50 corridor system management plan
Page Inte
ntionally
Left
Blank
congestion and bottleneck analysis
chapter seven
The 2000 Highway Capacity Manual defines a bottleneck
as ldquoa road element on which demand exceeds capacityrdquo
The bottleneck analysis evaluates specific causes of existshying recurrent traffic congestion in the corridor Freeway bottleneck locations that create mobility constraints are identified and documented and their relative contribution
to corridor-wide congestion is reported The bottleneck locations were determined based on a combination of the use of 2006 PeMS data HiCOMP report probe vehicle tach runs and field observations
Traffic congestion can be categorized as either recurrent
or non-recurrent
recurrent congestion occurs repeatedly at the same place and time of day in a predictable pattern Recurrent congesshytion is often associated with facility capacity limitations changes in capacity conflicting vehicle movements such
as lane merges inadequate number of transit vehicles to handle passenger loads or other persistent physical condishytions of the transportation facility
Non-recurrent congestion is usually attributed to collishysions equipment malfunction community events weather construction projects and other occasional occurrences When transportation systems are close to their maximum
carrying capacity non-recurrent congestion is more likely to occur as there is little excess capacity in the system
The location and extent of the bottlenecks on US 50 found
in the aM and PM peak periods are summarized in Tables 14 and 15 These depictions should be considered a snapshyshot view and not a comprehensive analysis of all bottleshynecks in the corridor Further work is being conducted to
refine the identification and causality of bottlenecks within
the corridor Table 14 shows a summary of the US 50 eastbound bottlenecks while the tables that follow discuss each bottleneck including location and possible causality Table 15 shows a summary of the US 50 westbound bottleshynecks while the tables that follow discuss each bottleneck including location and possible causality Minor or hidden bottlenecks are those Freeway bottleneck
that are not as defined locations that create (or severe) as the major mobility constraints bottlenecks Please note are identified and that the graphics accomshy documented and their panying the bottlenecks
relative contribution to are not to scale
corridor-wide congestion Major bottlenecks in the is reported eastbound direction during the aM peak period are at Howe avenue and during the PM peak period are at 48th Street Howe Avenue Mayhew Road Routier Road Sunrise Boulevard and El Dorado Hills Boulevard Major bottlenecks in the westbound direction during the aM peak period are at El Dorado Hills Boulevard Hazel Avenue Zinfandel Drive
HigHway 50 corridor system management plan [ 47 ]
c h a p t e r s e v e n c o n g e s t i o n a n d b o t t l e n e c k a n a l y s i s
Bradshaw Road and Howe Avenue and major bottleneck
locations during the PM peak period are at Zinfandel Drive Routier Road Bradshaw Road Howe Avenue and Intershystate 5
Causalities for these bottlenecks range from high-traffic
demand (congestion) heavy weavingmerging areas or physical constraints such as lane drops lack of ramp meters incomplete HOV network incomplete Auxiliary Lane
network poorly coordinated traffic signals and an off-ramp
queue (Sunrise Boulevard) US 50 Westbound Onramp
TABLE 14 US 50 EASTBOUnD BOTTLEnECk SUmmARY Source PeMS Caltrans tach runs and
Cambridge Systematics field observations
bottleneck Location PeMS Speed Contours Caltrans Probe Vehicle Runs
Cause aM PM aM PM
A Jefferson Blvd PM 25 Minor Minor Traffic weaving truck volumes and grade
B 48th St PM 7 Minor Major Minor Minor Merge from SR 51 and SR 99
C Howe ave PM 9 Major Major Major weave between Howe and watt
D Mayhew Rd PM 12 Major Minor Major Weaving before Bradshaw Exit
E Routier Rd PM 14 Minor Major Weaving before Mather Field Rd Exit
F Sunrise Blvd PM 185 Minor Major Lane drop HOV add off-ramp queue
G Folsom Blvd PM 22 Minor Minor Lane drop 4 to 3
H El Dorado Hills Blvd PM 275 Major
Poorly coordinated traffic signal on arterial causes spillback onto freeway
a jefferson blvd bottleneck The bottleneck approximately located at Jefferson Blvd is due to weaving traffic as those entershying the freeway from Jefferson Blvd must cross those attempting to exit the freeway to I 5 There is a large number of trucks in the stream which struggle with the grade at this location exacerbatshying the bottleneck
[ 48 ] HigHway 50 corridor system management plan
c h a p t e r s e v e n c o n g e s t i o n a n d b o t t l e n e c k a n a l y s i s
b 48th St bottleneck The bottleneck approximately located at 48th St is due to the additional traffic merging from SR 51 and SR 99 combined with the eventual lane drop at 59th St This queue extends upstream past the off-ramp to SR 5199 These off-ramps are bottlenecks in themselves which spill back and choke the US 50 mainline
C Howe Ave Bottleneck The bottleneck at Howe ave is due to the entering traffic from Howe Ave Two Howe Ave on-ramps feed into US 50 eastbound southbound Howe ave loop on-ramp and northbound Howe ave direct ramp approximately 300 feet apart The watt avenue off-ramp is just down stream with heavy exiting volumes therefore the segment between Howe and watt is characterized by heavy weaving
D mayhew Rd Bottleneck The bottleneck approximately located at Mayhew Rd most likely begins with the additional traffic entering from Watt Ave and ends with the exiting traffic at Bradshaw Rd It is possible that there is a high proportion of weaving traffic with in this section (Watt Ave traffic moving to the left lane and those exiting at Bradshaw Rd moving to the right lane)
HigHway 50 corridor system management plan [ 49 ]
c h a p t e r s e v e n c o n g e s t i o n a n d b o t t l e n e c k a n a l y s i s
[ 50 ] HigHway 50 corridor system management plan
e routier rd bottleneck It is likely that the bottleneck at Routier Rd is due to the same merging conditions associated with Mayhew Rd The area is comprised of both residential and light industrialoffice land uses therefore during the PM peak period there are large volumes of vehicles entering at Bradshaw Rd moving to the left lanes and large volumes of vehicles moving to the right lane to exit at Mather Field Rd
f Sunrise blvd bottleneck At Sunrise Blvd the right-most lane exits while an HOV lane is added as the median lane The bottleneck is formed from vehicles shifting left to avoid exiting at Sunrise Blvd and to enter the HOV lane There is a large volume of vehicles queued at the Sunrise off-ramp which spills back and negatively affects the US 50 mainline
g folsom blvd bottleneck The right-most lane exits to Folsom Blvd leaving one HOV lane and two regular lanes along the US 50 The bottleneck is caused by this lane drop as well as the quick merge at the Folsom on-ramp
c h a p t e r s e v e n c o n g e s t i o n a n d b o t t l e n e c k a n a l y s i s
H The eastbound US 50 at El Dorado Hills Blvd Bottleneck The eastbound El Dorado Hills Blvd bottleneck is caused by a traffic signal on the arterial that often causes spillbacks on the EB loop offramp onto the freeway mainlines
TABLE 15 US 50 WESTBOUnD BOTTLEnECk SUmmARY Source PeMS Caltrans tach runs and Cambridge Systematics field observations
bottleneck Location PeMS Speed Contours Caltrans Probe Vehicle Runs
Cause aM PM aM PM
A El Dorado Hills Blvd PM 275 Major Poorly coordinated traffic
signal on El Dorado Hills Blvd
B Hazel Ave PM 21 Major Entering traffic
C Zinfandel Dr PM 16 Minor Major Major Major Entering traffic
D Routier Rd PM 14 Minor Major Minor Weaving traffic
E Bradshaw PM 13 Major Major Major Merging traffic and curve
F Howe Ave PM 9 Minor Major Major Major Weaving traffic and grade
G SR 51SR 99 PM 6 Minor Lane drop weaving traffic
H i-5 PM 3 Major Weaving traffic
HigHway 50 corridor system management plan [ 51 ]
c h a p t e r s e v e n c o n g e s t i o n a n d b o t t l e n e c k a n a l y s i s
[ 52 ] HigHway 50 corridor system management plan
A El Dorado Hills Blvd Bottleneck The minor bottleneck at El Dorado Hills Boulevard is caused by the traffic signal on El Dorado Hills Blvd that causes spillback on the westbound offramp onto the freeway mainlines
B Hazel Avenue Bottleneck In 2006 the Hazel Ave Bottleneck is caused by the traffic entering at both Hazel Ave and Folsom Blvd (the two on-ramps are separated by about one mile) The bottleneck that would appear at Folsom Blvd combines with the bottleneck at Hazel ave to form a large bottleneck that does not clear until after Hazel ave Sometimes causshying spillbacks as far as Prairies City Road this bottleneck was mitigated in 2007 as part of the GO CALIFORNIA program
C Zinfandel Dr Bottleneck There is heavy traffic coming from Sunrise Blvd but the lane addition immediately after the westbound on-ramp prevents a bottleneck from forming but as traffic flows westward the heavy traffic entering from Zinfandel Dr causes a bottleshyneck here
D Routier Rd Bottleneck The bottleneck at Routier Rd is caused by weaving traffic between Mather Field Rd and Bradshaw Rd This highway segment represents a transition area where vehicles that have been traveling in the left lanes begin to shift to the right lanes to exit while the entering traffic tries to shift to the left lanes
W eav in gLan e Dr o p
c h a p t e r s e v e n c o n g e s t i o n a n d b o t t l e n e c k a n a l y s i s
e bradshaw rd bottleneck The Bradshaw Rd bottleneck is caused by the entering traffic from Bradshaw Road the high truck volumes and the curve west of Bradshaw Two Bradshaw Rd on-ramps feed into US 50 westshybound southbound Bradshaw Rd direct on-ramp and northbound Bradshaw Rd loop on-ramp approximately 400 feet apart
F Howe Ave Bottleneck The Howe ave bottleneck is caused by a grade change and the weaving traffic entering from Howe ave and Hornet Dr competing for the right-most lane with those wanting to exit at 65th Street
G amp H SR 51SR 99 amp I-5 Bottleneck The bottleneck at I 5 is caused by the conflict between entering SR 99 and SR 51 traffic and exiting I-5 traffic as well as the queues formed on the ramps to i-5 which spill back onto US 50 The number of lanes in this section reaches a maximum of 6 and then drops to 4 as two lanes exit at the I-5 freeway This bottleneck is exacershybated during the peak periods when it stretches upstream to the lane drop before SR 99
W ea v in g
Lan e Dr o p
HigHway 50 corridor system management plan [ 53 ]

mdash
c h a p t e r f i v e p e r f o r m a n c e m e a s u r e s
HigHway 50 corridor system management plan [ 27 ]
TABLE 5 PERFORmAnCE mEASURES DEFInITIOnS AnD APPLICABILITY (ConTInued)
Performance Measure Definition of Performance measure applicability to Corridor
PARALLEL AnD COnnECTInG ROADWAYS
LOS A ldquoreport cardrdquo measurement with ldquoArdquo being the least amount of
congestion and ldquoFrdquo being the most congestion LOS is a relatively simple and often used measure which
offers comparison opportunities
traNSit
available Capacity Ratio () of available transit capacity alternatives within the corridor
This measure indicates the available capacity to accommoshydate diverted travelers from single occupant vehicles
c h a p t e r f i v e p e r f o r m a n c e m e a s u r e s
[ 28 ] HigHway 50 corridor system management plan
Page Inte
ntionally
Left
Blank
c h a p t e r f i v e p e r f o r m a n c e m e a s u r e s
Table 6 US 50 PerForManCe MeaSUreS
County location Post Miles
distance (Miles)
average annual daily Traffic1
PerForManCe MeaSUreS
loS1
Total Vehicle Hours of delay2
Total Person Minutes of delay2
Minutes of delay per Vehicle2
Minutes of delay per Person2
Vehicle Travel Time (Minutes)2 distressed
Pavement (lane
Miles)4
reported Col-lision rate
Comparison ()5
reliability6 lost Productivity7
daily Peak Hour3 daily Peak
Hour3 Peak Hour3 Peak Hour3 Peak Hour3 eastbound westbound lost lane Miles aM
Peak Period
lost lane Miles PM
Peak Period
STaTe HigHway SySTeM
yOL interstate 80 to yolo Sacramento County Line
000 to 316 316 180000 F 1169 126 95363 8061 049 046 36 9 26 62 22 01 0
SaC
yoloSacramento County Line to State Routes 99
and 51
L000 to L248 R000
248 253000 F 4993 653 407455 41746 186 175 43 7 20 64 60 53 76
State Routes 99 and 51 to watt avenue
R000 to R534 534 225000 F 10097 1362 823883 87105 397 372 93 15 24 60 48 81 68
watt avenue to Zinfandel Drive
R534 to R1092 558 187000 F 8075 977 658886 62506 351 329 91 19 -32 56 42 44 23
Zinfandel Drive to Sunrise Boulevard
R1092 to 1250 158 149000 E 1271 197 103727 12610 088 082 25 9 -33 46 13 0 16
Sunrise Boulevard to Folsom Boulevard
1250 to 1701 451 125000 E 3087 356 251940 25832 180 149 63 5 -14 60 46 1 45
Folsom Boulevard to SacramentoEl Dorado
County Line
1701 to 2314 613 95000 D 583 122 47537 8867 083 069 70 0 -11 19 55 0 08
ED
SacramentoEl Dorado County Line to Cameron
Park Dr
000 to R657 657 70000 E 504 126 41150 9138 110 091 77 1 -35 PeMS Data
Unavailable PeMS Data Unavailable
PeMS Data Unavailable
PeMS Data Unavailable
Cameron Park Drive to Missouri Flat Road
R657 to R1506 849 62000 E 302 75 24633 4827 079 075 93 2 -61 PeMS Data
Unavailable PeMS Data Unavailable
PeMS Data Unavailable
PeMS Data Unavailable
Missouri Flat Road to End of Freeway in Placerville
R1506 to 1725 219 59000 D 66 16 5376 1053 020 019 24 1 20 PeMS Data
Unavailable PeMS Data Unavailable
PeMS Data Unavailable
PeMS Data Unavailable
End of Freeway in Placerville to Bedford avenue
1725 to 1811 086 52000 D 68 17 5585 1094 021 020 15 2 81 PeMS Data
Unavailable PeMS Data Unavailable
PeMS Data Unavailable
PeMS Data Unavailable
Bedford avenue to Cedar grove Road
1811 to R2595 784 38500 D 58 15 4758 932 023 022 85 10 6 PeMS Data
Unavailable PeMS Data Unavailable
PeMS Data Unavailable
PeMS Data Unavailable
TOTaL mdash 5473 mdash mdash 30273 4042 2470293 263771 1587 1449 7150 80 mdash mdash mdash mdash mdash
1 Source Average Annual Daily Traffic and Level of Service (LOS) calculated is based on 2007 Caltrans Traffic Volumes on California State Highways and Highway Capacity Manual and Cambridge Systematics from 2008 Reported LOS is for the typical most congested daily peak travel period 2 Source Delay is the average additional travel time by vehiclespersons traveling under 60 mph Data derived from 2007 HICOMP report SACMET Travel Demand Model PeMSs traffic data and Caltrans District 3 Traffic Operations Probe vehicle Tach runs 3 Peak Hour is during PM 4 Source 2007 Caltrans Division of Maintenance Pavement Summary Report 5 Source 2004 through 2007 Caltrans Traffic Accident Surveillance and Analysis System summary data of the percentage above or below the statewide average for fatal injury and property damage-only collisions on comparable facilities 6 Reliability The Planning Time Index is a measure of the reliability of the travel time on a particular route It is the ratio of the 95th percentile of travel time on a route to the median free-flow travel time This means itrsquos the amount of time a traveler needs to allocate for a route if they want to show up on time 19 out of 20 trips Reliability and Planning Time data was taken from April 2007 The data covered a 24-hour period of time on each Tuesday wednesday and Thursday of that month That data was then aggregated into a single average 24-hour day it was then analyzed to determine the highest average aM and PM travel time That time was then compared to the best possible average travel time to determine the additional time that was spent traveling the same seg-ment 7 Lost Productivity Data taken April 2007 PeMS As traffic increases to the capacity of the highway speeds decline throughput drops dramatically and the efficiency of the highway to provide mobility decreases This decline in the potential carrying-capacity of the freeway is expressed in terms of how many equivalent lane miles of roadway are lost
HigHway 50 corridor system management plans [ 29 ]
c h a p t e r f i v e p e r f o r m a n c e m e a s u r e s
Table 7 Parallel and ConneCTing roadwayS PerForManCe MeaSUreS
County location average
daily Traffic1
PerForManCe MeaSUreS
loS1
Total Vehicle Hours of delay2
Total Person Minutes of delay2
Minutes of delay per Vehicle2
Minutes of delay per Person2
Vehicle Travel Time (Minutes)2
distressed Pavement
(lane Miles)4
daily Peak Hour3 daily Peak
Hour3 Peak Hour3 Peak Hour3 Peak Hour3
Parallel and ConneCTing roadwayS
yOL west Capitol Enterprise Boulevard to Capitol Mall 13737 No Data
Data is unavailable for these performance measures at this time however will be pursued in the next phase of the CSMP
SaC
w 5th Street to 26th Street 9194 a
X 5th Street to 26th Street 9154 a
Folsom Boulevard watt avenue to Bradshaw Road 25600 C
watt avenue Folsom Boulevard to US 50 63900 F
Bradshaw Road Folsom Boulevard to US 50 22400 a
Folsom Boulevard Bradshaw Road to Sunrise Boulevard 20400 a
Bradshaw Road Old Placerville to US 50 54405 F
Old Placerville Road Bradshaw Road to Rockingham Drive 11864ndash18365 a
Rockingham Drive Old Placerville Road to Mather Boulevard 16516 E
Mather Boulevard Rockingham Drive to Folsom Boulevard 21732 C
international Drive Rockingham Drive to Zinfandel Drive 12808 a
Zinfandel Drive international Drive to Folsom Boulevard 22298ndash47032 BE
white Rock Road Zinfandel Drive to Sunrise Boulevard 25459 a
Sunrise Boulevard US 50 to Folsom Boulevard No Data No Data
white Rock Road Sunrise Boulevard to Prairie City Road 3400 B
Folsom Boulevard Sunrise Boulevard to iron Point Road 17200 a
white Rock Road grant Line Road to EDSaC County Line 6700 D
iron Point Road Folsom Boulevard to East BidwellScott Road 13984 No Data
Scott Road iron Point Road to white Rock Road No Data No Data
Folsom Boulevard iron Point Road to Blue Ravine Road No Data No Data
Blue Ravine Road Folsom Boulevard to green Valley Road No Data No Data
Prairie City Road US 50 to white Rock Road 6000 D
HigHway 50 corridor system management plans [ 30 ]
c h a p t e r f i v e p e r f o r m a n c e m e a s u r e s
Table 7 Parallel and ConneCTing roadwayS PerForManCe MeaSUreS (ConTinUed)
County location average
daily Traffic1
PerForManCe MeaSUreS
loS1
Total Vehicle Hours of delay2
Total Person Minutes of delay2
Minutes of delay per Vehicle2
Minutes of delay per Person2
Vehicle Travel Time (Minutes)2
distressed Pavement
(lane Miles)4
daily Peak Hour3 daily Peak
Hour3 Peak Hour3 Peak Hour3 Peak Hour3
Parallel and ConneCTing roadwayS
ED
green Valley Road EDSaC County Line to Francisco Drive 22600 D
Data is unavailable for these performance measures at this time however will be pursued in the next phase of the CSMP
green Valley Road Francisco Drive to Silva Valley Parkway 13077 D
green Valley Road Silva Valley Parkway to Cameron Park 9849 C
green Valley Road Cameron Park Drive to Deer Valley Road 5278 C
green Valley Road Deer Valley Road (East) to Lotus Road 8381 D
green Valley Road Lotus Road to Placerville Drive 4669 C
Latrobe Road white Rock Road to US 50 24742 C
Durock Road Cameron Park Dr to South Shingle Road 7278 C
Cameron Park Drive Durock Road to US 50 (Durock Road to Coach Lane Coach Lane to US 50) 9544 26603 CD
South Shingle Road Durock Road to US 50 11390 D
white Rock Road EDSaC County Line to Latrobe 12808 D
white Rock Road Latrobe Rd to Silva Valley Pkwy (Latrobe to PostPost to Silva Vlly Pkwy) 10124 CD
Silva Valley Parkway white Rock Rd to Serrano Pkwy (white Rock to Entrada Entrada to Serrano Pkwy) 13708 9328 DC
Forni Road Placerville Drive to Main Street 9049 8379 No Data
Placerville Drive Forni Road to US 50 No Data No Data
Main Street Placerville Drive to Bedford avenue No Data No Data
Main Street Bedford avenue to Broadway No Data No Data
Broadway Main Street to Point View Drive No Data No Data
1 Source Average Daily Traffic and Level of Service (LOS) calculated are based on City of Sacramento between 2001 and 2007 Sacramento County from 20072008 City of Rancho Cordova between 2004 and 2007 and El Dorado County from 2007
HigHway 50 corridor system management plans [ 31 ]
c h a p t e r f i v e p e r f o r m a n c e m e a s u r e s
Page Inte
ntionally
Left
Blank
[ 32 ] HigHway 50 corridor system management plan
c h a p t e r f i v e p e r f o r m a n c e m e a s u r e s
tabLe 8 traNSit PerforMaNCe MeaSure
County transit Provider route Performance Measure
available daily Capacity ()1 available Peak Hour Capacity1
traNSit
SaC
SacRT (Bus)
Route 21 70 10
Route 28 76 59
Route 36 83 74
Route 38 66 44
Route 72 56 20
Route 73 79 45
Route 74 82 43
Route 109 47 22
SacRT (Light Rail) Gold Line 31 Exceeds Capacity
EDSAC ED County Transit Authority
Commuter Express Bus Service Not applicablendashOperates Peak Hour
Only 405
iron Point Connector 764 Not available
Reverse Commuter Not applicablendashOperates Peak Hour Only 982
yoloSaC yolo County Transit District Not applicablendashOperates Peak Hour Only 498
biKe3
1 Source average Daily and Peak Hour available Capacity calculated from each transit providerrsquos route ridership data 2 The Reverse Commuter service is offered on vehicles that are returning to El Dorado County (Commuter Express Buses) 3 Bicycle performance measure(s) will be identified applied and included in the subsequent CSMPs
HigHway 50 corridor system management plan [ 33 ]
c h a p t e r f i v e p e r f o r m a n c e m e a s u r e s
[ 34 ] HigHway 50 corridor system management plan
Page Inte
ntionally
Left
Blank
planned corridor system management strategies
chapter six
ConCept LoS and ConCept FaCiLit y ldquoConcept LOSrdquo and ldquoConcept Facilityrdquo have traditionally been used in Caltrans TCCRs to reflect the minimum level or quality of operations acceptable for each route segment within the 20-year planning period and the highway facility needed in the next 20 years to maintain the Concept LOS
Typical Concept LOS standards in Caltrans District 3 are LOS ldquoDrdquo in rural areas and LOS ldquoErdquo in urban areas how-ever some heavily congested route segments now have a Concept LOS ldquoFrdquo because the improvements required to bring the LOS to ldquoErdquo are not feasible due to environmental right of way financial and other constraints The applica-tion of multi-modal corridor management strategies should reduce the severity and duration of congestion and provide viable travel options and information that will enable a traveler to avoid severe freeway congestion
The Concept LOS and Concept Facility for US 50 are shown in Table 9 almost all US 50 segments are forecasted to operate under LOS ldquoFrdquo conditions in 20 years under the No-Build and Build scenarios
Corridor ManageMent StrategieS The US 50 CSMP also proposes specific strategies to enhance corridor mobility (see Table 10) based on the fol-lowing principles
bull Manage all modes and facilities in the corridor as a single system beginning with the transportation net-work defined in this CSMP
bull Implement comprehensive and dynamic multimodal monitoring and reporting for the system and for all modes
bull Develop and use micro-simulation modeling to identify mobility challenges and to evaluate proposed solutions
bull Complete the projects included in the regional trans-portation plans with an emphasis on the completion of the key mobility improvement projects identified in this CSMP (see Tables 11 and 12)
bull Implement the specific strategies outlined in this CSMP
Key CapitaL projeCtS Tables 11 and 12 contain key capital projects that have been identified as the most critical to corridor mobility These are also included in the SaCOg MTP for 2035 and are either planned without any funding yet programmed are partially programmed
The US 50 CSMPor are entirely programmed SACOG conducted significant proposes specific
public attitude research strategies to enhance for the MTP for 2035 to corridor mobility complement comprehensive outreach efforts through community workshops the TALL Order Moving the Region Forward event the televised Town Hall Road Map for the Future and associated public polling The results of the SaCOg analyses and public out-reach for the MTP were
highway 50 corridor system management plan [ 35 ]
c h a p t e r s i x p l a n n e d c o r r i d o r s y s t e m m a n a g e m e n t s t r a t e g i e s
[ 36 ] HigHway 50 corridor system management plan
used when selecting the key projects for identification in
the CSMP and to ensure consistency Not all corridor projshyects in the MTP are included in the CSMP since the CSMP focuses on the managed network and the SaCOg MTP considers all streets and roads bike routes and transit services in the corridor
highway 50 partnership The Highway 50 Partnership is a cooperative public-private effort among the County of Sacramento City of Rancho
Cordova City of Folsom County of El Dorado and several major landowners that recognize the need to consider corrishydor mobility needs holistically
The Partnership has collaborated effectively to develop a Plan to improve mobility in the US 50 Corridor from Rancho
Cordova to El Dorado Hills an area identified as approprishyate for growth in the SACOG Blueprint Recognizing the
need to generate private investment the Partnership is seeking to implement a regional Highway 50 Corridor fee program to fund these projects
in addition to the key projects indicated in Table 11 Table 12 displays the key projects identified by the
Partnership
These projects include (1) Near-Term Priority Improvement Projects and (2) Near-Term Expected Roadway Improveshyments
The Near-term Priority improvement Projects would proshyvide several new roadway connections for people to travel within and through the area to avoid congestion They also include new transit routes and widening existing roadways
viewed by the Partnership as a package that would provide system-wide travel benefits These improvements targeted
for completion through 2012 would reduce vehicle hours of delay during commute hours by 30 percent
The near-Term Expected Roadway Improvements are conshysidered by the Partnership to be readily expected since they are tied to expected development or are part of a near-term
capital improvements program
Visionary projects Visionary projects are not yet included in the SaCOg MTP or EDCTC RTP but appear to offer considerable corridor mobilshyity benefits and merit further analysis and consideration for inclusion in the next MTP and RTP These are displayed in
Table 13
The ldquoPlus 10 Listrdquo in the SACOG MTP identifies projects
that are attractive from a performance standpoint but could not be included in the Final Project Lists because of financial constraint The ldquoPlus 10 Listrdquo element offers the
opportunity to include projects that would not be affordshyable without additional funding Some projects identified in
the Visionary Projects List were analyzed by SACOG during
development of the current MTP Some of these are included in the ldquoPlus 10 Listrdquo
Watt Avenue Light Rail Station Improvement Project
c h a p t e r s i x p l a n n e d c o r r i d o r s y s t e m m a n a g e m e n t s t r a t e g i e s
Table 9 US 50 ConCePT loS and FaCiliTy TyPe
location Forecasted level of Service1 (loS) and Facility Type
County description and location From Post Mile To Post Mile Current
loS1 20-year no build loS12
20-year build loS12
20-year Concept
loS13 existing Facility4 Concept Facility456 Ultimate Facility457
yOL interstate 80 to yoloSacramento County Line
000 316 F F F F 8F (6F between Jefferson Blvd ramps)
8F+2HOV+aux Lanes 8F+2HOV+aux Lanes
SaC yoloSacramento County Line to SR 99 and 51
L000 L248 = R000 F F F F 8F 8F+2HOV+aux Lanes 8F+2HOV+aux Lanes
SaC State Routes 99 and 51 to watt avenue R000 R534 F F F F 8F 8F+2HOV+aux Lanes 8F+2HOV+aux Lanes
SaC watt avenue to Zinfandel Drive R534 R1092 F F F F 8F 8F+2HOV+aux Lanes 8F+2HOV+aux Lanes
SaC Zinfandel Drive to Sunrise Boulevard R1092 1250 E F F F 8F 8F+2HOV+aux Lanes 8F+2HOV+aux Lanes
SaC Sunrise Boulevard to Folsom Boulevard 1250 1701 E F F F 6F+2HOV to Hazel ave 4F+2HOV
to Folsom Blvd
6F+2HOV+aux Lanes to Hazel ave 4F+2HOV+aux
Lanes to Folsom Blvd
8F+2HOV+aux Lanes
SaC Folsom Boulevard to SaCED County Line 1701 2314 D F F F 4F+2HOV 4F+2HOV+aux Lanes 6F+2HOV+aux Lanes
ED SacramentoEl Dorado County Line to Cameron Park Drive
000 R657 E F F F 4F 4F+2HOV+aux Lanes 6F+2HOV+aux Lanes
ED Cameron Park Drive to Missouri Flat Road R657 R1506 E F E E 4F 4F+2HOV+aux Lanes to greenstone 4F+aux Lanes
to Missouri Flat
6F+2HOV+aux Lanes to greenstone 4F+2HOV+aux Lanes
to Missouri Flat
ED Missouri Flat Road to End of Freeway in Placerville
R1506 1725 D F F F 4F 4F+aux Lanes 4F+aux Lanes
ED End of Freeway in Placerville to Bedford avenue
1725 1811 D E E E 4E 4E 4E
ED Bedford avenue to Cedar grove Exit 1811 R2595 D F F F 4F to Smith Flat 4E to Camino 4F+aux Lanes to Smith Flat 4E to Camino
4F+aux Lanes
1 Level of Service (LOS) A ldquoreport cardrdquo for evaluating traffic flow with ldquoArdquo being the best and ldquoFrdquo being the worst 2 20-year LOS (No Build) The LOS that would be expected at 20 years with no improvements 3 20-year Concept LOS The minimum acceptable LOS over the next 20 years 4 Facility Type Codes C=Conventional Highway E=Expressway F=Freeway HOV=High Occupancy Vehicle Lanes aux=auxiliary Lanes 5 Operational improvements are included in future facilities for all segments Examples of operational improvements include TOS improvements and auxiliary lanes 6 Concept Facility the future roadway with improvements needed in the next 20 years if LOS ldquoFrdquo no further degradation of service from existing ldquoFrdquo is acceptable as indicated by delay performance measurement 7 Ultimate Facility The future roadway with improvements needed beyond a 20 year timeframe
HigHway 50 corridor system management plans [ 37 ]
c h a p t e r f i v e p e r f o r m a n c e m e a s u r e s
Table 10 US 50 CSMP STraTegieS
Strategy description implementation Challenges
Maintain and operate the existing corridor multi-modal trans-
portation infrastructure
Maintain the existing investment in all modes of the transportation system and provide adequate resources for daily operations including operating
revenues for transit services
Funding availability funding competition within the region
Fully coordinate the delivery of transportation services and facili-ties in the corridor including daily operations and system planning
for enhancements
Interagency operational coordination to maximize the efficiency and effec-tiveness of all modes operating in the corridor with a focus on the CSMP transportation network defined in this CSMP Use of an existing group or
committee to provide initial oversight for this strategy
Diverse interests and competing priorities and limited resources
Construct planned and pro-grammed corridor capital improve-
ment projects
implementation of the capital improvements in the corridor included within the approved Metropolitan Transportation Plan and Regional Transportation
Plan for all transportation modes within the scope schedule and cost specified
Funding availability funding competition within the region
Comprehensive daily monitoring of the status of all modes providing service on the CSMP transporta-
tion network
Full deployment of multimodal transportation service status detection systems for all CSMP network components
Funding availability funding competition within region
Provide traveler information to the public
Provide the public with real-time easily accessible information regarding the status of all CSMP transportation system components so as to allow travel-
ers to make informed decisions about trip mode time and routing options
Funding availability funding competition within region
Continually monitor and analyze the CSMP transportation network to improve system performance
Monitor transportation performance measures and make system modifica-tions as appropriate on a frequent and timely basis Staff resources and data availability
Decrease the duration of non-recurrent traffic congestion
Expand and enhance the Freeway Service Patrol to respond to automobile accidents and vehicle break-downs
Funding availability funding competition within the region
Timely implementation of STaRNET
Expedite the implementation of the STaRNET operators of transportation facilities and emergency responders in the Sacramento region through real-time sharing of data and live video refinement of joint procedures
pertaining to the operation of roadways and public transit and public safety activities as well as enhance the regionrsquos 511 web site and interactive
telephone service to provide more traveler information
Developmental time acceptance by agencies and integration into daily use and identifica-
tion of maintenance and operations funding
Enhance transit and rail service increase transit service frequency provide express transit services imple-
ment bus rapid transit routes reduce headways for light rail and buses and construct planned light rail line extensions
Funding availability funding competition within the region
Complete Bus Carpool lane network
Complete the regional buscarpool lane network including freeway-to-freeway HOV lane connectors
Funding availability funding competition within the region Public agency and public
acceptance of network
[ 38 ] HigHway 50 corridor system management plan
c h a p t e r s i x p l a n n e d c o r r i d o r s y s t e m m a n a g e m e n t s t r a t e g i e s
tabLe 10 uS 50 CSMP StrategieS (ConTInued)
Strategy Description implementation Challenges
Enhance Transportation Demand Management strategies
Encourage employers to provide telecommuting and flexible working hour options to employees
acceptance by employers and resources to participate
Optimize the timing and synchronishyzation of traffic signals
Coordinate the optimization and timing of traffic signals on freeway ramps and along parallel and connecting roadways within and between jurisdicshytions to improve traffic flow and reduce congestion Provide signal priority
systems for transit vehicles
Funding availability and coordination among cities counties and Caltrans
improve access management of freeways and parallel connecting roadways
Develop and implement access management strategies to maintain the operational efficiency of freeways and parallelconnecting roadways
agreement between responsible jurisdicshytions as to where increased access control is needed increased access control on some parallelconnecting roadways may increase
traffic volumes on non-corridor roads
Develop innovative use of CMSs (eg travel times)
Potential uses of CMSs to improve system efficiency include the use of CMSs along portions of all corridors near transit station to indicate travel
times based on real-time existing traffic conditions on the freeway as well as on parallel roadways and express bus and light rail services CMS can also be used to identify the number of parking spaces that are still available at
the light-rail stations
Funding availability funding competition within the region
Implement amp expand Transit AVLTransit status information
enhancements for system users
Expand the use of AVL systems utilizing GPS technology to track in real-time the location of transit vehicles monitor transit schedules dispatch transit vehicles and provide real-time passenger information such as ldquonext busrdquo or
ldquonext trainrdquo arrival times
Funding availability funding competition within region
Expand Park-and-Ride lots at key locations
Add additional capacity to existing park-and-ride lots near transit stations and other locations that are approaching capacity
Funding availability funding competition within the region and available land
improve bike-pedestrian access in the CSMP
transportation network
Plan and program for construction of additional bicycle paths lanes and related improvements for access and connectivity to transit park and ride
lots and destination points
Funding availability funding competition within the region
Provide ldquoBike-SharingrdquordquoCar-Sharingrdquo tofrom transit (ldquoCarlinkrdquo) and from
neighborhoods
Expand the Regional Rideshare and Spare-the-Air programs to include bicycle and car sharing opportunities
Funding availability and coordination between SaCOg TMa air Districts employers developshyers property managers and local government
officials
Provide parking management stratshyegies in interested jurisdictions where applicable to discourage
use of single-occupant vehicles
in higher-density areas provide preferential parking for carpools and vanshypools require residential parking permits remove on-street parking and or provide graduated parking fees for metered on-street parking based on
vehicle type and time of day for SOV spaces to encourage transit use
Acceptance by businesses local officials and the general public
Expand bicycle commute amp transit fare strategiessubsidies
increase participation by large employers in programs that subsidize transit fares for employees during peak-hour commute times and provide bicycling
to work incentives
Voluntary participation by large employers to pay subsidy to transit providers
HigHway 50 corridor system management plan [ 39 ]
c h a p t e r s i x p l a n n e d c o r r i d o r s y s t e m m a n a g e m e n t s t r a t e g i e s
tabLe 11 KeY CaPitaL ProjeCtS
CountyLead agency
route roadway from to Project
Description Programmed
funds
additional funding Needed
total Cost estimate (x $1000)
Comp Year (FFY)
uS 50
Sacramento Caltrans District 3
US 50 Downtown watt avenue HOV Lanes $0 $75000 $75000 2020
Sacramento Caltrans District 3
US 50 watt avenue Sunrise Blvd HOV Lanes $165000 $0 $165000 2013
Sacramento Caltrans District 3
US 50 Bradshaw Road
Mather Field Road
Eastbound and Westbound Auxiliary Lanes
$0 $3700 $3700 2016
Sacramento Caltrans District 3
US 50 State Route 99
(Oak Park Interchange) interchange improvements including buscarpool lane
connectors $0 $150000 $150000 2014
Sacramento Caltrans District 3
US 50 interstate 5
(Riverfront Interchange) Riverfront Interchange
improvements including bus carpool lane connectors
$30000 $170000 $200000 2016
ED Caltrans District 3 US 50 Camino
Operational Safety improvements Construct an
undercrossing median barrier modify local road connections andor associated operational improvements on and adjacent
to US 50
$15000 $0 $15000 2012
ED ED County DOT US 50
west of Latrobe Road
west of Bass Lake
grade HOV Lanes (Ph1) $47141 $0 $47141 2010
ED Caltrans District 3 US 50
west of Bass Lake Road
Ponderosa Road
HOV Lanes (Ph2) $55000 $0 $55000 2011
ED Caltrans District 3 US 50 Ponderosa
Road greenstone
Road HOV Lanes (Ph3) $22357 $0 $22357 2013
ED ED County DOT US 50 Future Silva
Valley iC
Future Empire Ranch IC
Mainline Widening construct new WB lane within the
median from proposed Silva Valley IC to proposed Empire
Ranch IC
$2950 $0 $2950 2013
[ 40 ] HigHway 50 corridor system management plan
c h a p t e r s i x p l a n n e d c o r r i d o r s y s t e m m a n a g e m e n t s t r a t e g i e s
tabLe 11 KeY CaPitaL ProjeCtS (ConTInued)
CountyLead agency
route roadway from to Project
Description Programmed
funds
additional funding Needed
total Cost estimate (x $1000)
Comp Year (FFY)
PARALLEL AnD COnnECTInG ROADWAYS
ED ED County DOT
Silva Valley Parkway
Entrada Drive
Future US 50
Silva Valley Parkway iC
Widen Silva Valley Road from 2 lanes to 4 lanes includes
Class ii bike lanes and left turn storage pockets
$2921 $0 $2921 2010
ED ED County DOT
Silva Valley Parkway US 50
US50 Silva Valley Parkway (Phase 2) Includes constructshying overcrossing and ramps
signalization at EB and WB on off ramps
$57817 $0 $57817 2016
ED ED County DOT
Headington Road
Missouri Flat Road
El Dorado Road
Extend 2 lanes with median $9878 $0 $9878 2012
ED ED County DOT
Durock Road
Robin Lane South
Shingle Road
Extend 2 lanes with median $1239 $9214 $10453 2015
ED ED County DOT
Durock Road
Business Center Drive intersection signalization
includes adding turn pockets on Durock Road
$4333 $0 $4333 2009
ED City of Placerville
Point View Drive Broadway Smith Flat
Road Extend 2 lanes $1300 $0 $1300 2020
ED City of Placerville
western Placerville
US 50 interchange
Forni Road Ray Lawyer
Drive
Placerville Drive
Interchange Reconstruction convert Ray Lawyer Dr
Overcrossing to full IC Auxiliary Lanes
$5059 $34741 $39800 2020
Sacramento City of Rancho
Cordova
Mather Boulevard
Rockingham Road
Zinfandel Drive widen to 4 lanes $0 $8617 $8617 2020
Sacramento Rancho Cordova
Parkway ii
Grant Line Road
White Rock Road
New 6-lane expressway includshying intersection improvements at Kiefer Blvd amp White Rock
Road
$0 $44518 $44518 2020
Sacramento City of Folsom
Scott Road US 50 White Rock Rd
widen from 2 to 6 lanes $16000 $0 $16000 2020
Sacramento Sacramento County DOT
White Rock Road
Grant Line Rd
Prairie City Rd
Widen from 2 to 4 lanes realign near Nike and Nimbus Roads and connect with existshying alignment west of Prairie City Rd Realign Grant Line Rd to intersect with realigned
White Rock Rd
$26600 $0 $26600 2020
Sacramento Sacramento County DOT
Hazel avenue
US 50 Hazel Madison
Widen American River Bridge and approaches from 4 to 6 lanes Widen Hazel Avenue from AR Bridge to Madison from 4 to 6 lanes with Bike
LanesSignals
$83530 $0 $83530 2020
HigHway 50 corridor system management plan [ 41 ]
c h a p t e r s i x p l a n n e d c o r r i d o r s y s t e m m a n a g e m e n t s t r a t e g i e s
tabLe 11 KeY CaPitaL ProjeCtS (ConTInued)
CountyLead agency
route roadway from to Project
Description Programmed
funds
additional funding Needed
total Cost Estimate (x $1000)
Comp Year (FFY)
PARALLEL AnD COnnECTInG ROADWAYS
ED ED County DOT
green Valley Road
Salmon Falls Road
east
Deer Valley Road
widen from 2 to 4 lanes $0 $14576 $14576 2025
ED ED County DOT
green Valley Road
Deer Valley Road east Lotus Road widen $958 $4513 $5471 2015
ED ED County DOT
green Valley Road
Francisco Drive
Salmon Falls Road
widen from 2 to 4 lanes divided $412 $3491 $3903 2015
ED ED County DOT
Latrobe Road
investment Boulevard
golden Foothill Parkway
widen from 2 lanes undivided to 4 lanes
divided $1076 $8792 $9868 2015
ED ED County DOT
Latrobe Road
Carson Creek
White Rock Road
widen from 4 to 6 lanes $0 $23755 $23755 2025
ED ED County DOT
white Rock Road
EDSac County Line
Manchester Drive
widen 2 to 4 lanes divided includes signal interconnect and coorshy
dination
$0 $23755 $23755 2025
Sacramento City of Rancho
Cordova
Easton Valley
Parkway
Prairie City Road
Empire Ranch Road extenshysion south of
US 50
Construct new 4 lane road $0 $45000 $45000 2020
Sacramento Sacramento County DOT
Hazel avenue
Easton Valley
Parkway
Grant Line RoadWhite Rock Road
New road extension 4 lane limited access
through aerojet property $0 $18000 $18000 2018
Sacramento Sacramento County DOT
white Rock Road
Prairie City Road
ED County Line
widen to 4 lanes $8330 $64773 $73103 2018
Sacramento Sacramento County DOT
green Valley Road
East Natoma Sacramento ED County
line widen to 4 lanes $0 $3000 $3000 2018
Sacramento City of Rancho
Cordova
Zinfandel Drive
international Drive
Folsom Boulevard
widen to 4 lanes $0 $12000 $12000 2020
[ 42 ] HigHway 50 corridor system management plan
c h a p t e r s i x p l a n n e d c o r r i d o r s y s t e m m a n a g e m e n t s t r a t e g i e s
tabLe 11 KeY CaPitaL ProjeCtS (ConTInued)
CountyLead agency
route roadway from to Project
Description
Pro-grammed
funds
addi-tional
funding Needed
total Cost estimate (x $1000)
Comp Year (FFY)
traNSit
yolo amp Sacramento City of west Sacramento
amp City of Sacramento
Sacramento River
Crossing
15th Street in the City
of west Sacramento
Broadway in the City of
Sacramento
New all-modal river crossing (Auto Transit Bike amp Pedestrian)
from Sacramento across the Sacramento River to West
Sacramento The crossing was modeled between Broadway in Sacramento amp 15th Street in
West Sacramento but final alignshyment options will be studied in subsequent planning efforts
$800 $99200 $100000 2019
Sacramento Cal State University
Sacramento
CSUS Campus mdash mdash
Sac State Tram adjoining City streets and SRTD 65th Street light railbus transfer station Bus Rapid Transit System
$23574 $0 $23574 2013
Sacramento City of Rancho
Cordova
Rancho Cordova Various Various
New Service Rancho Cordova Pilot Transit Shuttle System new transit service for connection to
RTs Gold Line
$2380 $1500 $38880 2014
yolo amp Sacramento City of west Sacramento
TBD west
Sacramento Sacramento Streetcar Service between west
Sacramento and Downtown Sacramento
$17400 $54700 $72100 2014
Sacramento City of Rancho
Cordova RT Gold Line
RT Gold Line Tracks
Mather Field Road
Light Rail Grade Separations $0 $52888 $52888 2025
Sacramento City of Rancho
Cordova RT Gold Line
RT Gold Line Tracks Zinfandel Drive Light Rail Grade Separations $0 $52888 $52888 2025
Sacramento City of Rancho
Cordova RT Gold Line
RT Gold Line Tracks
Bradshaw Road
Light Rail Grade Separations $0 $35260 $35260 2025
Sacramento City of Rancho
Cordova RT Gold Line
RT Gold Line Tracks Routier Road Light Rail Grade Separations $0 $35260 $35260 2025
Sacramento City of
Sacramento Sacramento Valley Station
Sacramento intermodal Transportation Facility (Phase 1) - Develop intermodal transportashytion terminal for heavy rail light
rail and bus service
$77799 $0 $77799 2010
Sacramento City of
Sacramento Sacramento Valley Station
Sacramento intermodal Transportation Facility (Phase 2) - Develop intermodal transportashytion terminal for heavy rail light
rail and bus service
$24101 $1000 $25101 2014
HigHway 50 corridor system management plan [ 43 ]
c h a p t e r s i x p l a n n e d c o r r i d o r s y s t e m m a n a g e m e n t s t r a t e g i e s
TABLE 11 KEY CAPITAL PROJECTS (CONTINUED)
CountyLead Agency
Route Roadway From To Project
Description Programmed
Funds
Additional Funding Needed
Total Cost Es-timate (x $1000)
Comp Year (FFY)
BICYCLE ROUTES
Sacramento City of Rancho
Cordova
US 50Mather Field Road IC US 50 Mather
Field Road
US 50Mather Field Road PedestrianBike Crossing along
the Mather Airport RR Spur alignment
$0 $820 $1055 2015
ED ED County DOT
Sacramento Placerville
Transportation Corridor
Forni Rd
Missouri Flat Rd Class I Bike Trail $1423 $111 $1534 2009
ED City of Placerville
El Dorado Trail Western
Extension
Canal Street Main Street
Ray Lawyer DriveForni
Road Class 1 Bike Trail $1850 $0 $1850 2010
ED ED County DOT
US 50ED Hills Blvd IC US 50
El Dorado Hills Blvd
Latrobe Road
US 50El Dorado Hills Blvd Pedestrian Overcrossing $5508 $66 $5574 2014
TABLE 12 50 MOBILITY PARTNERSHIP KEY CAPITAL PROJECTS
RouteRoadway From To Project Description
NEAR TERM PRIORITY IMPROVEMENT PROJECTS
US 50 Sunrise Scott Road Auxiliary Lane
US 50 Hazel Avenue Interchange Improvements
Hazel Avenue Folsom Boulevard Easton Valley Parkway New 4 Lane Road
Easton Valley Parkway Hazel Avenue Rancho Cordova Parkway New 6 Lane Road
Rancho Cordova Parkway Easton Valley Parkway White Rock Road New 4 Lane Road
White Rock Road Sunrise Boulevard Silva Valley Parkway Widen to 4 Lanes
RT Gold Line Hazel Iron Point Station Passing Tracks
US 50 Rancho Cordova Parkway New Interchange
Zinfandel Drive South of International Douglas Road New 4 Lane Road
International Drive Kilgore Road Rancho Cordova Parkway New 6 Lane Road
Douglas Road Zinfandel Extension Sunrise Boulevard Widen to 4 Lanes
Sunrise LRT Citrus Road Sunrise Mall Bus Rapid TransitExpress Bus
[ 44 ] HIGHWAY 50 corridor system management plan
c h a p t e r s i x p l a n n e d c o r r i d o r s y s t e m m a n a g e m e n t s t r a t e g i e s
TABLE 12 50 mOBILITY PARTnERSHIP kEY CAPITAL PROjECTS (COnTInUED)
routeroadway from to Project Description
US 50 nEAR TERm PRIORITY ImPROVEmEnT PROjECTS
US 50 Empire Ranch Road New interchange
US 50 Silva Valley New interchange
US 50 Scott Road Empire Ranch Road Aux Lanes
US 50 Empire Ranch Road El Dorado Hills Boulevard Aux lanes and climbing lanes
US 50 El Dorado Hills Boulevard Silva Valley Parkway Aux lanes and climbing lanes
US 50 Silva Valley Parkway Bass Lake Road Aux lanes
Sunrise Boulevard White Rock Road Douglas Boulevard widen to 6 lanes
Sunrise Boulevard Douglas Boulevard Jackson Road widen to 4 lanes
White Rock Road Sunrise Boulevard Future Rancho Cordova Parkway and El Dorado County Line to Latrobe Road
widen to 4 lanes
Douglas Boulevard Sunrise Boulevard Grant Line Road widen to 4 lanes
Rancho Cordova Parkway Douglas Boulevard Rio del Oro Parkway New 2 lane road
Rancho Cordova Parkway Rio del Oro Parkway White Rock Road New 6 lane road
Jaeger Road Douglas Road Kiefer Boulevard New 4 lane road
Chrysanthy Sunrise Boulevard Americanos Boulevard New 4 lane road
Kiefer Boulevard Sunrise Boulevard Jaeger Road New 4 lane road
Grant Line Road Douglas Road Chrysanthy Road widen to 4 lanes
Hazel avenue Gold Country Boulevard Madison avenue widen to 6 lanes
Latrobe Road South of White Rock Road widen to 4 lanes
TABLE 13 VISIOnARY PROjECTS
County routeroadway from to Project Description
Sac yolo US 50 Enterprise Downtown Sacramento HOV Lanes
ED TBD Folsom Placerville Transit ndash Type TBD
ED New Road Latrobe Road White Rock Road (poten shy
tially US 50) New 2-lane road
HigHway 50 corridor system management plan [ 45 ]
c h a p t e r s i x p l a n n e d c o r r i d o r s y s t e m m a n a g e m e n t s t r a t e g i e s
[ 46 ] HigHway 50 corridor system management plan
Page Inte
ntionally
Left
Blank
congestion and bottleneck analysis
chapter seven
The 2000 Highway Capacity Manual defines a bottleneck
as ldquoa road element on which demand exceeds capacityrdquo
The bottleneck analysis evaluates specific causes of existshying recurrent traffic congestion in the corridor Freeway bottleneck locations that create mobility constraints are identified and documented and their relative contribution
to corridor-wide congestion is reported The bottleneck locations were determined based on a combination of the use of 2006 PeMS data HiCOMP report probe vehicle tach runs and field observations
Traffic congestion can be categorized as either recurrent
or non-recurrent
recurrent congestion occurs repeatedly at the same place and time of day in a predictable pattern Recurrent congesshytion is often associated with facility capacity limitations changes in capacity conflicting vehicle movements such
as lane merges inadequate number of transit vehicles to handle passenger loads or other persistent physical condishytions of the transportation facility
Non-recurrent congestion is usually attributed to collishysions equipment malfunction community events weather construction projects and other occasional occurrences When transportation systems are close to their maximum
carrying capacity non-recurrent congestion is more likely to occur as there is little excess capacity in the system
The location and extent of the bottlenecks on US 50 found
in the aM and PM peak periods are summarized in Tables 14 and 15 These depictions should be considered a snapshyshot view and not a comprehensive analysis of all bottleshynecks in the corridor Further work is being conducted to
refine the identification and causality of bottlenecks within
the corridor Table 14 shows a summary of the US 50 eastbound bottlenecks while the tables that follow discuss each bottleneck including location and possible causality Table 15 shows a summary of the US 50 westbound bottleshynecks while the tables that follow discuss each bottleneck including location and possible causality Minor or hidden bottlenecks are those Freeway bottleneck
that are not as defined locations that create (or severe) as the major mobility constraints bottlenecks Please note are identified and that the graphics accomshy documented and their panying the bottlenecks
relative contribution to are not to scale
corridor-wide congestion Major bottlenecks in the is reported eastbound direction during the aM peak period are at Howe avenue and during the PM peak period are at 48th Street Howe Avenue Mayhew Road Routier Road Sunrise Boulevard and El Dorado Hills Boulevard Major bottlenecks in the westbound direction during the aM peak period are at El Dorado Hills Boulevard Hazel Avenue Zinfandel Drive
HigHway 50 corridor system management plan [ 47 ]
c h a p t e r s e v e n c o n g e s t i o n a n d b o t t l e n e c k a n a l y s i s
Bradshaw Road and Howe Avenue and major bottleneck
locations during the PM peak period are at Zinfandel Drive Routier Road Bradshaw Road Howe Avenue and Intershystate 5
Causalities for these bottlenecks range from high-traffic
demand (congestion) heavy weavingmerging areas or physical constraints such as lane drops lack of ramp meters incomplete HOV network incomplete Auxiliary Lane
network poorly coordinated traffic signals and an off-ramp
queue (Sunrise Boulevard) US 50 Westbound Onramp
TABLE 14 US 50 EASTBOUnD BOTTLEnECk SUmmARY Source PeMS Caltrans tach runs and
Cambridge Systematics field observations
bottleneck Location PeMS Speed Contours Caltrans Probe Vehicle Runs
Cause aM PM aM PM
A Jefferson Blvd PM 25 Minor Minor Traffic weaving truck volumes and grade
B 48th St PM 7 Minor Major Minor Minor Merge from SR 51 and SR 99
C Howe ave PM 9 Major Major Major weave between Howe and watt
D Mayhew Rd PM 12 Major Minor Major Weaving before Bradshaw Exit
E Routier Rd PM 14 Minor Major Weaving before Mather Field Rd Exit
F Sunrise Blvd PM 185 Minor Major Lane drop HOV add off-ramp queue
G Folsom Blvd PM 22 Minor Minor Lane drop 4 to 3
H El Dorado Hills Blvd PM 275 Major
Poorly coordinated traffic signal on arterial causes spillback onto freeway
a jefferson blvd bottleneck The bottleneck approximately located at Jefferson Blvd is due to weaving traffic as those entershying the freeway from Jefferson Blvd must cross those attempting to exit the freeway to I 5 There is a large number of trucks in the stream which struggle with the grade at this location exacerbatshying the bottleneck
[ 48 ] HigHway 50 corridor system management plan
c h a p t e r s e v e n c o n g e s t i o n a n d b o t t l e n e c k a n a l y s i s
b 48th St bottleneck The bottleneck approximately located at 48th St is due to the additional traffic merging from SR 51 and SR 99 combined with the eventual lane drop at 59th St This queue extends upstream past the off-ramp to SR 5199 These off-ramps are bottlenecks in themselves which spill back and choke the US 50 mainline
C Howe Ave Bottleneck The bottleneck at Howe ave is due to the entering traffic from Howe Ave Two Howe Ave on-ramps feed into US 50 eastbound southbound Howe ave loop on-ramp and northbound Howe ave direct ramp approximately 300 feet apart The watt avenue off-ramp is just down stream with heavy exiting volumes therefore the segment between Howe and watt is characterized by heavy weaving
D mayhew Rd Bottleneck The bottleneck approximately located at Mayhew Rd most likely begins with the additional traffic entering from Watt Ave and ends with the exiting traffic at Bradshaw Rd It is possible that there is a high proportion of weaving traffic with in this section (Watt Ave traffic moving to the left lane and those exiting at Bradshaw Rd moving to the right lane)
HigHway 50 corridor system management plan [ 49 ]
c h a p t e r s e v e n c o n g e s t i o n a n d b o t t l e n e c k a n a l y s i s
[ 50 ] HigHway 50 corridor system management plan
e routier rd bottleneck It is likely that the bottleneck at Routier Rd is due to the same merging conditions associated with Mayhew Rd The area is comprised of both residential and light industrialoffice land uses therefore during the PM peak period there are large volumes of vehicles entering at Bradshaw Rd moving to the left lanes and large volumes of vehicles moving to the right lane to exit at Mather Field Rd
f Sunrise blvd bottleneck At Sunrise Blvd the right-most lane exits while an HOV lane is added as the median lane The bottleneck is formed from vehicles shifting left to avoid exiting at Sunrise Blvd and to enter the HOV lane There is a large volume of vehicles queued at the Sunrise off-ramp which spills back and negatively affects the US 50 mainline
g folsom blvd bottleneck The right-most lane exits to Folsom Blvd leaving one HOV lane and two regular lanes along the US 50 The bottleneck is caused by this lane drop as well as the quick merge at the Folsom on-ramp
c h a p t e r s e v e n c o n g e s t i o n a n d b o t t l e n e c k a n a l y s i s
H The eastbound US 50 at El Dorado Hills Blvd Bottleneck The eastbound El Dorado Hills Blvd bottleneck is caused by a traffic signal on the arterial that often causes spillbacks on the EB loop offramp onto the freeway mainlines
TABLE 15 US 50 WESTBOUnD BOTTLEnECk SUmmARY Source PeMS Caltrans tach runs and Cambridge Systematics field observations
bottleneck Location PeMS Speed Contours Caltrans Probe Vehicle Runs
Cause aM PM aM PM
A El Dorado Hills Blvd PM 275 Major Poorly coordinated traffic
signal on El Dorado Hills Blvd
B Hazel Ave PM 21 Major Entering traffic
C Zinfandel Dr PM 16 Minor Major Major Major Entering traffic
D Routier Rd PM 14 Minor Major Minor Weaving traffic
E Bradshaw PM 13 Major Major Major Merging traffic and curve
F Howe Ave PM 9 Minor Major Major Major Weaving traffic and grade
G SR 51SR 99 PM 6 Minor Lane drop weaving traffic
H i-5 PM 3 Major Weaving traffic
HigHway 50 corridor system management plan [ 51 ]
c h a p t e r s e v e n c o n g e s t i o n a n d b o t t l e n e c k a n a l y s i s
[ 52 ] HigHway 50 corridor system management plan
A El Dorado Hills Blvd Bottleneck The minor bottleneck at El Dorado Hills Boulevard is caused by the traffic signal on El Dorado Hills Blvd that causes spillback on the westbound offramp onto the freeway mainlines
B Hazel Avenue Bottleneck In 2006 the Hazel Ave Bottleneck is caused by the traffic entering at both Hazel Ave and Folsom Blvd (the two on-ramps are separated by about one mile) The bottleneck that would appear at Folsom Blvd combines with the bottleneck at Hazel ave to form a large bottleneck that does not clear until after Hazel ave Sometimes causshying spillbacks as far as Prairies City Road this bottleneck was mitigated in 2007 as part of the GO CALIFORNIA program
C Zinfandel Dr Bottleneck There is heavy traffic coming from Sunrise Blvd but the lane addition immediately after the westbound on-ramp prevents a bottleneck from forming but as traffic flows westward the heavy traffic entering from Zinfandel Dr causes a bottleshyneck here
D Routier Rd Bottleneck The bottleneck at Routier Rd is caused by weaving traffic between Mather Field Rd and Bradshaw Rd This highway segment represents a transition area where vehicles that have been traveling in the left lanes begin to shift to the right lanes to exit while the entering traffic tries to shift to the left lanes
W eav in gLan e Dr o p
c h a p t e r s e v e n c o n g e s t i o n a n d b o t t l e n e c k a n a l y s i s
e bradshaw rd bottleneck The Bradshaw Rd bottleneck is caused by the entering traffic from Bradshaw Road the high truck volumes and the curve west of Bradshaw Two Bradshaw Rd on-ramps feed into US 50 westshybound southbound Bradshaw Rd direct on-ramp and northbound Bradshaw Rd loop on-ramp approximately 400 feet apart
F Howe Ave Bottleneck The Howe ave bottleneck is caused by a grade change and the weaving traffic entering from Howe ave and Hornet Dr competing for the right-most lane with those wanting to exit at 65th Street
G amp H SR 51SR 99 amp I-5 Bottleneck The bottleneck at I 5 is caused by the conflict between entering SR 99 and SR 51 traffic and exiting I-5 traffic as well as the queues formed on the ramps to i-5 which spill back onto US 50 The number of lanes in this section reaches a maximum of 6 and then drops to 4 as two lanes exit at the I-5 freeway This bottleneck is exacershybated during the peak periods when it stretches upstream to the lane drop before SR 99
W ea v in g
Lan e Dr o p
HigHway 50 corridor system management plan [ 53 ]
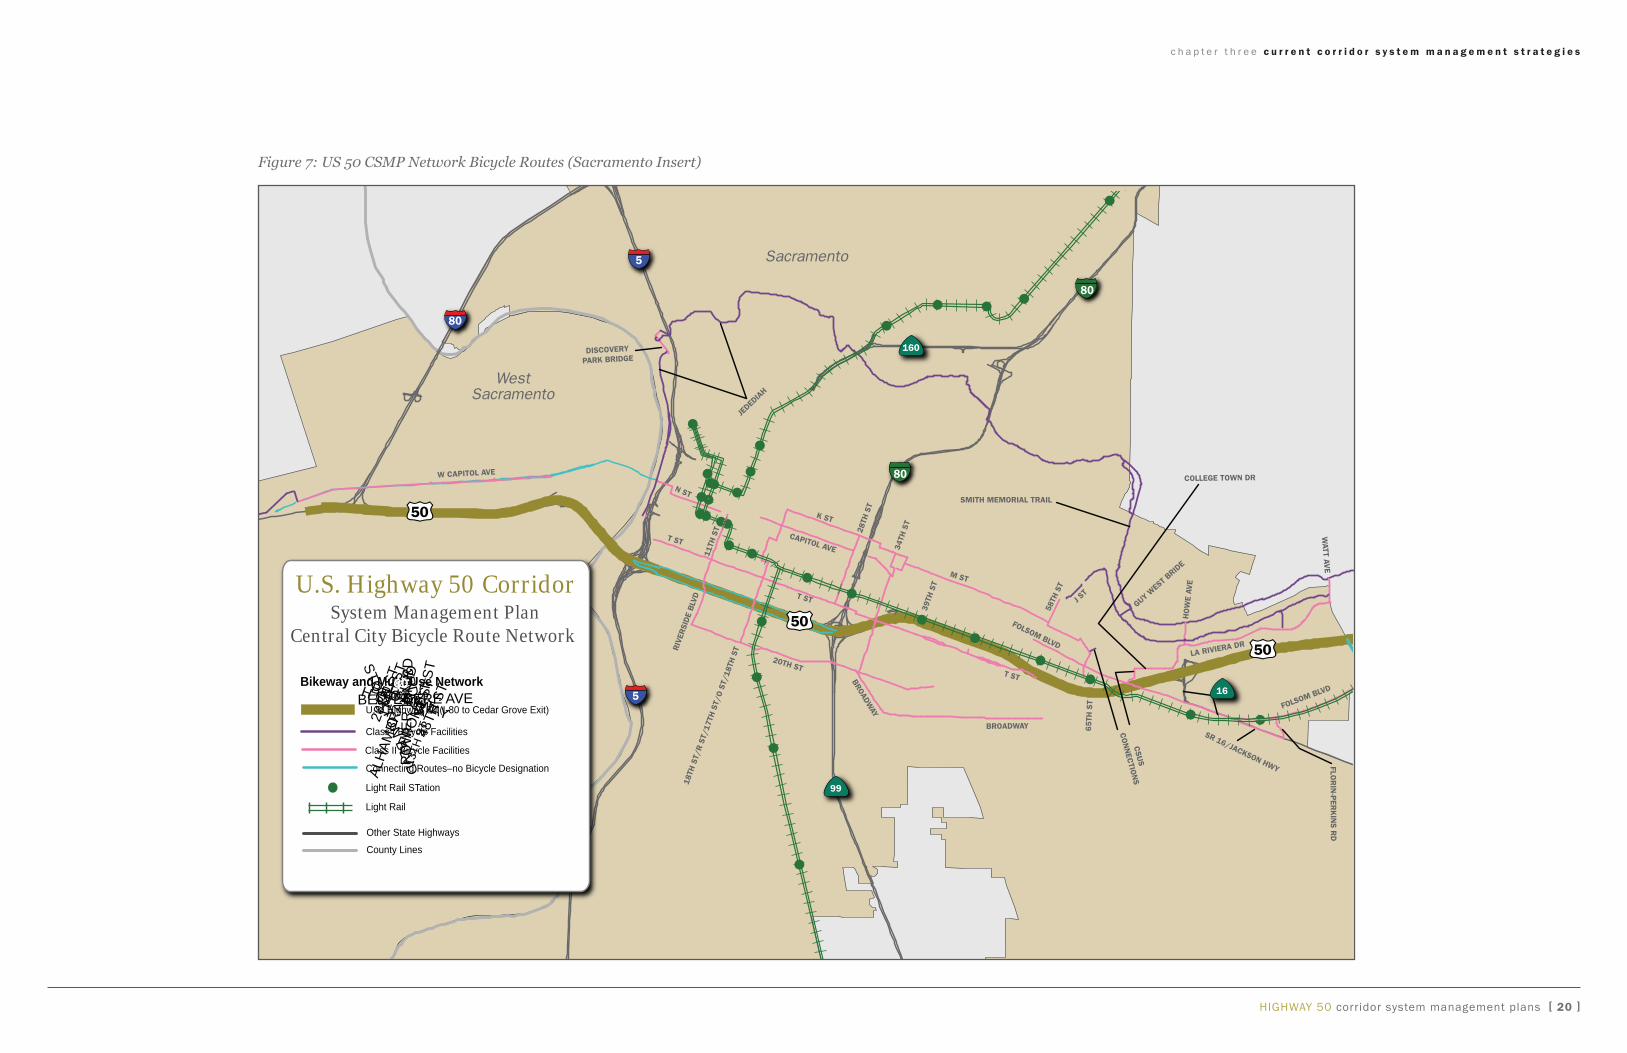
c h a p t e r f i v e p e r f o r m a n c e m e a s u r e s
[ 28 ] HigHway 50 corridor system management plan
Page Inte
ntionally
Left
Blank
c h a p t e r f i v e p e r f o r m a n c e m e a s u r e s
Table 6 US 50 PerForManCe MeaSUreS
County location Post Miles
distance (Miles)
average annual daily Traffic1
PerForManCe MeaSUreS
loS1
Total Vehicle Hours of delay2
Total Person Minutes of delay2
Minutes of delay per Vehicle2
Minutes of delay per Person2
Vehicle Travel Time (Minutes)2 distressed
Pavement (lane
Miles)4
reported Col-lision rate
Comparison ()5
reliability6 lost Productivity7
daily Peak Hour3 daily Peak
Hour3 Peak Hour3 Peak Hour3 Peak Hour3 eastbound westbound lost lane Miles aM
Peak Period
lost lane Miles PM
Peak Period
STaTe HigHway SySTeM
yOL interstate 80 to yolo Sacramento County Line
000 to 316 316 180000 F 1169 126 95363 8061 049 046 36 9 26 62 22 01 0
SaC
yoloSacramento County Line to State Routes 99
and 51
L000 to L248 R000
248 253000 F 4993 653 407455 41746 186 175 43 7 20 64 60 53 76
State Routes 99 and 51 to watt avenue
R000 to R534 534 225000 F 10097 1362 823883 87105 397 372 93 15 24 60 48 81 68
watt avenue to Zinfandel Drive
R534 to R1092 558 187000 F 8075 977 658886 62506 351 329 91 19 -32 56 42 44 23
Zinfandel Drive to Sunrise Boulevard
R1092 to 1250 158 149000 E 1271 197 103727 12610 088 082 25 9 -33 46 13 0 16
Sunrise Boulevard to Folsom Boulevard
1250 to 1701 451 125000 E 3087 356 251940 25832 180 149 63 5 -14 60 46 1 45
Folsom Boulevard to SacramentoEl Dorado
County Line
1701 to 2314 613 95000 D 583 122 47537 8867 083 069 70 0 -11 19 55 0 08
ED
SacramentoEl Dorado County Line to Cameron
Park Dr
000 to R657 657 70000 E 504 126 41150 9138 110 091 77 1 -35 PeMS Data
Unavailable PeMS Data Unavailable
PeMS Data Unavailable
PeMS Data Unavailable
Cameron Park Drive to Missouri Flat Road
R657 to R1506 849 62000 E 302 75 24633 4827 079 075 93 2 -61 PeMS Data
Unavailable PeMS Data Unavailable
PeMS Data Unavailable
PeMS Data Unavailable
Missouri Flat Road to End of Freeway in Placerville
R1506 to 1725 219 59000 D 66 16 5376 1053 020 019 24 1 20 PeMS Data
Unavailable PeMS Data Unavailable
PeMS Data Unavailable
PeMS Data Unavailable
End of Freeway in Placerville to Bedford avenue
1725 to 1811 086 52000 D 68 17 5585 1094 021 020 15 2 81 PeMS Data
Unavailable PeMS Data Unavailable
PeMS Data Unavailable
PeMS Data Unavailable
Bedford avenue to Cedar grove Road
1811 to R2595 784 38500 D 58 15 4758 932 023 022 85 10 6 PeMS Data
Unavailable PeMS Data Unavailable
PeMS Data Unavailable
PeMS Data Unavailable
TOTaL mdash 5473 mdash mdash 30273 4042 2470293 263771 1587 1449 7150 80 mdash mdash mdash mdash mdash
1 Source Average Annual Daily Traffic and Level of Service (LOS) calculated is based on 2007 Caltrans Traffic Volumes on California State Highways and Highway Capacity Manual and Cambridge Systematics from 2008 Reported LOS is for the typical most congested daily peak travel period 2 Source Delay is the average additional travel time by vehiclespersons traveling under 60 mph Data derived from 2007 HICOMP report SACMET Travel Demand Model PeMSs traffic data and Caltrans District 3 Traffic Operations Probe vehicle Tach runs 3 Peak Hour is during PM 4 Source 2007 Caltrans Division of Maintenance Pavement Summary Report 5 Source 2004 through 2007 Caltrans Traffic Accident Surveillance and Analysis System summary data of the percentage above or below the statewide average for fatal injury and property damage-only collisions on comparable facilities 6 Reliability The Planning Time Index is a measure of the reliability of the travel time on a particular route It is the ratio of the 95th percentile of travel time on a route to the median free-flow travel time This means itrsquos the amount of time a traveler needs to allocate for a route if they want to show up on time 19 out of 20 trips Reliability and Planning Time data was taken from April 2007 The data covered a 24-hour period of time on each Tuesday wednesday and Thursday of that month That data was then aggregated into a single average 24-hour day it was then analyzed to determine the highest average aM and PM travel time That time was then compared to the best possible average travel time to determine the additional time that was spent traveling the same seg-ment 7 Lost Productivity Data taken April 2007 PeMS As traffic increases to the capacity of the highway speeds decline throughput drops dramatically and the efficiency of the highway to provide mobility decreases This decline in the potential carrying-capacity of the freeway is expressed in terms of how many equivalent lane miles of roadway are lost
HigHway 50 corridor system management plans [ 29 ]
c h a p t e r f i v e p e r f o r m a n c e m e a s u r e s
Table 7 Parallel and ConneCTing roadwayS PerForManCe MeaSUreS
County location average
daily Traffic1
PerForManCe MeaSUreS
loS1
Total Vehicle Hours of delay2
Total Person Minutes of delay2
Minutes of delay per Vehicle2
Minutes of delay per Person2
Vehicle Travel Time (Minutes)2
distressed Pavement
(lane Miles)4
daily Peak Hour3 daily Peak
Hour3 Peak Hour3 Peak Hour3 Peak Hour3
Parallel and ConneCTing roadwayS
yOL west Capitol Enterprise Boulevard to Capitol Mall 13737 No Data
Data is unavailable for these performance measures at this time however will be pursued in the next phase of the CSMP
SaC
w 5th Street to 26th Street 9194 a
X 5th Street to 26th Street 9154 a
Folsom Boulevard watt avenue to Bradshaw Road 25600 C
watt avenue Folsom Boulevard to US 50 63900 F
Bradshaw Road Folsom Boulevard to US 50 22400 a
Folsom Boulevard Bradshaw Road to Sunrise Boulevard 20400 a
Bradshaw Road Old Placerville to US 50 54405 F
Old Placerville Road Bradshaw Road to Rockingham Drive 11864ndash18365 a
Rockingham Drive Old Placerville Road to Mather Boulevard 16516 E
Mather Boulevard Rockingham Drive to Folsom Boulevard 21732 C
international Drive Rockingham Drive to Zinfandel Drive 12808 a
Zinfandel Drive international Drive to Folsom Boulevard 22298ndash47032 BE
white Rock Road Zinfandel Drive to Sunrise Boulevard 25459 a
Sunrise Boulevard US 50 to Folsom Boulevard No Data No Data
white Rock Road Sunrise Boulevard to Prairie City Road 3400 B
Folsom Boulevard Sunrise Boulevard to iron Point Road 17200 a
white Rock Road grant Line Road to EDSaC County Line 6700 D
iron Point Road Folsom Boulevard to East BidwellScott Road 13984 No Data
Scott Road iron Point Road to white Rock Road No Data No Data
Folsom Boulevard iron Point Road to Blue Ravine Road No Data No Data
Blue Ravine Road Folsom Boulevard to green Valley Road No Data No Data
Prairie City Road US 50 to white Rock Road 6000 D
HigHway 50 corridor system management plans [ 30 ]
c h a p t e r f i v e p e r f o r m a n c e m e a s u r e s
Table 7 Parallel and ConneCTing roadwayS PerForManCe MeaSUreS (ConTinUed)
County location average
daily Traffic1
PerForManCe MeaSUreS
loS1
Total Vehicle Hours of delay2
Total Person Minutes of delay2
Minutes of delay per Vehicle2
Minutes of delay per Person2
Vehicle Travel Time (Minutes)2
distressed Pavement
(lane Miles)4
daily Peak Hour3 daily Peak
Hour3 Peak Hour3 Peak Hour3 Peak Hour3
Parallel and ConneCTing roadwayS
ED
green Valley Road EDSaC County Line to Francisco Drive 22600 D
Data is unavailable for these performance measures at this time however will be pursued in the next phase of the CSMP
green Valley Road Francisco Drive to Silva Valley Parkway 13077 D
green Valley Road Silva Valley Parkway to Cameron Park 9849 C
green Valley Road Cameron Park Drive to Deer Valley Road 5278 C
green Valley Road Deer Valley Road (East) to Lotus Road 8381 D
green Valley Road Lotus Road to Placerville Drive 4669 C
Latrobe Road white Rock Road to US 50 24742 C
Durock Road Cameron Park Dr to South Shingle Road 7278 C
Cameron Park Drive Durock Road to US 50 (Durock Road to Coach Lane Coach Lane to US 50) 9544 26603 CD
South Shingle Road Durock Road to US 50 11390 D
white Rock Road EDSaC County Line to Latrobe 12808 D
white Rock Road Latrobe Rd to Silva Valley Pkwy (Latrobe to PostPost to Silva Vlly Pkwy) 10124 CD
Silva Valley Parkway white Rock Rd to Serrano Pkwy (white Rock to Entrada Entrada to Serrano Pkwy) 13708 9328 DC
Forni Road Placerville Drive to Main Street 9049 8379 No Data
Placerville Drive Forni Road to US 50 No Data No Data
Main Street Placerville Drive to Bedford avenue No Data No Data
Main Street Bedford avenue to Broadway No Data No Data
Broadway Main Street to Point View Drive No Data No Data
1 Source Average Daily Traffic and Level of Service (LOS) calculated are based on City of Sacramento between 2001 and 2007 Sacramento County from 20072008 City of Rancho Cordova between 2004 and 2007 and El Dorado County from 2007
HigHway 50 corridor system management plans [ 31 ]
c h a p t e r f i v e p e r f o r m a n c e m e a s u r e s
Page Inte
ntionally
Left
Blank
[ 32 ] HigHway 50 corridor system management plan
c h a p t e r f i v e p e r f o r m a n c e m e a s u r e s
tabLe 8 traNSit PerforMaNCe MeaSure
County transit Provider route Performance Measure
available daily Capacity ()1 available Peak Hour Capacity1
traNSit
SaC
SacRT (Bus)
Route 21 70 10
Route 28 76 59
Route 36 83 74
Route 38 66 44
Route 72 56 20
Route 73 79 45
Route 74 82 43
Route 109 47 22
SacRT (Light Rail) Gold Line 31 Exceeds Capacity
EDSAC ED County Transit Authority
Commuter Express Bus Service Not applicablendashOperates Peak Hour
Only 405
iron Point Connector 764 Not available
Reverse Commuter Not applicablendashOperates Peak Hour Only 982
yoloSaC yolo County Transit District Not applicablendashOperates Peak Hour Only 498
biKe3
1 Source average Daily and Peak Hour available Capacity calculated from each transit providerrsquos route ridership data 2 The Reverse Commuter service is offered on vehicles that are returning to El Dorado County (Commuter Express Buses) 3 Bicycle performance measure(s) will be identified applied and included in the subsequent CSMPs
HigHway 50 corridor system management plan [ 33 ]
c h a p t e r f i v e p e r f o r m a n c e m e a s u r e s
[ 34 ] HigHway 50 corridor system management plan
Page Inte
ntionally
Left
Blank
planned corridor system management strategies
chapter six
ConCept LoS and ConCept FaCiLit y ldquoConcept LOSrdquo and ldquoConcept Facilityrdquo have traditionally been used in Caltrans TCCRs to reflect the minimum level or quality of operations acceptable for each route segment within the 20-year planning period and the highway facility needed in the next 20 years to maintain the Concept LOS
Typical Concept LOS standards in Caltrans District 3 are LOS ldquoDrdquo in rural areas and LOS ldquoErdquo in urban areas how-ever some heavily congested route segments now have a Concept LOS ldquoFrdquo because the improvements required to bring the LOS to ldquoErdquo are not feasible due to environmental right of way financial and other constraints The applica-tion of multi-modal corridor management strategies should reduce the severity and duration of congestion and provide viable travel options and information that will enable a traveler to avoid severe freeway congestion
The Concept LOS and Concept Facility for US 50 are shown in Table 9 almost all US 50 segments are forecasted to operate under LOS ldquoFrdquo conditions in 20 years under the No-Build and Build scenarios
Corridor ManageMent StrategieS The US 50 CSMP also proposes specific strategies to enhance corridor mobility (see Table 10) based on the fol-lowing principles
bull Manage all modes and facilities in the corridor as a single system beginning with the transportation net-work defined in this CSMP
bull Implement comprehensive and dynamic multimodal monitoring and reporting for the system and for all modes
bull Develop and use micro-simulation modeling to identify mobility challenges and to evaluate proposed solutions
bull Complete the projects included in the regional trans-portation plans with an emphasis on the completion of the key mobility improvement projects identified in this CSMP (see Tables 11 and 12)
bull Implement the specific strategies outlined in this CSMP
Key CapitaL projeCtS Tables 11 and 12 contain key capital projects that have been identified as the most critical to corridor mobility These are also included in the SaCOg MTP for 2035 and are either planned without any funding yet programmed are partially programmed
The US 50 CSMPor are entirely programmed SACOG conducted significant proposes specific
public attitude research strategies to enhance for the MTP for 2035 to corridor mobility complement comprehensive outreach efforts through community workshops the TALL Order Moving the Region Forward event the televised Town Hall Road Map for the Future and associated public polling The results of the SaCOg analyses and public out-reach for the MTP were
highway 50 corridor system management plan [ 35 ]
c h a p t e r s i x p l a n n e d c o r r i d o r s y s t e m m a n a g e m e n t s t r a t e g i e s
[ 36 ] HigHway 50 corridor system management plan
used when selecting the key projects for identification in
the CSMP and to ensure consistency Not all corridor projshyects in the MTP are included in the CSMP since the CSMP focuses on the managed network and the SaCOg MTP considers all streets and roads bike routes and transit services in the corridor
highway 50 partnership The Highway 50 Partnership is a cooperative public-private effort among the County of Sacramento City of Rancho
Cordova City of Folsom County of El Dorado and several major landowners that recognize the need to consider corrishydor mobility needs holistically
The Partnership has collaborated effectively to develop a Plan to improve mobility in the US 50 Corridor from Rancho
Cordova to El Dorado Hills an area identified as approprishyate for growth in the SACOG Blueprint Recognizing the
need to generate private investment the Partnership is seeking to implement a regional Highway 50 Corridor fee program to fund these projects
in addition to the key projects indicated in Table 11 Table 12 displays the key projects identified by the
Partnership
These projects include (1) Near-Term Priority Improvement Projects and (2) Near-Term Expected Roadway Improveshyments
The Near-term Priority improvement Projects would proshyvide several new roadway connections for people to travel within and through the area to avoid congestion They also include new transit routes and widening existing roadways
viewed by the Partnership as a package that would provide system-wide travel benefits These improvements targeted
for completion through 2012 would reduce vehicle hours of delay during commute hours by 30 percent
The near-Term Expected Roadway Improvements are conshysidered by the Partnership to be readily expected since they are tied to expected development or are part of a near-term
capital improvements program
Visionary projects Visionary projects are not yet included in the SaCOg MTP or EDCTC RTP but appear to offer considerable corridor mobilshyity benefits and merit further analysis and consideration for inclusion in the next MTP and RTP These are displayed in
Table 13
The ldquoPlus 10 Listrdquo in the SACOG MTP identifies projects
that are attractive from a performance standpoint but could not be included in the Final Project Lists because of financial constraint The ldquoPlus 10 Listrdquo element offers the
opportunity to include projects that would not be affordshyable without additional funding Some projects identified in
the Visionary Projects List were analyzed by SACOG during
development of the current MTP Some of these are included in the ldquoPlus 10 Listrdquo
Watt Avenue Light Rail Station Improvement Project
c h a p t e r s i x p l a n n e d c o r r i d o r s y s t e m m a n a g e m e n t s t r a t e g i e s
Table 9 US 50 ConCePT loS and FaCiliTy TyPe
location Forecasted level of Service1 (loS) and Facility Type
County description and location From Post Mile To Post Mile Current
loS1 20-year no build loS12
20-year build loS12
20-year Concept
loS13 existing Facility4 Concept Facility456 Ultimate Facility457
yOL interstate 80 to yoloSacramento County Line
000 316 F F F F 8F (6F between Jefferson Blvd ramps)
8F+2HOV+aux Lanes 8F+2HOV+aux Lanes
SaC yoloSacramento County Line to SR 99 and 51
L000 L248 = R000 F F F F 8F 8F+2HOV+aux Lanes 8F+2HOV+aux Lanes
SaC State Routes 99 and 51 to watt avenue R000 R534 F F F F 8F 8F+2HOV+aux Lanes 8F+2HOV+aux Lanes
SaC watt avenue to Zinfandel Drive R534 R1092 F F F F 8F 8F+2HOV+aux Lanes 8F+2HOV+aux Lanes
SaC Zinfandel Drive to Sunrise Boulevard R1092 1250 E F F F 8F 8F+2HOV+aux Lanes 8F+2HOV+aux Lanes
SaC Sunrise Boulevard to Folsom Boulevard 1250 1701 E F F F 6F+2HOV to Hazel ave 4F+2HOV
to Folsom Blvd
6F+2HOV+aux Lanes to Hazel ave 4F+2HOV+aux
Lanes to Folsom Blvd
8F+2HOV+aux Lanes
SaC Folsom Boulevard to SaCED County Line 1701 2314 D F F F 4F+2HOV 4F+2HOV+aux Lanes 6F+2HOV+aux Lanes
ED SacramentoEl Dorado County Line to Cameron Park Drive
000 R657 E F F F 4F 4F+2HOV+aux Lanes 6F+2HOV+aux Lanes
ED Cameron Park Drive to Missouri Flat Road R657 R1506 E F E E 4F 4F+2HOV+aux Lanes to greenstone 4F+aux Lanes
to Missouri Flat
6F+2HOV+aux Lanes to greenstone 4F+2HOV+aux Lanes
to Missouri Flat
ED Missouri Flat Road to End of Freeway in Placerville
R1506 1725 D F F F 4F 4F+aux Lanes 4F+aux Lanes
ED End of Freeway in Placerville to Bedford avenue
1725 1811 D E E E 4E 4E 4E
ED Bedford avenue to Cedar grove Exit 1811 R2595 D F F F 4F to Smith Flat 4E to Camino 4F+aux Lanes to Smith Flat 4E to Camino
4F+aux Lanes
1 Level of Service (LOS) A ldquoreport cardrdquo for evaluating traffic flow with ldquoArdquo being the best and ldquoFrdquo being the worst 2 20-year LOS (No Build) The LOS that would be expected at 20 years with no improvements 3 20-year Concept LOS The minimum acceptable LOS over the next 20 years 4 Facility Type Codes C=Conventional Highway E=Expressway F=Freeway HOV=High Occupancy Vehicle Lanes aux=auxiliary Lanes 5 Operational improvements are included in future facilities for all segments Examples of operational improvements include TOS improvements and auxiliary lanes 6 Concept Facility the future roadway with improvements needed in the next 20 years if LOS ldquoFrdquo no further degradation of service from existing ldquoFrdquo is acceptable as indicated by delay performance measurement 7 Ultimate Facility The future roadway with improvements needed beyond a 20 year timeframe
HigHway 50 corridor system management plans [ 37 ]
c h a p t e r f i v e p e r f o r m a n c e m e a s u r e s
Table 10 US 50 CSMP STraTegieS
Strategy description implementation Challenges
Maintain and operate the existing corridor multi-modal trans-
portation infrastructure
Maintain the existing investment in all modes of the transportation system and provide adequate resources for daily operations including operating
revenues for transit services
Funding availability funding competition within the region
Fully coordinate the delivery of transportation services and facili-ties in the corridor including daily operations and system planning
for enhancements
Interagency operational coordination to maximize the efficiency and effec-tiveness of all modes operating in the corridor with a focus on the CSMP transportation network defined in this CSMP Use of an existing group or
committee to provide initial oversight for this strategy
Diverse interests and competing priorities and limited resources
Construct planned and pro-grammed corridor capital improve-
ment projects
implementation of the capital improvements in the corridor included within the approved Metropolitan Transportation Plan and Regional Transportation
Plan for all transportation modes within the scope schedule and cost specified
Funding availability funding competition within the region
Comprehensive daily monitoring of the status of all modes providing service on the CSMP transporta-
tion network
Full deployment of multimodal transportation service status detection systems for all CSMP network components
Funding availability funding competition within region
Provide traveler information to the public
Provide the public with real-time easily accessible information regarding the status of all CSMP transportation system components so as to allow travel-
ers to make informed decisions about trip mode time and routing options
Funding availability funding competition within region
Continually monitor and analyze the CSMP transportation network to improve system performance
Monitor transportation performance measures and make system modifica-tions as appropriate on a frequent and timely basis Staff resources and data availability
Decrease the duration of non-recurrent traffic congestion
Expand and enhance the Freeway Service Patrol to respond to automobile accidents and vehicle break-downs
Funding availability funding competition within the region
Timely implementation of STaRNET
Expedite the implementation of the STaRNET operators of transportation facilities and emergency responders in the Sacramento region through real-time sharing of data and live video refinement of joint procedures
pertaining to the operation of roadways and public transit and public safety activities as well as enhance the regionrsquos 511 web site and interactive
telephone service to provide more traveler information
Developmental time acceptance by agencies and integration into daily use and identifica-
tion of maintenance and operations funding
Enhance transit and rail service increase transit service frequency provide express transit services imple-
ment bus rapid transit routes reduce headways for light rail and buses and construct planned light rail line extensions
Funding availability funding competition within the region
Complete Bus Carpool lane network
Complete the regional buscarpool lane network including freeway-to-freeway HOV lane connectors
Funding availability funding competition within the region Public agency and public
acceptance of network
[ 38 ] HigHway 50 corridor system management plan
c h a p t e r s i x p l a n n e d c o r r i d o r s y s t e m m a n a g e m e n t s t r a t e g i e s
tabLe 10 uS 50 CSMP StrategieS (ConTInued)
Strategy Description implementation Challenges
Enhance Transportation Demand Management strategies
Encourage employers to provide telecommuting and flexible working hour options to employees
acceptance by employers and resources to participate
Optimize the timing and synchronishyzation of traffic signals
Coordinate the optimization and timing of traffic signals on freeway ramps and along parallel and connecting roadways within and between jurisdicshytions to improve traffic flow and reduce congestion Provide signal priority
systems for transit vehicles
Funding availability and coordination among cities counties and Caltrans
improve access management of freeways and parallel connecting roadways
Develop and implement access management strategies to maintain the operational efficiency of freeways and parallelconnecting roadways
agreement between responsible jurisdicshytions as to where increased access control is needed increased access control on some parallelconnecting roadways may increase
traffic volumes on non-corridor roads
Develop innovative use of CMSs (eg travel times)
Potential uses of CMSs to improve system efficiency include the use of CMSs along portions of all corridors near transit station to indicate travel
times based on real-time existing traffic conditions on the freeway as well as on parallel roadways and express bus and light rail services CMS can also be used to identify the number of parking spaces that are still available at
the light-rail stations
Funding availability funding competition within the region
Implement amp expand Transit AVLTransit status information
enhancements for system users
Expand the use of AVL systems utilizing GPS technology to track in real-time the location of transit vehicles monitor transit schedules dispatch transit vehicles and provide real-time passenger information such as ldquonext busrdquo or
ldquonext trainrdquo arrival times
Funding availability funding competition within region
Expand Park-and-Ride lots at key locations
Add additional capacity to existing park-and-ride lots near transit stations and other locations that are approaching capacity
Funding availability funding competition within the region and available land
improve bike-pedestrian access in the CSMP
transportation network
Plan and program for construction of additional bicycle paths lanes and related improvements for access and connectivity to transit park and ride
lots and destination points
Funding availability funding competition within the region
Provide ldquoBike-SharingrdquordquoCar-Sharingrdquo tofrom transit (ldquoCarlinkrdquo) and from
neighborhoods
Expand the Regional Rideshare and Spare-the-Air programs to include bicycle and car sharing opportunities
Funding availability and coordination between SaCOg TMa air Districts employers developshyers property managers and local government
officials
Provide parking management stratshyegies in interested jurisdictions where applicable to discourage
use of single-occupant vehicles
in higher-density areas provide preferential parking for carpools and vanshypools require residential parking permits remove on-street parking and or provide graduated parking fees for metered on-street parking based on
vehicle type and time of day for SOV spaces to encourage transit use
Acceptance by businesses local officials and the general public
Expand bicycle commute amp transit fare strategiessubsidies
increase participation by large employers in programs that subsidize transit fares for employees during peak-hour commute times and provide bicycling
to work incentives
Voluntary participation by large employers to pay subsidy to transit providers
HigHway 50 corridor system management plan [ 39 ]
c h a p t e r s i x p l a n n e d c o r r i d o r s y s t e m m a n a g e m e n t s t r a t e g i e s
tabLe 11 KeY CaPitaL ProjeCtS
CountyLead agency
route roadway from to Project
Description Programmed
funds
additional funding Needed
total Cost estimate (x $1000)
Comp Year (FFY)
uS 50
Sacramento Caltrans District 3
US 50 Downtown watt avenue HOV Lanes $0 $75000 $75000 2020
Sacramento Caltrans District 3
US 50 watt avenue Sunrise Blvd HOV Lanes $165000 $0 $165000 2013
Sacramento Caltrans District 3
US 50 Bradshaw Road
Mather Field Road
Eastbound and Westbound Auxiliary Lanes
$0 $3700 $3700 2016
Sacramento Caltrans District 3
US 50 State Route 99
(Oak Park Interchange) interchange improvements including buscarpool lane
connectors $0 $150000 $150000 2014
Sacramento Caltrans District 3
US 50 interstate 5
(Riverfront Interchange) Riverfront Interchange
improvements including bus carpool lane connectors
$30000 $170000 $200000 2016
ED Caltrans District 3 US 50 Camino
Operational Safety improvements Construct an
undercrossing median barrier modify local road connections andor associated operational improvements on and adjacent
to US 50
$15000 $0 $15000 2012
ED ED County DOT US 50
west of Latrobe Road
west of Bass Lake
grade HOV Lanes (Ph1) $47141 $0 $47141 2010
ED Caltrans District 3 US 50
west of Bass Lake Road
Ponderosa Road
HOV Lanes (Ph2) $55000 $0 $55000 2011
ED Caltrans District 3 US 50 Ponderosa
Road greenstone
Road HOV Lanes (Ph3) $22357 $0 $22357 2013
ED ED County DOT US 50 Future Silva
Valley iC
Future Empire Ranch IC
Mainline Widening construct new WB lane within the
median from proposed Silva Valley IC to proposed Empire
Ranch IC
$2950 $0 $2950 2013
[ 40 ] HigHway 50 corridor system management plan
c h a p t e r s i x p l a n n e d c o r r i d o r s y s t e m m a n a g e m e n t s t r a t e g i e s
tabLe 11 KeY CaPitaL ProjeCtS (ConTInued)
CountyLead agency
route roadway from to Project
Description Programmed
funds
additional funding Needed
total Cost estimate (x $1000)
Comp Year (FFY)
PARALLEL AnD COnnECTInG ROADWAYS
ED ED County DOT
Silva Valley Parkway
Entrada Drive
Future US 50
Silva Valley Parkway iC
Widen Silva Valley Road from 2 lanes to 4 lanes includes
Class ii bike lanes and left turn storage pockets
$2921 $0 $2921 2010
ED ED County DOT
Silva Valley Parkway US 50
US50 Silva Valley Parkway (Phase 2) Includes constructshying overcrossing and ramps
signalization at EB and WB on off ramps
$57817 $0 $57817 2016
ED ED County DOT
Headington Road
Missouri Flat Road
El Dorado Road
Extend 2 lanes with median $9878 $0 $9878 2012
ED ED County DOT
Durock Road
Robin Lane South
Shingle Road
Extend 2 lanes with median $1239 $9214 $10453 2015
ED ED County DOT
Durock Road
Business Center Drive intersection signalization
includes adding turn pockets on Durock Road
$4333 $0 $4333 2009
ED City of Placerville
Point View Drive Broadway Smith Flat
Road Extend 2 lanes $1300 $0 $1300 2020
ED City of Placerville
western Placerville
US 50 interchange
Forni Road Ray Lawyer
Drive
Placerville Drive
Interchange Reconstruction convert Ray Lawyer Dr
Overcrossing to full IC Auxiliary Lanes
$5059 $34741 $39800 2020
Sacramento City of Rancho
Cordova
Mather Boulevard
Rockingham Road
Zinfandel Drive widen to 4 lanes $0 $8617 $8617 2020
Sacramento Rancho Cordova
Parkway ii
Grant Line Road
White Rock Road
New 6-lane expressway includshying intersection improvements at Kiefer Blvd amp White Rock
Road
$0 $44518 $44518 2020
Sacramento City of Folsom
Scott Road US 50 White Rock Rd
widen from 2 to 6 lanes $16000 $0 $16000 2020
Sacramento Sacramento County DOT
White Rock Road
Grant Line Rd
Prairie City Rd
Widen from 2 to 4 lanes realign near Nike and Nimbus Roads and connect with existshying alignment west of Prairie City Rd Realign Grant Line Rd to intersect with realigned
White Rock Rd
$26600 $0 $26600 2020
Sacramento Sacramento County DOT
Hazel avenue
US 50 Hazel Madison
Widen American River Bridge and approaches from 4 to 6 lanes Widen Hazel Avenue from AR Bridge to Madison from 4 to 6 lanes with Bike
LanesSignals
$83530 $0 $83530 2020
HigHway 50 corridor system management plan [ 41 ]
c h a p t e r s i x p l a n n e d c o r r i d o r s y s t e m m a n a g e m e n t s t r a t e g i e s
tabLe 11 KeY CaPitaL ProjeCtS (ConTInued)
CountyLead agency
route roadway from to Project
Description Programmed
funds
additional funding Needed
total Cost Estimate (x $1000)
Comp Year (FFY)
PARALLEL AnD COnnECTInG ROADWAYS
ED ED County DOT
green Valley Road
Salmon Falls Road
east
Deer Valley Road
widen from 2 to 4 lanes $0 $14576 $14576 2025
ED ED County DOT
green Valley Road
Deer Valley Road east Lotus Road widen $958 $4513 $5471 2015
ED ED County DOT
green Valley Road
Francisco Drive
Salmon Falls Road
widen from 2 to 4 lanes divided $412 $3491 $3903 2015
ED ED County DOT
Latrobe Road
investment Boulevard
golden Foothill Parkway
widen from 2 lanes undivided to 4 lanes
divided $1076 $8792 $9868 2015
ED ED County DOT
Latrobe Road
Carson Creek
White Rock Road
widen from 4 to 6 lanes $0 $23755 $23755 2025
ED ED County DOT
white Rock Road
EDSac County Line
Manchester Drive
widen 2 to 4 lanes divided includes signal interconnect and coorshy
dination
$0 $23755 $23755 2025
Sacramento City of Rancho
Cordova
Easton Valley
Parkway
Prairie City Road
Empire Ranch Road extenshysion south of
US 50
Construct new 4 lane road $0 $45000 $45000 2020
Sacramento Sacramento County DOT
Hazel avenue
Easton Valley
Parkway
Grant Line RoadWhite Rock Road
New road extension 4 lane limited access
through aerojet property $0 $18000 $18000 2018
Sacramento Sacramento County DOT
white Rock Road
Prairie City Road
ED County Line
widen to 4 lanes $8330 $64773 $73103 2018
Sacramento Sacramento County DOT
green Valley Road
East Natoma Sacramento ED County
line widen to 4 lanes $0 $3000 $3000 2018
Sacramento City of Rancho
Cordova
Zinfandel Drive
international Drive
Folsom Boulevard
widen to 4 lanes $0 $12000 $12000 2020
[ 42 ] HigHway 50 corridor system management plan
c h a p t e r s i x p l a n n e d c o r r i d o r s y s t e m m a n a g e m e n t s t r a t e g i e s
tabLe 11 KeY CaPitaL ProjeCtS (ConTInued)
CountyLead agency
route roadway from to Project
Description
Pro-grammed
funds
addi-tional
funding Needed
total Cost estimate (x $1000)
Comp Year (FFY)
traNSit
yolo amp Sacramento City of west Sacramento
amp City of Sacramento
Sacramento River
Crossing
15th Street in the City
of west Sacramento
Broadway in the City of
Sacramento
New all-modal river crossing (Auto Transit Bike amp Pedestrian)
from Sacramento across the Sacramento River to West
Sacramento The crossing was modeled between Broadway in Sacramento amp 15th Street in
West Sacramento but final alignshyment options will be studied in subsequent planning efforts
$800 $99200 $100000 2019
Sacramento Cal State University
Sacramento
CSUS Campus mdash mdash
Sac State Tram adjoining City streets and SRTD 65th Street light railbus transfer station Bus Rapid Transit System
$23574 $0 $23574 2013
Sacramento City of Rancho
Cordova
Rancho Cordova Various Various
New Service Rancho Cordova Pilot Transit Shuttle System new transit service for connection to
RTs Gold Line
$2380 $1500 $38880 2014
yolo amp Sacramento City of west Sacramento
TBD west
Sacramento Sacramento Streetcar Service between west
Sacramento and Downtown Sacramento
$17400 $54700 $72100 2014
Sacramento City of Rancho
Cordova RT Gold Line
RT Gold Line Tracks
Mather Field Road
Light Rail Grade Separations $0 $52888 $52888 2025
Sacramento City of Rancho
Cordova RT Gold Line
RT Gold Line Tracks Zinfandel Drive Light Rail Grade Separations $0 $52888 $52888 2025
Sacramento City of Rancho
Cordova RT Gold Line
RT Gold Line Tracks
Bradshaw Road
Light Rail Grade Separations $0 $35260 $35260 2025
Sacramento City of Rancho
Cordova RT Gold Line
RT Gold Line Tracks Routier Road Light Rail Grade Separations $0 $35260 $35260 2025
Sacramento City of
Sacramento Sacramento Valley Station
Sacramento intermodal Transportation Facility (Phase 1) - Develop intermodal transportashytion terminal for heavy rail light
rail and bus service
$77799 $0 $77799 2010
Sacramento City of
Sacramento Sacramento Valley Station
Sacramento intermodal Transportation Facility (Phase 2) - Develop intermodal transportashytion terminal for heavy rail light
rail and bus service
$24101 $1000 $25101 2014
HigHway 50 corridor system management plan [ 43 ]
c h a p t e r s i x p l a n n e d c o r r i d o r s y s t e m m a n a g e m e n t s t r a t e g i e s
TABLE 11 KEY CAPITAL PROJECTS (CONTINUED)
CountyLead Agency
Route Roadway From To Project
Description Programmed
Funds
Additional Funding Needed
Total Cost Es-timate (x $1000)
Comp Year (FFY)
BICYCLE ROUTES
Sacramento City of Rancho
Cordova
US 50Mather Field Road IC US 50 Mather
Field Road
US 50Mather Field Road PedestrianBike Crossing along
the Mather Airport RR Spur alignment
$0 $820 $1055 2015
ED ED County DOT
Sacramento Placerville
Transportation Corridor
Forni Rd
Missouri Flat Rd Class I Bike Trail $1423 $111 $1534 2009
ED City of Placerville
El Dorado Trail Western
Extension
Canal Street Main Street
Ray Lawyer DriveForni
Road Class 1 Bike Trail $1850 $0 $1850 2010
ED ED County DOT
US 50ED Hills Blvd IC US 50
El Dorado Hills Blvd
Latrobe Road
US 50El Dorado Hills Blvd Pedestrian Overcrossing $5508 $66 $5574 2014
TABLE 12 50 MOBILITY PARTNERSHIP KEY CAPITAL PROJECTS
RouteRoadway From To Project Description
NEAR TERM PRIORITY IMPROVEMENT PROJECTS
US 50 Sunrise Scott Road Auxiliary Lane
US 50 Hazel Avenue Interchange Improvements
Hazel Avenue Folsom Boulevard Easton Valley Parkway New 4 Lane Road
Easton Valley Parkway Hazel Avenue Rancho Cordova Parkway New 6 Lane Road
Rancho Cordova Parkway Easton Valley Parkway White Rock Road New 4 Lane Road
White Rock Road Sunrise Boulevard Silva Valley Parkway Widen to 4 Lanes
RT Gold Line Hazel Iron Point Station Passing Tracks
US 50 Rancho Cordova Parkway New Interchange
Zinfandel Drive South of International Douglas Road New 4 Lane Road
International Drive Kilgore Road Rancho Cordova Parkway New 6 Lane Road
Douglas Road Zinfandel Extension Sunrise Boulevard Widen to 4 Lanes
Sunrise LRT Citrus Road Sunrise Mall Bus Rapid TransitExpress Bus
[ 44 ] HIGHWAY 50 corridor system management plan
c h a p t e r s i x p l a n n e d c o r r i d o r s y s t e m m a n a g e m e n t s t r a t e g i e s
TABLE 12 50 mOBILITY PARTnERSHIP kEY CAPITAL PROjECTS (COnTInUED)
routeroadway from to Project Description
US 50 nEAR TERm PRIORITY ImPROVEmEnT PROjECTS
US 50 Empire Ranch Road New interchange
US 50 Silva Valley New interchange
US 50 Scott Road Empire Ranch Road Aux Lanes
US 50 Empire Ranch Road El Dorado Hills Boulevard Aux lanes and climbing lanes
US 50 El Dorado Hills Boulevard Silva Valley Parkway Aux lanes and climbing lanes
US 50 Silva Valley Parkway Bass Lake Road Aux lanes
Sunrise Boulevard White Rock Road Douglas Boulevard widen to 6 lanes
Sunrise Boulevard Douglas Boulevard Jackson Road widen to 4 lanes
White Rock Road Sunrise Boulevard Future Rancho Cordova Parkway and El Dorado County Line to Latrobe Road
widen to 4 lanes
Douglas Boulevard Sunrise Boulevard Grant Line Road widen to 4 lanes
Rancho Cordova Parkway Douglas Boulevard Rio del Oro Parkway New 2 lane road
Rancho Cordova Parkway Rio del Oro Parkway White Rock Road New 6 lane road
Jaeger Road Douglas Road Kiefer Boulevard New 4 lane road
Chrysanthy Sunrise Boulevard Americanos Boulevard New 4 lane road
Kiefer Boulevard Sunrise Boulevard Jaeger Road New 4 lane road
Grant Line Road Douglas Road Chrysanthy Road widen to 4 lanes
Hazel avenue Gold Country Boulevard Madison avenue widen to 6 lanes
Latrobe Road South of White Rock Road widen to 4 lanes
TABLE 13 VISIOnARY PROjECTS
County routeroadway from to Project Description
Sac yolo US 50 Enterprise Downtown Sacramento HOV Lanes
ED TBD Folsom Placerville Transit ndash Type TBD
ED New Road Latrobe Road White Rock Road (poten shy
tially US 50) New 2-lane road
HigHway 50 corridor system management plan [ 45 ]
c h a p t e r s i x p l a n n e d c o r r i d o r s y s t e m m a n a g e m e n t s t r a t e g i e s
[ 46 ] HigHway 50 corridor system management plan
Page Inte
ntionally
Left
Blank
congestion and bottleneck analysis
chapter seven
The 2000 Highway Capacity Manual defines a bottleneck
as ldquoa road element on which demand exceeds capacityrdquo
The bottleneck analysis evaluates specific causes of existshying recurrent traffic congestion in the corridor Freeway bottleneck locations that create mobility constraints are identified and documented and their relative contribution
to corridor-wide congestion is reported The bottleneck locations were determined based on a combination of the use of 2006 PeMS data HiCOMP report probe vehicle tach runs and field observations
Traffic congestion can be categorized as either recurrent
or non-recurrent
recurrent congestion occurs repeatedly at the same place and time of day in a predictable pattern Recurrent congesshytion is often associated with facility capacity limitations changes in capacity conflicting vehicle movements such
as lane merges inadequate number of transit vehicles to handle passenger loads or other persistent physical condishytions of the transportation facility
Non-recurrent congestion is usually attributed to collishysions equipment malfunction community events weather construction projects and other occasional occurrences When transportation systems are close to their maximum
carrying capacity non-recurrent congestion is more likely to occur as there is little excess capacity in the system
The location and extent of the bottlenecks on US 50 found
in the aM and PM peak periods are summarized in Tables 14 and 15 These depictions should be considered a snapshyshot view and not a comprehensive analysis of all bottleshynecks in the corridor Further work is being conducted to
refine the identification and causality of bottlenecks within
the corridor Table 14 shows a summary of the US 50 eastbound bottlenecks while the tables that follow discuss each bottleneck including location and possible causality Table 15 shows a summary of the US 50 westbound bottleshynecks while the tables that follow discuss each bottleneck including location and possible causality Minor or hidden bottlenecks are those Freeway bottleneck
that are not as defined locations that create (or severe) as the major mobility constraints bottlenecks Please note are identified and that the graphics accomshy documented and their panying the bottlenecks
relative contribution to are not to scale
corridor-wide congestion Major bottlenecks in the is reported eastbound direction during the aM peak period are at Howe avenue and during the PM peak period are at 48th Street Howe Avenue Mayhew Road Routier Road Sunrise Boulevard and El Dorado Hills Boulevard Major bottlenecks in the westbound direction during the aM peak period are at El Dorado Hills Boulevard Hazel Avenue Zinfandel Drive
HigHway 50 corridor system management plan [ 47 ]
c h a p t e r s e v e n c o n g e s t i o n a n d b o t t l e n e c k a n a l y s i s
Bradshaw Road and Howe Avenue and major bottleneck
locations during the PM peak period are at Zinfandel Drive Routier Road Bradshaw Road Howe Avenue and Intershystate 5
Causalities for these bottlenecks range from high-traffic
demand (congestion) heavy weavingmerging areas or physical constraints such as lane drops lack of ramp meters incomplete HOV network incomplete Auxiliary Lane
network poorly coordinated traffic signals and an off-ramp
queue (Sunrise Boulevard) US 50 Westbound Onramp
TABLE 14 US 50 EASTBOUnD BOTTLEnECk SUmmARY Source PeMS Caltrans tach runs and
Cambridge Systematics field observations
bottleneck Location PeMS Speed Contours Caltrans Probe Vehicle Runs
Cause aM PM aM PM
A Jefferson Blvd PM 25 Minor Minor Traffic weaving truck volumes and grade
B 48th St PM 7 Minor Major Minor Minor Merge from SR 51 and SR 99
C Howe ave PM 9 Major Major Major weave between Howe and watt
D Mayhew Rd PM 12 Major Minor Major Weaving before Bradshaw Exit
E Routier Rd PM 14 Minor Major Weaving before Mather Field Rd Exit
F Sunrise Blvd PM 185 Minor Major Lane drop HOV add off-ramp queue
G Folsom Blvd PM 22 Minor Minor Lane drop 4 to 3
H El Dorado Hills Blvd PM 275 Major
Poorly coordinated traffic signal on arterial causes spillback onto freeway
a jefferson blvd bottleneck The bottleneck approximately located at Jefferson Blvd is due to weaving traffic as those entershying the freeway from Jefferson Blvd must cross those attempting to exit the freeway to I 5 There is a large number of trucks in the stream which struggle with the grade at this location exacerbatshying the bottleneck
[ 48 ] HigHway 50 corridor system management plan
c h a p t e r s e v e n c o n g e s t i o n a n d b o t t l e n e c k a n a l y s i s
b 48th St bottleneck The bottleneck approximately located at 48th St is due to the additional traffic merging from SR 51 and SR 99 combined with the eventual lane drop at 59th St This queue extends upstream past the off-ramp to SR 5199 These off-ramps are bottlenecks in themselves which spill back and choke the US 50 mainline
C Howe Ave Bottleneck The bottleneck at Howe ave is due to the entering traffic from Howe Ave Two Howe Ave on-ramps feed into US 50 eastbound southbound Howe ave loop on-ramp and northbound Howe ave direct ramp approximately 300 feet apart The watt avenue off-ramp is just down stream with heavy exiting volumes therefore the segment between Howe and watt is characterized by heavy weaving
D mayhew Rd Bottleneck The bottleneck approximately located at Mayhew Rd most likely begins with the additional traffic entering from Watt Ave and ends with the exiting traffic at Bradshaw Rd It is possible that there is a high proportion of weaving traffic with in this section (Watt Ave traffic moving to the left lane and those exiting at Bradshaw Rd moving to the right lane)
HigHway 50 corridor system management plan [ 49 ]
c h a p t e r s e v e n c o n g e s t i o n a n d b o t t l e n e c k a n a l y s i s
[ 50 ] HigHway 50 corridor system management plan
e routier rd bottleneck It is likely that the bottleneck at Routier Rd is due to the same merging conditions associated with Mayhew Rd The area is comprised of both residential and light industrialoffice land uses therefore during the PM peak period there are large volumes of vehicles entering at Bradshaw Rd moving to the left lanes and large volumes of vehicles moving to the right lane to exit at Mather Field Rd
f Sunrise blvd bottleneck At Sunrise Blvd the right-most lane exits while an HOV lane is added as the median lane The bottleneck is formed from vehicles shifting left to avoid exiting at Sunrise Blvd and to enter the HOV lane There is a large volume of vehicles queued at the Sunrise off-ramp which spills back and negatively affects the US 50 mainline
g folsom blvd bottleneck The right-most lane exits to Folsom Blvd leaving one HOV lane and two regular lanes along the US 50 The bottleneck is caused by this lane drop as well as the quick merge at the Folsom on-ramp
c h a p t e r s e v e n c o n g e s t i o n a n d b o t t l e n e c k a n a l y s i s
H The eastbound US 50 at El Dorado Hills Blvd Bottleneck The eastbound El Dorado Hills Blvd bottleneck is caused by a traffic signal on the arterial that often causes spillbacks on the EB loop offramp onto the freeway mainlines
TABLE 15 US 50 WESTBOUnD BOTTLEnECk SUmmARY Source PeMS Caltrans tach runs and Cambridge Systematics field observations
bottleneck Location PeMS Speed Contours Caltrans Probe Vehicle Runs
Cause aM PM aM PM
A El Dorado Hills Blvd PM 275 Major Poorly coordinated traffic
signal on El Dorado Hills Blvd
B Hazel Ave PM 21 Major Entering traffic
C Zinfandel Dr PM 16 Minor Major Major Major Entering traffic
D Routier Rd PM 14 Minor Major Minor Weaving traffic
E Bradshaw PM 13 Major Major Major Merging traffic and curve
F Howe Ave PM 9 Minor Major Major Major Weaving traffic and grade
G SR 51SR 99 PM 6 Minor Lane drop weaving traffic
H i-5 PM 3 Major Weaving traffic
HigHway 50 corridor system management plan [ 51 ]
c h a p t e r s e v e n c o n g e s t i o n a n d b o t t l e n e c k a n a l y s i s
[ 52 ] HigHway 50 corridor system management plan
A El Dorado Hills Blvd Bottleneck The minor bottleneck at El Dorado Hills Boulevard is caused by the traffic signal on El Dorado Hills Blvd that causes spillback on the westbound offramp onto the freeway mainlines
B Hazel Avenue Bottleneck In 2006 the Hazel Ave Bottleneck is caused by the traffic entering at both Hazel Ave and Folsom Blvd (the two on-ramps are separated by about one mile) The bottleneck that would appear at Folsom Blvd combines with the bottleneck at Hazel ave to form a large bottleneck that does not clear until after Hazel ave Sometimes causshying spillbacks as far as Prairies City Road this bottleneck was mitigated in 2007 as part of the GO CALIFORNIA program
C Zinfandel Dr Bottleneck There is heavy traffic coming from Sunrise Blvd but the lane addition immediately after the westbound on-ramp prevents a bottleneck from forming but as traffic flows westward the heavy traffic entering from Zinfandel Dr causes a bottleshyneck here
D Routier Rd Bottleneck The bottleneck at Routier Rd is caused by weaving traffic between Mather Field Rd and Bradshaw Rd This highway segment represents a transition area where vehicles that have been traveling in the left lanes begin to shift to the right lanes to exit while the entering traffic tries to shift to the left lanes
W eav in gLan e Dr o p
c h a p t e r s e v e n c o n g e s t i o n a n d b o t t l e n e c k a n a l y s i s
e bradshaw rd bottleneck The Bradshaw Rd bottleneck is caused by the entering traffic from Bradshaw Road the high truck volumes and the curve west of Bradshaw Two Bradshaw Rd on-ramps feed into US 50 westshybound southbound Bradshaw Rd direct on-ramp and northbound Bradshaw Rd loop on-ramp approximately 400 feet apart
F Howe Ave Bottleneck The Howe ave bottleneck is caused by a grade change and the weaving traffic entering from Howe ave and Hornet Dr competing for the right-most lane with those wanting to exit at 65th Street
G amp H SR 51SR 99 amp I-5 Bottleneck The bottleneck at I 5 is caused by the conflict between entering SR 99 and SR 51 traffic and exiting I-5 traffic as well as the queues formed on the ramps to i-5 which spill back onto US 50 The number of lanes in this section reaches a maximum of 6 and then drops to 4 as two lanes exit at the I-5 freeway This bottleneck is exacershybated during the peak periods when it stretches upstream to the lane drop before SR 99
W ea v in g
Lan e Dr o p
HigHway 50 corridor system management plan [ 53 ]
c h a p t e r f i v e p e r f o r m a n c e m e a s u r e s
Table 6 US 50 PerForManCe MeaSUreS
County location Post Miles
distance (Miles)
average annual daily Traffic1
PerForManCe MeaSUreS
loS1
Total Vehicle Hours of delay2
Total Person Minutes of delay2
Minutes of delay per Vehicle2
Minutes of delay per Person2
Vehicle Travel Time (Minutes)2 distressed
Pavement (lane
Miles)4
reported Col-lision rate
Comparison ()5
reliability6 lost Productivity7
daily Peak Hour3 daily Peak
Hour3 Peak Hour3 Peak Hour3 Peak Hour3 eastbound westbound lost lane Miles aM
Peak Period
lost lane Miles PM
Peak Period
STaTe HigHway SySTeM
yOL interstate 80 to yolo Sacramento County Line
000 to 316 316 180000 F 1169 126 95363 8061 049 046 36 9 26 62 22 01 0
SaC
yoloSacramento County Line to State Routes 99
and 51
L000 to L248 R000
248 253000 F 4993 653 407455 41746 186 175 43 7 20 64 60 53 76
State Routes 99 and 51 to watt avenue
R000 to R534 534 225000 F 10097 1362 823883 87105 397 372 93 15 24 60 48 81 68
watt avenue to Zinfandel Drive
R534 to R1092 558 187000 F 8075 977 658886 62506 351 329 91 19 -32 56 42 44 23
Zinfandel Drive to Sunrise Boulevard
R1092 to 1250 158 149000 E 1271 197 103727 12610 088 082 25 9 -33 46 13 0 16
Sunrise Boulevard to Folsom Boulevard
1250 to 1701 451 125000 E 3087 356 251940 25832 180 149 63 5 -14 60 46 1 45
Folsom Boulevard to SacramentoEl Dorado
County Line
1701 to 2314 613 95000 D 583 122 47537 8867 083 069 70 0 -11 19 55 0 08
ED
SacramentoEl Dorado County Line to Cameron
Park Dr
000 to R657 657 70000 E 504 126 41150 9138 110 091 77 1 -35 PeMS Data
Unavailable PeMS Data Unavailable
PeMS Data Unavailable
PeMS Data Unavailable
Cameron Park Drive to Missouri Flat Road
R657 to R1506 849 62000 E 302 75 24633 4827 079 075 93 2 -61 PeMS Data
Unavailable PeMS Data Unavailable
PeMS Data Unavailable
PeMS Data Unavailable
Missouri Flat Road to End of Freeway in Placerville
R1506 to 1725 219 59000 D 66 16 5376 1053 020 019 24 1 20 PeMS Data
Unavailable PeMS Data Unavailable
PeMS Data Unavailable
PeMS Data Unavailable
End of Freeway in Placerville to Bedford avenue
1725 to 1811 086 52000 D 68 17 5585 1094 021 020 15 2 81 PeMS Data
Unavailable PeMS Data Unavailable
PeMS Data Unavailable
PeMS Data Unavailable
Bedford avenue to Cedar grove Road
1811 to R2595 784 38500 D 58 15 4758 932 023 022 85 10 6 PeMS Data
Unavailable PeMS Data Unavailable
PeMS Data Unavailable
PeMS Data Unavailable
TOTaL mdash 5473 mdash mdash 30273 4042 2470293 263771 1587 1449 7150 80 mdash mdash mdash mdash mdash
1 Source Average Annual Daily Traffic and Level of Service (LOS) calculated is based on 2007 Caltrans Traffic Volumes on California State Highways and Highway Capacity Manual and Cambridge Systematics from 2008 Reported LOS is for the typical most congested daily peak travel period 2 Source Delay is the average additional travel time by vehiclespersons traveling under 60 mph Data derived from 2007 HICOMP report SACMET Travel Demand Model PeMSs traffic data and Caltrans District 3 Traffic Operations Probe vehicle Tach runs 3 Peak Hour is during PM 4 Source 2007 Caltrans Division of Maintenance Pavement Summary Report 5 Source 2004 through 2007 Caltrans Traffic Accident Surveillance and Analysis System summary data of the percentage above or below the statewide average for fatal injury and property damage-only collisions on comparable facilities 6 Reliability The Planning Time Index is a measure of the reliability of the travel time on a particular route It is the ratio of the 95th percentile of travel time on a route to the median free-flow travel time This means itrsquos the amount of time a traveler needs to allocate for a route if they want to show up on time 19 out of 20 trips Reliability and Planning Time data was taken from April 2007 The data covered a 24-hour period of time on each Tuesday wednesday and Thursday of that month That data was then aggregated into a single average 24-hour day it was then analyzed to determine the highest average aM and PM travel time That time was then compared to the best possible average travel time to determine the additional time that was spent traveling the same seg-ment 7 Lost Productivity Data taken April 2007 PeMS As traffic increases to the capacity of the highway speeds decline throughput drops dramatically and the efficiency of the highway to provide mobility decreases This decline in the potential carrying-capacity of the freeway is expressed in terms of how many equivalent lane miles of roadway are lost
HigHway 50 corridor system management plans [ 29 ]
c h a p t e r f i v e p e r f o r m a n c e m e a s u r e s
Table 7 Parallel and ConneCTing roadwayS PerForManCe MeaSUreS
County location average
daily Traffic1
PerForManCe MeaSUreS
loS1
Total Vehicle Hours of delay2
Total Person Minutes of delay2
Minutes of delay per Vehicle2
Minutes of delay per Person2
Vehicle Travel Time (Minutes)2
distressed Pavement
(lane Miles)4
daily Peak Hour3 daily Peak
Hour3 Peak Hour3 Peak Hour3 Peak Hour3
Parallel and ConneCTing roadwayS
yOL west Capitol Enterprise Boulevard to Capitol Mall 13737 No Data
Data is unavailable for these performance measures at this time however will be pursued in the next phase of the CSMP
SaC
w 5th Street to 26th Street 9194 a
X 5th Street to 26th Street 9154 a
Folsom Boulevard watt avenue to Bradshaw Road 25600 C
watt avenue Folsom Boulevard to US 50 63900 F
Bradshaw Road Folsom Boulevard to US 50 22400 a
Folsom Boulevard Bradshaw Road to Sunrise Boulevard 20400 a
Bradshaw Road Old Placerville to US 50 54405 F
Old Placerville Road Bradshaw Road to Rockingham Drive 11864ndash18365 a
Rockingham Drive Old Placerville Road to Mather Boulevard 16516 E
Mather Boulevard Rockingham Drive to Folsom Boulevard 21732 C
international Drive Rockingham Drive to Zinfandel Drive 12808 a
Zinfandel Drive international Drive to Folsom Boulevard 22298ndash47032 BE
white Rock Road Zinfandel Drive to Sunrise Boulevard 25459 a
Sunrise Boulevard US 50 to Folsom Boulevard No Data No Data
white Rock Road Sunrise Boulevard to Prairie City Road 3400 B
Folsom Boulevard Sunrise Boulevard to iron Point Road 17200 a
white Rock Road grant Line Road to EDSaC County Line 6700 D
iron Point Road Folsom Boulevard to East BidwellScott Road 13984 No Data
Scott Road iron Point Road to white Rock Road No Data No Data
Folsom Boulevard iron Point Road to Blue Ravine Road No Data No Data
Blue Ravine Road Folsom Boulevard to green Valley Road No Data No Data
Prairie City Road US 50 to white Rock Road 6000 D
HigHway 50 corridor system management plans [ 30 ]
c h a p t e r f i v e p e r f o r m a n c e m e a s u r e s
Table 7 Parallel and ConneCTing roadwayS PerForManCe MeaSUreS (ConTinUed)
County location average
daily Traffic1
PerForManCe MeaSUreS
loS1
Total Vehicle Hours of delay2
Total Person Minutes of delay2
Minutes of delay per Vehicle2
Minutes of delay per Person2
Vehicle Travel Time (Minutes)2
distressed Pavement
(lane Miles)4
daily Peak Hour3 daily Peak
Hour3 Peak Hour3 Peak Hour3 Peak Hour3
Parallel and ConneCTing roadwayS
ED
green Valley Road EDSaC County Line to Francisco Drive 22600 D
Data is unavailable for these performance measures at this time however will be pursued in the next phase of the CSMP
green Valley Road Francisco Drive to Silva Valley Parkway 13077 D
green Valley Road Silva Valley Parkway to Cameron Park 9849 C
green Valley Road Cameron Park Drive to Deer Valley Road 5278 C
green Valley Road Deer Valley Road (East) to Lotus Road 8381 D
green Valley Road Lotus Road to Placerville Drive 4669 C
Latrobe Road white Rock Road to US 50 24742 C
Durock Road Cameron Park Dr to South Shingle Road 7278 C
Cameron Park Drive Durock Road to US 50 (Durock Road to Coach Lane Coach Lane to US 50) 9544 26603 CD
South Shingle Road Durock Road to US 50 11390 D
white Rock Road EDSaC County Line to Latrobe 12808 D
white Rock Road Latrobe Rd to Silva Valley Pkwy (Latrobe to PostPost to Silva Vlly Pkwy) 10124 CD
Silva Valley Parkway white Rock Rd to Serrano Pkwy (white Rock to Entrada Entrada to Serrano Pkwy) 13708 9328 DC
Forni Road Placerville Drive to Main Street 9049 8379 No Data
Placerville Drive Forni Road to US 50 No Data No Data
Main Street Placerville Drive to Bedford avenue No Data No Data
Main Street Bedford avenue to Broadway No Data No Data
Broadway Main Street to Point View Drive No Data No Data
1 Source Average Daily Traffic and Level of Service (LOS) calculated are based on City of Sacramento between 2001 and 2007 Sacramento County from 20072008 City of Rancho Cordova between 2004 and 2007 and El Dorado County from 2007
HigHway 50 corridor system management plans [ 31 ]
c h a p t e r f i v e p e r f o r m a n c e m e a s u r e s
Page Inte
ntionally
Left
Blank
[ 32 ] HigHway 50 corridor system management plan
c h a p t e r f i v e p e r f o r m a n c e m e a s u r e s
tabLe 8 traNSit PerforMaNCe MeaSure
County transit Provider route Performance Measure
available daily Capacity ()1 available Peak Hour Capacity1
traNSit
SaC
SacRT (Bus)
Route 21 70 10
Route 28 76 59
Route 36 83 74
Route 38 66 44
Route 72 56 20
Route 73 79 45
Route 74 82 43
Route 109 47 22
SacRT (Light Rail) Gold Line 31 Exceeds Capacity
EDSAC ED County Transit Authority
Commuter Express Bus Service Not applicablendashOperates Peak Hour
Only 405
iron Point Connector 764 Not available
Reverse Commuter Not applicablendashOperates Peak Hour Only 982
yoloSaC yolo County Transit District Not applicablendashOperates Peak Hour Only 498
biKe3
1 Source average Daily and Peak Hour available Capacity calculated from each transit providerrsquos route ridership data 2 The Reverse Commuter service is offered on vehicles that are returning to El Dorado County (Commuter Express Buses) 3 Bicycle performance measure(s) will be identified applied and included in the subsequent CSMPs
HigHway 50 corridor system management plan [ 33 ]
c h a p t e r f i v e p e r f o r m a n c e m e a s u r e s
[ 34 ] HigHway 50 corridor system management plan
Page Inte
ntionally
Left
Blank
planned corridor system management strategies
chapter six
ConCept LoS and ConCept FaCiLit y ldquoConcept LOSrdquo and ldquoConcept Facilityrdquo have traditionally been used in Caltrans TCCRs to reflect the minimum level or quality of operations acceptable for each route segment within the 20-year planning period and the highway facility needed in the next 20 years to maintain the Concept LOS
Typical Concept LOS standards in Caltrans District 3 are LOS ldquoDrdquo in rural areas and LOS ldquoErdquo in urban areas how-ever some heavily congested route segments now have a Concept LOS ldquoFrdquo because the improvements required to bring the LOS to ldquoErdquo are not feasible due to environmental right of way financial and other constraints The applica-tion of multi-modal corridor management strategies should reduce the severity and duration of congestion and provide viable travel options and information that will enable a traveler to avoid severe freeway congestion
The Concept LOS and Concept Facility for US 50 are shown in Table 9 almost all US 50 segments are forecasted to operate under LOS ldquoFrdquo conditions in 20 years under the No-Build and Build scenarios
Corridor ManageMent StrategieS The US 50 CSMP also proposes specific strategies to enhance corridor mobility (see Table 10) based on the fol-lowing principles
bull Manage all modes and facilities in the corridor as a single system beginning with the transportation net-work defined in this CSMP
bull Implement comprehensive and dynamic multimodal monitoring and reporting for the system and for all modes
bull Develop and use micro-simulation modeling to identify mobility challenges and to evaluate proposed solutions
bull Complete the projects included in the regional trans-portation plans with an emphasis on the completion of the key mobility improvement projects identified in this CSMP (see Tables 11 and 12)
bull Implement the specific strategies outlined in this CSMP
Key CapitaL projeCtS Tables 11 and 12 contain key capital projects that have been identified as the most critical to corridor mobility These are also included in the SaCOg MTP for 2035 and are either planned without any funding yet programmed are partially programmed
The US 50 CSMPor are entirely programmed SACOG conducted significant proposes specific
public attitude research strategies to enhance for the MTP for 2035 to corridor mobility complement comprehensive outreach efforts through community workshops the TALL Order Moving the Region Forward event the televised Town Hall Road Map for the Future and associated public polling The results of the SaCOg analyses and public out-reach for the MTP were
highway 50 corridor system management plan [ 35 ]
c h a p t e r s i x p l a n n e d c o r r i d o r s y s t e m m a n a g e m e n t s t r a t e g i e s
[ 36 ] HigHway 50 corridor system management plan
used when selecting the key projects for identification in
the CSMP and to ensure consistency Not all corridor projshyects in the MTP are included in the CSMP since the CSMP focuses on the managed network and the SaCOg MTP considers all streets and roads bike routes and transit services in the corridor
highway 50 partnership The Highway 50 Partnership is a cooperative public-private effort among the County of Sacramento City of Rancho
Cordova City of Folsom County of El Dorado and several major landowners that recognize the need to consider corrishydor mobility needs holistically
The Partnership has collaborated effectively to develop a Plan to improve mobility in the US 50 Corridor from Rancho
Cordova to El Dorado Hills an area identified as approprishyate for growth in the SACOG Blueprint Recognizing the
need to generate private investment the Partnership is seeking to implement a regional Highway 50 Corridor fee program to fund these projects
in addition to the key projects indicated in Table 11 Table 12 displays the key projects identified by the
Partnership
These projects include (1) Near-Term Priority Improvement Projects and (2) Near-Term Expected Roadway Improveshyments
The Near-term Priority improvement Projects would proshyvide several new roadway connections for people to travel within and through the area to avoid congestion They also include new transit routes and widening existing roadways
viewed by the Partnership as a package that would provide system-wide travel benefits These improvements targeted
for completion through 2012 would reduce vehicle hours of delay during commute hours by 30 percent
The near-Term Expected Roadway Improvements are conshysidered by the Partnership to be readily expected since they are tied to expected development or are part of a near-term
capital improvements program
Visionary projects Visionary projects are not yet included in the SaCOg MTP or EDCTC RTP but appear to offer considerable corridor mobilshyity benefits and merit further analysis and consideration for inclusion in the next MTP and RTP These are displayed in
Table 13
The ldquoPlus 10 Listrdquo in the SACOG MTP identifies projects
that are attractive from a performance standpoint but could not be included in the Final Project Lists because of financial constraint The ldquoPlus 10 Listrdquo element offers the
opportunity to include projects that would not be affordshyable without additional funding Some projects identified in
the Visionary Projects List were analyzed by SACOG during
development of the current MTP Some of these are included in the ldquoPlus 10 Listrdquo
Watt Avenue Light Rail Station Improvement Project
c h a p t e r s i x p l a n n e d c o r r i d o r s y s t e m m a n a g e m e n t s t r a t e g i e s
Table 9 US 50 ConCePT loS and FaCiliTy TyPe
location Forecasted level of Service1 (loS) and Facility Type
County description and location From Post Mile To Post Mile Current
loS1 20-year no build loS12
20-year build loS12
20-year Concept
loS13 existing Facility4 Concept Facility456 Ultimate Facility457
yOL interstate 80 to yoloSacramento County Line
000 316 F F F F 8F (6F between Jefferson Blvd ramps)
8F+2HOV+aux Lanes 8F+2HOV+aux Lanes
SaC yoloSacramento County Line to SR 99 and 51
L000 L248 = R000 F F F F 8F 8F+2HOV+aux Lanes 8F+2HOV+aux Lanes
SaC State Routes 99 and 51 to watt avenue R000 R534 F F F F 8F 8F+2HOV+aux Lanes 8F+2HOV+aux Lanes
SaC watt avenue to Zinfandel Drive R534 R1092 F F F F 8F 8F+2HOV+aux Lanes 8F+2HOV+aux Lanes
SaC Zinfandel Drive to Sunrise Boulevard R1092 1250 E F F F 8F 8F+2HOV+aux Lanes 8F+2HOV+aux Lanes
SaC Sunrise Boulevard to Folsom Boulevard 1250 1701 E F F F 6F+2HOV to Hazel ave 4F+2HOV
to Folsom Blvd
6F+2HOV+aux Lanes to Hazel ave 4F+2HOV+aux
Lanes to Folsom Blvd
8F+2HOV+aux Lanes
SaC Folsom Boulevard to SaCED County Line 1701 2314 D F F F 4F+2HOV 4F+2HOV+aux Lanes 6F+2HOV+aux Lanes
ED SacramentoEl Dorado County Line to Cameron Park Drive
000 R657 E F F F 4F 4F+2HOV+aux Lanes 6F+2HOV+aux Lanes
ED Cameron Park Drive to Missouri Flat Road R657 R1506 E F E E 4F 4F+2HOV+aux Lanes to greenstone 4F+aux Lanes
to Missouri Flat
6F+2HOV+aux Lanes to greenstone 4F+2HOV+aux Lanes
to Missouri Flat
ED Missouri Flat Road to End of Freeway in Placerville
R1506 1725 D F F F 4F 4F+aux Lanes 4F+aux Lanes
ED End of Freeway in Placerville to Bedford avenue
1725 1811 D E E E 4E 4E 4E
ED Bedford avenue to Cedar grove Exit 1811 R2595 D F F F 4F to Smith Flat 4E to Camino 4F+aux Lanes to Smith Flat 4E to Camino
4F+aux Lanes
1 Level of Service (LOS) A ldquoreport cardrdquo for evaluating traffic flow with ldquoArdquo being the best and ldquoFrdquo being the worst 2 20-year LOS (No Build) The LOS that would be expected at 20 years with no improvements 3 20-year Concept LOS The minimum acceptable LOS over the next 20 years 4 Facility Type Codes C=Conventional Highway E=Expressway F=Freeway HOV=High Occupancy Vehicle Lanes aux=auxiliary Lanes 5 Operational improvements are included in future facilities for all segments Examples of operational improvements include TOS improvements and auxiliary lanes 6 Concept Facility the future roadway with improvements needed in the next 20 years if LOS ldquoFrdquo no further degradation of service from existing ldquoFrdquo is acceptable as indicated by delay performance measurement 7 Ultimate Facility The future roadway with improvements needed beyond a 20 year timeframe
HigHway 50 corridor system management plans [ 37 ]
c h a p t e r f i v e p e r f o r m a n c e m e a s u r e s
Table 10 US 50 CSMP STraTegieS
Strategy description implementation Challenges
Maintain and operate the existing corridor multi-modal trans-
portation infrastructure
Maintain the existing investment in all modes of the transportation system and provide adequate resources for daily operations including operating
revenues for transit services
Funding availability funding competition within the region
Fully coordinate the delivery of transportation services and facili-ties in the corridor including daily operations and system planning
for enhancements
Interagency operational coordination to maximize the efficiency and effec-tiveness of all modes operating in the corridor with a focus on the CSMP transportation network defined in this CSMP Use of an existing group or
committee to provide initial oversight for this strategy
Diverse interests and competing priorities and limited resources
Construct planned and pro-grammed corridor capital improve-
ment projects
implementation of the capital improvements in the corridor included within the approved Metropolitan Transportation Plan and Regional Transportation
Plan for all transportation modes within the scope schedule and cost specified
Funding availability funding competition within the region
Comprehensive daily monitoring of the status of all modes providing service on the CSMP transporta-
tion network
Full deployment of multimodal transportation service status detection systems for all CSMP network components
Funding availability funding competition within region
Provide traveler information to the public
Provide the public with real-time easily accessible information regarding the status of all CSMP transportation system components so as to allow travel-
ers to make informed decisions about trip mode time and routing options
Funding availability funding competition within region
Continually monitor and analyze the CSMP transportation network to improve system performance
Monitor transportation performance measures and make system modifica-tions as appropriate on a frequent and timely basis Staff resources and data availability
Decrease the duration of non-recurrent traffic congestion
Expand and enhance the Freeway Service Patrol to respond to automobile accidents and vehicle break-downs
Funding availability funding competition within the region
Timely implementation of STaRNET
Expedite the implementation of the STaRNET operators of transportation facilities and emergency responders in the Sacramento region through real-time sharing of data and live video refinement of joint procedures
pertaining to the operation of roadways and public transit and public safety activities as well as enhance the regionrsquos 511 web site and interactive
telephone service to provide more traveler information
Developmental time acceptance by agencies and integration into daily use and identifica-
tion of maintenance and operations funding
Enhance transit and rail service increase transit service frequency provide express transit services imple-
ment bus rapid transit routes reduce headways for light rail and buses and construct planned light rail line extensions
Funding availability funding competition within the region
Complete Bus Carpool lane network
Complete the regional buscarpool lane network including freeway-to-freeway HOV lane connectors
Funding availability funding competition within the region Public agency and public
acceptance of network
[ 38 ] HigHway 50 corridor system management plan
c h a p t e r s i x p l a n n e d c o r r i d o r s y s t e m m a n a g e m e n t s t r a t e g i e s
tabLe 10 uS 50 CSMP StrategieS (ConTInued)
Strategy Description implementation Challenges
Enhance Transportation Demand Management strategies
Encourage employers to provide telecommuting and flexible working hour options to employees
acceptance by employers and resources to participate
Optimize the timing and synchronishyzation of traffic signals
Coordinate the optimization and timing of traffic signals on freeway ramps and along parallel and connecting roadways within and between jurisdicshytions to improve traffic flow and reduce congestion Provide signal priority
systems for transit vehicles
Funding availability and coordination among cities counties and Caltrans
improve access management of freeways and parallel connecting roadways
Develop and implement access management strategies to maintain the operational efficiency of freeways and parallelconnecting roadways
agreement between responsible jurisdicshytions as to where increased access control is needed increased access control on some parallelconnecting roadways may increase
traffic volumes on non-corridor roads
Develop innovative use of CMSs (eg travel times)
Potential uses of CMSs to improve system efficiency include the use of CMSs along portions of all corridors near transit station to indicate travel
times based on real-time existing traffic conditions on the freeway as well as on parallel roadways and express bus and light rail services CMS can also be used to identify the number of parking spaces that are still available at
the light-rail stations
Funding availability funding competition within the region
Implement amp expand Transit AVLTransit status information
enhancements for system users
Expand the use of AVL systems utilizing GPS technology to track in real-time the location of transit vehicles monitor transit schedules dispatch transit vehicles and provide real-time passenger information such as ldquonext busrdquo or
ldquonext trainrdquo arrival times
Funding availability funding competition within region
Expand Park-and-Ride lots at key locations
Add additional capacity to existing park-and-ride lots near transit stations and other locations that are approaching capacity
Funding availability funding competition within the region and available land
improve bike-pedestrian access in the CSMP
transportation network
Plan and program for construction of additional bicycle paths lanes and related improvements for access and connectivity to transit park and ride
lots and destination points
Funding availability funding competition within the region
Provide ldquoBike-SharingrdquordquoCar-Sharingrdquo tofrom transit (ldquoCarlinkrdquo) and from
neighborhoods
Expand the Regional Rideshare and Spare-the-Air programs to include bicycle and car sharing opportunities
Funding availability and coordination between SaCOg TMa air Districts employers developshyers property managers and local government
officials
Provide parking management stratshyegies in interested jurisdictions where applicable to discourage
use of single-occupant vehicles
in higher-density areas provide preferential parking for carpools and vanshypools require residential parking permits remove on-street parking and or provide graduated parking fees for metered on-street parking based on
vehicle type and time of day for SOV spaces to encourage transit use
Acceptance by businesses local officials and the general public
Expand bicycle commute amp transit fare strategiessubsidies
increase participation by large employers in programs that subsidize transit fares for employees during peak-hour commute times and provide bicycling
to work incentives
Voluntary participation by large employers to pay subsidy to transit providers
HigHway 50 corridor system management plan [ 39 ]
c h a p t e r s i x p l a n n e d c o r r i d o r s y s t e m m a n a g e m e n t s t r a t e g i e s
tabLe 11 KeY CaPitaL ProjeCtS
CountyLead agency
route roadway from to Project
Description Programmed
funds
additional funding Needed
total Cost estimate (x $1000)
Comp Year (FFY)
uS 50
Sacramento Caltrans District 3
US 50 Downtown watt avenue HOV Lanes $0 $75000 $75000 2020
Sacramento Caltrans District 3
US 50 watt avenue Sunrise Blvd HOV Lanes $165000 $0 $165000 2013
Sacramento Caltrans District 3
US 50 Bradshaw Road
Mather Field Road
Eastbound and Westbound Auxiliary Lanes
$0 $3700 $3700 2016
Sacramento Caltrans District 3
US 50 State Route 99
(Oak Park Interchange) interchange improvements including buscarpool lane
connectors $0 $150000 $150000 2014
Sacramento Caltrans District 3
US 50 interstate 5
(Riverfront Interchange) Riverfront Interchange
improvements including bus carpool lane connectors
$30000 $170000 $200000 2016
ED Caltrans District 3 US 50 Camino
Operational Safety improvements Construct an
undercrossing median barrier modify local road connections andor associated operational improvements on and adjacent
to US 50
$15000 $0 $15000 2012
ED ED County DOT US 50
west of Latrobe Road
west of Bass Lake
grade HOV Lanes (Ph1) $47141 $0 $47141 2010
ED Caltrans District 3 US 50
west of Bass Lake Road
Ponderosa Road
HOV Lanes (Ph2) $55000 $0 $55000 2011
ED Caltrans District 3 US 50 Ponderosa
Road greenstone
Road HOV Lanes (Ph3) $22357 $0 $22357 2013
ED ED County DOT US 50 Future Silva
Valley iC
Future Empire Ranch IC
Mainline Widening construct new WB lane within the
median from proposed Silva Valley IC to proposed Empire
Ranch IC
$2950 $0 $2950 2013
[ 40 ] HigHway 50 corridor system management plan
c h a p t e r s i x p l a n n e d c o r r i d o r s y s t e m m a n a g e m e n t s t r a t e g i e s
tabLe 11 KeY CaPitaL ProjeCtS (ConTInued)
CountyLead agency
route roadway from to Project
Description Programmed
funds
additional funding Needed
total Cost estimate (x $1000)
Comp Year (FFY)
PARALLEL AnD COnnECTInG ROADWAYS
ED ED County DOT
Silva Valley Parkway
Entrada Drive
Future US 50
Silva Valley Parkway iC
Widen Silva Valley Road from 2 lanes to 4 lanes includes
Class ii bike lanes and left turn storage pockets
$2921 $0 $2921 2010
ED ED County DOT
Silva Valley Parkway US 50
US50 Silva Valley Parkway (Phase 2) Includes constructshying overcrossing and ramps
signalization at EB and WB on off ramps
$57817 $0 $57817 2016
ED ED County DOT
Headington Road
Missouri Flat Road
El Dorado Road
Extend 2 lanes with median $9878 $0 $9878 2012
ED ED County DOT
Durock Road
Robin Lane South
Shingle Road
Extend 2 lanes with median $1239 $9214 $10453 2015
ED ED County DOT
Durock Road
Business Center Drive intersection signalization
includes adding turn pockets on Durock Road
$4333 $0 $4333 2009
ED City of Placerville
Point View Drive Broadway Smith Flat
Road Extend 2 lanes $1300 $0 $1300 2020
ED City of Placerville
western Placerville
US 50 interchange
Forni Road Ray Lawyer
Drive
Placerville Drive
Interchange Reconstruction convert Ray Lawyer Dr
Overcrossing to full IC Auxiliary Lanes
$5059 $34741 $39800 2020
Sacramento City of Rancho
Cordova
Mather Boulevard
Rockingham Road
Zinfandel Drive widen to 4 lanes $0 $8617 $8617 2020
Sacramento Rancho Cordova
Parkway ii
Grant Line Road
White Rock Road
New 6-lane expressway includshying intersection improvements at Kiefer Blvd amp White Rock
Road
$0 $44518 $44518 2020
Sacramento City of Folsom
Scott Road US 50 White Rock Rd
widen from 2 to 6 lanes $16000 $0 $16000 2020
Sacramento Sacramento County DOT
White Rock Road
Grant Line Rd
Prairie City Rd
Widen from 2 to 4 lanes realign near Nike and Nimbus Roads and connect with existshying alignment west of Prairie City Rd Realign Grant Line Rd to intersect with realigned
White Rock Rd
$26600 $0 $26600 2020
Sacramento Sacramento County DOT
Hazel avenue
US 50 Hazel Madison
Widen American River Bridge and approaches from 4 to 6 lanes Widen Hazel Avenue from AR Bridge to Madison from 4 to 6 lanes with Bike
LanesSignals
$83530 $0 $83530 2020
HigHway 50 corridor system management plan [ 41 ]
c h a p t e r s i x p l a n n e d c o r r i d o r s y s t e m m a n a g e m e n t s t r a t e g i e s
tabLe 11 KeY CaPitaL ProjeCtS (ConTInued)
CountyLead agency
route roadway from to Project
Description Programmed
funds
additional funding Needed
total Cost Estimate (x $1000)
Comp Year (FFY)
PARALLEL AnD COnnECTInG ROADWAYS
ED ED County DOT
green Valley Road
Salmon Falls Road
east
Deer Valley Road
widen from 2 to 4 lanes $0 $14576 $14576 2025
ED ED County DOT
green Valley Road
Deer Valley Road east Lotus Road widen $958 $4513 $5471 2015
ED ED County DOT
green Valley Road
Francisco Drive
Salmon Falls Road
widen from 2 to 4 lanes divided $412 $3491 $3903 2015
ED ED County DOT
Latrobe Road
investment Boulevard
golden Foothill Parkway
widen from 2 lanes undivided to 4 lanes
divided $1076 $8792 $9868 2015
ED ED County DOT
Latrobe Road
Carson Creek
White Rock Road
widen from 4 to 6 lanes $0 $23755 $23755 2025
ED ED County DOT
white Rock Road
EDSac County Line
Manchester Drive
widen 2 to 4 lanes divided includes signal interconnect and coorshy
dination
$0 $23755 $23755 2025
Sacramento City of Rancho
Cordova
Easton Valley
Parkway
Prairie City Road
Empire Ranch Road extenshysion south of
US 50
Construct new 4 lane road $0 $45000 $45000 2020
Sacramento Sacramento County DOT
Hazel avenue
Easton Valley
Parkway
Grant Line RoadWhite Rock Road
New road extension 4 lane limited access
through aerojet property $0 $18000 $18000 2018
Sacramento Sacramento County DOT
white Rock Road
Prairie City Road
ED County Line
widen to 4 lanes $8330 $64773 $73103 2018
Sacramento Sacramento County DOT
green Valley Road
East Natoma Sacramento ED County
line widen to 4 lanes $0 $3000 $3000 2018
Sacramento City of Rancho
Cordova
Zinfandel Drive
international Drive
Folsom Boulevard
widen to 4 lanes $0 $12000 $12000 2020
[ 42 ] HigHway 50 corridor system management plan
c h a p t e r s i x p l a n n e d c o r r i d o r s y s t e m m a n a g e m e n t s t r a t e g i e s
tabLe 11 KeY CaPitaL ProjeCtS (ConTInued)
CountyLead agency
route roadway from to Project
Description
Pro-grammed
funds
addi-tional
funding Needed
total Cost estimate (x $1000)
Comp Year (FFY)
traNSit
yolo amp Sacramento City of west Sacramento
amp City of Sacramento
Sacramento River
Crossing
15th Street in the City
of west Sacramento
Broadway in the City of
Sacramento
New all-modal river crossing (Auto Transit Bike amp Pedestrian)
from Sacramento across the Sacramento River to West
Sacramento The crossing was modeled between Broadway in Sacramento amp 15th Street in
West Sacramento but final alignshyment options will be studied in subsequent planning efforts
$800 $99200 $100000 2019
Sacramento Cal State University
Sacramento
CSUS Campus mdash mdash
Sac State Tram adjoining City streets and SRTD 65th Street light railbus transfer station Bus Rapid Transit System
$23574 $0 $23574 2013
Sacramento City of Rancho
Cordova
Rancho Cordova Various Various
New Service Rancho Cordova Pilot Transit Shuttle System new transit service for connection to
RTs Gold Line
$2380 $1500 $38880 2014
yolo amp Sacramento City of west Sacramento
TBD west
Sacramento Sacramento Streetcar Service between west
Sacramento and Downtown Sacramento
$17400 $54700 $72100 2014
Sacramento City of Rancho
Cordova RT Gold Line
RT Gold Line Tracks
Mather Field Road
Light Rail Grade Separations $0 $52888 $52888 2025
Sacramento City of Rancho
Cordova RT Gold Line
RT Gold Line Tracks Zinfandel Drive Light Rail Grade Separations $0 $52888 $52888 2025
Sacramento City of Rancho
Cordova RT Gold Line
RT Gold Line Tracks
Bradshaw Road
Light Rail Grade Separations $0 $35260 $35260 2025
Sacramento City of Rancho
Cordova RT Gold Line
RT Gold Line Tracks Routier Road Light Rail Grade Separations $0 $35260 $35260 2025
Sacramento City of
Sacramento Sacramento Valley Station
Sacramento intermodal Transportation Facility (Phase 1) - Develop intermodal transportashytion terminal for heavy rail light
rail and bus service
$77799 $0 $77799 2010
Sacramento City of
Sacramento Sacramento Valley Station
Sacramento intermodal Transportation Facility (Phase 2) - Develop intermodal transportashytion terminal for heavy rail light
rail and bus service
$24101 $1000 $25101 2014
HigHway 50 corridor system management plan [ 43 ]
c h a p t e r s i x p l a n n e d c o r r i d o r s y s t e m m a n a g e m e n t s t r a t e g i e s
TABLE 11 KEY CAPITAL PROJECTS (CONTINUED)
CountyLead Agency
Route Roadway From To Project
Description Programmed
Funds
Additional Funding Needed
Total Cost Es-timate (x $1000)
Comp Year (FFY)
BICYCLE ROUTES
Sacramento City of Rancho
Cordova
US 50Mather Field Road IC US 50 Mather
Field Road
US 50Mather Field Road PedestrianBike Crossing along
the Mather Airport RR Spur alignment
$0 $820 $1055 2015
ED ED County DOT
Sacramento Placerville
Transportation Corridor
Forni Rd
Missouri Flat Rd Class I Bike Trail $1423 $111 $1534 2009
ED City of Placerville
El Dorado Trail Western
Extension
Canal Street Main Street
Ray Lawyer DriveForni
Road Class 1 Bike Trail $1850 $0 $1850 2010
ED ED County DOT
US 50ED Hills Blvd IC US 50
El Dorado Hills Blvd
Latrobe Road
US 50El Dorado Hills Blvd Pedestrian Overcrossing $5508 $66 $5574 2014
TABLE 12 50 MOBILITY PARTNERSHIP KEY CAPITAL PROJECTS
RouteRoadway From To Project Description
NEAR TERM PRIORITY IMPROVEMENT PROJECTS
US 50 Sunrise Scott Road Auxiliary Lane
US 50 Hazel Avenue Interchange Improvements
Hazel Avenue Folsom Boulevard Easton Valley Parkway New 4 Lane Road
Easton Valley Parkway Hazel Avenue Rancho Cordova Parkway New 6 Lane Road
Rancho Cordova Parkway Easton Valley Parkway White Rock Road New 4 Lane Road
White Rock Road Sunrise Boulevard Silva Valley Parkway Widen to 4 Lanes
RT Gold Line Hazel Iron Point Station Passing Tracks
US 50 Rancho Cordova Parkway New Interchange
Zinfandel Drive South of International Douglas Road New 4 Lane Road
International Drive Kilgore Road Rancho Cordova Parkway New 6 Lane Road
Douglas Road Zinfandel Extension Sunrise Boulevard Widen to 4 Lanes
Sunrise LRT Citrus Road Sunrise Mall Bus Rapid TransitExpress Bus
[ 44 ] HIGHWAY 50 corridor system management plan
c h a p t e r s i x p l a n n e d c o r r i d o r s y s t e m m a n a g e m e n t s t r a t e g i e s
TABLE 12 50 mOBILITY PARTnERSHIP kEY CAPITAL PROjECTS (COnTInUED)
routeroadway from to Project Description
US 50 nEAR TERm PRIORITY ImPROVEmEnT PROjECTS
US 50 Empire Ranch Road New interchange
US 50 Silva Valley New interchange
US 50 Scott Road Empire Ranch Road Aux Lanes
US 50 Empire Ranch Road El Dorado Hills Boulevard Aux lanes and climbing lanes
US 50 El Dorado Hills Boulevard Silva Valley Parkway Aux lanes and climbing lanes
US 50 Silva Valley Parkway Bass Lake Road Aux lanes
Sunrise Boulevard White Rock Road Douglas Boulevard widen to 6 lanes
Sunrise Boulevard Douglas Boulevard Jackson Road widen to 4 lanes
White Rock Road Sunrise Boulevard Future Rancho Cordova Parkway and El Dorado County Line to Latrobe Road
widen to 4 lanes
Douglas Boulevard Sunrise Boulevard Grant Line Road widen to 4 lanes
Rancho Cordova Parkway Douglas Boulevard Rio del Oro Parkway New 2 lane road
Rancho Cordova Parkway Rio del Oro Parkway White Rock Road New 6 lane road
Jaeger Road Douglas Road Kiefer Boulevard New 4 lane road
Chrysanthy Sunrise Boulevard Americanos Boulevard New 4 lane road
Kiefer Boulevard Sunrise Boulevard Jaeger Road New 4 lane road
Grant Line Road Douglas Road Chrysanthy Road widen to 4 lanes
Hazel avenue Gold Country Boulevard Madison avenue widen to 6 lanes
Latrobe Road South of White Rock Road widen to 4 lanes
TABLE 13 VISIOnARY PROjECTS
County routeroadway from to Project Description
Sac yolo US 50 Enterprise Downtown Sacramento HOV Lanes
ED TBD Folsom Placerville Transit ndash Type TBD
ED New Road Latrobe Road White Rock Road (poten shy
tially US 50) New 2-lane road
HigHway 50 corridor system management plan [ 45 ]
c h a p t e r s i x p l a n n e d c o r r i d o r s y s t e m m a n a g e m e n t s t r a t e g i e s
[ 46 ] HigHway 50 corridor system management plan
Page Inte
ntionally
Left
Blank
congestion and bottleneck analysis
chapter seven
The 2000 Highway Capacity Manual defines a bottleneck
as ldquoa road element on which demand exceeds capacityrdquo
The bottleneck analysis evaluates specific causes of existshying recurrent traffic congestion in the corridor Freeway bottleneck locations that create mobility constraints are identified and documented and their relative contribution
to corridor-wide congestion is reported The bottleneck locations were determined based on a combination of the use of 2006 PeMS data HiCOMP report probe vehicle tach runs and field observations
Traffic congestion can be categorized as either recurrent
or non-recurrent
recurrent congestion occurs repeatedly at the same place and time of day in a predictable pattern Recurrent congesshytion is often associated with facility capacity limitations changes in capacity conflicting vehicle movements such
as lane merges inadequate number of transit vehicles to handle passenger loads or other persistent physical condishytions of the transportation facility
Non-recurrent congestion is usually attributed to collishysions equipment malfunction community events weather construction projects and other occasional occurrences When transportation systems are close to their maximum
carrying capacity non-recurrent congestion is more likely to occur as there is little excess capacity in the system
The location and extent of the bottlenecks on US 50 found
in the aM and PM peak periods are summarized in Tables 14 and 15 These depictions should be considered a snapshyshot view and not a comprehensive analysis of all bottleshynecks in the corridor Further work is being conducted to
refine the identification and causality of bottlenecks within
the corridor Table 14 shows a summary of the US 50 eastbound bottlenecks while the tables that follow discuss each bottleneck including location and possible causality Table 15 shows a summary of the US 50 westbound bottleshynecks while the tables that follow discuss each bottleneck including location and possible causality Minor or hidden bottlenecks are those Freeway bottleneck
that are not as defined locations that create (or severe) as the major mobility constraints bottlenecks Please note are identified and that the graphics accomshy documented and their panying the bottlenecks
relative contribution to are not to scale
corridor-wide congestion Major bottlenecks in the is reported eastbound direction during the aM peak period are at Howe avenue and during the PM peak period are at 48th Street Howe Avenue Mayhew Road Routier Road Sunrise Boulevard and El Dorado Hills Boulevard Major bottlenecks in the westbound direction during the aM peak period are at El Dorado Hills Boulevard Hazel Avenue Zinfandel Drive
HigHway 50 corridor system management plan [ 47 ]
c h a p t e r s e v e n c o n g e s t i o n a n d b o t t l e n e c k a n a l y s i s
Bradshaw Road and Howe Avenue and major bottleneck
locations during the PM peak period are at Zinfandel Drive Routier Road Bradshaw Road Howe Avenue and Intershystate 5
Causalities for these bottlenecks range from high-traffic
demand (congestion) heavy weavingmerging areas or physical constraints such as lane drops lack of ramp meters incomplete HOV network incomplete Auxiliary Lane
network poorly coordinated traffic signals and an off-ramp
queue (Sunrise Boulevard) US 50 Westbound Onramp
TABLE 14 US 50 EASTBOUnD BOTTLEnECk SUmmARY Source PeMS Caltrans tach runs and
Cambridge Systematics field observations
bottleneck Location PeMS Speed Contours Caltrans Probe Vehicle Runs
Cause aM PM aM PM
A Jefferson Blvd PM 25 Minor Minor Traffic weaving truck volumes and grade
B 48th St PM 7 Minor Major Minor Minor Merge from SR 51 and SR 99
C Howe ave PM 9 Major Major Major weave between Howe and watt
D Mayhew Rd PM 12 Major Minor Major Weaving before Bradshaw Exit
E Routier Rd PM 14 Minor Major Weaving before Mather Field Rd Exit
F Sunrise Blvd PM 185 Minor Major Lane drop HOV add off-ramp queue
G Folsom Blvd PM 22 Minor Minor Lane drop 4 to 3
H El Dorado Hills Blvd PM 275 Major
Poorly coordinated traffic signal on arterial causes spillback onto freeway
a jefferson blvd bottleneck The bottleneck approximately located at Jefferson Blvd is due to weaving traffic as those entershying the freeway from Jefferson Blvd must cross those attempting to exit the freeway to I 5 There is a large number of trucks in the stream which struggle with the grade at this location exacerbatshying the bottleneck
[ 48 ] HigHway 50 corridor system management plan
c h a p t e r s e v e n c o n g e s t i o n a n d b o t t l e n e c k a n a l y s i s
b 48th St bottleneck The bottleneck approximately located at 48th St is due to the additional traffic merging from SR 51 and SR 99 combined with the eventual lane drop at 59th St This queue extends upstream past the off-ramp to SR 5199 These off-ramps are bottlenecks in themselves which spill back and choke the US 50 mainline
C Howe Ave Bottleneck The bottleneck at Howe ave is due to the entering traffic from Howe Ave Two Howe Ave on-ramps feed into US 50 eastbound southbound Howe ave loop on-ramp and northbound Howe ave direct ramp approximately 300 feet apart The watt avenue off-ramp is just down stream with heavy exiting volumes therefore the segment between Howe and watt is characterized by heavy weaving
D mayhew Rd Bottleneck The bottleneck approximately located at Mayhew Rd most likely begins with the additional traffic entering from Watt Ave and ends with the exiting traffic at Bradshaw Rd It is possible that there is a high proportion of weaving traffic with in this section (Watt Ave traffic moving to the left lane and those exiting at Bradshaw Rd moving to the right lane)
HigHway 50 corridor system management plan [ 49 ]
c h a p t e r s e v e n c o n g e s t i o n a n d b o t t l e n e c k a n a l y s i s
[ 50 ] HigHway 50 corridor system management plan
e routier rd bottleneck It is likely that the bottleneck at Routier Rd is due to the same merging conditions associated with Mayhew Rd The area is comprised of both residential and light industrialoffice land uses therefore during the PM peak period there are large volumes of vehicles entering at Bradshaw Rd moving to the left lanes and large volumes of vehicles moving to the right lane to exit at Mather Field Rd
f Sunrise blvd bottleneck At Sunrise Blvd the right-most lane exits while an HOV lane is added as the median lane The bottleneck is formed from vehicles shifting left to avoid exiting at Sunrise Blvd and to enter the HOV lane There is a large volume of vehicles queued at the Sunrise off-ramp which spills back and negatively affects the US 50 mainline
g folsom blvd bottleneck The right-most lane exits to Folsom Blvd leaving one HOV lane and two regular lanes along the US 50 The bottleneck is caused by this lane drop as well as the quick merge at the Folsom on-ramp
c h a p t e r s e v e n c o n g e s t i o n a n d b o t t l e n e c k a n a l y s i s
H The eastbound US 50 at El Dorado Hills Blvd Bottleneck The eastbound El Dorado Hills Blvd bottleneck is caused by a traffic signal on the arterial that often causes spillbacks on the EB loop offramp onto the freeway mainlines
TABLE 15 US 50 WESTBOUnD BOTTLEnECk SUmmARY Source PeMS Caltrans tach runs and Cambridge Systematics field observations
bottleneck Location PeMS Speed Contours Caltrans Probe Vehicle Runs
Cause aM PM aM PM
A El Dorado Hills Blvd PM 275 Major Poorly coordinated traffic
signal on El Dorado Hills Blvd
B Hazel Ave PM 21 Major Entering traffic
C Zinfandel Dr PM 16 Minor Major Major Major Entering traffic
D Routier Rd PM 14 Minor Major Minor Weaving traffic
E Bradshaw PM 13 Major Major Major Merging traffic and curve
F Howe Ave PM 9 Minor Major Major Major Weaving traffic and grade
G SR 51SR 99 PM 6 Minor Lane drop weaving traffic
H i-5 PM 3 Major Weaving traffic
HigHway 50 corridor system management plan [ 51 ]
c h a p t e r s e v e n c o n g e s t i o n a n d b o t t l e n e c k a n a l y s i s
[ 52 ] HigHway 50 corridor system management plan
A El Dorado Hills Blvd Bottleneck The minor bottleneck at El Dorado Hills Boulevard is caused by the traffic signal on El Dorado Hills Blvd that causes spillback on the westbound offramp onto the freeway mainlines
B Hazel Avenue Bottleneck In 2006 the Hazel Ave Bottleneck is caused by the traffic entering at both Hazel Ave and Folsom Blvd (the two on-ramps are separated by about one mile) The bottleneck that would appear at Folsom Blvd combines with the bottleneck at Hazel ave to form a large bottleneck that does not clear until after Hazel ave Sometimes causshying spillbacks as far as Prairies City Road this bottleneck was mitigated in 2007 as part of the GO CALIFORNIA program
C Zinfandel Dr Bottleneck There is heavy traffic coming from Sunrise Blvd but the lane addition immediately after the westbound on-ramp prevents a bottleneck from forming but as traffic flows westward the heavy traffic entering from Zinfandel Dr causes a bottleshyneck here
D Routier Rd Bottleneck The bottleneck at Routier Rd is caused by weaving traffic between Mather Field Rd and Bradshaw Rd This highway segment represents a transition area where vehicles that have been traveling in the left lanes begin to shift to the right lanes to exit while the entering traffic tries to shift to the left lanes
W eav in gLan e Dr o p
c h a p t e r s e v e n c o n g e s t i o n a n d b o t t l e n e c k a n a l y s i s
e bradshaw rd bottleneck The Bradshaw Rd bottleneck is caused by the entering traffic from Bradshaw Road the high truck volumes and the curve west of Bradshaw Two Bradshaw Rd on-ramps feed into US 50 westshybound southbound Bradshaw Rd direct on-ramp and northbound Bradshaw Rd loop on-ramp approximately 400 feet apart
F Howe Ave Bottleneck The Howe ave bottleneck is caused by a grade change and the weaving traffic entering from Howe ave and Hornet Dr competing for the right-most lane with those wanting to exit at 65th Street
G amp H SR 51SR 99 amp I-5 Bottleneck The bottleneck at I 5 is caused by the conflict between entering SR 99 and SR 51 traffic and exiting I-5 traffic as well as the queues formed on the ramps to i-5 which spill back onto US 50 The number of lanes in this section reaches a maximum of 6 and then drops to 4 as two lanes exit at the I-5 freeway This bottleneck is exacershybated during the peak periods when it stretches upstream to the lane drop before SR 99
W ea v in g
Lan e Dr o p
HigHway 50 corridor system management plan [ 53 ]
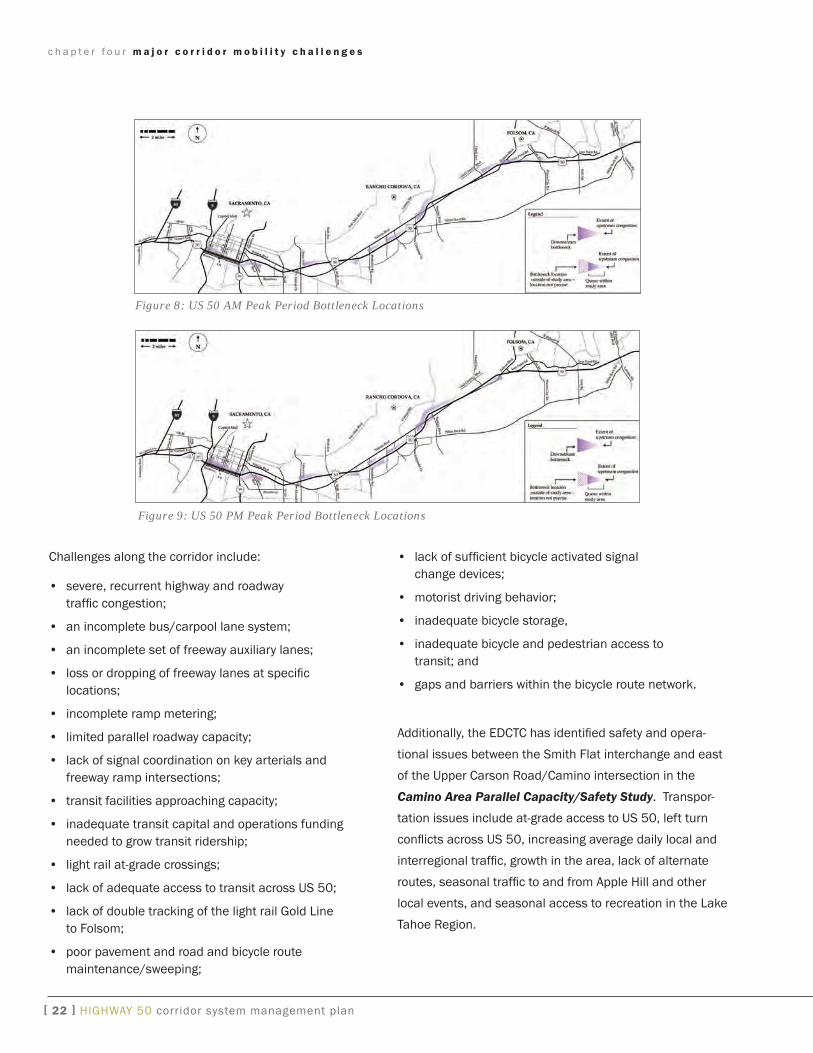
c h a p t e r f i v e p e r f o r m a n c e m e a s u r e s
Table 7 Parallel and ConneCTing roadwayS PerForManCe MeaSUreS
County location average
daily Traffic1
PerForManCe MeaSUreS
loS1
Total Vehicle Hours of delay2
Total Person Minutes of delay2
Minutes of delay per Vehicle2
Minutes of delay per Person2
Vehicle Travel Time (Minutes)2
distressed Pavement
(lane Miles)4
daily Peak Hour3 daily Peak
Hour3 Peak Hour3 Peak Hour3 Peak Hour3
Parallel and ConneCTing roadwayS
yOL west Capitol Enterprise Boulevard to Capitol Mall 13737 No Data
Data is unavailable for these performance measures at this time however will be pursued in the next phase of the CSMP
SaC
w 5th Street to 26th Street 9194 a
X 5th Street to 26th Street 9154 a
Folsom Boulevard watt avenue to Bradshaw Road 25600 C
watt avenue Folsom Boulevard to US 50 63900 F
Bradshaw Road Folsom Boulevard to US 50 22400 a
Folsom Boulevard Bradshaw Road to Sunrise Boulevard 20400 a
Bradshaw Road Old Placerville to US 50 54405 F
Old Placerville Road Bradshaw Road to Rockingham Drive 11864ndash18365 a
Rockingham Drive Old Placerville Road to Mather Boulevard 16516 E
Mather Boulevard Rockingham Drive to Folsom Boulevard 21732 C
international Drive Rockingham Drive to Zinfandel Drive 12808 a
Zinfandel Drive international Drive to Folsom Boulevard 22298ndash47032 BE
white Rock Road Zinfandel Drive to Sunrise Boulevard 25459 a
Sunrise Boulevard US 50 to Folsom Boulevard No Data No Data
white Rock Road Sunrise Boulevard to Prairie City Road 3400 B
Folsom Boulevard Sunrise Boulevard to iron Point Road 17200 a
white Rock Road grant Line Road to EDSaC County Line 6700 D
iron Point Road Folsom Boulevard to East BidwellScott Road 13984 No Data
Scott Road iron Point Road to white Rock Road No Data No Data
Folsom Boulevard iron Point Road to Blue Ravine Road No Data No Data
Blue Ravine Road Folsom Boulevard to green Valley Road No Data No Data
Prairie City Road US 50 to white Rock Road 6000 D
HigHway 50 corridor system management plans [ 30 ]
c h a p t e r f i v e p e r f o r m a n c e m e a s u r e s
Table 7 Parallel and ConneCTing roadwayS PerForManCe MeaSUreS (ConTinUed)
County location average
daily Traffic1
PerForManCe MeaSUreS
loS1
Total Vehicle Hours of delay2
Total Person Minutes of delay2
Minutes of delay per Vehicle2
Minutes of delay per Person2
Vehicle Travel Time (Minutes)2
distressed Pavement
(lane Miles)4
daily Peak Hour3 daily Peak
Hour3 Peak Hour3 Peak Hour3 Peak Hour3
Parallel and ConneCTing roadwayS
ED
green Valley Road EDSaC County Line to Francisco Drive 22600 D
Data is unavailable for these performance measures at this time however will be pursued in the next phase of the CSMP
green Valley Road Francisco Drive to Silva Valley Parkway 13077 D
green Valley Road Silva Valley Parkway to Cameron Park 9849 C
green Valley Road Cameron Park Drive to Deer Valley Road 5278 C
green Valley Road Deer Valley Road (East) to Lotus Road 8381 D
green Valley Road Lotus Road to Placerville Drive 4669 C
Latrobe Road white Rock Road to US 50 24742 C
Durock Road Cameron Park Dr to South Shingle Road 7278 C
Cameron Park Drive Durock Road to US 50 (Durock Road to Coach Lane Coach Lane to US 50) 9544 26603 CD
South Shingle Road Durock Road to US 50 11390 D
white Rock Road EDSaC County Line to Latrobe 12808 D
white Rock Road Latrobe Rd to Silva Valley Pkwy (Latrobe to PostPost to Silva Vlly Pkwy) 10124 CD
Silva Valley Parkway white Rock Rd to Serrano Pkwy (white Rock to Entrada Entrada to Serrano Pkwy) 13708 9328 DC
Forni Road Placerville Drive to Main Street 9049 8379 No Data
Placerville Drive Forni Road to US 50 No Data No Data
Main Street Placerville Drive to Bedford avenue No Data No Data
Main Street Bedford avenue to Broadway No Data No Data
Broadway Main Street to Point View Drive No Data No Data
1 Source Average Daily Traffic and Level of Service (LOS) calculated are based on City of Sacramento between 2001 and 2007 Sacramento County from 20072008 City of Rancho Cordova between 2004 and 2007 and El Dorado County from 2007
HigHway 50 corridor system management plans [ 31 ]
c h a p t e r f i v e p e r f o r m a n c e m e a s u r e s
Page Inte
ntionally
Left
Blank
[ 32 ] HigHway 50 corridor system management plan
c h a p t e r f i v e p e r f o r m a n c e m e a s u r e s
tabLe 8 traNSit PerforMaNCe MeaSure
County transit Provider route Performance Measure
available daily Capacity ()1 available Peak Hour Capacity1
traNSit
SaC
SacRT (Bus)
Route 21 70 10
Route 28 76 59
Route 36 83 74
Route 38 66 44
Route 72 56 20
Route 73 79 45
Route 74 82 43
Route 109 47 22
SacRT (Light Rail) Gold Line 31 Exceeds Capacity
EDSAC ED County Transit Authority
Commuter Express Bus Service Not applicablendashOperates Peak Hour
Only 405
iron Point Connector 764 Not available
Reverse Commuter Not applicablendashOperates Peak Hour Only 982
yoloSaC yolo County Transit District Not applicablendashOperates Peak Hour Only 498
biKe3
1 Source average Daily and Peak Hour available Capacity calculated from each transit providerrsquos route ridership data 2 The Reverse Commuter service is offered on vehicles that are returning to El Dorado County (Commuter Express Buses) 3 Bicycle performance measure(s) will be identified applied and included in the subsequent CSMPs
HigHway 50 corridor system management plan [ 33 ]
c h a p t e r f i v e p e r f o r m a n c e m e a s u r e s
[ 34 ] HigHway 50 corridor system management plan
Page Inte
ntionally
Left
Blank
planned corridor system management strategies
chapter six
ConCept LoS and ConCept FaCiLit y ldquoConcept LOSrdquo and ldquoConcept Facilityrdquo have traditionally been used in Caltrans TCCRs to reflect the minimum level or quality of operations acceptable for each route segment within the 20-year planning period and the highway facility needed in the next 20 years to maintain the Concept LOS
Typical Concept LOS standards in Caltrans District 3 are LOS ldquoDrdquo in rural areas and LOS ldquoErdquo in urban areas how-ever some heavily congested route segments now have a Concept LOS ldquoFrdquo because the improvements required to bring the LOS to ldquoErdquo are not feasible due to environmental right of way financial and other constraints The applica-tion of multi-modal corridor management strategies should reduce the severity and duration of congestion and provide viable travel options and information that will enable a traveler to avoid severe freeway congestion
The Concept LOS and Concept Facility for US 50 are shown in Table 9 almost all US 50 segments are forecasted to operate under LOS ldquoFrdquo conditions in 20 years under the No-Build and Build scenarios
Corridor ManageMent StrategieS The US 50 CSMP also proposes specific strategies to enhance corridor mobility (see Table 10) based on the fol-lowing principles
bull Manage all modes and facilities in the corridor as a single system beginning with the transportation net-work defined in this CSMP
bull Implement comprehensive and dynamic multimodal monitoring and reporting for the system and for all modes
bull Develop and use micro-simulation modeling to identify mobility challenges and to evaluate proposed solutions
bull Complete the projects included in the regional trans-portation plans with an emphasis on the completion of the key mobility improvement projects identified in this CSMP (see Tables 11 and 12)
bull Implement the specific strategies outlined in this CSMP
Key CapitaL projeCtS Tables 11 and 12 contain key capital projects that have been identified as the most critical to corridor mobility These are also included in the SaCOg MTP for 2035 and are either planned without any funding yet programmed are partially programmed
The US 50 CSMPor are entirely programmed SACOG conducted significant proposes specific
public attitude research strategies to enhance for the MTP for 2035 to corridor mobility complement comprehensive outreach efforts through community workshops the TALL Order Moving the Region Forward event the televised Town Hall Road Map for the Future and associated public polling The results of the SaCOg analyses and public out-reach for the MTP were
highway 50 corridor system management plan [ 35 ]
c h a p t e r s i x p l a n n e d c o r r i d o r s y s t e m m a n a g e m e n t s t r a t e g i e s
[ 36 ] HigHway 50 corridor system management plan
used when selecting the key projects for identification in
the CSMP and to ensure consistency Not all corridor projshyects in the MTP are included in the CSMP since the CSMP focuses on the managed network and the SaCOg MTP considers all streets and roads bike routes and transit services in the corridor
highway 50 partnership The Highway 50 Partnership is a cooperative public-private effort among the County of Sacramento City of Rancho
Cordova City of Folsom County of El Dorado and several major landowners that recognize the need to consider corrishydor mobility needs holistically
The Partnership has collaborated effectively to develop a Plan to improve mobility in the US 50 Corridor from Rancho
Cordova to El Dorado Hills an area identified as approprishyate for growth in the SACOG Blueprint Recognizing the
need to generate private investment the Partnership is seeking to implement a regional Highway 50 Corridor fee program to fund these projects
in addition to the key projects indicated in Table 11 Table 12 displays the key projects identified by the
Partnership
These projects include (1) Near-Term Priority Improvement Projects and (2) Near-Term Expected Roadway Improveshyments
The Near-term Priority improvement Projects would proshyvide several new roadway connections for people to travel within and through the area to avoid congestion They also include new transit routes and widening existing roadways
viewed by the Partnership as a package that would provide system-wide travel benefits These improvements targeted
for completion through 2012 would reduce vehicle hours of delay during commute hours by 30 percent
The near-Term Expected Roadway Improvements are conshysidered by the Partnership to be readily expected since they are tied to expected development or are part of a near-term
capital improvements program
Visionary projects Visionary projects are not yet included in the SaCOg MTP or EDCTC RTP but appear to offer considerable corridor mobilshyity benefits and merit further analysis and consideration for inclusion in the next MTP and RTP These are displayed in
Table 13
The ldquoPlus 10 Listrdquo in the SACOG MTP identifies projects
that are attractive from a performance standpoint but could not be included in the Final Project Lists because of financial constraint The ldquoPlus 10 Listrdquo element offers the
opportunity to include projects that would not be affordshyable without additional funding Some projects identified in
the Visionary Projects List were analyzed by SACOG during
development of the current MTP Some of these are included in the ldquoPlus 10 Listrdquo
Watt Avenue Light Rail Station Improvement Project
c h a p t e r s i x p l a n n e d c o r r i d o r s y s t e m m a n a g e m e n t s t r a t e g i e s
Table 9 US 50 ConCePT loS and FaCiliTy TyPe
location Forecasted level of Service1 (loS) and Facility Type
County description and location From Post Mile To Post Mile Current
loS1 20-year no build loS12
20-year build loS12
20-year Concept
loS13 existing Facility4 Concept Facility456 Ultimate Facility457
yOL interstate 80 to yoloSacramento County Line
000 316 F F F F 8F (6F between Jefferson Blvd ramps)
8F+2HOV+aux Lanes 8F+2HOV+aux Lanes
SaC yoloSacramento County Line to SR 99 and 51
L000 L248 = R000 F F F F 8F 8F+2HOV+aux Lanes 8F+2HOV+aux Lanes
SaC State Routes 99 and 51 to watt avenue R000 R534 F F F F 8F 8F+2HOV+aux Lanes 8F+2HOV+aux Lanes
SaC watt avenue to Zinfandel Drive R534 R1092 F F F F 8F 8F+2HOV+aux Lanes 8F+2HOV+aux Lanes
SaC Zinfandel Drive to Sunrise Boulevard R1092 1250 E F F F 8F 8F+2HOV+aux Lanes 8F+2HOV+aux Lanes
SaC Sunrise Boulevard to Folsom Boulevard 1250 1701 E F F F 6F+2HOV to Hazel ave 4F+2HOV
to Folsom Blvd
6F+2HOV+aux Lanes to Hazel ave 4F+2HOV+aux
Lanes to Folsom Blvd
8F+2HOV+aux Lanes
SaC Folsom Boulevard to SaCED County Line 1701 2314 D F F F 4F+2HOV 4F+2HOV+aux Lanes 6F+2HOV+aux Lanes
ED SacramentoEl Dorado County Line to Cameron Park Drive
000 R657 E F F F 4F 4F+2HOV+aux Lanes 6F+2HOV+aux Lanes
ED Cameron Park Drive to Missouri Flat Road R657 R1506 E F E E 4F 4F+2HOV+aux Lanes to greenstone 4F+aux Lanes
to Missouri Flat
6F+2HOV+aux Lanes to greenstone 4F+2HOV+aux Lanes
to Missouri Flat
ED Missouri Flat Road to End of Freeway in Placerville
R1506 1725 D F F F 4F 4F+aux Lanes 4F+aux Lanes
ED End of Freeway in Placerville to Bedford avenue
1725 1811 D E E E 4E 4E 4E
ED Bedford avenue to Cedar grove Exit 1811 R2595 D F F F 4F to Smith Flat 4E to Camino 4F+aux Lanes to Smith Flat 4E to Camino
4F+aux Lanes
1 Level of Service (LOS) A ldquoreport cardrdquo for evaluating traffic flow with ldquoArdquo being the best and ldquoFrdquo being the worst 2 20-year LOS (No Build) The LOS that would be expected at 20 years with no improvements 3 20-year Concept LOS The minimum acceptable LOS over the next 20 years 4 Facility Type Codes C=Conventional Highway E=Expressway F=Freeway HOV=High Occupancy Vehicle Lanes aux=auxiliary Lanes 5 Operational improvements are included in future facilities for all segments Examples of operational improvements include TOS improvements and auxiliary lanes 6 Concept Facility the future roadway with improvements needed in the next 20 years if LOS ldquoFrdquo no further degradation of service from existing ldquoFrdquo is acceptable as indicated by delay performance measurement 7 Ultimate Facility The future roadway with improvements needed beyond a 20 year timeframe
HigHway 50 corridor system management plans [ 37 ]
c h a p t e r f i v e p e r f o r m a n c e m e a s u r e s
Table 10 US 50 CSMP STraTegieS
Strategy description implementation Challenges
Maintain and operate the existing corridor multi-modal trans-
portation infrastructure
Maintain the existing investment in all modes of the transportation system and provide adequate resources for daily operations including operating
revenues for transit services
Funding availability funding competition within the region
Fully coordinate the delivery of transportation services and facili-ties in the corridor including daily operations and system planning
for enhancements
Interagency operational coordination to maximize the efficiency and effec-tiveness of all modes operating in the corridor with a focus on the CSMP transportation network defined in this CSMP Use of an existing group or
committee to provide initial oversight for this strategy
Diverse interests and competing priorities and limited resources
Construct planned and pro-grammed corridor capital improve-
ment projects
implementation of the capital improvements in the corridor included within the approved Metropolitan Transportation Plan and Regional Transportation
Plan for all transportation modes within the scope schedule and cost specified
Funding availability funding competition within the region
Comprehensive daily monitoring of the status of all modes providing service on the CSMP transporta-
tion network
Full deployment of multimodal transportation service status detection systems for all CSMP network components
Funding availability funding competition within region
Provide traveler information to the public
Provide the public with real-time easily accessible information regarding the status of all CSMP transportation system components so as to allow travel-
ers to make informed decisions about trip mode time and routing options
Funding availability funding competition within region
Continually monitor and analyze the CSMP transportation network to improve system performance
Monitor transportation performance measures and make system modifica-tions as appropriate on a frequent and timely basis Staff resources and data availability
Decrease the duration of non-recurrent traffic congestion
Expand and enhance the Freeway Service Patrol to respond to automobile accidents and vehicle break-downs
Funding availability funding competition within the region
Timely implementation of STaRNET
Expedite the implementation of the STaRNET operators of transportation facilities and emergency responders in the Sacramento region through real-time sharing of data and live video refinement of joint procedures
pertaining to the operation of roadways and public transit and public safety activities as well as enhance the regionrsquos 511 web site and interactive
telephone service to provide more traveler information
Developmental time acceptance by agencies and integration into daily use and identifica-
tion of maintenance and operations funding
Enhance transit and rail service increase transit service frequency provide express transit services imple-
ment bus rapid transit routes reduce headways for light rail and buses and construct planned light rail line extensions
Funding availability funding competition within the region
Complete Bus Carpool lane network
Complete the regional buscarpool lane network including freeway-to-freeway HOV lane connectors
Funding availability funding competition within the region Public agency and public
acceptance of network
[ 38 ] HigHway 50 corridor system management plan
c h a p t e r s i x p l a n n e d c o r r i d o r s y s t e m m a n a g e m e n t s t r a t e g i e s
tabLe 10 uS 50 CSMP StrategieS (ConTInued)
Strategy Description implementation Challenges
Enhance Transportation Demand Management strategies
Encourage employers to provide telecommuting and flexible working hour options to employees
acceptance by employers and resources to participate
Optimize the timing and synchronishyzation of traffic signals
Coordinate the optimization and timing of traffic signals on freeway ramps and along parallel and connecting roadways within and between jurisdicshytions to improve traffic flow and reduce congestion Provide signal priority
systems for transit vehicles
Funding availability and coordination among cities counties and Caltrans
improve access management of freeways and parallel connecting roadways
Develop and implement access management strategies to maintain the operational efficiency of freeways and parallelconnecting roadways
agreement between responsible jurisdicshytions as to where increased access control is needed increased access control on some parallelconnecting roadways may increase
traffic volumes on non-corridor roads
Develop innovative use of CMSs (eg travel times)
Potential uses of CMSs to improve system efficiency include the use of CMSs along portions of all corridors near transit station to indicate travel
times based on real-time existing traffic conditions on the freeway as well as on parallel roadways and express bus and light rail services CMS can also be used to identify the number of parking spaces that are still available at
the light-rail stations
Funding availability funding competition within the region
Implement amp expand Transit AVLTransit status information
enhancements for system users
Expand the use of AVL systems utilizing GPS technology to track in real-time the location of transit vehicles monitor transit schedules dispatch transit vehicles and provide real-time passenger information such as ldquonext busrdquo or
ldquonext trainrdquo arrival times
Funding availability funding competition within region
Expand Park-and-Ride lots at key locations
Add additional capacity to existing park-and-ride lots near transit stations and other locations that are approaching capacity
Funding availability funding competition within the region and available land
improve bike-pedestrian access in the CSMP
transportation network
Plan and program for construction of additional bicycle paths lanes and related improvements for access and connectivity to transit park and ride
lots and destination points
Funding availability funding competition within the region
Provide ldquoBike-SharingrdquordquoCar-Sharingrdquo tofrom transit (ldquoCarlinkrdquo) and from
neighborhoods
Expand the Regional Rideshare and Spare-the-Air programs to include bicycle and car sharing opportunities
Funding availability and coordination between SaCOg TMa air Districts employers developshyers property managers and local government
officials
Provide parking management stratshyegies in interested jurisdictions where applicable to discourage
use of single-occupant vehicles
in higher-density areas provide preferential parking for carpools and vanshypools require residential parking permits remove on-street parking and or provide graduated parking fees for metered on-street parking based on
vehicle type and time of day for SOV spaces to encourage transit use
Acceptance by businesses local officials and the general public
Expand bicycle commute amp transit fare strategiessubsidies
increase participation by large employers in programs that subsidize transit fares for employees during peak-hour commute times and provide bicycling
to work incentives
Voluntary participation by large employers to pay subsidy to transit providers
HigHway 50 corridor system management plan [ 39 ]
c h a p t e r s i x p l a n n e d c o r r i d o r s y s t e m m a n a g e m e n t s t r a t e g i e s
tabLe 11 KeY CaPitaL ProjeCtS
CountyLead agency
route roadway from to Project
Description Programmed
funds
additional funding Needed
total Cost estimate (x $1000)
Comp Year (FFY)
uS 50
Sacramento Caltrans District 3
US 50 Downtown watt avenue HOV Lanes $0 $75000 $75000 2020
Sacramento Caltrans District 3
US 50 watt avenue Sunrise Blvd HOV Lanes $165000 $0 $165000 2013
Sacramento Caltrans District 3
US 50 Bradshaw Road
Mather Field Road
Eastbound and Westbound Auxiliary Lanes
$0 $3700 $3700 2016
Sacramento Caltrans District 3
US 50 State Route 99
(Oak Park Interchange) interchange improvements including buscarpool lane
connectors $0 $150000 $150000 2014
Sacramento Caltrans District 3
US 50 interstate 5
(Riverfront Interchange) Riverfront Interchange
improvements including bus carpool lane connectors
$30000 $170000 $200000 2016
ED Caltrans District 3 US 50 Camino
Operational Safety improvements Construct an
undercrossing median barrier modify local road connections andor associated operational improvements on and adjacent
to US 50
$15000 $0 $15000 2012
ED ED County DOT US 50
west of Latrobe Road
west of Bass Lake
grade HOV Lanes (Ph1) $47141 $0 $47141 2010
ED Caltrans District 3 US 50
west of Bass Lake Road
Ponderosa Road
HOV Lanes (Ph2) $55000 $0 $55000 2011
ED Caltrans District 3 US 50 Ponderosa
Road greenstone
Road HOV Lanes (Ph3) $22357 $0 $22357 2013
ED ED County DOT US 50 Future Silva
Valley iC
Future Empire Ranch IC
Mainline Widening construct new WB lane within the
median from proposed Silva Valley IC to proposed Empire
Ranch IC
$2950 $0 $2950 2013
[ 40 ] HigHway 50 corridor system management plan
c h a p t e r s i x p l a n n e d c o r r i d o r s y s t e m m a n a g e m e n t s t r a t e g i e s
tabLe 11 KeY CaPitaL ProjeCtS (ConTInued)
CountyLead agency
route roadway from to Project
Description Programmed
funds
additional funding Needed
total Cost estimate (x $1000)
Comp Year (FFY)
PARALLEL AnD COnnECTInG ROADWAYS
ED ED County DOT
Silva Valley Parkway
Entrada Drive
Future US 50
Silva Valley Parkway iC
Widen Silva Valley Road from 2 lanes to 4 lanes includes
Class ii bike lanes and left turn storage pockets
$2921 $0 $2921 2010
ED ED County DOT
Silva Valley Parkway US 50
US50 Silva Valley Parkway (Phase 2) Includes constructshying overcrossing and ramps
signalization at EB and WB on off ramps
$57817 $0 $57817 2016
ED ED County DOT
Headington Road
Missouri Flat Road
El Dorado Road
Extend 2 lanes with median $9878 $0 $9878 2012
ED ED County DOT
Durock Road
Robin Lane South
Shingle Road
Extend 2 lanes with median $1239 $9214 $10453 2015
ED ED County DOT
Durock Road
Business Center Drive intersection signalization
includes adding turn pockets on Durock Road
$4333 $0 $4333 2009
ED City of Placerville
Point View Drive Broadway Smith Flat
Road Extend 2 lanes $1300 $0 $1300 2020
ED City of Placerville
western Placerville
US 50 interchange
Forni Road Ray Lawyer
Drive
Placerville Drive
Interchange Reconstruction convert Ray Lawyer Dr
Overcrossing to full IC Auxiliary Lanes
$5059 $34741 $39800 2020
Sacramento City of Rancho
Cordova
Mather Boulevard
Rockingham Road
Zinfandel Drive widen to 4 lanes $0 $8617 $8617 2020
Sacramento Rancho Cordova
Parkway ii
Grant Line Road
White Rock Road
New 6-lane expressway includshying intersection improvements at Kiefer Blvd amp White Rock
Road
$0 $44518 $44518 2020
Sacramento City of Folsom
Scott Road US 50 White Rock Rd
widen from 2 to 6 lanes $16000 $0 $16000 2020
Sacramento Sacramento County DOT
White Rock Road
Grant Line Rd
Prairie City Rd
Widen from 2 to 4 lanes realign near Nike and Nimbus Roads and connect with existshying alignment west of Prairie City Rd Realign Grant Line Rd to intersect with realigned
White Rock Rd
$26600 $0 $26600 2020
Sacramento Sacramento County DOT
Hazel avenue
US 50 Hazel Madison
Widen American River Bridge and approaches from 4 to 6 lanes Widen Hazel Avenue from AR Bridge to Madison from 4 to 6 lanes with Bike
LanesSignals
$83530 $0 $83530 2020
HigHway 50 corridor system management plan [ 41 ]
c h a p t e r s i x p l a n n e d c o r r i d o r s y s t e m m a n a g e m e n t s t r a t e g i e s
tabLe 11 KeY CaPitaL ProjeCtS (ConTInued)
CountyLead agency
route roadway from to Project
Description Programmed
funds
additional funding Needed
total Cost Estimate (x $1000)
Comp Year (FFY)
PARALLEL AnD COnnECTInG ROADWAYS
ED ED County DOT
green Valley Road
Salmon Falls Road
east
Deer Valley Road
widen from 2 to 4 lanes $0 $14576 $14576 2025
ED ED County DOT
green Valley Road
Deer Valley Road east Lotus Road widen $958 $4513 $5471 2015
ED ED County DOT
green Valley Road
Francisco Drive
Salmon Falls Road
widen from 2 to 4 lanes divided $412 $3491 $3903 2015
ED ED County DOT
Latrobe Road
investment Boulevard
golden Foothill Parkway
widen from 2 lanes undivided to 4 lanes
divided $1076 $8792 $9868 2015
ED ED County DOT
Latrobe Road
Carson Creek
White Rock Road
widen from 4 to 6 lanes $0 $23755 $23755 2025
ED ED County DOT
white Rock Road
EDSac County Line
Manchester Drive
widen 2 to 4 lanes divided includes signal interconnect and coorshy
dination
$0 $23755 $23755 2025
Sacramento City of Rancho
Cordova
Easton Valley
Parkway
Prairie City Road
Empire Ranch Road extenshysion south of
US 50
Construct new 4 lane road $0 $45000 $45000 2020
Sacramento Sacramento County DOT
Hazel avenue
Easton Valley
Parkway
Grant Line RoadWhite Rock Road
New road extension 4 lane limited access
through aerojet property $0 $18000 $18000 2018
Sacramento Sacramento County DOT
white Rock Road
Prairie City Road
ED County Line
widen to 4 lanes $8330 $64773 $73103 2018
Sacramento Sacramento County DOT
green Valley Road
East Natoma Sacramento ED County
line widen to 4 lanes $0 $3000 $3000 2018
Sacramento City of Rancho
Cordova
Zinfandel Drive
international Drive
Folsom Boulevard
widen to 4 lanes $0 $12000 $12000 2020
[ 42 ] HigHway 50 corridor system management plan
c h a p t e r s i x p l a n n e d c o r r i d o r s y s t e m m a n a g e m e n t s t r a t e g i e s
tabLe 11 KeY CaPitaL ProjeCtS (ConTInued)
CountyLead agency
route roadway from to Project
Description
Pro-grammed
funds
addi-tional
funding Needed
total Cost estimate (x $1000)
Comp Year (FFY)
traNSit
yolo amp Sacramento City of west Sacramento
amp City of Sacramento
Sacramento River
Crossing
15th Street in the City
of west Sacramento
Broadway in the City of
Sacramento
New all-modal river crossing (Auto Transit Bike amp Pedestrian)
from Sacramento across the Sacramento River to West
Sacramento The crossing was modeled between Broadway in Sacramento amp 15th Street in
West Sacramento but final alignshyment options will be studied in subsequent planning efforts
$800 $99200 $100000 2019
Sacramento Cal State University
Sacramento
CSUS Campus mdash mdash
Sac State Tram adjoining City streets and SRTD 65th Street light railbus transfer station Bus Rapid Transit System
$23574 $0 $23574 2013
Sacramento City of Rancho
Cordova
Rancho Cordova Various Various
New Service Rancho Cordova Pilot Transit Shuttle System new transit service for connection to
RTs Gold Line
$2380 $1500 $38880 2014
yolo amp Sacramento City of west Sacramento
TBD west
Sacramento Sacramento Streetcar Service between west
Sacramento and Downtown Sacramento
$17400 $54700 $72100 2014
Sacramento City of Rancho
Cordova RT Gold Line
RT Gold Line Tracks
Mather Field Road
Light Rail Grade Separations $0 $52888 $52888 2025
Sacramento City of Rancho
Cordova RT Gold Line
RT Gold Line Tracks Zinfandel Drive Light Rail Grade Separations $0 $52888 $52888 2025
Sacramento City of Rancho
Cordova RT Gold Line
RT Gold Line Tracks
Bradshaw Road
Light Rail Grade Separations $0 $35260 $35260 2025
Sacramento City of Rancho
Cordova RT Gold Line
RT Gold Line Tracks Routier Road Light Rail Grade Separations $0 $35260 $35260 2025
Sacramento City of
Sacramento Sacramento Valley Station
Sacramento intermodal Transportation Facility (Phase 1) - Develop intermodal transportashytion terminal for heavy rail light
rail and bus service
$77799 $0 $77799 2010
Sacramento City of
Sacramento Sacramento Valley Station
Sacramento intermodal Transportation Facility (Phase 2) - Develop intermodal transportashytion terminal for heavy rail light
rail and bus service
$24101 $1000 $25101 2014
HigHway 50 corridor system management plan [ 43 ]
c h a p t e r s i x p l a n n e d c o r r i d o r s y s t e m m a n a g e m e n t s t r a t e g i e s
TABLE 11 KEY CAPITAL PROJECTS (CONTINUED)
CountyLead Agency
Route Roadway From To Project
Description Programmed
Funds
Additional Funding Needed
Total Cost Es-timate (x $1000)
Comp Year (FFY)
BICYCLE ROUTES
Sacramento City of Rancho
Cordova
US 50Mather Field Road IC US 50 Mather
Field Road
US 50Mather Field Road PedestrianBike Crossing along
the Mather Airport RR Spur alignment
$0 $820 $1055 2015
ED ED County DOT
Sacramento Placerville
Transportation Corridor
Forni Rd
Missouri Flat Rd Class I Bike Trail $1423 $111 $1534 2009
ED City of Placerville
El Dorado Trail Western
Extension
Canal Street Main Street
Ray Lawyer DriveForni
Road Class 1 Bike Trail $1850 $0 $1850 2010
ED ED County DOT
US 50ED Hills Blvd IC US 50
El Dorado Hills Blvd
Latrobe Road
US 50El Dorado Hills Blvd Pedestrian Overcrossing $5508 $66 $5574 2014
TABLE 12 50 MOBILITY PARTNERSHIP KEY CAPITAL PROJECTS
RouteRoadway From To Project Description
NEAR TERM PRIORITY IMPROVEMENT PROJECTS
US 50 Sunrise Scott Road Auxiliary Lane
US 50 Hazel Avenue Interchange Improvements
Hazel Avenue Folsom Boulevard Easton Valley Parkway New 4 Lane Road
Easton Valley Parkway Hazel Avenue Rancho Cordova Parkway New 6 Lane Road
Rancho Cordova Parkway Easton Valley Parkway White Rock Road New 4 Lane Road
White Rock Road Sunrise Boulevard Silva Valley Parkway Widen to 4 Lanes
RT Gold Line Hazel Iron Point Station Passing Tracks
US 50 Rancho Cordova Parkway New Interchange
Zinfandel Drive South of International Douglas Road New 4 Lane Road
International Drive Kilgore Road Rancho Cordova Parkway New 6 Lane Road
Douglas Road Zinfandel Extension Sunrise Boulevard Widen to 4 Lanes
Sunrise LRT Citrus Road Sunrise Mall Bus Rapid TransitExpress Bus
[ 44 ] HIGHWAY 50 corridor system management plan
c h a p t e r s i x p l a n n e d c o r r i d o r s y s t e m m a n a g e m e n t s t r a t e g i e s
TABLE 12 50 mOBILITY PARTnERSHIP kEY CAPITAL PROjECTS (COnTInUED)
routeroadway from to Project Description
US 50 nEAR TERm PRIORITY ImPROVEmEnT PROjECTS
US 50 Empire Ranch Road New interchange
US 50 Silva Valley New interchange
US 50 Scott Road Empire Ranch Road Aux Lanes
US 50 Empire Ranch Road El Dorado Hills Boulevard Aux lanes and climbing lanes
US 50 El Dorado Hills Boulevard Silva Valley Parkway Aux lanes and climbing lanes
US 50 Silva Valley Parkway Bass Lake Road Aux lanes
Sunrise Boulevard White Rock Road Douglas Boulevard widen to 6 lanes
Sunrise Boulevard Douglas Boulevard Jackson Road widen to 4 lanes
White Rock Road Sunrise Boulevard Future Rancho Cordova Parkway and El Dorado County Line to Latrobe Road
widen to 4 lanes
Douglas Boulevard Sunrise Boulevard Grant Line Road widen to 4 lanes
Rancho Cordova Parkway Douglas Boulevard Rio del Oro Parkway New 2 lane road
Rancho Cordova Parkway Rio del Oro Parkway White Rock Road New 6 lane road
Jaeger Road Douglas Road Kiefer Boulevard New 4 lane road
Chrysanthy Sunrise Boulevard Americanos Boulevard New 4 lane road
Kiefer Boulevard Sunrise Boulevard Jaeger Road New 4 lane road
Grant Line Road Douglas Road Chrysanthy Road widen to 4 lanes
Hazel avenue Gold Country Boulevard Madison avenue widen to 6 lanes
Latrobe Road South of White Rock Road widen to 4 lanes
TABLE 13 VISIOnARY PROjECTS
County routeroadway from to Project Description
Sac yolo US 50 Enterprise Downtown Sacramento HOV Lanes
ED TBD Folsom Placerville Transit ndash Type TBD
ED New Road Latrobe Road White Rock Road (poten shy
tially US 50) New 2-lane road
HigHway 50 corridor system management plan [ 45 ]
c h a p t e r s i x p l a n n e d c o r r i d o r s y s t e m m a n a g e m e n t s t r a t e g i e s
[ 46 ] HigHway 50 corridor system management plan
Page Inte
ntionally
Left
Blank
congestion and bottleneck analysis
chapter seven
The 2000 Highway Capacity Manual defines a bottleneck
as ldquoa road element on which demand exceeds capacityrdquo
The bottleneck analysis evaluates specific causes of existshying recurrent traffic congestion in the corridor Freeway bottleneck locations that create mobility constraints are identified and documented and their relative contribution
to corridor-wide congestion is reported The bottleneck locations were determined based on a combination of the use of 2006 PeMS data HiCOMP report probe vehicle tach runs and field observations
Traffic congestion can be categorized as either recurrent
or non-recurrent
recurrent congestion occurs repeatedly at the same place and time of day in a predictable pattern Recurrent congesshytion is often associated with facility capacity limitations changes in capacity conflicting vehicle movements such
as lane merges inadequate number of transit vehicles to handle passenger loads or other persistent physical condishytions of the transportation facility
Non-recurrent congestion is usually attributed to collishysions equipment malfunction community events weather construction projects and other occasional occurrences When transportation systems are close to their maximum
carrying capacity non-recurrent congestion is more likely to occur as there is little excess capacity in the system
The location and extent of the bottlenecks on US 50 found
in the aM and PM peak periods are summarized in Tables 14 and 15 These depictions should be considered a snapshyshot view and not a comprehensive analysis of all bottleshynecks in the corridor Further work is being conducted to
refine the identification and causality of bottlenecks within
the corridor Table 14 shows a summary of the US 50 eastbound bottlenecks while the tables that follow discuss each bottleneck including location and possible causality Table 15 shows a summary of the US 50 westbound bottleshynecks while the tables that follow discuss each bottleneck including location and possible causality Minor or hidden bottlenecks are those Freeway bottleneck
that are not as defined locations that create (or severe) as the major mobility constraints bottlenecks Please note are identified and that the graphics accomshy documented and their panying the bottlenecks
relative contribution to are not to scale
corridor-wide congestion Major bottlenecks in the is reported eastbound direction during the aM peak period are at Howe avenue and during the PM peak period are at 48th Street Howe Avenue Mayhew Road Routier Road Sunrise Boulevard and El Dorado Hills Boulevard Major bottlenecks in the westbound direction during the aM peak period are at El Dorado Hills Boulevard Hazel Avenue Zinfandel Drive
HigHway 50 corridor system management plan [ 47 ]
c h a p t e r s e v e n c o n g e s t i o n a n d b o t t l e n e c k a n a l y s i s
Bradshaw Road and Howe Avenue and major bottleneck
locations during the PM peak period are at Zinfandel Drive Routier Road Bradshaw Road Howe Avenue and Intershystate 5
Causalities for these bottlenecks range from high-traffic
demand (congestion) heavy weavingmerging areas or physical constraints such as lane drops lack of ramp meters incomplete HOV network incomplete Auxiliary Lane
network poorly coordinated traffic signals and an off-ramp
queue (Sunrise Boulevard) US 50 Westbound Onramp
TABLE 14 US 50 EASTBOUnD BOTTLEnECk SUmmARY Source PeMS Caltrans tach runs and
Cambridge Systematics field observations
bottleneck Location PeMS Speed Contours Caltrans Probe Vehicle Runs
Cause aM PM aM PM
A Jefferson Blvd PM 25 Minor Minor Traffic weaving truck volumes and grade
B 48th St PM 7 Minor Major Minor Minor Merge from SR 51 and SR 99
C Howe ave PM 9 Major Major Major weave between Howe and watt
D Mayhew Rd PM 12 Major Minor Major Weaving before Bradshaw Exit
E Routier Rd PM 14 Minor Major Weaving before Mather Field Rd Exit
F Sunrise Blvd PM 185 Minor Major Lane drop HOV add off-ramp queue
G Folsom Blvd PM 22 Minor Minor Lane drop 4 to 3
H El Dorado Hills Blvd PM 275 Major
Poorly coordinated traffic signal on arterial causes spillback onto freeway
a jefferson blvd bottleneck The bottleneck approximately located at Jefferson Blvd is due to weaving traffic as those entershying the freeway from Jefferson Blvd must cross those attempting to exit the freeway to I 5 There is a large number of trucks in the stream which struggle with the grade at this location exacerbatshying the bottleneck
[ 48 ] HigHway 50 corridor system management plan
c h a p t e r s e v e n c o n g e s t i o n a n d b o t t l e n e c k a n a l y s i s
b 48th St bottleneck The bottleneck approximately located at 48th St is due to the additional traffic merging from SR 51 and SR 99 combined with the eventual lane drop at 59th St This queue extends upstream past the off-ramp to SR 5199 These off-ramps are bottlenecks in themselves which spill back and choke the US 50 mainline
C Howe Ave Bottleneck The bottleneck at Howe ave is due to the entering traffic from Howe Ave Two Howe Ave on-ramps feed into US 50 eastbound southbound Howe ave loop on-ramp and northbound Howe ave direct ramp approximately 300 feet apart The watt avenue off-ramp is just down stream with heavy exiting volumes therefore the segment between Howe and watt is characterized by heavy weaving
D mayhew Rd Bottleneck The bottleneck approximately located at Mayhew Rd most likely begins with the additional traffic entering from Watt Ave and ends with the exiting traffic at Bradshaw Rd It is possible that there is a high proportion of weaving traffic with in this section (Watt Ave traffic moving to the left lane and those exiting at Bradshaw Rd moving to the right lane)
HigHway 50 corridor system management plan [ 49 ]
c h a p t e r s e v e n c o n g e s t i o n a n d b o t t l e n e c k a n a l y s i s
[ 50 ] HigHway 50 corridor system management plan
e routier rd bottleneck It is likely that the bottleneck at Routier Rd is due to the same merging conditions associated with Mayhew Rd The area is comprised of both residential and light industrialoffice land uses therefore during the PM peak period there are large volumes of vehicles entering at Bradshaw Rd moving to the left lanes and large volumes of vehicles moving to the right lane to exit at Mather Field Rd
f Sunrise blvd bottleneck At Sunrise Blvd the right-most lane exits while an HOV lane is added as the median lane The bottleneck is formed from vehicles shifting left to avoid exiting at Sunrise Blvd and to enter the HOV lane There is a large volume of vehicles queued at the Sunrise off-ramp which spills back and negatively affects the US 50 mainline
g folsom blvd bottleneck The right-most lane exits to Folsom Blvd leaving one HOV lane and two regular lanes along the US 50 The bottleneck is caused by this lane drop as well as the quick merge at the Folsom on-ramp
c h a p t e r s e v e n c o n g e s t i o n a n d b o t t l e n e c k a n a l y s i s
H The eastbound US 50 at El Dorado Hills Blvd Bottleneck The eastbound El Dorado Hills Blvd bottleneck is caused by a traffic signal on the arterial that often causes spillbacks on the EB loop offramp onto the freeway mainlines
TABLE 15 US 50 WESTBOUnD BOTTLEnECk SUmmARY Source PeMS Caltrans tach runs and Cambridge Systematics field observations
bottleneck Location PeMS Speed Contours Caltrans Probe Vehicle Runs
Cause aM PM aM PM
A El Dorado Hills Blvd PM 275 Major Poorly coordinated traffic
signal on El Dorado Hills Blvd
B Hazel Ave PM 21 Major Entering traffic
C Zinfandel Dr PM 16 Minor Major Major Major Entering traffic
D Routier Rd PM 14 Minor Major Minor Weaving traffic
E Bradshaw PM 13 Major Major Major Merging traffic and curve
F Howe Ave PM 9 Minor Major Major Major Weaving traffic and grade
G SR 51SR 99 PM 6 Minor Lane drop weaving traffic
H i-5 PM 3 Major Weaving traffic
HigHway 50 corridor system management plan [ 51 ]
c h a p t e r s e v e n c o n g e s t i o n a n d b o t t l e n e c k a n a l y s i s
[ 52 ] HigHway 50 corridor system management plan
A El Dorado Hills Blvd Bottleneck The minor bottleneck at El Dorado Hills Boulevard is caused by the traffic signal on El Dorado Hills Blvd that causes spillback on the westbound offramp onto the freeway mainlines
B Hazel Avenue Bottleneck In 2006 the Hazel Ave Bottleneck is caused by the traffic entering at both Hazel Ave and Folsom Blvd (the two on-ramps are separated by about one mile) The bottleneck that would appear at Folsom Blvd combines with the bottleneck at Hazel ave to form a large bottleneck that does not clear until after Hazel ave Sometimes causshying spillbacks as far as Prairies City Road this bottleneck was mitigated in 2007 as part of the GO CALIFORNIA program
C Zinfandel Dr Bottleneck There is heavy traffic coming from Sunrise Blvd but the lane addition immediately after the westbound on-ramp prevents a bottleneck from forming but as traffic flows westward the heavy traffic entering from Zinfandel Dr causes a bottleshyneck here
D Routier Rd Bottleneck The bottleneck at Routier Rd is caused by weaving traffic between Mather Field Rd and Bradshaw Rd This highway segment represents a transition area where vehicles that have been traveling in the left lanes begin to shift to the right lanes to exit while the entering traffic tries to shift to the left lanes
W eav in gLan e Dr o p
c h a p t e r s e v e n c o n g e s t i o n a n d b o t t l e n e c k a n a l y s i s
e bradshaw rd bottleneck The Bradshaw Rd bottleneck is caused by the entering traffic from Bradshaw Road the high truck volumes and the curve west of Bradshaw Two Bradshaw Rd on-ramps feed into US 50 westshybound southbound Bradshaw Rd direct on-ramp and northbound Bradshaw Rd loop on-ramp approximately 400 feet apart
F Howe Ave Bottleneck The Howe ave bottleneck is caused by a grade change and the weaving traffic entering from Howe ave and Hornet Dr competing for the right-most lane with those wanting to exit at 65th Street
G amp H SR 51SR 99 amp I-5 Bottleneck The bottleneck at I 5 is caused by the conflict between entering SR 99 and SR 51 traffic and exiting I-5 traffic as well as the queues formed on the ramps to i-5 which spill back onto US 50 The number of lanes in this section reaches a maximum of 6 and then drops to 4 as two lanes exit at the I-5 freeway This bottleneck is exacershybated during the peak periods when it stretches upstream to the lane drop before SR 99
W ea v in g
Lan e Dr o p
HigHway 50 corridor system management plan [ 53 ]
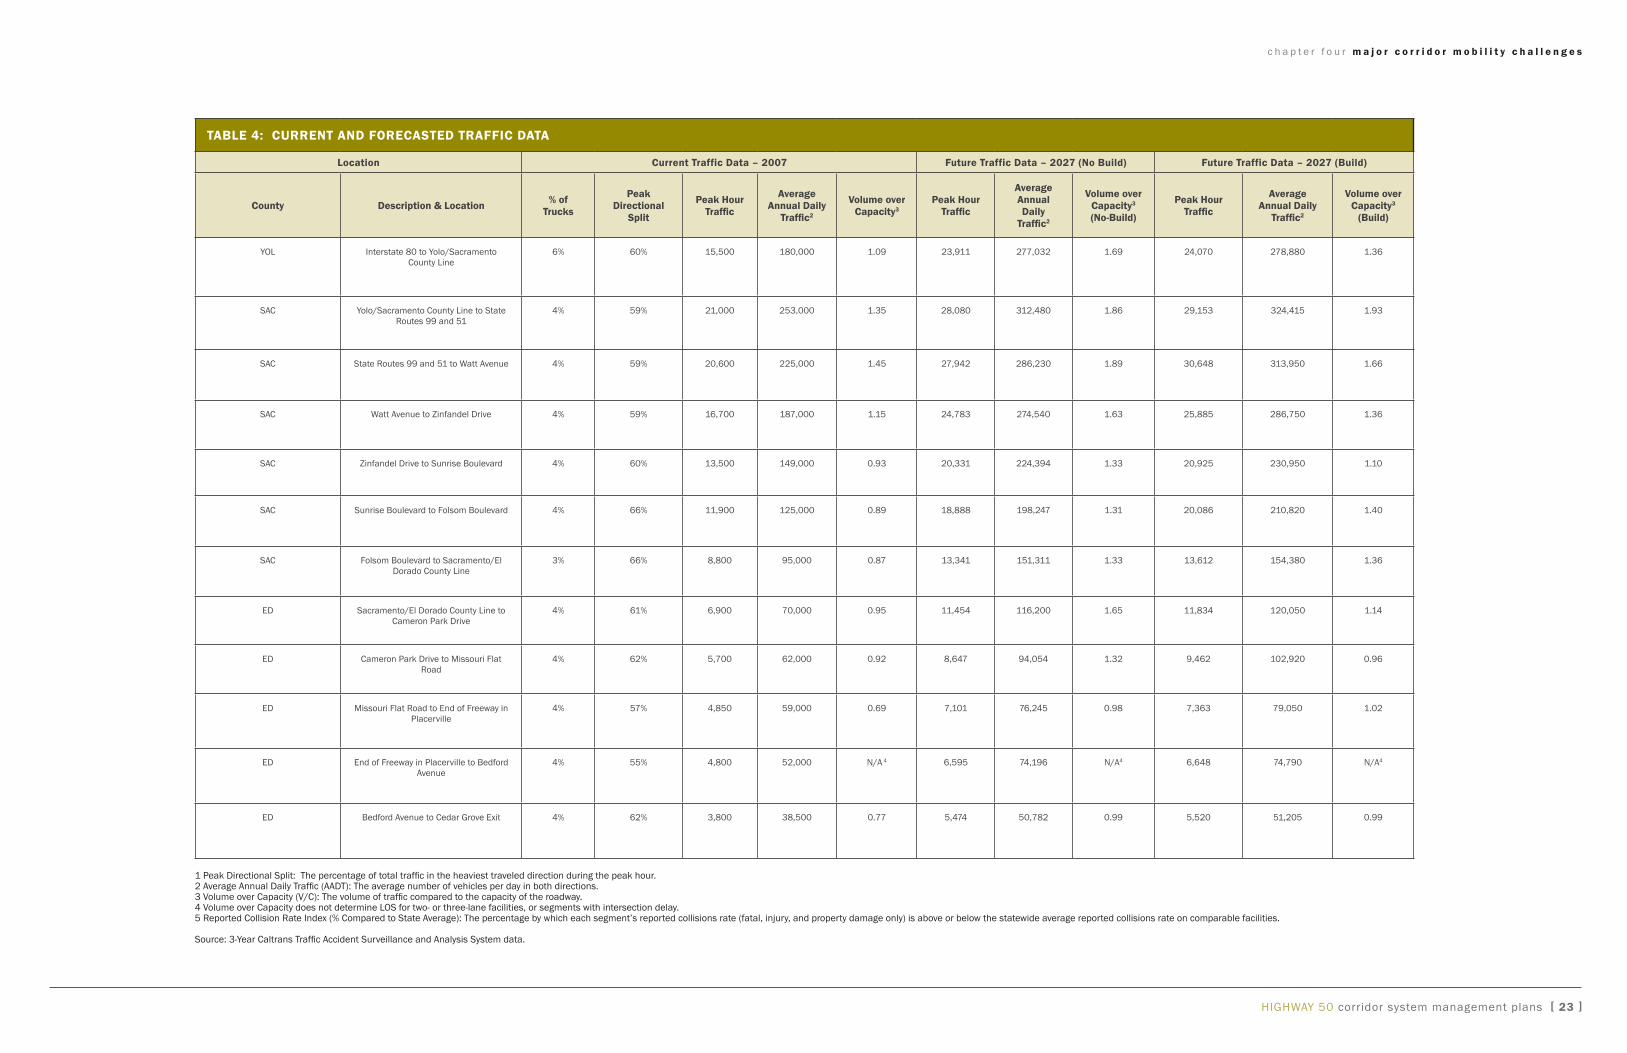
c h a p t e r f i v e p e r f o r m a n c e m e a s u r e s
Page Inte
ntionally
Left
Blank
[ 32 ] HigHway 50 corridor system management plan
c h a p t e r f i v e p e r f o r m a n c e m e a s u r e s
tabLe 8 traNSit PerforMaNCe MeaSure
County transit Provider route Performance Measure
available daily Capacity ()1 available Peak Hour Capacity1
traNSit
SaC
SacRT (Bus)
Route 21 70 10
Route 28 76 59
Route 36 83 74
Route 38 66 44
Route 72 56 20
Route 73 79 45
Route 74 82 43
Route 109 47 22
SacRT (Light Rail) Gold Line 31 Exceeds Capacity
EDSAC ED County Transit Authority
Commuter Express Bus Service Not applicablendashOperates Peak Hour
Only 405
iron Point Connector 764 Not available
Reverse Commuter Not applicablendashOperates Peak Hour Only 982
yoloSaC yolo County Transit District Not applicablendashOperates Peak Hour Only 498
biKe3
1 Source average Daily and Peak Hour available Capacity calculated from each transit providerrsquos route ridership data 2 The Reverse Commuter service is offered on vehicles that are returning to El Dorado County (Commuter Express Buses) 3 Bicycle performance measure(s) will be identified applied and included in the subsequent CSMPs
HigHway 50 corridor system management plan [ 33 ]
c h a p t e r f i v e p e r f o r m a n c e m e a s u r e s
[ 34 ] HigHway 50 corridor system management plan
Page Inte
ntionally
Left
Blank
planned corridor system management strategies
chapter six
ConCept LoS and ConCept FaCiLit y ldquoConcept LOSrdquo and ldquoConcept Facilityrdquo have traditionally been used in Caltrans TCCRs to reflect the minimum level or quality of operations acceptable for each route segment within the 20-year planning period and the highway facility needed in the next 20 years to maintain the Concept LOS
Typical Concept LOS standards in Caltrans District 3 are LOS ldquoDrdquo in rural areas and LOS ldquoErdquo in urban areas how-ever some heavily congested route segments now have a Concept LOS ldquoFrdquo because the improvements required to bring the LOS to ldquoErdquo are not feasible due to environmental right of way financial and other constraints The applica-tion of multi-modal corridor management strategies should reduce the severity and duration of congestion and provide viable travel options and information that will enable a traveler to avoid severe freeway congestion
The Concept LOS and Concept Facility for US 50 are shown in Table 9 almost all US 50 segments are forecasted to operate under LOS ldquoFrdquo conditions in 20 years under the No-Build and Build scenarios
Corridor ManageMent StrategieS The US 50 CSMP also proposes specific strategies to enhance corridor mobility (see Table 10) based on the fol-lowing principles
bull Manage all modes and facilities in the corridor as a single system beginning with the transportation net-work defined in this CSMP
bull Implement comprehensive and dynamic multimodal monitoring and reporting for the system and for all modes
bull Develop and use micro-simulation modeling to identify mobility challenges and to evaluate proposed solutions
bull Complete the projects included in the regional trans-portation plans with an emphasis on the completion of the key mobility improvement projects identified in this CSMP (see Tables 11 and 12)
bull Implement the specific strategies outlined in this CSMP
Key CapitaL projeCtS Tables 11 and 12 contain key capital projects that have been identified as the most critical to corridor mobility These are also included in the SaCOg MTP for 2035 and are either planned without any funding yet programmed are partially programmed
The US 50 CSMPor are entirely programmed SACOG conducted significant proposes specific
public attitude research strategies to enhance for the MTP for 2035 to corridor mobility complement comprehensive outreach efforts through community workshops the TALL Order Moving the Region Forward event the televised Town Hall Road Map for the Future and associated public polling The results of the SaCOg analyses and public out-reach for the MTP were
highway 50 corridor system management plan [ 35 ]
c h a p t e r s i x p l a n n e d c o r r i d o r s y s t e m m a n a g e m e n t s t r a t e g i e s
[ 36 ] HigHway 50 corridor system management plan
used when selecting the key projects for identification in
the CSMP and to ensure consistency Not all corridor projshyects in the MTP are included in the CSMP since the CSMP focuses on the managed network and the SaCOg MTP considers all streets and roads bike routes and transit services in the corridor
highway 50 partnership The Highway 50 Partnership is a cooperative public-private effort among the County of Sacramento City of Rancho
Cordova City of Folsom County of El Dorado and several major landowners that recognize the need to consider corrishydor mobility needs holistically
The Partnership has collaborated effectively to develop a Plan to improve mobility in the US 50 Corridor from Rancho
Cordova to El Dorado Hills an area identified as approprishyate for growth in the SACOG Blueprint Recognizing the
need to generate private investment the Partnership is seeking to implement a regional Highway 50 Corridor fee program to fund these projects
in addition to the key projects indicated in Table 11 Table 12 displays the key projects identified by the
Partnership
These projects include (1) Near-Term Priority Improvement Projects and (2) Near-Term Expected Roadway Improveshyments
The Near-term Priority improvement Projects would proshyvide several new roadway connections for people to travel within and through the area to avoid congestion They also include new transit routes and widening existing roadways
viewed by the Partnership as a package that would provide system-wide travel benefits These improvements targeted
for completion through 2012 would reduce vehicle hours of delay during commute hours by 30 percent
The near-Term Expected Roadway Improvements are conshysidered by the Partnership to be readily expected since they are tied to expected development or are part of a near-term
capital improvements program
Visionary projects Visionary projects are not yet included in the SaCOg MTP or EDCTC RTP but appear to offer considerable corridor mobilshyity benefits and merit further analysis and consideration for inclusion in the next MTP and RTP These are displayed in
Table 13
The ldquoPlus 10 Listrdquo in the SACOG MTP identifies projects
that are attractive from a performance standpoint but could not be included in the Final Project Lists because of financial constraint The ldquoPlus 10 Listrdquo element offers the
opportunity to include projects that would not be affordshyable without additional funding Some projects identified in
the Visionary Projects List were analyzed by SACOG during
development of the current MTP Some of these are included in the ldquoPlus 10 Listrdquo
Watt Avenue Light Rail Station Improvement Project
c h a p t e r s i x p l a n n e d c o r r i d o r s y s t e m m a n a g e m e n t s t r a t e g i e s
Table 9 US 50 ConCePT loS and FaCiliTy TyPe
location Forecasted level of Service1 (loS) and Facility Type
County description and location From Post Mile To Post Mile Current
loS1 20-year no build loS12
20-year build loS12
20-year Concept
loS13 existing Facility4 Concept Facility456 Ultimate Facility457
yOL interstate 80 to yoloSacramento County Line
000 316 F F F F 8F (6F between Jefferson Blvd ramps)
8F+2HOV+aux Lanes 8F+2HOV+aux Lanes
SaC yoloSacramento County Line to SR 99 and 51
L000 L248 = R000 F F F F 8F 8F+2HOV+aux Lanes 8F+2HOV+aux Lanes
SaC State Routes 99 and 51 to watt avenue R000 R534 F F F F 8F 8F+2HOV+aux Lanes 8F+2HOV+aux Lanes
SaC watt avenue to Zinfandel Drive R534 R1092 F F F F 8F 8F+2HOV+aux Lanes 8F+2HOV+aux Lanes
SaC Zinfandel Drive to Sunrise Boulevard R1092 1250 E F F F 8F 8F+2HOV+aux Lanes 8F+2HOV+aux Lanes
SaC Sunrise Boulevard to Folsom Boulevard 1250 1701 E F F F 6F+2HOV to Hazel ave 4F+2HOV
to Folsom Blvd
6F+2HOV+aux Lanes to Hazel ave 4F+2HOV+aux
Lanes to Folsom Blvd
8F+2HOV+aux Lanes
SaC Folsom Boulevard to SaCED County Line 1701 2314 D F F F 4F+2HOV 4F+2HOV+aux Lanes 6F+2HOV+aux Lanes
ED SacramentoEl Dorado County Line to Cameron Park Drive
000 R657 E F F F 4F 4F+2HOV+aux Lanes 6F+2HOV+aux Lanes
ED Cameron Park Drive to Missouri Flat Road R657 R1506 E F E E 4F 4F+2HOV+aux Lanes to greenstone 4F+aux Lanes
to Missouri Flat
6F+2HOV+aux Lanes to greenstone 4F+2HOV+aux Lanes
to Missouri Flat
ED Missouri Flat Road to End of Freeway in Placerville
R1506 1725 D F F F 4F 4F+aux Lanes 4F+aux Lanes
ED End of Freeway in Placerville to Bedford avenue
1725 1811 D E E E 4E 4E 4E
ED Bedford avenue to Cedar grove Exit 1811 R2595 D F F F 4F to Smith Flat 4E to Camino 4F+aux Lanes to Smith Flat 4E to Camino
4F+aux Lanes
1 Level of Service (LOS) A ldquoreport cardrdquo for evaluating traffic flow with ldquoArdquo being the best and ldquoFrdquo being the worst 2 20-year LOS (No Build) The LOS that would be expected at 20 years with no improvements 3 20-year Concept LOS The minimum acceptable LOS over the next 20 years 4 Facility Type Codes C=Conventional Highway E=Expressway F=Freeway HOV=High Occupancy Vehicle Lanes aux=auxiliary Lanes 5 Operational improvements are included in future facilities for all segments Examples of operational improvements include TOS improvements and auxiliary lanes 6 Concept Facility the future roadway with improvements needed in the next 20 years if LOS ldquoFrdquo no further degradation of service from existing ldquoFrdquo is acceptable as indicated by delay performance measurement 7 Ultimate Facility The future roadway with improvements needed beyond a 20 year timeframe
HigHway 50 corridor system management plans [ 37 ]
c h a p t e r f i v e p e r f o r m a n c e m e a s u r e s
Table 10 US 50 CSMP STraTegieS
Strategy description implementation Challenges
Maintain and operate the existing corridor multi-modal trans-
portation infrastructure
Maintain the existing investment in all modes of the transportation system and provide adequate resources for daily operations including operating
revenues for transit services
Funding availability funding competition within the region
Fully coordinate the delivery of transportation services and facili-ties in the corridor including daily operations and system planning
for enhancements
Interagency operational coordination to maximize the efficiency and effec-tiveness of all modes operating in the corridor with a focus on the CSMP transportation network defined in this CSMP Use of an existing group or
committee to provide initial oversight for this strategy
Diverse interests and competing priorities and limited resources
Construct planned and pro-grammed corridor capital improve-
ment projects
implementation of the capital improvements in the corridor included within the approved Metropolitan Transportation Plan and Regional Transportation
Plan for all transportation modes within the scope schedule and cost specified
Funding availability funding competition within the region
Comprehensive daily monitoring of the status of all modes providing service on the CSMP transporta-
tion network
Full deployment of multimodal transportation service status detection systems for all CSMP network components
Funding availability funding competition within region
Provide traveler information to the public
Provide the public with real-time easily accessible information regarding the status of all CSMP transportation system components so as to allow travel-
ers to make informed decisions about trip mode time and routing options
Funding availability funding competition within region
Continually monitor and analyze the CSMP transportation network to improve system performance
Monitor transportation performance measures and make system modifica-tions as appropriate on a frequent and timely basis Staff resources and data availability
Decrease the duration of non-recurrent traffic congestion
Expand and enhance the Freeway Service Patrol to respond to automobile accidents and vehicle break-downs
Funding availability funding competition within the region
Timely implementation of STaRNET
Expedite the implementation of the STaRNET operators of transportation facilities and emergency responders in the Sacramento region through real-time sharing of data and live video refinement of joint procedures
pertaining to the operation of roadways and public transit and public safety activities as well as enhance the regionrsquos 511 web site and interactive
telephone service to provide more traveler information
Developmental time acceptance by agencies and integration into daily use and identifica-
tion of maintenance and operations funding
Enhance transit and rail service increase transit service frequency provide express transit services imple-
ment bus rapid transit routes reduce headways for light rail and buses and construct planned light rail line extensions
Funding availability funding competition within the region
Complete Bus Carpool lane network
Complete the regional buscarpool lane network including freeway-to-freeway HOV lane connectors
Funding availability funding competition within the region Public agency and public
acceptance of network
[ 38 ] HigHway 50 corridor system management plan
c h a p t e r s i x p l a n n e d c o r r i d o r s y s t e m m a n a g e m e n t s t r a t e g i e s
tabLe 10 uS 50 CSMP StrategieS (ConTInued)
Strategy Description implementation Challenges
Enhance Transportation Demand Management strategies
Encourage employers to provide telecommuting and flexible working hour options to employees
acceptance by employers and resources to participate
Optimize the timing and synchronishyzation of traffic signals
Coordinate the optimization and timing of traffic signals on freeway ramps and along parallel and connecting roadways within and between jurisdicshytions to improve traffic flow and reduce congestion Provide signal priority
systems for transit vehicles
Funding availability and coordination among cities counties and Caltrans
improve access management of freeways and parallel connecting roadways
Develop and implement access management strategies to maintain the operational efficiency of freeways and parallelconnecting roadways
agreement between responsible jurisdicshytions as to where increased access control is needed increased access control on some parallelconnecting roadways may increase
traffic volumes on non-corridor roads
Develop innovative use of CMSs (eg travel times)
Potential uses of CMSs to improve system efficiency include the use of CMSs along portions of all corridors near transit station to indicate travel
times based on real-time existing traffic conditions on the freeway as well as on parallel roadways and express bus and light rail services CMS can also be used to identify the number of parking spaces that are still available at
the light-rail stations
Funding availability funding competition within the region
Implement amp expand Transit AVLTransit status information
enhancements for system users
Expand the use of AVL systems utilizing GPS technology to track in real-time the location of transit vehicles monitor transit schedules dispatch transit vehicles and provide real-time passenger information such as ldquonext busrdquo or
ldquonext trainrdquo arrival times
Funding availability funding competition within region
Expand Park-and-Ride lots at key locations
Add additional capacity to existing park-and-ride lots near transit stations and other locations that are approaching capacity
Funding availability funding competition within the region and available land
improve bike-pedestrian access in the CSMP
transportation network
Plan and program for construction of additional bicycle paths lanes and related improvements for access and connectivity to transit park and ride
lots and destination points
Funding availability funding competition within the region
Provide ldquoBike-SharingrdquordquoCar-Sharingrdquo tofrom transit (ldquoCarlinkrdquo) and from
neighborhoods
Expand the Regional Rideshare and Spare-the-Air programs to include bicycle and car sharing opportunities
Funding availability and coordination between SaCOg TMa air Districts employers developshyers property managers and local government
officials
Provide parking management stratshyegies in interested jurisdictions where applicable to discourage
use of single-occupant vehicles
in higher-density areas provide preferential parking for carpools and vanshypools require residential parking permits remove on-street parking and or provide graduated parking fees for metered on-street parking based on
vehicle type and time of day for SOV spaces to encourage transit use
Acceptance by businesses local officials and the general public
Expand bicycle commute amp transit fare strategiessubsidies
increase participation by large employers in programs that subsidize transit fares for employees during peak-hour commute times and provide bicycling
to work incentives
Voluntary participation by large employers to pay subsidy to transit providers
HigHway 50 corridor system management plan [ 39 ]
c h a p t e r s i x p l a n n e d c o r r i d o r s y s t e m m a n a g e m e n t s t r a t e g i e s
tabLe 11 KeY CaPitaL ProjeCtS
CountyLead agency
route roadway from to Project
Description Programmed
funds
additional funding Needed
total Cost estimate (x $1000)
Comp Year (FFY)
uS 50
Sacramento Caltrans District 3
US 50 Downtown watt avenue HOV Lanes $0 $75000 $75000 2020
Sacramento Caltrans District 3
US 50 watt avenue Sunrise Blvd HOV Lanes $165000 $0 $165000 2013
Sacramento Caltrans District 3
US 50 Bradshaw Road
Mather Field Road
Eastbound and Westbound Auxiliary Lanes
$0 $3700 $3700 2016
Sacramento Caltrans District 3
US 50 State Route 99
(Oak Park Interchange) interchange improvements including buscarpool lane
connectors $0 $150000 $150000 2014
Sacramento Caltrans District 3
US 50 interstate 5
(Riverfront Interchange) Riverfront Interchange
improvements including bus carpool lane connectors
$30000 $170000 $200000 2016
ED Caltrans District 3 US 50 Camino
Operational Safety improvements Construct an
undercrossing median barrier modify local road connections andor associated operational improvements on and adjacent
to US 50
$15000 $0 $15000 2012
ED ED County DOT US 50
west of Latrobe Road
west of Bass Lake
grade HOV Lanes (Ph1) $47141 $0 $47141 2010
ED Caltrans District 3 US 50
west of Bass Lake Road
Ponderosa Road
HOV Lanes (Ph2) $55000 $0 $55000 2011
ED Caltrans District 3 US 50 Ponderosa
Road greenstone
Road HOV Lanes (Ph3) $22357 $0 $22357 2013
ED ED County DOT US 50 Future Silva
Valley iC
Future Empire Ranch IC
Mainline Widening construct new WB lane within the
median from proposed Silva Valley IC to proposed Empire
Ranch IC
$2950 $0 $2950 2013
[ 40 ] HigHway 50 corridor system management plan
c h a p t e r s i x p l a n n e d c o r r i d o r s y s t e m m a n a g e m e n t s t r a t e g i e s
tabLe 11 KeY CaPitaL ProjeCtS (ConTInued)
CountyLead agency
route roadway from to Project
Description Programmed
funds
additional funding Needed
total Cost estimate (x $1000)
Comp Year (FFY)
PARALLEL AnD COnnECTInG ROADWAYS
ED ED County DOT
Silva Valley Parkway
Entrada Drive
Future US 50
Silva Valley Parkway iC
Widen Silva Valley Road from 2 lanes to 4 lanes includes
Class ii bike lanes and left turn storage pockets
$2921 $0 $2921 2010
ED ED County DOT
Silva Valley Parkway US 50
US50 Silva Valley Parkway (Phase 2) Includes constructshying overcrossing and ramps
signalization at EB and WB on off ramps
$57817 $0 $57817 2016
ED ED County DOT
Headington Road
Missouri Flat Road
El Dorado Road
Extend 2 lanes with median $9878 $0 $9878 2012
ED ED County DOT
Durock Road
Robin Lane South
Shingle Road
Extend 2 lanes with median $1239 $9214 $10453 2015
ED ED County DOT
Durock Road
Business Center Drive intersection signalization
includes adding turn pockets on Durock Road
$4333 $0 $4333 2009
ED City of Placerville
Point View Drive Broadway Smith Flat
Road Extend 2 lanes $1300 $0 $1300 2020
ED City of Placerville
western Placerville
US 50 interchange
Forni Road Ray Lawyer
Drive
Placerville Drive
Interchange Reconstruction convert Ray Lawyer Dr
Overcrossing to full IC Auxiliary Lanes
$5059 $34741 $39800 2020
Sacramento City of Rancho
Cordova
Mather Boulevard
Rockingham Road
Zinfandel Drive widen to 4 lanes $0 $8617 $8617 2020
Sacramento Rancho Cordova
Parkway ii
Grant Line Road
White Rock Road
New 6-lane expressway includshying intersection improvements at Kiefer Blvd amp White Rock
Road
$0 $44518 $44518 2020
Sacramento City of Folsom
Scott Road US 50 White Rock Rd
widen from 2 to 6 lanes $16000 $0 $16000 2020
Sacramento Sacramento County DOT
White Rock Road
Grant Line Rd
Prairie City Rd
Widen from 2 to 4 lanes realign near Nike and Nimbus Roads and connect with existshying alignment west of Prairie City Rd Realign Grant Line Rd to intersect with realigned
White Rock Rd
$26600 $0 $26600 2020
Sacramento Sacramento County DOT
Hazel avenue
US 50 Hazel Madison
Widen American River Bridge and approaches from 4 to 6 lanes Widen Hazel Avenue from AR Bridge to Madison from 4 to 6 lanes with Bike
LanesSignals
$83530 $0 $83530 2020
HigHway 50 corridor system management plan [ 41 ]
c h a p t e r s i x p l a n n e d c o r r i d o r s y s t e m m a n a g e m e n t s t r a t e g i e s
tabLe 11 KeY CaPitaL ProjeCtS (ConTInued)
CountyLead agency
route roadway from to Project
Description Programmed
funds
additional funding Needed
total Cost Estimate (x $1000)
Comp Year (FFY)
PARALLEL AnD COnnECTInG ROADWAYS
ED ED County DOT
green Valley Road
Salmon Falls Road
east
Deer Valley Road
widen from 2 to 4 lanes $0 $14576 $14576 2025
ED ED County DOT
green Valley Road
Deer Valley Road east Lotus Road widen $958 $4513 $5471 2015
ED ED County DOT
green Valley Road
Francisco Drive
Salmon Falls Road
widen from 2 to 4 lanes divided $412 $3491 $3903 2015
ED ED County DOT
Latrobe Road
investment Boulevard
golden Foothill Parkway
widen from 2 lanes undivided to 4 lanes
divided $1076 $8792 $9868 2015
ED ED County DOT
Latrobe Road
Carson Creek
White Rock Road
widen from 4 to 6 lanes $0 $23755 $23755 2025
ED ED County DOT
white Rock Road
EDSac County Line
Manchester Drive
widen 2 to 4 lanes divided includes signal interconnect and coorshy
dination
$0 $23755 $23755 2025
Sacramento City of Rancho
Cordova
Easton Valley
Parkway
Prairie City Road
Empire Ranch Road extenshysion south of
US 50
Construct new 4 lane road $0 $45000 $45000 2020
Sacramento Sacramento County DOT
Hazel avenue
Easton Valley
Parkway
Grant Line RoadWhite Rock Road
New road extension 4 lane limited access
through aerojet property $0 $18000 $18000 2018
Sacramento Sacramento County DOT
white Rock Road
Prairie City Road
ED County Line
widen to 4 lanes $8330 $64773 $73103 2018
Sacramento Sacramento County DOT
green Valley Road
East Natoma Sacramento ED County
line widen to 4 lanes $0 $3000 $3000 2018
Sacramento City of Rancho
Cordova
Zinfandel Drive
international Drive
Folsom Boulevard
widen to 4 lanes $0 $12000 $12000 2020
[ 42 ] HigHway 50 corridor system management plan
c h a p t e r s i x p l a n n e d c o r r i d o r s y s t e m m a n a g e m e n t s t r a t e g i e s
tabLe 11 KeY CaPitaL ProjeCtS (ConTInued)
CountyLead agency
route roadway from to Project
Description
Pro-grammed
funds
addi-tional
funding Needed
total Cost estimate (x $1000)
Comp Year (FFY)
traNSit
yolo amp Sacramento City of west Sacramento
amp City of Sacramento
Sacramento River
Crossing
15th Street in the City
of west Sacramento
Broadway in the City of
Sacramento
New all-modal river crossing (Auto Transit Bike amp Pedestrian)
from Sacramento across the Sacramento River to West
Sacramento The crossing was modeled between Broadway in Sacramento amp 15th Street in
West Sacramento but final alignshyment options will be studied in subsequent planning efforts
$800 $99200 $100000 2019
Sacramento Cal State University
Sacramento
CSUS Campus mdash mdash
Sac State Tram adjoining City streets and SRTD 65th Street light railbus transfer station Bus Rapid Transit System
$23574 $0 $23574 2013
Sacramento City of Rancho
Cordova
Rancho Cordova Various Various
New Service Rancho Cordova Pilot Transit Shuttle System new transit service for connection to
RTs Gold Line
$2380 $1500 $38880 2014
yolo amp Sacramento City of west Sacramento
TBD west
Sacramento Sacramento Streetcar Service between west
Sacramento and Downtown Sacramento
$17400 $54700 $72100 2014
Sacramento City of Rancho
Cordova RT Gold Line
RT Gold Line Tracks
Mather Field Road
Light Rail Grade Separations $0 $52888 $52888 2025
Sacramento City of Rancho
Cordova RT Gold Line
RT Gold Line Tracks Zinfandel Drive Light Rail Grade Separations $0 $52888 $52888 2025
Sacramento City of Rancho
Cordova RT Gold Line
RT Gold Line Tracks
Bradshaw Road
Light Rail Grade Separations $0 $35260 $35260 2025
Sacramento City of Rancho
Cordova RT Gold Line
RT Gold Line Tracks Routier Road Light Rail Grade Separations $0 $35260 $35260 2025
Sacramento City of
Sacramento Sacramento Valley Station
Sacramento intermodal Transportation Facility (Phase 1) - Develop intermodal transportashytion terminal for heavy rail light
rail and bus service
$77799 $0 $77799 2010
Sacramento City of
Sacramento Sacramento Valley Station
Sacramento intermodal Transportation Facility (Phase 2) - Develop intermodal transportashytion terminal for heavy rail light
rail and bus service
$24101 $1000 $25101 2014
HigHway 50 corridor system management plan [ 43 ]
c h a p t e r s i x p l a n n e d c o r r i d o r s y s t e m m a n a g e m e n t s t r a t e g i e s
TABLE 11 KEY CAPITAL PROJECTS (CONTINUED)
CountyLead Agency
Route Roadway From To Project
Description Programmed
Funds
Additional Funding Needed
Total Cost Es-timate (x $1000)
Comp Year (FFY)
BICYCLE ROUTES
Sacramento City of Rancho
Cordova
US 50Mather Field Road IC US 50 Mather
Field Road
US 50Mather Field Road PedestrianBike Crossing along
the Mather Airport RR Spur alignment
$0 $820 $1055 2015
ED ED County DOT
Sacramento Placerville
Transportation Corridor
Forni Rd
Missouri Flat Rd Class I Bike Trail $1423 $111 $1534 2009
ED City of Placerville
El Dorado Trail Western
Extension
Canal Street Main Street
Ray Lawyer DriveForni
Road Class 1 Bike Trail $1850 $0 $1850 2010
ED ED County DOT
US 50ED Hills Blvd IC US 50
El Dorado Hills Blvd
Latrobe Road
US 50El Dorado Hills Blvd Pedestrian Overcrossing $5508 $66 $5574 2014
TABLE 12 50 MOBILITY PARTNERSHIP KEY CAPITAL PROJECTS
RouteRoadway From To Project Description
NEAR TERM PRIORITY IMPROVEMENT PROJECTS
US 50 Sunrise Scott Road Auxiliary Lane
US 50 Hazel Avenue Interchange Improvements
Hazel Avenue Folsom Boulevard Easton Valley Parkway New 4 Lane Road
Easton Valley Parkway Hazel Avenue Rancho Cordova Parkway New 6 Lane Road
Rancho Cordova Parkway Easton Valley Parkway White Rock Road New 4 Lane Road
White Rock Road Sunrise Boulevard Silva Valley Parkway Widen to 4 Lanes
RT Gold Line Hazel Iron Point Station Passing Tracks
US 50 Rancho Cordova Parkway New Interchange
Zinfandel Drive South of International Douglas Road New 4 Lane Road
International Drive Kilgore Road Rancho Cordova Parkway New 6 Lane Road
Douglas Road Zinfandel Extension Sunrise Boulevard Widen to 4 Lanes
Sunrise LRT Citrus Road Sunrise Mall Bus Rapid TransitExpress Bus
[ 44 ] HIGHWAY 50 corridor system management plan
c h a p t e r s i x p l a n n e d c o r r i d o r s y s t e m m a n a g e m e n t s t r a t e g i e s
TABLE 12 50 mOBILITY PARTnERSHIP kEY CAPITAL PROjECTS (COnTInUED)
routeroadway from to Project Description
US 50 nEAR TERm PRIORITY ImPROVEmEnT PROjECTS
US 50 Empire Ranch Road New interchange
US 50 Silva Valley New interchange
US 50 Scott Road Empire Ranch Road Aux Lanes
US 50 Empire Ranch Road El Dorado Hills Boulevard Aux lanes and climbing lanes
US 50 El Dorado Hills Boulevard Silva Valley Parkway Aux lanes and climbing lanes
US 50 Silva Valley Parkway Bass Lake Road Aux lanes
Sunrise Boulevard White Rock Road Douglas Boulevard widen to 6 lanes
Sunrise Boulevard Douglas Boulevard Jackson Road widen to 4 lanes
White Rock Road Sunrise Boulevard Future Rancho Cordova Parkway and El Dorado County Line to Latrobe Road
widen to 4 lanes
Douglas Boulevard Sunrise Boulevard Grant Line Road widen to 4 lanes
Rancho Cordova Parkway Douglas Boulevard Rio del Oro Parkway New 2 lane road
Rancho Cordova Parkway Rio del Oro Parkway White Rock Road New 6 lane road
Jaeger Road Douglas Road Kiefer Boulevard New 4 lane road
Chrysanthy Sunrise Boulevard Americanos Boulevard New 4 lane road
Kiefer Boulevard Sunrise Boulevard Jaeger Road New 4 lane road
Grant Line Road Douglas Road Chrysanthy Road widen to 4 lanes
Hazel avenue Gold Country Boulevard Madison avenue widen to 6 lanes
Latrobe Road South of White Rock Road widen to 4 lanes
TABLE 13 VISIOnARY PROjECTS
County routeroadway from to Project Description
Sac yolo US 50 Enterprise Downtown Sacramento HOV Lanes
ED TBD Folsom Placerville Transit ndash Type TBD
ED New Road Latrobe Road White Rock Road (poten shy
tially US 50) New 2-lane road
HigHway 50 corridor system management plan [ 45 ]
c h a p t e r s i x p l a n n e d c o r r i d o r s y s t e m m a n a g e m e n t s t r a t e g i e s
[ 46 ] HigHway 50 corridor system management plan
Page Inte
ntionally
Left
Blank
congestion and bottleneck analysis
chapter seven
The 2000 Highway Capacity Manual defines a bottleneck
as ldquoa road element on which demand exceeds capacityrdquo
The bottleneck analysis evaluates specific causes of existshying recurrent traffic congestion in the corridor Freeway bottleneck locations that create mobility constraints are identified and documented and their relative contribution
to corridor-wide congestion is reported The bottleneck locations were determined based on a combination of the use of 2006 PeMS data HiCOMP report probe vehicle tach runs and field observations
Traffic congestion can be categorized as either recurrent
or non-recurrent
recurrent congestion occurs repeatedly at the same place and time of day in a predictable pattern Recurrent congesshytion is often associated with facility capacity limitations changes in capacity conflicting vehicle movements such
as lane merges inadequate number of transit vehicles to handle passenger loads or other persistent physical condishytions of the transportation facility
Non-recurrent congestion is usually attributed to collishysions equipment malfunction community events weather construction projects and other occasional occurrences When transportation systems are close to their maximum
carrying capacity non-recurrent congestion is more likely to occur as there is little excess capacity in the system
The location and extent of the bottlenecks on US 50 found
in the aM and PM peak periods are summarized in Tables 14 and 15 These depictions should be considered a snapshyshot view and not a comprehensive analysis of all bottleshynecks in the corridor Further work is being conducted to
refine the identification and causality of bottlenecks within
the corridor Table 14 shows a summary of the US 50 eastbound bottlenecks while the tables that follow discuss each bottleneck including location and possible causality Table 15 shows a summary of the US 50 westbound bottleshynecks while the tables that follow discuss each bottleneck including location and possible causality Minor or hidden bottlenecks are those Freeway bottleneck
that are not as defined locations that create (or severe) as the major mobility constraints bottlenecks Please note are identified and that the graphics accomshy documented and their panying the bottlenecks
relative contribution to are not to scale
corridor-wide congestion Major bottlenecks in the is reported eastbound direction during the aM peak period are at Howe avenue and during the PM peak period are at 48th Street Howe Avenue Mayhew Road Routier Road Sunrise Boulevard and El Dorado Hills Boulevard Major bottlenecks in the westbound direction during the aM peak period are at El Dorado Hills Boulevard Hazel Avenue Zinfandel Drive
HigHway 50 corridor system management plan [ 47 ]
c h a p t e r s e v e n c o n g e s t i o n a n d b o t t l e n e c k a n a l y s i s
Bradshaw Road and Howe Avenue and major bottleneck
locations during the PM peak period are at Zinfandel Drive Routier Road Bradshaw Road Howe Avenue and Intershystate 5
Causalities for these bottlenecks range from high-traffic
demand (congestion) heavy weavingmerging areas or physical constraints such as lane drops lack of ramp meters incomplete HOV network incomplete Auxiliary Lane
network poorly coordinated traffic signals and an off-ramp
queue (Sunrise Boulevard) US 50 Westbound Onramp
TABLE 14 US 50 EASTBOUnD BOTTLEnECk SUmmARY Source PeMS Caltrans tach runs and
Cambridge Systematics field observations
bottleneck Location PeMS Speed Contours Caltrans Probe Vehicle Runs
Cause aM PM aM PM
A Jefferson Blvd PM 25 Minor Minor Traffic weaving truck volumes and grade
B 48th St PM 7 Minor Major Minor Minor Merge from SR 51 and SR 99
C Howe ave PM 9 Major Major Major weave between Howe and watt
D Mayhew Rd PM 12 Major Minor Major Weaving before Bradshaw Exit
E Routier Rd PM 14 Minor Major Weaving before Mather Field Rd Exit
F Sunrise Blvd PM 185 Minor Major Lane drop HOV add off-ramp queue
G Folsom Blvd PM 22 Minor Minor Lane drop 4 to 3
H El Dorado Hills Blvd PM 275 Major
Poorly coordinated traffic signal on arterial causes spillback onto freeway
a jefferson blvd bottleneck The bottleneck approximately located at Jefferson Blvd is due to weaving traffic as those entershying the freeway from Jefferson Blvd must cross those attempting to exit the freeway to I 5 There is a large number of trucks in the stream which struggle with the grade at this location exacerbatshying the bottleneck
[ 48 ] HigHway 50 corridor system management plan
c h a p t e r s e v e n c o n g e s t i o n a n d b o t t l e n e c k a n a l y s i s
b 48th St bottleneck The bottleneck approximately located at 48th St is due to the additional traffic merging from SR 51 and SR 99 combined with the eventual lane drop at 59th St This queue extends upstream past the off-ramp to SR 5199 These off-ramps are bottlenecks in themselves which spill back and choke the US 50 mainline
C Howe Ave Bottleneck The bottleneck at Howe ave is due to the entering traffic from Howe Ave Two Howe Ave on-ramps feed into US 50 eastbound southbound Howe ave loop on-ramp and northbound Howe ave direct ramp approximately 300 feet apart The watt avenue off-ramp is just down stream with heavy exiting volumes therefore the segment between Howe and watt is characterized by heavy weaving
D mayhew Rd Bottleneck The bottleneck approximately located at Mayhew Rd most likely begins with the additional traffic entering from Watt Ave and ends with the exiting traffic at Bradshaw Rd It is possible that there is a high proportion of weaving traffic with in this section (Watt Ave traffic moving to the left lane and those exiting at Bradshaw Rd moving to the right lane)
HigHway 50 corridor system management plan [ 49 ]
c h a p t e r s e v e n c o n g e s t i o n a n d b o t t l e n e c k a n a l y s i s
[ 50 ] HigHway 50 corridor system management plan
e routier rd bottleneck It is likely that the bottleneck at Routier Rd is due to the same merging conditions associated with Mayhew Rd The area is comprised of both residential and light industrialoffice land uses therefore during the PM peak period there are large volumes of vehicles entering at Bradshaw Rd moving to the left lanes and large volumes of vehicles moving to the right lane to exit at Mather Field Rd
f Sunrise blvd bottleneck At Sunrise Blvd the right-most lane exits while an HOV lane is added as the median lane The bottleneck is formed from vehicles shifting left to avoid exiting at Sunrise Blvd and to enter the HOV lane There is a large volume of vehicles queued at the Sunrise off-ramp which spills back and negatively affects the US 50 mainline
g folsom blvd bottleneck The right-most lane exits to Folsom Blvd leaving one HOV lane and two regular lanes along the US 50 The bottleneck is caused by this lane drop as well as the quick merge at the Folsom on-ramp
c h a p t e r s e v e n c o n g e s t i o n a n d b o t t l e n e c k a n a l y s i s
H The eastbound US 50 at El Dorado Hills Blvd Bottleneck The eastbound El Dorado Hills Blvd bottleneck is caused by a traffic signal on the arterial that often causes spillbacks on the EB loop offramp onto the freeway mainlines
TABLE 15 US 50 WESTBOUnD BOTTLEnECk SUmmARY Source PeMS Caltrans tach runs and Cambridge Systematics field observations
bottleneck Location PeMS Speed Contours Caltrans Probe Vehicle Runs
Cause aM PM aM PM
A El Dorado Hills Blvd PM 275 Major Poorly coordinated traffic
signal on El Dorado Hills Blvd
B Hazel Ave PM 21 Major Entering traffic
C Zinfandel Dr PM 16 Minor Major Major Major Entering traffic
D Routier Rd PM 14 Minor Major Minor Weaving traffic
E Bradshaw PM 13 Major Major Major Merging traffic and curve
F Howe Ave PM 9 Minor Major Major Major Weaving traffic and grade
G SR 51SR 99 PM 6 Minor Lane drop weaving traffic
H i-5 PM 3 Major Weaving traffic
HigHway 50 corridor system management plan [ 51 ]
c h a p t e r s e v e n c o n g e s t i o n a n d b o t t l e n e c k a n a l y s i s
[ 52 ] HigHway 50 corridor system management plan
A El Dorado Hills Blvd Bottleneck The minor bottleneck at El Dorado Hills Boulevard is caused by the traffic signal on El Dorado Hills Blvd that causes spillback on the westbound offramp onto the freeway mainlines
B Hazel Avenue Bottleneck In 2006 the Hazel Ave Bottleneck is caused by the traffic entering at both Hazel Ave and Folsom Blvd (the two on-ramps are separated by about one mile) The bottleneck that would appear at Folsom Blvd combines with the bottleneck at Hazel ave to form a large bottleneck that does not clear until after Hazel ave Sometimes causshying spillbacks as far as Prairies City Road this bottleneck was mitigated in 2007 as part of the GO CALIFORNIA program
C Zinfandel Dr Bottleneck There is heavy traffic coming from Sunrise Blvd but the lane addition immediately after the westbound on-ramp prevents a bottleneck from forming but as traffic flows westward the heavy traffic entering from Zinfandel Dr causes a bottleshyneck here
D Routier Rd Bottleneck The bottleneck at Routier Rd is caused by weaving traffic between Mather Field Rd and Bradshaw Rd This highway segment represents a transition area where vehicles that have been traveling in the left lanes begin to shift to the right lanes to exit while the entering traffic tries to shift to the left lanes
W eav in gLan e Dr o p
c h a p t e r s e v e n c o n g e s t i o n a n d b o t t l e n e c k a n a l y s i s
e bradshaw rd bottleneck The Bradshaw Rd bottleneck is caused by the entering traffic from Bradshaw Road the high truck volumes and the curve west of Bradshaw Two Bradshaw Rd on-ramps feed into US 50 westshybound southbound Bradshaw Rd direct on-ramp and northbound Bradshaw Rd loop on-ramp approximately 400 feet apart
F Howe Ave Bottleneck The Howe ave bottleneck is caused by a grade change and the weaving traffic entering from Howe ave and Hornet Dr competing for the right-most lane with those wanting to exit at 65th Street
G amp H SR 51SR 99 amp I-5 Bottleneck The bottleneck at I 5 is caused by the conflict between entering SR 99 and SR 51 traffic and exiting I-5 traffic as well as the queues formed on the ramps to i-5 which spill back onto US 50 The number of lanes in this section reaches a maximum of 6 and then drops to 4 as two lanes exit at the I-5 freeway This bottleneck is exacershybated during the peak periods when it stretches upstream to the lane drop before SR 99
W ea v in g
Lan e Dr o p
HigHway 50 corridor system management plan [ 53 ]
c h a p t e r f i v e p e r f o r m a n c e m e a s u r e s
tabLe 8 traNSit PerforMaNCe MeaSure
County transit Provider route Performance Measure
available daily Capacity ()1 available Peak Hour Capacity1
traNSit
SaC
SacRT (Bus)
Route 21 70 10
Route 28 76 59
Route 36 83 74
Route 38 66 44
Route 72 56 20
Route 73 79 45
Route 74 82 43
Route 109 47 22
SacRT (Light Rail) Gold Line 31 Exceeds Capacity
EDSAC ED County Transit Authority
Commuter Express Bus Service Not applicablendashOperates Peak Hour
Only 405
iron Point Connector 764 Not available
Reverse Commuter Not applicablendashOperates Peak Hour Only 982
yoloSaC yolo County Transit District Not applicablendashOperates Peak Hour Only 498
biKe3
1 Source average Daily and Peak Hour available Capacity calculated from each transit providerrsquos route ridership data 2 The Reverse Commuter service is offered on vehicles that are returning to El Dorado County (Commuter Express Buses) 3 Bicycle performance measure(s) will be identified applied and included in the subsequent CSMPs
HigHway 50 corridor system management plan [ 33 ]
c h a p t e r f i v e p e r f o r m a n c e m e a s u r e s
[ 34 ] HigHway 50 corridor system management plan
Page Inte
ntionally
Left
Blank
planned corridor system management strategies
chapter six
ConCept LoS and ConCept FaCiLit y ldquoConcept LOSrdquo and ldquoConcept Facilityrdquo have traditionally been used in Caltrans TCCRs to reflect the minimum level or quality of operations acceptable for each route segment within the 20-year planning period and the highway facility needed in the next 20 years to maintain the Concept LOS
Typical Concept LOS standards in Caltrans District 3 are LOS ldquoDrdquo in rural areas and LOS ldquoErdquo in urban areas how-ever some heavily congested route segments now have a Concept LOS ldquoFrdquo because the improvements required to bring the LOS to ldquoErdquo are not feasible due to environmental right of way financial and other constraints The applica-tion of multi-modal corridor management strategies should reduce the severity and duration of congestion and provide viable travel options and information that will enable a traveler to avoid severe freeway congestion
The Concept LOS and Concept Facility for US 50 are shown in Table 9 almost all US 50 segments are forecasted to operate under LOS ldquoFrdquo conditions in 20 years under the No-Build and Build scenarios
Corridor ManageMent StrategieS The US 50 CSMP also proposes specific strategies to enhance corridor mobility (see Table 10) based on the fol-lowing principles
bull Manage all modes and facilities in the corridor as a single system beginning with the transportation net-work defined in this CSMP
bull Implement comprehensive and dynamic multimodal monitoring and reporting for the system and for all modes
bull Develop and use micro-simulation modeling to identify mobility challenges and to evaluate proposed solutions
bull Complete the projects included in the regional trans-portation plans with an emphasis on the completion of the key mobility improvement projects identified in this CSMP (see Tables 11 and 12)
bull Implement the specific strategies outlined in this CSMP
Key CapitaL projeCtS Tables 11 and 12 contain key capital projects that have been identified as the most critical to corridor mobility These are also included in the SaCOg MTP for 2035 and are either planned without any funding yet programmed are partially programmed
The US 50 CSMPor are entirely programmed SACOG conducted significant proposes specific
public attitude research strategies to enhance for the MTP for 2035 to corridor mobility complement comprehensive outreach efforts through community workshops the TALL Order Moving the Region Forward event the televised Town Hall Road Map for the Future and associated public polling The results of the SaCOg analyses and public out-reach for the MTP were
highway 50 corridor system management plan [ 35 ]
c h a p t e r s i x p l a n n e d c o r r i d o r s y s t e m m a n a g e m e n t s t r a t e g i e s
[ 36 ] HigHway 50 corridor system management plan
used when selecting the key projects for identification in
the CSMP and to ensure consistency Not all corridor projshyects in the MTP are included in the CSMP since the CSMP focuses on the managed network and the SaCOg MTP considers all streets and roads bike routes and transit services in the corridor
highway 50 partnership The Highway 50 Partnership is a cooperative public-private effort among the County of Sacramento City of Rancho
Cordova City of Folsom County of El Dorado and several major landowners that recognize the need to consider corrishydor mobility needs holistically
The Partnership has collaborated effectively to develop a Plan to improve mobility in the US 50 Corridor from Rancho
Cordova to El Dorado Hills an area identified as approprishyate for growth in the SACOG Blueprint Recognizing the
need to generate private investment the Partnership is seeking to implement a regional Highway 50 Corridor fee program to fund these projects
in addition to the key projects indicated in Table 11 Table 12 displays the key projects identified by the
Partnership
These projects include (1) Near-Term Priority Improvement Projects and (2) Near-Term Expected Roadway Improveshyments
The Near-term Priority improvement Projects would proshyvide several new roadway connections for people to travel within and through the area to avoid congestion They also include new transit routes and widening existing roadways
viewed by the Partnership as a package that would provide system-wide travel benefits These improvements targeted
for completion through 2012 would reduce vehicle hours of delay during commute hours by 30 percent
The near-Term Expected Roadway Improvements are conshysidered by the Partnership to be readily expected since they are tied to expected development or are part of a near-term
capital improvements program
Visionary projects Visionary projects are not yet included in the SaCOg MTP or EDCTC RTP but appear to offer considerable corridor mobilshyity benefits and merit further analysis and consideration for inclusion in the next MTP and RTP These are displayed in
Table 13
The ldquoPlus 10 Listrdquo in the SACOG MTP identifies projects
that are attractive from a performance standpoint but could not be included in the Final Project Lists because of financial constraint The ldquoPlus 10 Listrdquo element offers the
opportunity to include projects that would not be affordshyable without additional funding Some projects identified in
the Visionary Projects List were analyzed by SACOG during
development of the current MTP Some of these are included in the ldquoPlus 10 Listrdquo
Watt Avenue Light Rail Station Improvement Project
c h a p t e r s i x p l a n n e d c o r r i d o r s y s t e m m a n a g e m e n t s t r a t e g i e s
Table 9 US 50 ConCePT loS and FaCiliTy TyPe
location Forecasted level of Service1 (loS) and Facility Type
County description and location From Post Mile To Post Mile Current
loS1 20-year no build loS12
20-year build loS12
20-year Concept
loS13 existing Facility4 Concept Facility456 Ultimate Facility457
yOL interstate 80 to yoloSacramento County Line
000 316 F F F F 8F (6F between Jefferson Blvd ramps)
8F+2HOV+aux Lanes 8F+2HOV+aux Lanes
SaC yoloSacramento County Line to SR 99 and 51
L000 L248 = R000 F F F F 8F 8F+2HOV+aux Lanes 8F+2HOV+aux Lanes
SaC State Routes 99 and 51 to watt avenue R000 R534 F F F F 8F 8F+2HOV+aux Lanes 8F+2HOV+aux Lanes
SaC watt avenue to Zinfandel Drive R534 R1092 F F F F 8F 8F+2HOV+aux Lanes 8F+2HOV+aux Lanes
SaC Zinfandel Drive to Sunrise Boulevard R1092 1250 E F F F 8F 8F+2HOV+aux Lanes 8F+2HOV+aux Lanes
SaC Sunrise Boulevard to Folsom Boulevard 1250 1701 E F F F 6F+2HOV to Hazel ave 4F+2HOV
to Folsom Blvd
6F+2HOV+aux Lanes to Hazel ave 4F+2HOV+aux
Lanes to Folsom Blvd
8F+2HOV+aux Lanes
SaC Folsom Boulevard to SaCED County Line 1701 2314 D F F F 4F+2HOV 4F+2HOV+aux Lanes 6F+2HOV+aux Lanes
ED SacramentoEl Dorado County Line to Cameron Park Drive
000 R657 E F F F 4F 4F+2HOV+aux Lanes 6F+2HOV+aux Lanes
ED Cameron Park Drive to Missouri Flat Road R657 R1506 E F E E 4F 4F+2HOV+aux Lanes to greenstone 4F+aux Lanes
to Missouri Flat
6F+2HOV+aux Lanes to greenstone 4F+2HOV+aux Lanes
to Missouri Flat
ED Missouri Flat Road to End of Freeway in Placerville
R1506 1725 D F F F 4F 4F+aux Lanes 4F+aux Lanes
ED End of Freeway in Placerville to Bedford avenue
1725 1811 D E E E 4E 4E 4E
ED Bedford avenue to Cedar grove Exit 1811 R2595 D F F F 4F to Smith Flat 4E to Camino 4F+aux Lanes to Smith Flat 4E to Camino
4F+aux Lanes
1 Level of Service (LOS) A ldquoreport cardrdquo for evaluating traffic flow with ldquoArdquo being the best and ldquoFrdquo being the worst 2 20-year LOS (No Build) The LOS that would be expected at 20 years with no improvements 3 20-year Concept LOS The minimum acceptable LOS over the next 20 years 4 Facility Type Codes C=Conventional Highway E=Expressway F=Freeway HOV=High Occupancy Vehicle Lanes aux=auxiliary Lanes 5 Operational improvements are included in future facilities for all segments Examples of operational improvements include TOS improvements and auxiliary lanes 6 Concept Facility the future roadway with improvements needed in the next 20 years if LOS ldquoFrdquo no further degradation of service from existing ldquoFrdquo is acceptable as indicated by delay performance measurement 7 Ultimate Facility The future roadway with improvements needed beyond a 20 year timeframe
HigHway 50 corridor system management plans [ 37 ]
c h a p t e r f i v e p e r f o r m a n c e m e a s u r e s
Table 10 US 50 CSMP STraTegieS
Strategy description implementation Challenges
Maintain and operate the existing corridor multi-modal trans-
portation infrastructure
Maintain the existing investment in all modes of the transportation system and provide adequate resources for daily operations including operating
revenues for transit services
Funding availability funding competition within the region
Fully coordinate the delivery of transportation services and facili-ties in the corridor including daily operations and system planning
for enhancements
Interagency operational coordination to maximize the efficiency and effec-tiveness of all modes operating in the corridor with a focus on the CSMP transportation network defined in this CSMP Use of an existing group or
committee to provide initial oversight for this strategy
Diverse interests and competing priorities and limited resources
Construct planned and pro-grammed corridor capital improve-
ment projects
implementation of the capital improvements in the corridor included within the approved Metropolitan Transportation Plan and Regional Transportation
Plan for all transportation modes within the scope schedule and cost specified
Funding availability funding competition within the region
Comprehensive daily monitoring of the status of all modes providing service on the CSMP transporta-
tion network
Full deployment of multimodal transportation service status detection systems for all CSMP network components
Funding availability funding competition within region
Provide traveler information to the public
Provide the public with real-time easily accessible information regarding the status of all CSMP transportation system components so as to allow travel-
ers to make informed decisions about trip mode time and routing options
Funding availability funding competition within region
Continually monitor and analyze the CSMP transportation network to improve system performance
Monitor transportation performance measures and make system modifica-tions as appropriate on a frequent and timely basis Staff resources and data availability
Decrease the duration of non-recurrent traffic congestion
Expand and enhance the Freeway Service Patrol to respond to automobile accidents and vehicle break-downs
Funding availability funding competition within the region
Timely implementation of STaRNET
Expedite the implementation of the STaRNET operators of transportation facilities and emergency responders in the Sacramento region through real-time sharing of data and live video refinement of joint procedures
pertaining to the operation of roadways and public transit and public safety activities as well as enhance the regionrsquos 511 web site and interactive
telephone service to provide more traveler information
Developmental time acceptance by agencies and integration into daily use and identifica-
tion of maintenance and operations funding
Enhance transit and rail service increase transit service frequency provide express transit services imple-
ment bus rapid transit routes reduce headways for light rail and buses and construct planned light rail line extensions
Funding availability funding competition within the region
Complete Bus Carpool lane network
Complete the regional buscarpool lane network including freeway-to-freeway HOV lane connectors
Funding availability funding competition within the region Public agency and public
acceptance of network
[ 38 ] HigHway 50 corridor system management plan
c h a p t e r s i x p l a n n e d c o r r i d o r s y s t e m m a n a g e m e n t s t r a t e g i e s
tabLe 10 uS 50 CSMP StrategieS (ConTInued)
Strategy Description implementation Challenges
Enhance Transportation Demand Management strategies
Encourage employers to provide telecommuting and flexible working hour options to employees
acceptance by employers and resources to participate
Optimize the timing and synchronishyzation of traffic signals
Coordinate the optimization and timing of traffic signals on freeway ramps and along parallel and connecting roadways within and between jurisdicshytions to improve traffic flow and reduce congestion Provide signal priority
systems for transit vehicles
Funding availability and coordination among cities counties and Caltrans
improve access management of freeways and parallel connecting roadways
Develop and implement access management strategies to maintain the operational efficiency of freeways and parallelconnecting roadways
agreement between responsible jurisdicshytions as to where increased access control is needed increased access control on some parallelconnecting roadways may increase
traffic volumes on non-corridor roads
Develop innovative use of CMSs (eg travel times)
Potential uses of CMSs to improve system efficiency include the use of CMSs along portions of all corridors near transit station to indicate travel
times based on real-time existing traffic conditions on the freeway as well as on parallel roadways and express bus and light rail services CMS can also be used to identify the number of parking spaces that are still available at
the light-rail stations
Funding availability funding competition within the region
Implement amp expand Transit AVLTransit status information
enhancements for system users
Expand the use of AVL systems utilizing GPS technology to track in real-time the location of transit vehicles monitor transit schedules dispatch transit vehicles and provide real-time passenger information such as ldquonext busrdquo or
ldquonext trainrdquo arrival times
Funding availability funding competition within region
Expand Park-and-Ride lots at key locations
Add additional capacity to existing park-and-ride lots near transit stations and other locations that are approaching capacity
Funding availability funding competition within the region and available land
improve bike-pedestrian access in the CSMP
transportation network
Plan and program for construction of additional bicycle paths lanes and related improvements for access and connectivity to transit park and ride
lots and destination points
Funding availability funding competition within the region
Provide ldquoBike-SharingrdquordquoCar-Sharingrdquo tofrom transit (ldquoCarlinkrdquo) and from
neighborhoods
Expand the Regional Rideshare and Spare-the-Air programs to include bicycle and car sharing opportunities
Funding availability and coordination between SaCOg TMa air Districts employers developshyers property managers and local government
officials
Provide parking management stratshyegies in interested jurisdictions where applicable to discourage
use of single-occupant vehicles
in higher-density areas provide preferential parking for carpools and vanshypools require residential parking permits remove on-street parking and or provide graduated parking fees for metered on-street parking based on
vehicle type and time of day for SOV spaces to encourage transit use
Acceptance by businesses local officials and the general public
Expand bicycle commute amp transit fare strategiessubsidies
increase participation by large employers in programs that subsidize transit fares for employees during peak-hour commute times and provide bicycling
to work incentives
Voluntary participation by large employers to pay subsidy to transit providers
HigHway 50 corridor system management plan [ 39 ]
c h a p t e r s i x p l a n n e d c o r r i d o r s y s t e m m a n a g e m e n t s t r a t e g i e s
tabLe 11 KeY CaPitaL ProjeCtS
CountyLead agency
route roadway from to Project
Description Programmed
funds
additional funding Needed
total Cost estimate (x $1000)
Comp Year (FFY)
uS 50
Sacramento Caltrans District 3
US 50 Downtown watt avenue HOV Lanes $0 $75000 $75000 2020
Sacramento Caltrans District 3
US 50 watt avenue Sunrise Blvd HOV Lanes $165000 $0 $165000 2013
Sacramento Caltrans District 3
US 50 Bradshaw Road
Mather Field Road
Eastbound and Westbound Auxiliary Lanes
$0 $3700 $3700 2016
Sacramento Caltrans District 3
US 50 State Route 99
(Oak Park Interchange) interchange improvements including buscarpool lane
connectors $0 $150000 $150000 2014
Sacramento Caltrans District 3
US 50 interstate 5
(Riverfront Interchange) Riverfront Interchange
improvements including bus carpool lane connectors
$30000 $170000 $200000 2016
ED Caltrans District 3 US 50 Camino
Operational Safety improvements Construct an
undercrossing median barrier modify local road connections andor associated operational improvements on and adjacent
to US 50
$15000 $0 $15000 2012
ED ED County DOT US 50
west of Latrobe Road
west of Bass Lake
grade HOV Lanes (Ph1) $47141 $0 $47141 2010
ED Caltrans District 3 US 50
west of Bass Lake Road
Ponderosa Road
HOV Lanes (Ph2) $55000 $0 $55000 2011
ED Caltrans District 3 US 50 Ponderosa
Road greenstone
Road HOV Lanes (Ph3) $22357 $0 $22357 2013
ED ED County DOT US 50 Future Silva
Valley iC
Future Empire Ranch IC
Mainline Widening construct new WB lane within the
median from proposed Silva Valley IC to proposed Empire
Ranch IC
$2950 $0 $2950 2013
[ 40 ] HigHway 50 corridor system management plan
c h a p t e r s i x p l a n n e d c o r r i d o r s y s t e m m a n a g e m e n t s t r a t e g i e s
tabLe 11 KeY CaPitaL ProjeCtS (ConTInued)
CountyLead agency
route roadway from to Project
Description Programmed
funds
additional funding Needed
total Cost estimate (x $1000)
Comp Year (FFY)
PARALLEL AnD COnnECTInG ROADWAYS
ED ED County DOT
Silva Valley Parkway
Entrada Drive
Future US 50
Silva Valley Parkway iC
Widen Silva Valley Road from 2 lanes to 4 lanes includes
Class ii bike lanes and left turn storage pockets
$2921 $0 $2921 2010
ED ED County DOT
Silva Valley Parkway US 50
US50 Silva Valley Parkway (Phase 2) Includes constructshying overcrossing and ramps
signalization at EB and WB on off ramps
$57817 $0 $57817 2016
ED ED County DOT
Headington Road
Missouri Flat Road
El Dorado Road
Extend 2 lanes with median $9878 $0 $9878 2012
ED ED County DOT
Durock Road
Robin Lane South
Shingle Road
Extend 2 lanes with median $1239 $9214 $10453 2015
ED ED County DOT
Durock Road
Business Center Drive intersection signalization
includes adding turn pockets on Durock Road
$4333 $0 $4333 2009
ED City of Placerville
Point View Drive Broadway Smith Flat
Road Extend 2 lanes $1300 $0 $1300 2020
ED City of Placerville
western Placerville
US 50 interchange
Forni Road Ray Lawyer
Drive
Placerville Drive
Interchange Reconstruction convert Ray Lawyer Dr
Overcrossing to full IC Auxiliary Lanes
$5059 $34741 $39800 2020
Sacramento City of Rancho
Cordova
Mather Boulevard
Rockingham Road
Zinfandel Drive widen to 4 lanes $0 $8617 $8617 2020
Sacramento Rancho Cordova
Parkway ii
Grant Line Road
White Rock Road
New 6-lane expressway includshying intersection improvements at Kiefer Blvd amp White Rock
Road
$0 $44518 $44518 2020
Sacramento City of Folsom
Scott Road US 50 White Rock Rd
widen from 2 to 6 lanes $16000 $0 $16000 2020
Sacramento Sacramento County DOT
White Rock Road
Grant Line Rd
Prairie City Rd
Widen from 2 to 4 lanes realign near Nike and Nimbus Roads and connect with existshying alignment west of Prairie City Rd Realign Grant Line Rd to intersect with realigned
White Rock Rd
$26600 $0 $26600 2020
Sacramento Sacramento County DOT
Hazel avenue
US 50 Hazel Madison
Widen American River Bridge and approaches from 4 to 6 lanes Widen Hazel Avenue from AR Bridge to Madison from 4 to 6 lanes with Bike
LanesSignals
$83530 $0 $83530 2020
HigHway 50 corridor system management plan [ 41 ]
c h a p t e r s i x p l a n n e d c o r r i d o r s y s t e m m a n a g e m e n t s t r a t e g i e s
tabLe 11 KeY CaPitaL ProjeCtS (ConTInued)
CountyLead agency
route roadway from to Project
Description Programmed
funds
additional funding Needed
total Cost Estimate (x $1000)
Comp Year (FFY)
PARALLEL AnD COnnECTInG ROADWAYS
ED ED County DOT
green Valley Road
Salmon Falls Road
east
Deer Valley Road
widen from 2 to 4 lanes $0 $14576 $14576 2025
ED ED County DOT
green Valley Road
Deer Valley Road east Lotus Road widen $958 $4513 $5471 2015
ED ED County DOT
green Valley Road
Francisco Drive
Salmon Falls Road
widen from 2 to 4 lanes divided $412 $3491 $3903 2015
ED ED County DOT
Latrobe Road
investment Boulevard
golden Foothill Parkway
widen from 2 lanes undivided to 4 lanes
divided $1076 $8792 $9868 2015
ED ED County DOT
Latrobe Road
Carson Creek
White Rock Road
widen from 4 to 6 lanes $0 $23755 $23755 2025
ED ED County DOT
white Rock Road
EDSac County Line
Manchester Drive
widen 2 to 4 lanes divided includes signal interconnect and coorshy
dination
$0 $23755 $23755 2025
Sacramento City of Rancho
Cordova
Easton Valley
Parkway
Prairie City Road
Empire Ranch Road extenshysion south of
US 50
Construct new 4 lane road $0 $45000 $45000 2020
Sacramento Sacramento County DOT
Hazel avenue
Easton Valley
Parkway
Grant Line RoadWhite Rock Road
New road extension 4 lane limited access
through aerojet property $0 $18000 $18000 2018
Sacramento Sacramento County DOT
white Rock Road
Prairie City Road
ED County Line
widen to 4 lanes $8330 $64773 $73103 2018
Sacramento Sacramento County DOT
green Valley Road
East Natoma Sacramento ED County
line widen to 4 lanes $0 $3000 $3000 2018
Sacramento City of Rancho
Cordova
Zinfandel Drive
international Drive
Folsom Boulevard
widen to 4 lanes $0 $12000 $12000 2020
[ 42 ] HigHway 50 corridor system management plan
c h a p t e r s i x p l a n n e d c o r r i d o r s y s t e m m a n a g e m e n t s t r a t e g i e s
tabLe 11 KeY CaPitaL ProjeCtS (ConTInued)
CountyLead agency
route roadway from to Project
Description
Pro-grammed
funds
addi-tional
funding Needed
total Cost estimate (x $1000)
Comp Year (FFY)
traNSit
yolo amp Sacramento City of west Sacramento
amp City of Sacramento
Sacramento River
Crossing
15th Street in the City
of west Sacramento
Broadway in the City of
Sacramento
New all-modal river crossing (Auto Transit Bike amp Pedestrian)
from Sacramento across the Sacramento River to West
Sacramento The crossing was modeled between Broadway in Sacramento amp 15th Street in
West Sacramento but final alignshyment options will be studied in subsequent planning efforts
$800 $99200 $100000 2019
Sacramento Cal State University
Sacramento
CSUS Campus mdash mdash
Sac State Tram adjoining City streets and SRTD 65th Street light railbus transfer station Bus Rapid Transit System
$23574 $0 $23574 2013
Sacramento City of Rancho
Cordova
Rancho Cordova Various Various
New Service Rancho Cordova Pilot Transit Shuttle System new transit service for connection to
RTs Gold Line
$2380 $1500 $38880 2014
yolo amp Sacramento City of west Sacramento
TBD west
Sacramento Sacramento Streetcar Service between west
Sacramento and Downtown Sacramento
$17400 $54700 $72100 2014
Sacramento City of Rancho
Cordova RT Gold Line
RT Gold Line Tracks
Mather Field Road
Light Rail Grade Separations $0 $52888 $52888 2025
Sacramento City of Rancho
Cordova RT Gold Line
RT Gold Line Tracks Zinfandel Drive Light Rail Grade Separations $0 $52888 $52888 2025
Sacramento City of Rancho
Cordova RT Gold Line
RT Gold Line Tracks
Bradshaw Road
Light Rail Grade Separations $0 $35260 $35260 2025
Sacramento City of Rancho
Cordova RT Gold Line
RT Gold Line Tracks Routier Road Light Rail Grade Separations $0 $35260 $35260 2025
Sacramento City of
Sacramento Sacramento Valley Station
Sacramento intermodal Transportation Facility (Phase 1) - Develop intermodal transportashytion terminal for heavy rail light
rail and bus service
$77799 $0 $77799 2010
Sacramento City of
Sacramento Sacramento Valley Station
Sacramento intermodal Transportation Facility (Phase 2) - Develop intermodal transportashytion terminal for heavy rail light
rail and bus service
$24101 $1000 $25101 2014
HigHway 50 corridor system management plan [ 43 ]
c h a p t e r s i x p l a n n e d c o r r i d o r s y s t e m m a n a g e m e n t s t r a t e g i e s
TABLE 11 KEY CAPITAL PROJECTS (CONTINUED)
CountyLead Agency
Route Roadway From To Project
Description Programmed
Funds
Additional Funding Needed
Total Cost Es-timate (x $1000)
Comp Year (FFY)
BICYCLE ROUTES
Sacramento City of Rancho
Cordova
US 50Mather Field Road IC US 50 Mather
Field Road
US 50Mather Field Road PedestrianBike Crossing along
the Mather Airport RR Spur alignment
$0 $820 $1055 2015
ED ED County DOT
Sacramento Placerville
Transportation Corridor
Forni Rd
Missouri Flat Rd Class I Bike Trail $1423 $111 $1534 2009
ED City of Placerville
El Dorado Trail Western
Extension
Canal Street Main Street
Ray Lawyer DriveForni
Road Class 1 Bike Trail $1850 $0 $1850 2010
ED ED County DOT
US 50ED Hills Blvd IC US 50
El Dorado Hills Blvd
Latrobe Road
US 50El Dorado Hills Blvd Pedestrian Overcrossing $5508 $66 $5574 2014
TABLE 12 50 MOBILITY PARTNERSHIP KEY CAPITAL PROJECTS
RouteRoadway From To Project Description
NEAR TERM PRIORITY IMPROVEMENT PROJECTS
US 50 Sunrise Scott Road Auxiliary Lane
US 50 Hazel Avenue Interchange Improvements
Hazel Avenue Folsom Boulevard Easton Valley Parkway New 4 Lane Road
Easton Valley Parkway Hazel Avenue Rancho Cordova Parkway New 6 Lane Road
Rancho Cordova Parkway Easton Valley Parkway White Rock Road New 4 Lane Road
White Rock Road Sunrise Boulevard Silva Valley Parkway Widen to 4 Lanes
RT Gold Line Hazel Iron Point Station Passing Tracks
US 50 Rancho Cordova Parkway New Interchange
Zinfandel Drive South of International Douglas Road New 4 Lane Road
International Drive Kilgore Road Rancho Cordova Parkway New 6 Lane Road
Douglas Road Zinfandel Extension Sunrise Boulevard Widen to 4 Lanes
Sunrise LRT Citrus Road Sunrise Mall Bus Rapid TransitExpress Bus
[ 44 ] HIGHWAY 50 corridor system management plan
c h a p t e r s i x p l a n n e d c o r r i d o r s y s t e m m a n a g e m e n t s t r a t e g i e s
TABLE 12 50 mOBILITY PARTnERSHIP kEY CAPITAL PROjECTS (COnTInUED)
routeroadway from to Project Description
US 50 nEAR TERm PRIORITY ImPROVEmEnT PROjECTS
US 50 Empire Ranch Road New interchange
US 50 Silva Valley New interchange
US 50 Scott Road Empire Ranch Road Aux Lanes
US 50 Empire Ranch Road El Dorado Hills Boulevard Aux lanes and climbing lanes
US 50 El Dorado Hills Boulevard Silva Valley Parkway Aux lanes and climbing lanes
US 50 Silva Valley Parkway Bass Lake Road Aux lanes
Sunrise Boulevard White Rock Road Douglas Boulevard widen to 6 lanes
Sunrise Boulevard Douglas Boulevard Jackson Road widen to 4 lanes
White Rock Road Sunrise Boulevard Future Rancho Cordova Parkway and El Dorado County Line to Latrobe Road
widen to 4 lanes
Douglas Boulevard Sunrise Boulevard Grant Line Road widen to 4 lanes
Rancho Cordova Parkway Douglas Boulevard Rio del Oro Parkway New 2 lane road
Rancho Cordova Parkway Rio del Oro Parkway White Rock Road New 6 lane road
Jaeger Road Douglas Road Kiefer Boulevard New 4 lane road
Chrysanthy Sunrise Boulevard Americanos Boulevard New 4 lane road
Kiefer Boulevard Sunrise Boulevard Jaeger Road New 4 lane road
Grant Line Road Douglas Road Chrysanthy Road widen to 4 lanes
Hazel avenue Gold Country Boulevard Madison avenue widen to 6 lanes
Latrobe Road South of White Rock Road widen to 4 lanes
TABLE 13 VISIOnARY PROjECTS
County routeroadway from to Project Description
Sac yolo US 50 Enterprise Downtown Sacramento HOV Lanes
ED TBD Folsom Placerville Transit ndash Type TBD
ED New Road Latrobe Road White Rock Road (poten shy
tially US 50) New 2-lane road
HigHway 50 corridor system management plan [ 45 ]
c h a p t e r s i x p l a n n e d c o r r i d o r s y s t e m m a n a g e m e n t s t r a t e g i e s
[ 46 ] HigHway 50 corridor system management plan
Page Inte
ntionally
Left
Blank
congestion and bottleneck analysis
chapter seven
The 2000 Highway Capacity Manual defines a bottleneck
as ldquoa road element on which demand exceeds capacityrdquo
The bottleneck analysis evaluates specific causes of existshying recurrent traffic congestion in the corridor Freeway bottleneck locations that create mobility constraints are identified and documented and their relative contribution
to corridor-wide congestion is reported The bottleneck locations were determined based on a combination of the use of 2006 PeMS data HiCOMP report probe vehicle tach runs and field observations
Traffic congestion can be categorized as either recurrent
or non-recurrent
recurrent congestion occurs repeatedly at the same place and time of day in a predictable pattern Recurrent congesshytion is often associated with facility capacity limitations changes in capacity conflicting vehicle movements such
as lane merges inadequate number of transit vehicles to handle passenger loads or other persistent physical condishytions of the transportation facility
Non-recurrent congestion is usually attributed to collishysions equipment malfunction community events weather construction projects and other occasional occurrences When transportation systems are close to their maximum
carrying capacity non-recurrent congestion is more likely to occur as there is little excess capacity in the system
The location and extent of the bottlenecks on US 50 found
in the aM and PM peak periods are summarized in Tables 14 and 15 These depictions should be considered a snapshyshot view and not a comprehensive analysis of all bottleshynecks in the corridor Further work is being conducted to
refine the identification and causality of bottlenecks within
the corridor Table 14 shows a summary of the US 50 eastbound bottlenecks while the tables that follow discuss each bottleneck including location and possible causality Table 15 shows a summary of the US 50 westbound bottleshynecks while the tables that follow discuss each bottleneck including location and possible causality Minor or hidden bottlenecks are those Freeway bottleneck
that are not as defined locations that create (or severe) as the major mobility constraints bottlenecks Please note are identified and that the graphics accomshy documented and their panying the bottlenecks
relative contribution to are not to scale
corridor-wide congestion Major bottlenecks in the is reported eastbound direction during the aM peak period are at Howe avenue and during the PM peak period are at 48th Street Howe Avenue Mayhew Road Routier Road Sunrise Boulevard and El Dorado Hills Boulevard Major bottlenecks in the westbound direction during the aM peak period are at El Dorado Hills Boulevard Hazel Avenue Zinfandel Drive
HigHway 50 corridor system management plan [ 47 ]
c h a p t e r s e v e n c o n g e s t i o n a n d b o t t l e n e c k a n a l y s i s
Bradshaw Road and Howe Avenue and major bottleneck
locations during the PM peak period are at Zinfandel Drive Routier Road Bradshaw Road Howe Avenue and Intershystate 5
Causalities for these bottlenecks range from high-traffic
demand (congestion) heavy weavingmerging areas or physical constraints such as lane drops lack of ramp meters incomplete HOV network incomplete Auxiliary Lane
network poorly coordinated traffic signals and an off-ramp
queue (Sunrise Boulevard) US 50 Westbound Onramp
TABLE 14 US 50 EASTBOUnD BOTTLEnECk SUmmARY Source PeMS Caltrans tach runs and
Cambridge Systematics field observations
bottleneck Location PeMS Speed Contours Caltrans Probe Vehicle Runs
Cause aM PM aM PM
A Jefferson Blvd PM 25 Minor Minor Traffic weaving truck volumes and grade
B 48th St PM 7 Minor Major Minor Minor Merge from SR 51 and SR 99
C Howe ave PM 9 Major Major Major weave between Howe and watt
D Mayhew Rd PM 12 Major Minor Major Weaving before Bradshaw Exit
E Routier Rd PM 14 Minor Major Weaving before Mather Field Rd Exit
F Sunrise Blvd PM 185 Minor Major Lane drop HOV add off-ramp queue
G Folsom Blvd PM 22 Minor Minor Lane drop 4 to 3
H El Dorado Hills Blvd PM 275 Major
Poorly coordinated traffic signal on arterial causes spillback onto freeway
a jefferson blvd bottleneck The bottleneck approximately located at Jefferson Blvd is due to weaving traffic as those entershying the freeway from Jefferson Blvd must cross those attempting to exit the freeway to I 5 There is a large number of trucks in the stream which struggle with the grade at this location exacerbatshying the bottleneck
[ 48 ] HigHway 50 corridor system management plan
c h a p t e r s e v e n c o n g e s t i o n a n d b o t t l e n e c k a n a l y s i s
b 48th St bottleneck The bottleneck approximately located at 48th St is due to the additional traffic merging from SR 51 and SR 99 combined with the eventual lane drop at 59th St This queue extends upstream past the off-ramp to SR 5199 These off-ramps are bottlenecks in themselves which spill back and choke the US 50 mainline
C Howe Ave Bottleneck The bottleneck at Howe ave is due to the entering traffic from Howe Ave Two Howe Ave on-ramps feed into US 50 eastbound southbound Howe ave loop on-ramp and northbound Howe ave direct ramp approximately 300 feet apart The watt avenue off-ramp is just down stream with heavy exiting volumes therefore the segment between Howe and watt is characterized by heavy weaving
D mayhew Rd Bottleneck The bottleneck approximately located at Mayhew Rd most likely begins with the additional traffic entering from Watt Ave and ends with the exiting traffic at Bradshaw Rd It is possible that there is a high proportion of weaving traffic with in this section (Watt Ave traffic moving to the left lane and those exiting at Bradshaw Rd moving to the right lane)
HigHway 50 corridor system management plan [ 49 ]
c h a p t e r s e v e n c o n g e s t i o n a n d b o t t l e n e c k a n a l y s i s
[ 50 ] HigHway 50 corridor system management plan
e routier rd bottleneck It is likely that the bottleneck at Routier Rd is due to the same merging conditions associated with Mayhew Rd The area is comprised of both residential and light industrialoffice land uses therefore during the PM peak period there are large volumes of vehicles entering at Bradshaw Rd moving to the left lanes and large volumes of vehicles moving to the right lane to exit at Mather Field Rd
f Sunrise blvd bottleneck At Sunrise Blvd the right-most lane exits while an HOV lane is added as the median lane The bottleneck is formed from vehicles shifting left to avoid exiting at Sunrise Blvd and to enter the HOV lane There is a large volume of vehicles queued at the Sunrise off-ramp which spills back and negatively affects the US 50 mainline
g folsom blvd bottleneck The right-most lane exits to Folsom Blvd leaving one HOV lane and two regular lanes along the US 50 The bottleneck is caused by this lane drop as well as the quick merge at the Folsom on-ramp
c h a p t e r s e v e n c o n g e s t i o n a n d b o t t l e n e c k a n a l y s i s
H The eastbound US 50 at El Dorado Hills Blvd Bottleneck The eastbound El Dorado Hills Blvd bottleneck is caused by a traffic signal on the arterial that often causes spillbacks on the EB loop offramp onto the freeway mainlines
TABLE 15 US 50 WESTBOUnD BOTTLEnECk SUmmARY Source PeMS Caltrans tach runs and Cambridge Systematics field observations
bottleneck Location PeMS Speed Contours Caltrans Probe Vehicle Runs
Cause aM PM aM PM
A El Dorado Hills Blvd PM 275 Major Poorly coordinated traffic
signal on El Dorado Hills Blvd
B Hazel Ave PM 21 Major Entering traffic
C Zinfandel Dr PM 16 Minor Major Major Major Entering traffic
D Routier Rd PM 14 Minor Major Minor Weaving traffic
E Bradshaw PM 13 Major Major Major Merging traffic and curve
F Howe Ave PM 9 Minor Major Major Major Weaving traffic and grade
G SR 51SR 99 PM 6 Minor Lane drop weaving traffic
H i-5 PM 3 Major Weaving traffic
HigHway 50 corridor system management plan [ 51 ]
c h a p t e r s e v e n c o n g e s t i o n a n d b o t t l e n e c k a n a l y s i s
[ 52 ] HigHway 50 corridor system management plan
A El Dorado Hills Blvd Bottleneck The minor bottleneck at El Dorado Hills Boulevard is caused by the traffic signal on El Dorado Hills Blvd that causes spillback on the westbound offramp onto the freeway mainlines
B Hazel Avenue Bottleneck In 2006 the Hazel Ave Bottleneck is caused by the traffic entering at both Hazel Ave and Folsom Blvd (the two on-ramps are separated by about one mile) The bottleneck that would appear at Folsom Blvd combines with the bottleneck at Hazel ave to form a large bottleneck that does not clear until after Hazel ave Sometimes causshying spillbacks as far as Prairies City Road this bottleneck was mitigated in 2007 as part of the GO CALIFORNIA program
C Zinfandel Dr Bottleneck There is heavy traffic coming from Sunrise Blvd but the lane addition immediately after the westbound on-ramp prevents a bottleneck from forming but as traffic flows westward the heavy traffic entering from Zinfandel Dr causes a bottleshyneck here
D Routier Rd Bottleneck The bottleneck at Routier Rd is caused by weaving traffic between Mather Field Rd and Bradshaw Rd This highway segment represents a transition area where vehicles that have been traveling in the left lanes begin to shift to the right lanes to exit while the entering traffic tries to shift to the left lanes
W eav in gLan e Dr o p
c h a p t e r s e v e n c o n g e s t i o n a n d b o t t l e n e c k a n a l y s i s
e bradshaw rd bottleneck The Bradshaw Rd bottleneck is caused by the entering traffic from Bradshaw Road the high truck volumes and the curve west of Bradshaw Two Bradshaw Rd on-ramps feed into US 50 westshybound southbound Bradshaw Rd direct on-ramp and northbound Bradshaw Rd loop on-ramp approximately 400 feet apart
F Howe Ave Bottleneck The Howe ave bottleneck is caused by a grade change and the weaving traffic entering from Howe ave and Hornet Dr competing for the right-most lane with those wanting to exit at 65th Street
G amp H SR 51SR 99 amp I-5 Bottleneck The bottleneck at I 5 is caused by the conflict between entering SR 99 and SR 51 traffic and exiting I-5 traffic as well as the queues formed on the ramps to i-5 which spill back onto US 50 The number of lanes in this section reaches a maximum of 6 and then drops to 4 as two lanes exit at the I-5 freeway This bottleneck is exacershybated during the peak periods when it stretches upstream to the lane drop before SR 99
W ea v in g
Lan e Dr o p
HigHway 50 corridor system management plan [ 53 ]

c h a p t e r f i v e p e r f o r m a n c e m e a s u r e s
[ 34 ] HigHway 50 corridor system management plan
Page Inte
ntionally
Left
Blank
planned corridor system management strategies
chapter six
ConCept LoS and ConCept FaCiLit y ldquoConcept LOSrdquo and ldquoConcept Facilityrdquo have traditionally been used in Caltrans TCCRs to reflect the minimum level or quality of operations acceptable for each route segment within the 20-year planning period and the highway facility needed in the next 20 years to maintain the Concept LOS
Typical Concept LOS standards in Caltrans District 3 are LOS ldquoDrdquo in rural areas and LOS ldquoErdquo in urban areas how-ever some heavily congested route segments now have a Concept LOS ldquoFrdquo because the improvements required to bring the LOS to ldquoErdquo are not feasible due to environmental right of way financial and other constraints The applica-tion of multi-modal corridor management strategies should reduce the severity and duration of congestion and provide viable travel options and information that will enable a traveler to avoid severe freeway congestion
The Concept LOS and Concept Facility for US 50 are shown in Table 9 almost all US 50 segments are forecasted to operate under LOS ldquoFrdquo conditions in 20 years under the No-Build and Build scenarios
Corridor ManageMent StrategieS The US 50 CSMP also proposes specific strategies to enhance corridor mobility (see Table 10) based on the fol-lowing principles
bull Manage all modes and facilities in the corridor as a single system beginning with the transportation net-work defined in this CSMP
bull Implement comprehensive and dynamic multimodal monitoring and reporting for the system and for all modes
bull Develop and use micro-simulation modeling to identify mobility challenges and to evaluate proposed solutions
bull Complete the projects included in the regional trans-portation plans with an emphasis on the completion of the key mobility improvement projects identified in this CSMP (see Tables 11 and 12)
bull Implement the specific strategies outlined in this CSMP
Key CapitaL projeCtS Tables 11 and 12 contain key capital projects that have been identified as the most critical to corridor mobility These are also included in the SaCOg MTP for 2035 and are either planned without any funding yet programmed are partially programmed
The US 50 CSMPor are entirely programmed SACOG conducted significant proposes specific
public attitude research strategies to enhance for the MTP for 2035 to corridor mobility complement comprehensive outreach efforts through community workshops the TALL Order Moving the Region Forward event the televised Town Hall Road Map for the Future and associated public polling The results of the SaCOg analyses and public out-reach for the MTP were
highway 50 corridor system management plan [ 35 ]
c h a p t e r s i x p l a n n e d c o r r i d o r s y s t e m m a n a g e m e n t s t r a t e g i e s
[ 36 ] HigHway 50 corridor system management plan
used when selecting the key projects for identification in
the CSMP and to ensure consistency Not all corridor projshyects in the MTP are included in the CSMP since the CSMP focuses on the managed network and the SaCOg MTP considers all streets and roads bike routes and transit services in the corridor
highway 50 partnership The Highway 50 Partnership is a cooperative public-private effort among the County of Sacramento City of Rancho
Cordova City of Folsom County of El Dorado and several major landowners that recognize the need to consider corrishydor mobility needs holistically
The Partnership has collaborated effectively to develop a Plan to improve mobility in the US 50 Corridor from Rancho
Cordova to El Dorado Hills an area identified as approprishyate for growth in the SACOG Blueprint Recognizing the
need to generate private investment the Partnership is seeking to implement a regional Highway 50 Corridor fee program to fund these projects
in addition to the key projects indicated in Table 11 Table 12 displays the key projects identified by the
Partnership
These projects include (1) Near-Term Priority Improvement Projects and (2) Near-Term Expected Roadway Improveshyments
The Near-term Priority improvement Projects would proshyvide several new roadway connections for people to travel within and through the area to avoid congestion They also include new transit routes and widening existing roadways
viewed by the Partnership as a package that would provide system-wide travel benefits These improvements targeted
for completion through 2012 would reduce vehicle hours of delay during commute hours by 30 percent
The near-Term Expected Roadway Improvements are conshysidered by the Partnership to be readily expected since they are tied to expected development or are part of a near-term
capital improvements program
Visionary projects Visionary projects are not yet included in the SaCOg MTP or EDCTC RTP but appear to offer considerable corridor mobilshyity benefits and merit further analysis and consideration for inclusion in the next MTP and RTP These are displayed in
Table 13
The ldquoPlus 10 Listrdquo in the SACOG MTP identifies projects
that are attractive from a performance standpoint but could not be included in the Final Project Lists because of financial constraint The ldquoPlus 10 Listrdquo element offers the
opportunity to include projects that would not be affordshyable without additional funding Some projects identified in
the Visionary Projects List were analyzed by SACOG during
development of the current MTP Some of these are included in the ldquoPlus 10 Listrdquo
Watt Avenue Light Rail Station Improvement Project
c h a p t e r s i x p l a n n e d c o r r i d o r s y s t e m m a n a g e m e n t s t r a t e g i e s
Table 9 US 50 ConCePT loS and FaCiliTy TyPe
location Forecasted level of Service1 (loS) and Facility Type
County description and location From Post Mile To Post Mile Current
loS1 20-year no build loS12
20-year build loS12
20-year Concept
loS13 existing Facility4 Concept Facility456 Ultimate Facility457
yOL interstate 80 to yoloSacramento County Line
000 316 F F F F 8F (6F between Jefferson Blvd ramps)
8F+2HOV+aux Lanes 8F+2HOV+aux Lanes
SaC yoloSacramento County Line to SR 99 and 51
L000 L248 = R000 F F F F 8F 8F+2HOV+aux Lanes 8F+2HOV+aux Lanes
SaC State Routes 99 and 51 to watt avenue R000 R534 F F F F 8F 8F+2HOV+aux Lanes 8F+2HOV+aux Lanes
SaC watt avenue to Zinfandel Drive R534 R1092 F F F F 8F 8F+2HOV+aux Lanes 8F+2HOV+aux Lanes
SaC Zinfandel Drive to Sunrise Boulevard R1092 1250 E F F F 8F 8F+2HOV+aux Lanes 8F+2HOV+aux Lanes
SaC Sunrise Boulevard to Folsom Boulevard 1250 1701 E F F F 6F+2HOV to Hazel ave 4F+2HOV
to Folsom Blvd
6F+2HOV+aux Lanes to Hazel ave 4F+2HOV+aux
Lanes to Folsom Blvd
8F+2HOV+aux Lanes
SaC Folsom Boulevard to SaCED County Line 1701 2314 D F F F 4F+2HOV 4F+2HOV+aux Lanes 6F+2HOV+aux Lanes
ED SacramentoEl Dorado County Line to Cameron Park Drive
000 R657 E F F F 4F 4F+2HOV+aux Lanes 6F+2HOV+aux Lanes
ED Cameron Park Drive to Missouri Flat Road R657 R1506 E F E E 4F 4F+2HOV+aux Lanes to greenstone 4F+aux Lanes
to Missouri Flat
6F+2HOV+aux Lanes to greenstone 4F+2HOV+aux Lanes
to Missouri Flat
ED Missouri Flat Road to End of Freeway in Placerville
R1506 1725 D F F F 4F 4F+aux Lanes 4F+aux Lanes
ED End of Freeway in Placerville to Bedford avenue
1725 1811 D E E E 4E 4E 4E
ED Bedford avenue to Cedar grove Exit 1811 R2595 D F F F 4F to Smith Flat 4E to Camino 4F+aux Lanes to Smith Flat 4E to Camino
4F+aux Lanes
1 Level of Service (LOS) A ldquoreport cardrdquo for evaluating traffic flow with ldquoArdquo being the best and ldquoFrdquo being the worst 2 20-year LOS (No Build) The LOS that would be expected at 20 years with no improvements 3 20-year Concept LOS The minimum acceptable LOS over the next 20 years 4 Facility Type Codes C=Conventional Highway E=Expressway F=Freeway HOV=High Occupancy Vehicle Lanes aux=auxiliary Lanes 5 Operational improvements are included in future facilities for all segments Examples of operational improvements include TOS improvements and auxiliary lanes 6 Concept Facility the future roadway with improvements needed in the next 20 years if LOS ldquoFrdquo no further degradation of service from existing ldquoFrdquo is acceptable as indicated by delay performance measurement 7 Ultimate Facility The future roadway with improvements needed beyond a 20 year timeframe
HigHway 50 corridor system management plans [ 37 ]
c h a p t e r f i v e p e r f o r m a n c e m e a s u r e s
Table 10 US 50 CSMP STraTegieS
Strategy description implementation Challenges
Maintain and operate the existing corridor multi-modal trans-
portation infrastructure
Maintain the existing investment in all modes of the transportation system and provide adequate resources for daily operations including operating
revenues for transit services
Funding availability funding competition within the region
Fully coordinate the delivery of transportation services and facili-ties in the corridor including daily operations and system planning
for enhancements
Interagency operational coordination to maximize the efficiency and effec-tiveness of all modes operating in the corridor with a focus on the CSMP transportation network defined in this CSMP Use of an existing group or
committee to provide initial oversight for this strategy
Diverse interests and competing priorities and limited resources
Construct planned and pro-grammed corridor capital improve-
ment projects
implementation of the capital improvements in the corridor included within the approved Metropolitan Transportation Plan and Regional Transportation
Plan for all transportation modes within the scope schedule and cost specified
Funding availability funding competition within the region
Comprehensive daily monitoring of the status of all modes providing service on the CSMP transporta-
tion network
Full deployment of multimodal transportation service status detection systems for all CSMP network components
Funding availability funding competition within region
Provide traveler information to the public
Provide the public with real-time easily accessible information regarding the status of all CSMP transportation system components so as to allow travel-
ers to make informed decisions about trip mode time and routing options
Funding availability funding competition within region
Continually monitor and analyze the CSMP transportation network to improve system performance
Monitor transportation performance measures and make system modifica-tions as appropriate on a frequent and timely basis Staff resources and data availability
Decrease the duration of non-recurrent traffic congestion
Expand and enhance the Freeway Service Patrol to respond to automobile accidents and vehicle break-downs
Funding availability funding competition within the region
Timely implementation of STaRNET
Expedite the implementation of the STaRNET operators of transportation facilities and emergency responders in the Sacramento region through real-time sharing of data and live video refinement of joint procedures
pertaining to the operation of roadways and public transit and public safety activities as well as enhance the regionrsquos 511 web site and interactive
telephone service to provide more traveler information
Developmental time acceptance by agencies and integration into daily use and identifica-
tion of maintenance and operations funding
Enhance transit and rail service increase transit service frequency provide express transit services imple-
ment bus rapid transit routes reduce headways for light rail and buses and construct planned light rail line extensions
Funding availability funding competition within the region
Complete Bus Carpool lane network
Complete the regional buscarpool lane network including freeway-to-freeway HOV lane connectors
Funding availability funding competition within the region Public agency and public
acceptance of network
[ 38 ] HigHway 50 corridor system management plan
c h a p t e r s i x p l a n n e d c o r r i d o r s y s t e m m a n a g e m e n t s t r a t e g i e s
tabLe 10 uS 50 CSMP StrategieS (ConTInued)
Strategy Description implementation Challenges
Enhance Transportation Demand Management strategies
Encourage employers to provide telecommuting and flexible working hour options to employees
acceptance by employers and resources to participate
Optimize the timing and synchronishyzation of traffic signals
Coordinate the optimization and timing of traffic signals on freeway ramps and along parallel and connecting roadways within and between jurisdicshytions to improve traffic flow and reduce congestion Provide signal priority
systems for transit vehicles
Funding availability and coordination among cities counties and Caltrans
improve access management of freeways and parallel connecting roadways
Develop and implement access management strategies to maintain the operational efficiency of freeways and parallelconnecting roadways
agreement between responsible jurisdicshytions as to where increased access control is needed increased access control on some parallelconnecting roadways may increase
traffic volumes on non-corridor roads
Develop innovative use of CMSs (eg travel times)
Potential uses of CMSs to improve system efficiency include the use of CMSs along portions of all corridors near transit station to indicate travel
times based on real-time existing traffic conditions on the freeway as well as on parallel roadways and express bus and light rail services CMS can also be used to identify the number of parking spaces that are still available at
the light-rail stations
Funding availability funding competition within the region
Implement amp expand Transit AVLTransit status information
enhancements for system users
Expand the use of AVL systems utilizing GPS technology to track in real-time the location of transit vehicles monitor transit schedules dispatch transit vehicles and provide real-time passenger information such as ldquonext busrdquo or
ldquonext trainrdquo arrival times
Funding availability funding competition within region
Expand Park-and-Ride lots at key locations
Add additional capacity to existing park-and-ride lots near transit stations and other locations that are approaching capacity
Funding availability funding competition within the region and available land
improve bike-pedestrian access in the CSMP
transportation network
Plan and program for construction of additional bicycle paths lanes and related improvements for access and connectivity to transit park and ride
lots and destination points
Funding availability funding competition within the region
Provide ldquoBike-SharingrdquordquoCar-Sharingrdquo tofrom transit (ldquoCarlinkrdquo) and from
neighborhoods
Expand the Regional Rideshare and Spare-the-Air programs to include bicycle and car sharing opportunities
Funding availability and coordination between SaCOg TMa air Districts employers developshyers property managers and local government
officials
Provide parking management stratshyegies in interested jurisdictions where applicable to discourage
use of single-occupant vehicles
in higher-density areas provide preferential parking for carpools and vanshypools require residential parking permits remove on-street parking and or provide graduated parking fees for metered on-street parking based on
vehicle type and time of day for SOV spaces to encourage transit use
Acceptance by businesses local officials and the general public
Expand bicycle commute amp transit fare strategiessubsidies
increase participation by large employers in programs that subsidize transit fares for employees during peak-hour commute times and provide bicycling
to work incentives
Voluntary participation by large employers to pay subsidy to transit providers
HigHway 50 corridor system management plan [ 39 ]
c h a p t e r s i x p l a n n e d c o r r i d o r s y s t e m m a n a g e m e n t s t r a t e g i e s
tabLe 11 KeY CaPitaL ProjeCtS
CountyLead agency
route roadway from to Project
Description Programmed
funds
additional funding Needed
total Cost estimate (x $1000)
Comp Year (FFY)
uS 50
Sacramento Caltrans District 3
US 50 Downtown watt avenue HOV Lanes $0 $75000 $75000 2020
Sacramento Caltrans District 3
US 50 watt avenue Sunrise Blvd HOV Lanes $165000 $0 $165000 2013
Sacramento Caltrans District 3
US 50 Bradshaw Road
Mather Field Road
Eastbound and Westbound Auxiliary Lanes
$0 $3700 $3700 2016
Sacramento Caltrans District 3
US 50 State Route 99
(Oak Park Interchange) interchange improvements including buscarpool lane
connectors $0 $150000 $150000 2014
Sacramento Caltrans District 3
US 50 interstate 5
(Riverfront Interchange) Riverfront Interchange
improvements including bus carpool lane connectors
$30000 $170000 $200000 2016
ED Caltrans District 3 US 50 Camino
Operational Safety improvements Construct an
undercrossing median barrier modify local road connections andor associated operational improvements on and adjacent
to US 50
$15000 $0 $15000 2012
ED ED County DOT US 50
west of Latrobe Road
west of Bass Lake
grade HOV Lanes (Ph1) $47141 $0 $47141 2010
ED Caltrans District 3 US 50
west of Bass Lake Road
Ponderosa Road
HOV Lanes (Ph2) $55000 $0 $55000 2011
ED Caltrans District 3 US 50 Ponderosa
Road greenstone
Road HOV Lanes (Ph3) $22357 $0 $22357 2013
ED ED County DOT US 50 Future Silva
Valley iC
Future Empire Ranch IC
Mainline Widening construct new WB lane within the
median from proposed Silva Valley IC to proposed Empire
Ranch IC
$2950 $0 $2950 2013
[ 40 ] HigHway 50 corridor system management plan
c h a p t e r s i x p l a n n e d c o r r i d o r s y s t e m m a n a g e m e n t s t r a t e g i e s
tabLe 11 KeY CaPitaL ProjeCtS (ConTInued)
CountyLead agency
route roadway from to Project
Description Programmed
funds
additional funding Needed
total Cost estimate (x $1000)
Comp Year (FFY)
PARALLEL AnD COnnECTInG ROADWAYS
ED ED County DOT
Silva Valley Parkway
Entrada Drive
Future US 50
Silva Valley Parkway iC
Widen Silva Valley Road from 2 lanes to 4 lanes includes
Class ii bike lanes and left turn storage pockets
$2921 $0 $2921 2010
ED ED County DOT
Silva Valley Parkway US 50
US50 Silva Valley Parkway (Phase 2) Includes constructshying overcrossing and ramps
signalization at EB and WB on off ramps
$57817 $0 $57817 2016
ED ED County DOT
Headington Road
Missouri Flat Road
El Dorado Road
Extend 2 lanes with median $9878 $0 $9878 2012
ED ED County DOT
Durock Road
Robin Lane South
Shingle Road
Extend 2 lanes with median $1239 $9214 $10453 2015
ED ED County DOT
Durock Road
Business Center Drive intersection signalization
includes adding turn pockets on Durock Road
$4333 $0 $4333 2009
ED City of Placerville
Point View Drive Broadway Smith Flat
Road Extend 2 lanes $1300 $0 $1300 2020
ED City of Placerville
western Placerville
US 50 interchange
Forni Road Ray Lawyer
Drive
Placerville Drive
Interchange Reconstruction convert Ray Lawyer Dr
Overcrossing to full IC Auxiliary Lanes
$5059 $34741 $39800 2020
Sacramento City of Rancho
Cordova
Mather Boulevard
Rockingham Road
Zinfandel Drive widen to 4 lanes $0 $8617 $8617 2020
Sacramento Rancho Cordova
Parkway ii
Grant Line Road
White Rock Road
New 6-lane expressway includshying intersection improvements at Kiefer Blvd amp White Rock
Road
$0 $44518 $44518 2020
Sacramento City of Folsom
Scott Road US 50 White Rock Rd
widen from 2 to 6 lanes $16000 $0 $16000 2020
Sacramento Sacramento County DOT
White Rock Road
Grant Line Rd
Prairie City Rd
Widen from 2 to 4 lanes realign near Nike and Nimbus Roads and connect with existshying alignment west of Prairie City Rd Realign Grant Line Rd to intersect with realigned
White Rock Rd
$26600 $0 $26600 2020
Sacramento Sacramento County DOT
Hazel avenue
US 50 Hazel Madison
Widen American River Bridge and approaches from 4 to 6 lanes Widen Hazel Avenue from AR Bridge to Madison from 4 to 6 lanes with Bike
LanesSignals
$83530 $0 $83530 2020
HigHway 50 corridor system management plan [ 41 ]
c h a p t e r s i x p l a n n e d c o r r i d o r s y s t e m m a n a g e m e n t s t r a t e g i e s
tabLe 11 KeY CaPitaL ProjeCtS (ConTInued)
CountyLead agency
route roadway from to Project
Description Programmed
funds
additional funding Needed
total Cost Estimate (x $1000)
Comp Year (FFY)
PARALLEL AnD COnnECTInG ROADWAYS
ED ED County DOT
green Valley Road
Salmon Falls Road
east
Deer Valley Road
widen from 2 to 4 lanes $0 $14576 $14576 2025
ED ED County DOT
green Valley Road
Deer Valley Road east Lotus Road widen $958 $4513 $5471 2015
ED ED County DOT
green Valley Road
Francisco Drive
Salmon Falls Road
widen from 2 to 4 lanes divided $412 $3491 $3903 2015
ED ED County DOT
Latrobe Road
investment Boulevard
golden Foothill Parkway
widen from 2 lanes undivided to 4 lanes
divided $1076 $8792 $9868 2015
ED ED County DOT
Latrobe Road
Carson Creek
White Rock Road
widen from 4 to 6 lanes $0 $23755 $23755 2025
ED ED County DOT
white Rock Road
EDSac County Line
Manchester Drive
widen 2 to 4 lanes divided includes signal interconnect and coorshy
dination
$0 $23755 $23755 2025
Sacramento City of Rancho
Cordova
Easton Valley
Parkway
Prairie City Road
Empire Ranch Road extenshysion south of
US 50
Construct new 4 lane road $0 $45000 $45000 2020
Sacramento Sacramento County DOT
Hazel avenue
Easton Valley
Parkway
Grant Line RoadWhite Rock Road
New road extension 4 lane limited access
through aerojet property $0 $18000 $18000 2018
Sacramento Sacramento County DOT
white Rock Road
Prairie City Road
ED County Line
widen to 4 lanes $8330 $64773 $73103 2018
Sacramento Sacramento County DOT
green Valley Road
East Natoma Sacramento ED County
line widen to 4 lanes $0 $3000 $3000 2018
Sacramento City of Rancho
Cordova
Zinfandel Drive
international Drive
Folsom Boulevard
widen to 4 lanes $0 $12000 $12000 2020
[ 42 ] HigHway 50 corridor system management plan
c h a p t e r s i x p l a n n e d c o r r i d o r s y s t e m m a n a g e m e n t s t r a t e g i e s
tabLe 11 KeY CaPitaL ProjeCtS (ConTInued)
CountyLead agency
route roadway from to Project
Description
Pro-grammed
funds
addi-tional
funding Needed
total Cost estimate (x $1000)
Comp Year (FFY)
traNSit
yolo amp Sacramento City of west Sacramento
amp City of Sacramento
Sacramento River
Crossing
15th Street in the City
of west Sacramento
Broadway in the City of
Sacramento
New all-modal river crossing (Auto Transit Bike amp Pedestrian)
from Sacramento across the Sacramento River to West
Sacramento The crossing was modeled between Broadway in Sacramento amp 15th Street in
West Sacramento but final alignshyment options will be studied in subsequent planning efforts
$800 $99200 $100000 2019
Sacramento Cal State University
Sacramento
CSUS Campus mdash mdash
Sac State Tram adjoining City streets and SRTD 65th Street light railbus transfer station Bus Rapid Transit System
$23574 $0 $23574 2013
Sacramento City of Rancho
Cordova
Rancho Cordova Various Various
New Service Rancho Cordova Pilot Transit Shuttle System new transit service for connection to
RTs Gold Line
$2380 $1500 $38880 2014
yolo amp Sacramento City of west Sacramento
TBD west
Sacramento Sacramento Streetcar Service between west
Sacramento and Downtown Sacramento
$17400 $54700 $72100 2014
Sacramento City of Rancho
Cordova RT Gold Line
RT Gold Line Tracks
Mather Field Road
Light Rail Grade Separations $0 $52888 $52888 2025
Sacramento City of Rancho
Cordova RT Gold Line
RT Gold Line Tracks Zinfandel Drive Light Rail Grade Separations $0 $52888 $52888 2025
Sacramento City of Rancho
Cordova RT Gold Line
RT Gold Line Tracks
Bradshaw Road
Light Rail Grade Separations $0 $35260 $35260 2025
Sacramento City of Rancho
Cordova RT Gold Line
RT Gold Line Tracks Routier Road Light Rail Grade Separations $0 $35260 $35260 2025
Sacramento City of
Sacramento Sacramento Valley Station
Sacramento intermodal Transportation Facility (Phase 1) - Develop intermodal transportashytion terminal for heavy rail light
rail and bus service
$77799 $0 $77799 2010
Sacramento City of
Sacramento Sacramento Valley Station
Sacramento intermodal Transportation Facility (Phase 2) - Develop intermodal transportashytion terminal for heavy rail light
rail and bus service
$24101 $1000 $25101 2014
HigHway 50 corridor system management plan [ 43 ]
c h a p t e r s i x p l a n n e d c o r r i d o r s y s t e m m a n a g e m e n t s t r a t e g i e s
TABLE 11 KEY CAPITAL PROJECTS (CONTINUED)
CountyLead Agency
Route Roadway From To Project
Description Programmed
Funds
Additional Funding Needed
Total Cost Es-timate (x $1000)
Comp Year (FFY)
BICYCLE ROUTES
Sacramento City of Rancho
Cordova
US 50Mather Field Road IC US 50 Mather
Field Road
US 50Mather Field Road PedestrianBike Crossing along
the Mather Airport RR Spur alignment
$0 $820 $1055 2015
ED ED County DOT
Sacramento Placerville
Transportation Corridor
Forni Rd
Missouri Flat Rd Class I Bike Trail $1423 $111 $1534 2009
ED City of Placerville
El Dorado Trail Western
Extension
Canal Street Main Street
Ray Lawyer DriveForni
Road Class 1 Bike Trail $1850 $0 $1850 2010
ED ED County DOT
US 50ED Hills Blvd IC US 50
El Dorado Hills Blvd
Latrobe Road
US 50El Dorado Hills Blvd Pedestrian Overcrossing $5508 $66 $5574 2014
TABLE 12 50 MOBILITY PARTNERSHIP KEY CAPITAL PROJECTS
RouteRoadway From To Project Description
NEAR TERM PRIORITY IMPROVEMENT PROJECTS
US 50 Sunrise Scott Road Auxiliary Lane
US 50 Hazel Avenue Interchange Improvements
Hazel Avenue Folsom Boulevard Easton Valley Parkway New 4 Lane Road
Easton Valley Parkway Hazel Avenue Rancho Cordova Parkway New 6 Lane Road
Rancho Cordova Parkway Easton Valley Parkway White Rock Road New 4 Lane Road
White Rock Road Sunrise Boulevard Silva Valley Parkway Widen to 4 Lanes
RT Gold Line Hazel Iron Point Station Passing Tracks
US 50 Rancho Cordova Parkway New Interchange
Zinfandel Drive South of International Douglas Road New 4 Lane Road
International Drive Kilgore Road Rancho Cordova Parkway New 6 Lane Road
Douglas Road Zinfandel Extension Sunrise Boulevard Widen to 4 Lanes
Sunrise LRT Citrus Road Sunrise Mall Bus Rapid TransitExpress Bus
[ 44 ] HIGHWAY 50 corridor system management plan
c h a p t e r s i x p l a n n e d c o r r i d o r s y s t e m m a n a g e m e n t s t r a t e g i e s
TABLE 12 50 mOBILITY PARTnERSHIP kEY CAPITAL PROjECTS (COnTInUED)
routeroadway from to Project Description
US 50 nEAR TERm PRIORITY ImPROVEmEnT PROjECTS
US 50 Empire Ranch Road New interchange
US 50 Silva Valley New interchange
US 50 Scott Road Empire Ranch Road Aux Lanes
US 50 Empire Ranch Road El Dorado Hills Boulevard Aux lanes and climbing lanes
US 50 El Dorado Hills Boulevard Silva Valley Parkway Aux lanes and climbing lanes
US 50 Silva Valley Parkway Bass Lake Road Aux lanes
Sunrise Boulevard White Rock Road Douglas Boulevard widen to 6 lanes
Sunrise Boulevard Douglas Boulevard Jackson Road widen to 4 lanes
White Rock Road Sunrise Boulevard Future Rancho Cordova Parkway and El Dorado County Line to Latrobe Road
widen to 4 lanes
Douglas Boulevard Sunrise Boulevard Grant Line Road widen to 4 lanes
Rancho Cordova Parkway Douglas Boulevard Rio del Oro Parkway New 2 lane road
Rancho Cordova Parkway Rio del Oro Parkway White Rock Road New 6 lane road
Jaeger Road Douglas Road Kiefer Boulevard New 4 lane road
Chrysanthy Sunrise Boulevard Americanos Boulevard New 4 lane road
Kiefer Boulevard Sunrise Boulevard Jaeger Road New 4 lane road
Grant Line Road Douglas Road Chrysanthy Road widen to 4 lanes
Hazel avenue Gold Country Boulevard Madison avenue widen to 6 lanes
Latrobe Road South of White Rock Road widen to 4 lanes
TABLE 13 VISIOnARY PROjECTS
County routeroadway from to Project Description
Sac yolo US 50 Enterprise Downtown Sacramento HOV Lanes
ED TBD Folsom Placerville Transit ndash Type TBD
ED New Road Latrobe Road White Rock Road (poten shy
tially US 50) New 2-lane road
HigHway 50 corridor system management plan [ 45 ]
c h a p t e r s i x p l a n n e d c o r r i d o r s y s t e m m a n a g e m e n t s t r a t e g i e s
[ 46 ] HigHway 50 corridor system management plan
Page Inte
ntionally
Left
Blank
congestion and bottleneck analysis
chapter seven
The 2000 Highway Capacity Manual defines a bottleneck
as ldquoa road element on which demand exceeds capacityrdquo
The bottleneck analysis evaluates specific causes of existshying recurrent traffic congestion in the corridor Freeway bottleneck locations that create mobility constraints are identified and documented and their relative contribution
to corridor-wide congestion is reported The bottleneck locations were determined based on a combination of the use of 2006 PeMS data HiCOMP report probe vehicle tach runs and field observations
Traffic congestion can be categorized as either recurrent
or non-recurrent
recurrent congestion occurs repeatedly at the same place and time of day in a predictable pattern Recurrent congesshytion is often associated with facility capacity limitations changes in capacity conflicting vehicle movements such
as lane merges inadequate number of transit vehicles to handle passenger loads or other persistent physical condishytions of the transportation facility
Non-recurrent congestion is usually attributed to collishysions equipment malfunction community events weather construction projects and other occasional occurrences When transportation systems are close to their maximum
carrying capacity non-recurrent congestion is more likely to occur as there is little excess capacity in the system
The location and extent of the bottlenecks on US 50 found
in the aM and PM peak periods are summarized in Tables 14 and 15 These depictions should be considered a snapshyshot view and not a comprehensive analysis of all bottleshynecks in the corridor Further work is being conducted to
refine the identification and causality of bottlenecks within
the corridor Table 14 shows a summary of the US 50 eastbound bottlenecks while the tables that follow discuss each bottleneck including location and possible causality Table 15 shows a summary of the US 50 westbound bottleshynecks while the tables that follow discuss each bottleneck including location and possible causality Minor or hidden bottlenecks are those Freeway bottleneck
that are not as defined locations that create (or severe) as the major mobility constraints bottlenecks Please note are identified and that the graphics accomshy documented and their panying the bottlenecks
relative contribution to are not to scale
corridor-wide congestion Major bottlenecks in the is reported eastbound direction during the aM peak period are at Howe avenue and during the PM peak period are at 48th Street Howe Avenue Mayhew Road Routier Road Sunrise Boulevard and El Dorado Hills Boulevard Major bottlenecks in the westbound direction during the aM peak period are at El Dorado Hills Boulevard Hazel Avenue Zinfandel Drive
HigHway 50 corridor system management plan [ 47 ]
c h a p t e r s e v e n c o n g e s t i o n a n d b o t t l e n e c k a n a l y s i s
Bradshaw Road and Howe Avenue and major bottleneck
locations during the PM peak period are at Zinfandel Drive Routier Road Bradshaw Road Howe Avenue and Intershystate 5
Causalities for these bottlenecks range from high-traffic
demand (congestion) heavy weavingmerging areas or physical constraints such as lane drops lack of ramp meters incomplete HOV network incomplete Auxiliary Lane
network poorly coordinated traffic signals and an off-ramp
queue (Sunrise Boulevard) US 50 Westbound Onramp
TABLE 14 US 50 EASTBOUnD BOTTLEnECk SUmmARY Source PeMS Caltrans tach runs and
Cambridge Systematics field observations
bottleneck Location PeMS Speed Contours Caltrans Probe Vehicle Runs
Cause aM PM aM PM
A Jefferson Blvd PM 25 Minor Minor Traffic weaving truck volumes and grade
B 48th St PM 7 Minor Major Minor Minor Merge from SR 51 and SR 99
C Howe ave PM 9 Major Major Major weave between Howe and watt
D Mayhew Rd PM 12 Major Minor Major Weaving before Bradshaw Exit
E Routier Rd PM 14 Minor Major Weaving before Mather Field Rd Exit
F Sunrise Blvd PM 185 Minor Major Lane drop HOV add off-ramp queue
G Folsom Blvd PM 22 Minor Minor Lane drop 4 to 3
H El Dorado Hills Blvd PM 275 Major
Poorly coordinated traffic signal on arterial causes spillback onto freeway
a jefferson blvd bottleneck The bottleneck approximately located at Jefferson Blvd is due to weaving traffic as those entershying the freeway from Jefferson Blvd must cross those attempting to exit the freeway to I 5 There is a large number of trucks in the stream which struggle with the grade at this location exacerbatshying the bottleneck
[ 48 ] HigHway 50 corridor system management plan
c h a p t e r s e v e n c o n g e s t i o n a n d b o t t l e n e c k a n a l y s i s
b 48th St bottleneck The bottleneck approximately located at 48th St is due to the additional traffic merging from SR 51 and SR 99 combined with the eventual lane drop at 59th St This queue extends upstream past the off-ramp to SR 5199 These off-ramps are bottlenecks in themselves which spill back and choke the US 50 mainline
C Howe Ave Bottleneck The bottleneck at Howe ave is due to the entering traffic from Howe Ave Two Howe Ave on-ramps feed into US 50 eastbound southbound Howe ave loop on-ramp and northbound Howe ave direct ramp approximately 300 feet apart The watt avenue off-ramp is just down stream with heavy exiting volumes therefore the segment between Howe and watt is characterized by heavy weaving
D mayhew Rd Bottleneck The bottleneck approximately located at Mayhew Rd most likely begins with the additional traffic entering from Watt Ave and ends with the exiting traffic at Bradshaw Rd It is possible that there is a high proportion of weaving traffic with in this section (Watt Ave traffic moving to the left lane and those exiting at Bradshaw Rd moving to the right lane)
HigHway 50 corridor system management plan [ 49 ]
c h a p t e r s e v e n c o n g e s t i o n a n d b o t t l e n e c k a n a l y s i s
[ 50 ] HigHway 50 corridor system management plan
e routier rd bottleneck It is likely that the bottleneck at Routier Rd is due to the same merging conditions associated with Mayhew Rd The area is comprised of both residential and light industrialoffice land uses therefore during the PM peak period there are large volumes of vehicles entering at Bradshaw Rd moving to the left lanes and large volumes of vehicles moving to the right lane to exit at Mather Field Rd
f Sunrise blvd bottleneck At Sunrise Blvd the right-most lane exits while an HOV lane is added as the median lane The bottleneck is formed from vehicles shifting left to avoid exiting at Sunrise Blvd and to enter the HOV lane There is a large volume of vehicles queued at the Sunrise off-ramp which spills back and negatively affects the US 50 mainline
g folsom blvd bottleneck The right-most lane exits to Folsom Blvd leaving one HOV lane and two regular lanes along the US 50 The bottleneck is caused by this lane drop as well as the quick merge at the Folsom on-ramp
c h a p t e r s e v e n c o n g e s t i o n a n d b o t t l e n e c k a n a l y s i s
H The eastbound US 50 at El Dorado Hills Blvd Bottleneck The eastbound El Dorado Hills Blvd bottleneck is caused by a traffic signal on the arterial that often causes spillbacks on the EB loop offramp onto the freeway mainlines
TABLE 15 US 50 WESTBOUnD BOTTLEnECk SUmmARY Source PeMS Caltrans tach runs and Cambridge Systematics field observations
bottleneck Location PeMS Speed Contours Caltrans Probe Vehicle Runs
Cause aM PM aM PM
A El Dorado Hills Blvd PM 275 Major Poorly coordinated traffic
signal on El Dorado Hills Blvd
B Hazel Ave PM 21 Major Entering traffic
C Zinfandel Dr PM 16 Minor Major Major Major Entering traffic
D Routier Rd PM 14 Minor Major Minor Weaving traffic
E Bradshaw PM 13 Major Major Major Merging traffic and curve
F Howe Ave PM 9 Minor Major Major Major Weaving traffic and grade
G SR 51SR 99 PM 6 Minor Lane drop weaving traffic
H i-5 PM 3 Major Weaving traffic
HigHway 50 corridor system management plan [ 51 ]
c h a p t e r s e v e n c o n g e s t i o n a n d b o t t l e n e c k a n a l y s i s
[ 52 ] HigHway 50 corridor system management plan
A El Dorado Hills Blvd Bottleneck The minor bottleneck at El Dorado Hills Boulevard is caused by the traffic signal on El Dorado Hills Blvd that causes spillback on the westbound offramp onto the freeway mainlines
B Hazel Avenue Bottleneck In 2006 the Hazel Ave Bottleneck is caused by the traffic entering at both Hazel Ave and Folsom Blvd (the two on-ramps are separated by about one mile) The bottleneck that would appear at Folsom Blvd combines with the bottleneck at Hazel ave to form a large bottleneck that does not clear until after Hazel ave Sometimes causshying spillbacks as far as Prairies City Road this bottleneck was mitigated in 2007 as part of the GO CALIFORNIA program
C Zinfandel Dr Bottleneck There is heavy traffic coming from Sunrise Blvd but the lane addition immediately after the westbound on-ramp prevents a bottleneck from forming but as traffic flows westward the heavy traffic entering from Zinfandel Dr causes a bottleshyneck here
D Routier Rd Bottleneck The bottleneck at Routier Rd is caused by weaving traffic between Mather Field Rd and Bradshaw Rd This highway segment represents a transition area where vehicles that have been traveling in the left lanes begin to shift to the right lanes to exit while the entering traffic tries to shift to the left lanes
W eav in gLan e Dr o p
c h a p t e r s e v e n c o n g e s t i o n a n d b o t t l e n e c k a n a l y s i s
e bradshaw rd bottleneck The Bradshaw Rd bottleneck is caused by the entering traffic from Bradshaw Road the high truck volumes and the curve west of Bradshaw Two Bradshaw Rd on-ramps feed into US 50 westshybound southbound Bradshaw Rd direct on-ramp and northbound Bradshaw Rd loop on-ramp approximately 400 feet apart
F Howe Ave Bottleneck The Howe ave bottleneck is caused by a grade change and the weaving traffic entering from Howe ave and Hornet Dr competing for the right-most lane with those wanting to exit at 65th Street
G amp H SR 51SR 99 amp I-5 Bottleneck The bottleneck at I 5 is caused by the conflict between entering SR 99 and SR 51 traffic and exiting I-5 traffic as well as the queues formed on the ramps to i-5 which spill back onto US 50 The number of lanes in this section reaches a maximum of 6 and then drops to 4 as two lanes exit at the I-5 freeway This bottleneck is exacershybated during the peak periods when it stretches upstream to the lane drop before SR 99
W ea v in g
Lan e Dr o p
HigHway 50 corridor system management plan [ 53 ]
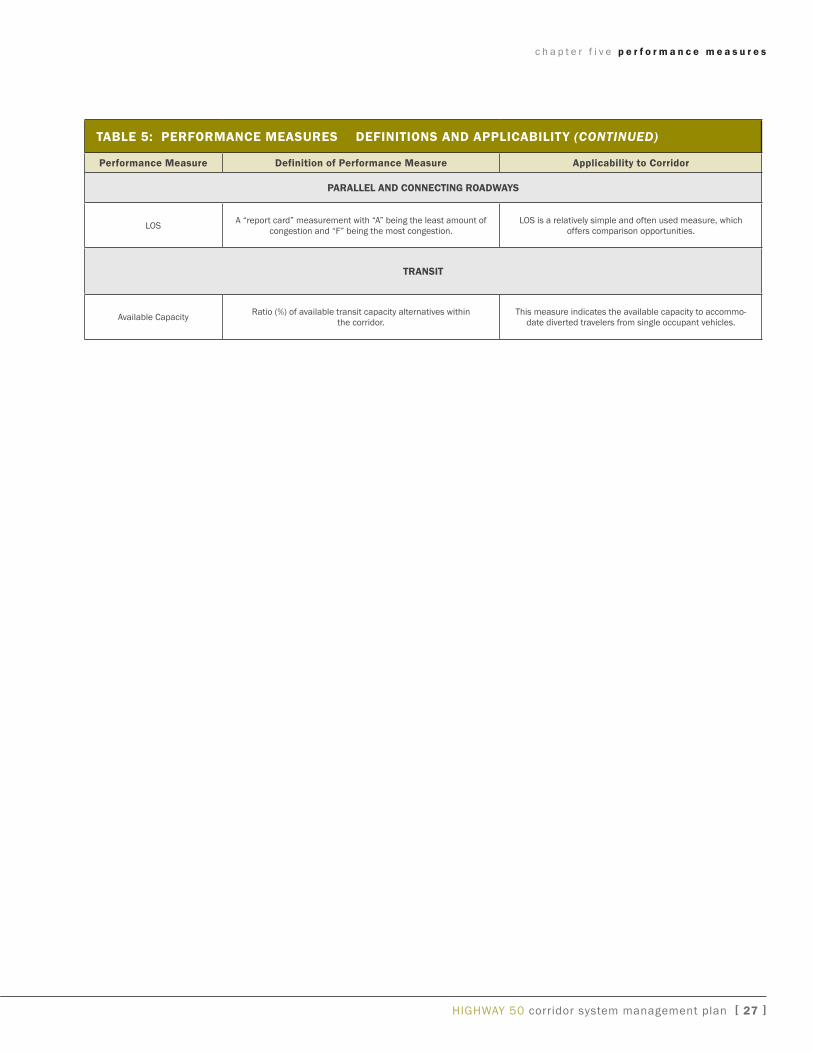

c h a p t e r s i x p l a n n e d c o r r i d o r s y s t e m m a n a g e m e n t s t r a t e g i e s
[ 36 ] HigHway 50 corridor system management plan
used when selecting the key projects for identification in
the CSMP and to ensure consistency Not all corridor projshyects in the MTP are included in the CSMP since the CSMP focuses on the managed network and the SaCOg MTP considers all streets and roads bike routes and transit services in the corridor
highway 50 partnership The Highway 50 Partnership is a cooperative public-private effort among the County of Sacramento City of Rancho
Cordova City of Folsom County of El Dorado and several major landowners that recognize the need to consider corrishydor mobility needs holistically
The Partnership has collaborated effectively to develop a Plan to improve mobility in the US 50 Corridor from Rancho
Cordova to El Dorado Hills an area identified as approprishyate for growth in the SACOG Blueprint Recognizing the
need to generate private investment the Partnership is seeking to implement a regional Highway 50 Corridor fee program to fund these projects
in addition to the key projects indicated in Table 11 Table 12 displays the key projects identified by the
Partnership
These projects include (1) Near-Term Priority Improvement Projects and (2) Near-Term Expected Roadway Improveshyments
The Near-term Priority improvement Projects would proshyvide several new roadway connections for people to travel within and through the area to avoid congestion They also include new transit routes and widening existing roadways
viewed by the Partnership as a package that would provide system-wide travel benefits These improvements targeted
for completion through 2012 would reduce vehicle hours of delay during commute hours by 30 percent
The near-Term Expected Roadway Improvements are conshysidered by the Partnership to be readily expected since they are tied to expected development or are part of a near-term
capital improvements program
Visionary projects Visionary projects are not yet included in the SaCOg MTP or EDCTC RTP but appear to offer considerable corridor mobilshyity benefits and merit further analysis and consideration for inclusion in the next MTP and RTP These are displayed in
Table 13
The ldquoPlus 10 Listrdquo in the SACOG MTP identifies projects
that are attractive from a performance standpoint but could not be included in the Final Project Lists because of financial constraint The ldquoPlus 10 Listrdquo element offers the
opportunity to include projects that would not be affordshyable without additional funding Some projects identified in
the Visionary Projects List were analyzed by SACOG during
development of the current MTP Some of these are included in the ldquoPlus 10 Listrdquo
Watt Avenue Light Rail Station Improvement Project
c h a p t e r s i x p l a n n e d c o r r i d o r s y s t e m m a n a g e m e n t s t r a t e g i e s
Table 9 US 50 ConCePT loS and FaCiliTy TyPe
location Forecasted level of Service1 (loS) and Facility Type
County description and location From Post Mile To Post Mile Current
loS1 20-year no build loS12
20-year build loS12
20-year Concept
loS13 existing Facility4 Concept Facility456 Ultimate Facility457
yOL interstate 80 to yoloSacramento County Line
000 316 F F F F 8F (6F between Jefferson Blvd ramps)
8F+2HOV+aux Lanes 8F+2HOV+aux Lanes
SaC yoloSacramento County Line to SR 99 and 51
L000 L248 = R000 F F F F 8F 8F+2HOV+aux Lanes 8F+2HOV+aux Lanes
SaC State Routes 99 and 51 to watt avenue R000 R534 F F F F 8F 8F+2HOV+aux Lanes 8F+2HOV+aux Lanes
SaC watt avenue to Zinfandel Drive R534 R1092 F F F F 8F 8F+2HOV+aux Lanes 8F+2HOV+aux Lanes
SaC Zinfandel Drive to Sunrise Boulevard R1092 1250 E F F F 8F 8F+2HOV+aux Lanes 8F+2HOV+aux Lanes
SaC Sunrise Boulevard to Folsom Boulevard 1250 1701 E F F F 6F+2HOV to Hazel ave 4F+2HOV
to Folsom Blvd
6F+2HOV+aux Lanes to Hazel ave 4F+2HOV+aux
Lanes to Folsom Blvd
8F+2HOV+aux Lanes
SaC Folsom Boulevard to SaCED County Line 1701 2314 D F F F 4F+2HOV 4F+2HOV+aux Lanes 6F+2HOV+aux Lanes
ED SacramentoEl Dorado County Line to Cameron Park Drive
000 R657 E F F F 4F 4F+2HOV+aux Lanes 6F+2HOV+aux Lanes
ED Cameron Park Drive to Missouri Flat Road R657 R1506 E F E E 4F 4F+2HOV+aux Lanes to greenstone 4F+aux Lanes
to Missouri Flat
6F+2HOV+aux Lanes to greenstone 4F+2HOV+aux Lanes
to Missouri Flat
ED Missouri Flat Road to End of Freeway in Placerville
R1506 1725 D F F F 4F 4F+aux Lanes 4F+aux Lanes
ED End of Freeway in Placerville to Bedford avenue
1725 1811 D E E E 4E 4E 4E
ED Bedford avenue to Cedar grove Exit 1811 R2595 D F F F 4F to Smith Flat 4E to Camino 4F+aux Lanes to Smith Flat 4E to Camino
4F+aux Lanes
1 Level of Service (LOS) A ldquoreport cardrdquo for evaluating traffic flow with ldquoArdquo being the best and ldquoFrdquo being the worst 2 20-year LOS (No Build) The LOS that would be expected at 20 years with no improvements 3 20-year Concept LOS The minimum acceptable LOS over the next 20 years 4 Facility Type Codes C=Conventional Highway E=Expressway F=Freeway HOV=High Occupancy Vehicle Lanes aux=auxiliary Lanes 5 Operational improvements are included in future facilities for all segments Examples of operational improvements include TOS improvements and auxiliary lanes 6 Concept Facility the future roadway with improvements needed in the next 20 years if LOS ldquoFrdquo no further degradation of service from existing ldquoFrdquo is acceptable as indicated by delay performance measurement 7 Ultimate Facility The future roadway with improvements needed beyond a 20 year timeframe
HigHway 50 corridor system management plans [ 37 ]
c h a p t e r f i v e p e r f o r m a n c e m e a s u r e s
Table 10 US 50 CSMP STraTegieS
Strategy description implementation Challenges
Maintain and operate the existing corridor multi-modal trans-
portation infrastructure
Maintain the existing investment in all modes of the transportation system and provide adequate resources for daily operations including operating
revenues for transit services
Funding availability funding competition within the region
Fully coordinate the delivery of transportation services and facili-ties in the corridor including daily operations and system planning
for enhancements
Interagency operational coordination to maximize the efficiency and effec-tiveness of all modes operating in the corridor with a focus on the CSMP transportation network defined in this CSMP Use of an existing group or
committee to provide initial oversight for this strategy
Diverse interests and competing priorities and limited resources
Construct planned and pro-grammed corridor capital improve-
ment projects
implementation of the capital improvements in the corridor included within the approved Metropolitan Transportation Plan and Regional Transportation
Plan for all transportation modes within the scope schedule and cost specified
Funding availability funding competition within the region
Comprehensive daily monitoring of the status of all modes providing service on the CSMP transporta-
tion network
Full deployment of multimodal transportation service status detection systems for all CSMP network components
Funding availability funding competition within region
Provide traveler information to the public
Provide the public with real-time easily accessible information regarding the status of all CSMP transportation system components so as to allow travel-
ers to make informed decisions about trip mode time and routing options
Funding availability funding competition within region
Continually monitor and analyze the CSMP transportation network to improve system performance
Monitor transportation performance measures and make system modifica-tions as appropriate on a frequent and timely basis Staff resources and data availability
Decrease the duration of non-recurrent traffic congestion
Expand and enhance the Freeway Service Patrol to respond to automobile accidents and vehicle break-downs
Funding availability funding competition within the region
Timely implementation of STaRNET
Expedite the implementation of the STaRNET operators of transportation facilities and emergency responders in the Sacramento region through real-time sharing of data and live video refinement of joint procedures
pertaining to the operation of roadways and public transit and public safety activities as well as enhance the regionrsquos 511 web site and interactive
telephone service to provide more traveler information
Developmental time acceptance by agencies and integration into daily use and identifica-
tion of maintenance and operations funding
Enhance transit and rail service increase transit service frequency provide express transit services imple-
ment bus rapid transit routes reduce headways for light rail and buses and construct planned light rail line extensions
Funding availability funding competition within the region
Complete Bus Carpool lane network
Complete the regional buscarpool lane network including freeway-to-freeway HOV lane connectors
Funding availability funding competition within the region Public agency and public
acceptance of network
[ 38 ] HigHway 50 corridor system management plan
c h a p t e r s i x p l a n n e d c o r r i d o r s y s t e m m a n a g e m e n t s t r a t e g i e s
tabLe 10 uS 50 CSMP StrategieS (ConTInued)
Strategy Description implementation Challenges
Enhance Transportation Demand Management strategies
Encourage employers to provide telecommuting and flexible working hour options to employees
acceptance by employers and resources to participate
Optimize the timing and synchronishyzation of traffic signals
Coordinate the optimization and timing of traffic signals on freeway ramps and along parallel and connecting roadways within and between jurisdicshytions to improve traffic flow and reduce congestion Provide signal priority
systems for transit vehicles
Funding availability and coordination among cities counties and Caltrans
improve access management of freeways and parallel connecting roadways
Develop and implement access management strategies to maintain the operational efficiency of freeways and parallelconnecting roadways
agreement between responsible jurisdicshytions as to where increased access control is needed increased access control on some parallelconnecting roadways may increase
traffic volumes on non-corridor roads
Develop innovative use of CMSs (eg travel times)
Potential uses of CMSs to improve system efficiency include the use of CMSs along portions of all corridors near transit station to indicate travel
times based on real-time existing traffic conditions on the freeway as well as on parallel roadways and express bus and light rail services CMS can also be used to identify the number of parking spaces that are still available at
the light-rail stations
Funding availability funding competition within the region
Implement amp expand Transit AVLTransit status information
enhancements for system users
Expand the use of AVL systems utilizing GPS technology to track in real-time the location of transit vehicles monitor transit schedules dispatch transit vehicles and provide real-time passenger information such as ldquonext busrdquo or
ldquonext trainrdquo arrival times
Funding availability funding competition within region
Expand Park-and-Ride lots at key locations
Add additional capacity to existing park-and-ride lots near transit stations and other locations that are approaching capacity
Funding availability funding competition within the region and available land
improve bike-pedestrian access in the CSMP
transportation network
Plan and program for construction of additional bicycle paths lanes and related improvements for access and connectivity to transit park and ride
lots and destination points
Funding availability funding competition within the region
Provide ldquoBike-SharingrdquordquoCar-Sharingrdquo tofrom transit (ldquoCarlinkrdquo) and from
neighborhoods
Expand the Regional Rideshare and Spare-the-Air programs to include bicycle and car sharing opportunities
Funding availability and coordination between SaCOg TMa air Districts employers developshyers property managers and local government
officials
Provide parking management stratshyegies in interested jurisdictions where applicable to discourage
use of single-occupant vehicles
in higher-density areas provide preferential parking for carpools and vanshypools require residential parking permits remove on-street parking and or provide graduated parking fees for metered on-street parking based on
vehicle type and time of day for SOV spaces to encourage transit use
Acceptance by businesses local officials and the general public
Expand bicycle commute amp transit fare strategiessubsidies
increase participation by large employers in programs that subsidize transit fares for employees during peak-hour commute times and provide bicycling
to work incentives
Voluntary participation by large employers to pay subsidy to transit providers
HigHway 50 corridor system management plan [ 39 ]
c h a p t e r s i x p l a n n e d c o r r i d o r s y s t e m m a n a g e m e n t s t r a t e g i e s
tabLe 11 KeY CaPitaL ProjeCtS
CountyLead agency
route roadway from to Project
Description Programmed
funds
additional funding Needed
total Cost estimate (x $1000)
Comp Year (FFY)
uS 50
Sacramento Caltrans District 3
US 50 Downtown watt avenue HOV Lanes $0 $75000 $75000 2020
Sacramento Caltrans District 3
US 50 watt avenue Sunrise Blvd HOV Lanes $165000 $0 $165000 2013
Sacramento Caltrans District 3
US 50 Bradshaw Road
Mather Field Road
Eastbound and Westbound Auxiliary Lanes
$0 $3700 $3700 2016
Sacramento Caltrans District 3
US 50 State Route 99
(Oak Park Interchange) interchange improvements including buscarpool lane
connectors $0 $150000 $150000 2014
Sacramento Caltrans District 3
US 50 interstate 5
(Riverfront Interchange) Riverfront Interchange
improvements including bus carpool lane connectors
$30000 $170000 $200000 2016
ED Caltrans District 3 US 50 Camino
Operational Safety improvements Construct an
undercrossing median barrier modify local road connections andor associated operational improvements on and adjacent
to US 50
$15000 $0 $15000 2012
ED ED County DOT US 50
west of Latrobe Road
west of Bass Lake
grade HOV Lanes (Ph1) $47141 $0 $47141 2010
ED Caltrans District 3 US 50
west of Bass Lake Road
Ponderosa Road
HOV Lanes (Ph2) $55000 $0 $55000 2011
ED Caltrans District 3 US 50 Ponderosa
Road greenstone
Road HOV Lanes (Ph3) $22357 $0 $22357 2013
ED ED County DOT US 50 Future Silva
Valley iC
Future Empire Ranch IC
Mainline Widening construct new WB lane within the
median from proposed Silva Valley IC to proposed Empire
Ranch IC
$2950 $0 $2950 2013
[ 40 ] HigHway 50 corridor system management plan
c h a p t e r s i x p l a n n e d c o r r i d o r s y s t e m m a n a g e m e n t s t r a t e g i e s
tabLe 11 KeY CaPitaL ProjeCtS (ConTInued)
CountyLead agency
route roadway from to Project
Description Programmed
funds
additional funding Needed
total Cost estimate (x $1000)
Comp Year (FFY)
PARALLEL AnD COnnECTInG ROADWAYS
ED ED County DOT
Silva Valley Parkway
Entrada Drive
Future US 50
Silva Valley Parkway iC
Widen Silva Valley Road from 2 lanes to 4 lanes includes
Class ii bike lanes and left turn storage pockets
$2921 $0 $2921 2010
ED ED County DOT
Silva Valley Parkway US 50
US50 Silva Valley Parkway (Phase 2) Includes constructshying overcrossing and ramps
signalization at EB and WB on off ramps
$57817 $0 $57817 2016
ED ED County DOT
Headington Road
Missouri Flat Road
El Dorado Road
Extend 2 lanes with median $9878 $0 $9878 2012
ED ED County DOT
Durock Road
Robin Lane South
Shingle Road
Extend 2 lanes with median $1239 $9214 $10453 2015
ED ED County DOT
Durock Road
Business Center Drive intersection signalization
includes adding turn pockets on Durock Road
$4333 $0 $4333 2009
ED City of Placerville
Point View Drive Broadway Smith Flat
Road Extend 2 lanes $1300 $0 $1300 2020
ED City of Placerville
western Placerville
US 50 interchange
Forni Road Ray Lawyer
Drive
Placerville Drive
Interchange Reconstruction convert Ray Lawyer Dr
Overcrossing to full IC Auxiliary Lanes
$5059 $34741 $39800 2020
Sacramento City of Rancho
Cordova
Mather Boulevard
Rockingham Road
Zinfandel Drive widen to 4 lanes $0 $8617 $8617 2020
Sacramento Rancho Cordova
Parkway ii
Grant Line Road
White Rock Road
New 6-lane expressway includshying intersection improvements at Kiefer Blvd amp White Rock
Road
$0 $44518 $44518 2020
Sacramento City of Folsom
Scott Road US 50 White Rock Rd
widen from 2 to 6 lanes $16000 $0 $16000 2020
Sacramento Sacramento County DOT
White Rock Road
Grant Line Rd
Prairie City Rd
Widen from 2 to 4 lanes realign near Nike and Nimbus Roads and connect with existshying alignment west of Prairie City Rd Realign Grant Line Rd to intersect with realigned
White Rock Rd
$26600 $0 $26600 2020
Sacramento Sacramento County DOT
Hazel avenue
US 50 Hazel Madison
Widen American River Bridge and approaches from 4 to 6 lanes Widen Hazel Avenue from AR Bridge to Madison from 4 to 6 lanes with Bike
LanesSignals
$83530 $0 $83530 2020
HigHway 50 corridor system management plan [ 41 ]
c h a p t e r s i x p l a n n e d c o r r i d o r s y s t e m m a n a g e m e n t s t r a t e g i e s
tabLe 11 KeY CaPitaL ProjeCtS (ConTInued)
CountyLead agency
route roadway from to Project
Description Programmed
funds
additional funding Needed
total Cost Estimate (x $1000)
Comp Year (FFY)
PARALLEL AnD COnnECTInG ROADWAYS
ED ED County DOT
green Valley Road
Salmon Falls Road
east
Deer Valley Road
widen from 2 to 4 lanes $0 $14576 $14576 2025
ED ED County DOT
green Valley Road
Deer Valley Road east Lotus Road widen $958 $4513 $5471 2015
ED ED County DOT
green Valley Road
Francisco Drive
Salmon Falls Road
widen from 2 to 4 lanes divided $412 $3491 $3903 2015
ED ED County DOT
Latrobe Road
investment Boulevard
golden Foothill Parkway
widen from 2 lanes undivided to 4 lanes
divided $1076 $8792 $9868 2015
ED ED County DOT
Latrobe Road
Carson Creek
White Rock Road
widen from 4 to 6 lanes $0 $23755 $23755 2025
ED ED County DOT
white Rock Road
EDSac County Line
Manchester Drive
widen 2 to 4 lanes divided includes signal interconnect and coorshy
dination
$0 $23755 $23755 2025
Sacramento City of Rancho
Cordova
Easton Valley
Parkway
Prairie City Road
Empire Ranch Road extenshysion south of
US 50
Construct new 4 lane road $0 $45000 $45000 2020
Sacramento Sacramento County DOT
Hazel avenue
Easton Valley
Parkway
Grant Line RoadWhite Rock Road
New road extension 4 lane limited access
through aerojet property $0 $18000 $18000 2018
Sacramento Sacramento County DOT
white Rock Road
Prairie City Road
ED County Line
widen to 4 lanes $8330 $64773 $73103 2018
Sacramento Sacramento County DOT
green Valley Road
East Natoma Sacramento ED County
line widen to 4 lanes $0 $3000 $3000 2018
Sacramento City of Rancho
Cordova
Zinfandel Drive
international Drive
Folsom Boulevard
widen to 4 lanes $0 $12000 $12000 2020
[ 42 ] HigHway 50 corridor system management plan
c h a p t e r s i x p l a n n e d c o r r i d o r s y s t e m m a n a g e m e n t s t r a t e g i e s
tabLe 11 KeY CaPitaL ProjeCtS (ConTInued)
CountyLead agency
route roadway from to Project
Description
Pro-grammed
funds
addi-tional
funding Needed
total Cost estimate (x $1000)
Comp Year (FFY)
traNSit
yolo amp Sacramento City of west Sacramento
amp City of Sacramento
Sacramento River
Crossing
15th Street in the City
of west Sacramento
Broadway in the City of
Sacramento
New all-modal river crossing (Auto Transit Bike amp Pedestrian)
from Sacramento across the Sacramento River to West
Sacramento The crossing was modeled between Broadway in Sacramento amp 15th Street in
West Sacramento but final alignshyment options will be studied in subsequent planning efforts
$800 $99200 $100000 2019
Sacramento Cal State University
Sacramento
CSUS Campus mdash mdash
Sac State Tram adjoining City streets and SRTD 65th Street light railbus transfer station Bus Rapid Transit System
$23574 $0 $23574 2013
Sacramento City of Rancho
Cordova
Rancho Cordova Various Various
New Service Rancho Cordova Pilot Transit Shuttle System new transit service for connection to
RTs Gold Line
$2380 $1500 $38880 2014
yolo amp Sacramento City of west Sacramento
TBD west
Sacramento Sacramento Streetcar Service between west
Sacramento and Downtown Sacramento
$17400 $54700 $72100 2014
Sacramento City of Rancho
Cordova RT Gold Line
RT Gold Line Tracks
Mather Field Road
Light Rail Grade Separations $0 $52888 $52888 2025
Sacramento City of Rancho
Cordova RT Gold Line
RT Gold Line Tracks Zinfandel Drive Light Rail Grade Separations $0 $52888 $52888 2025
Sacramento City of Rancho
Cordova RT Gold Line
RT Gold Line Tracks
Bradshaw Road
Light Rail Grade Separations $0 $35260 $35260 2025
Sacramento City of Rancho
Cordova RT Gold Line
RT Gold Line Tracks Routier Road Light Rail Grade Separations $0 $35260 $35260 2025
Sacramento City of
Sacramento Sacramento Valley Station
Sacramento intermodal Transportation Facility (Phase 1) - Develop intermodal transportashytion terminal for heavy rail light
rail and bus service
$77799 $0 $77799 2010
Sacramento City of
Sacramento Sacramento Valley Station
Sacramento intermodal Transportation Facility (Phase 2) - Develop intermodal transportashytion terminal for heavy rail light
rail and bus service
$24101 $1000 $25101 2014
HigHway 50 corridor system management plan [ 43 ]
c h a p t e r s i x p l a n n e d c o r r i d o r s y s t e m m a n a g e m e n t s t r a t e g i e s
TABLE 11 KEY CAPITAL PROJECTS (CONTINUED)
CountyLead Agency
Route Roadway From To Project
Description Programmed
Funds
Additional Funding Needed
Total Cost Es-timate (x $1000)
Comp Year (FFY)
BICYCLE ROUTES
Sacramento City of Rancho
Cordova
US 50Mather Field Road IC US 50 Mather
Field Road
US 50Mather Field Road PedestrianBike Crossing along
the Mather Airport RR Spur alignment
$0 $820 $1055 2015
ED ED County DOT
Sacramento Placerville
Transportation Corridor
Forni Rd
Missouri Flat Rd Class I Bike Trail $1423 $111 $1534 2009
ED City of Placerville
El Dorado Trail Western
Extension
Canal Street Main Street
Ray Lawyer DriveForni
Road Class 1 Bike Trail $1850 $0 $1850 2010
ED ED County DOT
US 50ED Hills Blvd IC US 50
El Dorado Hills Blvd
Latrobe Road
US 50El Dorado Hills Blvd Pedestrian Overcrossing $5508 $66 $5574 2014
TABLE 12 50 MOBILITY PARTNERSHIP KEY CAPITAL PROJECTS
RouteRoadway From To Project Description
NEAR TERM PRIORITY IMPROVEMENT PROJECTS
US 50 Sunrise Scott Road Auxiliary Lane
US 50 Hazel Avenue Interchange Improvements
Hazel Avenue Folsom Boulevard Easton Valley Parkway New 4 Lane Road
Easton Valley Parkway Hazel Avenue Rancho Cordova Parkway New 6 Lane Road
Rancho Cordova Parkway Easton Valley Parkway White Rock Road New 4 Lane Road
White Rock Road Sunrise Boulevard Silva Valley Parkway Widen to 4 Lanes
RT Gold Line Hazel Iron Point Station Passing Tracks
US 50 Rancho Cordova Parkway New Interchange
Zinfandel Drive South of International Douglas Road New 4 Lane Road
International Drive Kilgore Road Rancho Cordova Parkway New 6 Lane Road
Douglas Road Zinfandel Extension Sunrise Boulevard Widen to 4 Lanes
Sunrise LRT Citrus Road Sunrise Mall Bus Rapid TransitExpress Bus
[ 44 ] HIGHWAY 50 corridor system management plan
c h a p t e r s i x p l a n n e d c o r r i d o r s y s t e m m a n a g e m e n t s t r a t e g i e s
TABLE 12 50 mOBILITY PARTnERSHIP kEY CAPITAL PROjECTS (COnTInUED)
routeroadway from to Project Description
US 50 nEAR TERm PRIORITY ImPROVEmEnT PROjECTS
US 50 Empire Ranch Road New interchange
US 50 Silva Valley New interchange
US 50 Scott Road Empire Ranch Road Aux Lanes
US 50 Empire Ranch Road El Dorado Hills Boulevard Aux lanes and climbing lanes
US 50 El Dorado Hills Boulevard Silva Valley Parkway Aux lanes and climbing lanes
US 50 Silva Valley Parkway Bass Lake Road Aux lanes
Sunrise Boulevard White Rock Road Douglas Boulevard widen to 6 lanes
Sunrise Boulevard Douglas Boulevard Jackson Road widen to 4 lanes
White Rock Road Sunrise Boulevard Future Rancho Cordova Parkway and El Dorado County Line to Latrobe Road
widen to 4 lanes
Douglas Boulevard Sunrise Boulevard Grant Line Road widen to 4 lanes
Rancho Cordova Parkway Douglas Boulevard Rio del Oro Parkway New 2 lane road
Rancho Cordova Parkway Rio del Oro Parkway White Rock Road New 6 lane road
Jaeger Road Douglas Road Kiefer Boulevard New 4 lane road
Chrysanthy Sunrise Boulevard Americanos Boulevard New 4 lane road
Kiefer Boulevard Sunrise Boulevard Jaeger Road New 4 lane road
Grant Line Road Douglas Road Chrysanthy Road widen to 4 lanes
Hazel avenue Gold Country Boulevard Madison avenue widen to 6 lanes
Latrobe Road South of White Rock Road widen to 4 lanes
TABLE 13 VISIOnARY PROjECTS
County routeroadway from to Project Description
Sac yolo US 50 Enterprise Downtown Sacramento HOV Lanes
ED TBD Folsom Placerville Transit ndash Type TBD
ED New Road Latrobe Road White Rock Road (poten shy
tially US 50) New 2-lane road
HigHway 50 corridor system management plan [ 45 ]
c h a p t e r s i x p l a n n e d c o r r i d o r s y s t e m m a n a g e m e n t s t r a t e g i e s
[ 46 ] HigHway 50 corridor system management plan
Page Inte
ntionally
Left
Blank
congestion and bottleneck analysis
chapter seven
The 2000 Highway Capacity Manual defines a bottleneck
as ldquoa road element on which demand exceeds capacityrdquo
The bottleneck analysis evaluates specific causes of existshying recurrent traffic congestion in the corridor Freeway bottleneck locations that create mobility constraints are identified and documented and their relative contribution
to corridor-wide congestion is reported The bottleneck locations were determined based on a combination of the use of 2006 PeMS data HiCOMP report probe vehicle tach runs and field observations
Traffic congestion can be categorized as either recurrent
or non-recurrent
recurrent congestion occurs repeatedly at the same place and time of day in a predictable pattern Recurrent congesshytion is often associated with facility capacity limitations changes in capacity conflicting vehicle movements such
as lane merges inadequate number of transit vehicles to handle passenger loads or other persistent physical condishytions of the transportation facility
Non-recurrent congestion is usually attributed to collishysions equipment malfunction community events weather construction projects and other occasional occurrences When transportation systems are close to their maximum
carrying capacity non-recurrent congestion is more likely to occur as there is little excess capacity in the system
The location and extent of the bottlenecks on US 50 found
in the aM and PM peak periods are summarized in Tables 14 and 15 These depictions should be considered a snapshyshot view and not a comprehensive analysis of all bottleshynecks in the corridor Further work is being conducted to
refine the identification and causality of bottlenecks within
the corridor Table 14 shows a summary of the US 50 eastbound bottlenecks while the tables that follow discuss each bottleneck including location and possible causality Table 15 shows a summary of the US 50 westbound bottleshynecks while the tables that follow discuss each bottleneck including location and possible causality Minor or hidden bottlenecks are those Freeway bottleneck
that are not as defined locations that create (or severe) as the major mobility constraints bottlenecks Please note are identified and that the graphics accomshy documented and their panying the bottlenecks
relative contribution to are not to scale
corridor-wide congestion Major bottlenecks in the is reported eastbound direction during the aM peak period are at Howe avenue and during the PM peak period are at 48th Street Howe Avenue Mayhew Road Routier Road Sunrise Boulevard and El Dorado Hills Boulevard Major bottlenecks in the westbound direction during the aM peak period are at El Dorado Hills Boulevard Hazel Avenue Zinfandel Drive
HigHway 50 corridor system management plan [ 47 ]
c h a p t e r s e v e n c o n g e s t i o n a n d b o t t l e n e c k a n a l y s i s
Bradshaw Road and Howe Avenue and major bottleneck
locations during the PM peak period are at Zinfandel Drive Routier Road Bradshaw Road Howe Avenue and Intershystate 5
Causalities for these bottlenecks range from high-traffic
demand (congestion) heavy weavingmerging areas or physical constraints such as lane drops lack of ramp meters incomplete HOV network incomplete Auxiliary Lane
network poorly coordinated traffic signals and an off-ramp
queue (Sunrise Boulevard) US 50 Westbound Onramp
TABLE 14 US 50 EASTBOUnD BOTTLEnECk SUmmARY Source PeMS Caltrans tach runs and
Cambridge Systematics field observations
bottleneck Location PeMS Speed Contours Caltrans Probe Vehicle Runs
Cause aM PM aM PM
A Jefferson Blvd PM 25 Minor Minor Traffic weaving truck volumes and grade
B 48th St PM 7 Minor Major Minor Minor Merge from SR 51 and SR 99
C Howe ave PM 9 Major Major Major weave between Howe and watt
D Mayhew Rd PM 12 Major Minor Major Weaving before Bradshaw Exit
E Routier Rd PM 14 Minor Major Weaving before Mather Field Rd Exit
F Sunrise Blvd PM 185 Minor Major Lane drop HOV add off-ramp queue
G Folsom Blvd PM 22 Minor Minor Lane drop 4 to 3
H El Dorado Hills Blvd PM 275 Major
Poorly coordinated traffic signal on arterial causes spillback onto freeway
a jefferson blvd bottleneck The bottleneck approximately located at Jefferson Blvd is due to weaving traffic as those entershying the freeway from Jefferson Blvd must cross those attempting to exit the freeway to I 5 There is a large number of trucks in the stream which struggle with the grade at this location exacerbatshying the bottleneck
[ 48 ] HigHway 50 corridor system management plan
c h a p t e r s e v e n c o n g e s t i o n a n d b o t t l e n e c k a n a l y s i s
b 48th St bottleneck The bottleneck approximately located at 48th St is due to the additional traffic merging from SR 51 and SR 99 combined with the eventual lane drop at 59th St This queue extends upstream past the off-ramp to SR 5199 These off-ramps are bottlenecks in themselves which spill back and choke the US 50 mainline
C Howe Ave Bottleneck The bottleneck at Howe ave is due to the entering traffic from Howe Ave Two Howe Ave on-ramps feed into US 50 eastbound southbound Howe ave loop on-ramp and northbound Howe ave direct ramp approximately 300 feet apart The watt avenue off-ramp is just down stream with heavy exiting volumes therefore the segment between Howe and watt is characterized by heavy weaving
D mayhew Rd Bottleneck The bottleneck approximately located at Mayhew Rd most likely begins with the additional traffic entering from Watt Ave and ends with the exiting traffic at Bradshaw Rd It is possible that there is a high proportion of weaving traffic with in this section (Watt Ave traffic moving to the left lane and those exiting at Bradshaw Rd moving to the right lane)
HigHway 50 corridor system management plan [ 49 ]
c h a p t e r s e v e n c o n g e s t i o n a n d b o t t l e n e c k a n a l y s i s
[ 50 ] HigHway 50 corridor system management plan
e routier rd bottleneck It is likely that the bottleneck at Routier Rd is due to the same merging conditions associated with Mayhew Rd The area is comprised of both residential and light industrialoffice land uses therefore during the PM peak period there are large volumes of vehicles entering at Bradshaw Rd moving to the left lanes and large volumes of vehicles moving to the right lane to exit at Mather Field Rd
f Sunrise blvd bottleneck At Sunrise Blvd the right-most lane exits while an HOV lane is added as the median lane The bottleneck is formed from vehicles shifting left to avoid exiting at Sunrise Blvd and to enter the HOV lane There is a large volume of vehicles queued at the Sunrise off-ramp which spills back and negatively affects the US 50 mainline
g folsom blvd bottleneck The right-most lane exits to Folsom Blvd leaving one HOV lane and two regular lanes along the US 50 The bottleneck is caused by this lane drop as well as the quick merge at the Folsom on-ramp
c h a p t e r s e v e n c o n g e s t i o n a n d b o t t l e n e c k a n a l y s i s
H The eastbound US 50 at El Dorado Hills Blvd Bottleneck The eastbound El Dorado Hills Blvd bottleneck is caused by a traffic signal on the arterial that often causes spillbacks on the EB loop offramp onto the freeway mainlines
TABLE 15 US 50 WESTBOUnD BOTTLEnECk SUmmARY Source PeMS Caltrans tach runs and Cambridge Systematics field observations
bottleneck Location PeMS Speed Contours Caltrans Probe Vehicle Runs
Cause aM PM aM PM
A El Dorado Hills Blvd PM 275 Major Poorly coordinated traffic
signal on El Dorado Hills Blvd
B Hazel Ave PM 21 Major Entering traffic
C Zinfandel Dr PM 16 Minor Major Major Major Entering traffic
D Routier Rd PM 14 Minor Major Minor Weaving traffic
E Bradshaw PM 13 Major Major Major Merging traffic and curve
F Howe Ave PM 9 Minor Major Major Major Weaving traffic and grade
G SR 51SR 99 PM 6 Minor Lane drop weaving traffic
H i-5 PM 3 Major Weaving traffic
HigHway 50 corridor system management plan [ 51 ]
c h a p t e r s e v e n c o n g e s t i o n a n d b o t t l e n e c k a n a l y s i s
[ 52 ] HigHway 50 corridor system management plan
A El Dorado Hills Blvd Bottleneck The minor bottleneck at El Dorado Hills Boulevard is caused by the traffic signal on El Dorado Hills Blvd that causes spillback on the westbound offramp onto the freeway mainlines
B Hazel Avenue Bottleneck In 2006 the Hazel Ave Bottleneck is caused by the traffic entering at both Hazel Ave and Folsom Blvd (the two on-ramps are separated by about one mile) The bottleneck that would appear at Folsom Blvd combines with the bottleneck at Hazel ave to form a large bottleneck that does not clear until after Hazel ave Sometimes causshying spillbacks as far as Prairies City Road this bottleneck was mitigated in 2007 as part of the GO CALIFORNIA program
C Zinfandel Dr Bottleneck There is heavy traffic coming from Sunrise Blvd but the lane addition immediately after the westbound on-ramp prevents a bottleneck from forming but as traffic flows westward the heavy traffic entering from Zinfandel Dr causes a bottleshyneck here
D Routier Rd Bottleneck The bottleneck at Routier Rd is caused by weaving traffic between Mather Field Rd and Bradshaw Rd This highway segment represents a transition area where vehicles that have been traveling in the left lanes begin to shift to the right lanes to exit while the entering traffic tries to shift to the left lanes
W eav in gLan e Dr o p
c h a p t e r s e v e n c o n g e s t i o n a n d b o t t l e n e c k a n a l y s i s
e bradshaw rd bottleneck The Bradshaw Rd bottleneck is caused by the entering traffic from Bradshaw Road the high truck volumes and the curve west of Bradshaw Two Bradshaw Rd on-ramps feed into US 50 westshybound southbound Bradshaw Rd direct on-ramp and northbound Bradshaw Rd loop on-ramp approximately 400 feet apart
F Howe Ave Bottleneck The Howe ave bottleneck is caused by a grade change and the weaving traffic entering from Howe ave and Hornet Dr competing for the right-most lane with those wanting to exit at 65th Street
G amp H SR 51SR 99 amp I-5 Bottleneck The bottleneck at I 5 is caused by the conflict between entering SR 99 and SR 51 traffic and exiting I-5 traffic as well as the queues formed on the ramps to i-5 which spill back onto US 50 The number of lanes in this section reaches a maximum of 6 and then drops to 4 as two lanes exit at the I-5 freeway This bottleneck is exacershybated during the peak periods when it stretches upstream to the lane drop before SR 99
W ea v in g
Lan e Dr o p
HigHway 50 corridor system management plan [ 53 ]
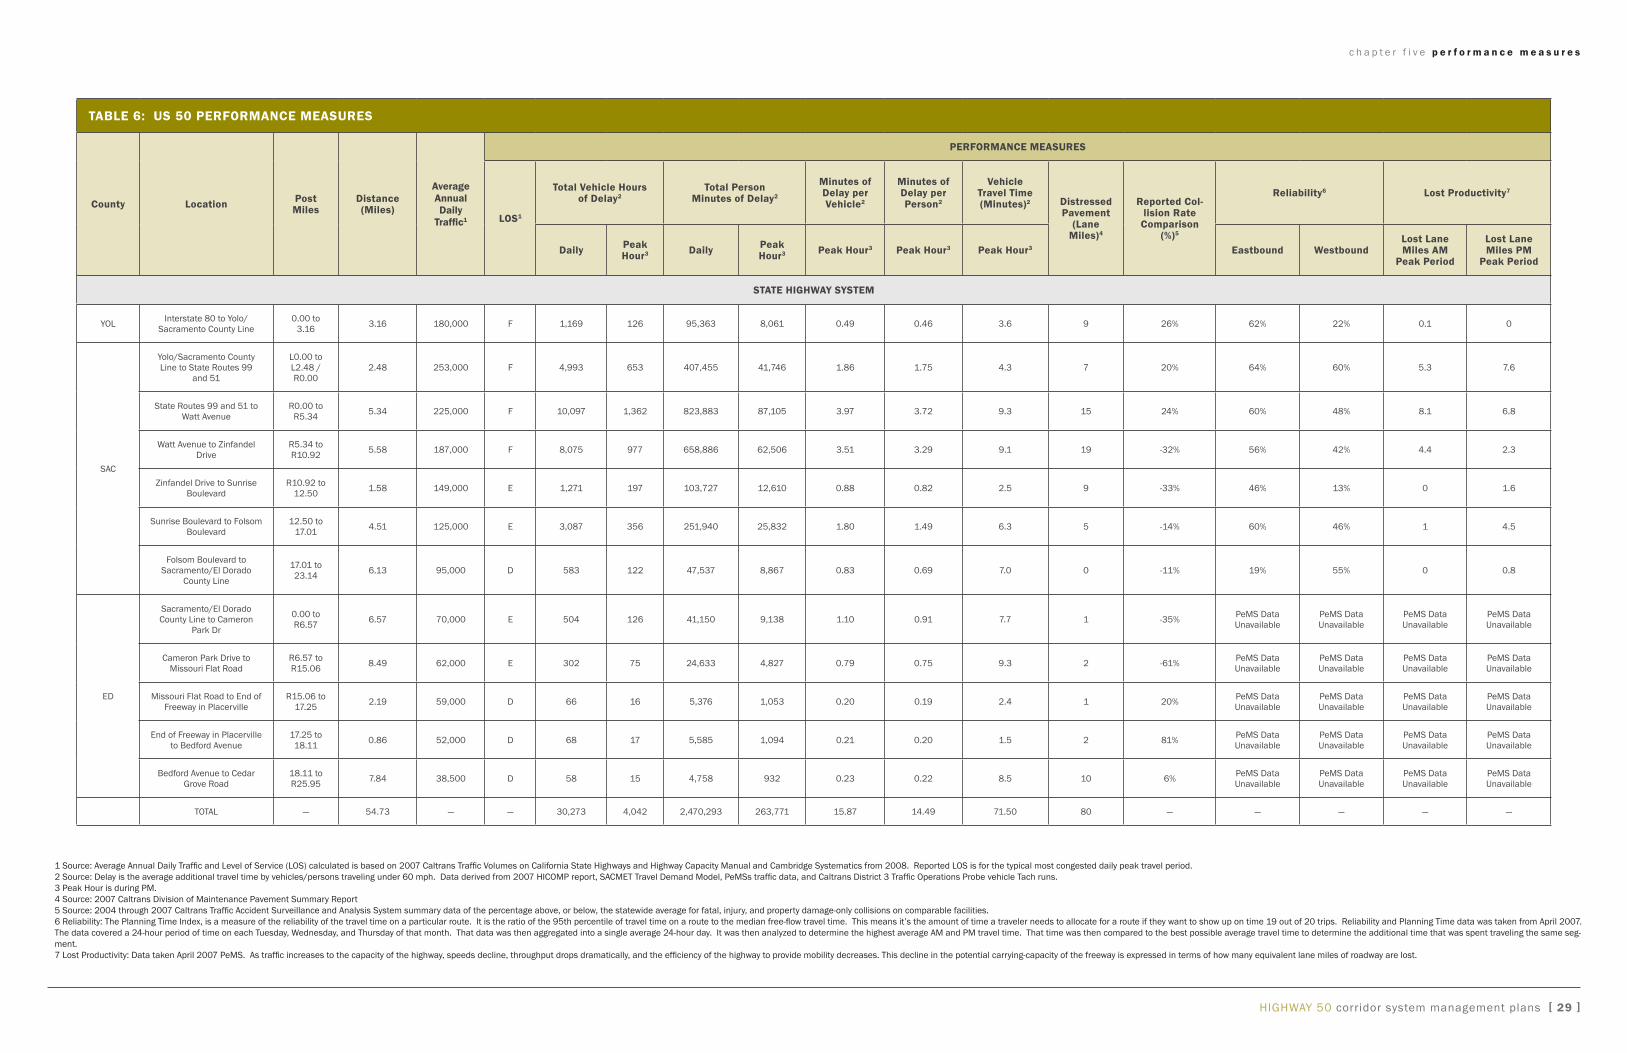
c h a p t e r s i x p l a n n e d c o r r i d o r s y s t e m m a n a g e m e n t s t r a t e g i e s
Table 9 US 50 ConCePT loS and FaCiliTy TyPe
location Forecasted level of Service1 (loS) and Facility Type
County description and location From Post Mile To Post Mile Current
loS1 20-year no build loS12
20-year build loS12
20-year Concept
loS13 existing Facility4 Concept Facility456 Ultimate Facility457
yOL interstate 80 to yoloSacramento County Line
000 316 F F F F 8F (6F between Jefferson Blvd ramps)
8F+2HOV+aux Lanes 8F+2HOV+aux Lanes
SaC yoloSacramento County Line to SR 99 and 51
L000 L248 = R000 F F F F 8F 8F+2HOV+aux Lanes 8F+2HOV+aux Lanes
SaC State Routes 99 and 51 to watt avenue R000 R534 F F F F 8F 8F+2HOV+aux Lanes 8F+2HOV+aux Lanes
SaC watt avenue to Zinfandel Drive R534 R1092 F F F F 8F 8F+2HOV+aux Lanes 8F+2HOV+aux Lanes
SaC Zinfandel Drive to Sunrise Boulevard R1092 1250 E F F F 8F 8F+2HOV+aux Lanes 8F+2HOV+aux Lanes
SaC Sunrise Boulevard to Folsom Boulevard 1250 1701 E F F F 6F+2HOV to Hazel ave 4F+2HOV
to Folsom Blvd
6F+2HOV+aux Lanes to Hazel ave 4F+2HOV+aux
Lanes to Folsom Blvd
8F+2HOV+aux Lanes
SaC Folsom Boulevard to SaCED County Line 1701 2314 D F F F 4F+2HOV 4F+2HOV+aux Lanes 6F+2HOV+aux Lanes
ED SacramentoEl Dorado County Line to Cameron Park Drive
000 R657 E F F F 4F 4F+2HOV+aux Lanes 6F+2HOV+aux Lanes
ED Cameron Park Drive to Missouri Flat Road R657 R1506 E F E E 4F 4F+2HOV+aux Lanes to greenstone 4F+aux Lanes
to Missouri Flat
6F+2HOV+aux Lanes to greenstone 4F+2HOV+aux Lanes
to Missouri Flat
ED Missouri Flat Road to End of Freeway in Placerville
R1506 1725 D F F F 4F 4F+aux Lanes 4F+aux Lanes
ED End of Freeway in Placerville to Bedford avenue
1725 1811 D E E E 4E 4E 4E
ED Bedford avenue to Cedar grove Exit 1811 R2595 D F F F 4F to Smith Flat 4E to Camino 4F+aux Lanes to Smith Flat 4E to Camino
4F+aux Lanes
1 Level of Service (LOS) A ldquoreport cardrdquo for evaluating traffic flow with ldquoArdquo being the best and ldquoFrdquo being the worst 2 20-year LOS (No Build) The LOS that would be expected at 20 years with no improvements 3 20-year Concept LOS The minimum acceptable LOS over the next 20 years 4 Facility Type Codes C=Conventional Highway E=Expressway F=Freeway HOV=High Occupancy Vehicle Lanes aux=auxiliary Lanes 5 Operational improvements are included in future facilities for all segments Examples of operational improvements include TOS improvements and auxiliary lanes 6 Concept Facility the future roadway with improvements needed in the next 20 years if LOS ldquoFrdquo no further degradation of service from existing ldquoFrdquo is acceptable as indicated by delay performance measurement 7 Ultimate Facility The future roadway with improvements needed beyond a 20 year timeframe
HigHway 50 corridor system management plans [ 37 ]
c h a p t e r f i v e p e r f o r m a n c e m e a s u r e s
Table 10 US 50 CSMP STraTegieS
Strategy description implementation Challenges
Maintain and operate the existing corridor multi-modal trans-
portation infrastructure
Maintain the existing investment in all modes of the transportation system and provide adequate resources for daily operations including operating
revenues for transit services
Funding availability funding competition within the region
Fully coordinate the delivery of transportation services and facili-ties in the corridor including daily operations and system planning
for enhancements
Interagency operational coordination to maximize the efficiency and effec-tiveness of all modes operating in the corridor with a focus on the CSMP transportation network defined in this CSMP Use of an existing group or
committee to provide initial oversight for this strategy
Diverse interests and competing priorities and limited resources
Construct planned and pro-grammed corridor capital improve-
ment projects
implementation of the capital improvements in the corridor included within the approved Metropolitan Transportation Plan and Regional Transportation
Plan for all transportation modes within the scope schedule and cost specified
Funding availability funding competition within the region
Comprehensive daily monitoring of the status of all modes providing service on the CSMP transporta-
tion network
Full deployment of multimodal transportation service status detection systems for all CSMP network components
Funding availability funding competition within region
Provide traveler information to the public
Provide the public with real-time easily accessible information regarding the status of all CSMP transportation system components so as to allow travel-
ers to make informed decisions about trip mode time and routing options
Funding availability funding competition within region
Continually monitor and analyze the CSMP transportation network to improve system performance
Monitor transportation performance measures and make system modifica-tions as appropriate on a frequent and timely basis Staff resources and data availability
Decrease the duration of non-recurrent traffic congestion
Expand and enhance the Freeway Service Patrol to respond to automobile accidents and vehicle break-downs
Funding availability funding competition within the region
Timely implementation of STaRNET
Expedite the implementation of the STaRNET operators of transportation facilities and emergency responders in the Sacramento region through real-time sharing of data and live video refinement of joint procedures
pertaining to the operation of roadways and public transit and public safety activities as well as enhance the regionrsquos 511 web site and interactive
telephone service to provide more traveler information
Developmental time acceptance by agencies and integration into daily use and identifica-
tion of maintenance and operations funding
Enhance transit and rail service increase transit service frequency provide express transit services imple-
ment bus rapid transit routes reduce headways for light rail and buses and construct planned light rail line extensions
Funding availability funding competition within the region
Complete Bus Carpool lane network
Complete the regional buscarpool lane network including freeway-to-freeway HOV lane connectors
Funding availability funding competition within the region Public agency and public
acceptance of network
[ 38 ] HigHway 50 corridor system management plan
c h a p t e r s i x p l a n n e d c o r r i d o r s y s t e m m a n a g e m e n t s t r a t e g i e s
tabLe 10 uS 50 CSMP StrategieS (ConTInued)
Strategy Description implementation Challenges
Enhance Transportation Demand Management strategies
Encourage employers to provide telecommuting and flexible working hour options to employees
acceptance by employers and resources to participate
Optimize the timing and synchronishyzation of traffic signals
Coordinate the optimization and timing of traffic signals on freeway ramps and along parallel and connecting roadways within and between jurisdicshytions to improve traffic flow and reduce congestion Provide signal priority
systems for transit vehicles
Funding availability and coordination among cities counties and Caltrans
improve access management of freeways and parallel connecting roadways
Develop and implement access management strategies to maintain the operational efficiency of freeways and parallelconnecting roadways
agreement between responsible jurisdicshytions as to where increased access control is needed increased access control on some parallelconnecting roadways may increase
traffic volumes on non-corridor roads
Develop innovative use of CMSs (eg travel times)
Potential uses of CMSs to improve system efficiency include the use of CMSs along portions of all corridors near transit station to indicate travel
times based on real-time existing traffic conditions on the freeway as well as on parallel roadways and express bus and light rail services CMS can also be used to identify the number of parking spaces that are still available at
the light-rail stations
Funding availability funding competition within the region
Implement amp expand Transit AVLTransit status information
enhancements for system users
Expand the use of AVL systems utilizing GPS technology to track in real-time the location of transit vehicles monitor transit schedules dispatch transit vehicles and provide real-time passenger information such as ldquonext busrdquo or
ldquonext trainrdquo arrival times
Funding availability funding competition within region
Expand Park-and-Ride lots at key locations
Add additional capacity to existing park-and-ride lots near transit stations and other locations that are approaching capacity
Funding availability funding competition within the region and available land
improve bike-pedestrian access in the CSMP
transportation network
Plan and program for construction of additional bicycle paths lanes and related improvements for access and connectivity to transit park and ride
lots and destination points
Funding availability funding competition within the region
Provide ldquoBike-SharingrdquordquoCar-Sharingrdquo tofrom transit (ldquoCarlinkrdquo) and from
neighborhoods
Expand the Regional Rideshare and Spare-the-Air programs to include bicycle and car sharing opportunities
Funding availability and coordination between SaCOg TMa air Districts employers developshyers property managers and local government
officials
Provide parking management stratshyegies in interested jurisdictions where applicable to discourage
use of single-occupant vehicles
in higher-density areas provide preferential parking for carpools and vanshypools require residential parking permits remove on-street parking and or provide graduated parking fees for metered on-street parking based on
vehicle type and time of day for SOV spaces to encourage transit use
Acceptance by businesses local officials and the general public
Expand bicycle commute amp transit fare strategiessubsidies
increase participation by large employers in programs that subsidize transit fares for employees during peak-hour commute times and provide bicycling
to work incentives
Voluntary participation by large employers to pay subsidy to transit providers
HigHway 50 corridor system management plan [ 39 ]
c h a p t e r s i x p l a n n e d c o r r i d o r s y s t e m m a n a g e m e n t s t r a t e g i e s
tabLe 11 KeY CaPitaL ProjeCtS
CountyLead agency
route roadway from to Project
Description Programmed
funds
additional funding Needed
total Cost estimate (x $1000)
Comp Year (FFY)
uS 50
Sacramento Caltrans District 3
US 50 Downtown watt avenue HOV Lanes $0 $75000 $75000 2020
Sacramento Caltrans District 3
US 50 watt avenue Sunrise Blvd HOV Lanes $165000 $0 $165000 2013
Sacramento Caltrans District 3
US 50 Bradshaw Road
Mather Field Road
Eastbound and Westbound Auxiliary Lanes
$0 $3700 $3700 2016
Sacramento Caltrans District 3
US 50 State Route 99
(Oak Park Interchange) interchange improvements including buscarpool lane
connectors $0 $150000 $150000 2014
Sacramento Caltrans District 3
US 50 interstate 5
(Riverfront Interchange) Riverfront Interchange
improvements including bus carpool lane connectors
$30000 $170000 $200000 2016
ED Caltrans District 3 US 50 Camino
Operational Safety improvements Construct an
undercrossing median barrier modify local road connections andor associated operational improvements on and adjacent
to US 50
$15000 $0 $15000 2012
ED ED County DOT US 50
west of Latrobe Road
west of Bass Lake
grade HOV Lanes (Ph1) $47141 $0 $47141 2010
ED Caltrans District 3 US 50
west of Bass Lake Road
Ponderosa Road
HOV Lanes (Ph2) $55000 $0 $55000 2011
ED Caltrans District 3 US 50 Ponderosa
Road greenstone
Road HOV Lanes (Ph3) $22357 $0 $22357 2013
ED ED County DOT US 50 Future Silva
Valley iC
Future Empire Ranch IC
Mainline Widening construct new WB lane within the
median from proposed Silva Valley IC to proposed Empire
Ranch IC
$2950 $0 $2950 2013
[ 40 ] HigHway 50 corridor system management plan
c h a p t e r s i x p l a n n e d c o r r i d o r s y s t e m m a n a g e m e n t s t r a t e g i e s
tabLe 11 KeY CaPitaL ProjeCtS (ConTInued)
CountyLead agency
route roadway from to Project
Description Programmed
funds
additional funding Needed
total Cost estimate (x $1000)
Comp Year (FFY)
PARALLEL AnD COnnECTInG ROADWAYS
ED ED County DOT
Silva Valley Parkway
Entrada Drive
Future US 50
Silva Valley Parkway iC
Widen Silva Valley Road from 2 lanes to 4 lanes includes
Class ii bike lanes and left turn storage pockets
$2921 $0 $2921 2010
ED ED County DOT
Silva Valley Parkway US 50
US50 Silva Valley Parkway (Phase 2) Includes constructshying overcrossing and ramps
signalization at EB and WB on off ramps
$57817 $0 $57817 2016
ED ED County DOT
Headington Road
Missouri Flat Road
El Dorado Road
Extend 2 lanes with median $9878 $0 $9878 2012
ED ED County DOT
Durock Road
Robin Lane South
Shingle Road
Extend 2 lanes with median $1239 $9214 $10453 2015
ED ED County DOT
Durock Road
Business Center Drive intersection signalization
includes adding turn pockets on Durock Road
$4333 $0 $4333 2009
ED City of Placerville
Point View Drive Broadway Smith Flat
Road Extend 2 lanes $1300 $0 $1300 2020
ED City of Placerville
western Placerville
US 50 interchange
Forni Road Ray Lawyer
Drive
Placerville Drive
Interchange Reconstruction convert Ray Lawyer Dr
Overcrossing to full IC Auxiliary Lanes
$5059 $34741 $39800 2020
Sacramento City of Rancho
Cordova
Mather Boulevard
Rockingham Road
Zinfandel Drive widen to 4 lanes $0 $8617 $8617 2020
Sacramento Rancho Cordova
Parkway ii
Grant Line Road
White Rock Road
New 6-lane expressway includshying intersection improvements at Kiefer Blvd amp White Rock
Road
$0 $44518 $44518 2020
Sacramento City of Folsom
Scott Road US 50 White Rock Rd
widen from 2 to 6 lanes $16000 $0 $16000 2020
Sacramento Sacramento County DOT
White Rock Road
Grant Line Rd
Prairie City Rd
Widen from 2 to 4 lanes realign near Nike and Nimbus Roads and connect with existshying alignment west of Prairie City Rd Realign Grant Line Rd to intersect with realigned
White Rock Rd
$26600 $0 $26600 2020
Sacramento Sacramento County DOT
Hazel avenue
US 50 Hazel Madison
Widen American River Bridge and approaches from 4 to 6 lanes Widen Hazel Avenue from AR Bridge to Madison from 4 to 6 lanes with Bike
LanesSignals
$83530 $0 $83530 2020
HigHway 50 corridor system management plan [ 41 ]
c h a p t e r s i x p l a n n e d c o r r i d o r s y s t e m m a n a g e m e n t s t r a t e g i e s
tabLe 11 KeY CaPitaL ProjeCtS (ConTInued)
CountyLead agency
route roadway from to Project
Description Programmed
funds
additional funding Needed
total Cost Estimate (x $1000)
Comp Year (FFY)
PARALLEL AnD COnnECTInG ROADWAYS
ED ED County DOT
green Valley Road
Salmon Falls Road
east
Deer Valley Road
widen from 2 to 4 lanes $0 $14576 $14576 2025
ED ED County DOT
green Valley Road
Deer Valley Road east Lotus Road widen $958 $4513 $5471 2015
ED ED County DOT
green Valley Road
Francisco Drive
Salmon Falls Road
widen from 2 to 4 lanes divided $412 $3491 $3903 2015
ED ED County DOT
Latrobe Road
investment Boulevard
golden Foothill Parkway
widen from 2 lanes undivided to 4 lanes
divided $1076 $8792 $9868 2015
ED ED County DOT
Latrobe Road
Carson Creek
White Rock Road
widen from 4 to 6 lanes $0 $23755 $23755 2025
ED ED County DOT
white Rock Road
EDSac County Line
Manchester Drive
widen 2 to 4 lanes divided includes signal interconnect and coorshy
dination
$0 $23755 $23755 2025
Sacramento City of Rancho
Cordova
Easton Valley
Parkway
Prairie City Road
Empire Ranch Road extenshysion south of
US 50
Construct new 4 lane road $0 $45000 $45000 2020
Sacramento Sacramento County DOT
Hazel avenue
Easton Valley
Parkway
Grant Line RoadWhite Rock Road
New road extension 4 lane limited access
through aerojet property $0 $18000 $18000 2018
Sacramento Sacramento County DOT
white Rock Road
Prairie City Road
ED County Line
widen to 4 lanes $8330 $64773 $73103 2018
Sacramento Sacramento County DOT
green Valley Road
East Natoma Sacramento ED County
line widen to 4 lanes $0 $3000 $3000 2018
Sacramento City of Rancho
Cordova
Zinfandel Drive
international Drive
Folsom Boulevard
widen to 4 lanes $0 $12000 $12000 2020
[ 42 ] HigHway 50 corridor system management plan
c h a p t e r s i x p l a n n e d c o r r i d o r s y s t e m m a n a g e m e n t s t r a t e g i e s
tabLe 11 KeY CaPitaL ProjeCtS (ConTInued)
CountyLead agency
route roadway from to Project
Description
Pro-grammed
funds
addi-tional
funding Needed
total Cost estimate (x $1000)
Comp Year (FFY)
traNSit
yolo amp Sacramento City of west Sacramento
amp City of Sacramento
Sacramento River
Crossing
15th Street in the City
of west Sacramento
Broadway in the City of
Sacramento
New all-modal river crossing (Auto Transit Bike amp Pedestrian)
from Sacramento across the Sacramento River to West
Sacramento The crossing was modeled between Broadway in Sacramento amp 15th Street in
West Sacramento but final alignshyment options will be studied in subsequent planning efforts
$800 $99200 $100000 2019
Sacramento Cal State University
Sacramento
CSUS Campus mdash mdash
Sac State Tram adjoining City streets and SRTD 65th Street light railbus transfer station Bus Rapid Transit System
$23574 $0 $23574 2013
Sacramento City of Rancho
Cordova
Rancho Cordova Various Various
New Service Rancho Cordova Pilot Transit Shuttle System new transit service for connection to
RTs Gold Line
$2380 $1500 $38880 2014
yolo amp Sacramento City of west Sacramento
TBD west
Sacramento Sacramento Streetcar Service between west
Sacramento and Downtown Sacramento
$17400 $54700 $72100 2014
Sacramento City of Rancho
Cordova RT Gold Line
RT Gold Line Tracks
Mather Field Road
Light Rail Grade Separations $0 $52888 $52888 2025
Sacramento City of Rancho
Cordova RT Gold Line
RT Gold Line Tracks Zinfandel Drive Light Rail Grade Separations $0 $52888 $52888 2025
Sacramento City of Rancho
Cordova RT Gold Line
RT Gold Line Tracks
Bradshaw Road
Light Rail Grade Separations $0 $35260 $35260 2025
Sacramento City of Rancho
Cordova RT Gold Line
RT Gold Line Tracks Routier Road Light Rail Grade Separations $0 $35260 $35260 2025
Sacramento City of
Sacramento Sacramento Valley Station
Sacramento intermodal Transportation Facility (Phase 1) - Develop intermodal transportashytion terminal for heavy rail light
rail and bus service
$77799 $0 $77799 2010
Sacramento City of
Sacramento Sacramento Valley Station
Sacramento intermodal Transportation Facility (Phase 2) - Develop intermodal transportashytion terminal for heavy rail light
rail and bus service
$24101 $1000 $25101 2014
HigHway 50 corridor system management plan [ 43 ]
c h a p t e r s i x p l a n n e d c o r r i d o r s y s t e m m a n a g e m e n t s t r a t e g i e s
TABLE 11 KEY CAPITAL PROJECTS (CONTINUED)
CountyLead Agency
Route Roadway From To Project
Description Programmed
Funds
Additional Funding Needed
Total Cost Es-timate (x $1000)
Comp Year (FFY)
BICYCLE ROUTES
Sacramento City of Rancho
Cordova
US 50Mather Field Road IC US 50 Mather
Field Road
US 50Mather Field Road PedestrianBike Crossing along
the Mather Airport RR Spur alignment
$0 $820 $1055 2015
ED ED County DOT
Sacramento Placerville
Transportation Corridor
Forni Rd
Missouri Flat Rd Class I Bike Trail $1423 $111 $1534 2009
ED City of Placerville
El Dorado Trail Western
Extension
Canal Street Main Street
Ray Lawyer DriveForni
Road Class 1 Bike Trail $1850 $0 $1850 2010
ED ED County DOT
US 50ED Hills Blvd IC US 50
El Dorado Hills Blvd
Latrobe Road
US 50El Dorado Hills Blvd Pedestrian Overcrossing $5508 $66 $5574 2014
TABLE 12 50 MOBILITY PARTNERSHIP KEY CAPITAL PROJECTS
RouteRoadway From To Project Description
NEAR TERM PRIORITY IMPROVEMENT PROJECTS
US 50 Sunrise Scott Road Auxiliary Lane
US 50 Hazel Avenue Interchange Improvements
Hazel Avenue Folsom Boulevard Easton Valley Parkway New 4 Lane Road
Easton Valley Parkway Hazel Avenue Rancho Cordova Parkway New 6 Lane Road
Rancho Cordova Parkway Easton Valley Parkway White Rock Road New 4 Lane Road
White Rock Road Sunrise Boulevard Silva Valley Parkway Widen to 4 Lanes
RT Gold Line Hazel Iron Point Station Passing Tracks
US 50 Rancho Cordova Parkway New Interchange
Zinfandel Drive South of International Douglas Road New 4 Lane Road
International Drive Kilgore Road Rancho Cordova Parkway New 6 Lane Road
Douglas Road Zinfandel Extension Sunrise Boulevard Widen to 4 Lanes
Sunrise LRT Citrus Road Sunrise Mall Bus Rapid TransitExpress Bus
[ 44 ] HIGHWAY 50 corridor system management plan
c h a p t e r s i x p l a n n e d c o r r i d o r s y s t e m m a n a g e m e n t s t r a t e g i e s
TABLE 12 50 mOBILITY PARTnERSHIP kEY CAPITAL PROjECTS (COnTInUED)
routeroadway from to Project Description
US 50 nEAR TERm PRIORITY ImPROVEmEnT PROjECTS
US 50 Empire Ranch Road New interchange
US 50 Silva Valley New interchange
US 50 Scott Road Empire Ranch Road Aux Lanes
US 50 Empire Ranch Road El Dorado Hills Boulevard Aux lanes and climbing lanes
US 50 El Dorado Hills Boulevard Silva Valley Parkway Aux lanes and climbing lanes
US 50 Silva Valley Parkway Bass Lake Road Aux lanes
Sunrise Boulevard White Rock Road Douglas Boulevard widen to 6 lanes
Sunrise Boulevard Douglas Boulevard Jackson Road widen to 4 lanes
White Rock Road Sunrise Boulevard Future Rancho Cordova Parkway and El Dorado County Line to Latrobe Road
widen to 4 lanes
Douglas Boulevard Sunrise Boulevard Grant Line Road widen to 4 lanes
Rancho Cordova Parkway Douglas Boulevard Rio del Oro Parkway New 2 lane road
Rancho Cordova Parkway Rio del Oro Parkway White Rock Road New 6 lane road
Jaeger Road Douglas Road Kiefer Boulevard New 4 lane road
Chrysanthy Sunrise Boulevard Americanos Boulevard New 4 lane road
Kiefer Boulevard Sunrise Boulevard Jaeger Road New 4 lane road
Grant Line Road Douglas Road Chrysanthy Road widen to 4 lanes
Hazel avenue Gold Country Boulevard Madison avenue widen to 6 lanes
Latrobe Road South of White Rock Road widen to 4 lanes
TABLE 13 VISIOnARY PROjECTS
County routeroadway from to Project Description
Sac yolo US 50 Enterprise Downtown Sacramento HOV Lanes
ED TBD Folsom Placerville Transit ndash Type TBD
ED New Road Latrobe Road White Rock Road (poten shy
tially US 50) New 2-lane road
HigHway 50 corridor system management plan [ 45 ]
c h a p t e r s i x p l a n n e d c o r r i d o r s y s t e m m a n a g e m e n t s t r a t e g i e s
[ 46 ] HigHway 50 corridor system management plan
Page Inte
ntionally
Left
Blank
congestion and bottleneck analysis
chapter seven
The 2000 Highway Capacity Manual defines a bottleneck
as ldquoa road element on which demand exceeds capacityrdquo
The bottleneck analysis evaluates specific causes of existshying recurrent traffic congestion in the corridor Freeway bottleneck locations that create mobility constraints are identified and documented and their relative contribution
to corridor-wide congestion is reported The bottleneck locations were determined based on a combination of the use of 2006 PeMS data HiCOMP report probe vehicle tach runs and field observations
Traffic congestion can be categorized as either recurrent
or non-recurrent
recurrent congestion occurs repeatedly at the same place and time of day in a predictable pattern Recurrent congesshytion is often associated with facility capacity limitations changes in capacity conflicting vehicle movements such
as lane merges inadequate number of transit vehicles to handle passenger loads or other persistent physical condishytions of the transportation facility
Non-recurrent congestion is usually attributed to collishysions equipment malfunction community events weather construction projects and other occasional occurrences When transportation systems are close to their maximum
carrying capacity non-recurrent congestion is more likely to occur as there is little excess capacity in the system
The location and extent of the bottlenecks on US 50 found
in the aM and PM peak periods are summarized in Tables 14 and 15 These depictions should be considered a snapshyshot view and not a comprehensive analysis of all bottleshynecks in the corridor Further work is being conducted to
refine the identification and causality of bottlenecks within
the corridor Table 14 shows a summary of the US 50 eastbound bottlenecks while the tables that follow discuss each bottleneck including location and possible causality Table 15 shows a summary of the US 50 westbound bottleshynecks while the tables that follow discuss each bottleneck including location and possible causality Minor or hidden bottlenecks are those Freeway bottleneck
that are not as defined locations that create (or severe) as the major mobility constraints bottlenecks Please note are identified and that the graphics accomshy documented and their panying the bottlenecks
relative contribution to are not to scale
corridor-wide congestion Major bottlenecks in the is reported eastbound direction during the aM peak period are at Howe avenue and during the PM peak period are at 48th Street Howe Avenue Mayhew Road Routier Road Sunrise Boulevard and El Dorado Hills Boulevard Major bottlenecks in the westbound direction during the aM peak period are at El Dorado Hills Boulevard Hazel Avenue Zinfandel Drive
HigHway 50 corridor system management plan [ 47 ]
c h a p t e r s e v e n c o n g e s t i o n a n d b o t t l e n e c k a n a l y s i s
Bradshaw Road and Howe Avenue and major bottleneck
locations during the PM peak period are at Zinfandel Drive Routier Road Bradshaw Road Howe Avenue and Intershystate 5
Causalities for these bottlenecks range from high-traffic
demand (congestion) heavy weavingmerging areas or physical constraints such as lane drops lack of ramp meters incomplete HOV network incomplete Auxiliary Lane
network poorly coordinated traffic signals and an off-ramp
queue (Sunrise Boulevard) US 50 Westbound Onramp
TABLE 14 US 50 EASTBOUnD BOTTLEnECk SUmmARY Source PeMS Caltrans tach runs and
Cambridge Systematics field observations
bottleneck Location PeMS Speed Contours Caltrans Probe Vehicle Runs
Cause aM PM aM PM
A Jefferson Blvd PM 25 Minor Minor Traffic weaving truck volumes and grade
B 48th St PM 7 Minor Major Minor Minor Merge from SR 51 and SR 99
C Howe ave PM 9 Major Major Major weave between Howe and watt
D Mayhew Rd PM 12 Major Minor Major Weaving before Bradshaw Exit
E Routier Rd PM 14 Minor Major Weaving before Mather Field Rd Exit
F Sunrise Blvd PM 185 Minor Major Lane drop HOV add off-ramp queue
G Folsom Blvd PM 22 Minor Minor Lane drop 4 to 3
H El Dorado Hills Blvd PM 275 Major
Poorly coordinated traffic signal on arterial causes spillback onto freeway
a jefferson blvd bottleneck The bottleneck approximately located at Jefferson Blvd is due to weaving traffic as those entershying the freeway from Jefferson Blvd must cross those attempting to exit the freeway to I 5 There is a large number of trucks in the stream which struggle with the grade at this location exacerbatshying the bottleneck
[ 48 ] HigHway 50 corridor system management plan
c h a p t e r s e v e n c o n g e s t i o n a n d b o t t l e n e c k a n a l y s i s
b 48th St bottleneck The bottleneck approximately located at 48th St is due to the additional traffic merging from SR 51 and SR 99 combined with the eventual lane drop at 59th St This queue extends upstream past the off-ramp to SR 5199 These off-ramps are bottlenecks in themselves which spill back and choke the US 50 mainline
C Howe Ave Bottleneck The bottleneck at Howe ave is due to the entering traffic from Howe Ave Two Howe Ave on-ramps feed into US 50 eastbound southbound Howe ave loop on-ramp and northbound Howe ave direct ramp approximately 300 feet apart The watt avenue off-ramp is just down stream with heavy exiting volumes therefore the segment between Howe and watt is characterized by heavy weaving
D mayhew Rd Bottleneck The bottleneck approximately located at Mayhew Rd most likely begins with the additional traffic entering from Watt Ave and ends with the exiting traffic at Bradshaw Rd It is possible that there is a high proportion of weaving traffic with in this section (Watt Ave traffic moving to the left lane and those exiting at Bradshaw Rd moving to the right lane)
HigHway 50 corridor system management plan [ 49 ]
c h a p t e r s e v e n c o n g e s t i o n a n d b o t t l e n e c k a n a l y s i s
[ 50 ] HigHway 50 corridor system management plan
e routier rd bottleneck It is likely that the bottleneck at Routier Rd is due to the same merging conditions associated with Mayhew Rd The area is comprised of both residential and light industrialoffice land uses therefore during the PM peak period there are large volumes of vehicles entering at Bradshaw Rd moving to the left lanes and large volumes of vehicles moving to the right lane to exit at Mather Field Rd
f Sunrise blvd bottleneck At Sunrise Blvd the right-most lane exits while an HOV lane is added as the median lane The bottleneck is formed from vehicles shifting left to avoid exiting at Sunrise Blvd and to enter the HOV lane There is a large volume of vehicles queued at the Sunrise off-ramp which spills back and negatively affects the US 50 mainline
g folsom blvd bottleneck The right-most lane exits to Folsom Blvd leaving one HOV lane and two regular lanes along the US 50 The bottleneck is caused by this lane drop as well as the quick merge at the Folsom on-ramp
c h a p t e r s e v e n c o n g e s t i o n a n d b o t t l e n e c k a n a l y s i s
H The eastbound US 50 at El Dorado Hills Blvd Bottleneck The eastbound El Dorado Hills Blvd bottleneck is caused by a traffic signal on the arterial that often causes spillbacks on the EB loop offramp onto the freeway mainlines
TABLE 15 US 50 WESTBOUnD BOTTLEnECk SUmmARY Source PeMS Caltrans tach runs and Cambridge Systematics field observations
bottleneck Location PeMS Speed Contours Caltrans Probe Vehicle Runs
Cause aM PM aM PM
A El Dorado Hills Blvd PM 275 Major Poorly coordinated traffic
signal on El Dorado Hills Blvd
B Hazel Ave PM 21 Major Entering traffic
C Zinfandel Dr PM 16 Minor Major Major Major Entering traffic
D Routier Rd PM 14 Minor Major Minor Weaving traffic
E Bradshaw PM 13 Major Major Major Merging traffic and curve
F Howe Ave PM 9 Minor Major Major Major Weaving traffic and grade
G SR 51SR 99 PM 6 Minor Lane drop weaving traffic
H i-5 PM 3 Major Weaving traffic
HigHway 50 corridor system management plan [ 51 ]
c h a p t e r s e v e n c o n g e s t i o n a n d b o t t l e n e c k a n a l y s i s
[ 52 ] HigHway 50 corridor system management plan
A El Dorado Hills Blvd Bottleneck The minor bottleneck at El Dorado Hills Boulevard is caused by the traffic signal on El Dorado Hills Blvd that causes spillback on the westbound offramp onto the freeway mainlines
B Hazel Avenue Bottleneck In 2006 the Hazel Ave Bottleneck is caused by the traffic entering at both Hazel Ave and Folsom Blvd (the two on-ramps are separated by about one mile) The bottleneck that would appear at Folsom Blvd combines with the bottleneck at Hazel ave to form a large bottleneck that does not clear until after Hazel ave Sometimes causshying spillbacks as far as Prairies City Road this bottleneck was mitigated in 2007 as part of the GO CALIFORNIA program
C Zinfandel Dr Bottleneck There is heavy traffic coming from Sunrise Blvd but the lane addition immediately after the westbound on-ramp prevents a bottleneck from forming but as traffic flows westward the heavy traffic entering from Zinfandel Dr causes a bottleshyneck here
D Routier Rd Bottleneck The bottleneck at Routier Rd is caused by weaving traffic between Mather Field Rd and Bradshaw Rd This highway segment represents a transition area where vehicles that have been traveling in the left lanes begin to shift to the right lanes to exit while the entering traffic tries to shift to the left lanes
W eav in gLan e Dr o p
c h a p t e r s e v e n c o n g e s t i o n a n d b o t t l e n e c k a n a l y s i s
e bradshaw rd bottleneck The Bradshaw Rd bottleneck is caused by the entering traffic from Bradshaw Road the high truck volumes and the curve west of Bradshaw Two Bradshaw Rd on-ramps feed into US 50 westshybound southbound Bradshaw Rd direct on-ramp and northbound Bradshaw Rd loop on-ramp approximately 400 feet apart
F Howe Ave Bottleneck The Howe ave bottleneck is caused by a grade change and the weaving traffic entering from Howe ave and Hornet Dr competing for the right-most lane with those wanting to exit at 65th Street
G amp H SR 51SR 99 amp I-5 Bottleneck The bottleneck at I 5 is caused by the conflict between entering SR 99 and SR 51 traffic and exiting I-5 traffic as well as the queues formed on the ramps to i-5 which spill back onto US 50 The number of lanes in this section reaches a maximum of 6 and then drops to 4 as two lanes exit at the I-5 freeway This bottleneck is exacershybated during the peak periods when it stretches upstream to the lane drop before SR 99
W ea v in g
Lan e Dr o p
HigHway 50 corridor system management plan [ 53 ]

c h a p t e r s i x p l a n n e d c o r r i d o r s y s t e m m a n a g e m e n t s t r a t e g i e s
tabLe 11 KeY CaPitaL ProjeCtS
CountyLead agency
route roadway from to Project
Description Programmed
funds
additional funding Needed
total Cost estimate (x $1000)
Comp Year (FFY)
uS 50
Sacramento Caltrans District 3
US 50 Downtown watt avenue HOV Lanes $0 $75000 $75000 2020
Sacramento Caltrans District 3
US 50 watt avenue Sunrise Blvd HOV Lanes $165000 $0 $165000 2013
Sacramento Caltrans District 3
US 50 Bradshaw Road
Mather Field Road
Eastbound and Westbound Auxiliary Lanes
$0 $3700 $3700 2016
Sacramento Caltrans District 3
US 50 State Route 99
(Oak Park Interchange) interchange improvements including buscarpool lane
connectors $0 $150000 $150000 2014
Sacramento Caltrans District 3
US 50 interstate 5
(Riverfront Interchange) Riverfront Interchange
improvements including bus carpool lane connectors
$30000 $170000 $200000 2016
ED Caltrans District 3 US 50 Camino
Operational Safety improvements Construct an
undercrossing median barrier modify local road connections andor associated operational improvements on and adjacent
to US 50
$15000 $0 $15000 2012
ED ED County DOT US 50
west of Latrobe Road
west of Bass Lake
grade HOV Lanes (Ph1) $47141 $0 $47141 2010
ED Caltrans District 3 US 50
west of Bass Lake Road
Ponderosa Road
HOV Lanes (Ph2) $55000 $0 $55000 2011
ED Caltrans District 3 US 50 Ponderosa
Road greenstone
Road HOV Lanes (Ph3) $22357 $0 $22357 2013
ED ED County DOT US 50 Future Silva
Valley iC
Future Empire Ranch IC
Mainline Widening construct new WB lane within the
median from proposed Silva Valley IC to proposed Empire
Ranch IC
$2950 $0 $2950 2013
[ 40 ] HigHway 50 corridor system management plan
c h a p t e r s i x p l a n n e d c o r r i d o r s y s t e m m a n a g e m e n t s t r a t e g i e s
tabLe 11 KeY CaPitaL ProjeCtS (ConTInued)
CountyLead agency
route roadway from to Project
Description Programmed
funds
additional funding Needed
total Cost estimate (x $1000)
Comp Year (FFY)
PARALLEL AnD COnnECTInG ROADWAYS
ED ED County DOT
Silva Valley Parkway
Entrada Drive
Future US 50
Silva Valley Parkway iC
Widen Silva Valley Road from 2 lanes to 4 lanes includes
Class ii bike lanes and left turn storage pockets
$2921 $0 $2921 2010
ED ED County DOT
Silva Valley Parkway US 50
US50 Silva Valley Parkway (Phase 2) Includes constructshying overcrossing and ramps
signalization at EB and WB on off ramps
$57817 $0 $57817 2016
ED ED County DOT
Headington Road
Missouri Flat Road
El Dorado Road
Extend 2 lanes with median $9878 $0 $9878 2012
ED ED County DOT
Durock Road
Robin Lane South
Shingle Road
Extend 2 lanes with median $1239 $9214 $10453 2015
ED ED County DOT
Durock Road
Business Center Drive intersection signalization
includes adding turn pockets on Durock Road
$4333 $0 $4333 2009
ED City of Placerville
Point View Drive Broadway Smith Flat
Road Extend 2 lanes $1300 $0 $1300 2020
ED City of Placerville
western Placerville
US 50 interchange
Forni Road Ray Lawyer
Drive
Placerville Drive
Interchange Reconstruction convert Ray Lawyer Dr
Overcrossing to full IC Auxiliary Lanes
$5059 $34741 $39800 2020
Sacramento City of Rancho
Cordova
Mather Boulevard
Rockingham Road
Zinfandel Drive widen to 4 lanes $0 $8617 $8617 2020
Sacramento Rancho Cordova
Parkway ii
Grant Line Road
White Rock Road
New 6-lane expressway includshying intersection improvements at Kiefer Blvd amp White Rock
Road
$0 $44518 $44518 2020
Sacramento City of Folsom
Scott Road US 50 White Rock Rd
widen from 2 to 6 lanes $16000 $0 $16000 2020
Sacramento Sacramento County DOT
White Rock Road
Grant Line Rd
Prairie City Rd
Widen from 2 to 4 lanes realign near Nike and Nimbus Roads and connect with existshying alignment west of Prairie City Rd Realign Grant Line Rd to intersect with realigned
White Rock Rd
$26600 $0 $26600 2020
Sacramento Sacramento County DOT
Hazel avenue
US 50 Hazel Madison
Widen American River Bridge and approaches from 4 to 6 lanes Widen Hazel Avenue from AR Bridge to Madison from 4 to 6 lanes with Bike
LanesSignals
$83530 $0 $83530 2020
HigHway 50 corridor system management plan [ 41 ]
c h a p t e r s i x p l a n n e d c o r r i d o r s y s t e m m a n a g e m e n t s t r a t e g i e s
tabLe 11 KeY CaPitaL ProjeCtS (ConTInued)
CountyLead agency
route roadway from to Project
Description Programmed
funds
additional funding Needed
total Cost Estimate (x $1000)
Comp Year (FFY)
PARALLEL AnD COnnECTInG ROADWAYS
ED ED County DOT
green Valley Road
Salmon Falls Road
east
Deer Valley Road
widen from 2 to 4 lanes $0 $14576 $14576 2025
ED ED County DOT
green Valley Road
Deer Valley Road east Lotus Road widen $958 $4513 $5471 2015
ED ED County DOT
green Valley Road
Francisco Drive
Salmon Falls Road
widen from 2 to 4 lanes divided $412 $3491 $3903 2015
ED ED County DOT
Latrobe Road
investment Boulevard
golden Foothill Parkway
widen from 2 lanes undivided to 4 lanes
divided $1076 $8792 $9868 2015
ED ED County DOT
Latrobe Road
Carson Creek
White Rock Road
widen from 4 to 6 lanes $0 $23755 $23755 2025
ED ED County DOT
white Rock Road
EDSac County Line
Manchester Drive
widen 2 to 4 lanes divided includes signal interconnect and coorshy
dination
$0 $23755 $23755 2025
Sacramento City of Rancho
Cordova
Easton Valley
Parkway
Prairie City Road
Empire Ranch Road extenshysion south of
US 50
Construct new 4 lane road $0 $45000 $45000 2020
Sacramento Sacramento County DOT
Hazel avenue
Easton Valley
Parkway
Grant Line RoadWhite Rock Road
New road extension 4 lane limited access
through aerojet property $0 $18000 $18000 2018
Sacramento Sacramento County DOT
white Rock Road
Prairie City Road
ED County Line
widen to 4 lanes $8330 $64773 $73103 2018
Sacramento Sacramento County DOT
green Valley Road
East Natoma Sacramento ED County
line widen to 4 lanes $0 $3000 $3000 2018
Sacramento City of Rancho
Cordova
Zinfandel Drive
international Drive
Folsom Boulevard
widen to 4 lanes $0 $12000 $12000 2020
[ 42 ] HigHway 50 corridor system management plan
c h a p t e r s i x p l a n n e d c o r r i d o r s y s t e m m a n a g e m e n t s t r a t e g i e s
tabLe 11 KeY CaPitaL ProjeCtS (ConTInued)
CountyLead agency
route roadway from to Project
Description
Pro-grammed
funds
addi-tional
funding Needed
total Cost estimate (x $1000)
Comp Year (FFY)
traNSit
yolo amp Sacramento City of west Sacramento
amp City of Sacramento
Sacramento River
Crossing
15th Street in the City
of west Sacramento
Broadway in the City of
Sacramento
New all-modal river crossing (Auto Transit Bike amp Pedestrian)
from Sacramento across the Sacramento River to West
Sacramento The crossing was modeled between Broadway in Sacramento amp 15th Street in
West Sacramento but final alignshyment options will be studied in subsequent planning efforts
$800 $99200 $100000 2019
Sacramento Cal State University
Sacramento
CSUS Campus mdash mdash
Sac State Tram adjoining City streets and SRTD 65th Street light railbus transfer station Bus Rapid Transit System
$23574 $0 $23574 2013
Sacramento City of Rancho
Cordova
Rancho Cordova Various Various
New Service Rancho Cordova Pilot Transit Shuttle System new transit service for connection to
RTs Gold Line
$2380 $1500 $38880 2014
yolo amp Sacramento City of west Sacramento
TBD west
Sacramento Sacramento Streetcar Service between west
Sacramento and Downtown Sacramento
$17400 $54700 $72100 2014
Sacramento City of Rancho
Cordova RT Gold Line
RT Gold Line Tracks
Mather Field Road
Light Rail Grade Separations $0 $52888 $52888 2025
Sacramento City of Rancho
Cordova RT Gold Line
RT Gold Line Tracks Zinfandel Drive Light Rail Grade Separations $0 $52888 $52888 2025
Sacramento City of Rancho
Cordova RT Gold Line
RT Gold Line Tracks
Bradshaw Road
Light Rail Grade Separations $0 $35260 $35260 2025
Sacramento City of Rancho
Cordova RT Gold Line
RT Gold Line Tracks Routier Road Light Rail Grade Separations $0 $35260 $35260 2025
Sacramento City of
Sacramento Sacramento Valley Station
Sacramento intermodal Transportation Facility (Phase 1) - Develop intermodal transportashytion terminal for heavy rail light
rail and bus service
$77799 $0 $77799 2010
Sacramento City of
Sacramento Sacramento Valley Station
Sacramento intermodal Transportation Facility (Phase 2) - Develop intermodal transportashytion terminal for heavy rail light
rail and bus service
$24101 $1000 $25101 2014
HigHway 50 corridor system management plan [ 43 ]
c h a p t e r s i x p l a n n e d c o r r i d o r s y s t e m m a n a g e m e n t s t r a t e g i e s
TABLE 11 KEY CAPITAL PROJECTS (CONTINUED)
CountyLead Agency
Route Roadway From To Project
Description Programmed
Funds
Additional Funding Needed
Total Cost Es-timate (x $1000)
Comp Year (FFY)
BICYCLE ROUTES
Sacramento City of Rancho
Cordova
US 50Mather Field Road IC US 50 Mather
Field Road
US 50Mather Field Road PedestrianBike Crossing along
the Mather Airport RR Spur alignment
$0 $820 $1055 2015
ED ED County DOT
Sacramento Placerville
Transportation Corridor
Forni Rd
Missouri Flat Rd Class I Bike Trail $1423 $111 $1534 2009
ED City of Placerville
El Dorado Trail Western
Extension
Canal Street Main Street
Ray Lawyer DriveForni
Road Class 1 Bike Trail $1850 $0 $1850 2010
ED ED County DOT
US 50ED Hills Blvd IC US 50
El Dorado Hills Blvd
Latrobe Road
US 50El Dorado Hills Blvd Pedestrian Overcrossing $5508 $66 $5574 2014
TABLE 12 50 MOBILITY PARTNERSHIP KEY CAPITAL PROJECTS
RouteRoadway From To Project Description
NEAR TERM PRIORITY IMPROVEMENT PROJECTS
US 50 Sunrise Scott Road Auxiliary Lane
US 50 Hazel Avenue Interchange Improvements
Hazel Avenue Folsom Boulevard Easton Valley Parkway New 4 Lane Road
Easton Valley Parkway Hazel Avenue Rancho Cordova Parkway New 6 Lane Road
Rancho Cordova Parkway Easton Valley Parkway White Rock Road New 4 Lane Road
White Rock Road Sunrise Boulevard Silva Valley Parkway Widen to 4 Lanes
RT Gold Line Hazel Iron Point Station Passing Tracks
US 50 Rancho Cordova Parkway New Interchange
Zinfandel Drive South of International Douglas Road New 4 Lane Road
International Drive Kilgore Road Rancho Cordova Parkway New 6 Lane Road
Douglas Road Zinfandel Extension Sunrise Boulevard Widen to 4 Lanes
Sunrise LRT Citrus Road Sunrise Mall Bus Rapid TransitExpress Bus
[ 44 ] HIGHWAY 50 corridor system management plan
c h a p t e r s i x p l a n n e d c o r r i d o r s y s t e m m a n a g e m e n t s t r a t e g i e s
TABLE 12 50 mOBILITY PARTnERSHIP kEY CAPITAL PROjECTS (COnTInUED)
routeroadway from to Project Description
US 50 nEAR TERm PRIORITY ImPROVEmEnT PROjECTS
US 50 Empire Ranch Road New interchange
US 50 Silva Valley New interchange
US 50 Scott Road Empire Ranch Road Aux Lanes
US 50 Empire Ranch Road El Dorado Hills Boulevard Aux lanes and climbing lanes
US 50 El Dorado Hills Boulevard Silva Valley Parkway Aux lanes and climbing lanes
US 50 Silva Valley Parkway Bass Lake Road Aux lanes
Sunrise Boulevard White Rock Road Douglas Boulevard widen to 6 lanes
Sunrise Boulevard Douglas Boulevard Jackson Road widen to 4 lanes
White Rock Road Sunrise Boulevard Future Rancho Cordova Parkway and El Dorado County Line to Latrobe Road
widen to 4 lanes
Douglas Boulevard Sunrise Boulevard Grant Line Road widen to 4 lanes
Rancho Cordova Parkway Douglas Boulevard Rio del Oro Parkway New 2 lane road
Rancho Cordova Parkway Rio del Oro Parkway White Rock Road New 6 lane road
Jaeger Road Douglas Road Kiefer Boulevard New 4 lane road
Chrysanthy Sunrise Boulevard Americanos Boulevard New 4 lane road
Kiefer Boulevard Sunrise Boulevard Jaeger Road New 4 lane road
Grant Line Road Douglas Road Chrysanthy Road widen to 4 lanes
Hazel avenue Gold Country Boulevard Madison avenue widen to 6 lanes
Latrobe Road South of White Rock Road widen to 4 lanes
TABLE 13 VISIOnARY PROjECTS
County routeroadway from to Project Description
Sac yolo US 50 Enterprise Downtown Sacramento HOV Lanes
ED TBD Folsom Placerville Transit ndash Type TBD
ED New Road Latrobe Road White Rock Road (poten shy
tially US 50) New 2-lane road
HigHway 50 corridor system management plan [ 45 ]
c h a p t e r s i x p l a n n e d c o r r i d o r s y s t e m m a n a g e m e n t s t r a t e g i e s
[ 46 ] HigHway 50 corridor system management plan
Page Inte
ntionally
Left
Blank
congestion and bottleneck analysis
chapter seven
The 2000 Highway Capacity Manual defines a bottleneck
as ldquoa road element on which demand exceeds capacityrdquo
The bottleneck analysis evaluates specific causes of existshying recurrent traffic congestion in the corridor Freeway bottleneck locations that create mobility constraints are identified and documented and their relative contribution
to corridor-wide congestion is reported The bottleneck locations were determined based on a combination of the use of 2006 PeMS data HiCOMP report probe vehicle tach runs and field observations
Traffic congestion can be categorized as either recurrent
or non-recurrent
recurrent congestion occurs repeatedly at the same place and time of day in a predictable pattern Recurrent congesshytion is often associated with facility capacity limitations changes in capacity conflicting vehicle movements such
as lane merges inadequate number of transit vehicles to handle passenger loads or other persistent physical condishytions of the transportation facility
Non-recurrent congestion is usually attributed to collishysions equipment malfunction community events weather construction projects and other occasional occurrences When transportation systems are close to their maximum
carrying capacity non-recurrent congestion is more likely to occur as there is little excess capacity in the system
The location and extent of the bottlenecks on US 50 found
in the aM and PM peak periods are summarized in Tables 14 and 15 These depictions should be considered a snapshyshot view and not a comprehensive analysis of all bottleshynecks in the corridor Further work is being conducted to
refine the identification and causality of bottlenecks within
the corridor Table 14 shows a summary of the US 50 eastbound bottlenecks while the tables that follow discuss each bottleneck including location and possible causality Table 15 shows a summary of the US 50 westbound bottleshynecks while the tables that follow discuss each bottleneck including location and possible causality Minor or hidden bottlenecks are those Freeway bottleneck
that are not as defined locations that create (or severe) as the major mobility constraints bottlenecks Please note are identified and that the graphics accomshy documented and their panying the bottlenecks
relative contribution to are not to scale
corridor-wide congestion Major bottlenecks in the is reported eastbound direction during the aM peak period are at Howe avenue and during the PM peak period are at 48th Street Howe Avenue Mayhew Road Routier Road Sunrise Boulevard and El Dorado Hills Boulevard Major bottlenecks in the westbound direction during the aM peak period are at El Dorado Hills Boulevard Hazel Avenue Zinfandel Drive
HigHway 50 corridor system management plan [ 47 ]
c h a p t e r s e v e n c o n g e s t i o n a n d b o t t l e n e c k a n a l y s i s
Bradshaw Road and Howe Avenue and major bottleneck
locations during the PM peak period are at Zinfandel Drive Routier Road Bradshaw Road Howe Avenue and Intershystate 5
Causalities for these bottlenecks range from high-traffic
demand (congestion) heavy weavingmerging areas or physical constraints such as lane drops lack of ramp meters incomplete HOV network incomplete Auxiliary Lane
network poorly coordinated traffic signals and an off-ramp
queue (Sunrise Boulevard) US 50 Westbound Onramp
TABLE 14 US 50 EASTBOUnD BOTTLEnECk SUmmARY Source PeMS Caltrans tach runs and
Cambridge Systematics field observations
bottleneck Location PeMS Speed Contours Caltrans Probe Vehicle Runs
Cause aM PM aM PM
A Jefferson Blvd PM 25 Minor Minor Traffic weaving truck volumes and grade
B 48th St PM 7 Minor Major Minor Minor Merge from SR 51 and SR 99
C Howe ave PM 9 Major Major Major weave between Howe and watt
D Mayhew Rd PM 12 Major Minor Major Weaving before Bradshaw Exit
E Routier Rd PM 14 Minor Major Weaving before Mather Field Rd Exit
F Sunrise Blvd PM 185 Minor Major Lane drop HOV add off-ramp queue
G Folsom Blvd PM 22 Minor Minor Lane drop 4 to 3
H El Dorado Hills Blvd PM 275 Major
Poorly coordinated traffic signal on arterial causes spillback onto freeway
a jefferson blvd bottleneck The bottleneck approximately located at Jefferson Blvd is due to weaving traffic as those entershying the freeway from Jefferson Blvd must cross those attempting to exit the freeway to I 5 There is a large number of trucks in the stream which struggle with the grade at this location exacerbatshying the bottleneck
[ 48 ] HigHway 50 corridor system management plan
c h a p t e r s e v e n c o n g e s t i o n a n d b o t t l e n e c k a n a l y s i s
b 48th St bottleneck The bottleneck approximately located at 48th St is due to the additional traffic merging from SR 51 and SR 99 combined with the eventual lane drop at 59th St This queue extends upstream past the off-ramp to SR 5199 These off-ramps are bottlenecks in themselves which spill back and choke the US 50 mainline
C Howe Ave Bottleneck The bottleneck at Howe ave is due to the entering traffic from Howe Ave Two Howe Ave on-ramps feed into US 50 eastbound southbound Howe ave loop on-ramp and northbound Howe ave direct ramp approximately 300 feet apart The watt avenue off-ramp is just down stream with heavy exiting volumes therefore the segment between Howe and watt is characterized by heavy weaving
D mayhew Rd Bottleneck The bottleneck approximately located at Mayhew Rd most likely begins with the additional traffic entering from Watt Ave and ends with the exiting traffic at Bradshaw Rd It is possible that there is a high proportion of weaving traffic with in this section (Watt Ave traffic moving to the left lane and those exiting at Bradshaw Rd moving to the right lane)
HigHway 50 corridor system management plan [ 49 ]
c h a p t e r s e v e n c o n g e s t i o n a n d b o t t l e n e c k a n a l y s i s
[ 50 ] HigHway 50 corridor system management plan
e routier rd bottleneck It is likely that the bottleneck at Routier Rd is due to the same merging conditions associated with Mayhew Rd The area is comprised of both residential and light industrialoffice land uses therefore during the PM peak period there are large volumes of vehicles entering at Bradshaw Rd moving to the left lanes and large volumes of vehicles moving to the right lane to exit at Mather Field Rd
f Sunrise blvd bottleneck At Sunrise Blvd the right-most lane exits while an HOV lane is added as the median lane The bottleneck is formed from vehicles shifting left to avoid exiting at Sunrise Blvd and to enter the HOV lane There is a large volume of vehicles queued at the Sunrise off-ramp which spills back and negatively affects the US 50 mainline
g folsom blvd bottleneck The right-most lane exits to Folsom Blvd leaving one HOV lane and two regular lanes along the US 50 The bottleneck is caused by this lane drop as well as the quick merge at the Folsom on-ramp
c h a p t e r s e v e n c o n g e s t i o n a n d b o t t l e n e c k a n a l y s i s
H The eastbound US 50 at El Dorado Hills Blvd Bottleneck The eastbound El Dorado Hills Blvd bottleneck is caused by a traffic signal on the arterial that often causes spillbacks on the EB loop offramp onto the freeway mainlines
TABLE 15 US 50 WESTBOUnD BOTTLEnECk SUmmARY Source PeMS Caltrans tach runs and Cambridge Systematics field observations
bottleneck Location PeMS Speed Contours Caltrans Probe Vehicle Runs
Cause aM PM aM PM
A El Dorado Hills Blvd PM 275 Major Poorly coordinated traffic
signal on El Dorado Hills Blvd
B Hazel Ave PM 21 Major Entering traffic
C Zinfandel Dr PM 16 Minor Major Major Major Entering traffic
D Routier Rd PM 14 Minor Major Minor Weaving traffic
E Bradshaw PM 13 Major Major Major Merging traffic and curve
F Howe Ave PM 9 Minor Major Major Major Weaving traffic and grade
G SR 51SR 99 PM 6 Minor Lane drop weaving traffic
H i-5 PM 3 Major Weaving traffic
HigHway 50 corridor system management plan [ 51 ]
c h a p t e r s e v e n c o n g e s t i o n a n d b o t t l e n e c k a n a l y s i s
[ 52 ] HigHway 50 corridor system management plan
A El Dorado Hills Blvd Bottleneck The minor bottleneck at El Dorado Hills Boulevard is caused by the traffic signal on El Dorado Hills Blvd that causes spillback on the westbound offramp onto the freeway mainlines
B Hazel Avenue Bottleneck In 2006 the Hazel Ave Bottleneck is caused by the traffic entering at both Hazel Ave and Folsom Blvd (the two on-ramps are separated by about one mile) The bottleneck that would appear at Folsom Blvd combines with the bottleneck at Hazel ave to form a large bottleneck that does not clear until after Hazel ave Sometimes causshying spillbacks as far as Prairies City Road this bottleneck was mitigated in 2007 as part of the GO CALIFORNIA program
C Zinfandel Dr Bottleneck There is heavy traffic coming from Sunrise Blvd but the lane addition immediately after the westbound on-ramp prevents a bottleneck from forming but as traffic flows westward the heavy traffic entering from Zinfandel Dr causes a bottleshyneck here
D Routier Rd Bottleneck The bottleneck at Routier Rd is caused by weaving traffic between Mather Field Rd and Bradshaw Rd This highway segment represents a transition area where vehicles that have been traveling in the left lanes begin to shift to the right lanes to exit while the entering traffic tries to shift to the left lanes
W eav in gLan e Dr o p
c h a p t e r s e v e n c o n g e s t i o n a n d b o t t l e n e c k a n a l y s i s
e bradshaw rd bottleneck The Bradshaw Rd bottleneck is caused by the entering traffic from Bradshaw Road the high truck volumes and the curve west of Bradshaw Two Bradshaw Rd on-ramps feed into US 50 westshybound southbound Bradshaw Rd direct on-ramp and northbound Bradshaw Rd loop on-ramp approximately 400 feet apart
F Howe Ave Bottleneck The Howe ave bottleneck is caused by a grade change and the weaving traffic entering from Howe ave and Hornet Dr competing for the right-most lane with those wanting to exit at 65th Street
G amp H SR 51SR 99 amp I-5 Bottleneck The bottleneck at I 5 is caused by the conflict between entering SR 99 and SR 51 traffic and exiting I-5 traffic as well as the queues formed on the ramps to i-5 which spill back onto US 50 The number of lanes in this section reaches a maximum of 6 and then drops to 4 as two lanes exit at the I-5 freeway This bottleneck is exacershybated during the peak periods when it stretches upstream to the lane drop before SR 99
W ea v in g
Lan e Dr o p
HigHway 50 corridor system management plan [ 53 ]
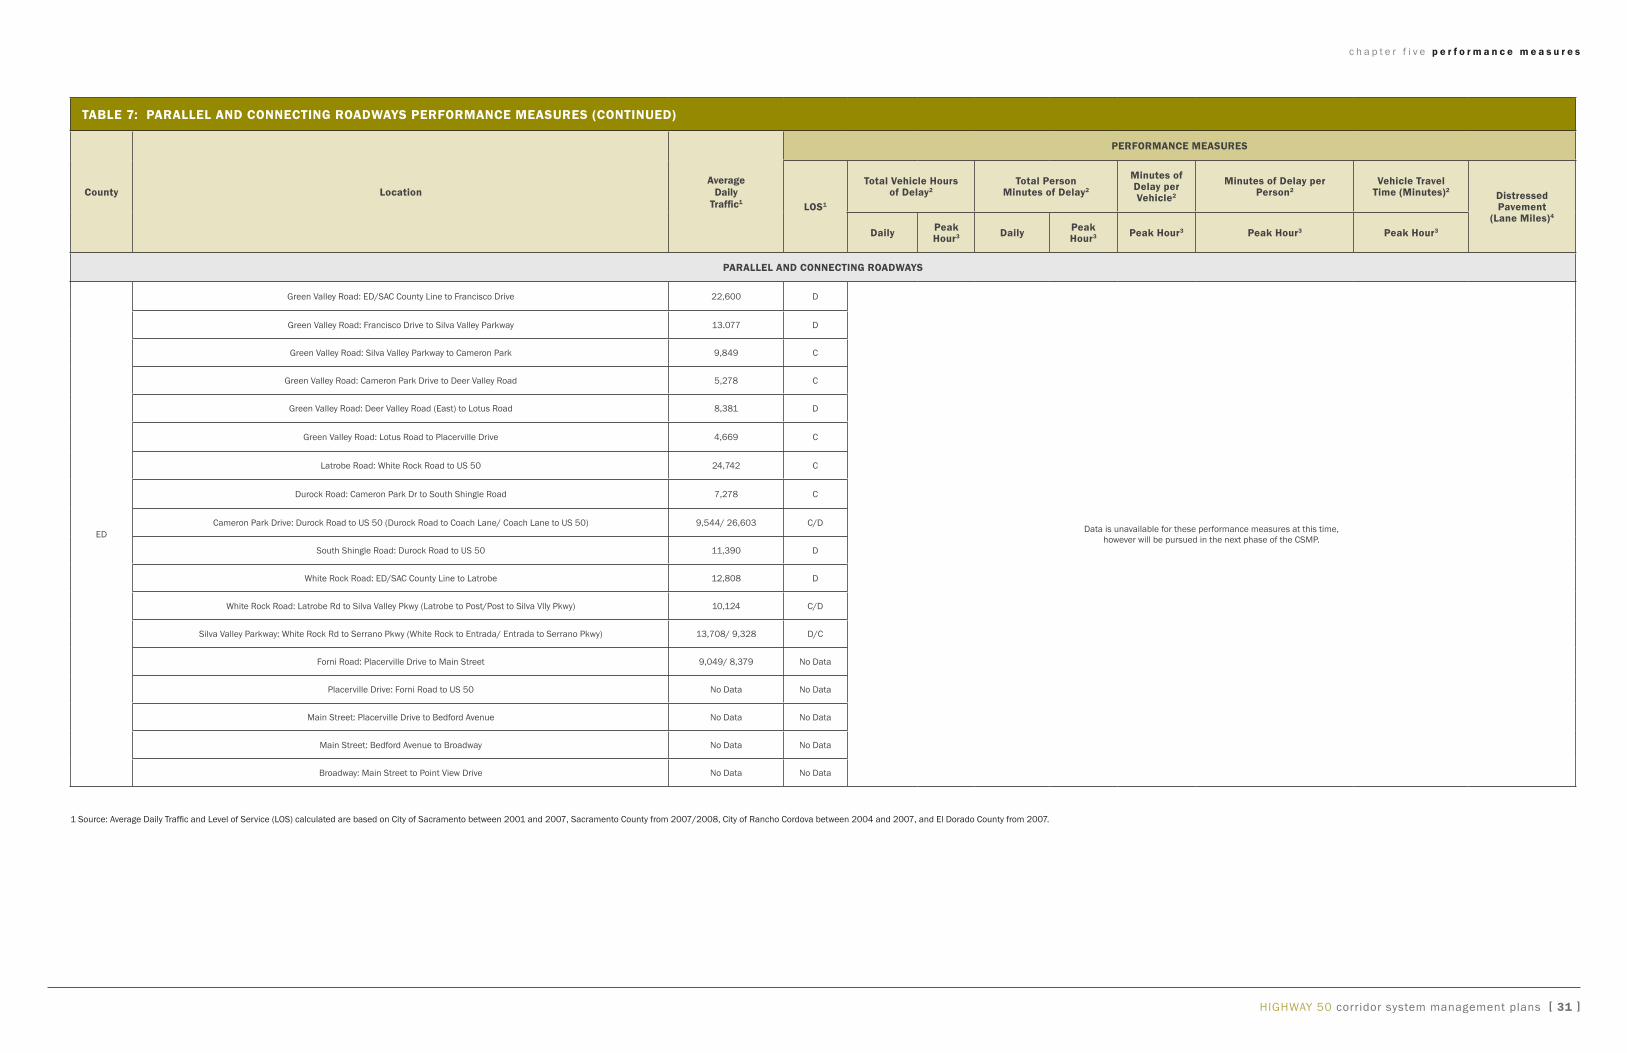
c h a p t e r s i x p l a n n e d c o r r i d o r s y s t e m m a n a g e m e n t s t r a t e g i e s
tabLe 11 KeY CaPitaL ProjeCtS (ConTInued)
CountyLead agency
route roadway from to Project
Description Programmed
funds
additional funding Needed
total Cost estimate (x $1000)
Comp Year (FFY)
PARALLEL AnD COnnECTInG ROADWAYS
ED ED County DOT
Silva Valley Parkway
Entrada Drive
Future US 50
Silva Valley Parkway iC
Widen Silva Valley Road from 2 lanes to 4 lanes includes
Class ii bike lanes and left turn storage pockets
$2921 $0 $2921 2010
ED ED County DOT
Silva Valley Parkway US 50
US50 Silva Valley Parkway (Phase 2) Includes constructshying overcrossing and ramps
signalization at EB and WB on off ramps
$57817 $0 $57817 2016
ED ED County DOT
Headington Road
Missouri Flat Road
El Dorado Road
Extend 2 lanes with median $9878 $0 $9878 2012
ED ED County DOT
Durock Road
Robin Lane South
Shingle Road
Extend 2 lanes with median $1239 $9214 $10453 2015
ED ED County DOT
Durock Road
Business Center Drive intersection signalization
includes adding turn pockets on Durock Road
$4333 $0 $4333 2009
ED City of Placerville
Point View Drive Broadway Smith Flat
Road Extend 2 lanes $1300 $0 $1300 2020
ED City of Placerville
western Placerville
US 50 interchange
Forni Road Ray Lawyer
Drive
Placerville Drive
Interchange Reconstruction convert Ray Lawyer Dr
Overcrossing to full IC Auxiliary Lanes
$5059 $34741 $39800 2020
Sacramento City of Rancho
Cordova
Mather Boulevard
Rockingham Road
Zinfandel Drive widen to 4 lanes $0 $8617 $8617 2020
Sacramento Rancho Cordova
Parkway ii
Grant Line Road
White Rock Road
New 6-lane expressway includshying intersection improvements at Kiefer Blvd amp White Rock
Road
$0 $44518 $44518 2020
Sacramento City of Folsom
Scott Road US 50 White Rock Rd
widen from 2 to 6 lanes $16000 $0 $16000 2020
Sacramento Sacramento County DOT
White Rock Road
Grant Line Rd
Prairie City Rd
Widen from 2 to 4 lanes realign near Nike and Nimbus Roads and connect with existshying alignment west of Prairie City Rd Realign Grant Line Rd to intersect with realigned
White Rock Rd
$26600 $0 $26600 2020
Sacramento Sacramento County DOT
Hazel avenue
US 50 Hazel Madison
Widen American River Bridge and approaches from 4 to 6 lanes Widen Hazel Avenue from AR Bridge to Madison from 4 to 6 lanes with Bike
LanesSignals
$83530 $0 $83530 2020
HigHway 50 corridor system management plan [ 41 ]
c h a p t e r s i x p l a n n e d c o r r i d o r s y s t e m m a n a g e m e n t s t r a t e g i e s
tabLe 11 KeY CaPitaL ProjeCtS (ConTInued)
CountyLead agency
route roadway from to Project
Description Programmed
funds
additional funding Needed
total Cost Estimate (x $1000)
Comp Year (FFY)
PARALLEL AnD COnnECTInG ROADWAYS
ED ED County DOT
green Valley Road
Salmon Falls Road
east
Deer Valley Road
widen from 2 to 4 lanes $0 $14576 $14576 2025
ED ED County DOT
green Valley Road
Deer Valley Road east Lotus Road widen $958 $4513 $5471 2015
ED ED County DOT
green Valley Road
Francisco Drive
Salmon Falls Road
widen from 2 to 4 lanes divided $412 $3491 $3903 2015
ED ED County DOT
Latrobe Road
investment Boulevard
golden Foothill Parkway
widen from 2 lanes undivided to 4 lanes
divided $1076 $8792 $9868 2015
ED ED County DOT
Latrobe Road
Carson Creek
White Rock Road
widen from 4 to 6 lanes $0 $23755 $23755 2025
ED ED County DOT
white Rock Road
EDSac County Line
Manchester Drive
widen 2 to 4 lanes divided includes signal interconnect and coorshy
dination
$0 $23755 $23755 2025
Sacramento City of Rancho
Cordova
Easton Valley
Parkway
Prairie City Road
Empire Ranch Road extenshysion south of
US 50
Construct new 4 lane road $0 $45000 $45000 2020
Sacramento Sacramento County DOT
Hazel avenue
Easton Valley
Parkway
Grant Line RoadWhite Rock Road
New road extension 4 lane limited access
through aerojet property $0 $18000 $18000 2018
Sacramento Sacramento County DOT
white Rock Road
Prairie City Road
ED County Line
widen to 4 lanes $8330 $64773 $73103 2018
Sacramento Sacramento County DOT
green Valley Road
East Natoma Sacramento ED County
line widen to 4 lanes $0 $3000 $3000 2018
Sacramento City of Rancho
Cordova
Zinfandel Drive
international Drive
Folsom Boulevard
widen to 4 lanes $0 $12000 $12000 2020
[ 42 ] HigHway 50 corridor system management plan
c h a p t e r s i x p l a n n e d c o r r i d o r s y s t e m m a n a g e m e n t s t r a t e g i e s
tabLe 11 KeY CaPitaL ProjeCtS (ConTInued)
CountyLead agency
route roadway from to Project
Description
Pro-grammed
funds
addi-tional
funding Needed
total Cost estimate (x $1000)
Comp Year (FFY)
traNSit
yolo amp Sacramento City of west Sacramento
amp City of Sacramento
Sacramento River
Crossing
15th Street in the City
of west Sacramento
Broadway in the City of
Sacramento
New all-modal river crossing (Auto Transit Bike amp Pedestrian)
from Sacramento across the Sacramento River to West
Sacramento The crossing was modeled between Broadway in Sacramento amp 15th Street in
West Sacramento but final alignshyment options will be studied in subsequent planning efforts
$800 $99200 $100000 2019
Sacramento Cal State University
Sacramento
CSUS Campus mdash mdash
Sac State Tram adjoining City streets and SRTD 65th Street light railbus transfer station Bus Rapid Transit System
$23574 $0 $23574 2013
Sacramento City of Rancho
Cordova
Rancho Cordova Various Various
New Service Rancho Cordova Pilot Transit Shuttle System new transit service for connection to
RTs Gold Line
$2380 $1500 $38880 2014
yolo amp Sacramento City of west Sacramento
TBD west
Sacramento Sacramento Streetcar Service between west
Sacramento and Downtown Sacramento
$17400 $54700 $72100 2014
Sacramento City of Rancho
Cordova RT Gold Line
RT Gold Line Tracks
Mather Field Road
Light Rail Grade Separations $0 $52888 $52888 2025
Sacramento City of Rancho
Cordova RT Gold Line
RT Gold Line Tracks Zinfandel Drive Light Rail Grade Separations $0 $52888 $52888 2025
Sacramento City of Rancho
Cordova RT Gold Line
RT Gold Line Tracks
Bradshaw Road
Light Rail Grade Separations $0 $35260 $35260 2025
Sacramento City of Rancho
Cordova RT Gold Line
RT Gold Line Tracks Routier Road Light Rail Grade Separations $0 $35260 $35260 2025
Sacramento City of
Sacramento Sacramento Valley Station
Sacramento intermodal Transportation Facility (Phase 1) - Develop intermodal transportashytion terminal for heavy rail light
rail and bus service
$77799 $0 $77799 2010
Sacramento City of
Sacramento Sacramento Valley Station
Sacramento intermodal Transportation Facility (Phase 2) - Develop intermodal transportashytion terminal for heavy rail light
rail and bus service
$24101 $1000 $25101 2014
HigHway 50 corridor system management plan [ 43 ]
c h a p t e r s i x p l a n n e d c o r r i d o r s y s t e m m a n a g e m e n t s t r a t e g i e s
TABLE 11 KEY CAPITAL PROJECTS (CONTINUED)
CountyLead Agency
Route Roadway From To Project
Description Programmed
Funds
Additional Funding Needed
Total Cost Es-timate (x $1000)
Comp Year (FFY)
BICYCLE ROUTES
Sacramento City of Rancho
Cordova
US 50Mather Field Road IC US 50 Mather
Field Road
US 50Mather Field Road PedestrianBike Crossing along
the Mather Airport RR Spur alignment
$0 $820 $1055 2015
ED ED County DOT
Sacramento Placerville
Transportation Corridor
Forni Rd
Missouri Flat Rd Class I Bike Trail $1423 $111 $1534 2009
ED City of Placerville
El Dorado Trail Western
Extension
Canal Street Main Street
Ray Lawyer DriveForni
Road Class 1 Bike Trail $1850 $0 $1850 2010
ED ED County DOT
US 50ED Hills Blvd IC US 50
El Dorado Hills Blvd
Latrobe Road
US 50El Dorado Hills Blvd Pedestrian Overcrossing $5508 $66 $5574 2014
TABLE 12 50 MOBILITY PARTNERSHIP KEY CAPITAL PROJECTS
RouteRoadway From To Project Description
NEAR TERM PRIORITY IMPROVEMENT PROJECTS
US 50 Sunrise Scott Road Auxiliary Lane
US 50 Hazel Avenue Interchange Improvements
Hazel Avenue Folsom Boulevard Easton Valley Parkway New 4 Lane Road
Easton Valley Parkway Hazel Avenue Rancho Cordova Parkway New 6 Lane Road
Rancho Cordova Parkway Easton Valley Parkway White Rock Road New 4 Lane Road
White Rock Road Sunrise Boulevard Silva Valley Parkway Widen to 4 Lanes
RT Gold Line Hazel Iron Point Station Passing Tracks
US 50 Rancho Cordova Parkway New Interchange
Zinfandel Drive South of International Douglas Road New 4 Lane Road
International Drive Kilgore Road Rancho Cordova Parkway New 6 Lane Road
Douglas Road Zinfandel Extension Sunrise Boulevard Widen to 4 Lanes
Sunrise LRT Citrus Road Sunrise Mall Bus Rapid TransitExpress Bus
[ 44 ] HIGHWAY 50 corridor system management plan
c h a p t e r s i x p l a n n e d c o r r i d o r s y s t e m m a n a g e m e n t s t r a t e g i e s
TABLE 12 50 mOBILITY PARTnERSHIP kEY CAPITAL PROjECTS (COnTInUED)
routeroadway from to Project Description
US 50 nEAR TERm PRIORITY ImPROVEmEnT PROjECTS
US 50 Empire Ranch Road New interchange
US 50 Silva Valley New interchange
US 50 Scott Road Empire Ranch Road Aux Lanes
US 50 Empire Ranch Road El Dorado Hills Boulevard Aux lanes and climbing lanes
US 50 El Dorado Hills Boulevard Silva Valley Parkway Aux lanes and climbing lanes
US 50 Silva Valley Parkway Bass Lake Road Aux lanes
Sunrise Boulevard White Rock Road Douglas Boulevard widen to 6 lanes
Sunrise Boulevard Douglas Boulevard Jackson Road widen to 4 lanes
White Rock Road Sunrise Boulevard Future Rancho Cordova Parkway and El Dorado County Line to Latrobe Road
widen to 4 lanes
Douglas Boulevard Sunrise Boulevard Grant Line Road widen to 4 lanes
Rancho Cordova Parkway Douglas Boulevard Rio del Oro Parkway New 2 lane road
Rancho Cordova Parkway Rio del Oro Parkway White Rock Road New 6 lane road
Jaeger Road Douglas Road Kiefer Boulevard New 4 lane road
Chrysanthy Sunrise Boulevard Americanos Boulevard New 4 lane road
Kiefer Boulevard Sunrise Boulevard Jaeger Road New 4 lane road
Grant Line Road Douglas Road Chrysanthy Road widen to 4 lanes
Hazel avenue Gold Country Boulevard Madison avenue widen to 6 lanes
Latrobe Road South of White Rock Road widen to 4 lanes
TABLE 13 VISIOnARY PROjECTS
County routeroadway from to Project Description
Sac yolo US 50 Enterprise Downtown Sacramento HOV Lanes
ED TBD Folsom Placerville Transit ndash Type TBD
ED New Road Latrobe Road White Rock Road (poten shy
tially US 50) New 2-lane road
HigHway 50 corridor system management plan [ 45 ]
c h a p t e r s i x p l a n n e d c o r r i d o r s y s t e m m a n a g e m e n t s t r a t e g i e s
[ 46 ] HigHway 50 corridor system management plan
Page Inte
ntionally
Left
Blank
congestion and bottleneck analysis
chapter seven
The 2000 Highway Capacity Manual defines a bottleneck
as ldquoa road element on which demand exceeds capacityrdquo
The bottleneck analysis evaluates specific causes of existshying recurrent traffic congestion in the corridor Freeway bottleneck locations that create mobility constraints are identified and documented and their relative contribution
to corridor-wide congestion is reported The bottleneck locations were determined based on a combination of the use of 2006 PeMS data HiCOMP report probe vehicle tach runs and field observations
Traffic congestion can be categorized as either recurrent
or non-recurrent
recurrent congestion occurs repeatedly at the same place and time of day in a predictable pattern Recurrent congesshytion is often associated with facility capacity limitations changes in capacity conflicting vehicle movements such
as lane merges inadequate number of transit vehicles to handle passenger loads or other persistent physical condishytions of the transportation facility
Non-recurrent congestion is usually attributed to collishysions equipment malfunction community events weather construction projects and other occasional occurrences When transportation systems are close to their maximum
carrying capacity non-recurrent congestion is more likely to occur as there is little excess capacity in the system
The location and extent of the bottlenecks on US 50 found
in the aM and PM peak periods are summarized in Tables 14 and 15 These depictions should be considered a snapshyshot view and not a comprehensive analysis of all bottleshynecks in the corridor Further work is being conducted to
refine the identification and causality of bottlenecks within
the corridor Table 14 shows a summary of the US 50 eastbound bottlenecks while the tables that follow discuss each bottleneck including location and possible causality Table 15 shows a summary of the US 50 westbound bottleshynecks while the tables that follow discuss each bottleneck including location and possible causality Minor or hidden bottlenecks are those Freeway bottleneck
that are not as defined locations that create (or severe) as the major mobility constraints bottlenecks Please note are identified and that the graphics accomshy documented and their panying the bottlenecks
relative contribution to are not to scale
corridor-wide congestion Major bottlenecks in the is reported eastbound direction during the aM peak period are at Howe avenue and during the PM peak period are at 48th Street Howe Avenue Mayhew Road Routier Road Sunrise Boulevard and El Dorado Hills Boulevard Major bottlenecks in the westbound direction during the aM peak period are at El Dorado Hills Boulevard Hazel Avenue Zinfandel Drive
HigHway 50 corridor system management plan [ 47 ]
c h a p t e r s e v e n c o n g e s t i o n a n d b o t t l e n e c k a n a l y s i s
Bradshaw Road and Howe Avenue and major bottleneck
locations during the PM peak period are at Zinfandel Drive Routier Road Bradshaw Road Howe Avenue and Intershystate 5
Causalities for these bottlenecks range from high-traffic
demand (congestion) heavy weavingmerging areas or physical constraints such as lane drops lack of ramp meters incomplete HOV network incomplete Auxiliary Lane
network poorly coordinated traffic signals and an off-ramp
queue (Sunrise Boulevard) US 50 Westbound Onramp
TABLE 14 US 50 EASTBOUnD BOTTLEnECk SUmmARY Source PeMS Caltrans tach runs and
Cambridge Systematics field observations
bottleneck Location PeMS Speed Contours Caltrans Probe Vehicle Runs
Cause aM PM aM PM
A Jefferson Blvd PM 25 Minor Minor Traffic weaving truck volumes and grade
B 48th St PM 7 Minor Major Minor Minor Merge from SR 51 and SR 99
C Howe ave PM 9 Major Major Major weave between Howe and watt
D Mayhew Rd PM 12 Major Minor Major Weaving before Bradshaw Exit
E Routier Rd PM 14 Minor Major Weaving before Mather Field Rd Exit
F Sunrise Blvd PM 185 Minor Major Lane drop HOV add off-ramp queue
G Folsom Blvd PM 22 Minor Minor Lane drop 4 to 3
H El Dorado Hills Blvd PM 275 Major
Poorly coordinated traffic signal on arterial causes spillback onto freeway
a jefferson blvd bottleneck The bottleneck approximately located at Jefferson Blvd is due to weaving traffic as those entershying the freeway from Jefferson Blvd must cross those attempting to exit the freeway to I 5 There is a large number of trucks in the stream which struggle with the grade at this location exacerbatshying the bottleneck
[ 48 ] HigHway 50 corridor system management plan
c h a p t e r s e v e n c o n g e s t i o n a n d b o t t l e n e c k a n a l y s i s
b 48th St bottleneck The bottleneck approximately located at 48th St is due to the additional traffic merging from SR 51 and SR 99 combined with the eventual lane drop at 59th St This queue extends upstream past the off-ramp to SR 5199 These off-ramps are bottlenecks in themselves which spill back and choke the US 50 mainline
C Howe Ave Bottleneck The bottleneck at Howe ave is due to the entering traffic from Howe Ave Two Howe Ave on-ramps feed into US 50 eastbound southbound Howe ave loop on-ramp and northbound Howe ave direct ramp approximately 300 feet apart The watt avenue off-ramp is just down stream with heavy exiting volumes therefore the segment between Howe and watt is characterized by heavy weaving
D mayhew Rd Bottleneck The bottleneck approximately located at Mayhew Rd most likely begins with the additional traffic entering from Watt Ave and ends with the exiting traffic at Bradshaw Rd It is possible that there is a high proportion of weaving traffic with in this section (Watt Ave traffic moving to the left lane and those exiting at Bradshaw Rd moving to the right lane)
HigHway 50 corridor system management plan [ 49 ]
c h a p t e r s e v e n c o n g e s t i o n a n d b o t t l e n e c k a n a l y s i s
[ 50 ] HigHway 50 corridor system management plan
e routier rd bottleneck It is likely that the bottleneck at Routier Rd is due to the same merging conditions associated with Mayhew Rd The area is comprised of both residential and light industrialoffice land uses therefore during the PM peak period there are large volumes of vehicles entering at Bradshaw Rd moving to the left lanes and large volumes of vehicles moving to the right lane to exit at Mather Field Rd
f Sunrise blvd bottleneck At Sunrise Blvd the right-most lane exits while an HOV lane is added as the median lane The bottleneck is formed from vehicles shifting left to avoid exiting at Sunrise Blvd and to enter the HOV lane There is a large volume of vehicles queued at the Sunrise off-ramp which spills back and negatively affects the US 50 mainline
g folsom blvd bottleneck The right-most lane exits to Folsom Blvd leaving one HOV lane and two regular lanes along the US 50 The bottleneck is caused by this lane drop as well as the quick merge at the Folsom on-ramp
c h a p t e r s e v e n c o n g e s t i o n a n d b o t t l e n e c k a n a l y s i s
H The eastbound US 50 at El Dorado Hills Blvd Bottleneck The eastbound El Dorado Hills Blvd bottleneck is caused by a traffic signal on the arterial that often causes spillbacks on the EB loop offramp onto the freeway mainlines
TABLE 15 US 50 WESTBOUnD BOTTLEnECk SUmmARY Source PeMS Caltrans tach runs and Cambridge Systematics field observations
bottleneck Location PeMS Speed Contours Caltrans Probe Vehicle Runs
Cause aM PM aM PM
A El Dorado Hills Blvd PM 275 Major Poorly coordinated traffic
signal on El Dorado Hills Blvd
B Hazel Ave PM 21 Major Entering traffic
C Zinfandel Dr PM 16 Minor Major Major Major Entering traffic
D Routier Rd PM 14 Minor Major Minor Weaving traffic
E Bradshaw PM 13 Major Major Major Merging traffic and curve
F Howe Ave PM 9 Minor Major Major Major Weaving traffic and grade
G SR 51SR 99 PM 6 Minor Lane drop weaving traffic
H i-5 PM 3 Major Weaving traffic
HigHway 50 corridor system management plan [ 51 ]
c h a p t e r s e v e n c o n g e s t i o n a n d b o t t l e n e c k a n a l y s i s
[ 52 ] HigHway 50 corridor system management plan
A El Dorado Hills Blvd Bottleneck The minor bottleneck at El Dorado Hills Boulevard is caused by the traffic signal on El Dorado Hills Blvd that causes spillback on the westbound offramp onto the freeway mainlines
B Hazel Avenue Bottleneck In 2006 the Hazel Ave Bottleneck is caused by the traffic entering at both Hazel Ave and Folsom Blvd (the two on-ramps are separated by about one mile) The bottleneck that would appear at Folsom Blvd combines with the bottleneck at Hazel ave to form a large bottleneck that does not clear until after Hazel ave Sometimes causshying spillbacks as far as Prairies City Road this bottleneck was mitigated in 2007 as part of the GO CALIFORNIA program
C Zinfandel Dr Bottleneck There is heavy traffic coming from Sunrise Blvd but the lane addition immediately after the westbound on-ramp prevents a bottleneck from forming but as traffic flows westward the heavy traffic entering from Zinfandel Dr causes a bottleshyneck here
D Routier Rd Bottleneck The bottleneck at Routier Rd is caused by weaving traffic between Mather Field Rd and Bradshaw Rd This highway segment represents a transition area where vehicles that have been traveling in the left lanes begin to shift to the right lanes to exit while the entering traffic tries to shift to the left lanes
W eav in gLan e Dr o p
c h a p t e r s e v e n c o n g e s t i o n a n d b o t t l e n e c k a n a l y s i s
e bradshaw rd bottleneck The Bradshaw Rd bottleneck is caused by the entering traffic from Bradshaw Road the high truck volumes and the curve west of Bradshaw Two Bradshaw Rd on-ramps feed into US 50 westshybound southbound Bradshaw Rd direct on-ramp and northbound Bradshaw Rd loop on-ramp approximately 400 feet apart
F Howe Ave Bottleneck The Howe ave bottleneck is caused by a grade change and the weaving traffic entering from Howe ave and Hornet Dr competing for the right-most lane with those wanting to exit at 65th Street
G amp H SR 51SR 99 amp I-5 Bottleneck The bottleneck at I 5 is caused by the conflict between entering SR 99 and SR 51 traffic and exiting I-5 traffic as well as the queues formed on the ramps to i-5 which spill back onto US 50 The number of lanes in this section reaches a maximum of 6 and then drops to 4 as two lanes exit at the I-5 freeway This bottleneck is exacershybated during the peak periods when it stretches upstream to the lane drop before SR 99
W ea v in g
Lan e Dr o p
HigHway 50 corridor system management plan [ 53 ]

c h a p t e r s i x p l a n n e d c o r r i d o r s y s t e m m a n a g e m e n t s t r a t e g i e s
tabLe 11 KeY CaPitaL ProjeCtS (ConTInued)
CountyLead agency
route roadway from to Project
Description Programmed
funds
additional funding Needed
total Cost Estimate (x $1000)
Comp Year (FFY)
PARALLEL AnD COnnECTInG ROADWAYS
ED ED County DOT
green Valley Road
Salmon Falls Road
east
Deer Valley Road
widen from 2 to 4 lanes $0 $14576 $14576 2025
ED ED County DOT
green Valley Road
Deer Valley Road east Lotus Road widen $958 $4513 $5471 2015
ED ED County DOT
green Valley Road
Francisco Drive
Salmon Falls Road
widen from 2 to 4 lanes divided $412 $3491 $3903 2015
ED ED County DOT
Latrobe Road
investment Boulevard
golden Foothill Parkway
widen from 2 lanes undivided to 4 lanes
divided $1076 $8792 $9868 2015
ED ED County DOT
Latrobe Road
Carson Creek
White Rock Road
widen from 4 to 6 lanes $0 $23755 $23755 2025
ED ED County DOT
white Rock Road
EDSac County Line
Manchester Drive
widen 2 to 4 lanes divided includes signal interconnect and coorshy
dination
$0 $23755 $23755 2025
Sacramento City of Rancho
Cordova
Easton Valley
Parkway
Prairie City Road
Empire Ranch Road extenshysion south of
US 50
Construct new 4 lane road $0 $45000 $45000 2020
Sacramento Sacramento County DOT
Hazel avenue
Easton Valley
Parkway
Grant Line RoadWhite Rock Road
New road extension 4 lane limited access
through aerojet property $0 $18000 $18000 2018
Sacramento Sacramento County DOT
white Rock Road
Prairie City Road
ED County Line
widen to 4 lanes $8330 $64773 $73103 2018
Sacramento Sacramento County DOT
green Valley Road
East Natoma Sacramento ED County
line widen to 4 lanes $0 $3000 $3000 2018
Sacramento City of Rancho
Cordova
Zinfandel Drive
international Drive
Folsom Boulevard
widen to 4 lanes $0 $12000 $12000 2020
[ 42 ] HigHway 50 corridor system management plan
c h a p t e r s i x p l a n n e d c o r r i d o r s y s t e m m a n a g e m e n t s t r a t e g i e s
tabLe 11 KeY CaPitaL ProjeCtS (ConTInued)
CountyLead agency
route roadway from to Project
Description
Pro-grammed
funds
addi-tional
funding Needed
total Cost estimate (x $1000)
Comp Year (FFY)
traNSit
yolo amp Sacramento City of west Sacramento
amp City of Sacramento
Sacramento River
Crossing
15th Street in the City
of west Sacramento
Broadway in the City of
Sacramento
New all-modal river crossing (Auto Transit Bike amp Pedestrian)
from Sacramento across the Sacramento River to West
Sacramento The crossing was modeled between Broadway in Sacramento amp 15th Street in
West Sacramento but final alignshyment options will be studied in subsequent planning efforts
$800 $99200 $100000 2019
Sacramento Cal State University
Sacramento
CSUS Campus mdash mdash
Sac State Tram adjoining City streets and SRTD 65th Street light railbus transfer station Bus Rapid Transit System
$23574 $0 $23574 2013
Sacramento City of Rancho
Cordova
Rancho Cordova Various Various
New Service Rancho Cordova Pilot Transit Shuttle System new transit service for connection to
RTs Gold Line
$2380 $1500 $38880 2014
yolo amp Sacramento City of west Sacramento
TBD west
Sacramento Sacramento Streetcar Service between west
Sacramento and Downtown Sacramento
$17400 $54700 $72100 2014
Sacramento City of Rancho
Cordova RT Gold Line
RT Gold Line Tracks
Mather Field Road
Light Rail Grade Separations $0 $52888 $52888 2025
Sacramento City of Rancho
Cordova RT Gold Line
RT Gold Line Tracks Zinfandel Drive Light Rail Grade Separations $0 $52888 $52888 2025
Sacramento City of Rancho
Cordova RT Gold Line
RT Gold Line Tracks
Bradshaw Road
Light Rail Grade Separations $0 $35260 $35260 2025
Sacramento City of Rancho
Cordova RT Gold Line
RT Gold Line Tracks Routier Road Light Rail Grade Separations $0 $35260 $35260 2025
Sacramento City of
Sacramento Sacramento Valley Station
Sacramento intermodal Transportation Facility (Phase 1) - Develop intermodal transportashytion terminal for heavy rail light
rail and bus service
$77799 $0 $77799 2010
Sacramento City of
Sacramento Sacramento Valley Station
Sacramento intermodal Transportation Facility (Phase 2) - Develop intermodal transportashytion terminal for heavy rail light
rail and bus service
$24101 $1000 $25101 2014
HigHway 50 corridor system management plan [ 43 ]
c h a p t e r s i x p l a n n e d c o r r i d o r s y s t e m m a n a g e m e n t s t r a t e g i e s
TABLE 11 KEY CAPITAL PROJECTS (CONTINUED)
CountyLead Agency
Route Roadway From To Project
Description Programmed
Funds
Additional Funding Needed
Total Cost Es-timate (x $1000)
Comp Year (FFY)
BICYCLE ROUTES
Sacramento City of Rancho
Cordova
US 50Mather Field Road IC US 50 Mather
Field Road
US 50Mather Field Road PedestrianBike Crossing along
the Mather Airport RR Spur alignment
$0 $820 $1055 2015
ED ED County DOT
Sacramento Placerville
Transportation Corridor
Forni Rd
Missouri Flat Rd Class I Bike Trail $1423 $111 $1534 2009
ED City of Placerville
El Dorado Trail Western
Extension
Canal Street Main Street
Ray Lawyer DriveForni
Road Class 1 Bike Trail $1850 $0 $1850 2010
ED ED County DOT
US 50ED Hills Blvd IC US 50
El Dorado Hills Blvd
Latrobe Road
US 50El Dorado Hills Blvd Pedestrian Overcrossing $5508 $66 $5574 2014
TABLE 12 50 MOBILITY PARTNERSHIP KEY CAPITAL PROJECTS
RouteRoadway From To Project Description
NEAR TERM PRIORITY IMPROVEMENT PROJECTS
US 50 Sunrise Scott Road Auxiliary Lane
US 50 Hazel Avenue Interchange Improvements
Hazel Avenue Folsom Boulevard Easton Valley Parkway New 4 Lane Road
Easton Valley Parkway Hazel Avenue Rancho Cordova Parkway New 6 Lane Road
Rancho Cordova Parkway Easton Valley Parkway White Rock Road New 4 Lane Road
White Rock Road Sunrise Boulevard Silva Valley Parkway Widen to 4 Lanes
RT Gold Line Hazel Iron Point Station Passing Tracks
US 50 Rancho Cordova Parkway New Interchange
Zinfandel Drive South of International Douglas Road New 4 Lane Road
International Drive Kilgore Road Rancho Cordova Parkway New 6 Lane Road
Douglas Road Zinfandel Extension Sunrise Boulevard Widen to 4 Lanes
Sunrise LRT Citrus Road Sunrise Mall Bus Rapid TransitExpress Bus
[ 44 ] HIGHWAY 50 corridor system management plan
c h a p t e r s i x p l a n n e d c o r r i d o r s y s t e m m a n a g e m e n t s t r a t e g i e s
TABLE 12 50 mOBILITY PARTnERSHIP kEY CAPITAL PROjECTS (COnTInUED)
routeroadway from to Project Description
US 50 nEAR TERm PRIORITY ImPROVEmEnT PROjECTS
US 50 Empire Ranch Road New interchange
US 50 Silva Valley New interchange
US 50 Scott Road Empire Ranch Road Aux Lanes
US 50 Empire Ranch Road El Dorado Hills Boulevard Aux lanes and climbing lanes
US 50 El Dorado Hills Boulevard Silva Valley Parkway Aux lanes and climbing lanes
US 50 Silva Valley Parkway Bass Lake Road Aux lanes
Sunrise Boulevard White Rock Road Douglas Boulevard widen to 6 lanes
Sunrise Boulevard Douglas Boulevard Jackson Road widen to 4 lanes
White Rock Road Sunrise Boulevard Future Rancho Cordova Parkway and El Dorado County Line to Latrobe Road
widen to 4 lanes
Douglas Boulevard Sunrise Boulevard Grant Line Road widen to 4 lanes
Rancho Cordova Parkway Douglas Boulevard Rio del Oro Parkway New 2 lane road
Rancho Cordova Parkway Rio del Oro Parkway White Rock Road New 6 lane road
Jaeger Road Douglas Road Kiefer Boulevard New 4 lane road
Chrysanthy Sunrise Boulevard Americanos Boulevard New 4 lane road
Kiefer Boulevard Sunrise Boulevard Jaeger Road New 4 lane road
Grant Line Road Douglas Road Chrysanthy Road widen to 4 lanes
Hazel avenue Gold Country Boulevard Madison avenue widen to 6 lanes
Latrobe Road South of White Rock Road widen to 4 lanes
TABLE 13 VISIOnARY PROjECTS
County routeroadway from to Project Description
Sac yolo US 50 Enterprise Downtown Sacramento HOV Lanes
ED TBD Folsom Placerville Transit ndash Type TBD
ED New Road Latrobe Road White Rock Road (poten shy
tially US 50) New 2-lane road
HigHway 50 corridor system management plan [ 45 ]
c h a p t e r s i x p l a n n e d c o r r i d o r s y s t e m m a n a g e m e n t s t r a t e g i e s
[ 46 ] HigHway 50 corridor system management plan
Page Inte
ntionally
Left
Blank
congestion and bottleneck analysis
chapter seven
The 2000 Highway Capacity Manual defines a bottleneck
as ldquoa road element on which demand exceeds capacityrdquo
The bottleneck analysis evaluates specific causes of existshying recurrent traffic congestion in the corridor Freeway bottleneck locations that create mobility constraints are identified and documented and their relative contribution
to corridor-wide congestion is reported The bottleneck locations were determined based on a combination of the use of 2006 PeMS data HiCOMP report probe vehicle tach runs and field observations
Traffic congestion can be categorized as either recurrent
or non-recurrent
recurrent congestion occurs repeatedly at the same place and time of day in a predictable pattern Recurrent congesshytion is often associated with facility capacity limitations changes in capacity conflicting vehicle movements such
as lane merges inadequate number of transit vehicles to handle passenger loads or other persistent physical condishytions of the transportation facility
Non-recurrent congestion is usually attributed to collishysions equipment malfunction community events weather construction projects and other occasional occurrences When transportation systems are close to their maximum
carrying capacity non-recurrent congestion is more likely to occur as there is little excess capacity in the system
The location and extent of the bottlenecks on US 50 found
in the aM and PM peak periods are summarized in Tables 14 and 15 These depictions should be considered a snapshyshot view and not a comprehensive analysis of all bottleshynecks in the corridor Further work is being conducted to
refine the identification and causality of bottlenecks within
the corridor Table 14 shows a summary of the US 50 eastbound bottlenecks while the tables that follow discuss each bottleneck including location and possible causality Table 15 shows a summary of the US 50 westbound bottleshynecks while the tables that follow discuss each bottleneck including location and possible causality Minor or hidden bottlenecks are those Freeway bottleneck
that are not as defined locations that create (or severe) as the major mobility constraints bottlenecks Please note are identified and that the graphics accomshy documented and their panying the bottlenecks
relative contribution to are not to scale
corridor-wide congestion Major bottlenecks in the is reported eastbound direction during the aM peak period are at Howe avenue and during the PM peak period are at 48th Street Howe Avenue Mayhew Road Routier Road Sunrise Boulevard and El Dorado Hills Boulevard Major bottlenecks in the westbound direction during the aM peak period are at El Dorado Hills Boulevard Hazel Avenue Zinfandel Drive
HigHway 50 corridor system management plan [ 47 ]
c h a p t e r s e v e n c o n g e s t i o n a n d b o t t l e n e c k a n a l y s i s
Bradshaw Road and Howe Avenue and major bottleneck
locations during the PM peak period are at Zinfandel Drive Routier Road Bradshaw Road Howe Avenue and Intershystate 5
Causalities for these bottlenecks range from high-traffic
demand (congestion) heavy weavingmerging areas or physical constraints such as lane drops lack of ramp meters incomplete HOV network incomplete Auxiliary Lane
network poorly coordinated traffic signals and an off-ramp
queue (Sunrise Boulevard) US 50 Westbound Onramp
TABLE 14 US 50 EASTBOUnD BOTTLEnECk SUmmARY Source PeMS Caltrans tach runs and
Cambridge Systematics field observations
bottleneck Location PeMS Speed Contours Caltrans Probe Vehicle Runs
Cause aM PM aM PM
A Jefferson Blvd PM 25 Minor Minor Traffic weaving truck volumes and grade
B 48th St PM 7 Minor Major Minor Minor Merge from SR 51 and SR 99
C Howe ave PM 9 Major Major Major weave between Howe and watt
D Mayhew Rd PM 12 Major Minor Major Weaving before Bradshaw Exit
E Routier Rd PM 14 Minor Major Weaving before Mather Field Rd Exit
F Sunrise Blvd PM 185 Minor Major Lane drop HOV add off-ramp queue
G Folsom Blvd PM 22 Minor Minor Lane drop 4 to 3
H El Dorado Hills Blvd PM 275 Major
Poorly coordinated traffic signal on arterial causes spillback onto freeway
a jefferson blvd bottleneck The bottleneck approximately located at Jefferson Blvd is due to weaving traffic as those entershying the freeway from Jefferson Blvd must cross those attempting to exit the freeway to I 5 There is a large number of trucks in the stream which struggle with the grade at this location exacerbatshying the bottleneck
[ 48 ] HigHway 50 corridor system management plan
c h a p t e r s e v e n c o n g e s t i o n a n d b o t t l e n e c k a n a l y s i s
b 48th St bottleneck The bottleneck approximately located at 48th St is due to the additional traffic merging from SR 51 and SR 99 combined with the eventual lane drop at 59th St This queue extends upstream past the off-ramp to SR 5199 These off-ramps are bottlenecks in themselves which spill back and choke the US 50 mainline
C Howe Ave Bottleneck The bottleneck at Howe ave is due to the entering traffic from Howe Ave Two Howe Ave on-ramps feed into US 50 eastbound southbound Howe ave loop on-ramp and northbound Howe ave direct ramp approximately 300 feet apart The watt avenue off-ramp is just down stream with heavy exiting volumes therefore the segment between Howe and watt is characterized by heavy weaving
D mayhew Rd Bottleneck The bottleneck approximately located at Mayhew Rd most likely begins with the additional traffic entering from Watt Ave and ends with the exiting traffic at Bradshaw Rd It is possible that there is a high proportion of weaving traffic with in this section (Watt Ave traffic moving to the left lane and those exiting at Bradshaw Rd moving to the right lane)
HigHway 50 corridor system management plan [ 49 ]
c h a p t e r s e v e n c o n g e s t i o n a n d b o t t l e n e c k a n a l y s i s
[ 50 ] HigHway 50 corridor system management plan
e routier rd bottleneck It is likely that the bottleneck at Routier Rd is due to the same merging conditions associated with Mayhew Rd The area is comprised of both residential and light industrialoffice land uses therefore during the PM peak period there are large volumes of vehicles entering at Bradshaw Rd moving to the left lanes and large volumes of vehicles moving to the right lane to exit at Mather Field Rd
f Sunrise blvd bottleneck At Sunrise Blvd the right-most lane exits while an HOV lane is added as the median lane The bottleneck is formed from vehicles shifting left to avoid exiting at Sunrise Blvd and to enter the HOV lane There is a large volume of vehicles queued at the Sunrise off-ramp which spills back and negatively affects the US 50 mainline
g folsom blvd bottleneck The right-most lane exits to Folsom Blvd leaving one HOV lane and two regular lanes along the US 50 The bottleneck is caused by this lane drop as well as the quick merge at the Folsom on-ramp
c h a p t e r s e v e n c o n g e s t i o n a n d b o t t l e n e c k a n a l y s i s
H The eastbound US 50 at El Dorado Hills Blvd Bottleneck The eastbound El Dorado Hills Blvd bottleneck is caused by a traffic signal on the arterial that often causes spillbacks on the EB loop offramp onto the freeway mainlines
TABLE 15 US 50 WESTBOUnD BOTTLEnECk SUmmARY Source PeMS Caltrans tach runs and Cambridge Systematics field observations
bottleneck Location PeMS Speed Contours Caltrans Probe Vehicle Runs
Cause aM PM aM PM
A El Dorado Hills Blvd PM 275 Major Poorly coordinated traffic
signal on El Dorado Hills Blvd
B Hazel Ave PM 21 Major Entering traffic
C Zinfandel Dr PM 16 Minor Major Major Major Entering traffic
D Routier Rd PM 14 Minor Major Minor Weaving traffic
E Bradshaw PM 13 Major Major Major Merging traffic and curve
F Howe Ave PM 9 Minor Major Major Major Weaving traffic and grade
G SR 51SR 99 PM 6 Minor Lane drop weaving traffic
H i-5 PM 3 Major Weaving traffic
HigHway 50 corridor system management plan [ 51 ]
c h a p t e r s e v e n c o n g e s t i o n a n d b o t t l e n e c k a n a l y s i s
[ 52 ] HigHway 50 corridor system management plan
A El Dorado Hills Blvd Bottleneck The minor bottleneck at El Dorado Hills Boulevard is caused by the traffic signal on El Dorado Hills Blvd that causes spillback on the westbound offramp onto the freeway mainlines
B Hazel Avenue Bottleneck In 2006 the Hazel Ave Bottleneck is caused by the traffic entering at both Hazel Ave and Folsom Blvd (the two on-ramps are separated by about one mile) The bottleneck that would appear at Folsom Blvd combines with the bottleneck at Hazel ave to form a large bottleneck that does not clear until after Hazel ave Sometimes causshying spillbacks as far as Prairies City Road this bottleneck was mitigated in 2007 as part of the GO CALIFORNIA program
C Zinfandel Dr Bottleneck There is heavy traffic coming from Sunrise Blvd but the lane addition immediately after the westbound on-ramp prevents a bottleneck from forming but as traffic flows westward the heavy traffic entering from Zinfandel Dr causes a bottleshyneck here
D Routier Rd Bottleneck The bottleneck at Routier Rd is caused by weaving traffic between Mather Field Rd and Bradshaw Rd This highway segment represents a transition area where vehicles that have been traveling in the left lanes begin to shift to the right lanes to exit while the entering traffic tries to shift to the left lanes
W eav in gLan e Dr o p
c h a p t e r s e v e n c o n g e s t i o n a n d b o t t l e n e c k a n a l y s i s
e bradshaw rd bottleneck The Bradshaw Rd bottleneck is caused by the entering traffic from Bradshaw Road the high truck volumes and the curve west of Bradshaw Two Bradshaw Rd on-ramps feed into US 50 westshybound southbound Bradshaw Rd direct on-ramp and northbound Bradshaw Rd loop on-ramp approximately 400 feet apart
F Howe Ave Bottleneck The Howe ave bottleneck is caused by a grade change and the weaving traffic entering from Howe ave and Hornet Dr competing for the right-most lane with those wanting to exit at 65th Street
G amp H SR 51SR 99 amp I-5 Bottleneck The bottleneck at I 5 is caused by the conflict between entering SR 99 and SR 51 traffic and exiting I-5 traffic as well as the queues formed on the ramps to i-5 which spill back onto US 50 The number of lanes in this section reaches a maximum of 6 and then drops to 4 as two lanes exit at the I-5 freeway This bottleneck is exacershybated during the peak periods when it stretches upstream to the lane drop before SR 99
W ea v in g
Lan e Dr o p
HigHway 50 corridor system management plan [ 53 ]
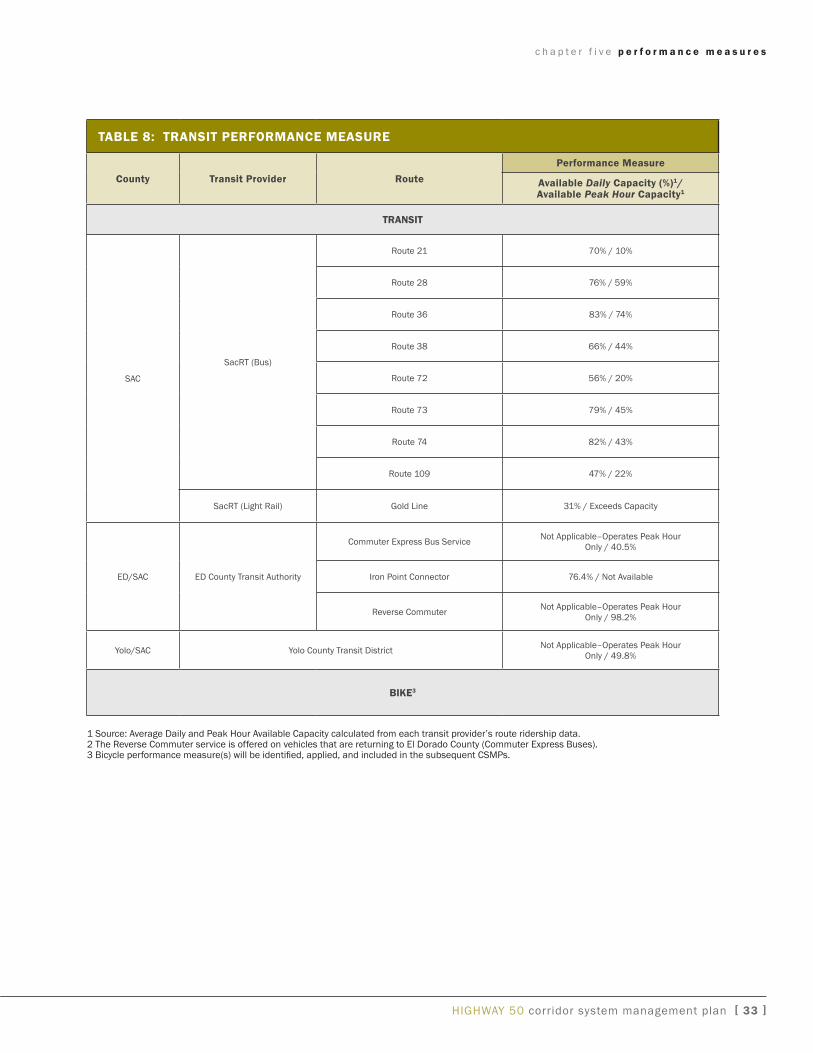
c h a p t e r s i x p l a n n e d c o r r i d o r s y s t e m m a n a g e m e n t s t r a t e g i e s
tabLe 11 KeY CaPitaL ProjeCtS (ConTInued)
CountyLead agency
route roadway from to Project
Description
Pro-grammed
funds
addi-tional
funding Needed
total Cost estimate (x $1000)
Comp Year (FFY)
traNSit
yolo amp Sacramento City of west Sacramento
amp City of Sacramento
Sacramento River
Crossing
15th Street in the City
of west Sacramento
Broadway in the City of
Sacramento
New all-modal river crossing (Auto Transit Bike amp Pedestrian)
from Sacramento across the Sacramento River to West
Sacramento The crossing was modeled between Broadway in Sacramento amp 15th Street in
West Sacramento but final alignshyment options will be studied in subsequent planning efforts
$800 $99200 $100000 2019
Sacramento Cal State University
Sacramento
CSUS Campus mdash mdash
Sac State Tram adjoining City streets and SRTD 65th Street light railbus transfer station Bus Rapid Transit System
$23574 $0 $23574 2013
Sacramento City of Rancho
Cordova
Rancho Cordova Various Various
New Service Rancho Cordova Pilot Transit Shuttle System new transit service for connection to
RTs Gold Line
$2380 $1500 $38880 2014
yolo amp Sacramento City of west Sacramento
TBD west
Sacramento Sacramento Streetcar Service between west
Sacramento and Downtown Sacramento
$17400 $54700 $72100 2014
Sacramento City of Rancho
Cordova RT Gold Line
RT Gold Line Tracks
Mather Field Road
Light Rail Grade Separations $0 $52888 $52888 2025
Sacramento City of Rancho
Cordova RT Gold Line
RT Gold Line Tracks Zinfandel Drive Light Rail Grade Separations $0 $52888 $52888 2025
Sacramento City of Rancho
Cordova RT Gold Line
RT Gold Line Tracks
Bradshaw Road
Light Rail Grade Separations $0 $35260 $35260 2025
Sacramento City of Rancho
Cordova RT Gold Line
RT Gold Line Tracks Routier Road Light Rail Grade Separations $0 $35260 $35260 2025
Sacramento City of
Sacramento Sacramento Valley Station
Sacramento intermodal Transportation Facility (Phase 1) - Develop intermodal transportashytion terminal for heavy rail light
rail and bus service
$77799 $0 $77799 2010
Sacramento City of
Sacramento Sacramento Valley Station
Sacramento intermodal Transportation Facility (Phase 2) - Develop intermodal transportashytion terminal for heavy rail light
rail and bus service
$24101 $1000 $25101 2014
HigHway 50 corridor system management plan [ 43 ]
c h a p t e r s i x p l a n n e d c o r r i d o r s y s t e m m a n a g e m e n t s t r a t e g i e s
TABLE 11 KEY CAPITAL PROJECTS (CONTINUED)
CountyLead Agency
Route Roadway From To Project
Description Programmed
Funds
Additional Funding Needed
Total Cost Es-timate (x $1000)
Comp Year (FFY)
BICYCLE ROUTES
Sacramento City of Rancho
Cordova
US 50Mather Field Road IC US 50 Mather
Field Road
US 50Mather Field Road PedestrianBike Crossing along
the Mather Airport RR Spur alignment
$0 $820 $1055 2015
ED ED County DOT
Sacramento Placerville
Transportation Corridor
Forni Rd
Missouri Flat Rd Class I Bike Trail $1423 $111 $1534 2009
ED City of Placerville
El Dorado Trail Western
Extension
Canal Street Main Street
Ray Lawyer DriveForni
Road Class 1 Bike Trail $1850 $0 $1850 2010
ED ED County DOT
US 50ED Hills Blvd IC US 50
El Dorado Hills Blvd
Latrobe Road
US 50El Dorado Hills Blvd Pedestrian Overcrossing $5508 $66 $5574 2014
TABLE 12 50 MOBILITY PARTNERSHIP KEY CAPITAL PROJECTS
RouteRoadway From To Project Description
NEAR TERM PRIORITY IMPROVEMENT PROJECTS
US 50 Sunrise Scott Road Auxiliary Lane
US 50 Hazel Avenue Interchange Improvements
Hazel Avenue Folsom Boulevard Easton Valley Parkway New 4 Lane Road
Easton Valley Parkway Hazel Avenue Rancho Cordova Parkway New 6 Lane Road
Rancho Cordova Parkway Easton Valley Parkway White Rock Road New 4 Lane Road
White Rock Road Sunrise Boulevard Silva Valley Parkway Widen to 4 Lanes
RT Gold Line Hazel Iron Point Station Passing Tracks
US 50 Rancho Cordova Parkway New Interchange
Zinfandel Drive South of International Douglas Road New 4 Lane Road
International Drive Kilgore Road Rancho Cordova Parkway New 6 Lane Road
Douglas Road Zinfandel Extension Sunrise Boulevard Widen to 4 Lanes
Sunrise LRT Citrus Road Sunrise Mall Bus Rapid TransitExpress Bus
[ 44 ] HIGHWAY 50 corridor system management plan
c h a p t e r s i x p l a n n e d c o r r i d o r s y s t e m m a n a g e m e n t s t r a t e g i e s
TABLE 12 50 mOBILITY PARTnERSHIP kEY CAPITAL PROjECTS (COnTInUED)
routeroadway from to Project Description
US 50 nEAR TERm PRIORITY ImPROVEmEnT PROjECTS
US 50 Empire Ranch Road New interchange
US 50 Silva Valley New interchange
US 50 Scott Road Empire Ranch Road Aux Lanes
US 50 Empire Ranch Road El Dorado Hills Boulevard Aux lanes and climbing lanes
US 50 El Dorado Hills Boulevard Silva Valley Parkway Aux lanes and climbing lanes
US 50 Silva Valley Parkway Bass Lake Road Aux lanes
Sunrise Boulevard White Rock Road Douglas Boulevard widen to 6 lanes
Sunrise Boulevard Douglas Boulevard Jackson Road widen to 4 lanes
White Rock Road Sunrise Boulevard Future Rancho Cordova Parkway and El Dorado County Line to Latrobe Road
widen to 4 lanes
Douglas Boulevard Sunrise Boulevard Grant Line Road widen to 4 lanes
Rancho Cordova Parkway Douglas Boulevard Rio del Oro Parkway New 2 lane road
Rancho Cordova Parkway Rio del Oro Parkway White Rock Road New 6 lane road
Jaeger Road Douglas Road Kiefer Boulevard New 4 lane road
Chrysanthy Sunrise Boulevard Americanos Boulevard New 4 lane road
Kiefer Boulevard Sunrise Boulevard Jaeger Road New 4 lane road
Grant Line Road Douglas Road Chrysanthy Road widen to 4 lanes
Hazel avenue Gold Country Boulevard Madison avenue widen to 6 lanes
Latrobe Road South of White Rock Road widen to 4 lanes
TABLE 13 VISIOnARY PROjECTS
County routeroadway from to Project Description
Sac yolo US 50 Enterprise Downtown Sacramento HOV Lanes
ED TBD Folsom Placerville Transit ndash Type TBD
ED New Road Latrobe Road White Rock Road (poten shy
tially US 50) New 2-lane road
HigHway 50 corridor system management plan [ 45 ]
c h a p t e r s i x p l a n n e d c o r r i d o r s y s t e m m a n a g e m e n t s t r a t e g i e s
[ 46 ] HigHway 50 corridor system management plan
Page Inte
ntionally
Left
Blank
congestion and bottleneck analysis
chapter seven
The 2000 Highway Capacity Manual defines a bottleneck
as ldquoa road element on which demand exceeds capacityrdquo
The bottleneck analysis evaluates specific causes of existshying recurrent traffic congestion in the corridor Freeway bottleneck locations that create mobility constraints are identified and documented and their relative contribution
to corridor-wide congestion is reported The bottleneck locations were determined based on a combination of the use of 2006 PeMS data HiCOMP report probe vehicle tach runs and field observations
Traffic congestion can be categorized as either recurrent
or non-recurrent
recurrent congestion occurs repeatedly at the same place and time of day in a predictable pattern Recurrent congesshytion is often associated with facility capacity limitations changes in capacity conflicting vehicle movements such
as lane merges inadequate number of transit vehicles to handle passenger loads or other persistent physical condishytions of the transportation facility
Non-recurrent congestion is usually attributed to collishysions equipment malfunction community events weather construction projects and other occasional occurrences When transportation systems are close to their maximum
carrying capacity non-recurrent congestion is more likely to occur as there is little excess capacity in the system
The location and extent of the bottlenecks on US 50 found
in the aM and PM peak periods are summarized in Tables 14 and 15 These depictions should be considered a snapshyshot view and not a comprehensive analysis of all bottleshynecks in the corridor Further work is being conducted to
refine the identification and causality of bottlenecks within
the corridor Table 14 shows a summary of the US 50 eastbound bottlenecks while the tables that follow discuss each bottleneck including location and possible causality Table 15 shows a summary of the US 50 westbound bottleshynecks while the tables that follow discuss each bottleneck including location and possible causality Minor or hidden bottlenecks are those Freeway bottleneck
that are not as defined locations that create (or severe) as the major mobility constraints bottlenecks Please note are identified and that the graphics accomshy documented and their panying the bottlenecks
relative contribution to are not to scale
corridor-wide congestion Major bottlenecks in the is reported eastbound direction during the aM peak period are at Howe avenue and during the PM peak period are at 48th Street Howe Avenue Mayhew Road Routier Road Sunrise Boulevard and El Dorado Hills Boulevard Major bottlenecks in the westbound direction during the aM peak period are at El Dorado Hills Boulevard Hazel Avenue Zinfandel Drive
HigHway 50 corridor system management plan [ 47 ]
c h a p t e r s e v e n c o n g e s t i o n a n d b o t t l e n e c k a n a l y s i s
Bradshaw Road and Howe Avenue and major bottleneck
locations during the PM peak period are at Zinfandel Drive Routier Road Bradshaw Road Howe Avenue and Intershystate 5
Causalities for these bottlenecks range from high-traffic
demand (congestion) heavy weavingmerging areas or physical constraints such as lane drops lack of ramp meters incomplete HOV network incomplete Auxiliary Lane
network poorly coordinated traffic signals and an off-ramp
queue (Sunrise Boulevard) US 50 Westbound Onramp
TABLE 14 US 50 EASTBOUnD BOTTLEnECk SUmmARY Source PeMS Caltrans tach runs and
Cambridge Systematics field observations
bottleneck Location PeMS Speed Contours Caltrans Probe Vehicle Runs
Cause aM PM aM PM
A Jefferson Blvd PM 25 Minor Minor Traffic weaving truck volumes and grade
B 48th St PM 7 Minor Major Minor Minor Merge from SR 51 and SR 99
C Howe ave PM 9 Major Major Major weave between Howe and watt
D Mayhew Rd PM 12 Major Minor Major Weaving before Bradshaw Exit
E Routier Rd PM 14 Minor Major Weaving before Mather Field Rd Exit
F Sunrise Blvd PM 185 Minor Major Lane drop HOV add off-ramp queue
G Folsom Blvd PM 22 Minor Minor Lane drop 4 to 3
H El Dorado Hills Blvd PM 275 Major
Poorly coordinated traffic signal on arterial causes spillback onto freeway
a jefferson blvd bottleneck The bottleneck approximately located at Jefferson Blvd is due to weaving traffic as those entershying the freeway from Jefferson Blvd must cross those attempting to exit the freeway to I 5 There is a large number of trucks in the stream which struggle with the grade at this location exacerbatshying the bottleneck
[ 48 ] HigHway 50 corridor system management plan
c h a p t e r s e v e n c o n g e s t i o n a n d b o t t l e n e c k a n a l y s i s
b 48th St bottleneck The bottleneck approximately located at 48th St is due to the additional traffic merging from SR 51 and SR 99 combined with the eventual lane drop at 59th St This queue extends upstream past the off-ramp to SR 5199 These off-ramps are bottlenecks in themselves which spill back and choke the US 50 mainline
C Howe Ave Bottleneck The bottleneck at Howe ave is due to the entering traffic from Howe Ave Two Howe Ave on-ramps feed into US 50 eastbound southbound Howe ave loop on-ramp and northbound Howe ave direct ramp approximately 300 feet apart The watt avenue off-ramp is just down stream with heavy exiting volumes therefore the segment between Howe and watt is characterized by heavy weaving
D mayhew Rd Bottleneck The bottleneck approximately located at Mayhew Rd most likely begins with the additional traffic entering from Watt Ave and ends with the exiting traffic at Bradshaw Rd It is possible that there is a high proportion of weaving traffic with in this section (Watt Ave traffic moving to the left lane and those exiting at Bradshaw Rd moving to the right lane)
HigHway 50 corridor system management plan [ 49 ]
c h a p t e r s e v e n c o n g e s t i o n a n d b o t t l e n e c k a n a l y s i s
[ 50 ] HigHway 50 corridor system management plan
e routier rd bottleneck It is likely that the bottleneck at Routier Rd is due to the same merging conditions associated with Mayhew Rd The area is comprised of both residential and light industrialoffice land uses therefore during the PM peak period there are large volumes of vehicles entering at Bradshaw Rd moving to the left lanes and large volumes of vehicles moving to the right lane to exit at Mather Field Rd
f Sunrise blvd bottleneck At Sunrise Blvd the right-most lane exits while an HOV lane is added as the median lane The bottleneck is formed from vehicles shifting left to avoid exiting at Sunrise Blvd and to enter the HOV lane There is a large volume of vehicles queued at the Sunrise off-ramp which spills back and negatively affects the US 50 mainline
g folsom blvd bottleneck The right-most lane exits to Folsom Blvd leaving one HOV lane and two regular lanes along the US 50 The bottleneck is caused by this lane drop as well as the quick merge at the Folsom on-ramp
c h a p t e r s e v e n c o n g e s t i o n a n d b o t t l e n e c k a n a l y s i s
H The eastbound US 50 at El Dorado Hills Blvd Bottleneck The eastbound El Dorado Hills Blvd bottleneck is caused by a traffic signal on the arterial that often causes spillbacks on the EB loop offramp onto the freeway mainlines
TABLE 15 US 50 WESTBOUnD BOTTLEnECk SUmmARY Source PeMS Caltrans tach runs and Cambridge Systematics field observations
bottleneck Location PeMS Speed Contours Caltrans Probe Vehicle Runs
Cause aM PM aM PM
A El Dorado Hills Blvd PM 275 Major Poorly coordinated traffic
signal on El Dorado Hills Blvd
B Hazel Ave PM 21 Major Entering traffic
C Zinfandel Dr PM 16 Minor Major Major Major Entering traffic
D Routier Rd PM 14 Minor Major Minor Weaving traffic
E Bradshaw PM 13 Major Major Major Merging traffic and curve
F Howe Ave PM 9 Minor Major Major Major Weaving traffic and grade
G SR 51SR 99 PM 6 Minor Lane drop weaving traffic
H i-5 PM 3 Major Weaving traffic
HigHway 50 corridor system management plan [ 51 ]
c h a p t e r s e v e n c o n g e s t i o n a n d b o t t l e n e c k a n a l y s i s
[ 52 ] HigHway 50 corridor system management plan
A El Dorado Hills Blvd Bottleneck The minor bottleneck at El Dorado Hills Boulevard is caused by the traffic signal on El Dorado Hills Blvd that causes spillback on the westbound offramp onto the freeway mainlines
B Hazel Avenue Bottleneck In 2006 the Hazel Ave Bottleneck is caused by the traffic entering at both Hazel Ave and Folsom Blvd (the two on-ramps are separated by about one mile) The bottleneck that would appear at Folsom Blvd combines with the bottleneck at Hazel ave to form a large bottleneck that does not clear until after Hazel ave Sometimes causshying spillbacks as far as Prairies City Road this bottleneck was mitigated in 2007 as part of the GO CALIFORNIA program
C Zinfandel Dr Bottleneck There is heavy traffic coming from Sunrise Blvd but the lane addition immediately after the westbound on-ramp prevents a bottleneck from forming but as traffic flows westward the heavy traffic entering from Zinfandel Dr causes a bottleshyneck here
D Routier Rd Bottleneck The bottleneck at Routier Rd is caused by weaving traffic between Mather Field Rd and Bradshaw Rd This highway segment represents a transition area where vehicles that have been traveling in the left lanes begin to shift to the right lanes to exit while the entering traffic tries to shift to the left lanes
W eav in gLan e Dr o p
c h a p t e r s e v e n c o n g e s t i o n a n d b o t t l e n e c k a n a l y s i s
e bradshaw rd bottleneck The Bradshaw Rd bottleneck is caused by the entering traffic from Bradshaw Road the high truck volumes and the curve west of Bradshaw Two Bradshaw Rd on-ramps feed into US 50 westshybound southbound Bradshaw Rd direct on-ramp and northbound Bradshaw Rd loop on-ramp approximately 400 feet apart
F Howe Ave Bottleneck The Howe ave bottleneck is caused by a grade change and the weaving traffic entering from Howe ave and Hornet Dr competing for the right-most lane with those wanting to exit at 65th Street
G amp H SR 51SR 99 amp I-5 Bottleneck The bottleneck at I 5 is caused by the conflict between entering SR 99 and SR 51 traffic and exiting I-5 traffic as well as the queues formed on the ramps to i-5 which spill back onto US 50 The number of lanes in this section reaches a maximum of 6 and then drops to 4 as two lanes exit at the I-5 freeway This bottleneck is exacershybated during the peak periods when it stretches upstream to the lane drop before SR 99
W ea v in g
Lan e Dr o p
HigHway 50 corridor system management plan [ 53 ]

c h a p t e r s i x p l a n n e d c o r r i d o r s y s t e m m a n a g e m e n t s t r a t e g i e s
TABLE 11 KEY CAPITAL PROJECTS (CONTINUED)
CountyLead Agency
Route Roadway From To Project
Description Programmed
Funds
Additional Funding Needed
Total Cost Es-timate (x $1000)
Comp Year (FFY)
BICYCLE ROUTES
Sacramento City of Rancho
Cordova
US 50Mather Field Road IC US 50 Mather
Field Road
US 50Mather Field Road PedestrianBike Crossing along
the Mather Airport RR Spur alignment
$0 $820 $1055 2015
ED ED County DOT
Sacramento Placerville
Transportation Corridor
Forni Rd
Missouri Flat Rd Class I Bike Trail $1423 $111 $1534 2009
ED City of Placerville
El Dorado Trail Western
Extension
Canal Street Main Street
Ray Lawyer DriveForni
Road Class 1 Bike Trail $1850 $0 $1850 2010
ED ED County DOT
US 50ED Hills Blvd IC US 50
El Dorado Hills Blvd
Latrobe Road
US 50El Dorado Hills Blvd Pedestrian Overcrossing $5508 $66 $5574 2014
TABLE 12 50 MOBILITY PARTNERSHIP KEY CAPITAL PROJECTS
RouteRoadway From To Project Description
NEAR TERM PRIORITY IMPROVEMENT PROJECTS
US 50 Sunrise Scott Road Auxiliary Lane
US 50 Hazel Avenue Interchange Improvements
Hazel Avenue Folsom Boulevard Easton Valley Parkway New 4 Lane Road
Easton Valley Parkway Hazel Avenue Rancho Cordova Parkway New 6 Lane Road
Rancho Cordova Parkway Easton Valley Parkway White Rock Road New 4 Lane Road
White Rock Road Sunrise Boulevard Silva Valley Parkway Widen to 4 Lanes
RT Gold Line Hazel Iron Point Station Passing Tracks
US 50 Rancho Cordova Parkway New Interchange
Zinfandel Drive South of International Douglas Road New 4 Lane Road
International Drive Kilgore Road Rancho Cordova Parkway New 6 Lane Road
Douglas Road Zinfandel Extension Sunrise Boulevard Widen to 4 Lanes
Sunrise LRT Citrus Road Sunrise Mall Bus Rapid TransitExpress Bus
[ 44 ] HIGHWAY 50 corridor system management plan
c h a p t e r s i x p l a n n e d c o r r i d o r s y s t e m m a n a g e m e n t s t r a t e g i e s
TABLE 12 50 mOBILITY PARTnERSHIP kEY CAPITAL PROjECTS (COnTInUED)
routeroadway from to Project Description
US 50 nEAR TERm PRIORITY ImPROVEmEnT PROjECTS
US 50 Empire Ranch Road New interchange
US 50 Silva Valley New interchange
US 50 Scott Road Empire Ranch Road Aux Lanes
US 50 Empire Ranch Road El Dorado Hills Boulevard Aux lanes and climbing lanes
US 50 El Dorado Hills Boulevard Silva Valley Parkway Aux lanes and climbing lanes
US 50 Silva Valley Parkway Bass Lake Road Aux lanes
Sunrise Boulevard White Rock Road Douglas Boulevard widen to 6 lanes
Sunrise Boulevard Douglas Boulevard Jackson Road widen to 4 lanes
White Rock Road Sunrise Boulevard Future Rancho Cordova Parkway and El Dorado County Line to Latrobe Road
widen to 4 lanes
Douglas Boulevard Sunrise Boulevard Grant Line Road widen to 4 lanes
Rancho Cordova Parkway Douglas Boulevard Rio del Oro Parkway New 2 lane road
Rancho Cordova Parkway Rio del Oro Parkway White Rock Road New 6 lane road
Jaeger Road Douglas Road Kiefer Boulevard New 4 lane road
Chrysanthy Sunrise Boulevard Americanos Boulevard New 4 lane road
Kiefer Boulevard Sunrise Boulevard Jaeger Road New 4 lane road
Grant Line Road Douglas Road Chrysanthy Road widen to 4 lanes
Hazel avenue Gold Country Boulevard Madison avenue widen to 6 lanes
Latrobe Road South of White Rock Road widen to 4 lanes
TABLE 13 VISIOnARY PROjECTS
County routeroadway from to Project Description
Sac yolo US 50 Enterprise Downtown Sacramento HOV Lanes
ED TBD Folsom Placerville Transit ndash Type TBD
ED New Road Latrobe Road White Rock Road (poten shy
tially US 50) New 2-lane road
HigHway 50 corridor system management plan [ 45 ]
c h a p t e r s i x p l a n n e d c o r r i d o r s y s t e m m a n a g e m e n t s t r a t e g i e s
[ 46 ] HigHway 50 corridor system management plan
Page Inte
ntionally
Left
Blank
congestion and bottleneck analysis
chapter seven
The 2000 Highway Capacity Manual defines a bottleneck
as ldquoa road element on which demand exceeds capacityrdquo
The bottleneck analysis evaluates specific causes of existshying recurrent traffic congestion in the corridor Freeway bottleneck locations that create mobility constraints are identified and documented and their relative contribution
to corridor-wide congestion is reported The bottleneck locations were determined based on a combination of the use of 2006 PeMS data HiCOMP report probe vehicle tach runs and field observations
Traffic congestion can be categorized as either recurrent
or non-recurrent
recurrent congestion occurs repeatedly at the same place and time of day in a predictable pattern Recurrent congesshytion is often associated with facility capacity limitations changes in capacity conflicting vehicle movements such
as lane merges inadequate number of transit vehicles to handle passenger loads or other persistent physical condishytions of the transportation facility
Non-recurrent congestion is usually attributed to collishysions equipment malfunction community events weather construction projects and other occasional occurrences When transportation systems are close to their maximum
carrying capacity non-recurrent congestion is more likely to occur as there is little excess capacity in the system
The location and extent of the bottlenecks on US 50 found
in the aM and PM peak periods are summarized in Tables 14 and 15 These depictions should be considered a snapshyshot view and not a comprehensive analysis of all bottleshynecks in the corridor Further work is being conducted to
refine the identification and causality of bottlenecks within
the corridor Table 14 shows a summary of the US 50 eastbound bottlenecks while the tables that follow discuss each bottleneck including location and possible causality Table 15 shows a summary of the US 50 westbound bottleshynecks while the tables that follow discuss each bottleneck including location and possible causality Minor or hidden bottlenecks are those Freeway bottleneck
that are not as defined locations that create (or severe) as the major mobility constraints bottlenecks Please note are identified and that the graphics accomshy documented and their panying the bottlenecks
relative contribution to are not to scale
corridor-wide congestion Major bottlenecks in the is reported eastbound direction during the aM peak period are at Howe avenue and during the PM peak period are at 48th Street Howe Avenue Mayhew Road Routier Road Sunrise Boulevard and El Dorado Hills Boulevard Major bottlenecks in the westbound direction during the aM peak period are at El Dorado Hills Boulevard Hazel Avenue Zinfandel Drive
HigHway 50 corridor system management plan [ 47 ]
c h a p t e r s e v e n c o n g e s t i o n a n d b o t t l e n e c k a n a l y s i s
Bradshaw Road and Howe Avenue and major bottleneck
locations during the PM peak period are at Zinfandel Drive Routier Road Bradshaw Road Howe Avenue and Intershystate 5
Causalities for these bottlenecks range from high-traffic
demand (congestion) heavy weavingmerging areas or physical constraints such as lane drops lack of ramp meters incomplete HOV network incomplete Auxiliary Lane
network poorly coordinated traffic signals and an off-ramp
queue (Sunrise Boulevard) US 50 Westbound Onramp
TABLE 14 US 50 EASTBOUnD BOTTLEnECk SUmmARY Source PeMS Caltrans tach runs and
Cambridge Systematics field observations
bottleneck Location PeMS Speed Contours Caltrans Probe Vehicle Runs
Cause aM PM aM PM
A Jefferson Blvd PM 25 Minor Minor Traffic weaving truck volumes and grade
B 48th St PM 7 Minor Major Minor Minor Merge from SR 51 and SR 99
C Howe ave PM 9 Major Major Major weave between Howe and watt
D Mayhew Rd PM 12 Major Minor Major Weaving before Bradshaw Exit
E Routier Rd PM 14 Minor Major Weaving before Mather Field Rd Exit
F Sunrise Blvd PM 185 Minor Major Lane drop HOV add off-ramp queue
G Folsom Blvd PM 22 Minor Minor Lane drop 4 to 3
H El Dorado Hills Blvd PM 275 Major
Poorly coordinated traffic signal on arterial causes spillback onto freeway
a jefferson blvd bottleneck The bottleneck approximately located at Jefferson Blvd is due to weaving traffic as those entershying the freeway from Jefferson Blvd must cross those attempting to exit the freeway to I 5 There is a large number of trucks in the stream which struggle with the grade at this location exacerbatshying the bottleneck
[ 48 ] HigHway 50 corridor system management plan
c h a p t e r s e v e n c o n g e s t i o n a n d b o t t l e n e c k a n a l y s i s
b 48th St bottleneck The bottleneck approximately located at 48th St is due to the additional traffic merging from SR 51 and SR 99 combined with the eventual lane drop at 59th St This queue extends upstream past the off-ramp to SR 5199 These off-ramps are bottlenecks in themselves which spill back and choke the US 50 mainline
C Howe Ave Bottleneck The bottleneck at Howe ave is due to the entering traffic from Howe Ave Two Howe Ave on-ramps feed into US 50 eastbound southbound Howe ave loop on-ramp and northbound Howe ave direct ramp approximately 300 feet apart The watt avenue off-ramp is just down stream with heavy exiting volumes therefore the segment between Howe and watt is characterized by heavy weaving
D mayhew Rd Bottleneck The bottleneck approximately located at Mayhew Rd most likely begins with the additional traffic entering from Watt Ave and ends with the exiting traffic at Bradshaw Rd It is possible that there is a high proportion of weaving traffic with in this section (Watt Ave traffic moving to the left lane and those exiting at Bradshaw Rd moving to the right lane)
HigHway 50 corridor system management plan [ 49 ]
c h a p t e r s e v e n c o n g e s t i o n a n d b o t t l e n e c k a n a l y s i s
[ 50 ] HigHway 50 corridor system management plan
e routier rd bottleneck It is likely that the bottleneck at Routier Rd is due to the same merging conditions associated with Mayhew Rd The area is comprised of both residential and light industrialoffice land uses therefore during the PM peak period there are large volumes of vehicles entering at Bradshaw Rd moving to the left lanes and large volumes of vehicles moving to the right lane to exit at Mather Field Rd
f Sunrise blvd bottleneck At Sunrise Blvd the right-most lane exits while an HOV lane is added as the median lane The bottleneck is formed from vehicles shifting left to avoid exiting at Sunrise Blvd and to enter the HOV lane There is a large volume of vehicles queued at the Sunrise off-ramp which spills back and negatively affects the US 50 mainline
g folsom blvd bottleneck The right-most lane exits to Folsom Blvd leaving one HOV lane and two regular lanes along the US 50 The bottleneck is caused by this lane drop as well as the quick merge at the Folsom on-ramp
c h a p t e r s e v e n c o n g e s t i o n a n d b o t t l e n e c k a n a l y s i s
H The eastbound US 50 at El Dorado Hills Blvd Bottleneck The eastbound El Dorado Hills Blvd bottleneck is caused by a traffic signal on the arterial that often causes spillbacks on the EB loop offramp onto the freeway mainlines
TABLE 15 US 50 WESTBOUnD BOTTLEnECk SUmmARY Source PeMS Caltrans tach runs and Cambridge Systematics field observations
bottleneck Location PeMS Speed Contours Caltrans Probe Vehicle Runs
Cause aM PM aM PM
A El Dorado Hills Blvd PM 275 Major Poorly coordinated traffic
signal on El Dorado Hills Blvd
B Hazel Ave PM 21 Major Entering traffic
C Zinfandel Dr PM 16 Minor Major Major Major Entering traffic
D Routier Rd PM 14 Minor Major Minor Weaving traffic
E Bradshaw PM 13 Major Major Major Merging traffic and curve
F Howe Ave PM 9 Minor Major Major Major Weaving traffic and grade
G SR 51SR 99 PM 6 Minor Lane drop weaving traffic
H i-5 PM 3 Major Weaving traffic
HigHway 50 corridor system management plan [ 51 ]
c h a p t e r s e v e n c o n g e s t i o n a n d b o t t l e n e c k a n a l y s i s
[ 52 ] HigHway 50 corridor system management plan
A El Dorado Hills Blvd Bottleneck The minor bottleneck at El Dorado Hills Boulevard is caused by the traffic signal on El Dorado Hills Blvd that causes spillback on the westbound offramp onto the freeway mainlines
B Hazel Avenue Bottleneck In 2006 the Hazel Ave Bottleneck is caused by the traffic entering at both Hazel Ave and Folsom Blvd (the two on-ramps are separated by about one mile) The bottleneck that would appear at Folsom Blvd combines with the bottleneck at Hazel ave to form a large bottleneck that does not clear until after Hazel ave Sometimes causshying spillbacks as far as Prairies City Road this bottleneck was mitigated in 2007 as part of the GO CALIFORNIA program
C Zinfandel Dr Bottleneck There is heavy traffic coming from Sunrise Blvd but the lane addition immediately after the westbound on-ramp prevents a bottleneck from forming but as traffic flows westward the heavy traffic entering from Zinfandel Dr causes a bottleshyneck here
D Routier Rd Bottleneck The bottleneck at Routier Rd is caused by weaving traffic between Mather Field Rd and Bradshaw Rd This highway segment represents a transition area where vehicles that have been traveling in the left lanes begin to shift to the right lanes to exit while the entering traffic tries to shift to the left lanes
W eav in gLan e Dr o p
c h a p t e r s e v e n c o n g e s t i o n a n d b o t t l e n e c k a n a l y s i s
e bradshaw rd bottleneck The Bradshaw Rd bottleneck is caused by the entering traffic from Bradshaw Road the high truck volumes and the curve west of Bradshaw Two Bradshaw Rd on-ramps feed into US 50 westshybound southbound Bradshaw Rd direct on-ramp and northbound Bradshaw Rd loop on-ramp approximately 400 feet apart
F Howe Ave Bottleneck The Howe ave bottleneck is caused by a grade change and the weaving traffic entering from Howe ave and Hornet Dr competing for the right-most lane with those wanting to exit at 65th Street
G amp H SR 51SR 99 amp I-5 Bottleneck The bottleneck at I 5 is caused by the conflict between entering SR 99 and SR 51 traffic and exiting I-5 traffic as well as the queues formed on the ramps to i-5 which spill back onto US 50 The number of lanes in this section reaches a maximum of 6 and then drops to 4 as two lanes exit at the I-5 freeway This bottleneck is exacershybated during the peak periods when it stretches upstream to the lane drop before SR 99
W ea v in g
Lan e Dr o p
HigHway 50 corridor system management plan [ 53 ]
c h a p t e r s i x p l a n n e d c o r r i d o r s y s t e m m a n a g e m e n t s t r a t e g i e s
TABLE 12 50 mOBILITY PARTnERSHIP kEY CAPITAL PROjECTS (COnTInUED)
routeroadway from to Project Description
US 50 nEAR TERm PRIORITY ImPROVEmEnT PROjECTS
US 50 Empire Ranch Road New interchange
US 50 Silva Valley New interchange
US 50 Scott Road Empire Ranch Road Aux Lanes
US 50 Empire Ranch Road El Dorado Hills Boulevard Aux lanes and climbing lanes
US 50 El Dorado Hills Boulevard Silva Valley Parkway Aux lanes and climbing lanes
US 50 Silva Valley Parkway Bass Lake Road Aux lanes
Sunrise Boulevard White Rock Road Douglas Boulevard widen to 6 lanes
Sunrise Boulevard Douglas Boulevard Jackson Road widen to 4 lanes
White Rock Road Sunrise Boulevard Future Rancho Cordova Parkway and El Dorado County Line to Latrobe Road
widen to 4 lanes
Douglas Boulevard Sunrise Boulevard Grant Line Road widen to 4 lanes
Rancho Cordova Parkway Douglas Boulevard Rio del Oro Parkway New 2 lane road
Rancho Cordova Parkway Rio del Oro Parkway White Rock Road New 6 lane road
Jaeger Road Douglas Road Kiefer Boulevard New 4 lane road
Chrysanthy Sunrise Boulevard Americanos Boulevard New 4 lane road
Kiefer Boulevard Sunrise Boulevard Jaeger Road New 4 lane road
Grant Line Road Douglas Road Chrysanthy Road widen to 4 lanes
Hazel avenue Gold Country Boulevard Madison avenue widen to 6 lanes
Latrobe Road South of White Rock Road widen to 4 lanes
TABLE 13 VISIOnARY PROjECTS
County routeroadway from to Project Description
Sac yolo US 50 Enterprise Downtown Sacramento HOV Lanes
ED TBD Folsom Placerville Transit ndash Type TBD
ED New Road Latrobe Road White Rock Road (poten shy
tially US 50) New 2-lane road
HigHway 50 corridor system management plan [ 45 ]
c h a p t e r s i x p l a n n e d c o r r i d o r s y s t e m m a n a g e m e n t s t r a t e g i e s
[ 46 ] HigHway 50 corridor system management plan
Page Inte
ntionally
Left
Blank
congestion and bottleneck analysis
chapter seven
The 2000 Highway Capacity Manual defines a bottleneck
as ldquoa road element on which demand exceeds capacityrdquo
The bottleneck analysis evaluates specific causes of existshying recurrent traffic congestion in the corridor Freeway bottleneck locations that create mobility constraints are identified and documented and their relative contribution
to corridor-wide congestion is reported The bottleneck locations were determined based on a combination of the use of 2006 PeMS data HiCOMP report probe vehicle tach runs and field observations
Traffic congestion can be categorized as either recurrent
or non-recurrent
recurrent congestion occurs repeatedly at the same place and time of day in a predictable pattern Recurrent congesshytion is often associated with facility capacity limitations changes in capacity conflicting vehicle movements such
as lane merges inadequate number of transit vehicles to handle passenger loads or other persistent physical condishytions of the transportation facility
Non-recurrent congestion is usually attributed to collishysions equipment malfunction community events weather construction projects and other occasional occurrences When transportation systems are close to their maximum
carrying capacity non-recurrent congestion is more likely to occur as there is little excess capacity in the system
The location and extent of the bottlenecks on US 50 found
in the aM and PM peak periods are summarized in Tables 14 and 15 These depictions should be considered a snapshyshot view and not a comprehensive analysis of all bottleshynecks in the corridor Further work is being conducted to
refine the identification and causality of bottlenecks within
the corridor Table 14 shows a summary of the US 50 eastbound bottlenecks while the tables that follow discuss each bottleneck including location and possible causality Table 15 shows a summary of the US 50 westbound bottleshynecks while the tables that follow discuss each bottleneck including location and possible causality Minor or hidden bottlenecks are those Freeway bottleneck
that are not as defined locations that create (or severe) as the major mobility constraints bottlenecks Please note are identified and that the graphics accomshy documented and their panying the bottlenecks
relative contribution to are not to scale
corridor-wide congestion Major bottlenecks in the is reported eastbound direction during the aM peak period are at Howe avenue and during the PM peak period are at 48th Street Howe Avenue Mayhew Road Routier Road Sunrise Boulevard and El Dorado Hills Boulevard Major bottlenecks in the westbound direction during the aM peak period are at El Dorado Hills Boulevard Hazel Avenue Zinfandel Drive
HigHway 50 corridor system management plan [ 47 ]
c h a p t e r s e v e n c o n g e s t i o n a n d b o t t l e n e c k a n a l y s i s
Bradshaw Road and Howe Avenue and major bottleneck
locations during the PM peak period are at Zinfandel Drive Routier Road Bradshaw Road Howe Avenue and Intershystate 5
Causalities for these bottlenecks range from high-traffic
demand (congestion) heavy weavingmerging areas or physical constraints such as lane drops lack of ramp meters incomplete HOV network incomplete Auxiliary Lane
network poorly coordinated traffic signals and an off-ramp
queue (Sunrise Boulevard) US 50 Westbound Onramp
TABLE 14 US 50 EASTBOUnD BOTTLEnECk SUmmARY Source PeMS Caltrans tach runs and
Cambridge Systematics field observations
bottleneck Location PeMS Speed Contours Caltrans Probe Vehicle Runs
Cause aM PM aM PM
A Jefferson Blvd PM 25 Minor Minor Traffic weaving truck volumes and grade
B 48th St PM 7 Minor Major Minor Minor Merge from SR 51 and SR 99
C Howe ave PM 9 Major Major Major weave between Howe and watt
D Mayhew Rd PM 12 Major Minor Major Weaving before Bradshaw Exit
E Routier Rd PM 14 Minor Major Weaving before Mather Field Rd Exit
F Sunrise Blvd PM 185 Minor Major Lane drop HOV add off-ramp queue
G Folsom Blvd PM 22 Minor Minor Lane drop 4 to 3
H El Dorado Hills Blvd PM 275 Major
Poorly coordinated traffic signal on arterial causes spillback onto freeway
a jefferson blvd bottleneck The bottleneck approximately located at Jefferson Blvd is due to weaving traffic as those entershying the freeway from Jefferson Blvd must cross those attempting to exit the freeway to I 5 There is a large number of trucks in the stream which struggle with the grade at this location exacerbatshying the bottleneck
[ 48 ] HigHway 50 corridor system management plan
c h a p t e r s e v e n c o n g e s t i o n a n d b o t t l e n e c k a n a l y s i s
b 48th St bottleneck The bottleneck approximately located at 48th St is due to the additional traffic merging from SR 51 and SR 99 combined with the eventual lane drop at 59th St This queue extends upstream past the off-ramp to SR 5199 These off-ramps are bottlenecks in themselves which spill back and choke the US 50 mainline
C Howe Ave Bottleneck The bottleneck at Howe ave is due to the entering traffic from Howe Ave Two Howe Ave on-ramps feed into US 50 eastbound southbound Howe ave loop on-ramp and northbound Howe ave direct ramp approximately 300 feet apart The watt avenue off-ramp is just down stream with heavy exiting volumes therefore the segment between Howe and watt is characterized by heavy weaving
D mayhew Rd Bottleneck The bottleneck approximately located at Mayhew Rd most likely begins with the additional traffic entering from Watt Ave and ends with the exiting traffic at Bradshaw Rd It is possible that there is a high proportion of weaving traffic with in this section (Watt Ave traffic moving to the left lane and those exiting at Bradshaw Rd moving to the right lane)
HigHway 50 corridor system management plan [ 49 ]
c h a p t e r s e v e n c o n g e s t i o n a n d b o t t l e n e c k a n a l y s i s
[ 50 ] HigHway 50 corridor system management plan
e routier rd bottleneck It is likely that the bottleneck at Routier Rd is due to the same merging conditions associated with Mayhew Rd The area is comprised of both residential and light industrialoffice land uses therefore during the PM peak period there are large volumes of vehicles entering at Bradshaw Rd moving to the left lanes and large volumes of vehicles moving to the right lane to exit at Mather Field Rd
f Sunrise blvd bottleneck At Sunrise Blvd the right-most lane exits while an HOV lane is added as the median lane The bottleneck is formed from vehicles shifting left to avoid exiting at Sunrise Blvd and to enter the HOV lane There is a large volume of vehicles queued at the Sunrise off-ramp which spills back and negatively affects the US 50 mainline
g folsom blvd bottleneck The right-most lane exits to Folsom Blvd leaving one HOV lane and two regular lanes along the US 50 The bottleneck is caused by this lane drop as well as the quick merge at the Folsom on-ramp
c h a p t e r s e v e n c o n g e s t i o n a n d b o t t l e n e c k a n a l y s i s
H The eastbound US 50 at El Dorado Hills Blvd Bottleneck The eastbound El Dorado Hills Blvd bottleneck is caused by a traffic signal on the arterial that often causes spillbacks on the EB loop offramp onto the freeway mainlines
TABLE 15 US 50 WESTBOUnD BOTTLEnECk SUmmARY Source PeMS Caltrans tach runs and Cambridge Systematics field observations
bottleneck Location PeMS Speed Contours Caltrans Probe Vehicle Runs
Cause aM PM aM PM
A El Dorado Hills Blvd PM 275 Major Poorly coordinated traffic
signal on El Dorado Hills Blvd
B Hazel Ave PM 21 Major Entering traffic
C Zinfandel Dr PM 16 Minor Major Major Major Entering traffic
D Routier Rd PM 14 Minor Major Minor Weaving traffic
E Bradshaw PM 13 Major Major Major Merging traffic and curve
F Howe Ave PM 9 Minor Major Major Major Weaving traffic and grade
G SR 51SR 99 PM 6 Minor Lane drop weaving traffic
H i-5 PM 3 Major Weaving traffic
HigHway 50 corridor system management plan [ 51 ]
c h a p t e r s e v e n c o n g e s t i o n a n d b o t t l e n e c k a n a l y s i s
[ 52 ] HigHway 50 corridor system management plan
A El Dorado Hills Blvd Bottleneck The minor bottleneck at El Dorado Hills Boulevard is caused by the traffic signal on El Dorado Hills Blvd that causes spillback on the westbound offramp onto the freeway mainlines
B Hazel Avenue Bottleneck In 2006 the Hazel Ave Bottleneck is caused by the traffic entering at both Hazel Ave and Folsom Blvd (the two on-ramps are separated by about one mile) The bottleneck that would appear at Folsom Blvd combines with the bottleneck at Hazel ave to form a large bottleneck that does not clear until after Hazel ave Sometimes causshying spillbacks as far as Prairies City Road this bottleneck was mitigated in 2007 as part of the GO CALIFORNIA program
C Zinfandel Dr Bottleneck There is heavy traffic coming from Sunrise Blvd but the lane addition immediately after the westbound on-ramp prevents a bottleneck from forming but as traffic flows westward the heavy traffic entering from Zinfandel Dr causes a bottleshyneck here
D Routier Rd Bottleneck The bottleneck at Routier Rd is caused by weaving traffic between Mather Field Rd and Bradshaw Rd This highway segment represents a transition area where vehicles that have been traveling in the left lanes begin to shift to the right lanes to exit while the entering traffic tries to shift to the left lanes
W eav in gLan e Dr o p
c h a p t e r s e v e n c o n g e s t i o n a n d b o t t l e n e c k a n a l y s i s
e bradshaw rd bottleneck The Bradshaw Rd bottleneck is caused by the entering traffic from Bradshaw Road the high truck volumes and the curve west of Bradshaw Two Bradshaw Rd on-ramps feed into US 50 westshybound southbound Bradshaw Rd direct on-ramp and northbound Bradshaw Rd loop on-ramp approximately 400 feet apart
F Howe Ave Bottleneck The Howe ave bottleneck is caused by a grade change and the weaving traffic entering from Howe ave and Hornet Dr competing for the right-most lane with those wanting to exit at 65th Street
G amp H SR 51SR 99 amp I-5 Bottleneck The bottleneck at I 5 is caused by the conflict between entering SR 99 and SR 51 traffic and exiting I-5 traffic as well as the queues formed on the ramps to i-5 which spill back onto US 50 The number of lanes in this section reaches a maximum of 6 and then drops to 4 as two lanes exit at the I-5 freeway This bottleneck is exacershybated during the peak periods when it stretches upstream to the lane drop before SR 99
W ea v in g
Lan e Dr o p
HigHway 50 corridor system management plan [ 53 ]
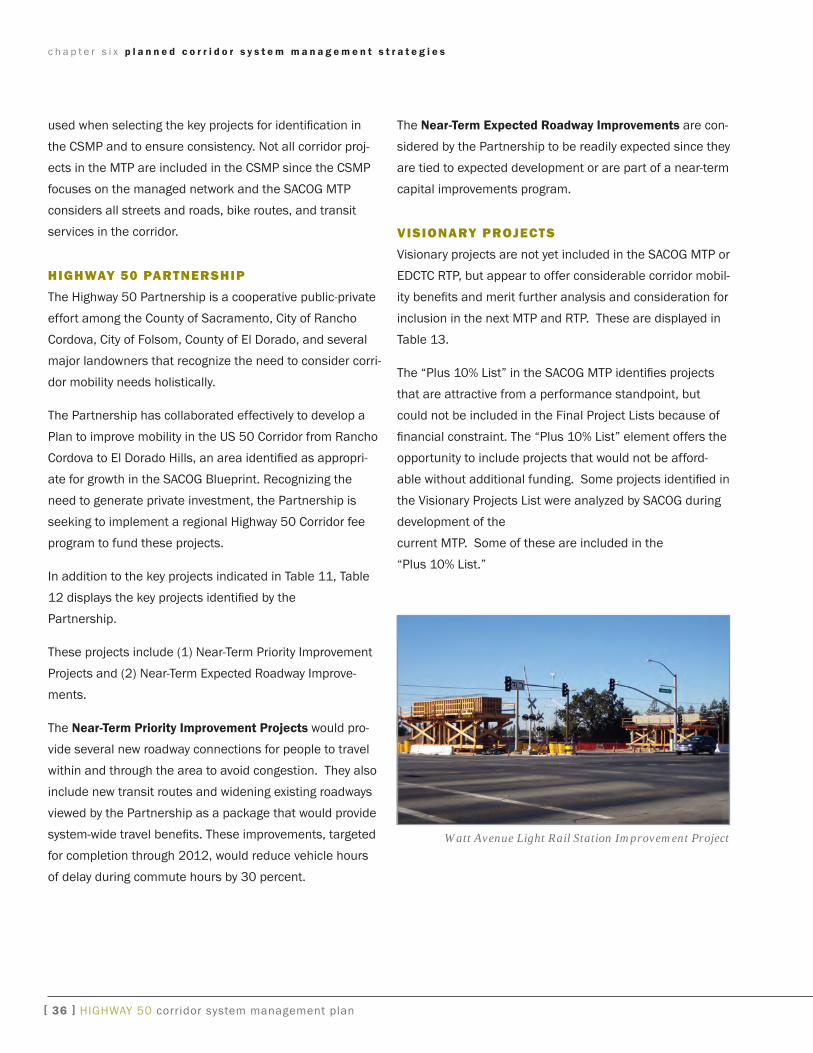
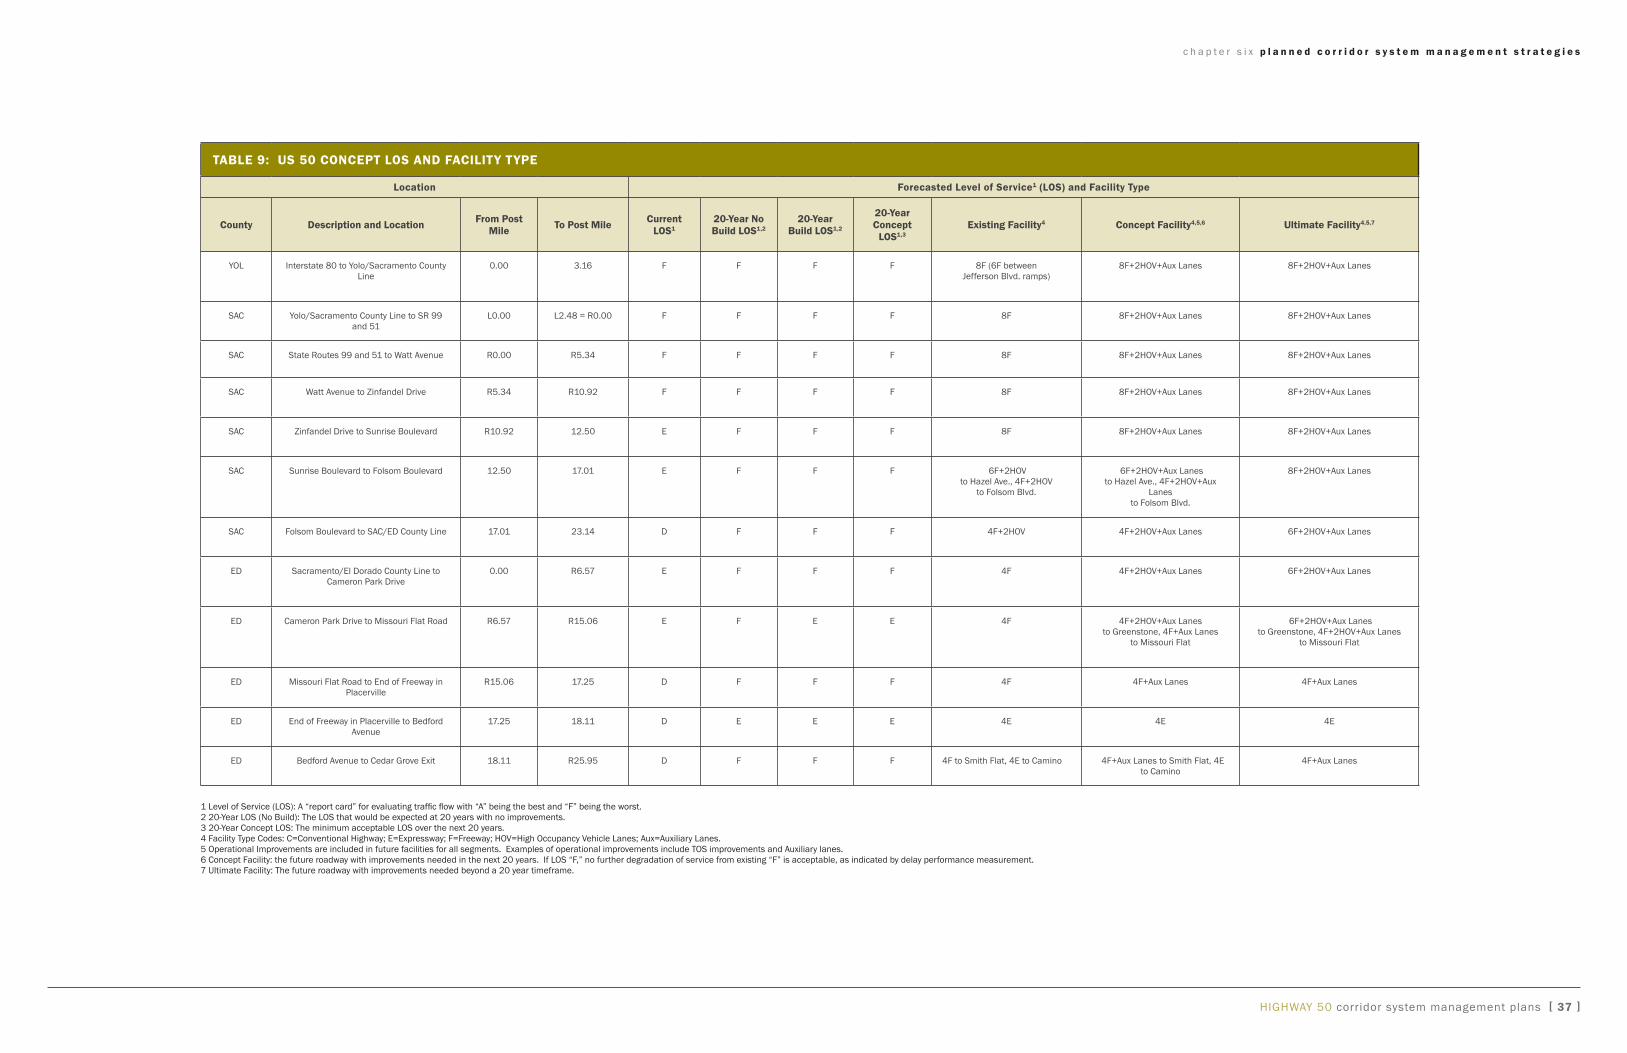
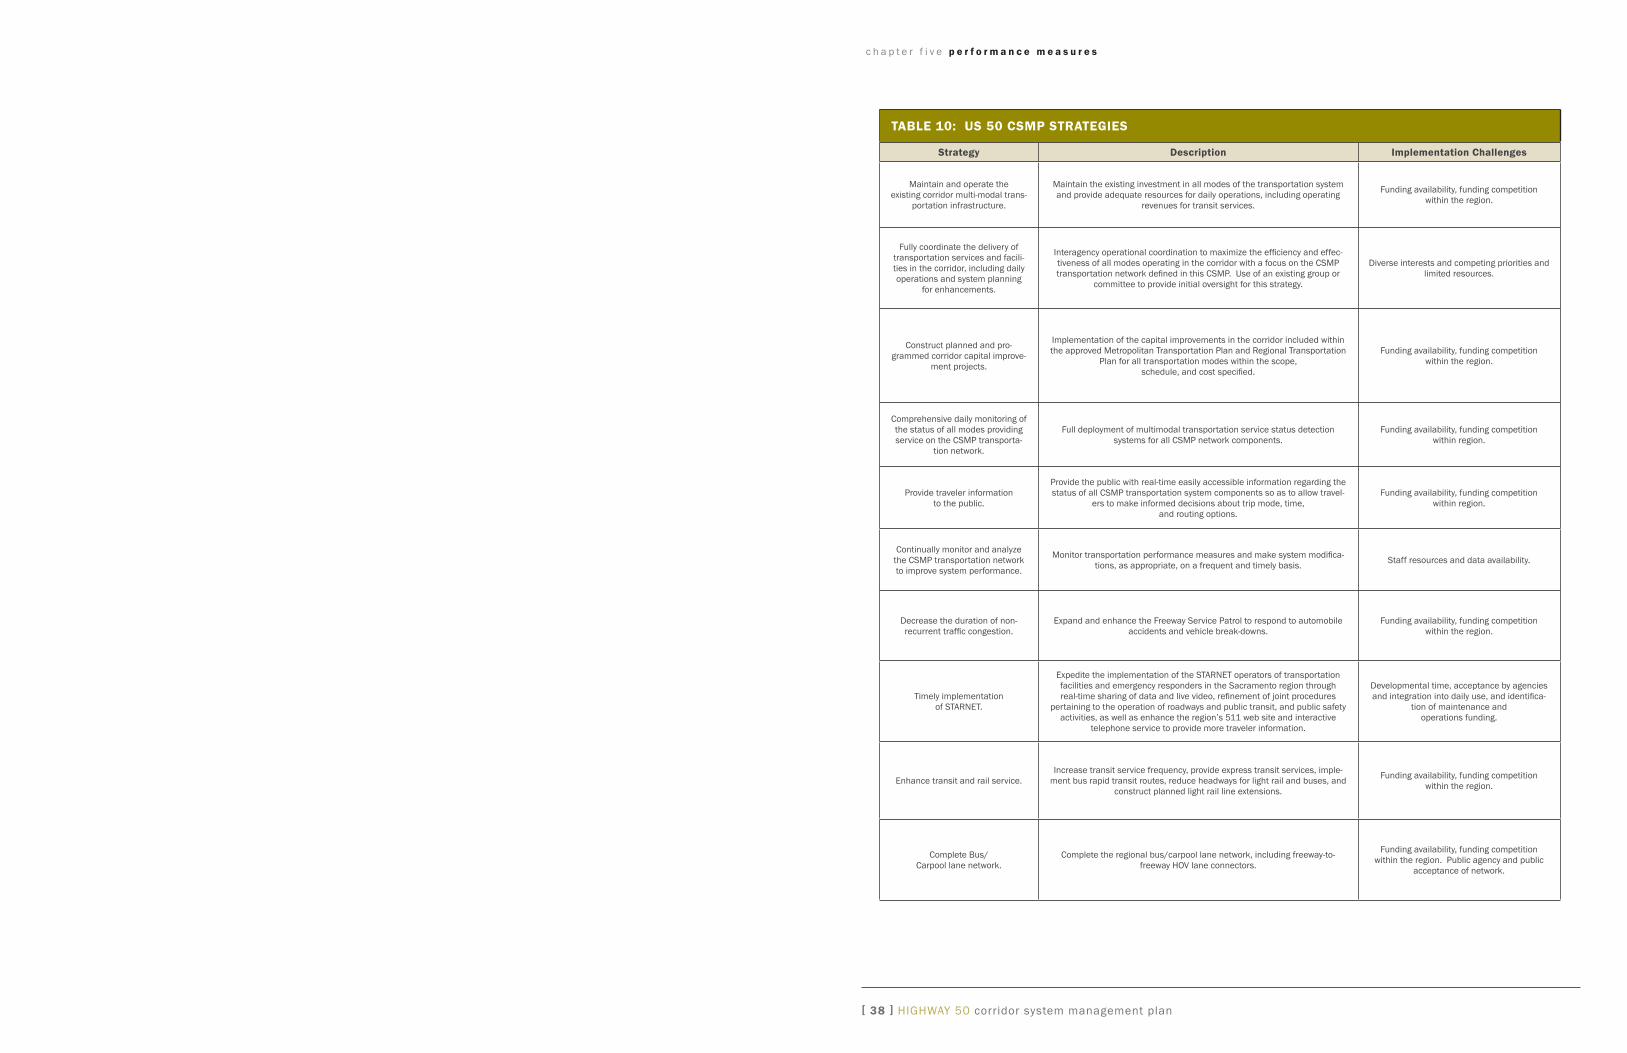
c h a p t e r s e v e n c o n g e s t i o n a n d b o t t l e n e c k a n a l y s i s
Bradshaw Road and Howe Avenue and major bottleneck
locations during the PM peak period are at Zinfandel Drive Routier Road Bradshaw Road Howe Avenue and Intershystate 5
Causalities for these bottlenecks range from high-traffic
demand (congestion) heavy weavingmerging areas or physical constraints such as lane drops lack of ramp meters incomplete HOV network incomplete Auxiliary Lane
network poorly coordinated traffic signals and an off-ramp
queue (Sunrise Boulevard) US 50 Westbound Onramp
TABLE 14 US 50 EASTBOUnD BOTTLEnECk SUmmARY Source PeMS Caltrans tach runs and
Cambridge Systematics field observations
bottleneck Location PeMS Speed Contours Caltrans Probe Vehicle Runs
Cause aM PM aM PM
A Jefferson Blvd PM 25 Minor Minor Traffic weaving truck volumes and grade
B 48th St PM 7 Minor Major Minor Minor Merge from SR 51 and SR 99
C Howe ave PM 9 Major Major Major weave between Howe and watt
D Mayhew Rd PM 12 Major Minor Major Weaving before Bradshaw Exit
E Routier Rd PM 14 Minor Major Weaving before Mather Field Rd Exit
F Sunrise Blvd PM 185 Minor Major Lane drop HOV add off-ramp queue
G Folsom Blvd PM 22 Minor Minor Lane drop 4 to 3
H El Dorado Hills Blvd PM 275 Major
Poorly coordinated traffic signal on arterial causes spillback onto freeway
a jefferson blvd bottleneck The bottleneck approximately located at Jefferson Blvd is due to weaving traffic as those entershying the freeway from Jefferson Blvd must cross those attempting to exit the freeway to I 5 There is a large number of trucks in the stream which struggle with the grade at this location exacerbatshying the bottleneck
[ 48 ] HigHway 50 corridor system management plan
c h a p t e r s e v e n c o n g e s t i o n a n d b o t t l e n e c k a n a l y s i s
b 48th St bottleneck The bottleneck approximately located at 48th St is due to the additional traffic merging from SR 51 and SR 99 combined with the eventual lane drop at 59th St This queue extends upstream past the off-ramp to SR 5199 These off-ramps are bottlenecks in themselves which spill back and choke the US 50 mainline
C Howe Ave Bottleneck The bottleneck at Howe ave is due to the entering traffic from Howe Ave Two Howe Ave on-ramps feed into US 50 eastbound southbound Howe ave loop on-ramp and northbound Howe ave direct ramp approximately 300 feet apart The watt avenue off-ramp is just down stream with heavy exiting volumes therefore the segment between Howe and watt is characterized by heavy weaving
D mayhew Rd Bottleneck The bottleneck approximately located at Mayhew Rd most likely begins with the additional traffic entering from Watt Ave and ends with the exiting traffic at Bradshaw Rd It is possible that there is a high proportion of weaving traffic with in this section (Watt Ave traffic moving to the left lane and those exiting at Bradshaw Rd moving to the right lane)
HigHway 50 corridor system management plan [ 49 ]
c h a p t e r s e v e n c o n g e s t i o n a n d b o t t l e n e c k a n a l y s i s
[ 50 ] HigHway 50 corridor system management plan
e routier rd bottleneck It is likely that the bottleneck at Routier Rd is due to the same merging conditions associated with Mayhew Rd The area is comprised of both residential and light industrialoffice land uses therefore during the PM peak period there are large volumes of vehicles entering at Bradshaw Rd moving to the left lanes and large volumes of vehicles moving to the right lane to exit at Mather Field Rd
f Sunrise blvd bottleneck At Sunrise Blvd the right-most lane exits while an HOV lane is added as the median lane The bottleneck is formed from vehicles shifting left to avoid exiting at Sunrise Blvd and to enter the HOV lane There is a large volume of vehicles queued at the Sunrise off-ramp which spills back and negatively affects the US 50 mainline
g folsom blvd bottleneck The right-most lane exits to Folsom Blvd leaving one HOV lane and two regular lanes along the US 50 The bottleneck is caused by this lane drop as well as the quick merge at the Folsom on-ramp
c h a p t e r s e v e n c o n g e s t i o n a n d b o t t l e n e c k a n a l y s i s
H The eastbound US 50 at El Dorado Hills Blvd Bottleneck The eastbound El Dorado Hills Blvd bottleneck is caused by a traffic signal on the arterial that often causes spillbacks on the EB loop offramp onto the freeway mainlines
TABLE 15 US 50 WESTBOUnD BOTTLEnECk SUmmARY Source PeMS Caltrans tach runs and Cambridge Systematics field observations
bottleneck Location PeMS Speed Contours Caltrans Probe Vehicle Runs
Cause aM PM aM PM
A El Dorado Hills Blvd PM 275 Major Poorly coordinated traffic
signal on El Dorado Hills Blvd
B Hazel Ave PM 21 Major Entering traffic
C Zinfandel Dr PM 16 Minor Major Major Major Entering traffic
D Routier Rd PM 14 Minor Major Minor Weaving traffic
E Bradshaw PM 13 Major Major Major Merging traffic and curve
F Howe Ave PM 9 Minor Major Major Major Weaving traffic and grade
G SR 51SR 99 PM 6 Minor Lane drop weaving traffic
H i-5 PM 3 Major Weaving traffic
HigHway 50 corridor system management plan [ 51 ]
c h a p t e r s e v e n c o n g e s t i o n a n d b o t t l e n e c k a n a l y s i s
[ 52 ] HigHway 50 corridor system management plan
A El Dorado Hills Blvd Bottleneck The minor bottleneck at El Dorado Hills Boulevard is caused by the traffic signal on El Dorado Hills Blvd that causes spillback on the westbound offramp onto the freeway mainlines
B Hazel Avenue Bottleneck In 2006 the Hazel Ave Bottleneck is caused by the traffic entering at both Hazel Ave and Folsom Blvd (the two on-ramps are separated by about one mile) The bottleneck that would appear at Folsom Blvd combines with the bottleneck at Hazel ave to form a large bottleneck that does not clear until after Hazel ave Sometimes causshying spillbacks as far as Prairies City Road this bottleneck was mitigated in 2007 as part of the GO CALIFORNIA program
C Zinfandel Dr Bottleneck There is heavy traffic coming from Sunrise Blvd but the lane addition immediately after the westbound on-ramp prevents a bottleneck from forming but as traffic flows westward the heavy traffic entering from Zinfandel Dr causes a bottleshyneck here
D Routier Rd Bottleneck The bottleneck at Routier Rd is caused by weaving traffic between Mather Field Rd and Bradshaw Rd This highway segment represents a transition area where vehicles that have been traveling in the left lanes begin to shift to the right lanes to exit while the entering traffic tries to shift to the left lanes
W eav in gLan e Dr o p
c h a p t e r s e v e n c o n g e s t i o n a n d b o t t l e n e c k a n a l y s i s
e bradshaw rd bottleneck The Bradshaw Rd bottleneck is caused by the entering traffic from Bradshaw Road the high truck volumes and the curve west of Bradshaw Two Bradshaw Rd on-ramps feed into US 50 westshybound southbound Bradshaw Rd direct on-ramp and northbound Bradshaw Rd loop on-ramp approximately 400 feet apart
F Howe Ave Bottleneck The Howe ave bottleneck is caused by a grade change and the weaving traffic entering from Howe ave and Hornet Dr competing for the right-most lane with those wanting to exit at 65th Street
G amp H SR 51SR 99 amp I-5 Bottleneck The bottleneck at I 5 is caused by the conflict between entering SR 99 and SR 51 traffic and exiting I-5 traffic as well as the queues formed on the ramps to i-5 which spill back onto US 50 The number of lanes in this section reaches a maximum of 6 and then drops to 4 as two lanes exit at the I-5 freeway This bottleneck is exacershybated during the peak periods when it stretches upstream to the lane drop before SR 99
W ea v in g
Lan e Dr o p
HigHway 50 corridor system management plan [ 53 ]
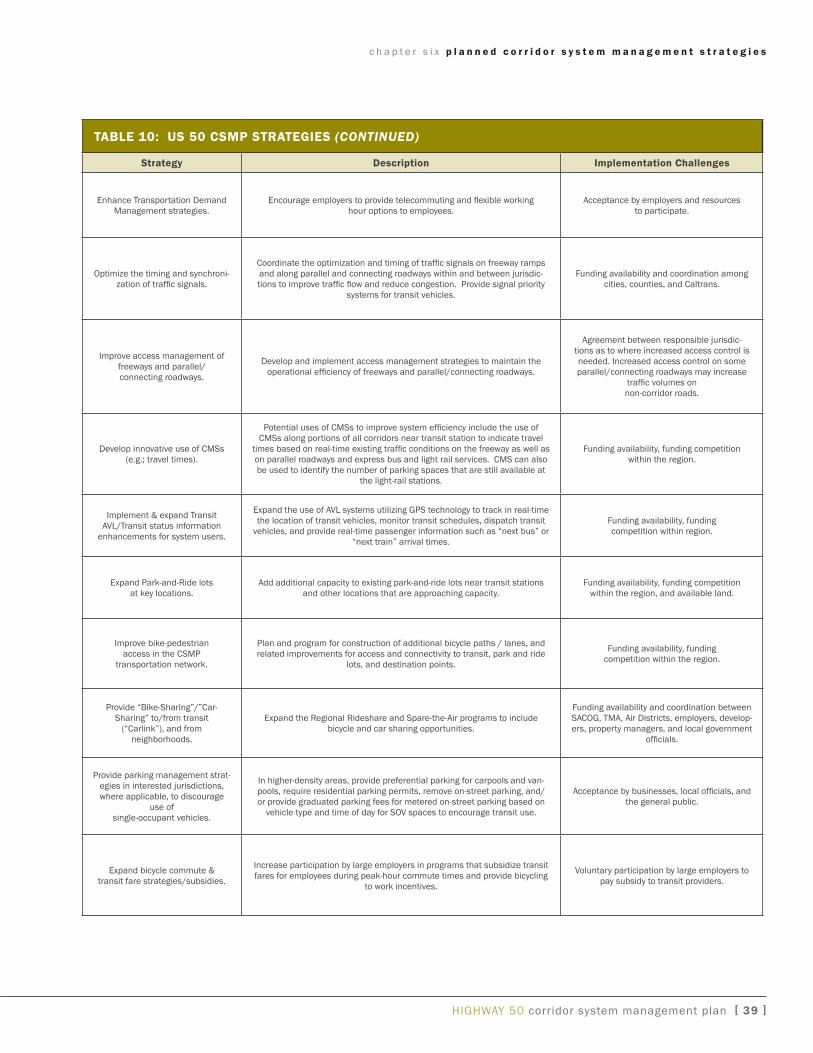
c h a p t e r s e v e n c o n g e s t i o n a n d b o t t l e n e c k a n a l y s i s
b 48th St bottleneck The bottleneck approximately located at 48th St is due to the additional traffic merging from SR 51 and SR 99 combined with the eventual lane drop at 59th St This queue extends upstream past the off-ramp to SR 5199 These off-ramps are bottlenecks in themselves which spill back and choke the US 50 mainline
C Howe Ave Bottleneck The bottleneck at Howe ave is due to the entering traffic from Howe Ave Two Howe Ave on-ramps feed into US 50 eastbound southbound Howe ave loop on-ramp and northbound Howe ave direct ramp approximately 300 feet apart The watt avenue off-ramp is just down stream with heavy exiting volumes therefore the segment between Howe and watt is characterized by heavy weaving
D mayhew Rd Bottleneck The bottleneck approximately located at Mayhew Rd most likely begins with the additional traffic entering from Watt Ave and ends with the exiting traffic at Bradshaw Rd It is possible that there is a high proportion of weaving traffic with in this section (Watt Ave traffic moving to the left lane and those exiting at Bradshaw Rd moving to the right lane)
HigHway 50 corridor system management plan [ 49 ]
c h a p t e r s e v e n c o n g e s t i o n a n d b o t t l e n e c k a n a l y s i s
[ 50 ] HigHway 50 corridor system management plan
e routier rd bottleneck It is likely that the bottleneck at Routier Rd is due to the same merging conditions associated with Mayhew Rd The area is comprised of both residential and light industrialoffice land uses therefore during the PM peak period there are large volumes of vehicles entering at Bradshaw Rd moving to the left lanes and large volumes of vehicles moving to the right lane to exit at Mather Field Rd
f Sunrise blvd bottleneck At Sunrise Blvd the right-most lane exits while an HOV lane is added as the median lane The bottleneck is formed from vehicles shifting left to avoid exiting at Sunrise Blvd and to enter the HOV lane There is a large volume of vehicles queued at the Sunrise off-ramp which spills back and negatively affects the US 50 mainline
g folsom blvd bottleneck The right-most lane exits to Folsom Blvd leaving one HOV lane and two regular lanes along the US 50 The bottleneck is caused by this lane drop as well as the quick merge at the Folsom on-ramp
c h a p t e r s e v e n c o n g e s t i o n a n d b o t t l e n e c k a n a l y s i s
H The eastbound US 50 at El Dorado Hills Blvd Bottleneck The eastbound El Dorado Hills Blvd bottleneck is caused by a traffic signal on the arterial that often causes spillbacks on the EB loop offramp onto the freeway mainlines
TABLE 15 US 50 WESTBOUnD BOTTLEnECk SUmmARY Source PeMS Caltrans tach runs and Cambridge Systematics field observations
bottleneck Location PeMS Speed Contours Caltrans Probe Vehicle Runs
Cause aM PM aM PM
A El Dorado Hills Blvd PM 275 Major Poorly coordinated traffic
signal on El Dorado Hills Blvd
B Hazel Ave PM 21 Major Entering traffic
C Zinfandel Dr PM 16 Minor Major Major Major Entering traffic
D Routier Rd PM 14 Minor Major Minor Weaving traffic
E Bradshaw PM 13 Major Major Major Merging traffic and curve
F Howe Ave PM 9 Minor Major Major Major Weaving traffic and grade
G SR 51SR 99 PM 6 Minor Lane drop weaving traffic
H i-5 PM 3 Major Weaving traffic
HigHway 50 corridor system management plan [ 51 ]
c h a p t e r s e v e n c o n g e s t i o n a n d b o t t l e n e c k a n a l y s i s
[ 52 ] HigHway 50 corridor system management plan
A El Dorado Hills Blvd Bottleneck The minor bottleneck at El Dorado Hills Boulevard is caused by the traffic signal on El Dorado Hills Blvd that causes spillback on the westbound offramp onto the freeway mainlines
B Hazel Avenue Bottleneck In 2006 the Hazel Ave Bottleneck is caused by the traffic entering at both Hazel Ave and Folsom Blvd (the two on-ramps are separated by about one mile) The bottleneck that would appear at Folsom Blvd combines with the bottleneck at Hazel ave to form a large bottleneck that does not clear until after Hazel ave Sometimes causshying spillbacks as far as Prairies City Road this bottleneck was mitigated in 2007 as part of the GO CALIFORNIA program
C Zinfandel Dr Bottleneck There is heavy traffic coming from Sunrise Blvd but the lane addition immediately after the westbound on-ramp prevents a bottleneck from forming but as traffic flows westward the heavy traffic entering from Zinfandel Dr causes a bottleshyneck here
D Routier Rd Bottleneck The bottleneck at Routier Rd is caused by weaving traffic between Mather Field Rd and Bradshaw Rd This highway segment represents a transition area where vehicles that have been traveling in the left lanes begin to shift to the right lanes to exit while the entering traffic tries to shift to the left lanes
W eav in gLan e Dr o p
c h a p t e r s e v e n c o n g e s t i o n a n d b o t t l e n e c k a n a l y s i s
e bradshaw rd bottleneck The Bradshaw Rd bottleneck is caused by the entering traffic from Bradshaw Road the high truck volumes and the curve west of Bradshaw Two Bradshaw Rd on-ramps feed into US 50 westshybound southbound Bradshaw Rd direct on-ramp and northbound Bradshaw Rd loop on-ramp approximately 400 feet apart
F Howe Ave Bottleneck The Howe ave bottleneck is caused by a grade change and the weaving traffic entering from Howe ave and Hornet Dr competing for the right-most lane with those wanting to exit at 65th Street
G amp H SR 51SR 99 amp I-5 Bottleneck The bottleneck at I 5 is caused by the conflict between entering SR 99 and SR 51 traffic and exiting I-5 traffic as well as the queues formed on the ramps to i-5 which spill back onto US 50 The number of lanes in this section reaches a maximum of 6 and then drops to 4 as two lanes exit at the I-5 freeway This bottleneck is exacershybated during the peak periods when it stretches upstream to the lane drop before SR 99
W ea v in g
Lan e Dr o p
HigHway 50 corridor system management plan [ 53 ]
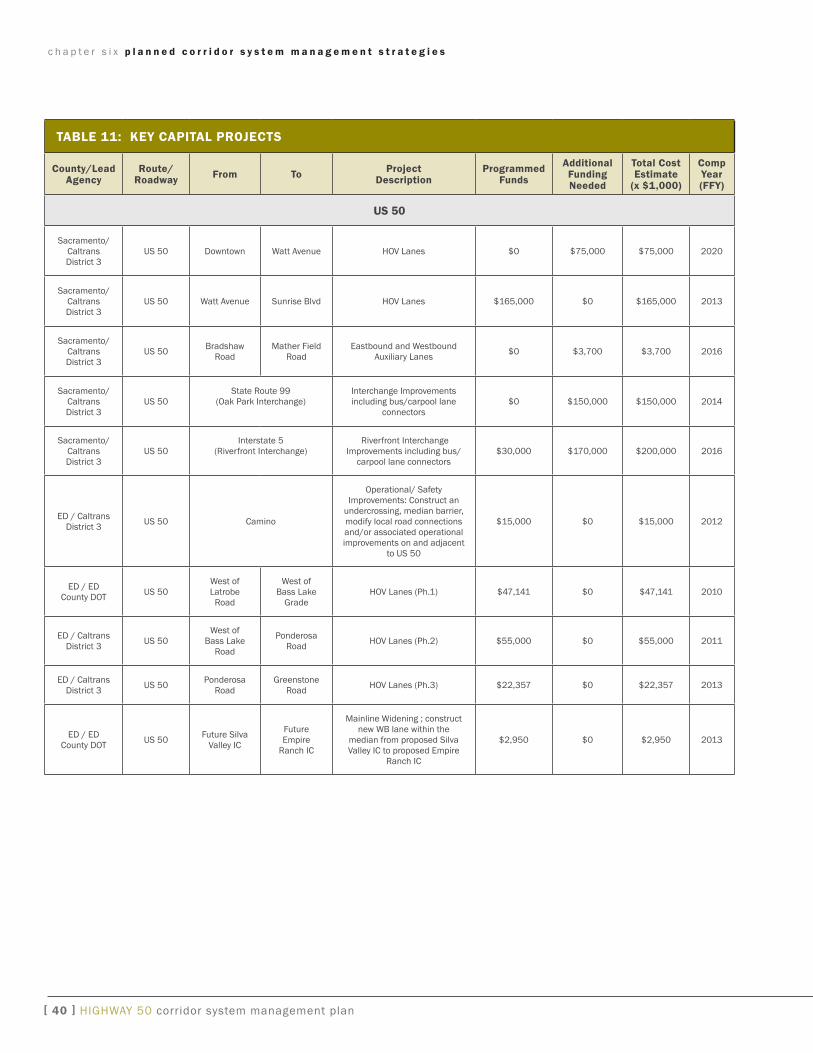
c h a p t e r s e v e n c o n g e s t i o n a n d b o t t l e n e c k a n a l y s i s
[ 50 ] HigHway 50 corridor system management plan
e routier rd bottleneck It is likely that the bottleneck at Routier Rd is due to the same merging conditions associated with Mayhew Rd The area is comprised of both residential and light industrialoffice land uses therefore during the PM peak period there are large volumes of vehicles entering at Bradshaw Rd moving to the left lanes and large volumes of vehicles moving to the right lane to exit at Mather Field Rd
f Sunrise blvd bottleneck At Sunrise Blvd the right-most lane exits while an HOV lane is added as the median lane The bottleneck is formed from vehicles shifting left to avoid exiting at Sunrise Blvd and to enter the HOV lane There is a large volume of vehicles queued at the Sunrise off-ramp which spills back and negatively affects the US 50 mainline
g folsom blvd bottleneck The right-most lane exits to Folsom Blvd leaving one HOV lane and two regular lanes along the US 50 The bottleneck is caused by this lane drop as well as the quick merge at the Folsom on-ramp
c h a p t e r s e v e n c o n g e s t i o n a n d b o t t l e n e c k a n a l y s i s
H The eastbound US 50 at El Dorado Hills Blvd Bottleneck The eastbound El Dorado Hills Blvd bottleneck is caused by a traffic signal on the arterial that often causes spillbacks on the EB loop offramp onto the freeway mainlines
TABLE 15 US 50 WESTBOUnD BOTTLEnECk SUmmARY Source PeMS Caltrans tach runs and Cambridge Systematics field observations
bottleneck Location PeMS Speed Contours Caltrans Probe Vehicle Runs
Cause aM PM aM PM
A El Dorado Hills Blvd PM 275 Major Poorly coordinated traffic
signal on El Dorado Hills Blvd
B Hazel Ave PM 21 Major Entering traffic
C Zinfandel Dr PM 16 Minor Major Major Major Entering traffic
D Routier Rd PM 14 Minor Major Minor Weaving traffic
E Bradshaw PM 13 Major Major Major Merging traffic and curve
F Howe Ave PM 9 Minor Major Major Major Weaving traffic and grade
G SR 51SR 99 PM 6 Minor Lane drop weaving traffic
H i-5 PM 3 Major Weaving traffic
HigHway 50 corridor system management plan [ 51 ]
c h a p t e r s e v e n c o n g e s t i o n a n d b o t t l e n e c k a n a l y s i s
[ 52 ] HigHway 50 corridor system management plan
A El Dorado Hills Blvd Bottleneck The minor bottleneck at El Dorado Hills Boulevard is caused by the traffic signal on El Dorado Hills Blvd that causes spillback on the westbound offramp onto the freeway mainlines
B Hazel Avenue Bottleneck In 2006 the Hazel Ave Bottleneck is caused by the traffic entering at both Hazel Ave and Folsom Blvd (the two on-ramps are separated by about one mile) The bottleneck that would appear at Folsom Blvd combines with the bottleneck at Hazel ave to form a large bottleneck that does not clear until after Hazel ave Sometimes causshying spillbacks as far as Prairies City Road this bottleneck was mitigated in 2007 as part of the GO CALIFORNIA program
C Zinfandel Dr Bottleneck There is heavy traffic coming from Sunrise Blvd but the lane addition immediately after the westbound on-ramp prevents a bottleneck from forming but as traffic flows westward the heavy traffic entering from Zinfandel Dr causes a bottleshyneck here
D Routier Rd Bottleneck The bottleneck at Routier Rd is caused by weaving traffic between Mather Field Rd and Bradshaw Rd This highway segment represents a transition area where vehicles that have been traveling in the left lanes begin to shift to the right lanes to exit while the entering traffic tries to shift to the left lanes
W eav in gLan e Dr o p
c h a p t e r s e v e n c o n g e s t i o n a n d b o t t l e n e c k a n a l y s i s
e bradshaw rd bottleneck The Bradshaw Rd bottleneck is caused by the entering traffic from Bradshaw Road the high truck volumes and the curve west of Bradshaw Two Bradshaw Rd on-ramps feed into US 50 westshybound southbound Bradshaw Rd direct on-ramp and northbound Bradshaw Rd loop on-ramp approximately 400 feet apart
F Howe Ave Bottleneck The Howe ave bottleneck is caused by a grade change and the weaving traffic entering from Howe ave and Hornet Dr competing for the right-most lane with those wanting to exit at 65th Street
G amp H SR 51SR 99 amp I-5 Bottleneck The bottleneck at I 5 is caused by the conflict between entering SR 99 and SR 51 traffic and exiting I-5 traffic as well as the queues formed on the ramps to i-5 which spill back onto US 50 The number of lanes in this section reaches a maximum of 6 and then drops to 4 as two lanes exit at the I-5 freeway This bottleneck is exacershybated during the peak periods when it stretches upstream to the lane drop before SR 99
W ea v in g
Lan e Dr o p
HigHway 50 corridor system management plan [ 53 ]
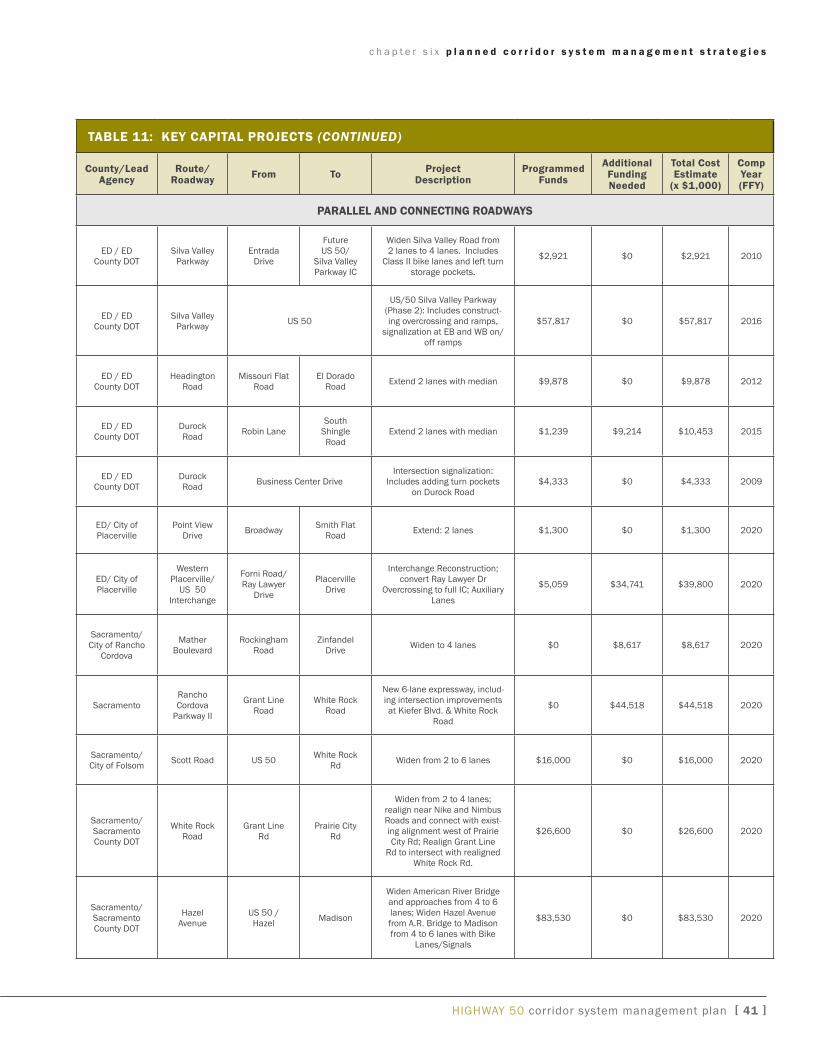
c h a p t e r s e v e n c o n g e s t i o n a n d b o t t l e n e c k a n a l y s i s
H The eastbound US 50 at El Dorado Hills Blvd Bottleneck The eastbound El Dorado Hills Blvd bottleneck is caused by a traffic signal on the arterial that often causes spillbacks on the EB loop offramp onto the freeway mainlines
TABLE 15 US 50 WESTBOUnD BOTTLEnECk SUmmARY Source PeMS Caltrans tach runs and Cambridge Systematics field observations
bottleneck Location PeMS Speed Contours Caltrans Probe Vehicle Runs
Cause aM PM aM PM
A El Dorado Hills Blvd PM 275 Major Poorly coordinated traffic
signal on El Dorado Hills Blvd
B Hazel Ave PM 21 Major Entering traffic
C Zinfandel Dr PM 16 Minor Major Major Major Entering traffic
D Routier Rd PM 14 Minor Major Minor Weaving traffic
E Bradshaw PM 13 Major Major Major Merging traffic and curve
F Howe Ave PM 9 Minor Major Major Major Weaving traffic and grade
G SR 51SR 99 PM 6 Minor Lane drop weaving traffic
H i-5 PM 3 Major Weaving traffic
HigHway 50 corridor system management plan [ 51 ]
c h a p t e r s e v e n c o n g e s t i o n a n d b o t t l e n e c k a n a l y s i s
[ 52 ] HigHway 50 corridor system management plan
A El Dorado Hills Blvd Bottleneck The minor bottleneck at El Dorado Hills Boulevard is caused by the traffic signal on El Dorado Hills Blvd that causes spillback on the westbound offramp onto the freeway mainlines
B Hazel Avenue Bottleneck In 2006 the Hazel Ave Bottleneck is caused by the traffic entering at both Hazel Ave and Folsom Blvd (the two on-ramps are separated by about one mile) The bottleneck that would appear at Folsom Blvd combines with the bottleneck at Hazel ave to form a large bottleneck that does not clear until after Hazel ave Sometimes causshying spillbacks as far as Prairies City Road this bottleneck was mitigated in 2007 as part of the GO CALIFORNIA program
C Zinfandel Dr Bottleneck There is heavy traffic coming from Sunrise Blvd but the lane addition immediately after the westbound on-ramp prevents a bottleneck from forming but as traffic flows westward the heavy traffic entering from Zinfandel Dr causes a bottleshyneck here
D Routier Rd Bottleneck The bottleneck at Routier Rd is caused by weaving traffic between Mather Field Rd and Bradshaw Rd This highway segment represents a transition area where vehicles that have been traveling in the left lanes begin to shift to the right lanes to exit while the entering traffic tries to shift to the left lanes
W eav in gLan e Dr o p
c h a p t e r s e v e n c o n g e s t i o n a n d b o t t l e n e c k a n a l y s i s
e bradshaw rd bottleneck The Bradshaw Rd bottleneck is caused by the entering traffic from Bradshaw Road the high truck volumes and the curve west of Bradshaw Two Bradshaw Rd on-ramps feed into US 50 westshybound southbound Bradshaw Rd direct on-ramp and northbound Bradshaw Rd loop on-ramp approximately 400 feet apart
F Howe Ave Bottleneck The Howe ave bottleneck is caused by a grade change and the weaving traffic entering from Howe ave and Hornet Dr competing for the right-most lane with those wanting to exit at 65th Street
G amp H SR 51SR 99 amp I-5 Bottleneck The bottleneck at I 5 is caused by the conflict between entering SR 99 and SR 51 traffic and exiting I-5 traffic as well as the queues formed on the ramps to i-5 which spill back onto US 50 The number of lanes in this section reaches a maximum of 6 and then drops to 4 as two lanes exit at the I-5 freeway This bottleneck is exacershybated during the peak periods when it stretches upstream to the lane drop before SR 99
W ea v in g
Lan e Dr o p
HigHway 50 corridor system management plan [ 53 ]
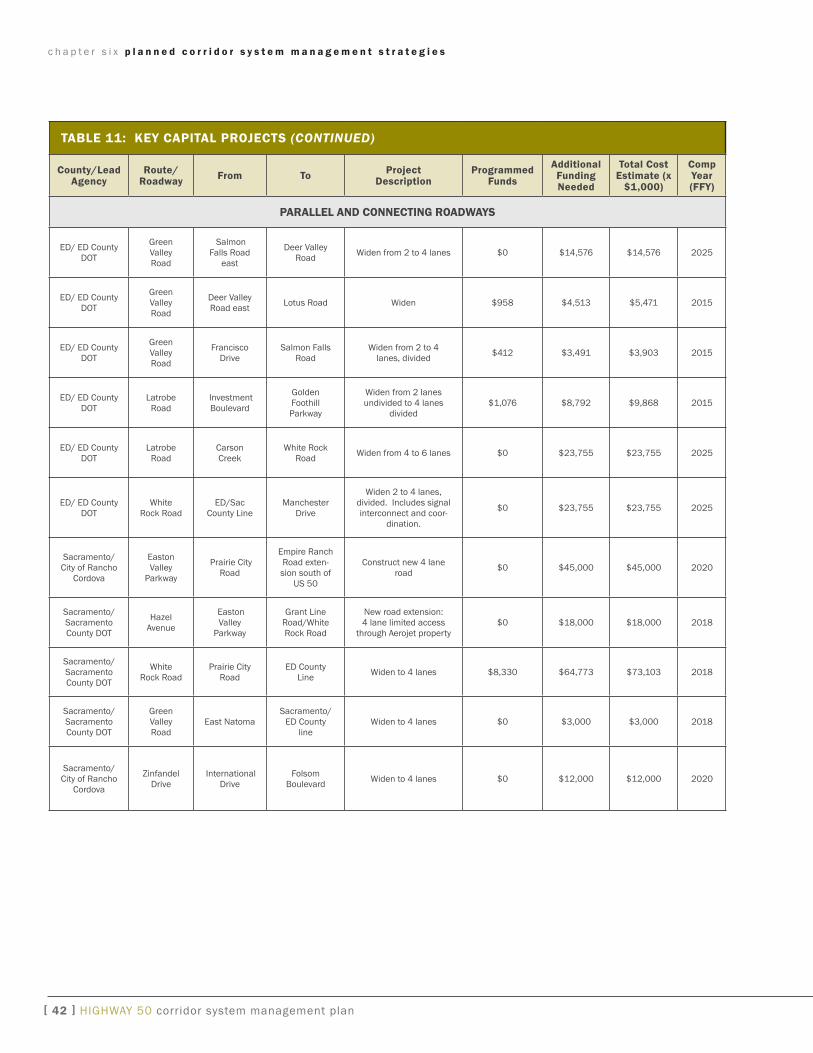
c h a p t e r s e v e n c o n g e s t i o n a n d b o t t l e n e c k a n a l y s i s
[ 52 ] HigHway 50 corridor system management plan
A El Dorado Hills Blvd Bottleneck The minor bottleneck at El Dorado Hills Boulevard is caused by the traffic signal on El Dorado Hills Blvd that causes spillback on the westbound offramp onto the freeway mainlines
B Hazel Avenue Bottleneck In 2006 the Hazel Ave Bottleneck is caused by the traffic entering at both Hazel Ave and Folsom Blvd (the two on-ramps are separated by about one mile) The bottleneck that would appear at Folsom Blvd combines with the bottleneck at Hazel ave to form a large bottleneck that does not clear until after Hazel ave Sometimes causshying spillbacks as far as Prairies City Road this bottleneck was mitigated in 2007 as part of the GO CALIFORNIA program
C Zinfandel Dr Bottleneck There is heavy traffic coming from Sunrise Blvd but the lane addition immediately after the westbound on-ramp prevents a bottleneck from forming but as traffic flows westward the heavy traffic entering from Zinfandel Dr causes a bottleshyneck here
D Routier Rd Bottleneck The bottleneck at Routier Rd is caused by weaving traffic between Mather Field Rd and Bradshaw Rd This highway segment represents a transition area where vehicles that have been traveling in the left lanes begin to shift to the right lanes to exit while the entering traffic tries to shift to the left lanes
W eav in gLan e Dr o p
c h a p t e r s e v e n c o n g e s t i o n a n d b o t t l e n e c k a n a l y s i s
e bradshaw rd bottleneck The Bradshaw Rd bottleneck is caused by the entering traffic from Bradshaw Road the high truck volumes and the curve west of Bradshaw Two Bradshaw Rd on-ramps feed into US 50 westshybound southbound Bradshaw Rd direct on-ramp and northbound Bradshaw Rd loop on-ramp approximately 400 feet apart
F Howe Ave Bottleneck The Howe ave bottleneck is caused by a grade change and the weaving traffic entering from Howe ave and Hornet Dr competing for the right-most lane with those wanting to exit at 65th Street
G amp H SR 51SR 99 amp I-5 Bottleneck The bottleneck at I 5 is caused by the conflict between entering SR 99 and SR 51 traffic and exiting I-5 traffic as well as the queues formed on the ramps to i-5 which spill back onto US 50 The number of lanes in this section reaches a maximum of 6 and then drops to 4 as two lanes exit at the I-5 freeway This bottleneck is exacershybated during the peak periods when it stretches upstream to the lane drop before SR 99
W ea v in g
Lan e Dr o p
HigHway 50 corridor system management plan [ 53 ]
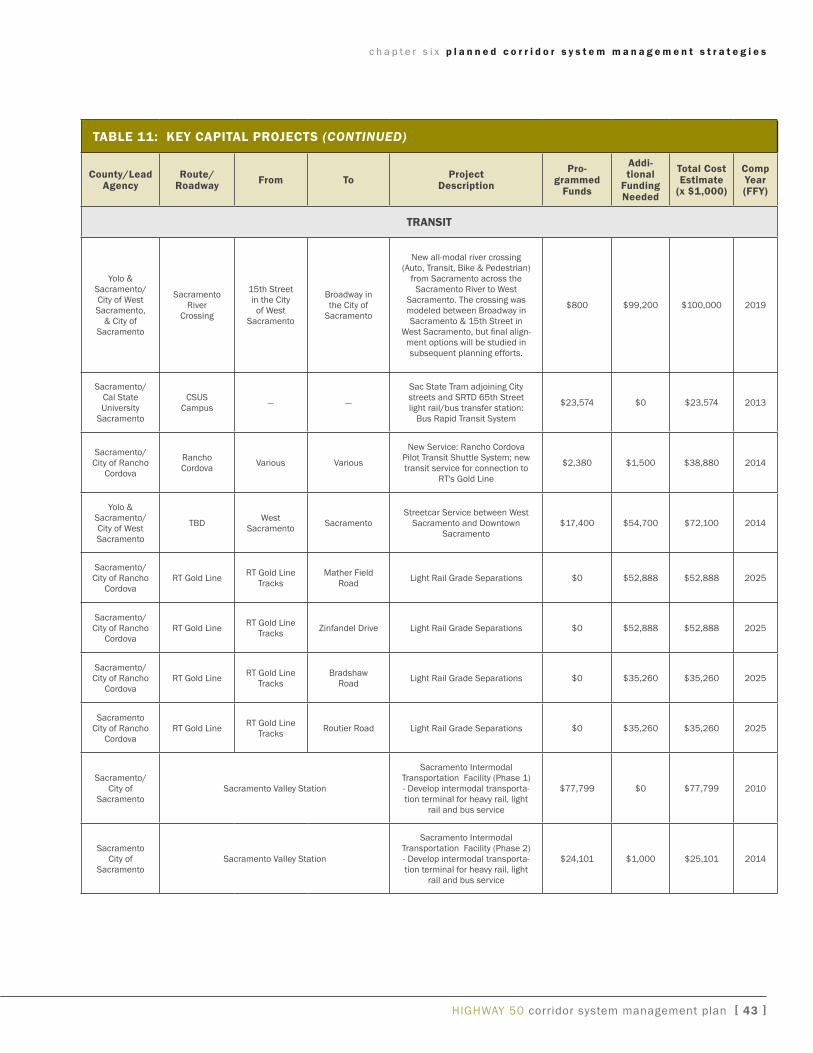