High=speed %Yind
81
- [A kg° & rffo ?~e. P~585 MINISTRY OF SUPPLY AERONAUTICAL RESEARCH COUNCIL REPORTS AND MEMORANDA k k.... .............. ,,t ,| ;'{ ' " " ~ "' f' L ~[ N LONDON ~ HIS MAJESTY'S STATIONERY OFFICE x95~ High=speed %Yind<unne~ ~ests on ModeJls ef Four 8ing][e=engined ~ighters (5pitir% 8pite£@~ Attacker and Mustang) Parts x- 5 By The Staff of the R.A.Eo High Speed Wind Tunnel Edited by W.Ao MAxR, MoA.
Transcript of High=speed %Yind
- [A
kg° & rffo ?~e. P~585
MINISTRY OF SUPPLY
AERONAUTICAL RESEARCH COUNCIL
REPORTS AND M E M O R A N D A
k k.... . . . . . . . . . . . . . . , , t , |
;'{ ' " " ~ "' f' L ~[ N
LONDON ~ HIS MAJESTY'S STATIONERY OFFICE
x95~
High=speed %Yind<unne~ ~ests on ModeJls ef Four 8ing][e=engined ~ighters
(5pitir% 8pite£@~ Attacker and Mustang) Parts x - 5
By The Staff of the R.A.Eo High Speed Wind Tunnel
Edited by W.Ao MAxR, MoA.

: , . q , - . . : - .
High-speed Wind-tunnel Tests,on Models of Four Single-engined Fighters
(Spitfire, Spiteful, Attacker and Mustang)
Part I
Tests on the Spitfire I B)
W. A. MaIR, M.A., S. P. HtSVTON, M.Eng. and H. E. GAMBLE, B.Sc.
Part II
Tests on the Spiteful (F. I/4. 3) By
W. A. MAIR, M.A., S. P. HIJTTON, M.Eng. and H. E. GAMBLE, B.Sc.
Part III
Tests on Cabins for the Spiteful By
W. A. Maltt, M.A. and S. P. HUTTON, M.Eng. ,~,~£.. -7. ~ q .~ f~q~ -r ~ 0.~c~ r"-~.:-~-(
Part IV
Tests on the Attacker (E. I O/+4)
S. P. HUTTON, M.Eng., D. A. CLattI% B.Sc. (Eng.), A.C.G.I. and D. J. TR~ML~*% B.Sc, (Eng.), A.C.G.I.
Part V
Tests on the Mustang I By
J. Y. G. Evans, B.Sc., J. C4LnW~LL , B.Sc., Wh.Sch., A.M.I.Mech.E. and C. M. BRITLAND
'l~t~ t~ ' .~7,o"Z c~,,a- e fZ~..>ic Oa_...--o ~ o %
i - ' t ~ - . . . . . ~ 4 . : . _ . ~ . ~ _ _ . , ~ j ~ . t ' r " "!1
/~, !.,> ..... ~"'i ..... I ! ,l Ip} i~", sr ~, ,,< '

High.speed Wind-tunnel Tests on Models of Single-engined Fighters
(Spitfire, Spiteful, Attacker and Mustang) By
The Staff of t h e R.A.E. H i g h Speed Wind Tunne l
Four
COMMUNICATED BY THE PRINCIPAL DIRECTOR OF SCIENTIFIC RESEARCH (AIR),
MINISTRY OF SUPPLY
Reports and Memoranda No. 2535"
April I945
Summary.--This report describes measurements of lift, drag, and pitching moment made in tile R.A.E. High Speed Wind Tunnel on models of the Spitfire, Spiteful (F.1/43), Attacker (E.10/44), and Mustang. On the Spiteful model, pressure distributions on the front radiator flap were also measured. An introduction (written in 1949) gives a general account of the tests described in the separate parts of the report.
INTRODUCTION
1. Range of Tests.--Each model was tested f0r a range of incidences at a series of Much numbers up to about 0.8, and the wind-tunnel pressure was adjusted to keep the Reynolds number constant at a value of about 1 × 10 ~. Measurements were made on the model with and without tail, and for various elevator and taiIplane settings.
In addition to ~:hese high-speed tests, measurements were made at low Much numbers (less than 0.2) for a range of Reynolds numbers up to about 4 × 10 a. On the Spiteful model these also included tests of landing flaps.
2. Model Rig.---The models were made of teak; and were supported on two main struts under the wings and a third strut under the after end of the body which was used to alter incidence. These struts were mounted on a balance under the floor of the tunnel. The main struts were shielded by hollow streamlined guards for about two-thirds of their height from the floor. Two cross-bracing wires of oval section were connected from the tops of the struts to the balance to provide lateral rigidity.
The engine air flow on the j et-propelled Attacker was represented by open ducts. These gave a flow at the entry roughly appropriate to top-speed flight conditions. On the other models, the radiators for the piston engines were represented by slotted metal baffle plates in the ducts, arranged to give roughly the correct pressure drop for top-speed flight conditions.
* R.A.E. R.A.E. R.A.E. R.A.E. R.A.E.
Report No. Aero. 1810 (A.R.C. 6739)--received 24th May, 1943. Report No. Aero. 1908 (A.R.C. 7596)--received 4th April, 1944. Test Note No. Aero. 1247 (A.R.C. 7045)--received 15th September, 1943. Report No. Aero 2112 (A.R.C. 9559)~received 29th April, 1946. Report No. Aero. 2038 (A.R.C. 8707)--received 28th May, 1945.
2

3. Presentatio~¢ of Results.--The results of the tests are given in the form of diagrams of force, moment and pressure coefficients, the pitching moments being referred to the C.G. position as given for each aircraft. The conclusions for each series of tests are given at the ends of the separate parts of the report.
4. Correctio~s Applied.--The tunnel interference effect produced by the model lift has been allowed for by applying the usual corrections, modified for compressibility by the linear perturba- tion theory given by Goldstein and Young in 1943 (R. & M. 1909). For high-speed tests the so-called " blockage " correction is of greater impor~tance, because it involves a correction to the measured Mach number. For all the results given in this report except those in Part I, this correction was calculated by tile method given by Thorn in 1943 (R. & M. 2033), the order of the correction to Mach number being about + 0 . 0 3 at M==0.8, and negligible below M = 0 . 7 . Later work has indicated that this method underestimates the magnitude of the correction at Mach numbers above about 0.8.
In the case of the Spitfire tests described in P a r t I, this blockage correction was not applied when the original report was issued. The appropriate values of the correction, Which should be applied to all the results given in Part I, are as follows : -
Uncorrected Mach number . . . . 0.60 0.70 0- 75 0.78 0.80
Corrected Mach number . . . . 0.607 0. 712 0. 768 0.807 0-838
The strut support system described above introduces serious disturbances in the air flow over the model at high speeds. Various attempts have been made to aUow for these by measuring the effects of the struts, guards, and bracing wires; and then correcting the measured forces and moments. These methods are not now regarded as reliable (1949), and there is some uncertainty about the results of the tests for Mach numbers (corrected for blockage) above about 0.8. In the case of drag the difficulties are particularly serious, and results above M = 0 . 7 5 are unreliable.
The aathors consider that although some caution is needed in interpreting the results at high Mach numbers, useful comparisons can be made, provided that due regard is paid to the above limitations and their causes.
a2
Cv
CF
Cu
C~
CL MAX
CLT
Cm
C r,,o
LIST OF SYMBOLS
Tail plane lift-curve slope (dCLT:/d~z~)
Elevator effectiveness (dCLr/dv)
Drag coefficient
Normal-force coefficient for radiator flap
Hinge-moment coefficient for radiator flap
Lift coefficient, for wing or complete aircraft
Maximum lift coefficient
Tailplane lift coefficient
Pitching-moment coefficient
Pitching-moment coefficient at zero lift, .'for aircraft without tail
3 {92750) k 2
c; C
h.
M
P pl R
T.A.S.
V
C~ T
p
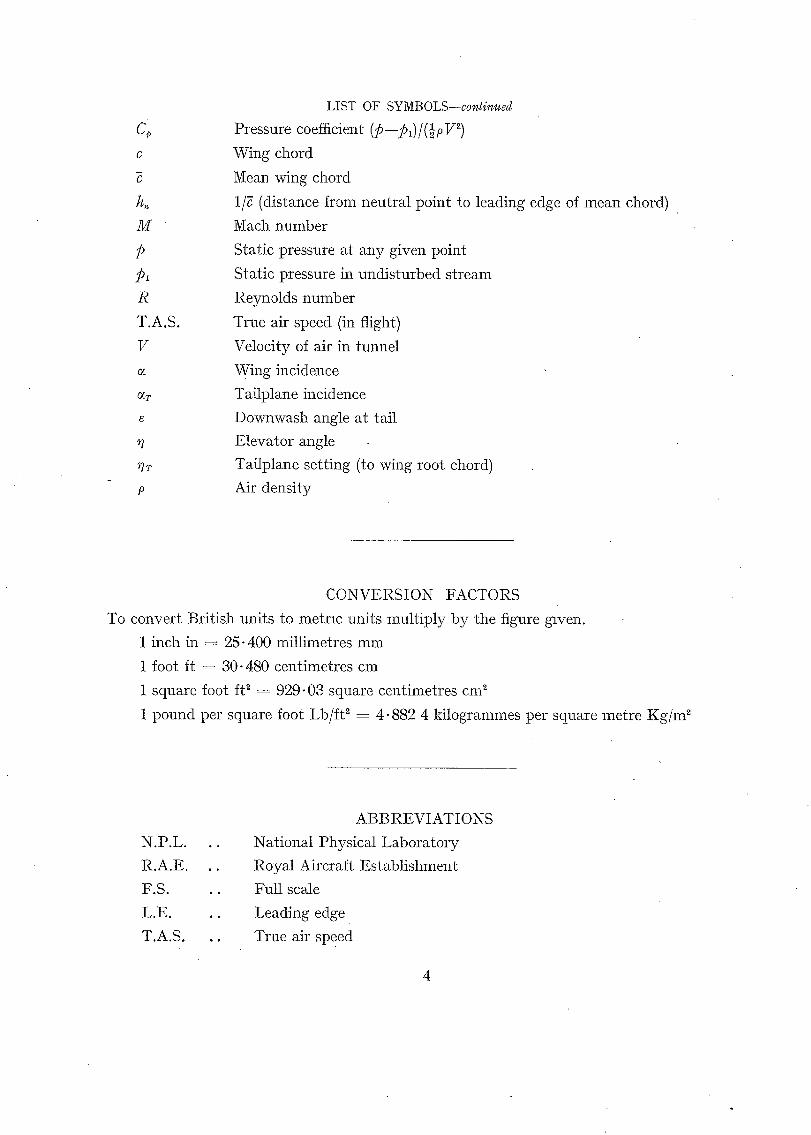
LIST OF SYMBOLS--continued Pressure coefficient (p--ill)/(½P V 2)
Wing chord
Mean wing chord
1/g (distance from neutral point to leading edge of mean chord)
Mach number
Static pressure at any given point
Static pressure in undisturbed stream
Reynolds number
True air speed (in flight)
Velocity of air in tunnel
Wing incidence
Tailplane incidence
Downwash angle at tail
Elevator angle
Tailplane setting (to wing root chord)
Air density
CONVERSION FACTORS
To convert British units to metric units multiply by the figure gzven.
1 inch in = 25-400 millimetres mm
1 foot ft = 30-480 centimetres cm
1 square foot It ~ = 929.03 square centimetres cm 2
1 pound per square foot Lb/ft 2 ---- 4.882 4 kilogrammes per square metre Kg/m ~
N.P.L.
R.A.E.
F.S.
L.E.
T.A.S.
• I
0 O
D O
Q g
O
ABBREVIATIONS
National Physical Laboratory
Royal Aircraft Establishment
Full scale
I.ead~ng edge
True air speed
4

P A R T I
Tests on the Spitfire I By
W. A. MAIR, M.A., S. P. HUTTON, B.Eng., and H. E. GAMBLE, B.Sc.
1. Introduction.--Flight tests 1 on a Spitfire at high speeds have shown no important changes of trim or stability at Mach numbers up to 0.775, but a large increase of drag* was found at Mach numbers above about 0.7.
High-speed tunnel tests were required to provide further information on the characteristics of the Spitfire at high speeds and for comparison with measurements made in flight.
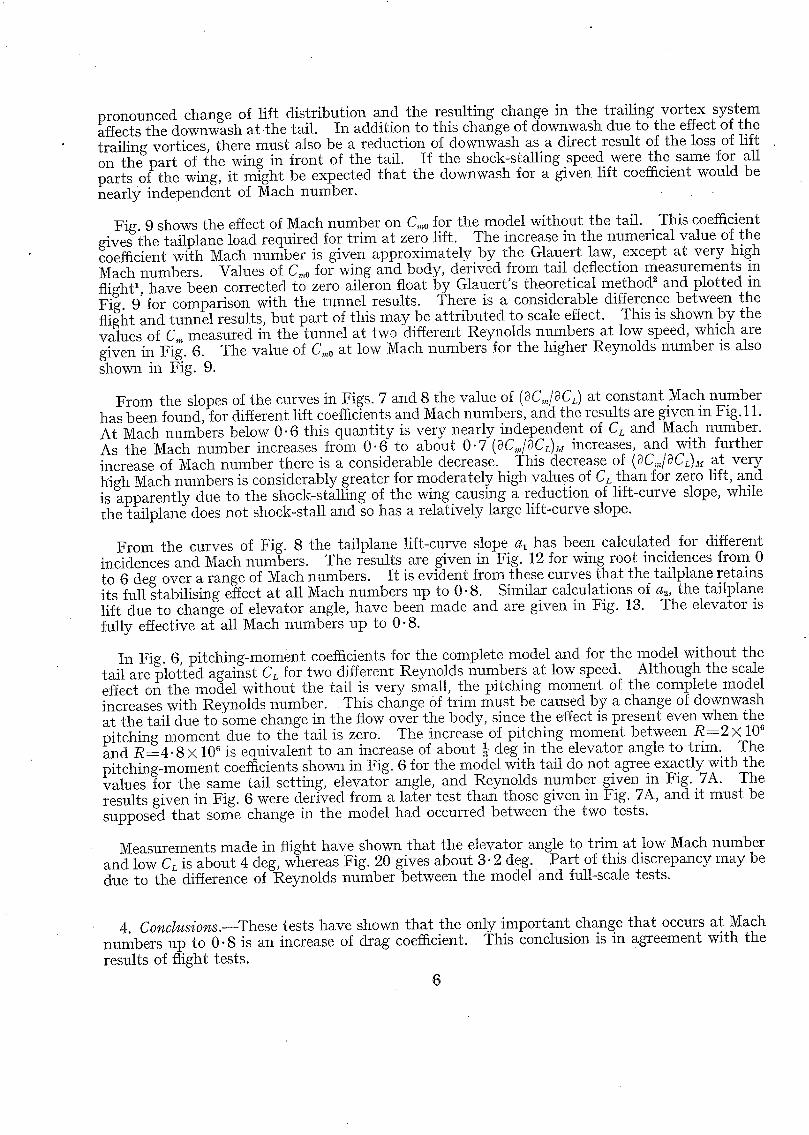
2. Details of Model.--The tests were made on a { scale model Spitfire I. Model and full-scale dimensions are given in Table 1, and the general arrangement of the model is shown in Fig. 1.
3. Results.--In presenting the results of the tests all incidences refer to the wing root chord.
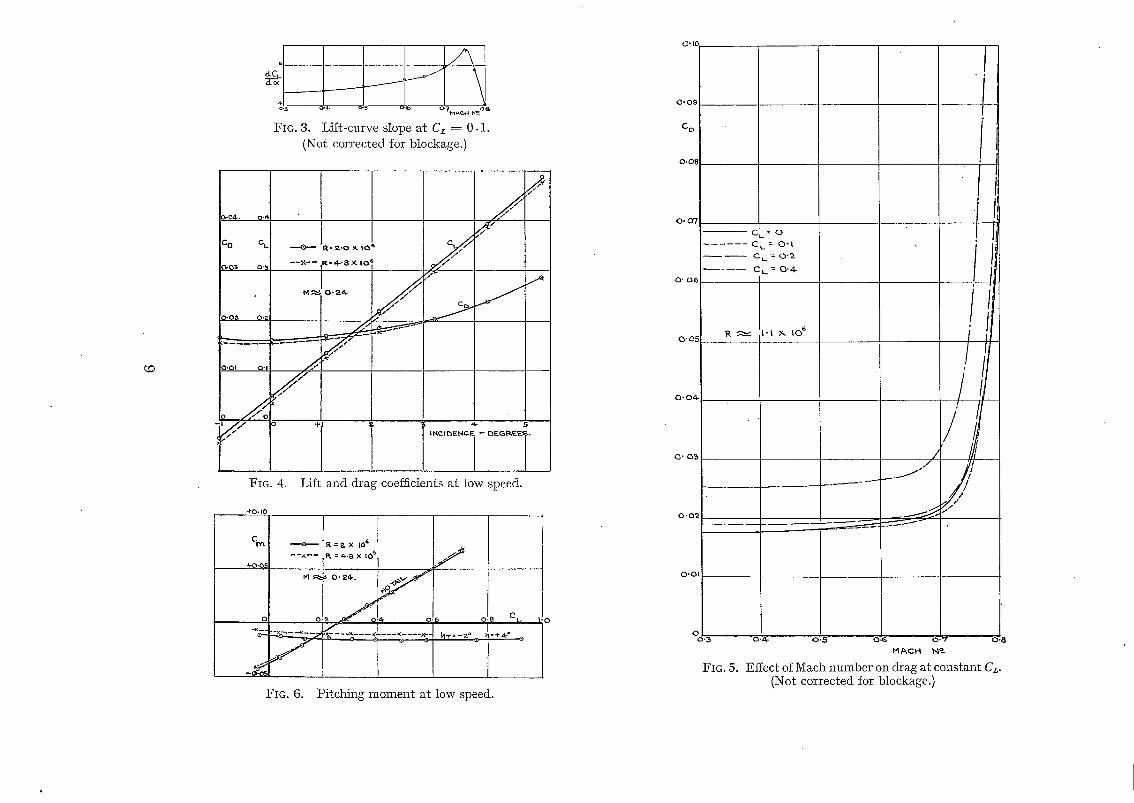
,3.1. Lift.--The variation of trimmed lift coefficient with incidence and Mach number is shown in the form of a lift carpet in Fig. 2. Fig. 3 shows the variation of lift-curve slope with Mach number for a lift coefficient of 0.1. The lift-curve slope increases with Mach number up to about 0.75, then falls off rapidly with further increase of Mach number.
Fig. 4 shows values of CL and Ca for the complete model at a low Mach number, pIotted against incidence for two different Reynolds numbers. There is no appreciable scale effect on lift-curve slope, but the no-lift angle appears to be about 0.1 deg greater at R = 4 . 8 × 10 ~ than at R = 2 × 10".
3.2. Drag.--Fig. 5 shows the variation of drag coefficient with Mach number for four different values of CL. These curves show that the drag critical Mach number is greatest at a lift coefficient of about 0.1. At this value of CL the drag coefficient at M = 0 . 7 is about 18 per cent greater than at low speed.
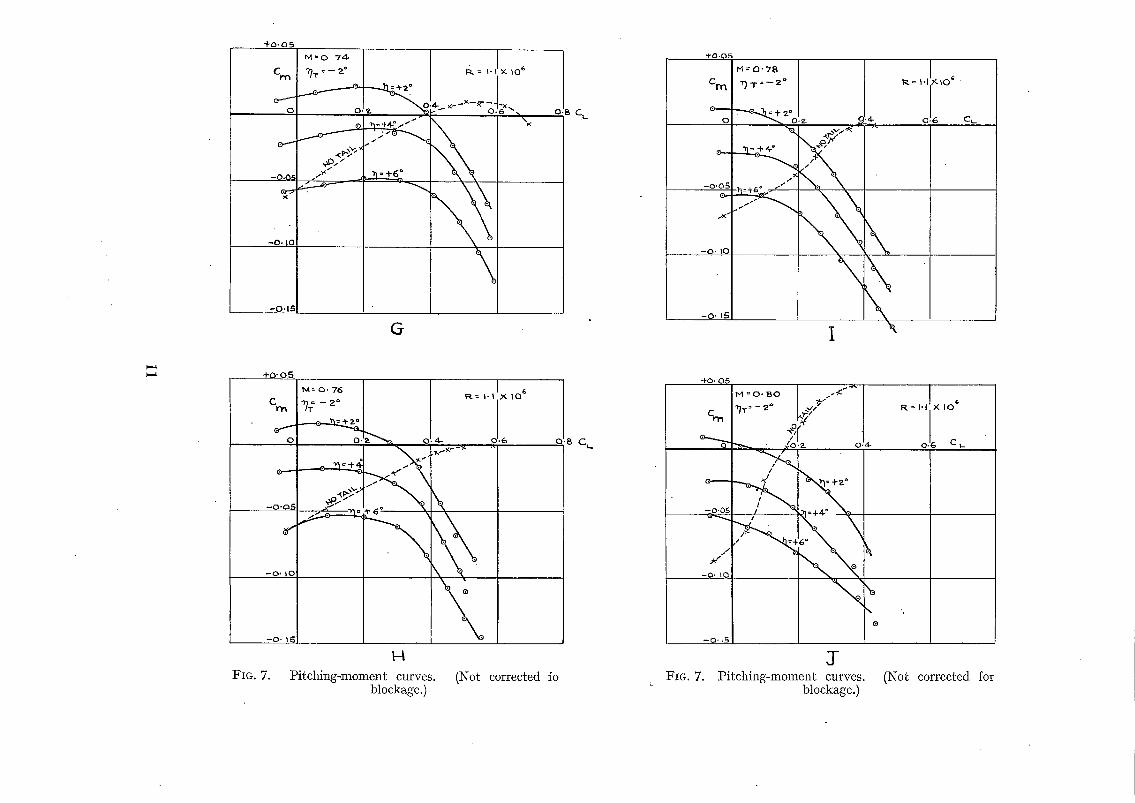
3.3. Longitudinal Stability and Trim.--Figs. 7 and 8 show pitching-moment coefficients plotted against lift coefficients (untrimmed) for different Mach numbers, tail settings and elevator angles.
In Figs. 15 and 16 pitching-moment coefficients are plotted against Mach number for several different values of CL, with and without the tail, Figs. 10 and 14 show elevator angle to trim and downwash angle at the tail respectively, plotted against Mach number. I t can be seen from Figs. 10 and 15 that the change of trim with N£ach number is smallest at zero lift, and is then only about ½ deg of elevator angle at a Mach number of 0.79. Even at higher lift coefficients the change of trim is not dangerously large, at least for Mach numbers up to about 0.8. Com- parison of Figs. 15 and 16 shows that at high Mach numbers and moderate lift coefficients there is a large negative pitching moment due to the tail. This effect is due part ly to the reduction of main-plane lift-curve slope, causing an increase of incidence for a given value of CL, and part ly to the reduction of downwash at the tail at high Mach numbers, as shown by Fig. 14.
The large reduction of downwash at high Mach numbers is probably due to the gradual spread- ing of the shock stall along the wing from root to tip. B~cause of the wash-out and change of thickness along the wing the critical speed at the root is less than at the tip, so that there is a
* Later flight tests, using improved methods, have shown that the drag of the Spitfire does not increase appreciably until much higher Mach numbers are reached.
5
pronounced change of lift distribution and the resulting change in the trailing vortex system affects the downwash at.the tail. In addition to this change of downwash due to the effect of the trailing vortices, there must also be a reduction of downwash as a direct result of the loss of lift on the part of the wing in front of the tail. If the shock-stalling speed were the same for all parts of the wing, it might be expected that the downwash for a given lift coefficient would be nearly independent of Mach number.
Fig. 9 shows the effect of Mach number on C,,,o for the model without the taft. This coefficient gives the tailplane load required for trim at zero lift. The increase in the numerical value of the coefficient with Mach number is given approximately by the Glauert law, except at very high Mach numbers. Values of C,,0 for wing and body, derived from tail deflection measurements in flight 1, have been corrected to zero aileron float by Glauert's theoretical method s and plotted in Fig. 9 for comparison with the tunnel results. There is a considerable difference between the flight and tunnel results, but part of this may be at tr ibuted to scale effect. This is shown by the values of C,,~ measured in the tunnel at two different Reynolds numbers at low speed, which are given in Fig. 6. The value of C,,~0 at low Mach numbers for the higher Reynolds number is also shown in Fig. 9.
From the slopes of the curves in Figs. 7 and 8 the value of (~C,,/~CL) at constant Nach number has been found, for different lift coefficients and Nach numbers, and the results are given in Fig. 11. At Mach numbers below 0.6 this quant i ty is very nearly independent of CL and Mach number. As the Nach number increases from 0.6 to about 0-7 (~C,,/~CL)M increases, and with further increase of Mach number there is a considerable decrease. This decrease of (~C,JOCL)M at very high Mach numbers is considerably greater for moderately high values of CL than for zero lift, and is apparently due to the shock-stalling of the wing causing a reduction of lift-curve slope, while the tailplane does not shock-stall and so has a relatively large lift-curve slope.
From the curves of Fig. 8 the tailplane lift-curve slope at has been calculated for different incidences and Mach numbers. The results are given in Fig. 12 for wing root incidences from 0 to 6 deg over a range of Mach numbers. I t is evident from these curves that the tailplane retains its full stabilising effect at all Mach numbers up to 0" 8. Similar calculations of a,., the tailplane lift due to change of elevator angle, have been made and are given in Fig. 13. The elevator is fully effective at all Mach numbers up to 0-8.
In Fig. 6, pitching-moment coefficients for the complete model and for the model without the tail are plotted against CL for two different Reynolds numbers at low speed. Although the scale effect on the model without the tail is very small, the pitching moment of the complete model increases with Reynolds number. This change of trim must be caused by a change of downwash at the tail due to some change in the flow over the body, since the effect is present even when the pitching moment due to the tail is zero. The increase of pitching moment between R = 2 × 10⁶ and R = 4 . 8 × l0 s is equivalent to an increase of about 1 deg in the elevator angle to trim. The pitching-moment coefficients shown in Fig. 6 for the model with tail do not agree exactly with the values for the same tail setting, elevator angle, and Reynolds number given in Fig. 7A. The results given in Fig. 6 were derived from a later test than those given in Fig. 7A, and it must be supposed tha t some change in the model had occurred between the two tests.
Measurements made in flight have shown that the elevator angle to trim at low Mach number and low CL is about 4 deg, whereas Fig. 20 gives about 3.2 deg. Part of this discrepancy m a y be due to the difference of Reynolds number between the mode land full-scale tests.
4. Conclusions.--These tests have shown that the only important chang.e that occurs at ~Mach numbers up to 0 .8 is an increase of drag coefficient. This conclusion is m agreement with the results of flight tests.
6

No. Author
1 Mair . . . .
2 Glanert . . . .
R E F E R E N C E S
Title, etc.
Measurements of Tailplane Deflection in High Speed Dives. A.R.C. 5989• (June, 1942.)
Theoretical Relationships for an Aerofoil with a Hinged Flap. R. & M. 1095• (April, 1927.)
@¢tfire
Wing span . .
S tandard mean chord
Wing root chord
Gross wing area
Aspect ratio . .
Tailplane span •.
Tailplane mean chord
Gross tai lplane area
Distance from tailplane quarter-chord point to aft centre of gravi ty position
Tailplane volume coefficient . . . . . . . . . . . . . .
Aft centre of gravi ty position
Aft of leading edge mean chord . . . . . . . . . .
T A B L E 1
Dimensions (Full Scale)
Above root chord . . . . . . . . . . . . . . . .
Aft of root leading edge . . . . . . . . . . . . . .
Above root chord . . . . . . . . . . . . . . . .
Fuselage da tum incidence . . . . . . . . . . . . . .
Wing t ip incidence . . . . . . . . . . . . . . . .
Normal tal lplane set t ing . . . . . . . . . . . . . .
Wing section at root . . . . . . . . . . . . . . . .
Wing section near t ip . . . . . . . . . . . . . . . .
Tailplane and elevator t . . . . = 0.10, C
7
. °
• . 3 6 . 9 2 I t
• . 6 . 5 4 I t
. . 8 . 2 6 It
. . 242.0 sq It
. . 5 .65
• . 1 0 . 5 0 ft
. . 3-215 ft
• . 33-75 sq i t
•. 17.92 It
. . 0 .382
• . 0 . 340~
0.246~
•. 2. 638 ft
•. 1.705 It
- -2 deg to wing root chord.
--2} . . . . . . . . . .
- - 2
NACA 2213
NACA 2208
0~" I
II °°-I~
i / %
t . 0 , ,
O.B
G.
0.6
O'A-
O'~
- - AT CONS"rA~T MA.CH 1,4o_
. ~ " . . j ¢ o o
~Z: ' / \ g°
.: ('°
o~-- - L i ° KI-0-40 M,O.SO M:O.60 0-6S 0.70 0-7.S n:/75 80
FIG. 2. Lif t carpet . (Not correc ted for blockage.)
8
e
4 O'3 (>~- Or5 t O.?p~ACH r~=o, ~
FIG. 3. L i f t -curve s lope a t C~ = 0 .1 . (Not cor rec ted for blockage.)
/ / /
:).04.. @,,1
CO Ct- ---.-O--- R = 2 . 0 ~ toe; C / / ~ / / / C ¢/"
0.05 o.~ - - X - - R-4--8 X. I07 / . ~ j ~ / / "
~.-.-..........~ _.....=.~=_ _ _
/ / /
/ / :' +.1 ~ at- 5 t ~ C I t ~ N C F - -- t~F-.GRF..E~.
J
FIG. 4. Lif t and d rag coefficients a t low speed.
4"O,t0
c~
+0.(35
0
----O......-- IR=?. X I0 '~
----I ~ "°''' '°~. W.~,;I~ / :8 C~_
='P A-" ®
FIG. 6. P i tch ing m o m e n t a t low speed.
Jo
O" I£
0 " 0 ~
C ~
o.o
o. or
O' OE
0"04-
0 . 0 2
0.0|
- - C L = O
. . . . . . C L = O - t
- - - - C t _ = 0"9 -
- - - - - C L . = 0 " 4 -
i -W
o 0 . 3
R - i ~. t o 6
Q,~- o , 5 O 6 "'-"~" O-
FIG. 5.
M A C H ~ o
Effect of Mach number on drag at constant C~. (Not cor rec ted for blockage.)

~ o . i o
C~. n
, + l ~ . o s
o
R : ~ x ~0 '~
9.'z ~ o.~.
0 0 0
A
/ /. / /
o
m 11 : + 4 - ° ¢t
o 'q =4" 6° ®
+0"10
+ 0 - 0 5
%
9
- 0 . ~
t~ = O, ,(:i-O ~'~'
I ~ . I . I X I0 ~ ~
0"?- . "a'~ 0 ; 4 -
.-,-o- r ~ ~ , - - _ _ k
0 ; 6 0.8 C~_
B
*o .05
tr" ~ t I. i ; ~ tO ql
0 o-~. / ~" ( 4- .+/
C
. / " / / /
. e . "'
0 : 6 0 : 8 O-k.
FIG. 7. Pitching-moment curves.
C m eO-05
0
-o £
- 0 " 1 0
t~t ¢ 0 - 6 0
~ = l ' I
o
/ / - g
\
0 . 8 C ~
t O . O G
C ~
o
o-'--
- o - o 5
[3
0 " 6 O.B C
I M = O - G 5
I +, 9<''~v
E
* -o , o~ , M = 0 , ' 7 0 . 71~ : - ~ k tZ = ~ . '~ x. l O t"
" - .
- - 0 " 0 ~ " / " °
\
C g C ,
F
FIG. 7. Pitching-moment curves. (Not corrected for blockage.)
+0.05
%
0
(>....--
-o.0~
-0. IO
- O . I S
~ : O , 74. ~T = -- ?'*
~I'->"
\
~.= %. ~ < l O 6
G
OB C~_
C m
o
-0'0..~
--0- I 0
-0, iB
N = 0 . 7 8
D T : - - 2 °
~ 7 " ° 0 .
. _ 2 1 2 + 4 -°
\
R = | - I X IO ~ '
O 6 Cu
\ +0. o5
C
0
--O'OS
--O' I 0
-o. 15
M= O. 76
~ ] T - - 2°
O- 0:4-
FIG. 7.
H
Pitching-moment curves. blockage.)
I I:~= I-I X ICI ~
,,, 1-6
(Not corrected fo
e'8 CL.
+O- 05
/ s
~ T ~ - ~° , ~ %
-Q. Io
J Pitching-moment curves.
blockage.) F I G . 7 .
®
@ R ~ I . ! r i o
o - ; Ct -
(Not corrected for

tO
c
+O-OS
-(9-----
0
,@...-
- ( - o . o ~
I M " 0 " 2 6 R = 2 X %0 &
/ - ~ x~
/%/ •
// 0 '- r-~ ~ 0;4 -
/ ~]r -= --2°- / 9 ~ O ® "(5 " ~ / " ! =
~ ~ ~ ° o O
A
I ,s
® ®
0 . 6 0 : 8 C L
0 n
~-0-05
%
Cr""
- 0 . 0 5 .g/ O--
t',l= 0 - . 6 S ~] = ~ - 4 . °
/
f / /
/
/*/
",o
%
%A"
6.-o
~= | . ~M. I (D 6
O ' B e L -
]5 ~O-OS
M" 0,70 .+~o
0 0 , 2 // '6 O. 8 CL
- 0 . 0 5 o ~b , - - . , ( ~
- O - L I O
c FIG. 8. Pitching-moment curves. (Not corrected for.blockage.)
Cr~
0
- O - o S
0 . "
-o I 0
- O . tS
I t~1=O 74
f
K
D
+ C).O~
e------
Cr n
0
e--"
-o.05
e.-
--0" IO
-c~.lS
I M=O 76
E FIG. 8.
P . . i . t x t O a
0 . 6 Ct-
Pitching-m0ment curves. (Not c0rrected for blockage.)
~ = ~-I x.~CD ~

oo
-~o.os
0
-0. 05
-0- ~o
%M= O, 78
o.~ ~,%
o ~ - / ; / " '
\ F
N = I - I X t 0 ~ .
0 . 6 CL.
* 0 . 0 5
Cn- ~ .v~/~
o ,£ o . z
/%
- o . O£
o
x /
--0- I0
--O- I ~:
G FIG. 8.
t'4: O- 80
I"}= +4 °
0:~%-
\
Ira.: I - I .XtO ~
0-6 C~_
Pitching-moment curves. (Not. corrected for blockage.)
-0.05
%
(~,.~ ~ ~o~)
- O . I 0 . . . . . . .
t~ACH N~
0 ~.~.~f. ' I~.%'I~ A'Y R = | . I X I O ~ ~ ~ .
cORtmZG~KD TO 7-ERO Att_~-P.Ot4 ~l-O~,~.
Fie. 9. Pitching moment (no tail) at C~ = 0. (Not corrected for blockage.)
• -v 4 . °
,pg_ o
0 . 3
F I G . 1 0 .
o-~ o,5 0-6 o, o.8 MAr_.H N o _
Elevator angle to trim. (Not corrected for blockage.)
• 0" 2C
O
-0.26 0"5
FIG 11.
l
Effect
0 . 5 0 . 6 0 ' 7 . Cv8 MACH t4 o -
i/~C"~ (Not of Mach number o n - \~/~--F[-/M
corrected :for blockage.)

EL i
f
7T -- ° ° To -,,*° R -~ l,l }{,IO 6"
C~ = WING ROO'T II~CII~F_HCI~.,
OC•
FIG. 12.
C/,, Ct. T ,,- _ I.IIF'T CO~.FF.) -~kcl. r- "=.P.
c 4- 0 5 o-~; O : T H & ¢ H Ne 0 . 8
Tailplane lift-curve slope. (Not corrected for blockage.)
O - 3
FIG. 13.
"~ : P..° "I"0 ~ o o~. --
R = I . I ,v, lO 6 ° L = 'a,-" t ¢~.= 6 °,
O f ~ . = W t N G R o O T Vt4Ct~EH, C-:E'
O O . 5 0 ' 6
Tailplane lift due to elevator. blockage.)
0 - 7 H I A C H N ° -
o78 (Not corrected for
..J 0 Z <
O O
+0. O5
C
-a.o~
eL= ) -6
eL=( 1.4.
O.5
FIG. 14.
O 3
0,4- 0 . 5 0 " 6
Downwash angle at tail. blockage.)
0.4- 0 . 5 O.G
0 ' 7 O.8 MACH t,,t.?
(Not corrected for
P4 ACH bt ° o . 7 0 . 8
- 0 ' 0 5
C m
- O ' t O
CL= (3' ~ /
CL= O" .3- I
FIG. 15. Pitching moment with tail (~ = -- 2 deg, ---- + 4 deg). (Not corrected for blockage.)
CL-~ O.4-
CL=O.3
) '3 GL.=O. z O
CL=O. I
CL=O
4- 0 5 O" @ HACH hP- > 8
FIG. 16. Pitching moments without tail. (Not corrected for blockage.)

P A R T I I
T e s t s o n t h e S p i t e f u l (F.I/~.3) By
W. A. MalI~, M.A., S. P. HUrTOS, B.Eng. a n d H . E. GaMBLe_, B.Sc.
1. !ntroduction.--The Spiteful (F.1/43) is a single-engine fighter with fuselage and tail unit similar to the Spitfire. The wing has been designed for low drag and has a cusped trailing edge. The inboard sections of the wing were designed to have a high critical Mach number, and the outboardsections to maintain extensive laminar boundary layers. The mean wing thickness is slightly greater than that of the Spitfire.
High-speed wind-tunnel tests were required to supplement the earlier low-speed tests 1, 2 and for comparison with the high-speed tests on the Spitfire I (Part I). High Reynolds-number tests
, were also required, to determine the scale effect on maximum lift and longitudinal stability at low speeds.
Pressure measurements on tile front radiator flaps at high speeds were required, for the estimation of loads in the flap operating mechanism, and for the determination of critical Mach number.
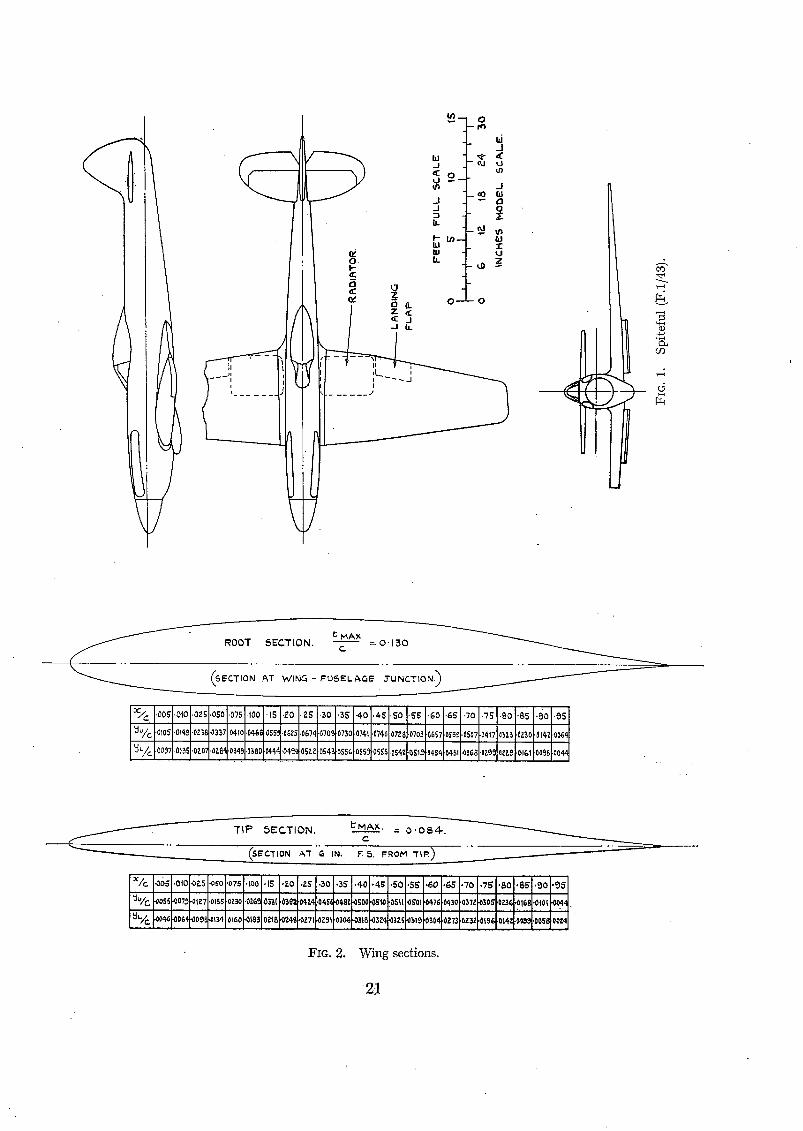
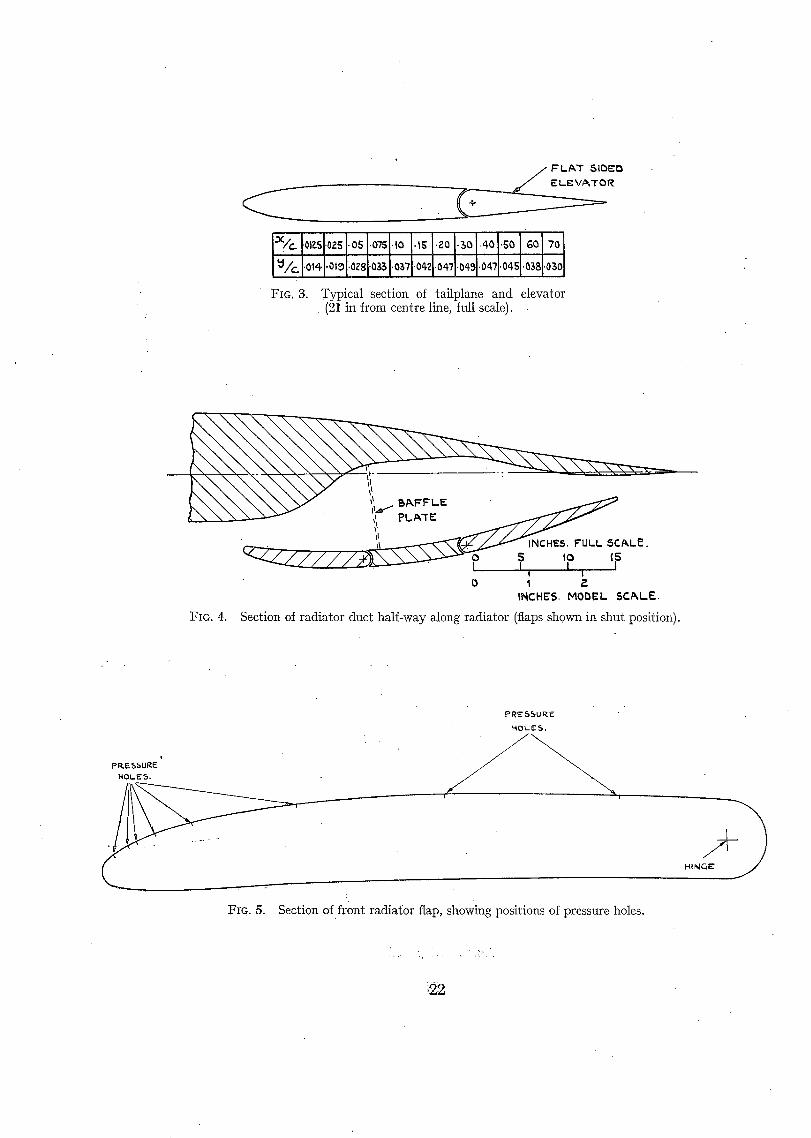
2. Description of Model.--Particulars of the 1/5-75 scale model are given in Table 1 and in Fig. 1. The wing and fuselage were made of hardwood and the radiators were made from brass castings with steel flaps and baffle plates. The wing sections at root and tip are shown in Fig. 2. Fig. 3 shows a typical section of the tailplane and elevator, this being the same as on the Spitfire. Fig. 4 shows a typical section of the radiator duct, and in Fig. 5 a section of the front radiator flap is given, indicating the positions of the static holes used for the pressure measurements. The baffle constant* was 0.50 for both radiators. The cabin was one with a curved front fairing, described as cabin A in Part I I I . In all tests with the fuselage the cabin and fin were fitted, and the engine air intake was represented by a faired shape. Ailerons, rudder and engine exhaust pipes were not represented.
For the tests with landing flaps down the rear radiator flaps were opened 87.5 deg to form part of the landing flap system (see Table 1). For all other tests with therad ia tors fitted the rear flaps were in the shut position, and except where otherwise stated the front radiator flaps were also in the shut position (Fig. 4). For the tests without radiators the ducts in the wing were filled with wood blocks.
3. Correction of Pressure Measureme~ts.--The diameter of the pressure holes in the front radiator flap was about 0.05 in, and a correction has been applied for this rather large hole diameter. Measurements by Thorn 3, confirmed by Linke 4, have shown that on a circular cylinder the measured pressure can be assumed to act at a point that is displaced from the centre of the hole by one-quarter of the hole diameter towards tile front of the cylinder. This rule was established by Thorn only for a circular cylinder upstream of the minimum pressure, and thus the displacement towards the front of the cylinder was upstream and towards the high-pressure side of the hole. In forming a rule tor general application, it is not known whether the displacement should be upstream or towards tile high-pressure side. Tile measured pressure distributions on the front radiator flap have been coirected for size of hole by displacing the measured pressure towards the high-pressure side by one quarter of the hole diameter. However, the correction is unimportant except on tile part of the flap where tile high-pressure side is also tile upstream side, this being the region of steep pressure gradients. Thus the uncertainty of the direction of the displacement in a region of rising pressure has no appreciable effect on the pressure distribution.
* The baffle col~stant is defined as (drop of total head across baffle)/½pV", where V is the velocity in the duct immediately in front of the baffle.
15
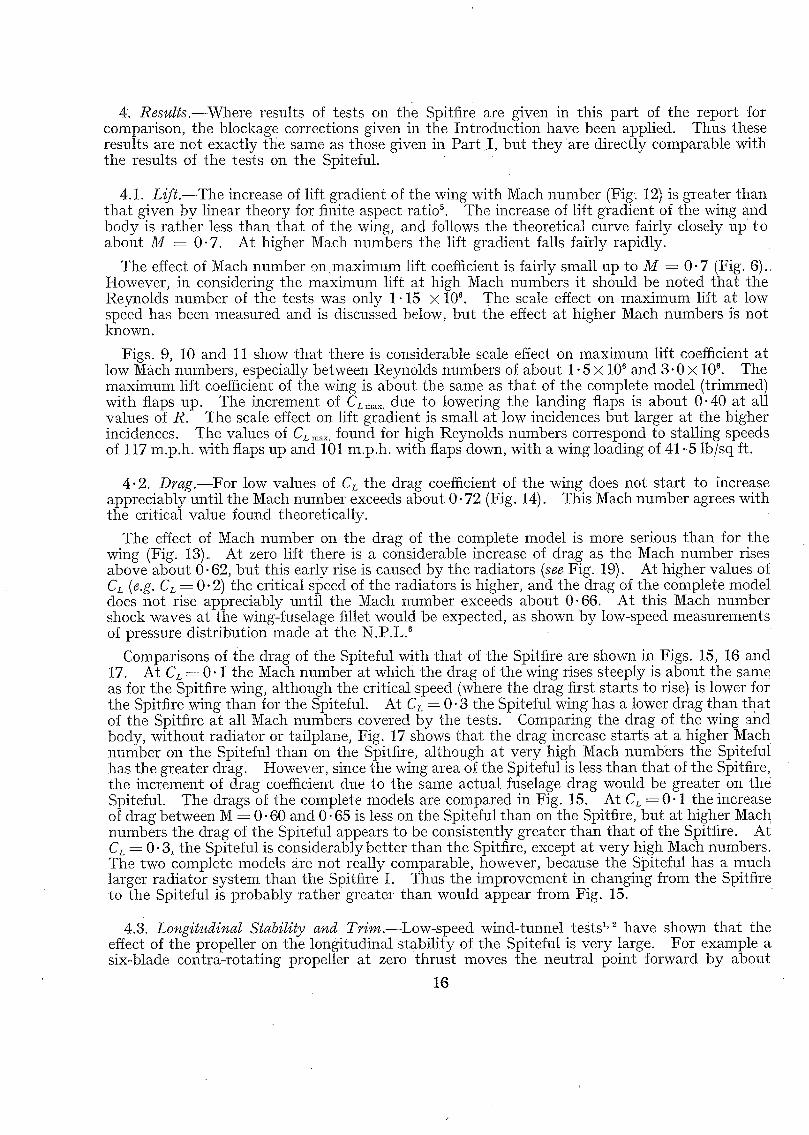
4. Results.--Where results of tests on the Spitfire are given in this part of the report for comparison, the blockage corrections given in the Introduction have been applied. Thus these results are not exactly the same as those given in Part I , but they are directly comparable with the results of the tests on the Spiteful.
4.1. Lift.--The increase of lift gradient of the wing with Mach number (Fig. 12) is greater than that given bv linear theory for finite aspect ratio 5. The increase of lift gradient of the wing and body is rather less than that of the wing, and follows the theoretical curve fairly closely up to about M --=- 0-7. At higher Mach numbers the lift gradient falls fairly rapidly.
The effect of Mach number on maximum lift coefficient is fairly small up to M -- 0 .7 (Fig. 6).. However, in considering the maximum lift at high Mach numbers it should be noted that the Reynolds number of the tests was only 1.15 × 10⁶. The sca!e effect on maximum lift at low speed has been measured and is discussed below, but the effect at higher Mach numbers is not known.
Figs. 9, 10 and 11 show that there is considerable scale effect on maximum lift coefficient at low Mach numbers, especially between Reynolds numbers of about 1.5 × 10⁶ and 3.0 × 10⁶. The maximum lift coefficient of the wing is about the same as that of the complete model (trimmed) with flaps up. The increment of CLmax. due to lowering the landing flaps is about 0.40 at all values of R. ~ihe scale effect on lift gradient is smM1 at low incidences but larger at the higher incidences. The values of CL .... found for high Reynolds numbers correspond to stalling speeds of 117 m.p.h, with flaps up and 101 m.p.h, with flaps down, with a wing loading of 41.5 lb/sq ft.
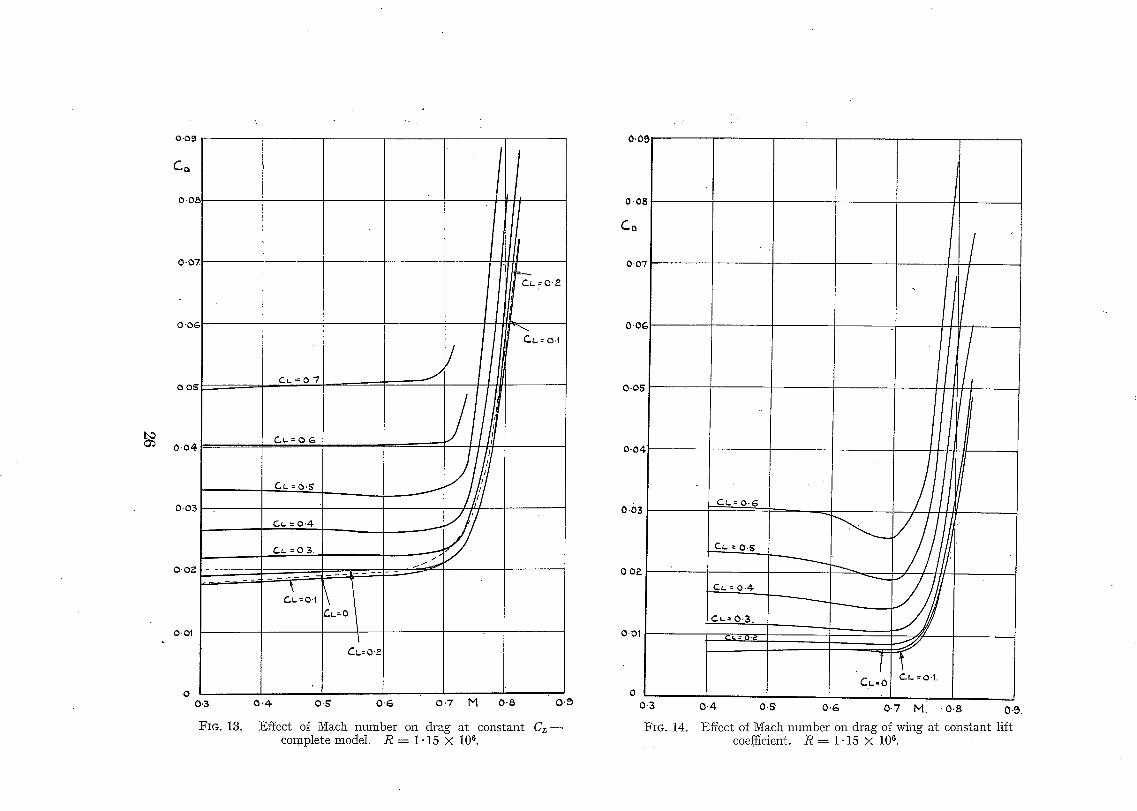
4.2. Drag.--For low values of CL the drag coefficient of the wing does not start to increase appreciably until the Maeh number exceeds about 0.72 (Fig. 14). This Mach number agrees with the critical value found theoretically.
The effect of Mach number on the drag of the complete model is more serious than for the wing (Fig. 13). At zero lift there is a considerable increase of drag as the Mach number rises above about 0.62, but this early rise is caused by the radiators (see Fig. 19). At higher values of CL (e.g. CL = 0.2) the critical speed of the radiators is higher, and the drag of the complete model does not rise appreciably until the Mach number exceeds about 0-66. At this Mach number shock waves at the wing-fuselage fillet would be expected, as shown by low-speed measurements of pressure distribution made at the N.P.L. 6
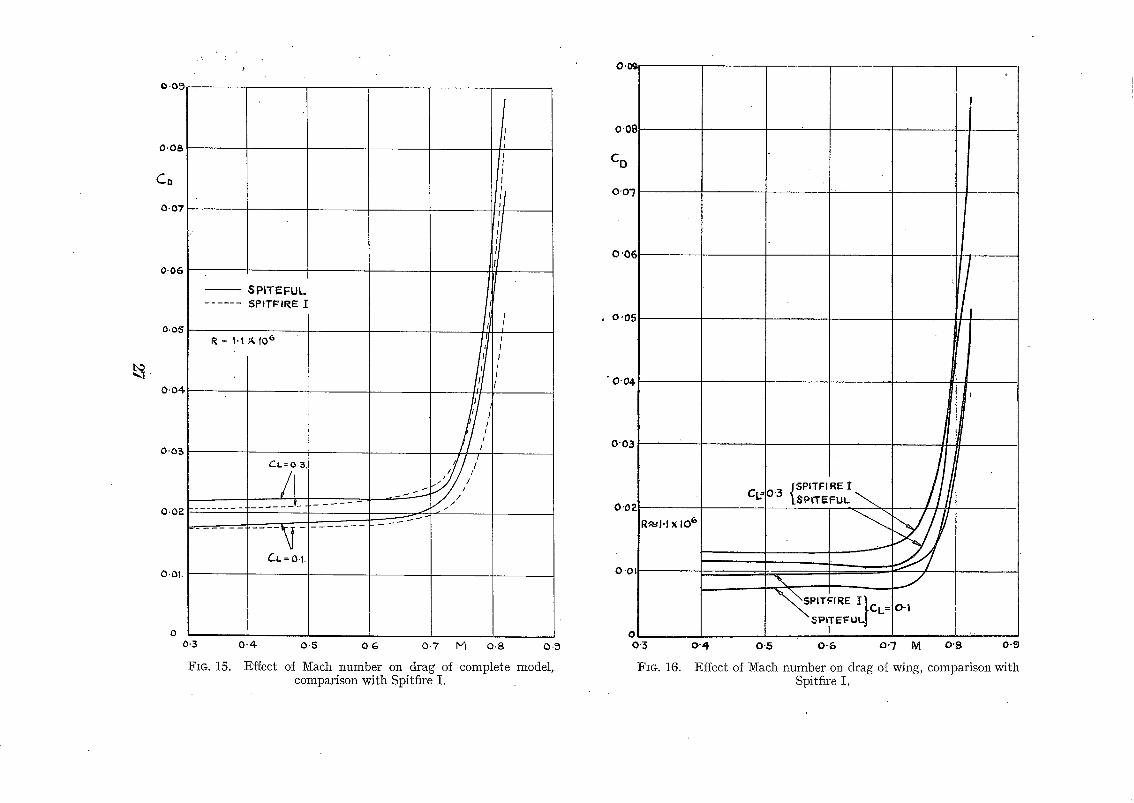
Comparisons of the drag of the Spiteful with that of the Spitfire are shown in Figs. 15, 16 and 17. At C~ -- 0.1 the Mach number at which the drag" of the wing rises steeply is about the same as for the Spitfire wing, although the critical speed (where the drag first starts to rise) is lower for the Spitfire .wing than for the Spiteful. At Cc = 0.3 the Spiteful wing has a lower drag than that of the Spitfire at all Mach mlmbers covered by the tests. Comparing the drag of the wing and body, without radiator or tailplane, Fig. 17 shows that the drag increase starts at a higher Mach number on the Spiteful than on the Spitfire, although at very high Mach numbers the Spiteful has the greater drag. However, since the wing area of the Spiteful is less than that of the Spitfire, the increment of drag coefficient due to the same actual fuselage drag would be greater On the Spiteful. The drags of the complete models are compared in Fig. 15. At CL = 0.1 the increase of drag between iV£ = 0.60 and 0.65 is less on the Spiteful than on the Spitfire, but at higher Mac k numbers the drag of the Spiteful appears to be consistently greater than that of the Spitfire. At CL = 0.3, the Spiteful is considerably better than the Spitfire, except at very high Mach numbers. The two complete models are not really comparable, however, because the Spiteful has a much larger radiator system than the Spitfire I. Thus the improvement in changing from the Spitfire to the Spiteful is probably rather greater than would appear from Fig. 15.
4.3. Longitudinal Stability and Trim.--Low-speed wind-tunnel tests 1, ~ have shown that the effect of the propeller on the longitudinal stability of the Spiteful is very large. For example a six-blade contra-rotating propeller at zero thrust moves the neutral point forward by about
16

0.14g. The high-speed tunnel tests were all made on a model without a propeller, and thus the stabil i ty as shown by the results of these tests is considerably greater than it would be with a propeller. The influence of Math number on the destabilising effect of a propeller is not yet known, but if it is assumed that this effect is independent of Mach number then the changes of stabili ty with l a c h number are given correctly by the results of the high-speed tunnel tests.
Fig. 30 shows the variation of --(OC,]OCL)M with Much number, for the complete model with tail. These curves show that there is a considerable decrease of manoeuvre margin at the higher lift coefficients between M = 0.6 and 0-7. This may mean tha t large normal accelerations can occur very easily in high-speed manoeuvres at high altitudes. The rapid increase of -- (OC,,/CL)~ at high Mach numbers is usually found in high-speed tunnel tests on complete models, and shows the large stick movement required for pulling out of a high-speed dive. I t is satisfactory, however, that for zero lift this increase does not occur at any Mach number up to 0.82.
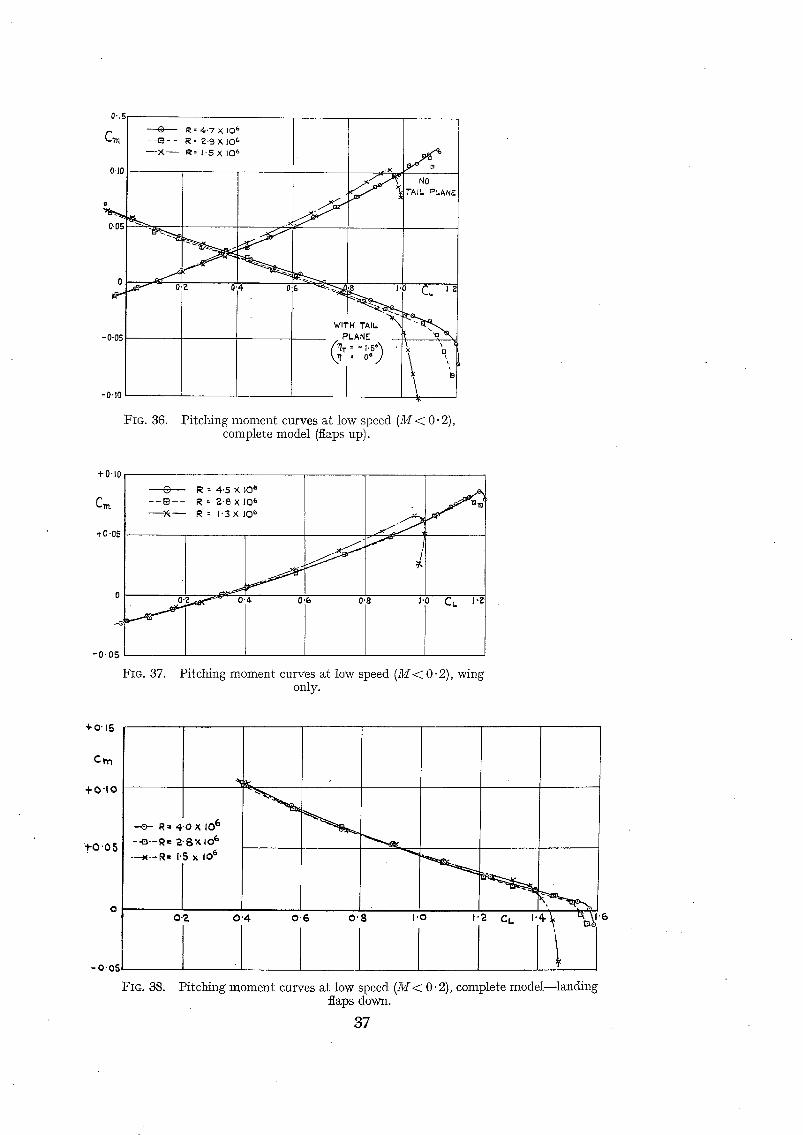
Table 2 shows that the scale effect on longitudinal stabili ty at low Mach numbers is fairly small. For the complete model with radiators and tail an increase of Reynolds number from 1.5 × 10⁶ to 4.5 × 10⁶ causes a forward movement of the neutral point of less than 0.01~.
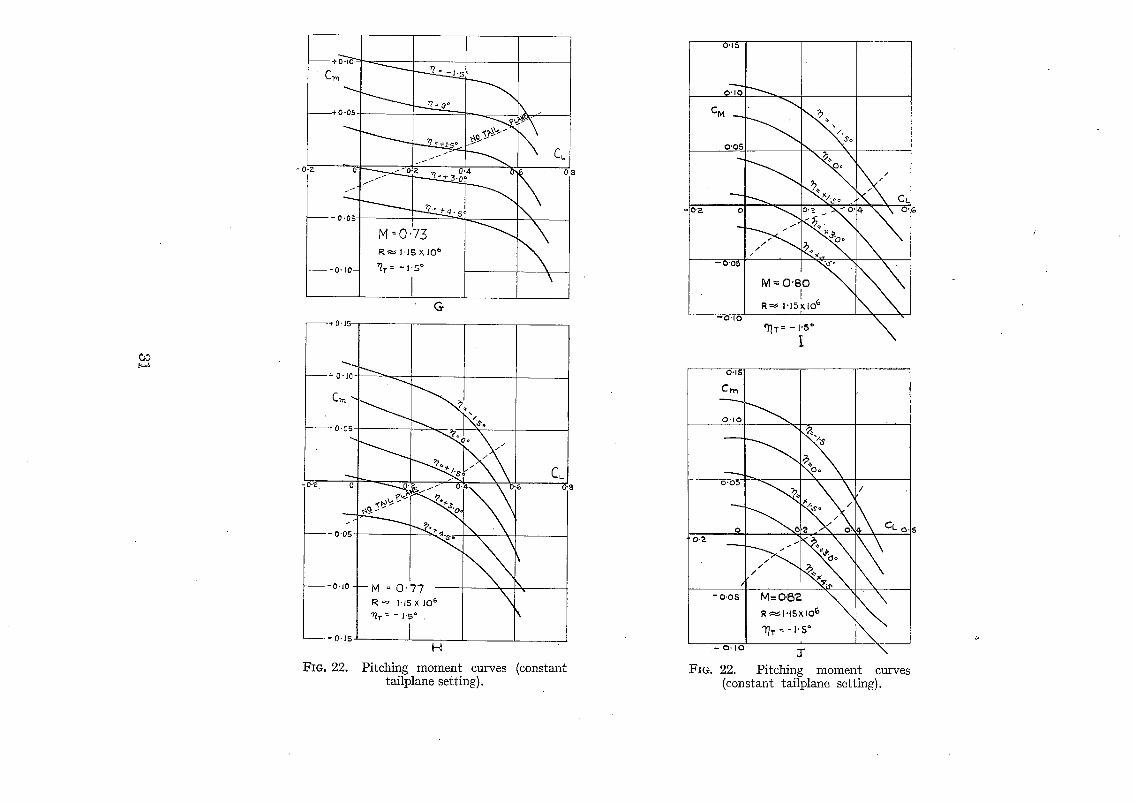
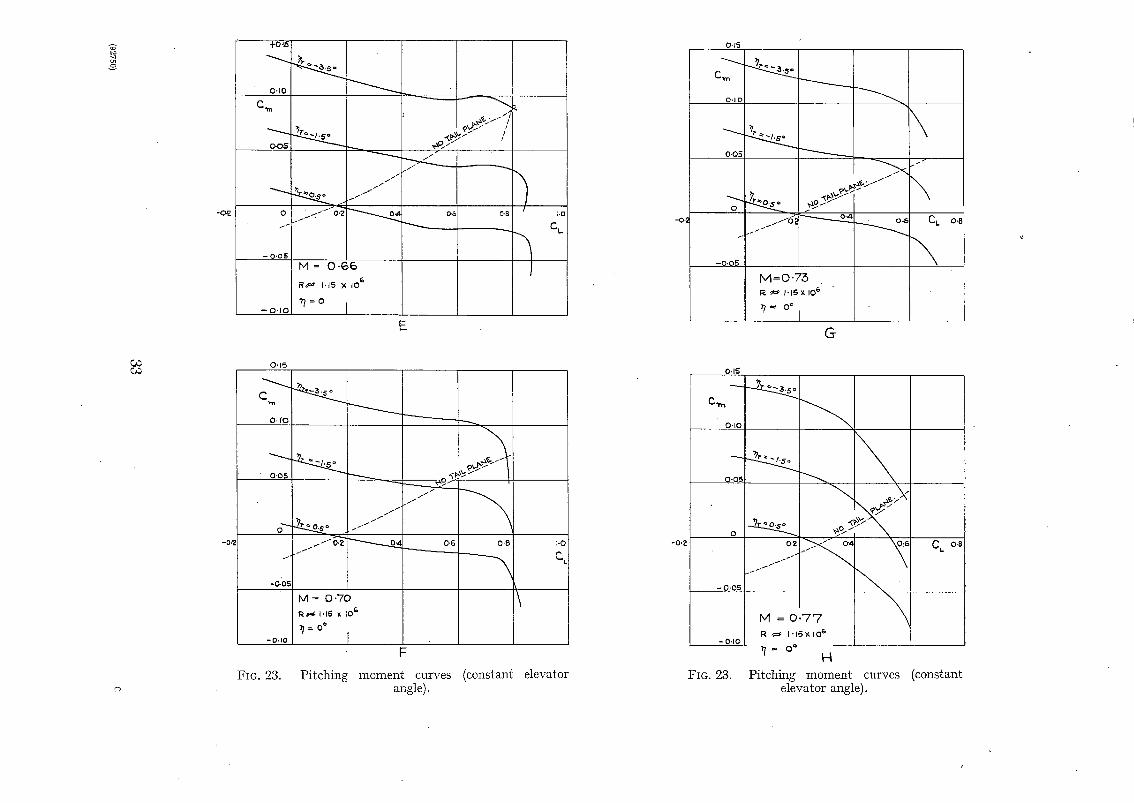
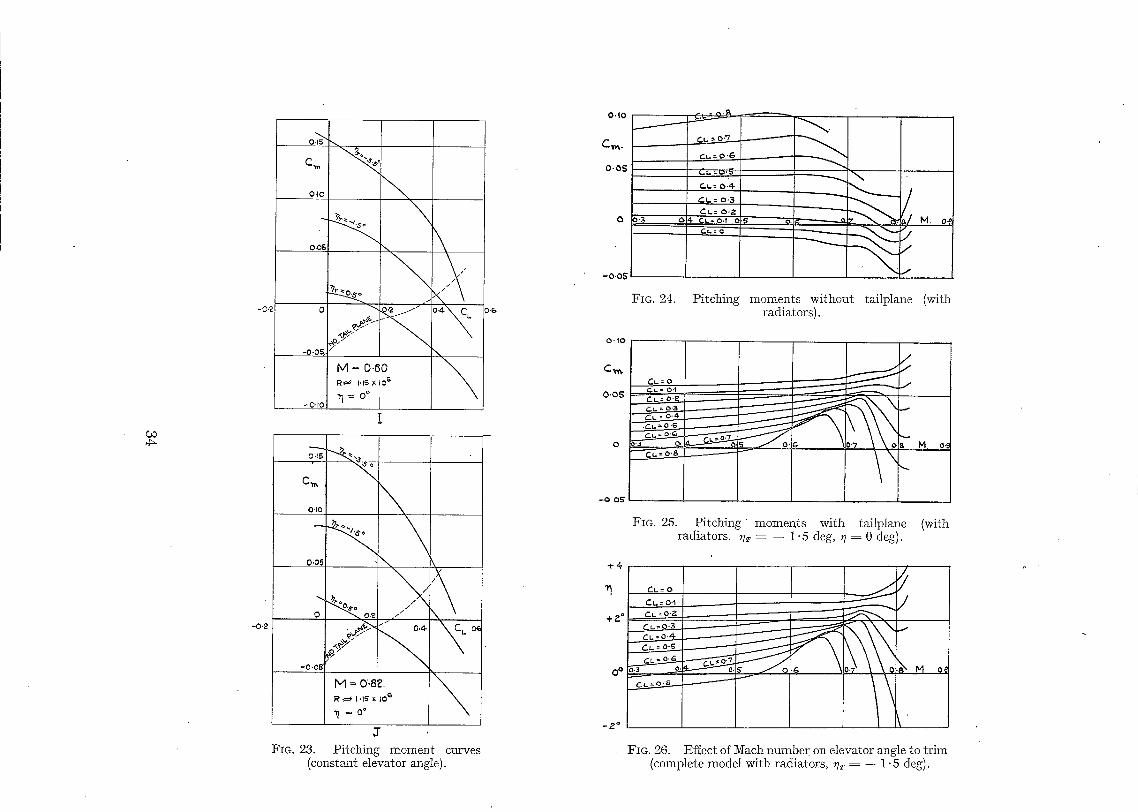
For the complete model with tailplane, the change of trim with Much number is least for CL = 0.2 (Fig. 25). At lower values of CL there is an increasing (positive) pitching moment with rising Much number, and at higher values of CL there is a decreasing pitching moment with rising Much number. For values of CL between 0 and 0.35, the change of trim between M = 0 and M = 0.82 is equivalent to less than 1 deg of elevator movement (Fig. 26).
Fig. 34 shows that there is a very large increase in the numerical value of C,,~o, as M is increased from 0.3 to 0.8. The variations with Much number of C,,o for the wing and for the wing and body without radiators are similar to the effects found on other models, but the effect of the radiators is unusual.
The effect of Much number on the downwash angle at the tail (Fig. 35) is very different from the effect on the Spitfire (Fig. 14 of Part I). On the Spitfire the downwash at a given value of CL falls severely as the Mach number increases above about 0 .7 or 0.75. On the Spiteful the down- wash angle at a given value of CL is nearly independent of Mach number up to M = 0 .8 This difference may be explained by the wash-out and greater thickness taper of the Spitfire wing, which tend to make the root sections shock-stall before the outer sections. The Spiteful wing has no wash-out and a more uniform thickness distribution.
Figs. 31 and 82 show that the tailplane and elevator both remain fully effective at all Much numbers up to about 0-82. These curves are similar to those given in Part I for the Spitfire I, the tailplane and elevator being identical on the two aircraft.
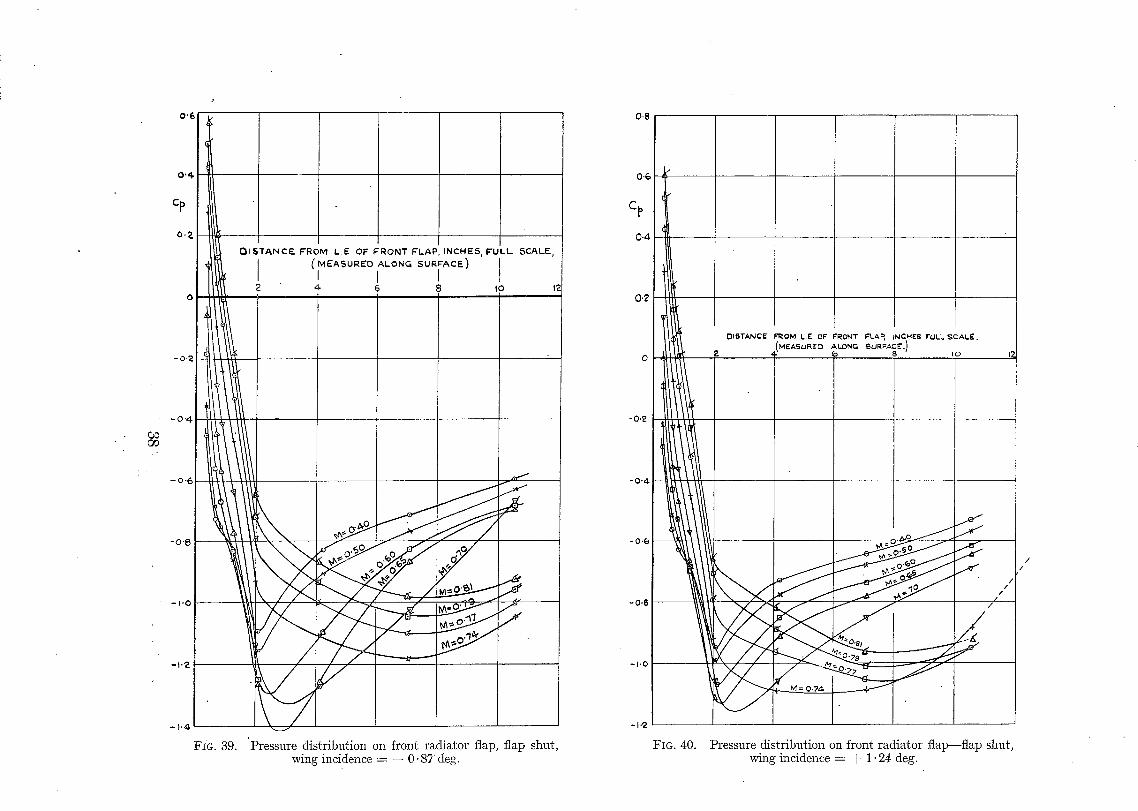
4.4. Radiators.--The pressure distributions on the front radiator flap are shown in Figs. 39 to 47. The peak suction coefficients are rather high, and further tests are being made in a low- speed wind tunnel to investigate the pressure distributions for different combinations of front and rear flap settings These tests have shown that the suction coefficients near the middle of the flap are slightly higher than those at the pressure holes used in the high-speed tunnel tests, so tha t the values given ill this.report for the critical speeds may be a little too high.
As the Mach number increases above about 0" 7 the pressure distribution curves change their form, possibly because of a separation of flow near the leading edge of the front radiator flap. At about the same Mach number the increment of CL due to the radiators starts to increase suddenly (Fig. 18). The change of sign of the radiator lift increment explains the large change in the increment of C,,~o due to the radiators, shown in Fig. 34. At low speeds the negative radiator lift increases the no-lift angle of the wing and so reduces C,,,o numerically. At high speeds this effect becomes reversed, giving a high numerical value of C,,o.
The observed peak suction coefficients for the radiator front flap are shown in Fig. 48 plotted against Mach number. The curve marked ' critical ' on the same diagram is derived from the theoretical relationship for isentropic flow, and shows the value of Cp giving a local velocity equal
17 (92750) B
to the local speed of sound. From the critical Mach number with front and rear flaps shut the critical speeds in level flight have been calculated, assuming a wing loading of 41.5 lb/sq ft (Fig. 49). At 35,000 It the critical speed is only about 430 m.p.h., which is below the probable top speed at that height. However, with both radiator flaps shut the increase of radiator drag with Mach number is fairly small for level flight conditions (Fig. 19). With the front flap open the radiator critical speed is lower and the increase of drag with Mach number is more serious (Figs. 20 and 21).
Comparison of Figs. 25 and 29 shows that the radiators do not have any large effect on the general form of the pitching-moment curves, but the curves of Fig. 25 are spaced more widely, indicating an increase of stability due to the radiators. Table 2 shows that, at low Mach number and low CL, this effect on stability disappears at high Reynolds number. At high CL tile radiators increase stability at all Reynolds numbers.
Coefficients ok normal force and hinge moment have been calculated for the radiator front flap, assuming free-stream stagnation pressure inside the radiator duct (Fig. 50). This assumption is not accurate, but is sufficient to show the general form of the variation of the coefficients with Mach number.
Fig. 50 shows that the variation of hinge-moment coefficient with Mach number is fairly small, the maximum increase due to compressibility effects being only about 10 per cent of the low- speed value.
5. Conclusions.--The Mach number at which the drag coefficient starts to rise is higher for the Spiteful than for the Spitfire. However, in changing from the Spitfire to the Spiteful only a small improvement of performance would be expected from the suppression of compressibility effects, because tile increase of drag of the Spitfire with Mach number is at first Very gradual. At very high Mach numbers and low values of CL tile drag coefficient of the Spiteful is greater than that of the Spitfire, this being probably due to the greater mean wing thickness of the former aircraft.
At Mach numbers up to 0:82 there are no large' changes of trim at low values of CL, and elevator control is satisfactory. "I here is the usual increase of stability in dives at very high Mach numbers, except near zero lift, where there is very little change of stability in the dive.
For all Mach numbers up to 0.70 the static margin of the model without propeller is about 0.10~. As shown in Refs. 1 and 2 this margin would be greatly reduced by the addition of a propeller.
At R----4 × 10⁶ and low Mach number, CL ..... (trimmed) is 1"16 with flaps up and 1.58 with flaps down. The corresponding stalling speeds are 117 and 101 m.p.h., assuming a wing loading of 41.5 lb/sq ft.
No. Author
1 Warren and Kirk . .
2 Warren and Becker
3 Thorn . . . . . .
4 Li~ke . . . . . .
5 Young . . . . . .
6 Warden . . . . . .
R E F E R E N C E S
Title, etc.
Wind Tunnel Tests with Propeller on the Supermarine F.1/43. R.A.E. Report No. Aero 1860. (October, 1943.)
Wind Tunnel Tests on the Supermarine F.1/43 with a Five-Bladed Propeller, and at Two Wing Settings. A.R.C. 7395. (November, 1943. (To be published.)
Flow Past Circular Cylinders at Low Speeds. R. & IV[. 1539. (June, 1932.)
Neue Messungen zur Aerodynamik des Zylinders, insbesondere seines reinen Reibungswiderstandes. Physik. Zeit. 32. (1931.)
Note on the Effect of Compressibility on the Lift Curve Slope of a Wing of Finite Aspect Ratio. A.R.C. 7046. (August, 1943.)
Pressure Distribution Measurements on the Supermarine F.1/43. (Unpublished.)
18
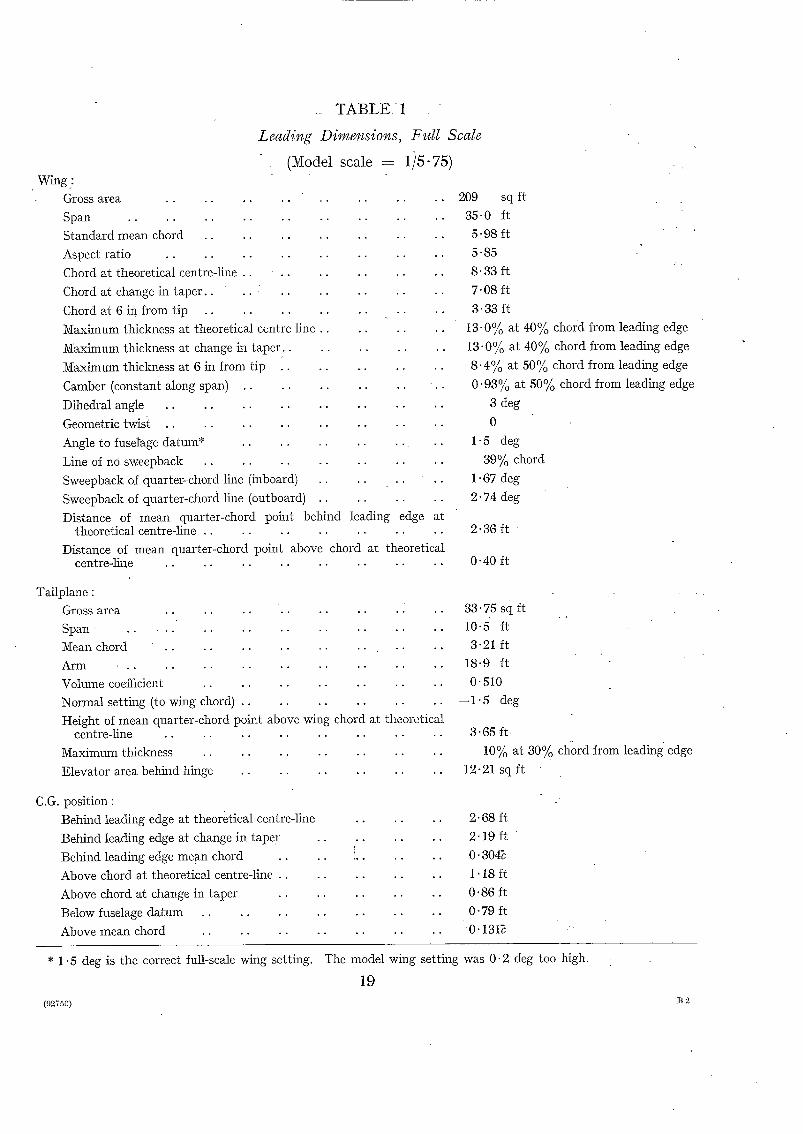
!~ T A B L E 1
Leading Dimensions, Full Scale
(Model scale = 1)5-75) W i n g :
Gross area . . . . . . . .
Span . . . . . . . . . .
Standard mean chord . . . . . .
Aspect ratio . . . . . . . .
Chord at theoretical centre-line . . . .
Chord at change in taper . . . . - . .
Chord at 6 in from tip . . . . . .
Maximum thickness at theoreticM centre line
Maximum thickness at change in taper•
Maximum thickness at 6 in from tip
Camber (constant along span) ..
Dihedral angle . . . . . .
Geometric twist . . . . . .
Angle to fusetage datum* ..
Line of nO sweepback . . . .
Sweepback of quarter-chord line (inboard)
Sweepback of quarter-chord line (outboard)
• °
• °
Distance of mean quarter-chord point behind leading edge at theoretical centre-line . . . . . . . . . . . . . .
Distance of mean quarter-chord point above chord at theoretical centre-line . . . . . . . . . . . . . . . .
209 sq ft
35-0 It
5.98 ft
5.85
8.33 ft
7.08 ft
3 .33 It
13-0% at 40% chord from leading edge
13-0% at 40°/0 chord from leading edge
8 . 4 % at 50% chord from leading edge
0-93°/0 at 50% chord from leading edge
3 deg
0
1-5 deg
39% chord
1-67 deg
2- 74 deg
2.36 ft
0.40 ft
Tailplane :
Gross area . . . .
Span . . . . . .
Mean chord . . . .
A r m . . . . . .
Volume coefficient ..
Normal setting (to wing chord)
Height of mean quarter-chord point above wing chord at theoretical centre-line . . . . . . . . . . . . . . . .
Maximum thickness . . . . . . . . . . . . . .
Elevator area behind hinge . . . . . . . . . . . .
33.75 sq It
lO.S ft 3.21 ft
18.9 ft
0 ' 510
- - 1 ' 5 deg
3.65 i t
10% at 30% chord from leading edge
12-21 sq ft
C.G. position :
Behind leading edge at theoretical centre-line . .
Behind leading edge at change in tape r . . . .
Behind leading edge mean chord . . . . !..
Above chord at theoretical centre-line . . . . . .
Above chord at change in taper . . . . . .
Below fuselage da tum . . . . . . . . . .
Above mean chord . . . . . . . . . .
2 .68 ft
2 ' 19 ft
0 ' 304}
1" 18 ft
0-86 ft
0-79 ft
O'1317
* 1.5 deg is the correct full-scale wing setting. The model wing setting was 0-2
19
deg too high.
(92750) ~B2
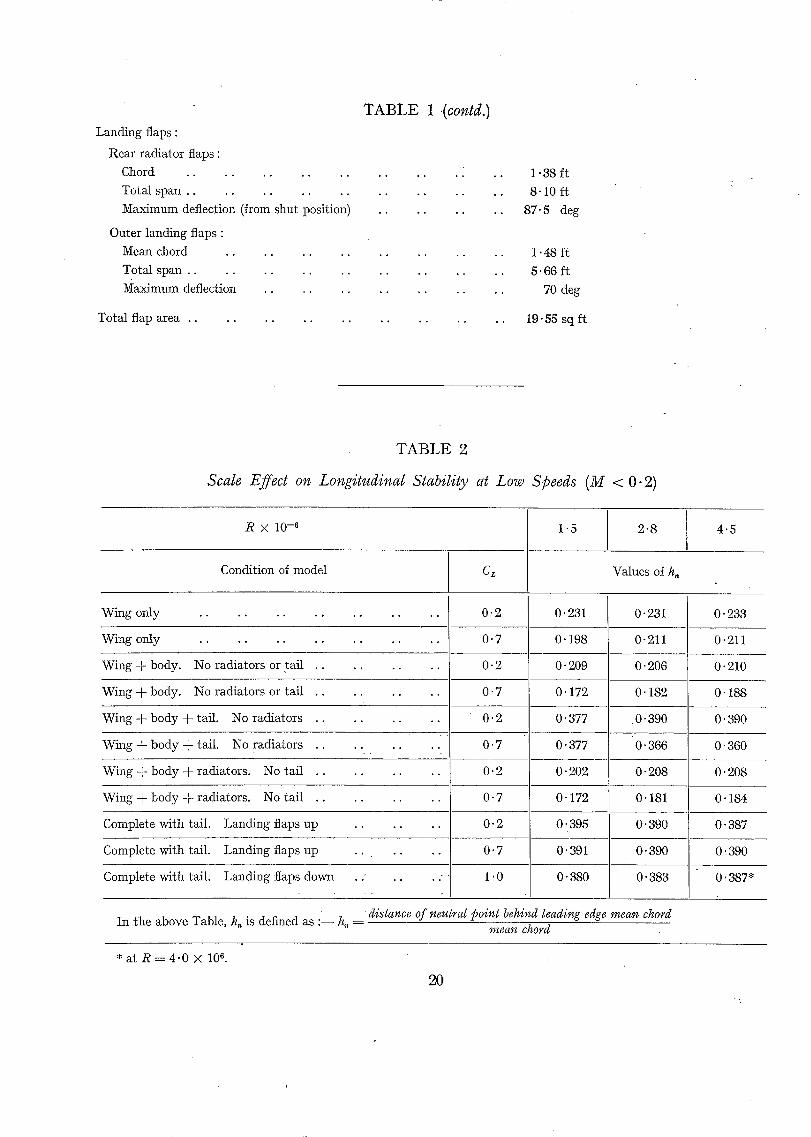
TABLE 1 (contd.) Landing flaps :
Rea r rad ia to r flaps :
Chord . . . . . . . . . . . . . . . . . . 1.38 ft
Tota l span . . . . . . . . . . . . . . . . . . 8 .10 ft
Max imum deflection (from shut position) . . . . . . . . 87-5 deg
Outer landing flaps :
Mean chord . . . . . . . . . . . . . . . . 1.48 ft
To ta l span . . . . . . . . . . . . . . . . . . 5 .66 ft
Maximum deflection . . . . . . . . . . . . . . 70 deg
Tota l flap area . . . . . . . . . . . . . . . . . . 19.55 sq ft
TABLE 2
Scale Effect on Longitudinal Stability at Low Speeds (M < 0.2)
R × 10 -8 1.5 2-8 4 .5
Condit ion of model Cz Values oI hn
Wing only . . . . . . . . 0 .2 0.231 0.231 0.233
Wing only . . . . . . O" 7 O- 198 O- 211 O" 211
Wing + body. No rad ia to rs or taft 0 .2 O" 209 O" 206 O. 210
Wing + body. No rad ia to rs or t a i l
Wing + body + tail . No rad ia to rs
Wing + body + tail . No rad ia to rs
No ta i l . .
0"7 0 .172 0 .182 0"188
0 . 2 0.377 0.390 0.390
0 .7 0.377 0 ' 366 0"360
0-208 0"208 Wing + body + radiators• 0 .2 0.202
Wing + body + radia tors . No ta i l . . . . . . 0 .7 0.172 0-181 0-184
Complete wi th tail . Land ing flaps up . . . . . . 0- 2 0. 395 0. 390 0" 387
Complete wi th tail . Land ing flaps up . . . . . . 0 . 7 0. 391 0.390 0.390
Complete wi th tail . Land ing flaps down . ' . . . . " 1.0 0- 380 0" 383 0.387*
• distance of neutral point behind leading edge mean chord I n the above Table, h~ is defined as : - - h~ ---
mean chord
* a t R = 4 . 0 x 106 .
20
0 P ¢.
II) _
tO J
J J 3 b.
P- b o - tO tO b_
t~
J
0
, ~ 0 . . 0 0
T--
<
!
I
ROOT SECT ION. = O. 130 c..
:~,/~ .005-010.0~5.0S0 075 1001.15 ,EO Z~ -30 .35 40 .45 ,50 .~5 .60 .65 .70 -75 .80-6S -~0 .95
~v/c .0105.0143 "0Z'~ '033; 04(C 0~&8 055! 06;~ ~. O&'~# ~70'3 0?30 074t 0740 07"Z8 0"/03 06~7 ~e~ 0507.04t7 03Z3 .~?.'~<~ ~l~ 0~64
~/~ oo~ .o~3s .ozo; ozv 034; o~Boj o¢~ o¢~ osz~ os43 oss~ oss~ os~s os~z o ~ o~s~ .o~1 o]~8 om~ oz~ o~t oee oo,~
T i P ~ECTION. bMAX. _ o.o$4-.
x/. . 065 .010 ¢?.5 .oso ,075 .',00 -15 .ZO .aS .30 .35" .¢0 -45 .50 .5~ .60 ,65 ,'70 .7~ .BO:,e,5 .~0 .95
~ / C 0055 0073 01g7,0~85 0Z3O .0Z~ ~33( .0~9| '0414 '045~ '0¢8~ .050~ '0~W 05tt .05"01,0~7e 043C 037~ ~30~ 07.3~ 4168 '010[ 4)044.
~dL/t. 004.6 oor~. OPgB ,t43¢ OiGo ,0183 02|E~ ,07:4~ ,OZTI ,Oz~l| ,030~ .0318 ,.03;;a O;Z~ .o~t~ .030~ 0272 BZ31 OIg& 014E. P~2, 005~ ,Ooz,;
FIG, 2, Wing sections.
21
(_. / FLAT 51nEIi~
:X/c. 01~5 025 .05 ,07S .t0 .1S .20 -50 .40 .S0 60 70
~ / c '01¢ ,0l~ .025 0 ~ .037.0¢Z.047'.0¢9.04~, 045 038.030
FIG. 3. Typical section of tailplane and elevator (2~ in from centre ]ine, full scale).
l I
INCHES. M00I~L SCALE.
FIG. 4. Section of radiator duct half-way along radiator (flaps shown in shut position).
pR.E ~>~URE ~4OLKS.
FIG. 5.
PRE'.5,Su~E
Section of front radiator flap, showing positions of pressure holes.

,I-0
'E L TRIMIVIED
0-~
0,6
0'4-
o.P.
o
-0"~
CL ,({'CURVES AT ~Og~lr. M ~. 13"-
- cL ~4 ¢URVESAT ~NST ~ ~. ,',6-- _ ' - - - 7 ~ - = . - _ . . _
~--9° " . . . . . . . . r --'".
. : . / _/ ___2 . . . . . _/__; ~-~:~- ~.~; ~" ~ ~ ~ M=o.3 :) M=0"4 ) M=O'SO M=0"6O
FIG. 6. Lift carpet--complete model.
10
CL
0"~
O'6
0 ' 4
0
- 0 " ~
I C[~¢~ CURVES AT CONSTANT M,
t - CLM CURVES AT CONSTANT e{. ~
~:7 7_ ...... I _/ ' " . -
4-- - - / i'--- z--"
~ = 0 °
FIG. 7. Lift carpet wing only.
28
/ \k
/

bD
CL
0.~
Z
0 . a l l - - X - # /
__222Z ~ f
0"1
/ / 1
/# xx
/ / / l ~l
\\ x\
,~ , \\
,
. . . . . . . . - r - - T T ~ c T x \
-0.1 R ~ I. 15 x lO b
_ _ WITH RADIATORS. NO TA iL PLANE . . . . . . WITHO~J'r RADIATORS
FIG. 8. Effect of lViach numbers on lift at constant ~, with and without radiators.
1 . 6
C L. T R I M M E ~
1'4
1.0
0.8
0.~
Z 0 2
0
7 5 ° .
R = 4 - 0 X I 0 ~
~ ~ = ~ . 8 X I 0
tSE~TA,LE' ~ I J I ; ~ o R : ,~.~ x Io ~
5 o I 0 ° 15 ° 0~, P.O °
Lift curves at low speed (MoO'2)- -complete model . FIG. 9.

b0 O1
! . 4
- 5
FIG. 10.
I.?-
CL
1.0
0"8
0 .6
R = , * . S x l o ~
Y
0'4
0'2
J 0 5 ° I0 ° 15 ° ,~ 20 °
Lift curves at low speed ( M < 0 " 2 ) - - w i n g only.
tO 6
IO &
6
,o,.
?_
1.6
C L. MAX
1.4.
1.2
, o
0 ' ~ 6 . 0
FIG. 11.
• ~ ~ . . . . . . . . . .
FLAreS DOWN. \COCFF~tENT / (RADIATOR FLAPS 87,5°, OLITER FLAP~ "70 e)
WING 0Nt.y \
' . . . _ . - o - . . . . . Jf . . . . . . . . .
= C2:C2:I I
G.2 ~.~ 6.~ G.8 7.0
Effect of Reyno lds number on m a x i m u m lift. (M < 0.2)
0 0.3
WING + ~0DY -WING+BODY. + R ADIATO IZ~
0 . 4
FIG. 12.
0.5 o,6 0.7 M 0.8
Effect of ~ a c h n u m b e r on lift gradient . R----1.15 × 10 6 . CL----0"2
0.~
0-09
C,,
0-0~
0 "06
0-0~
0.0"
0-0~
0-01
0
CL .=O 7
C L : O G
J /
/
/
C ~ : o . 1
C L : O . ~
CL : 0.4
~L = 0 3 .
f..~- :0"1 CI..=O
Ct..= 0.;'!
/ '
0.3
FIG. 13.
o . 6 o-~ o-6 0-7 N 0 .8 0-~
Ef fec t of ~ a c h n u m b e r o n d r a g a t c o n s t a n t C • - - c o m p l e t e mode l . R = 1 . 1 5 × 10 °.
0.0
0.0~
C~
0.0"
O-O~
0-0~
0.0~
0.03;
0.0~
o-ol
,/ i, I //
cL : o.¢ ~ ~ /
c L = o . s , j 1
C~.-o c - =o.1.
0-3
FIG. 14.
0 . 4 0-5' 0 . 6 0-7 b41 - 0 .8 0.5.
Effec t of ~ a c h n u m b e r o n d r a g of w i n g a t c o n s t a n t l i f t c o e ~ c i e n t . R ~-- 1 -15 × 106.
, 0.0~
o.o~ i
O,O&
C~
0.07
0.06
0,05
0.04.
0.0~
0.0~
0.01.
- - SPITEFUL " SPITFIRE I
R = t , l ,~ IO G
( - L = 0 3 ,
L . . . . . . . . . . . . . .
EL = O.I.
f
f
[
# , / / /
0.3
FIG. 15.
0-4 O.S O,G 0-7 M 0.8 0.9
Effect of lVfach number on drag of complete model, comparison with Spitfire I.
0.09
C O
0"07
0 ' 0 6
• 0 ' 0 5
" 0"04.
0"03
0"02
0 ,Ol
EL= 03 [SPITFIRE I /
R ~ I - I x I 0 6
0.3
FIG. 16.
~SPITFIRE I CL =
0.4 0.5 0-6 o:7 M 0.8 0-9
Ef fec t of M a c h n m n b e r on d r a g of wing , c o m p a r i s o n w i t h Spi t f i re I,

[,0 (50
0 . 0 8
C~
0 - 0
O,0~
O.0. ¢
0-04-
0-O3
O.O~.
0"01
SPITEFUL,NO RADIATOR5 OR TA lL PLANE. f
f . . . . . . SPITFIRE I , NO P-,AQI~TOR, OIL COOLER,
I OR TP~IL. PL/~NE.
R.= ! - | ~ . I 0 G
| ~ 4- - . . . . . . i
0 0.3
FZG. 17.
///•// I /I
/
LI:: ;/ - - - - - Cu=o4u...-"
0-~ 0 -5 O'G 0.7 0-~ M 0.9
Effect of Mach number on drag of wing + body, comparison with Spitfire I.
+0"10
IXcL
+O "0:..,
-O'OS
-0 "IC
2.O
LB, DRAG, F..5. AT IOO FT./$E(
15
0 ' 3 O"

t~3
~ 0
Le, OR~,G ES. ~.T (oo FT/$EC
IO
O
3 0
g5
LB, 0 RP, G. F 5 ATIOOF'E
£ 0
I ° Ct- ' : -~ 0 " '
ra t ' l_ = O.P_
X C L = O . 4 .
C..~. = 0 .4
~ _ . . . _ ~ o=o ~ CL : O.<?. -
o //o
0 . 3
FIG. 20.
O C L - O
X C L = 0 . 4 -
t S
0 . 4 0 . 5 0 - 6 o ; 7 H 0 ' 6
Drag of radiators, rear flaps shut, front flaps 2 deg open.
/
G
g
x
~o ~ ~ ~______ ~
0.3 0 . 4 o , o . G 0 . 7 M o s
FIG. 2i. Drag of radiators, rear flaps shut, front flaps 5 deg open.
- 0 .g
+ 0 . 0 5
c
-0"OE;
- O . I O
- o . 1 5 .
M = 0 . 3 1
"L,. = - 1 . S °
A
I I
I i
/
/ /
'"'N CL
- v o - l o
+ o - o S
- o - 0 5
- O . f O
- o , t ~ .
--___% ~ f
%
M = o . 4 1 .
R = I - I ~ Y~ I~ 6
" q 7 : - t , ~ °
~ . ~ I I
B
C
FIG. 22. Pitching moment curves (constant tailplane setting).

c~
4 - o . t 0
£ ~
-(3 .Z.
+ o-os ~ . . . . . ~ j ,o .
M : o . 5 t
IZ : i'IS A IO G
- O d O q"#¢ : - t . 5 0
- O d S
C
-/ / I I
X~ CL
-c Z
+o.Io
+o.o5
- o . o S
).E -I-C
M : O . G I - 0'I0
= i" 15 A 10 G
~ = -I.5 °
-: O.tS I
/
/
.4
?
J
D FIG. 22~ Pitching moment curves (constant tailplanc
setting).
t-~'. 10
E~
-I-0.05
).Z 0
-O.OS
- - - 0 ' 1 0 -
+ O,OS
-0 '05
- - - 0 " ] 0 -
FIG. 22.
~ '2 0 4 . 0 :
I - '7., I
M =0"66
R-- t.ls xlO ~
~r = - 1"5°
E
1 1 / 1 1 /
J\
H -- 0"70 R . = ] ' I 5 X IO 6
"0 .T= - 1 . 5 ~
I
C~ '8 1'(
F Pitching moment curves (constant tailplane
setting).
Co
+o-~-~-o - ~ ~ I -
-O 'Z
---0-10
M = 0 "73 ] ~
i ~ z = - 1 . 5 °
G
eL,
0'8
\' \
FIG. 22. H
Pitching moment curves (constant tailplane setting).
0'15
O'E
0'10
0 ' 0 5
-- ~,'Oo \
" ~ " 0 , CU
- - 0 - 0 5
M = 0"8: ~ ' ~ t \ r = l .~xlo G
--O'lO e~T= -- 1.5 °
I
0'15
C~ 0"10
\~, ,
o ., . CL o.6
- O.OS ' ~ ~
R ~_..I.ISX IO G \
"qt = -~ 's° ' ~
- 0 . 1 0 3"
FIG. '22. Pitching moment curves (constant tailplane setting).

"0'
0"10
Cm
A
- 0"05
- 0 "tO
.. Q /
z o , o s ~ 6 ~
M = 0 " 4 1 R-~.. I. 15X I0 6
" q = O *
I ' 0
C-.t.
- o ' t 5
FIG. 23.
B Pitching moment curves (constant elevator
angle).
"O' i
- 0 "
0 4 0 ~ -,
i I
" ~ ~ - - ~ , .~ - - -" o . ~ 0 . ~ o.~
M =0.51 ~ I.ISXlO 6
1 1 . o ° -OqO
-O'J5
C
\
0 ' 1 5
O-Io
0.05 ~ -,~9~"P
. -k.~_ o,a 0.6
- O . O S
- 0 ' I 0
FIG. 23.
/ ?
M = O ' G I ]
R ~- [.IS x lO ~ / ? 7 = 0 ° ]
[3
Pitching moment curves (constant elevator angle)
I 'O
CL
('3
03 03
- 0 ~
-0,~
+ 0 .l!i
0 ' I 0
C~
OOS
0
- O,OS
- - 0 " I 0
< 1, . t - ~ 0'2
M = o . r o 6
R~ =~ 1,15 X I 0 &
w // //
o,t
~,/ , ' /
J 0 .6 O,B I,C
C u
E
O.15
C
O. I'O
0'05
o--~.
-o:o5
- 0 , 10
M = 0 . 7 0
~ 1.15 x IO g
l
O,G 0,8
FIG. 23. P i tch ing m o m e n t curves (constant angle).
I-0
C L
elevator
-0-~
0.15
O.lO
0.05
O
--0,05
M=0.73 I~ ~ 1-15 x IO G.
~=, 0 ° I
---. .
\
\ o-6 C t 0.8
\
G
-0.~
0.15
C~
0dO
0 , 0 5
0 ' 2
. 1 / /
- 0'05
- 0.10
FIG. 23.
I M = 0.77 R ~ I'15~I0 6
= 0 Q
H
Pitching moment
\ \
Cu 0.8
elevator angle). curves (constant
- 0 . 2
~ 0 - ~
o.,5"-.
0.IO
/
-o.os~ \
M : 0 , 8 0
R , ; ~ i . iG X i o C' \ - q : o °
-OdO I
I
FIG. 23.
o-I~
C~
OdO
-o.o~ k
M = 0 - 8 ? .
R ~ 1.1~ x lO ~ \ -~ ~ 0 °
Pitching moment curves (constant elevator angle).
).G
O . I O
0 . 0 !
- - 0 " 0
, - t . ~ o .G
C.t.= O.4-
,"L. = 0.3
~'3 0 ¢ ¢ - ~ . = o 4 C-~ ~ - L = O
M. o.!
FIG. 24. Pitching moments wi thout tailplane (with radiators).
O- ~O
/ c ~ ~ /
CL.=O I • " L = o .1 . . . . . . ~ . ~ _ ~
- O O ~
FIG. 25. P i t c h i n g moments with tailplane radiators, ~ ---- - - 1"5 deg, 17 = 0 deg).
~ , 0 .9
(with
~ 4
+ ~ °
0 o
- 2 . °
C-L= O. 4 . _...-.....-
0.~
FIG. 26. Effect of ~ a c h number on elevator angle to tr im (complete model with radiators, ~ = - - 1-S deg).

0-05
o
- 0 . o 5
_~.3 o.
t ' t . : 0 . 7
CL : o.ro C~ : O-S Cu :0.4
4 ~s
Ct,, : O . a Ct. = Q,I t~#_ = 0
%
o.1~] M. 0
FIG. 27. Effect of Mach number on pitching moment , wing only.
+O.iO
C ~
q-O.ON
0 0 . 3
-0.0~
~ t . = O ~t . = o.,i
t ' L . = 0 . 2
1
FIG. 29. Effect of 1Viach number on pitching moment , wing -[- body -}- tailplane (no radiators). ~?~ = - - 1.5 deg, ~ = 0 deg.
+ o . t o
+ o.05
- o-os
- 0 . | 0
C~.= o_o~ f
~L=0.7
CI. . = O ' G
~.~ O,
, , C L = 0 . ~
CL=O.t C L : O
o ,~
FIG. 28.
o. M o
Effect of Mach number on picthing moment , wing -]- body (no radiators or tailplane).
0'40
0 '30
0 ,20
O , l O
o.~
rL=o.~ / C-L" = 0-,%
// L = O ' ~
0 . 4 0"~ O,G 0"7 O.& M
( co,h FIG. 30. Effect of Mach number on - - k, SCz,}~
0 . 9

c,0
¢
CL I = d C _ k T (CLT= T, I~.LI I~T COE~FTI
O(.r = EFFECTIVE T A I L P L A N E INCIDENCl ¢~ = WING INC IDENCE
q?'r = - 3 " 5 ° TO + O ' 5 °
" • = O a
R ~-~-. I ' I S X I O 6
¢~= o °
/ = , t = 4 -°
d.,=6 °
0 ' ~ 0 4 . O'5 0 ' 6 0"7 O 'B MACH NUMBER
O ' ~
FIG. 31. Effect of Mach number on tailplane lift gradient..
3
CL 2
2
I
0
0'3
FIG. 32.
d CLT COEFFT.) (3.?. = d--~-, { C L ~ T.P. LiF'T
o ( = WING INCIDENCE
~T = - I-5 °
'r{ = - 1:5" 'To + 30
R ~ 1'15 X IO 6
0-4- 0"5 0 " 6 0 ' 7 O ' ~ 0 . 9 MACH NuMP, ER
Effect of Mach number on tailplane lift due to elevator.
o IO
C~
4 - o OS
- O IO
J
FIG. 33.
+
- - E P - - /Z -] ?--8 ,,¢. I0 ~
- - - x - ~ R = I - S ;<, | o ~
R = 4 - 5 X tO G NO TAIL P L A ~
WITH TAIL PLANE. =-~ ~-- - -~,~ r l = o ° q - r=-1-5 ° "~
Pitching momen t curves at low speed ( M < 0.2), wing + body (no radiators).
0 0 . 3
- 0 - o $
-0-10
o4- G 0 7 0 - 8 N 0 '3 , 0 . ~ i
Wll~lg +l~0ny + RADIATOR~;
~/ING_ ONLY
---....
E
4 °
FIG. 34. Effect of Mach number on C,0.
C L = 0 . 4 -
CL = 0.3.
,(" t. = 0-1. l
0-3 o 4 o s o.G o-7 o-8 H. o ~
FIG. 35. Effect of lYIach number on downwash angle at t3il.
C~
0-10
0-05
-0-05
-0.30
+ R : 4'7 X ]0 6
- - ~ - - R= 2.SXIO ~ --M.-- ~= 1"S X IO 6 ~ * o
~,f~ so
I. FIG. 36. Pitching moment curves at low speed (M < 0.2),
complete model (flaps up).
*0'1
,t- 0 .d [ , ,
- 0 ' 0 5
FIG. 37.
O R = 4-5 x IO" - - E } - - R = 2 " 8 X I O 6 - - ) ~ - - R-" 1 '3X JO ~,
0.6 0 . 8 ~.0 Ct. 1-~
Pitching moment curves at low speed (M< 0.2), wing only.
+o"15
C m
+ O ' 1 0
t-o.o,5
-0 '05
-.O-- R= 4 ' 0 ,X IO 6
- -G - - R = ?..B~. IO ~'
--.-.~--R= 1"5 x IO 6
O.~ o . 4 o . 6 o. g I'O
FIG. 38. Pitching moment curves at low speed (M< O. 2), complete model--landing flaps down.
37
0'61 ~.
0"4-
0.?.
(~ISTANCE F'ROM L.E OF FRONT FLAP, INCHES FULL 5CALF-., I (MEASURED ALONG SURFACE) I 2 ~ 6 8 10 t~
- o "
- 0 " 8
- I ' O
-1"2
- ) . 6 t
FIG. 39. Pressure distribution on front radiator ftap, flap shut, wing incidence = -- 0.87 deg.
0.8
0-to "-~
c I,
0.4
0'~
-0'4-
-0 '6
- I .0
DIgTAMCE FROM L.E OF FRONT FLAI~, IMCHEG FLILL SCALE£. 4(HE&SLJREI:3 ALONG 6LIRFACE.)
6 8 iO
i f j
/ /
/ /
/
FIG. 40. Pressure distribution on front radiator flap--flap shut, wing incidence = + 1.24 deg.
/ /

O0
0.8
0.6
cp 0.4
0.~
-0.~
-0.4-
-0 .6
-0"8
~i .0
f I~I~TANCE FROM L,E. OF FRONT FLAP. , INCHES F/ILL SCALE.
~. O -~J
FIG. 41. P r e s s u r e d i s t r i b u t i o n on f r o n t r a d i a t o r f l a p - - f l a p s h u t , w ing inc idence = + 3 . 3 4 deg.
+0 '+
cp
-~0.2
DISTANCE FROM L.E. OF FRONT FLAP INCHES ~'ULL SCALE, ( MEASURED ALONG SURFACE)
o 2 4 ~ 8 .bo j~
-0.1
-O.~
-0-~
- I .O
-1"2
- I . 4
°~~ _ ~ ~ . i ~ . -
•
FIG. 42.
I
P r e s s u r e d i s t r i b u t i o n o n f r o n t r a d i a t o r flap, f lap 2 deg. open, w ing inc idence = - - 0 ' 87 deg.

+ 0 . 4
cp
-t- 0. ~
0 .~
-0 .4
-O.G
-0 -8
-1"0
- I . 2
- 1 " 4
t DISTANCE
2
FROM L E. OF FRONT FLAP INCHE5, FULL SCALE.
G t 0
z
FIG. 43. Pressure d i s t r ibu t ion on front r ad ia to r f l ap - - f l ap 2 deg open, wing incidence = + 1.24 deg.
0 .4 -
0 . 2
O
- 0 . 2
- 0 - 4 -
- o . C =
- o - &
- t . o
- I - 2
- t " 4
I I DISTANCE
2
,I
Fro. 44.
FROM L.E. OF FRONT FLAP, INr_ItE5 FULL SCALE (MEASURED ALONG 5URI=ACE)
4 6 8 tO 1
O &
Y:d ~ y ~ ~ ~ J ~I -'~ ~ ,
Pressure d i s t r i ba t ion on front r a d i a t o r f l a p - - f l a p 2 deg open, wing incidence = + 3-34 deg.

+ 0'2 I
O
DISTANCE F'ROM L.E Of-FRONT FLAP, INCHES F'ULL.SCALE ( MEASURED ALONG .SURFACE )
~'o-~
~[m. i OISTANCE FROM(.MEASLIREoL.E. OFALONEFRONTsuR, F/~.CE..~F'LAp j INCHES, FULL SCALE. O o 2 4 G & IO
-O.Z
-0"4
- 0 ' 6
- O . ~
- I . O
- I ' Z
- 1 4 -
-I "6
-1"8
- a . 2
- 0 . 4 -
/ /
- O - t ~
_
- I ' &
! /
/
/ /
/
- 9 . . 0
FIG. 45. Pressure distribution on front radiator f lap--flap 5 deg open, wing incidence = - - 0 .87 deg.
- 2 . 0
FIG. 46. Pressure distr ibution on front radiator f lap--flap 5 deg open, wing incidence = + 1.24 deg.

l'O
c l,
0
DISTANCE FROM L.E OF" FRONT FLAP, INCHES I~ULL SCALE
_. • (MEASURED ALONG SURFACe)
o .. 2 4 ~ S 1o I~
- 0 . ' 2
- 0 " (
- O ' g ~0'~
_,o ' < ; / / /
- i • 2 y /
oq - I . 4 -
- I ' G
FIG. 47. Pressure distribution on front radiator flap--flap 5 deg open, wing incidence = + 3.34 deg.
2.0 , ?__~,,
-Cp , /
?2: -- . 0
0.~
0-4.
0.2
F'~NT RLA~ 2 ° OPL'~.
-----FRONT FL~kP 5"OPEN.
04.
Fro. 48.
o.s o . ~ 0 .7 M o . ~
Radiator front flap, peak sucfion coefficients.

5oo
CRITICAL T.A.S (M.P.H)
45O
400 0
FIG. 49.
I 0 , 0 o o '2C 0 0 0 30 0 0 0 4.0,000 ALTITUDE - FT
Critical speed of radiator (front and rear flaps shut).
~.s
9_'O
1"5
CH~
CF
I 'O
O.5
FOI~'C.E COEF'FICIANT C F J
= NORMAL FORCE ON FLAP (Po$1TI~' CF ( FLAP ARIEA)X Va {~ V~-
I
HINGE MOMENT COEFFICIENT C H
.
FLAP HINGE MOMENT (PO~ITIVI CN =(FLAP REA)X(FLAf CHORD))~I/P.~V ~" TO OPE
"o
E DOWNWARr
TENDING N FLAP)
IT HAS BE BEEN ASSUMED THAT THE INTERNAL PRESSURE IS EQUAL -ro THE STAGNATION PRESSURE IN "THE FREE ,STREAM
o I O'5 0"~, O "5 0-6 O.'7 O .~ M 0-9
FIG. 50. Effect of lVIach number on radiator front flaphinge-moment and force coefficients. Front flap 2 deg open, wing incidence = + 1.24 deg.
43
P A R T I I I
Tests on Cabins for the Spiteful By
W. A. Mair% M.A. and S. P. H~JTTON, B.Eng.
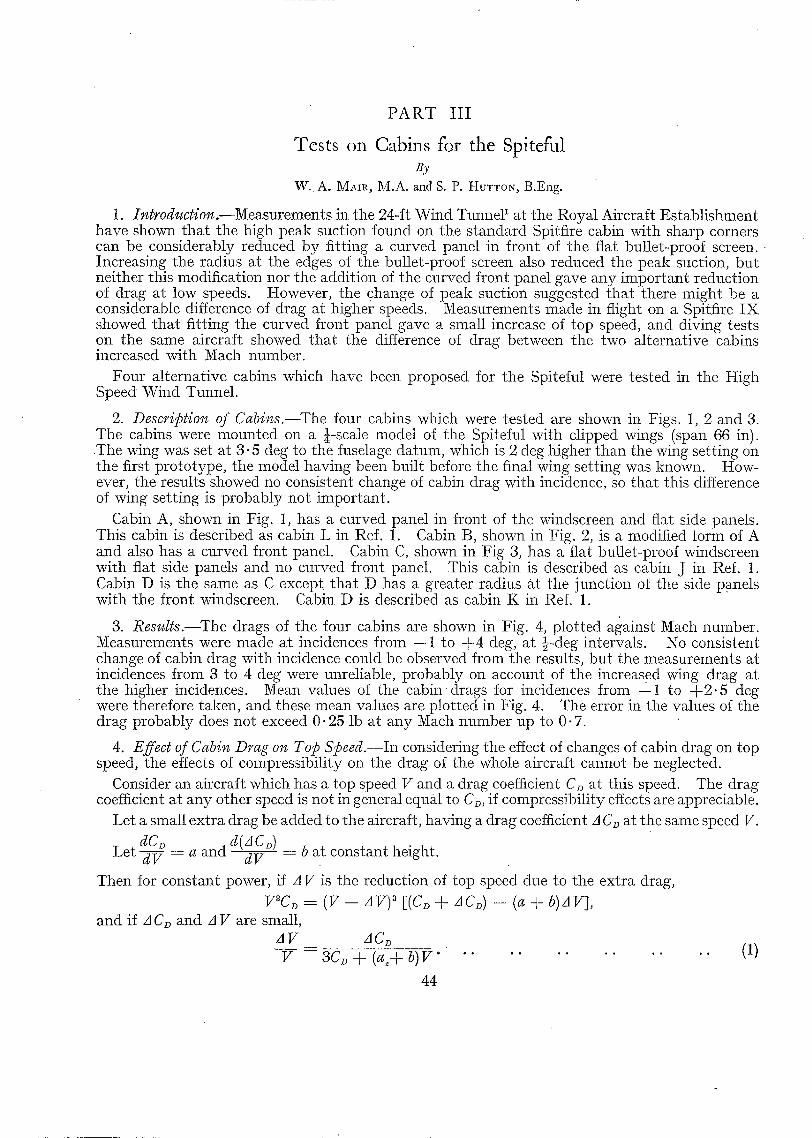
1. Introduction.--Measurements in the 24-ft Wind Tunnel I at the Royal Aircraft Establishment have shown that the high peak suction found on the standard Spitfire cabin with sharp corners can be considerably reduced by fitting a curved panel in front of the flat bullet-proof screen. - Increasing the radius at the edges of the bullet-proof screen also reduced the peak suction, but neither this modification nor the addition of the curved front panel gave any important reduction of drag at low speeds. However, the change of peak suction suggested tha t there might be a considerable difference of drag at higher speeds. Measurements made in flight on a Spitfire IX showed that fitting the curved front panel gave a small increase of top speed, and diving tests on the same aircraft showed that the difference of drag between the two alternative cabins increased with Mach number.
Four alternative cabins which have been proposed for the Spiteful were tested in the High Speed Wind Tunnel.
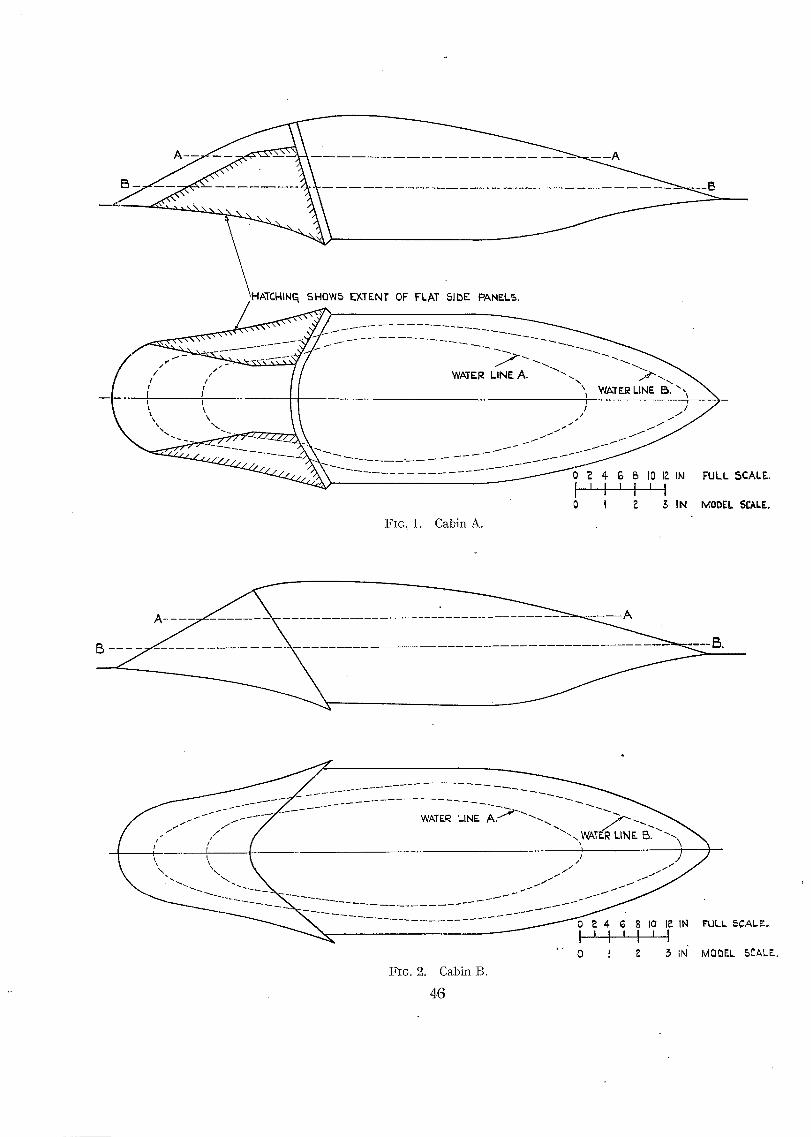
2. Descr@tio~ qf Cabins.--The four cabins which were tested are shown in Figs. 1, 2 and 3. The cabins were mounted on a 1-scale model of the Spiteful with clipped wings (span 66 in). The wing was set at 3.5 deg to the fuselage datum, which is 2 deg higher than the wing setting on the first prototype, the model having been built before the final wing setting was known. How- ever, the results showed no consistent change of cabin drag with incidence, so that this difference of wing setting is probably not important.
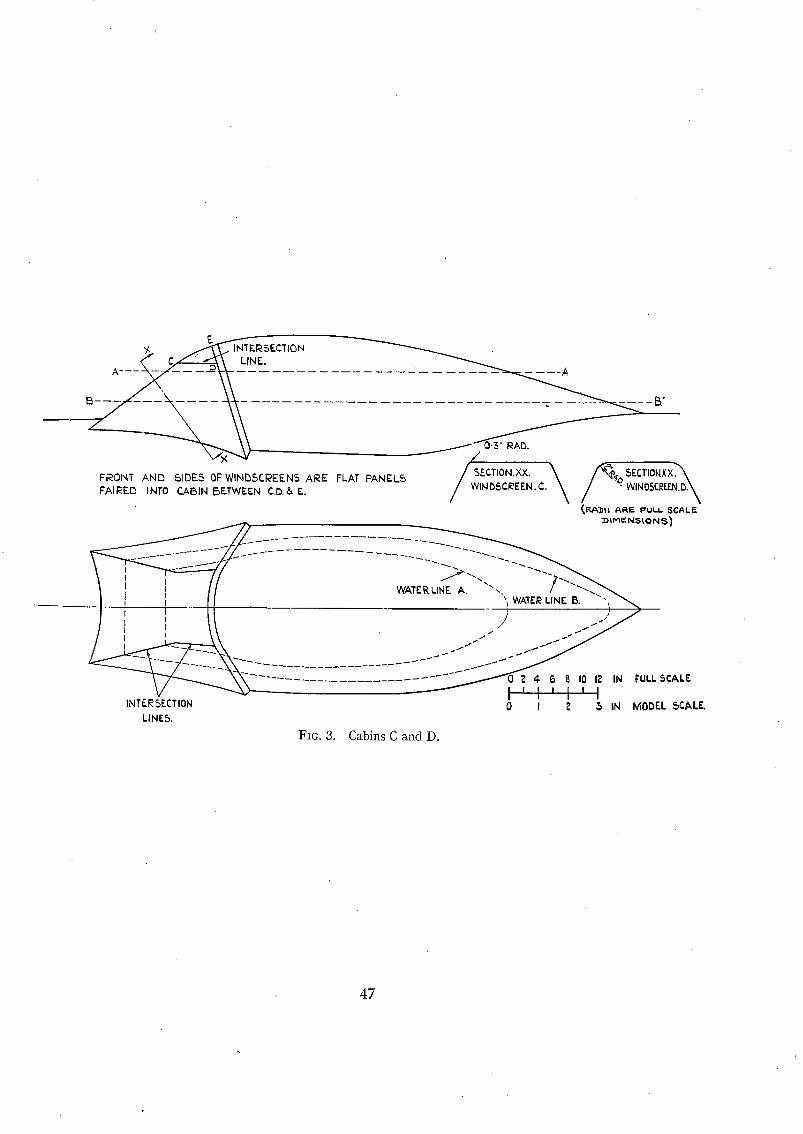
Cabin A, shown in Fig. 1, has a curved panel in front of the windscreen and flat side panels. This cabin is described as cabin L in Ref. 1. Cabin B, shown in Fig. 2, is a modified iorm of A and also has a curved front panel. Cabin C, shown in Fig 3, has a flat bu!let-proof windscreen with flat side panels and no curved front panel. This cabin is described as cabin J in Ref. 1. Cabin D is the same as C eKcept that I) has a greater radius at the junction ot the side panels with the front windscreen. Cabin I)' is described as cabin K in Ref. 1.
3. Results.--The drags of the four cabins are shown in Fig. 4, plotted against Mach number. Measurements were made at incidences from - - ! to + 4 deg, at ½-deg intervals. No consistent change of cabin drag with incidence could be observed from the results, but the measurements at incidences from 3 to 4 deg were unreliable, probably on account of the increased wing drag at the higher incidences. Mean values of the cab indrags for incidences from --1 to + 2 . 5 deg were therefore taken, and these mean values are plotted in Fig. 4. The error in the values of the drag probably does not exceed 0.25 lb at any Mach number up to 0.7.
4. Effect of Cabir~ Drag on Top Speed.--In considering the effect of changes of cabin drag on top speed, the effects of compressibility on the drag of the whole aircraft cannot be neglected.
Consider an aircraft which has a top speed V and a drag coefficient C~ at this speed. The drag coefficient at any other speed is not in general equal to CD, if compressibility effects are appreciable.
Let a small extra drag be added to the aircraft, having a drag coefficient A C~ at the same speed V. dC. d(ACD)
Let d--V ---- a and dV -- b at constant height.
Then for constant power, if A V is the reduction of top speed due to the extra drag,
V~C~ = (V -- AV) ~ E(C~ + AC~) -- (a + b)aV], and if A Cv and A V are small,
A V ACD v - + b ) v " . . . . . . . . . . . . O)
44

In considering the effects of cabin drag, b is negligible in comparison with a and the expression ~educes to
A V ACD v - 3 c D + . . . . . . . . . . . . . . . (2)
Values of the dimensionless coefficient dC./dM, from which the quant i ty a is derived, are plotted against Mach number in Fig. 5 for the Spitfire and Spiteful. The values for the Spitfire are taken from the results given in Part I, after applying corrections for blockage. The values for the Spiteful are t aken from some early tests on the model without radiators. Since the radiators on the Spiteful have a rather low critical Mach number, the values of dCD/dM given for the higher Mach numbers in Fig. 5 may be too low.
Of the four cabins tested, C has the highest drag at all Mach numbers and A has the lowest drag over the most important part of the speed range. Using the values of cabin drag and dC,/dM given in Figs. 4 and 5, the increase of top speed of the Spiteful due to a change from cabin C to cabin A has been calculated, and the results are plotted in Fig. 6. I t has been assumed that the drag of the full-scale aircraft is 60 lb at 100 ft/sec and tha t the range of top speed con- sidered (400 to 480 m.p.h.) is obtained by variation of engine power. The calculations have been made for a height of 30,000 ft, but the effect of altitude on the speed increment is small.
5. D~sc~tssio~.--Cabins A, B and D show very little increase of drag with Mach number, for values of M below 0.7, but the drag of cabin C increases by about 1 lb as M increases h-om 0-6 to 0- 7. The peak suction coefficient on cabin C is 1.8 at low speeds (Ref. 1), and the correspond- ing critical Mach number as calculated from this suction coefficient by K&rm&n% formula is 0-48. However, pressure measurements on a Frise aileron 2 in the High Speed Wind Tunnel have shown that, on bodies which have high peak suctions at low speeds, the suction may decrease with increase of Mach number, the effect being probably due to separation of the boundary layer near the point of maximum suction. In such a case the critical Mach number, as calculated in the usual way from low-speed pressure measurements, has no meaning. Thus the increase of drag of cabin C is not necessarily the result of t h e formation of a shock wave, and may be due to a separation of flow at the sharp edges of the front windscreen which becomes more serious as the Mach number increases. Also, the appearance of shock waves on the other cabins may possibly be delayed by local separations which reduce the peak suctions.
ThE drags of cabins A and I) at M = 0.4, given in Fig. 4, agree fairly well with the values measured in the 24-ft wind tunnel at very low Mach numbers, but the drag of cabin C at M = 0 .4 is considerably greater than the value found from the 24-ft tunnel tests. This suggests that there was some separation at the sharp edges on cabin C at M = 0.4 which was not present at the very low Mach number of the 24-It tunnel tests.
Flight tests ~ on a Spitfire IX have shown that changing the windscreen shape from C to cabin A gives an increase of top speed of about 5 m.p.h, at about 420 m.p.h, at 24,000 ft. 7his is equivalent to a reduction of drag of 2.3 lb due to changing from cabin C to cabin A, at M =-- 0.6. This reduction of drag is about 1 lb greater than the reduction shown in Fig. 4.
No. Author
1 Duddy . . . . . . . . . .
2 Mair, Thompson and Hut ton . . . .
3 Stewart . . . . . . . . . .
REFERENCES T~tle, e~o.
Wind Tunnel Tests on Alternative Spitfire Cabins. R.A.E. Technical Note No. Aero 1213. (June, 1943.)
High Speed Wind Tunnel Tests on a Spitfire Type Wing and Aileron. A.t{.C. 7169. (August, 1943.)
Effect of Conical Windscreen on Performance of a Spitfire IX. I{.A.E. Technical Note No. Aero 1284. (1943.)
45
EXTENT OF FLAT 61DE PANELS,
WATER LINE A. " ' , , /7,,'-......
- - t - " , - - 4 - - - - - - - + - - - , ' ~ . . . . ,~ ~.9~R L~NE B. ",~ ~ \ ", \ II ,; - - ; / ~ / /
~22 mLL SCALE. I I I I I I I I J I 0 t P 3 IN MODEL SCALE.
B _ _ _
L_.
FIG. 1. Cabin A.
WATER L.IN~ A . 7 " > " " - - ~ "'-- ,, WATE'R t..~ N F.. l~. ""-,~,
- ; ~ ~ ) / J
I I I I I I I I I I
";" 0 t ~ ~ IN" MODt'.L 5CAL.E..
FIG. 2. CabinB.
46
L -/, ~ INTERSECTION
FRONT AND SIDES OF WINBSCI~EEN5 ARE FLAT PANELS FAIRED INT0 CABIN BETWEEN C.D. & E.
INTERSECTION LINE~.
B."
~ I I RAD.
/~SECTION.XX. " 5ECTIONX X . ~
f~P,A~)IL ~,~E FU'' SCAL~ :DIMEN.SLQN ~)
I ' I ' I ' I 0 I ~ ~ IN MODEL SCALE,
WATER LtNE A. "-, / " - - . ~
- - - ~ - ~ " " " ~ 4 6 g I0 I~ IN F'ULLSCALE
FIG. 3. Cabins C and D.
47

(L
~ j
0 0.5
i (i) CABIN .A X CABIN . 5 . r."l CABIN. C. A CAB, II l .l::).
Y
/ J
B
f [ ]
&
0.4. 0.5 0.8 0-7 O.B M ACI..L N~'
FIG. 4. Drag of alternative cabins.
d, Co. & M
0.03
0.0~
0.0~,
0
0 '~
FIG. 5.
5 PJTFI~F.. ].
S ~ ( " se|TEFuL (NO RADIATORS)
, - ~ I 0"¢ 0.5 0"6 07 MACH. O.B
N o .
Rate of increase of drag with Mach number.
C~ INCI~KA~K
M.I~H
4
(
?.
j J /
0 400 4-~'0 440 ~.G0 4B0
T.A.5,. M,P.H,
FIG. 6. Increase of top speed at 30,000 ft due to change from cabin C to cabin A.
48
P A R T IV
Tests on the Attacker (E. I O/Jr4. ) By
s. P. HUTTO~, M.Eng., D. A. CLaI~V:~, B.Sc.(Eng.) A.C.G.I. and D. J. T~RMLtT'r, B.Sc.(Eng.) A.C.G I.
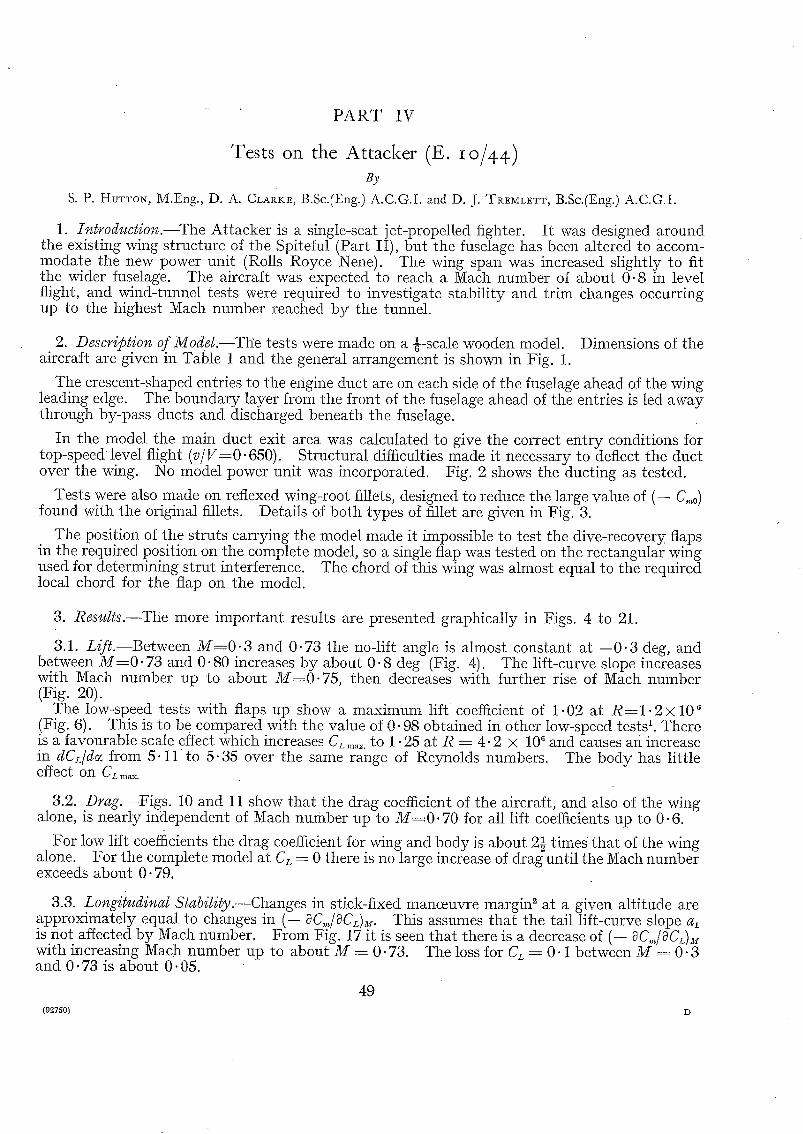
1. Introduction.--The Attacker is a single-seat jet-propelled fighter. I t was designed around the existing wing structure of the Spiteful (Part II), but the fuselage has been altered to accom- modate the new power unit (Rolls Royce Nene). The wing span was increased slightly to fit the wider fuselage. The aircraft was expected to reach a Mach number of about 0.8 in level flight, and wind-tunnel tests were required to investigate stabil i ty and trim Changes occurring up to the highest Mach number reached by the tunnel.
2. Descr@tion of Model.--Ttie tests were made on a {-scale wooden model. Dimensions of the aircraft are given in Table 1 and the general arrangement is shown in Fig. 1.
The crescent-shaped entries to the erigine duct are on each side of the fuselage ahead of the wing leading edge. The boundary layer from the front of the fuselage ahead of tile entries is led away through by-pass ducts and discharged beneath the fuselage.
In the model the main duct exit area was calculated to give tile correct entry conditions for top-speed level flight (v/V=O. 650). Structural difficulties made it necessary to deflect the duct over tile wing. No model power unit was incorporated. Fig. 2 shows the ducting as tested.
Tests were also made on reflexed wing-root fillets, designed to reduce the large value of (-- C,,,0) found with tile original fillets. Details of both types o~ fillet are given in Fig. 3.
The position of the struts carrying the model made it impossible to test the dive-recovery flaps in tile required position on the complete model, so a single flap was tested on the rectangular wing used for determining strut interference. The chord of this wing was almost eqllal to the required local chord for the flap on the model.
3. Results.--The more important results are presented graphically in Figs. 4 to 21.
3.1. Lift.--Between M = 0 - 3 and 0-73 the no-lift angle is almost constant at - -0 .3 deg, and between M = 0 . 7 3 and 0.80 increases by about 0" 8 deg (Fig. 4). The lift-curve slope increases with Mach number up to about M = 0 - 7 5 , then decreases with further rise of Mach number (Fig. 20).
The low-speed tests with flaps up show a maximum lif t coefficient of 1.02 at R----1.2× 10⁶ !Fig. 6). This is to be compared with the value of 0.98 obtained in other low-speed tests ~. There is a favourable scale effect which increases CL ...... to 1" 25 at R = 4.2 × 10⁶ and causes an increase in dCL/d~ from 5. l l t o 5.35 over the same range of Reynolds numbers. The body has little effect on CLm~x.
3.2. Drag.--Figs. 10 and 11 show that the drag coefficient of the aircraft, and also of the wing alone, is nearly independent of Mach number up to M = 0 . 7 0 for all lift coefficients up to 0.6.
For low lift coefficients tile drag coefficient for wing and body is about ol ~,~- times that of the wing alone. For the complete model at Cr = 0 there is no large increase of drag until the Mach number exceeds about 0.79.
3.3. Longitudinal Stability.--Changes in stick-fixed manceuvre margin 2 at a given altitude are approximately equal to changes in (-- ~C,,]aCL)M. This assumes that the tail lift-curve slope a~ is not affected by Mach number. From Fig. 17 it is seen tha t there is a decrease of (-- aC,~/OCi)M with increasing Mach number up to about M = 0.73. The loss for CL = 0" 1 between M ---- 0- 3 and 0.73 is about 0.05.
49 (92750) D
Figs. 18 and 19 show that downwash and a, do not vary much with Mach number. Thus the main reason for the decrease of stabili ty seems to be the large difference beween the changes of tailplane and main plane lift-gradients with Mach number. As the Mach number increases, the wing lift gradient (Fig. 20) rises steadily, whereas al for the tailplane (Fig. 19) is approximately constant up to M = 0.82. Consequently the stabili ty decreases with increasing speed until dCz,/do~ starts to decrease at M -- 0.73 ; the stabili ty then begins to increase with speed.
A part of the difference between the changes of these two lift gradients with Mach number is accounted for by the difference in aspect ratio. The remainder may be due to wake effects at the tailplane.
Fig. 9 shows tha t the body has a fairly large destabilizing effect at low speed and shifts the aerodynamic centre forward by about 0.06~. As the Reynolds number increases from 1.2 × 10⁶ to 4.2 × 100 the neutral point, with or without tail, moves back slightly.
3.4. C,,,0.--This is numerically large even at low speeds (Fig. 9). Fig. 16 shows that a large part of this is due to the body and that the body contribution is approximately independent of Mach number.
The value o f - C,,,o increases steadily with Mach number from 0.05" at M - - 0 . 3 to 0.09 at M = 0.82. The tests do not cover higher I~iach numbers, but the curves at higher lift coefficients suggest that the C,;0 curve will hook over and that C,,~0 will decrease numerically at Mach numbers abave about 0 . 8 3 . As the corresponding maximum numerical value of C,,o is very near the factored value assumed for stressing purposes, an a t tempt was made to reduce it by adding a fillet, reflexed at the trailing edge of tile wing root. This is shown in Fig. 3. The only difference between the two fillets is that on the reflexed one the tail of the fillet, aft of the wing trailing edge, was turned up 15 def. Low speed tests showed that this changed C,,,o from about -- 0.055 to -- 0.045. High-speed tunnel tests at M = 0.3 confirmed this change. The fillet reduces the body increment by about half and the effect on C,,0 is nearly independent of Mach number up to M = 0- 82 (Fig. 16). At M - 0.80 the reduction of -- C,,,0 due to the reflexed fillet is 10 per cent.
3.5. Trim Changes at High Mach N,~mbers.--Fig. 21 shows that at Mach numbers above 0.75 • the elevator angle to trim decreases rapidly. This effect is also shown in Figs. 14(a) and [b),
which give the unbalanced pitching moment at zero elevator angle. A comparison with Figs. 15(a) and (b) shows tha t the effect is due to an increase of tail lift coefficient at high Mach number. A small part of this is caused by change of downwash angle at the tail with Mach number, for constant CL (Fig. 18), but most of it is due to increase of incidence for a constant wing CL (Fig. 4).
3.6. Dive-recovery Flafis.--The tests on the dive-recovery flaps could not be made on the complete model, because the supporting struts were very near the position of the flaps. Accord- ingly, a flap was tested on a rectangular wing of the appropriate section. Details of the flap are given at the end of Table 1 and the correct position of the flaps on the complete aircraft is shown in Fig. 1.
The effect of a pair of flaps has been estimated by doubling the pitching moment and lift increments on the single flap. In applying these increments to the complete aircraft it has been assumed tha t the downwash for a given total lift coefficient is unaffected by the flaps. This is equivalent to assuming that the flaps have no effect on the spanwise distribution of lift. This assumption cannot be exactly correct, although the flaps are not in front of any part of the tail- plane, but the calculations based on this assumption will probably give an upper limit to the recovery effect of the flaps.
For the complete aircraft the estimated increase of C,~ due to the flaps, at a constant lift coefficient of + 0.05, is about 0.12 for Mach numbers between 0.76 and 0.80. This nose-up trim change is equivalent to an elevator movement of about 4½ deg. The nose-down trim change due
50

to compressibility effects, on the aircraft without flaps, is equivalent to a change of elevator angle of about 2 deg at M := 0.80, but of course this may be greater at higher Mach numbers. Thug the nose-down tendency at M ---- 0-8 could probably be counteracted by flaps of about half the span tested.
4. Co~¢clusions.--There is a considerable loss of static longitudinal stability with increase of Mach number up to 0.73. This is due mainly to the increase of wing lift gradient with Mach number while the tailplane lift gradient is almost constant. Similar effects have been found in tests on other fighters, e.g., Spitfire and Spiteful (Parts I and II).
The wings of the Spiteful and Attacker are almost identical, and the lift and pitching-moment curves for the wing-alone cases show good agreement up to M = 0.76. Above this the pitching- moment curves differ to some extent, but this can be accounted for by the different methods used for strut correction in the two series of tests.
The value of C,,,o is -- 0.05 at low Mach numbers, changing to -- 0.09 at M -- 0.82. A large part of this is due to the body, the effect of which can be reduced by half by the use of reflexed fillets at the wing root. This corresponds to a total reduction in the maximum numerical value of C,,,0 of about 10 per cent. The large difference in C,,o between the tests on the Spiteful and the Attacker is almost entirely due to the large body of the latter compared with the original Spiteful fuselage.
Between M ---- 0.75 and M ~- 0.80 there is a large nose-down trim change, caused mainly by the increase of incidence required to maintain a constant lift coefficient on the wing after the shock stall. The maximum lift coefficient at R ---- 4.2 x l0 G is about 1.25 (without flaps), but the value may be greater at higher Reynolds numbers.
The drag coefficient does not increase rapidly until a Mach number of about 0- 79 is exceeded.
No. Author
1 Morgan and Alton
2 Gates and Lyon ..
REFERENCES
Title, etc.
Low Speed Wind Tunnel Tests on the Supermarine E.10/44 (Single Jet Fighter). R.A.E. Report No. Aero 2059. (July, 1945.)
A Continuation of Longitudinal Stability and Control Analysis Part I--General Theory. R. & M. 2027. (February, 1944.)
51 (92750) D 2

T A B L E 1
Leading Dimensions, Full Scale
( M o d e l S c a l e = 1 / 6 t h )
Wing : Gross area . . . . . . . . . . . . Span . . . . . . . . . . . . S tandard mean chore1" . . . . . . . . Aspect ratio . . . . . . . . . . . . Straight taper between : -
Chord at 1.02 ft from centre-line (inside fuselage) Chord at 6-00 ft from centre-line (at ' b r e a k ')
Straight taper between : - Chord at 6-00 It from centre-line (at ' b r e a k ') Chord at 17.00 ft from centre-line (start of tip)
Position of max imum camber . . . . . . Maximum camber Position of max imum thickness . . . . Thickness ratio :
From centre-line to ' break ' . . At 12.00 ft from centre-line . . At 17.00 It from centre-line . .
Dihedral . . . . . . . . Twist . . Angle of chord line to fuselage da tum Sweepback of quarter-chord line :
• °
From centre-line to ' b r e a k ' From ' b r e a k ' to 17.00 ft from centre-line . . . . .
Distance of mean quarter-chord point in front of 39 per cent chord line .. Distance of mean quarter-chord point below fuselage da tum . . . . .
Tailplane Gross area . . . . . . . . . . . . . . . . . . Span . . . . . . . . . . . . . . . . . . . . S tandard mean chord Arm (distance of mean quarter-chord point of tai iplane from e.g. of ai'rcraft)' Aspect ratio . . . . . . . . . . . . . . . . . . Volume coefficient . . . . . . . . . . . . . . . . Rat io of gross tai lplane area to gross wing area . . . . . . . . . . Normal set t ing relative to wing chord . . . . . . . . . . . . Dihedral . . . . . . . . . . . . . . . . : . Height of mean quarter-chord point above e.g. (measured perpendicular to s~m.c.). Thickness ratio . . . . . . Posit ion of max imum "thickness . . . . . .
Elevators : Type of balance . . . . . . . . . . Area aft of hinge line . . . . . . . . Area of horn . . . . . . . .
e.G. position : Distance behind leading edge of s tandard mean chord Distance above s tandard mean chord Distance behind leading edge of wing root 'chord " Distance above wing root chord . . . . . .
Weight : Assumed all-np weight . . . . . . . .
Dive-recovery flaps : Angle of flap . . . . . . . . . . . . Chord . . . . . . . . . . . . . . Span . . . . . . . . . . . . . . Posit ion of hinge line . . . . . . . .
. ~ . . .
. . 226 •. 37 ' 0
6"11 6 '1
8"34 7' 08
7 ' 08 3"34
.. 47"5 • . 0 " 9 3
40
13 11.3
8"4 3 0
+ 2 . 5 0
sq ft I t ft
It It
ft ft per cent per cent pet cent
per cent pel cent per cent deg
deg
. . 2 .00 deg
.. 2.50 deg
. . 0"91 ft
. . 1.09 ff
59.0 sq It 13.7 It 4" 30 It
17.4 It 3 .2 0.742 0. 261
- - 0 . 2 5 deg 10 deg 2-21 It
9 per cent 40 per cent
Horn 17.4 sq ft
1.4 s q f t
0"390~ 0.123~ 0.506~ 0'173~
10,500 lb
. . 40 deg
. . 0-5 ft
. . 2-5 It
. . 28 per cent of local chord
5 2 ' 2 " _ "
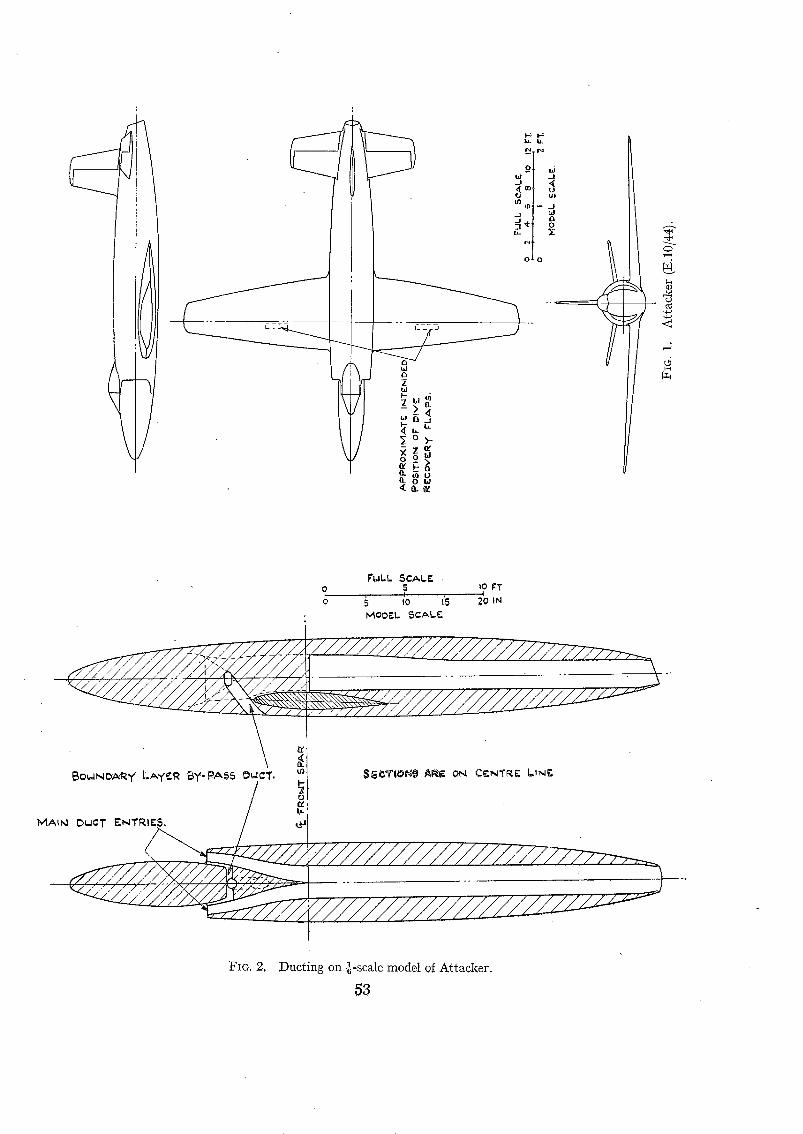
i u l
2 I11
~ga
i , j - o t~ . _ l
t f ) ~ _ _1
~ o
o
.-..ff
F'LJLL. S C A L E . o 5 ~o I~T
t I ~ io t'S Zo t~ MOOe.L , ~ C A L -C
MA~ D"er ~TaWS. / / OI
FIG. 2. D u c t i n g on {-scale m o d e l of A t t a c k e r .
53

FULL $CAI.£,
o I 2 • 4 5 ~7 I . 1 I ] I
0 ~ 4 6 8 I~ IN MO~I ~AI.E
1 FLISELAGE bATIJM
F- Z
ORGINAL ~II..LET, REFLEXEI~ F I L L E T o / n, AIRCRA~'T. ~"
INV~
Fla. 8. Original and reflexed fillets.
~ " ~,. ",~ ~,-)'>" -
>..~ ~-..! ,
T
,~ I I I
I I I ~!~ o m ~o u~ ,t- .~ cu ~ " • ~ ~ . . . . . - . o o - o o o o o o o ~ - . ~ 6
54
l I I I I I
' ~ I , ' ~ L i I, ~-
jIi 1:3 ~ " ' I I
~1 t~ ~ " ~ - L I I I" ~ I ~i"~ I i I~ I ~' .,, .'~ Iii
~. ~ ~ ~. , ~. ~.~-~x' " 0 0 0 0 0 0 0 u l J
0
b.0
u5

¢',e
%
t~ " ~
O ~
.2. -
o
' ~ ! . x "d f~l
o ~0
d
o ~
O b o
v
~3
rn 8 >
L.)
.,.-~
c4
C~ TRIMIvlED
I.O
o.,E
0 "6
0"4
-~.xlO
/
/ /
i i /
I ' y /
,~o 4 o
= = ' ~ R :~'SXIO 6
J~
IFIG, 7. Complete model--lift curves at low speeds (M< O. 2).
55
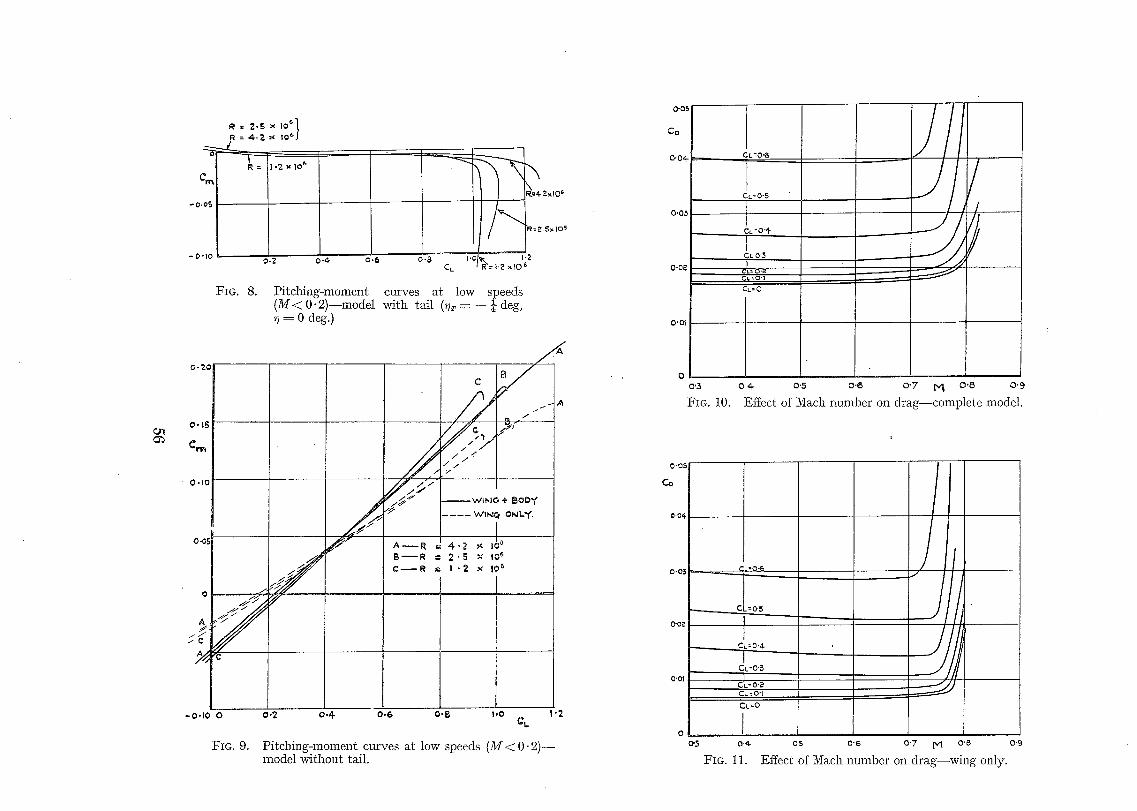
- 0 - 0 5
= 2 , 5 x 10⁶~ 1 R 4 - 2 :~ to~J
0-4- o.6 - 0 " I 0 0"2
~IG. 8. Pitching-moment (M < O- 2)--model
---- 0 deg.)
R : ~ . S ~ IO s
o.B I.G/~ [.2 EL I R'= 1'2 ~10 6
curves at low speeds with tail ( ~ = -- } deg,
O. ZO
O, IS
¢m
O.lO
o
A ~J
J S
B - - R = 2 " 5 x 10 6
C ~ R = 1 . 2 x I0 ~
- O . l O 0
FIG. 9.
0 . 2 0 . 4 o . 6 0 . 8 1.o 1 "2 CL
Pitching-moment curves at low speeds (M< 0 . 2 ) - model without tail.
0-05
Co
0'04-
0'03
0-0~
0"01
0"05
Co
0"0~-
0-03
0-0~
0"01
0 0'3
FIG. I0.
CL=0.6
1 Cu=0"5
_ _ iL ~O"4-
CL 0"3
C73
CL=O
I
o ¢ 0'5 o.6 o-7 iv~ 0"8 0'9
Effect of Mach number on drag--complete model.
CL-O'6
C .:0"5
CL= O'dr ,
I CL:O'3
CL:O'~ CL :O't
CL =0
I cP3 0-4- 05
FIG. 11.
jl J _J
J
J 0"6 0"7 M O"B 0'9
Effect of Mach number on drag--wing only.

F'I -- 0..30 M =0.4-0 0'~
o.~ ~ ~.~ - ~ i O.
o ~ ~ - ~ : 0 ° -~
-oT i ~-oq
o Is I I -o.E -O~o o.~ o.~ o. ..~ o. o.~ 0 .70 .ScO-S " o o.~
I ,q = -3 '~ , , . - ~ . -
~l :¢3 °
O'i
0
~ -o.7
-O'a
H = 0'50
l-" - 3 ° .,.--
~ 1=+3 =
0 0.1 0'~ 0.3 0.4. 0.5 O.G 0.7 O'B O.P- 0.3 0 ,~ 0 . 5 0 . G 0.7 o .BCO,9 c O , 9
C.~ "..1
M = 0.60 O.Z
o.~ . - . ,
-0.1
0 0.1 0"~ 0"3 0,4- 0~5 0"6 0"TCLO'B
M=O,G5
0 ......
°'% o., o., o. cg.
\
0"~ M = 0 . 7 0
Cm
o., ~'-~_c~-. ~-~ --~'~° "~ ' "
-0 .~ 0 0-1 0'~ 0'3 0,4 O.B 0,6C0.7
H = O . 7 3
O.B "~'~ 30 r..rr ~ NO T
0 "Q: =.. ,,.,_.. ----~" I
- o r
"O ' ! 0 0'1 0 '~ 0"3 0 " ¢ O'ScO'6L.
0.1
:m O
-O.I
-O'i
M:0,76 M :0.TE~ H :0,00
" ~ " N=.+-~ ~ i - " q='~3 ~.÷3,=
, ] o o-~ o.a 0.3 0.4 o.s o o.1 o.a O.3c.O.,~. o o.i o.a °'~C°'*u
CL
FIG. 12. P i t ch ing-moment c u r v e s - - c o m p l e t e model, ~ = - - ~ deg.
0.3
Crn
-o4 G
H :0.@2
~..~o ~
Oq 0,~- 0-3_ 0.=~ CL
OT~IL
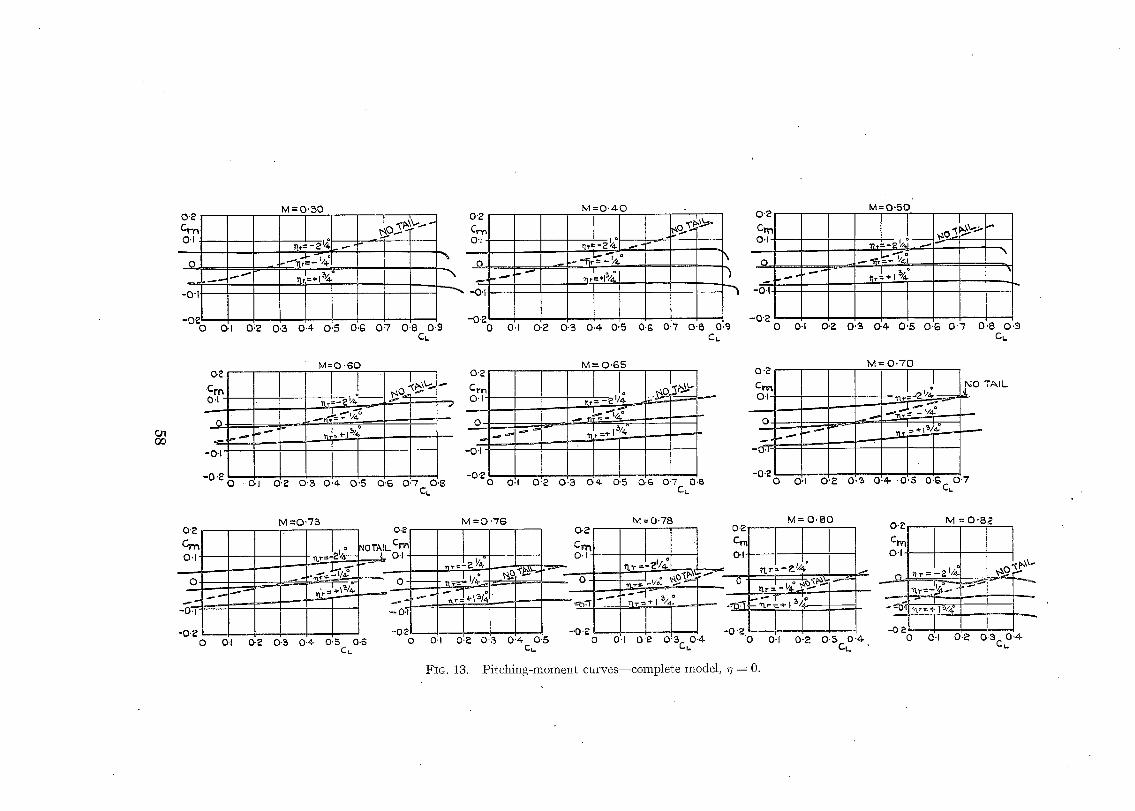
0"1 00
0"8 Cm 0,1
.9_ ~ r
oO'i
M=O.30
~-'7' "% - - ~'il, =-/,~
-07 0 0.1 0:~ 0,3 0.4. 0"50.G 0'7 0'8 0.9
Q.
M=0-4.0
I o
0 O.I O'~ O'S 0.4- 0"5 O'G O"7 O'~ 0.9 CL
M = 0 " 5 O
Cm ~ O,1' i
-O'a 0 0-I (>2 0"3 0-4- 0"5 O-G 0'-/ 0'8 0"~
C~
cm! 0'I
_9--
-0"1'
-0.8 '~ 0'3 0'4- 0"{
M=O '60
Cnn %r ~ 0. I
!o + l ' i ; ~ ~ "
" ' " ~ r - T - o : T " - - - " ~
O'G 0'7 0'8 -O'~q Cu
M= O'G5
,, ' ~o~p,~. ~ ...==.=
3 0'¢ 0-5 0"6 0"7 O.l~ Cu
M = 0.70 0"2
C~ t j O.I-
-0"~
CL
~ 0 TAIL
0'~
o - -
"0'~ 0
M =0'75 M =0 '~'G M = 0-78 ( 0 . 2 0.;
n,r :~11; NOTAILC , ~ 1 / £ _ Err% ~ ' CrO
-0.~ -0'2 0.1 0-~ 0.5 0.4- 0,5 0.6 0 Oq 0.~ 0.:~ 0.4- 0.5 0 C ~3C0"4"L.
CL CL.
M = 0 . 8 0 M = O - B 2 0 -£
I ° Cm .~OJ~P, \b" O'1'
-
O-I 0 " 2 0 ' B C L O ' 4 " 0 O-I 0.~ 0,~C0"4-
FIG. 13. P i t c h i n g - m o m e n t c u r v e s - - c o m p l e t e mode l , ~7 ---- 0.
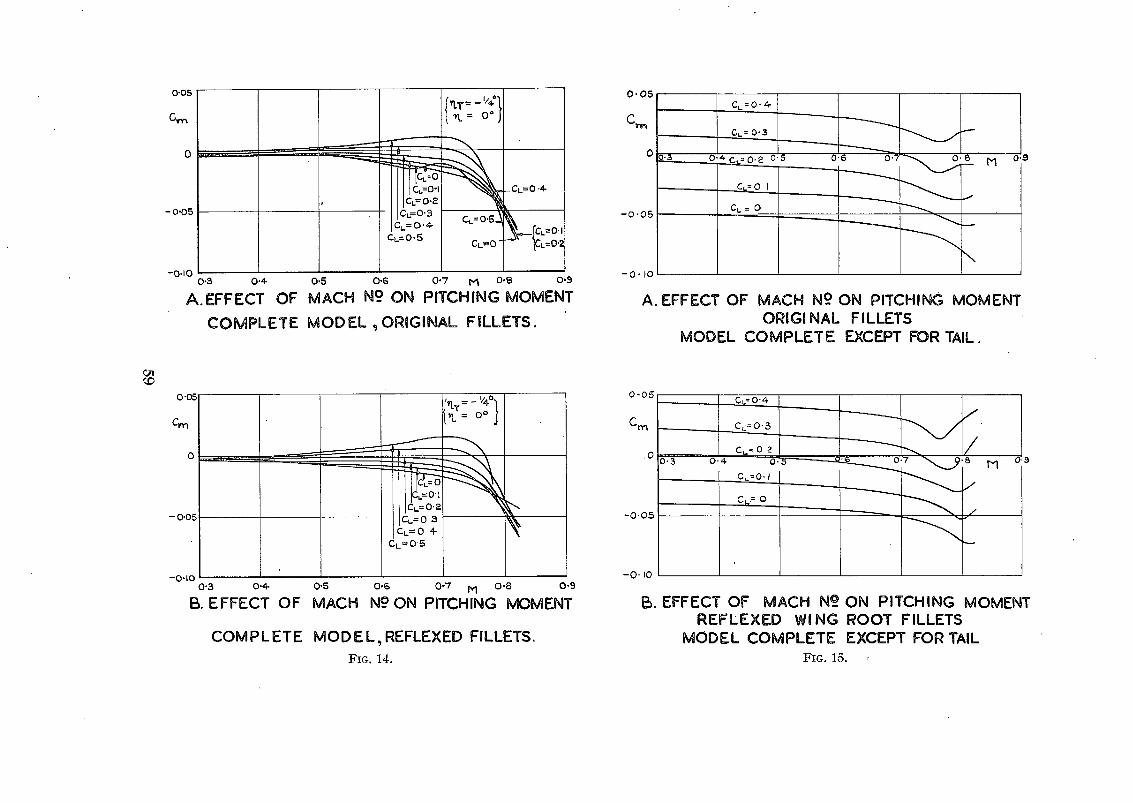
¢,D
0"05
Gm
- 0.O5
J -5,
I c~=o-I CL = O-a
el.---- O '3 C~= O'
Cu=0'5
{ ~T = -'/~'1,! "~= O°J
% ~=o.s2
CL----O -
-CL=O'~
-0.I0 0.3 0.4- 0.5 0.6 0.7 ~,% O.B 0.9
A.EFFECT OF MACH N ° ON PITCHING MOMENT
COMPLETE MODEL ~ORiGiNAL FILLETS.
0 "05
C~n
0
--0.0
CL=O'5
;% =- "P/
-O,IO 0.3 0.4- 0'5 0.6 0-7 M 0"8 0,9
B. EFFECT OF MACH NoON PITCHING MOMENT
COMPLETE M O D E L , REFLEXED FILLETS, FIG. 14.
0 ' 0 5
Cm~
o
- o ' 0 5
o_..3 C
C~=0-4-
C~= 0"3
"* Cj. = O.a
Ck= 0 I
C .=O
- 0 - I O
A. EFFECT OF MACH N9 ON PITCHING MOMENT ORIGI NAL FILLETS
MODEL COMPLETE EXCEPT FOR TAIL.
0 . 0 5
C, m
.0
- 0 - 0 5
- 0 - I O
0-3
c,:o.3 c oZ I/
0"4 ~ - ~ ~ - - ' ~ - - - ~ L ~ . . _ . O' 7 " , ~ . ~ 8
CL=O • I ~ _
Cb:= O
).9 M
5. EFFECT OF MACH N O_ ON PITCHING MOMENT REFLEXED WING ROOT FILLETS
MODEL COMPLETE EXCEPT FOR TAIL FIG. 15.
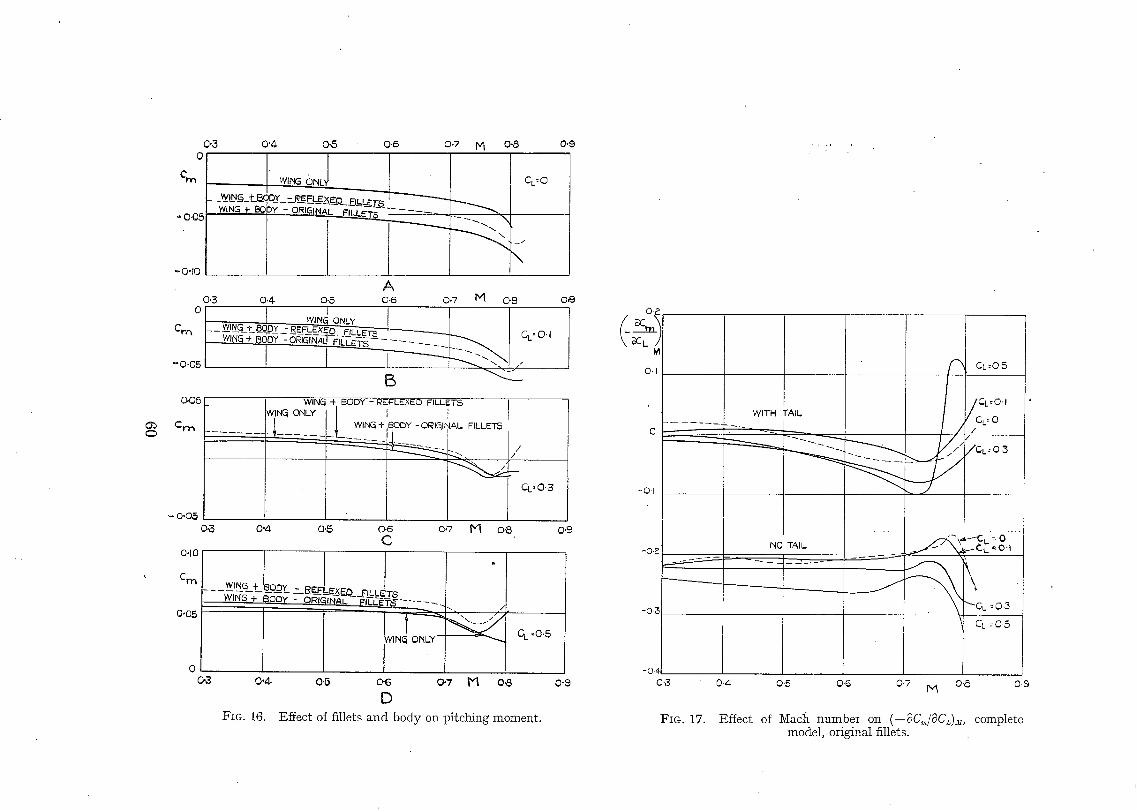
0,3 0
%
- O.O~
- 0"10
0"4 o.5 0 .6 0.7 M o-8
wtr~ OND CL'O
__~_~_t~c ~DY - leEFLE×~_ EILLE:[~_ WING f BODY - OI~IC_F~INAL FILLET~ "~,
\
0.3 0
C~n
" 0 - 0 5
OO5
0~. Cn~ (:D
• - o,05 0.;3
0.10
C m
0,o5
0 0.3
A 0.4 0-5 0.6 0.7 Iv] 0"8
I5 W NG + BODY - REFLEXED F LL~TS
IWIN~ ONLY I : ~ L WING + BODY -O~I~,,!AL FILLET5
' ~ ~ _ [ /
CL, 0..3
0"9
O,9
O ~ 0 '5 G6 Oq M O'8 0"9 c
C L =0.5
WING + 80DY - RE_ELEXE_D__ FILL~TG ---~Eq-CE65~----5~FqTWji~ ~cc¢-f¢ . . . . . .
WINfi ORGY--
o-s 0'~ 0-O O~ O7 P3 O.5
D FIG. 16. Effect of fillets a n d body on pi tching moment .
0.1
-©'1
-04
-0"~
-0.4
WITH TAIL
NO TAIL
J
CL-'O 5
~ /CL= 0
/GL: 0.3
0.3 0.4 0 5 O'G 0.9
~---.- ¢- L..-'- 0 • I
CL -- 0 '5
0.7 M 0.8
FIG. 17. Effect of Mach n u m b e r on (--3C,,,/3CL)j2, complete model, original fillets.
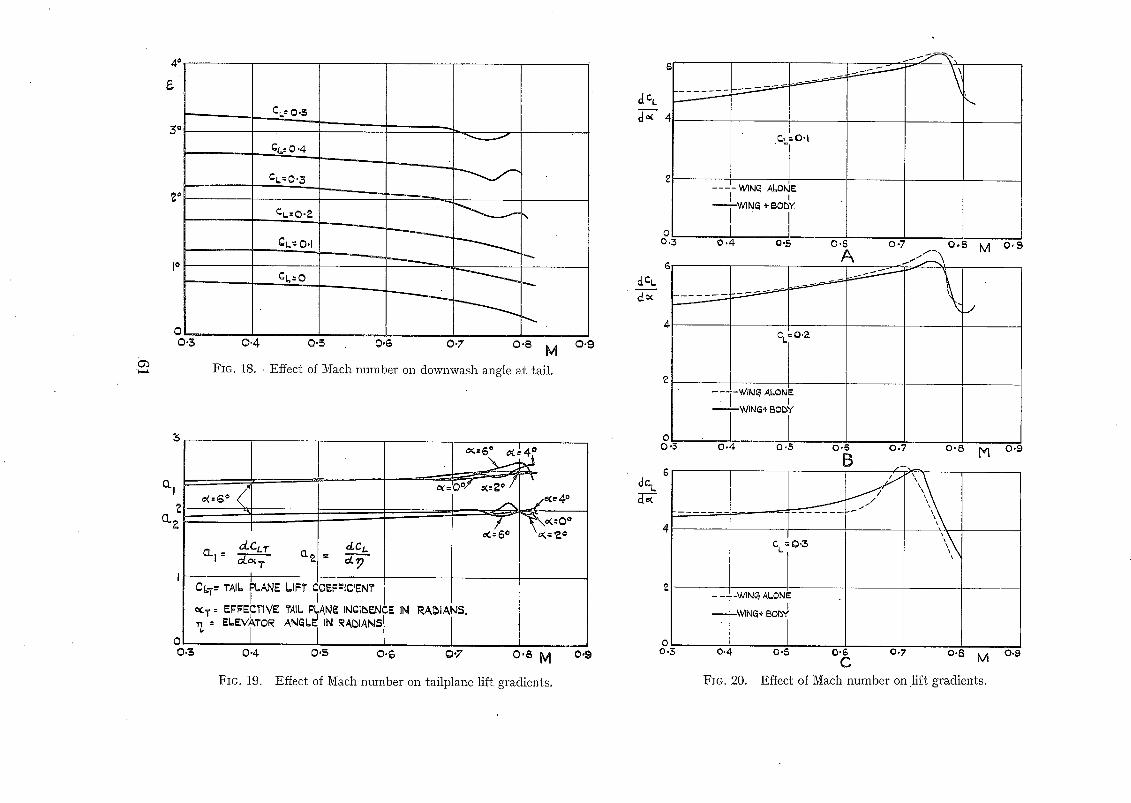
"k,l~
4 ~ ,
£
o
~o
JO
o 0.3
3
¢L=0,3
CL.=O.P
gL= O.I
" - ~ I ~
CL I
t c~ z
Ck=O
Q.~ >5 0.6 0.7 0.8 M 0.9
FIG. 18. , Effect of Mach number on downwash angle at tail.
O 0.$
o(= a- -~° <
oLCc r d.C (. °"I"- at =
CLT: rA~ ~LmE ~Fr CO~F~Cf~N~" I ~T = E;;ECTIVE ?AIL RL, ANE IN¢I~-F.NCE IN RAblANS.
-- ELEV~kTOR AN~L~ IN RAblAN~ I 0.4 0 .5 0 .6 0 .7
FIG. 19.
O,B M
Effect of Mach number on tailplane lift gradients.
6
dcL
d~ 4
0 0.3
6 dcu
0 0 .3
6 dc L
4
o 0.3
O.,
~L=O'I
WINq ALOM~ I
WIN~ + BOb¥
0.5
J
Cl=O,2
WIN~ ALONE
.---z-'WING, BOb /
O "8 O -7
A o.l M o .9
0.4
O.Z
o .5 o-6
C L = g '3
-WIN~ ALONE
--IV4JN~ ~" B~Y
0 . 7 0 . 8
x
FIG. 20.
o.$ o ~ o.7 o.8 M
Effect of Mach number on lift gradients.
[~q 0 . 9
O.~

TO TRIM
o o
_ I ~
_2 °
_3°I . . . . . .
0"4
I o
0.5
FIG. 21.
I CL=O'I C.'- 0"2
CL= 0"3 C.=0"4
CL:- 0 ' S
CL= 0.5
CL-O" I
o.s o.6 o.~ • o .3
Effect of i~ach number on e levator angle to t r im.
62
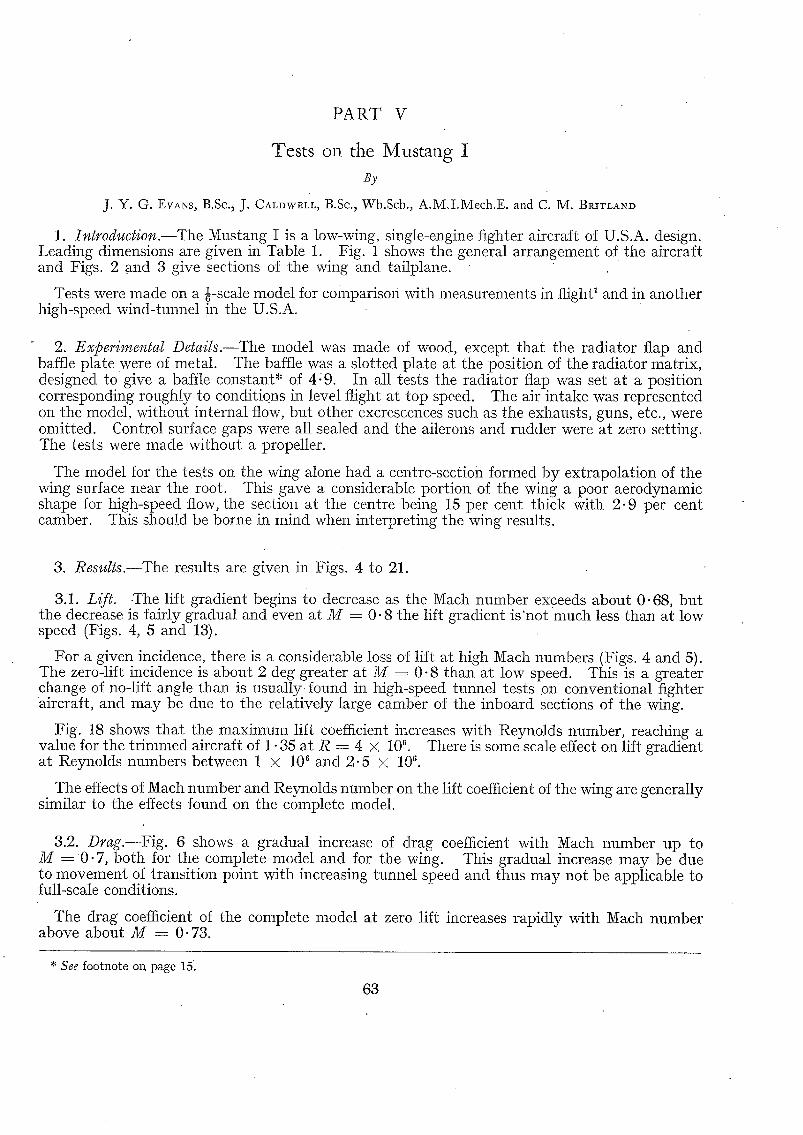
P A R T V
Tests on the Mustang I
j. Y. G. EVANS, B.Sc., J. CALDWELL, B.Sc., Wh.Sch., A.M,I.Mech.E. and C. M. BRITLAND
1. Introduc~ion.--The Mustang I is a low-wing, single-engine fighter aircraft of U.S.A. design. Leading dimensions are given in Table 1. Fig. 1 shows the general arrangement of the aircraft and Figs. 2 and 3 give sections of the wing and tailplane.
Tests were made on a ~-scale model for comparison with measurements in flight 1 and in another high-speed wind-tunnel in the U.S.A.
2. Experimental Details.--The model was made of wood, except that tile radiator flap and baffle plate were of metal. The baffle was a slotted plate at the position of the radiator matrix, designed to give a baffle constant* of 4.9. In all tests the radiator flap was set at a position corresponding roughly to conditions in level flight at top speed. The air intake was represented on the model, without internal flow, but other excrescences such as the exhausts, guns, etc., were omitted. Control surface gaps were all sealed and the ailerons and rudder were at zero setting. The tests were made without a propeller.
The model for the tests on the wing alone had a centre-section formed by extrapolation of the wing surface near the root. This gave a considerable portion of the wing a poor aerodynamic shape for high-speed flow, the section at the centre being 15 per cent thick with 2.9 per cent camber. This should be borne in mind when interpreting the wing results.
3. Results.--The results are given in Figs. 4 to 21.
3.1. Li f t . - -The lifL gradient begins to decrease as the Mach number exceeds about 0.68, but the decrease is fairly gradual and even at M = 0 .8 the lift gradient is 'not nmch less than at low speed (Figs. 4, 5 and 13).
For a given incidence, there is a considerable loss of lift at high Mach numbers (Figs. 4 and 5). The zero-lift incidence is about 2 deg greater at M = 0-8 than at low speed. This is a greater change of no-lift angle than is usua l ly found in high-speed tunnel tests on conventional fighter aircraft, and may be due to the relatively large camber of the inboard sections of the wing.
Fig. 18 shows tha t the maximum lift coefficient increases with Reynolds mlmber, reaching a vahle for the trimmed aircraft of 1- 35 at R = 4 × 10⁶. There is some scale effect on lift gradient at Reynolds numbers between 1 × 10⁶ and 2.5 × 10⁸.
The effects of Mach number and Reynolds number on the lift coefficient of the wing are generally similar to the effects found on the complete model.
3.2. Drag.--Fig. 6 shows a gradual increase of drag coefficient with Mach number up to M = O. 7, both for the complete model and for the wing. This gradual increase may be due to movement of transition point with increasing tunnel speed and thus may not be applicable to full-scale conditions.
The drag coefficient of tile complete model at zero lift increases rapidly with Mach number above about M = 0.73.
* See footnote on page 15.
63

3.3. Pitching Moment.--The pitching moment without tail (Fig. 10) is proportional to the force on the tailplane required to trim. With increasing Mach number, up to the limit of the present tests, there is no very large increase of tail load in steady flight, the compressibility rise up to M -~ 0.75 being followed by a decrease, and the load may even fall to zero at a Mach number a little above M = 0.8.
Fig. 12 shows the elevator angles required to trim, piotted against Mach number. A com- parison of Figs. 9 and 10 at the lower lift coefficients shows tha t with increasing Mach number up to the lift critical an increase in nose-down moment for the wing plus body is balanced by a decrease in tailplane lift, giving no resultant change of trim with Mach number. Above the critical, the wing incidence increases rapidly to maintain constant CL, thus decreasing the down- ward load on the still efficient tailplane (there is very little change of downwash with Mach number (Fig. 14) ). The nose-up moment of the wing and body is insufficient to balance this nose-down change of trim due to increased tailplane lift ; hence negative elevator setting is required to trim.
3.4. Stability.--For CL values below 0.4 the tailplane and elevator are fully effective up to Mach numbers above 0.8 (Figs. 15 and 16).
The manoeuvre margin s H,,, is given by
H,,, - - \-g~/~/,,~ + Kpa~,
where K is a constant for any aircraft. The tailplane lift-curve slope al has been shown to change verY . little with Mach number, hence at any given altitude the variation of H,,, with Mach number is given by that of (--OC,,]OCL)M. This derivative (Fig. 17) decreases gradually up to about M --- 0.68 and then increases rapidly, i.e. the aircraft requires more ' stick movement per g ' at very high Mach numbers.
4. Comparison of Flight and Tunnel Tests.--4.1. Drag.--Drag curves obtained from N.A.C.A. and R.A.E. flight and tunnel tests have been plotted together in Fig. 22. The N.A.C.A. tunnel tests were made in the 16-ft. diameter atmospheric tunnel at the Ames Aeronautical Laboratory.
The Reynolds number and turbulence differ considerably between the variofis tests, so tha t no exact agreement can be expected. Also it was found in the R.A.E. flight tests that the lowering of a small spoiler flap immediately ahead of the radiator, intended to block the radiator entry daring glides and dives, greatly decreased the drag at the higher Mach numbers. The flight results with and without this flap lowered have been given in Fig. 26. I t is not known at the time of writing whether the N.A.C.A. tunnel tests were made with the flap up or down, or i f any such drag differences have been observed in the U.S.A. The R.A.E. tunnel tests were all made with the flap in the normal (raised) position.
At sub-critical Mach numbers the drag coefficient of the R.A.E. tunnel model is about 0. 004 lower than tha t found in the other tests. This difference may possibly be at t r ibuted to excres- cences .on the full-scale aircraft and on the N.A.C.A. tunnel model which were omitted in the present tests. Further, although the turbulence in the R.A.E. high-speed tunnel is fairly h igh , the Reynolds nnmber is low and it is possible that the transition point was further back in the R.A.E. tunnel than in the other tests. The N.A.C.A. flight and tunnel results agree regarding the Mach number at which the drag rise starts, but this is about 0" 03 lower than that shown by the R.A.E. flight: and tunnel resu l t s . At Nach numbers above the critical value, the R.A.E. results show a steeper drag rise than the N.A.C.A. ones.
In general, the agreement is good over the Nach number range Considered.
64 !
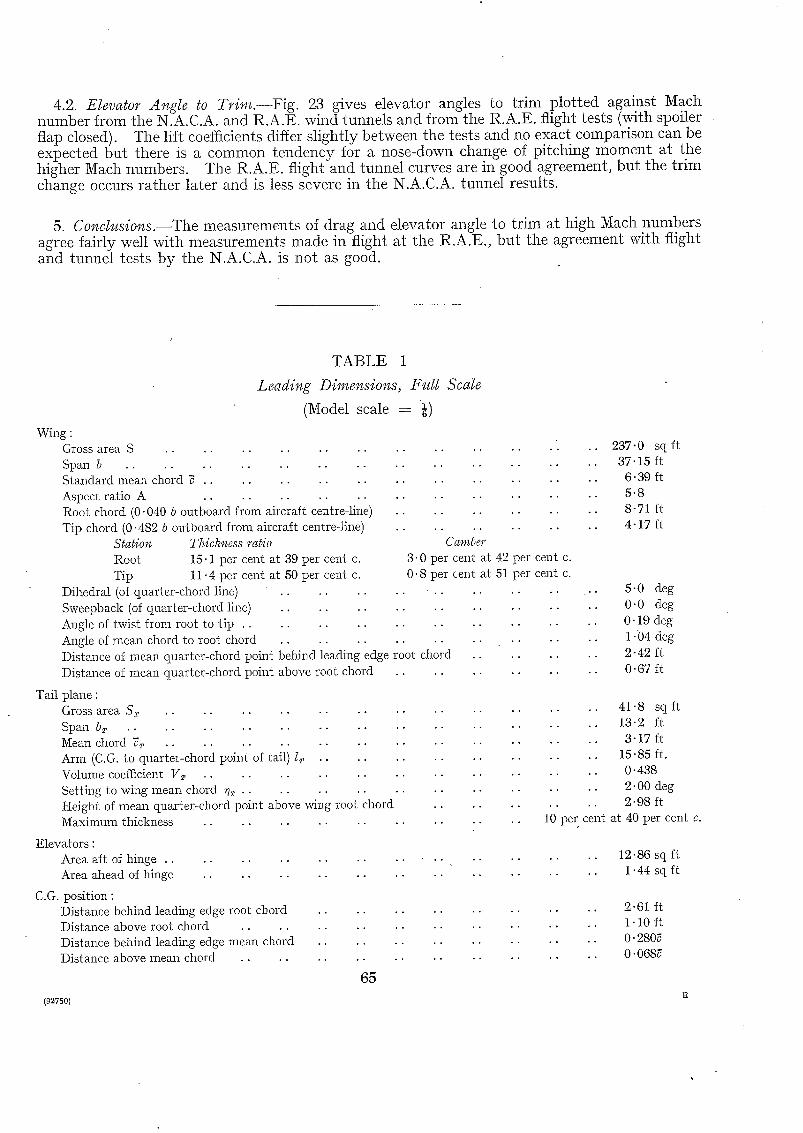
4.2. Elevator Angle to Trim.--Fig. 23 gives elevator angles to trim plotted against Mach number from the N.A.C.A. and R.A.E. wind tunnels and from the R.A.E. flight tests (with spoiler flap closed). The lift coefficients differ slightly between the tests and no exact comparison can be expected but there is a common tendency for a nose-down change of pitching moment at the higher Mach numbers. The R.A.E. flight and tunnel curves are in good agreement, but the trim change occurs rather later and is less severe in the N.A.C.A. tunnel results.
5. Conclusions.--The measurements of drag and elevator angle to trim at high Mach numbers agree fairly well with measurements made in flight at the R.A.E., but the agreement with flight and tunnel tests by the N.A.C.A. is not as good.
TABLE 1
Leading Dimensions, Full Scale
(Model scale : ~)
Wing : Gross area S . . . . . . . . . . . . . . Span b . . . . . . . . . . . . . . . . S tandard mean chord 3 . . . . . . . . . . . .
Aspect ratio A . . . . . . . . . . Root chord (0' 040 b outboard from aircraft centre-line) Tip chord (0' 482 b outboard from aircraft centre-line)
Station Thick~ess ratio Root 15" 1 per cent at 39 per cent c. Tip 11.4 per cent at 50 per cent c.
Dihedral (of quarter-chord line) . . . . . . . . . . Sweepback (of quarter-chord line) . . . . . . . . . .
Angle of twist from root to t ip . . . . . . . . . . . . Angle of mean chord to root chord . . . . . . . . . . Distance of mean quarter-chord point behind leading edge root chord
Distance of mean quarter-chord point above root chord . . . .
Tail plane : Gross area S~ . . . . . . . . . . . . .
Span b~ . . . . . . . . . . . . . . Mean chord ~T . . . . . . . . . . . . Arm (C.G. to quarteI-c.hord point of tail) Ir . . . .
Volume coefficient V~ . . . . . . . . . . Sett ing to wing mean chord ~ . . . . . . . . Height of mean quarter-chord point above wilag root chord . .
Maximum thickness . . . . . . . . . . . . . .
Elevators : Area aft of hinge . . . . . . . . . . . . . . . . Area ahead of hinge . . . . . . . . . . . . . .
C.G. position : Distance behind leading edge root chord . . . . . . . . Distance above root chord . . . . . . . . . . . . Distance behind leading edge mean chord . . . . . . . . Distance above mean chord . . . . . . . . . . . .
65
Camber 3.0 per cent at 42 per cent c.
0"8 per cent at 51 per cent c.
237.0 s q f t 37.15 ft
6 .39 ft 5-8 8-71 ft 4.17 ft
. . 5-0 deg
. . 0"0 deg
. . 0 .19 deg
. . 1 .'04 deg
. . 2 . 4 2 ft
. . 0 - 6 7 I t
41"8 sq ft 13"2 i t 3-17 ft
15"85 ft. 0-438 2-00 deg 2.98 ft
10 pm] cent at 40 per cent c.
. . 12"86 sq ft
. . 1"44 sq ft
. . . . 2.61 ft
. . . . 1.10 ft
. . . . O" 2 8 0 ~
. . . . O ' 0 6 8 ~
(92750) E

<-,t
,l f
~ m
~ " - - ~ ~-~-
~A b.o cd
~ ' ~ _ ~ C I D E N _ CE OF MEAN CHORD
ROOT SECTION {0'0¢0 b OUTBOARD)
INCIDENCE OF MEAN CHORD
SECTION APPROX. PC SPAN OUTBOARD. ( 0.Z4-?. b OUTBOARD)
INCIDENCEOF MEAN CHORD
TiP SECTION (0"4.B'~ b OUTBOARD)
FIG. 2. Wing sections.
66
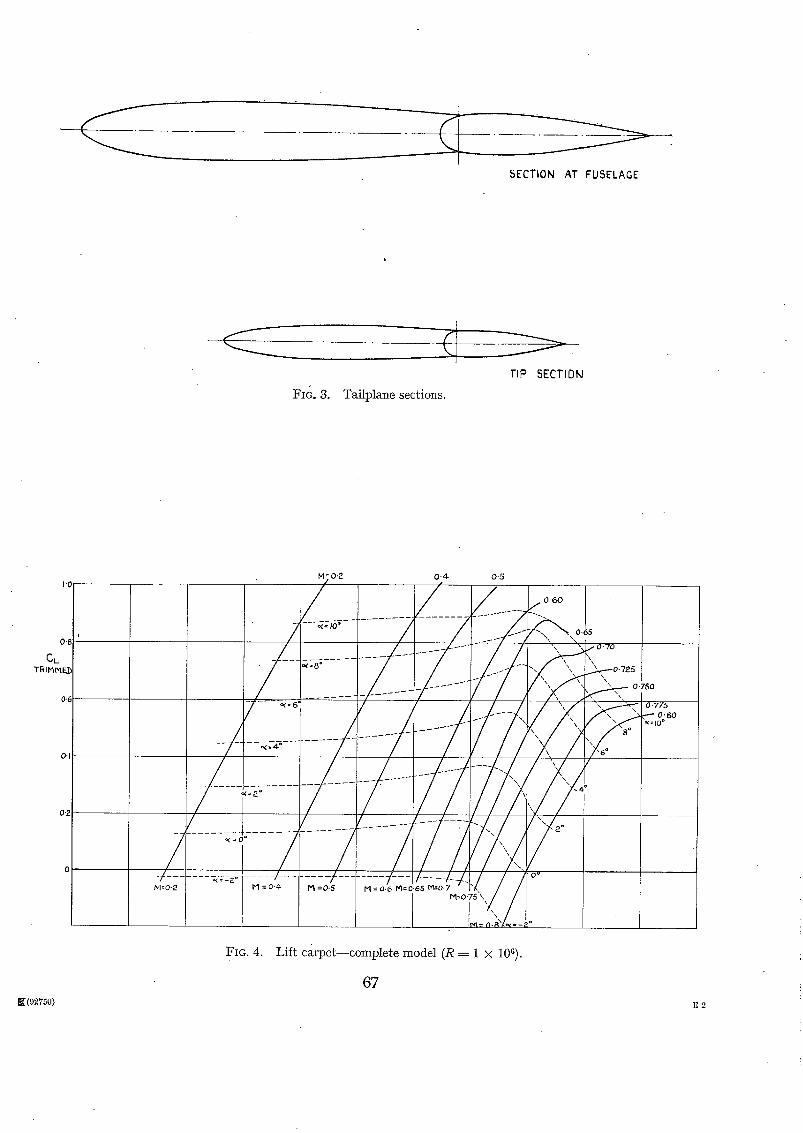
---__._>
SECTION AT FUSELAGE
FIG. 8. Tailplane sections.
TIP SECTIOM
I'0
0.8
CL TRII~MF..D
0.6
0.1
0"2
M O.a 0-4 0.5
/ / _/__ --- .-.°~ .
z --~-~ - 1 . . . . . . 7 - _ ./- ~ ,~ .c~
• =================================
FIG. 4. Lift carpet--complete model (R = 1 × 10a).
67 ~[(92750) E 2

1.0
C L
0.8
O.G
0.4
0.~
7
_/__4s- .... ~ -/---r .... 7 /./--.. ~ l",J o~-, .--" " , ~ ', 0'75
/ , I/__ .... J--/ ...... /-7 /",/Z/;07,. / =<=+6-1 . . . . . . . . . . . . . " " ~
/ - .... t - - - - 7 - £ ..... 1--/---t/~~~....,o. __ / . -~-~-+,: .... i ....... t - t ...... 1 [ / I / / " , : ' / ~ , , , S , 2:: /
i ..........
M_-oj ,?°
FIG. 5. Lift carpet--wing alone (R = I × 106).
i,
_.in- i
.0
, u Jl I I
I,', g
I
i
i 6 o
68

FIG. 7.
%
0 0-2 _ o @4
I E~ M - O . 4
/ P:I ~ ' ~ - ~ 106 ~i-Ol
-O.h
-0'1;5
-0'20' ' P I
Pitching moment s on complete model, for constant tailplane setting (~;~ = 2 deg).
O'lO
c~ C
o.os " ' ~ . p-,"
o.~. _. o . F - - ~ - ,
M = 0 . 5
I
,.." o.8 \ I'0
0,05
~. o ° 0.4- 0 - 6 - - ~ ' - - - - ' ~ 0
M - 0 - 6
I'0
"0"10 -0. IO
-0.15 -0.1:5
-0 '20
FIG. 7. Pitching moments on complete model, for constant tai lplane sett ing ( ~ ---- 2 deg).
69
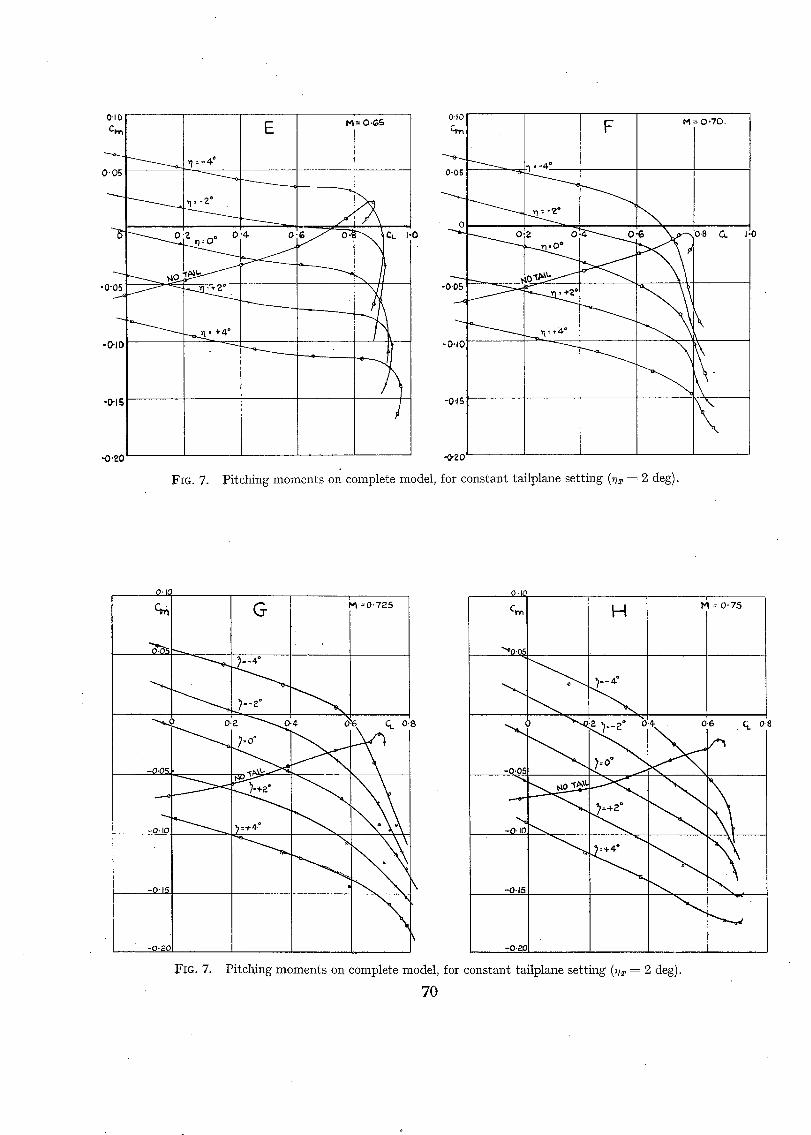
-0-0~5
0"05
0"10 Ct.~
-0'10
-O'IS
"O'~C
FIG. 7.
E M': 0-¢,,S
- - -____&a _° o , o:~ ~ c, ~.o
- - - - . _ . _
Pitching moments on complete model, for constant tailplane setting (v~ = 2 deg).
O" )(
~.05 ~
-0.0,.5
-0. I0
-0-15
-0-20
G l "- ' - - . . . . ?._4°
7"°°
--. . . .
C1. 0 .$
.~?!G. 7 .
o.ic
C~l F4
Pitching moments on complete model, for constant tailplane setting ( ~ = 2 deg).
70
'~1 = 0.75
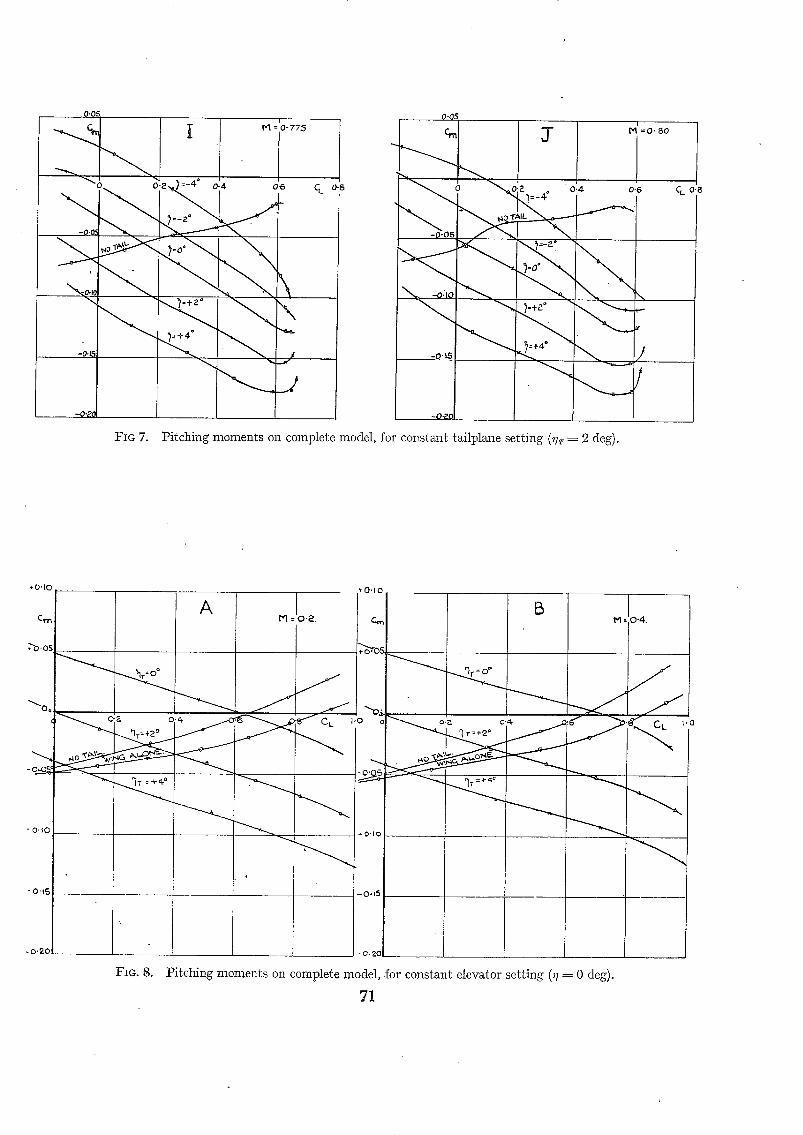
f
""*'~ ~ ~ ' ~ 0 2 4° 0 4 - 0 6
\
C L 0-8
q', 3 " ,,.,' =o. ~,o
q_o
FIG 7. Pitching moments on complete model, for constant tailplane setting ( ~ ----- 2 deg).
",'O'10
Cn,, ~
~.os
"~OQ
A M.-o~ ! ~ B
---. . . . .
" ' - ~ J J a o,.~ J ' o : g ~ ' - - . ~ o ; ~ " 1 cL i.o O'& 0'~"
M ' : 0 "4 .
-0 "10
-O-15i
Fro. 8. Pitching moments on complete model, for constant elevator setting (~? = 0 deg).
71

*0-10
*0.0.5
C~
-o.a~s
-O.lO
-0 15
C
r l~ = 0 °
M = 0-5(~
/ /
] +0- 05 [
-o-o£~£
-O' lO
- O q 5
b, 1 ~¢I • 0-60 .
f jjo~ c./
J
Fro. 8. Pitching moments on complete model, for constant elevator setting (7 = 0 deg).
0'~0
Cm
F__ l
I ~ = O, 6S
/
-040
I" =+4°
-0.Ls " /
F I M = 0.70
I
%
C.
]FIG. 8. Pitching moments on complete model,, for constant elevator setting (~7 = 0 deg).
:72

O'lC
÷ 0.05
(
G M : 0-725
0-I0
I-4
"-- . . )
0 . 2 .4 O.G 8 c~ ,-o " ~ . 1 , ~ ,
= O-75
eL.. o.~
-0
- 0
-c
- o . l o
-0.15
+ ~
FIG. 8. Pitching moments on complete model, for constant elevator setting (rl = 0 deg).
°'11.
+ 0-o51
Cm
-0'05
-O,IO
-0,15
~ 0 ° .,0,2
M:0,775
0,4. 0.6
1
7
o:10
+ O.OS
J
CL 0.8 0 .4 0.S C~
- 0 . I S
1~=0.80C
C8
FIG. 8. Pitching moments on complete model, for constant elevator setting (~1 = 0 deg).
73

÷0.05
Cm
02 0 3 O-
-0.0
-o : io
-0"15
O-4- 0-5 0-6
2 0.7 M 0-8
c-,.= o .8
FIG. 9. Var ia t ion of pi tching momen t wi th Mach n u m b e r - - complete model (~?T ---- 2 deg, ~ = 0 deg).
\Q.= o xq, o.~ xcr= o.2
"-Ct.: 0"4
Ct.: 0 .~
0.0~
C
00"2
- 0 , 0 5 -
0-3 0-5 0.6
FIG. 11.
0 . 4 0.7 oq
" = " q = 0.8 ~'"- C~. = O. {5 ~ " - -c , . = o- 4. ~
~ ' C = o ~ ~
I Varia t ion of p i tch ing moment wi th Mach n u m b e r - -
wing alone.
0.0'3
c.,
O -
-0-c
FIG. 10.
o .3 o - 4
Ct.--" 0 " 8
0-5 O, 6~0-7 M I Q . = 0 " 6 '~
Ct.= 0-4-
• C L = ~
I (>8
Varia t ion of p i tching moment wi th Mach n u m b e r - - model wi thout tail .
0-2 O-
7 -
o .3 o -4-
":-q:o ~"q.= 0-2 ._- - - -
~ " CL-- 0.4
~'-c~-- o-6
- 0 d 0 - 8
. 6 o
FIG. 12.
o-5 0 .6 0.7 0.8
\ Var ia t ion w i t h Mach number of e levator angle to t r im
at cons tant Cz ( ~ = 2 deg).
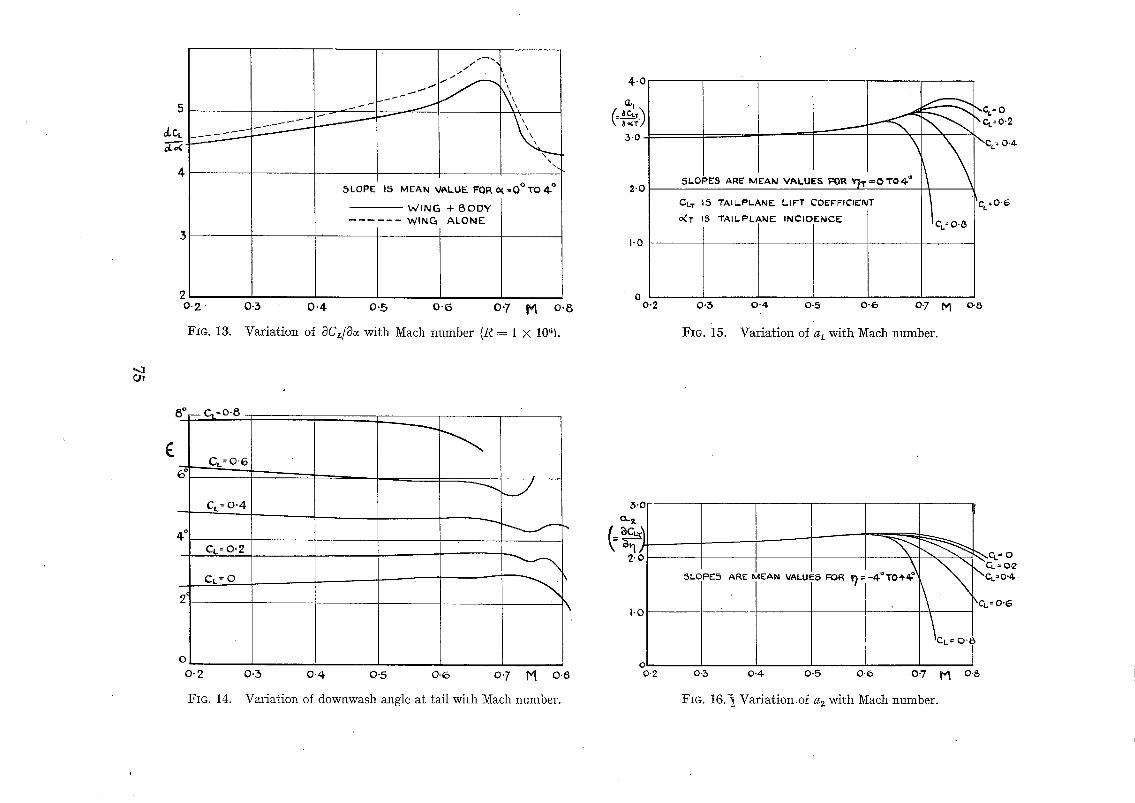
5
~LC, L ~--~.
4
0 , 2 -
FIG. 13.
5LOPE 15
\ x\
MEAN VALUE F0R 0(~O°TO4- °
WING + [~ODY WING ALONE
0.3 0-4 0.5 0-6 0"7 M 0 ,8
Var ia t ion of ~C,,/Sc~ with ~ a c h number (R = 1 X 10⁶).
4-.0
~t (__~c:q
3-0
2"C
I-0
0 0-2
"c , .~ 0.4.
i i°i; i:i?iiii T O 1"° 4" ~Ct =0,, 5
0.3 0.4. 0.5 0 -6 0"7 N o.5
FIG. i5. Va r i a t i on of a z wi th Mach number .
',,4
6 ° _ CI -0 -8
E
2 c
CL = 0 6
CL = 0-4
CL = 0 - 2
C t = 0
-----4
o-2 0.3 0-4 0-5 o . e 0'7 M o.8
FIG. 14. Var ia t ion of downwash angle at ta i l wi th Mach number.
5.0
2-0
1.0
o 0-2
= - SLOPES ARE MEAN VALUE;5 FOF~ ~ 4. T04'~
O-5 0-4 0-5 0-6 0"7 ~ 0-8
FIG. 16 ,~ V a r i a t i o n of 6 2 w i t h ~/[ach n u m b e r .
t.Ci. = 0 = 0-2
\C,=0"4- !
'.eL.= 0.6

0 . 2 0 . . . . '
(- 1 ~c./. o~:O',b?%, O"lID- @ " ~ = u" "/ I " -- 1 / ~ l , ~ [ y z L .
k ' ~ c 0 - 6 cu= ~ 0
~-L - v ~ I ' -- - ~ 0 , : 0 " 2 1 V A L U E 5 FROM R.A.E. 5 0 ~ N JET TUINWEL I v
0 I I ; ~ 0 - 2 - 0.5
cL = o C Io J L-" .z ¢
-0-I( \ ~:~=o.~ CL:O~r
-O.20 FTG. 17;
0.4 0.5 O-G
~ N G + B O D Y
o-7 ~v~ 0-8
J
_J
U %~o.6
Variation of (-- aC,,,/OC~),~, with Mach number at constant Cz.
1,4
C~ "r~IMMED
1.2
I.O
0 '8
0 ' 6
0.4-
/ FIG. 18.
O*
Low-speed lift curves--complete model (M < 0.2).
76
~ ,x_~__R-- 4. X I0~
~ - - R--3XI06 R-"2.SXI0 ~
~_ ~b ~
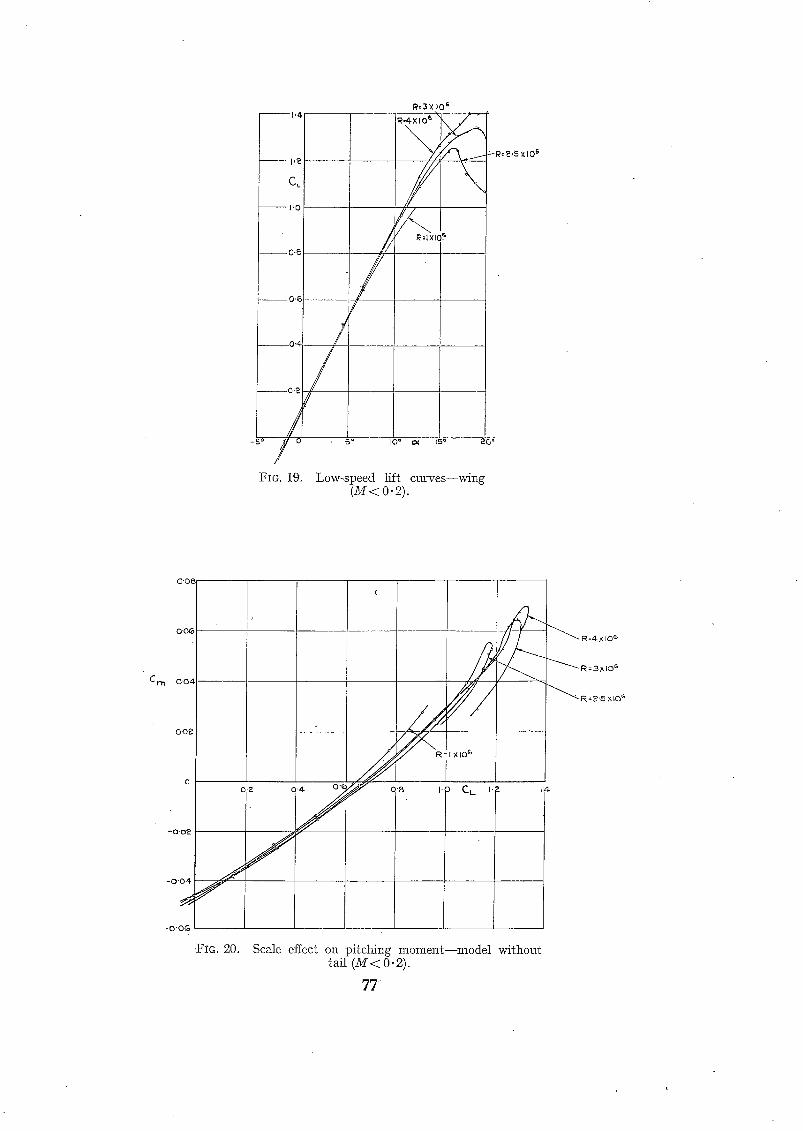
I°~_
C~i
I'0
0-~,
0-~
0,4 /
0,~
/ 5 o
1~=3 × I0 s
I R,4XlO ~
7 \ <J:
10 ~ ~ 15 Q
~R='2.SxlO 6
FIG. 19. Low-speed lift curves--wing (~<o.2).
C:nn
- O
- O '
- O " - v
FiG. 20.
R:4 X IO r~
~ R = 3 x l O ~
"~"~" R = ~.,5 X lot,.
Scale effect on pitching moment--model without tail (M< 0.2).
7T

• 0'02
O'E ).4- 0 "~ 0"8 l ' 4 CL.
R~ ,4 -x IO 6
R= 3 XlOro
R= 2.5.~-t0 C=
~rrl - C 'OE
-0(34
- 0 ' 0 ~
/
FIG. 21. Scale effect on pitching moment--wing (M< 0-2).
005
0 . 0 4
Co
0.02
0 .0~
/ / NA.CA. TUNNEL - '-- --=~ /
• . (16' A.A.L.) I / /
J
R . A . E . FLIGHT. 5POLLER UP NI
,, ,, OOW
R.&. F'. TUNNEL (CL=O:I~ ('O'X 7' H.S.T)
0-01
0.4 O.S 0.6 0 .7
FIG. 22.
M 0.8
Comparison of drag from N.A.C.A. and R.A.E. flight and tunnel tests.
78

0
I~TRIM
O.$
FIG. 23.
0.7 ~ 0,8 Comparison of elevator angle to trim from
flight and tunnel tests.
-N./~,C,~. TUNNEL
\
~.A~. FLIQHT TESTS
RAE TUNMEL(CL:O.P )
79 (92750) Wt. 13/806 K.5 11]51 tiw. P~INTED IN GREAT BRITAIN

R. & M. No. 2535 (6739, 7596, 7045, 9559, 8707)
A.R.C. Technical Report
Publications of the Aeronautical Research Councit
ANNUAL TECHNICAL REPORTS OF THE AERONAUTICAL RESEARCH COUNCIL (BOUND VOLUMES) - -
I934-35 Vol. I. Aerodynamics. Out of print. gol. II. Seaplanes, Structures, Engines, Materials, etc. 4o;. (4os. 8d.)
I935-36 Vol. I. Aerodynamics. 3os. (3os. 7d.) Vol. II. Structures, Flutter, Engines, Seaplanes, etc. 3os. (3os. 7d.)
x936 Vol. L Aerodynamics General, Performance, Airscrews, Hurter and Spinning. 4os. (4os. 9d.)
Vol. II. Stability and Control, Structures, Seaplanes, Engines, etc. 5;os. (5os. xod.)
I937 Vol. I° Aerodynamics General, Performance, Airscrews, Flutter and Spinning. 4os. (4os. Iod.)
Vol. II. Stability and Control, Structures, Seaplanes, Engines, etc. 6os. (6Is.)
x938 Vol. I. Aerodynamics General, Performance, Airscrews. 5o;. (Sxs.) Vol. II. Stability and Control, Flutter, Structures, Seaplanes, Wind Tunnels,
Materials. 3os. (3os. 9d.)
I939 Vol. I. Aerodynamics General, Performance, Airscrews, Engines. 5os. (5os. I rd.) VoI. II. Stability and Control, Flutter and Vibration, Instruments, Structures,
Seaplanes, etc. 63s. (64s. :~d.)
I94o Aero and Hydrodynamics, Aerofoils, Airscrews, Engines, Flutter, Icing, Stability and Control, Structures, and a miscellaneous section. 5os. (5 xs.)
Certain other reports proper to the I94o volume will subsefueutly he included in a separate volume.
ANNUAL REPORTS OF T H E AERONAUTICAL RESEARCH COUNCIL-~ I933-34 Is. 6d. (Is. 8d.) I934-35 :ts. 6d. (Is. 8d.)
April x, I935 to December 3I, I936. 4s. (4 s. 4d.) I937 2s. (2s. zd.) x938 is. 6d. (IS. 8d.)
I939-48 3s. (3 s. 2d.)
INDEX T O ALL REPORTS AND MEMORANDA PUBLISHED IN T H E ANNUAL TECHNICAL REPORTS, AND SEPARATELY--
April, I95o R. & M. No. 26oo. 2s. 6d. (2s. 7½d.)
INDEXES T O T H E TECHNICAL REPORTS OF T H E AERONAUTICAL RESEARCH COUNCIL- -
December I, I936- -June 3 o, i939. July I, I 939 - - June 30, ~945. July x, r945 - - June 30, ~946. July r, I946--December 3I, I946. January I, r947 - - June 3o, I947.
R. & M. No. r85o. zs. 3d. (Is. 4½d.) R. & M. No. z95o. zs. (rs. z½d.) R. & M. No. 2050. is. (zs. i½d.) R. & M. No. zISo. Is. 3d. (zs. 4½d.) R. & M. No. z25o. Is. 3d. (Is. 4½d.)
Prices in brackets include postage.
Obtainable from
HIS M A J E S T Y ' S S T A T I O N E R Y O F F I C E York House. Kingsway, LONDON, W.C.2 429 Oxford Street, LONDON, w.l
P.O. BOX 569, LONDON, S.E.1 13a Castle Street, ~DINBUaGH, 2 1 St. Andrew's Crescent, c ~ m F 39 King Street, MANCHESTER, 2 Tower Lane, BRISTOL, 1
2 Edmund Street, BlmarNG~M, 3 80 Chichester Street, BELFAST
or through any bookseller.
S.O. Code No, ~3-2535