Highly Confident Peptide Mapping of Protein Digests …for example, from different digest enzymes)...
8
Technical Overview Authors Stephen Madden, Crystal Cody, and Jungkap Park Agilent Technologies, Inc. Santa Clara, California, USA Introduction The biopharmaceutical industry is adding an increasing number of protein therapeutics to its pipelines. With a five-year compound annual growth rate (CAGR) of 7.3 %, it is predicted to attain sales of $248.7 billion worldwide by 2020 1 . The fastest growing segment with a five-year CAGR of 16.6 % is monoclonal antibodies (mAbs), which have been approved for a range of conditions such as oncology and autoimmune diseases. During the development of protein therapeutics, monitoring is required for a broad set of Critical Quality Attributes (CQAs), among which is confirming the protein sequence and post-translational modifications (PTMs). Typically, a bottoms-up approach is taken in which the protein is digested with an enzyme to create peptides in the range 5 to 60 amino acids. The peptide mixture is separated by liquid chromatography then detected in a mass spectrometer (MS), which generates mass spectra containing information about them. Given the richness of MS data, there are challenges in finding spectra that have peptide information, then extracting the sequence and PTMs accurately and efficiently. A manual approach by inspection requires significant time and expertise. The Agilent MassHunter BioConfirm B.09.00 has made a step forward in this peptide mapping workflow for finding peptides and visualizing the results. A software algorithm uses MS/MS data to narrow the list of possible peptides, saving time versus manual inspection. The results are displayed in the Sequence Coverage Map, which allows the user to review multiple samples (for example, from different digest enzymes) at the same time. A new mode in Agilent MassHunter Acquisition software on the Agilent 6545XT AdvanceBio LC/Q-TOF called Iterative MS/MS focuses on low-concentration PTMs, and enables them to be viewed in the Sequence Coverage Map. Highly Confident Peptide Mapping of Protein Digests Using Agilent LC/Q-TOFs
Transcript of Highly Confident Peptide Mapping of Protein Digests …for example, from different digest enzymes)...

Technical Overview
AuthorsStephen Madden, Crystal Cody, and Jungkap Park Agilent Technologies, Inc. Santa Clara, California, USA
IntroductionThe biopharmaceutical industry is adding an increasing number of protein therapeutics to its pipelines. With a five-year compound annual growth rate (CAGR) of 7.3 %, it is predicted to attain sales of $248.7 billion worldwide by 20201. The fastest growing segment with a five-year CAGR of 16.6 % is monoclonal antibodies (mAbs), which have been approved for a range of conditions such as oncology and autoimmune diseases. During the development of protein therapeutics, monitoring is required for a broad set of Critical Quality Attributes (CQAs), among which is confirming the protein sequence and post-translational modifications (PTMs).
Typically, a bottoms-up approach is taken in which the protein is digested with an enzyme to create peptides in the range 5 to 60 amino acids. The peptide mixture is separated by liquid chromatography then detected in a mass spectrometer (MS), which generates mass spectra containing information about them. Given the richness of MS data, there are challenges in finding spectra that have peptide information, then extracting the sequence and PTMs accurately and efficiently. A manual approach by inspection requires significant time and expertise.
The Agilent MassHunter BioConfirm B.09.00 has made a step forward in this peptide mapping workflow for finding peptides and visualizing the results. A software algorithm uses MS/MS data to narrow the list of possible peptides, saving time versus manual inspection. The results are displayed in the Sequence Coverage Map, which allows the user to review multiple samples (for example, from different digest enzymes) at the same time. A new mode in Agilent MassHunter Acquisition software on the Agilent 6545XT AdvanceBio LC/Q-TOF called Iterative MS/MS focuses on low-concentration PTMs, and enables them to be viewed in the Sequence Coverage Map.
Highly Confident Peptide Mapping of Protein Digests Using Agilent LC/Q-TOFs
2
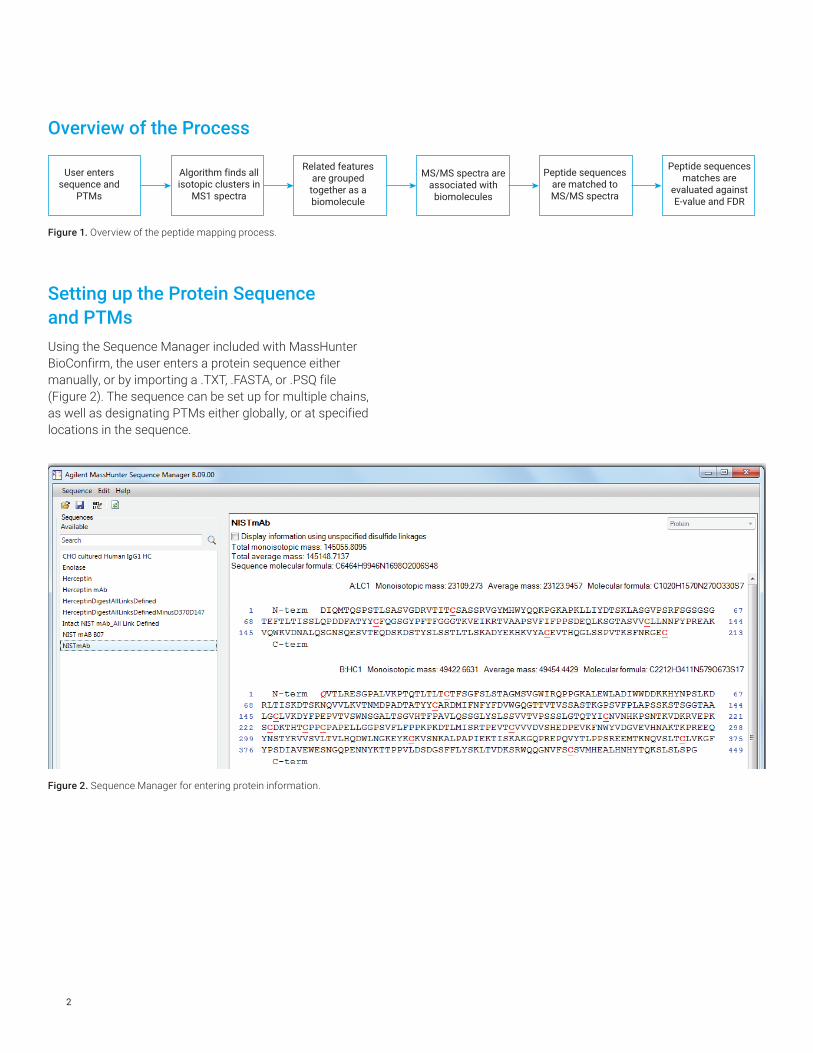
Setting up the Protein Sequence and PTMsUsing the Sequence Manager included with MassHunter BioConfirm, the user enters a protein sequence either manually, or by importing a .TXT, .FASTA, or .PSQ file (Figure 2). The sequence can be set up for multiple chains, as well as designating PTMs either globally, or at specified locations in the sequence.
Figure 1. Overview of the peptide mapping process.
Overview of the Process
User enters sequence and
PTMs
Algorithm finds all isotopic clusters in
MS1 spectra
Related features are grouped together as a biomolecule
MS/MS spectra are associated with
biomolecules
Peptide sequences are matched to MS/MS spectra
Peptide sequences matches are
evaluated against E-value and FDR
Figure 2. Sequence Manager for entering protein information.
3
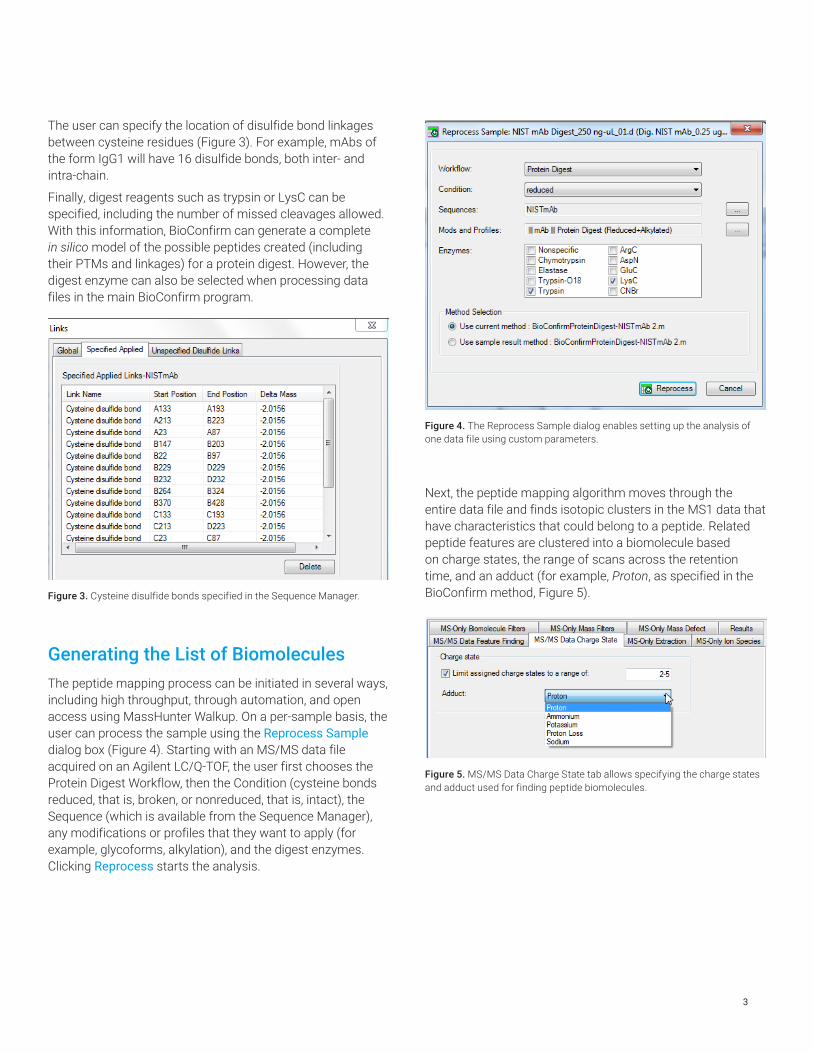
Figure 3. Cysteine disulfide bonds specified in the Sequence Manager.
Figure 4. The Reprocess Sample dialog enables setting up the analysis of one data file using custom parameters.
The user can specify the location of disulfide bond linkages between cysteine residues (Figure 3). For example, mAbs of the form IgG1 will have 16 disulfide bonds, both inter- and intra-chain.
Finally, digest reagents such as trypsin or LysC can be specified, including the number of missed cleavages allowed. With this information, BioConfirm can generate a complete in silico model of the possible peptides created (including their PTMs and linkages) for a protein digest. However, the digest enzyme can also be selected when processing data files in the main BioConfirm program.
Next, the peptide mapping algorithm moves through the entire data file and finds isotopic clusters in the MS1 data that have characteristics that could belong to a peptide. Related peptide features are clustered into a biomolecule based on charge states, the range of scans across the retention time, and an adduct (for example, Proton, as specified in the BioConfirm method, Figure 5).
Figure 5. MS/MS Data Charge State tab allows specifying the charge states and adduct used for finding peptide biomolecules.
Generating the List of BiomoleculesThe peptide mapping process can be initiated in several ways, including high throughput, through automation, and open access using MassHunter Walkup. On a per-sample basis, the user can process the sample using the Reprocess Sample dialog box (Figure 4). Starting with an MS/MS data file acquired on an Agilent LC/Q-TOF, the user first chooses the Protein Digest Workflow, then the Condition (cysteine bonds reduced, that is, broken, or nonreduced, that is, intact), the Sequence (which is available from the Sequence Manager), any modifications or profiles that they want to apply (for example, glycoforms, alkylation), and the digest enzymes. Clicking Reprocess starts the analysis.

4
Associating MS/MS Spectra with BiomoleculesThe peptide mapping algorithm associates MS/MS spectra with the biomolecules based on their MS1 spectra using the MS/MS isolation width and retention time (Figure 6). In the case of chimeric (that is, multipeptide) spectra, one MS/MS spectrum can be associated with more than one biomolecule. MS/MS spectra are more information-rich than MS1 due to the specificity of fragmentation, and have the potential for higher confidence peptide spectrum matches (PSMs). The MS/MS spectra will be associated with biomolecules if a biomolecule exists for it, but if no biomolecule exists, the algorithm will create one using the precursor mass. In this manner, every MS/MS scan will be evaluated as a potential PSM.
Matching Peptide Sequences to MS/MS Spectra, and ValidatingThe peptide mapping algorithm matches every possible sequence against MS/MS spectra while taking PTMs into account. To speed up the search time, it uses a graph-based algorithm that can encode a number of possible PTMs in a compact data structure2. Once a list of likely PSMs is created, the PSMs are then ranked using their spectral E-value, which is the probability of observing such results by chance3. This is accomplished by comparing the PSM raw score to a spectrum-specific histogram of every possible peptide (Figure 7). The peptide with the best spectral E-value is assigned to the MS/MS spectrum.
Figure 6. MS/MS spectra with different precursor ions and retention time ranges are associated with a biomolecule MS1 spectrum.
Figure 7. Score histogram of frequency of possible sequence matches based on raw score enables calculation of the E-value.
Frequency
Raw score
PSMraw score
E-value/P-value
5
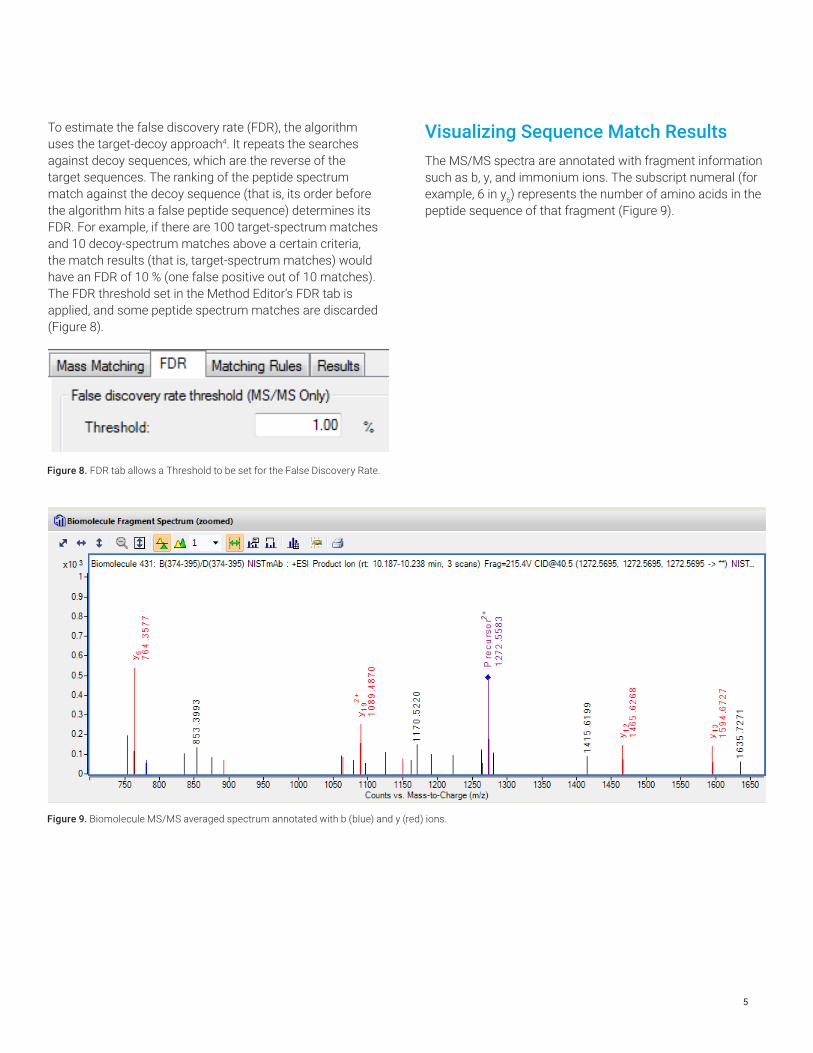
To estimate the false discovery rate (FDR), the algorithm uses the target-decoy approach4. It repeats the searches against decoy sequences, which are the reverse of the target sequences. The ranking of the peptide spectrum match against the decoy sequence (that is, its order before the algorithm hits a false peptide sequence) determines its FDR. For example, if there are 100 target-spectrum matches and 10 decoy-spectrum matches above a certain criteria, the match results (that is, target-spectrum matches) would have an FDR of 10 % (one false positive out of 10 matches). The FDR threshold set in the Method Editor’s FDR tab is applied, and some peptide spectrum matches are discarded (Figure 8).
Figure 8. FDR tab allows a Threshold to be set for the False Discovery Rate.
Visualizing Sequence Match ResultsThe MS/MS spectra are annotated with fragment information such as b, y, and immonium ions. The subscript numeral (for example, 6 in y6) represents the number of amino acids in the peptide sequence of that fragment (Figure 9).
Figure 9. Biomolecule MS/MS averaged spectrum annotated with b (blue) and y (red) ions.
6
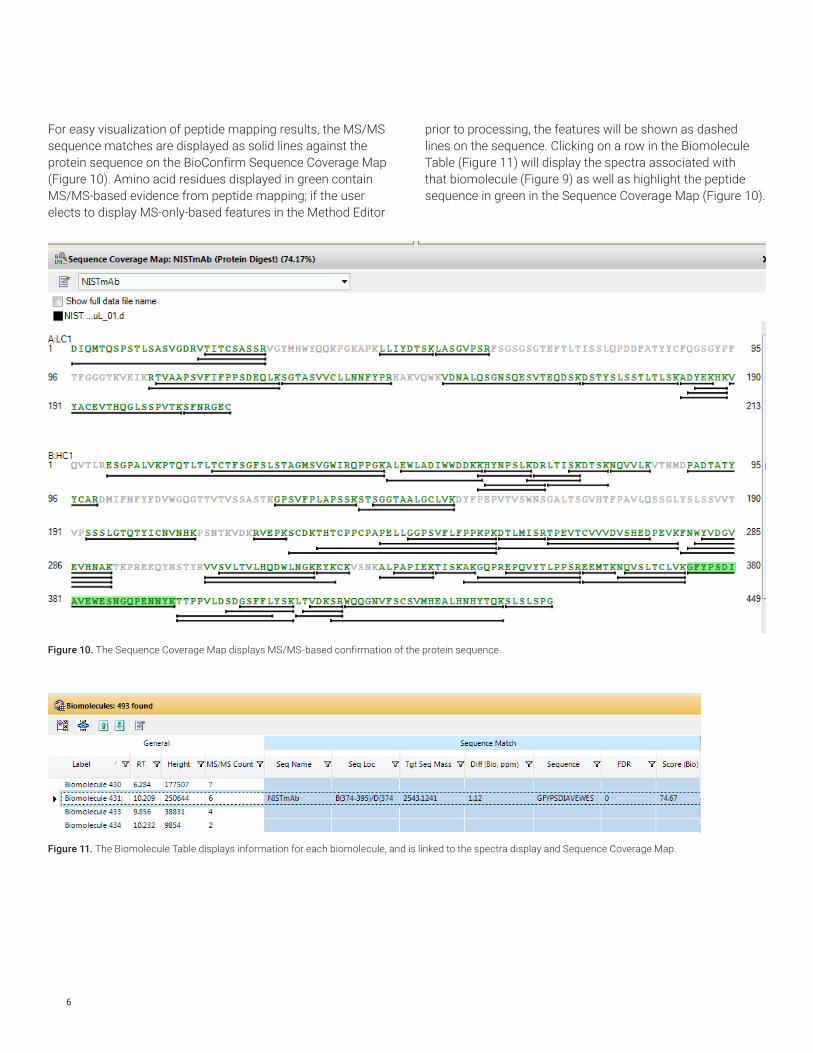
For easy visualization of peptide mapping results, the MS/MS sequence matches are displayed as solid lines against the protein sequence on the BioConfirm Sequence Coverage Map (Figure 10). Amino acid residues displayed in green contain MS/MS-based evidence from peptide mapping; if the user elects to display MS-only-based features in the Method Editor
Figure 10. The Sequence Coverage Map displays MS/MS-based confirmation of the protein sequence.
prior to processing, the features will be shown as dashed lines on the sequence. Clicking on a row in the Biomolecule Table (Figure 11) will display the spectra associated with that biomolecule (Figure 9) as well as highlight the peptide sequence in green in the Sequence Coverage Map (Figure 10).
Figure 11. The Biomolecule Table displays information for each biomolecule, and is linked to the spectra display and Sequence Coverage Map.

7
Figure 12. Multiple Iterative MS/MS data files loaded into the Sequence Coverage Map.
The peptide mapping results in the Biomolecule Table can display columns of both the FDR and the Score (Bio), which ranges from 0 to 100, and is calculated using the number of fragment ions, taking into account consecutive and complementary ions. It is abundance-weighted so that ions from large-abundance mass peaks contribute to larger scores.
It is possible to inspect results from multiple data files at the same time, for example, from different enzyme digests or Iterative MS/MS experiments. Figure 12 shows the heavy chain (HC) of a CHO cell cultured human IgG1 mAb in the Sequence Coverage Map with two data files loaded. The first acquisition (in black) confirmed 96.5 % of the sequence; the second Iterative MS/MS dug deeper and found an additional peptide at A(294-306) to raise the sequence confirmation to 99.1 %.
ConclusionsGiven the requirement to accurately characterize protein therapeutics, the need for speed and confidence in the results becomes critical. The Agilent MassHunter BioConfirm peptide mapping algorithm uses MS/MS spectra as the primary source for matches due to the density of information that can be extracted. It efficiently models possible peptide sequences, including PTMs and linkages, then evaluates matches to minimize the number of false positives while maximizing the number of true positives. The algorithm performs an additional validation using the target-decoy method, and has a user-settable threshold for which matches are discarded as well as a score denoting the quality of the match. Finally, results are visualized in a manner that allows quick inspection of the evidence for sequence coverage in spectral, tabular, and graphical formats at the same time.
www.agilent.com/chem
For Research Use Only. Not for use in diagnostic procedures.
This information is subject to change without notice.
© Agilent Technologies, Inc. 2017 Printed in the USA, September 29, 2017 5991-8552EN
References1. Sullivan, et al Drug Development & Delivery November/
December 2016 Vol 16 No 9: 44-47.
2. Park, et al. Nat. Methods (2017): doi:10.1038/nmeth.4388
3. Kim, et al. Nat Commun. (2014) 5:5277
4. Elias, et al. Methods Mol Biol. (2010) 604: 55–71.
For more informationFor more information on our products and services, visit our Web site at www.agilent.com/chem