Highlights - TD Canada Trust · Highlights • Record cash EPS ... Total Revenues $163 $249 $243...
22
1 BANK ANK F FINANCIAL INANCIAL G GROUP ROUP THIRD THIRD Q QUARTER UARTER 1999 1999 Dan Dan Marinangeli Marinangeli Highlights • Record cash EPS of $0.66 excluding gain on sale of TD Waterhouse - up 38% from last year and 14% from last quarter (accrual EPS $0.64 - up 39% from last year) • Cash ROE 21.4% excluding gain on Waterhouse (accrual ROE 18.9%) • Transacted $US 1.0B IPO for TD Waterhouse - the largest internet related IPO in NYSE history. Resulted in gain of $CDN 1.082 Billion • Increased Tier 1 and Total Capital ratios to 8.7% and 12.1% respectively • Reduced expected full year PCL by $100MM to $300MM including $100MM special general provision 2
Transcript of Highlights - TD Canada Trust · Highlights • Record cash EPS ... Total Revenues $163 $249 $243...

1
BBANKANK F FINANCIALINANCIAL G GROUPROUP
THIRDTHIRD Q QUARTERUARTER 1999 1999
Dan Dan MarinangeliMarinangeli
Highlights
• Record cash EPS of $0.66 excluding gain on sale of TDWaterhouse - up 38% from last year and 14% from lastquarter (accrual EPS $0.64 - up 39% from last year)
• Cash ROE 21.4% excluding gain on Waterhouse (accrualROE 18.9%)
• Transacted $US 1.0B IPO for TD Waterhouse - the largestinternet related IPO in NYSE history. Resulted in gain of$CDN 1.082 Billion
• Increased Tier 1 and Total Capital ratios to 8.7% and12.1% respectively
• Reduced expected full year PCL by $100MM to $300MMincluding $100MM special general provision
2

2
ROE Cash Basis*
10
15
20
25
Q1/97
Q2/97
Q3/97
Q4/97
Q1/98
Q2/98
Q3/98
Q4/98
Q1/99
Q2/99
Q3/99
Cash Basis ROEAccrual Basis ROE
* Cash basis measurement is based on excluding goodwill effect from both earnings and capital. Data adjusted to exclude extraordinary items.
%
Fiscal 1998 = 17.4%
Fiscal 1997 = 19.0%
3
Cash EPS Growth
Base = Q1/98
5060708090
100110120130140150
Q1 98 Q2 98 Q3 98 Q4 98 Q1 99 Q2 99 Q3 99
TD 4 Peer Average
4
*
*Q3/99 peer average based on adjusted consensus analyst estimates
3
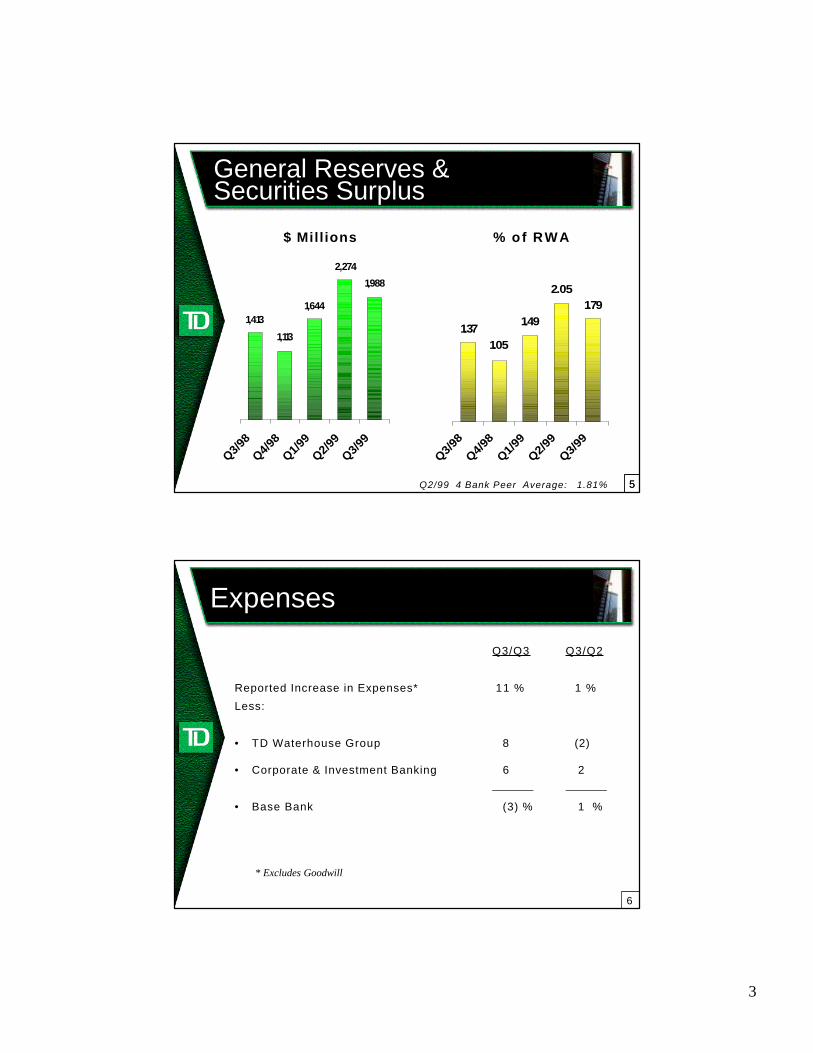
General Reserves &Securities Surplus
1.792.05
1.49
1.051.37
Q3/98
Q4/98
Q1/99
Q2/99
Q3/99
% of RWA
1,988
2,274
1,644
1,113
1,413
Q3/98
Q4/98
Q1/99
Q2/99
Q3/99
$ Mill ions
Q2/99 4 Bank Peer Average: 1.81% 55
Expenses
Q3/Q3 Q3/Q2
Reported Increase in Expenses* 11 % 1 %
Less:
• TD Waterhouse Group 8 (2)
• Corporate & Investment Banking 6 2
• Base Bank (3) % 1 %
* Excludes Goodwill
6

4
12
3
THREE GROWTH STRATEGIES
Invest in wealthmanagementbusinesses
Reposition retailbanking network
Focus corporate andinvestment banking
businesses
Wealth Management Segment vsTD Waterhouse Group
Wealth Management Segment - TD Bank comprised of:
• TD Waterhouse - global discount brokerage
• TD Investments - investment management
• Mutual Funds - Canadian fund operations
Wealth Management/Discount Brokerage segment resultsdiffer from the public company TD Waterhouse Groupresults because:
• $CDN versus $US
• Minority interest of 11.5%
• Goodwill adjustments
• U.S. GAAP accounting for option expense
• Knight/Trimark shares not owned by TD Waterhouse Group
8

5
Wealth Management
$1,485
$298$403* $403*
$471
Q3/98 Q2/99 Q3/99
Revenue$ Millions
$93
$52* $37
$1,130
$48*
Q3/98 Q2/99 Q3/99
Net Income$ Millions
* Excludes gains, restated for transfer of Private Client business to P&C9
0
100
200
300
400
500
Q3/98 Q4/98 Q1/99 Q2/99* Q3/99
Fund Services
TD Investments
Mutual Funds
TD Waterhouse:Other
TD Waterhouse:Canada
TD Waterhouse:USA
Wealth ManagementRevenue by Component
$ Millions
*Excludes gains10

6
0
50
100
150
200
250
Q2/97
Q3/97
Q4/97
Q1/98
Q2/98
Q3/98
Q4/98
Q1/99
Q2/99
Q3/99
TD Investments
Mutual Funds
TD Waterhouse:Other
TD Waterhouse:Canada
TD Waterhouse:USA
$ Billions
Wealth ManagementAssets Under Administration
11
April 30April 30 July 31July 31 ChangeChangeJuly 31July 31
19981998 19991999 Yr/YrYr/Yr
($US Millions)
Commission/Fees $106 $177 $155 47%
Other Revenue 57 72 88 53%
Total Revenues $163 $249 $243 49%
Total Expenses 136 194 194 43%
Net Income $ 13 $ 30 $ 26 104%
EPS (Diluted) $0.04 $0.09 $0.08 94%
TD Waterhouse Group
12

7
TD Waterhouse Group
Active Accounts (000) 1,485 1,884 2,066 39%
New accounts (000) 125 253 169 35%
Trades/day (000) 58 118 109 86%
Online penetration 45% 59% 64% 43%
Customer Assets($B) $74 $106 $113 51%
April 30April 30 July 31July 31 ChangeChangeJuly 31July 31
19981998 19991999 Yr/YrYr/Yr
13
($US)
Mutual Funds - Canada
$4
$6
$8
$10
$12
$14
$16
$18
Q3/97
Q1/98
Q3/98
Q1/99
Q3/99
4%
5%
6%
Canada Waterhouse Cdn M.F. Industry Mkt. Share to June/99
$ BillionsWAF: 1.12% 1.16% 1.19% 1.17% 1.13% 1.14% 1.12% 1.12%WAF: 1.12% 1.16% 1.19% 1.17% 1.13% 1.14% 1.12% 1.12%
14

8
12
3
THREE GROWTH STRATEGIES
Reposition retailbanking network
Invest in wealthmanagementbusinesses
Focus corporate andinvestment banking
businesses
$794 $779$819
Q3/98 Q2/99 Q3/99
Revenue$ Millions
$139
$101$104
Q3/98 Q2/99 Q3/99
Net Income$ Millions
Personal & Commercial Bank
* Restated to include transfer of Private Client group16

9
Personal and CommercialBanking Margin
2.50%
3.00%
3.50%
4.00%
Q3 98 Q4 98 Q1 99 Q2 99 Q3 99
17
Residential Mortgages
$ Billions
$24
$27
$30
$33
$36
$39
Q3/97 Q1/98 Q3/98 Q1/99 Q3/9913%
14%
15%
Volume Cdn. Bank Mkt. Share to June/99
Insured mortgages
Q3/99: 74 %
Q3/98: 73 %
Note: Data includes securitized mortgages.
8% year over year growth
18

10
$6
$8
$10
$12
$14
$16
Q3/97 Q1/98 Q3/98 Q1/99 Q3/99
10%
11%
12%
13%
Volume Cdn. Bank Mkt. Share to June/99
$ Billions
Note: Data includes securitized loans.
9% year over year growth
Personal Loans & Cards(Canadian Currency)
19
Personal Deposits(Canadian Currency)
$36
$37
$38
$39
$40
$41
$42
Q3/97 Q1/98 Q3/98 Q1/99 Q3/9912%
13%
14%
Volume Cdn. Bank Mkt. Share to June/99
$ Billions 7% year over year growth
20

11
Electronic Banking
15%
30%
45%
Q1 97 Q3 97 Q1 98 Q3 98 Q1 99 Q3 9910
10.5
11
11.5
12
12.5
13
Web & Telephone BankingCounter Transactions (MM's)
Web and telephone banking customers as a % penetrationof TD households vs number of counter transactions
40% penetration and 1.7MM customers (181M web and 1.5MM telephone)21
12
3
THREE GROWTH STRATEGIES
Reposition retailbanking network
Invest in wealthmanagementbusinesses
Focus corporate andinvestment banking
businesses

12
$573
$744$623
$544*
Q3/98 Q2/99 Q3/99
$ Millions
Corporate & InvestmentBanking: Revenue
*Excludes special gains
23
$163
$258
$192
$150*
Q3/98 Q2/99 Q3/99
Net Income$ Millions
20%
16%
26%
15%*
Q3/98 Q2/99 Q3/99
ROE%
* Excludes special gains
Corporate & InvestmentBanking
24

13
Capital Allocated
1996 1997 1998 1999 YTD
Other Personal & Commercial Banking
Wealth Management Corporate & Investment Banking
Retail 45%
Wholesale
55%
Retail50%*
Wholesale
50%
Goal(2001)
40%
60%
*Other Capital included in Retail
25
BBANKANK F FINANCIALINANCIAL G GROUPROUP
Q3 1999Q3 1999Risk ManagementRisk Management
Tom SpencerTom Spencer

14
Strong Asset Quality
0.00
0.20
0.40
0.60
0.80
1.00
1994 1995 1996 1997 1998 Q1/99 Q2/99 Q3/99
TD 4 Bank Peer
%
Ratio of PCL to Loans & BAs
Notes: Excludes special general provisions and reverse repos.
10 bps*
27*1999 full year estimate for PCL to loans and BA’s at July 31/99 20 bps
General Reserves &Net Impaired Loans
0.18
0.39
0.610.67 0.67 0.68
1996 1997 1998 Q1 99 Q2 99 Q3 991996 1997 1998 Q1 99 Q2 99 Q3 99
$ Millions
Q2 99 4 Bank Peer Average: 0.61%
Net Impaired Loans $(411)million
$636
General Reservesas a % of RWA
$402
$159
$744 $740 $749
28

15
$0
$250
$500
$750
$1,000
$1,250
$1,500
1993 1994 1995 1996 1997 1998 Q2/99Q3/990%
1%
2%
3%
4%
$ Millions
BUSINESS & GOVERNMENT
As a % of Loans & BA’s
Net Impaired Loans(before General Reserves)
61 bps
29
Asian ExposureGross Outstanding Loans and other Credit Exposures
Millions of Canadian DollarsJuly 31, 1999
Country
China *Hong KongIndonesiaMalaysiaPhilippinesSingaporeSouth KoreaTaiwanThailandSub-total
Japan
Total
Sovereign
8
14166
188
2,553
$2,741
Banks
64 36 26 4 3 168 70 30 401
68
$469
Commercial& Industrial
55 166 45 46 7 547 8 874
1,397
$2,271
Total
65 100 195
49 63 341 617 38 1,468
4,140
$5,608
Mark toMarket
1 1 3
5
122
$127* We have no exposure to International Trusts and Investment Corporations.
TotalApr./99
55 94 230 2 65 61 141 728 36 1,412
3,514
$4,926
30

16
Latin American ExposureGross Outstanding Loans and other Credit Exposures
Millions of Canadian DollarsJuly 31, 1999
Country
ArgentinaBrazilChileColombiaMexicoPeruAll Other
Total
Banks
153 122 133 129 327 17 23
$904
Commercial& Industrial
223 28 160 15 131 67
$624
Mark toMarket
$0
Total
376 150 293 144 458 17 90
$1,528
TotalApr./99
491 85 309 150 403 30 43
$1,512
31
BBANKANK F FINANCIALINANCIAL G GROUPROUP
Q3 1999Q3 1999
Bob KellyBob KellyVice Chair, Retail BankingVice Chair, Retail Banking
An overview of TD WaterhouseAn overview of TD WaterhouseNational BankNational Bank

17
TD WaterhouseNational Bank
• TD’s original purchase of Waterhouse
included a national US banking license.
• Original purpose of the bank was to house
“Investor’s Money Market” accounts.
• NOW : a fully functional electronic bank
available to both US and Canadian
customers.
BackgroundBackground
33
TD WaterhouseNational Bank
• Sell Banking services to 1.9 million TD
Waterhouse U.S. investing customers.
• Provide cross-border electronic banking
services to Canadian customers.
• Integrate banking/brokerage services on
both sides of the border.
• Identify profitable customer segments to
build further banking presence in U.S.
StrategyStrategy
34
18
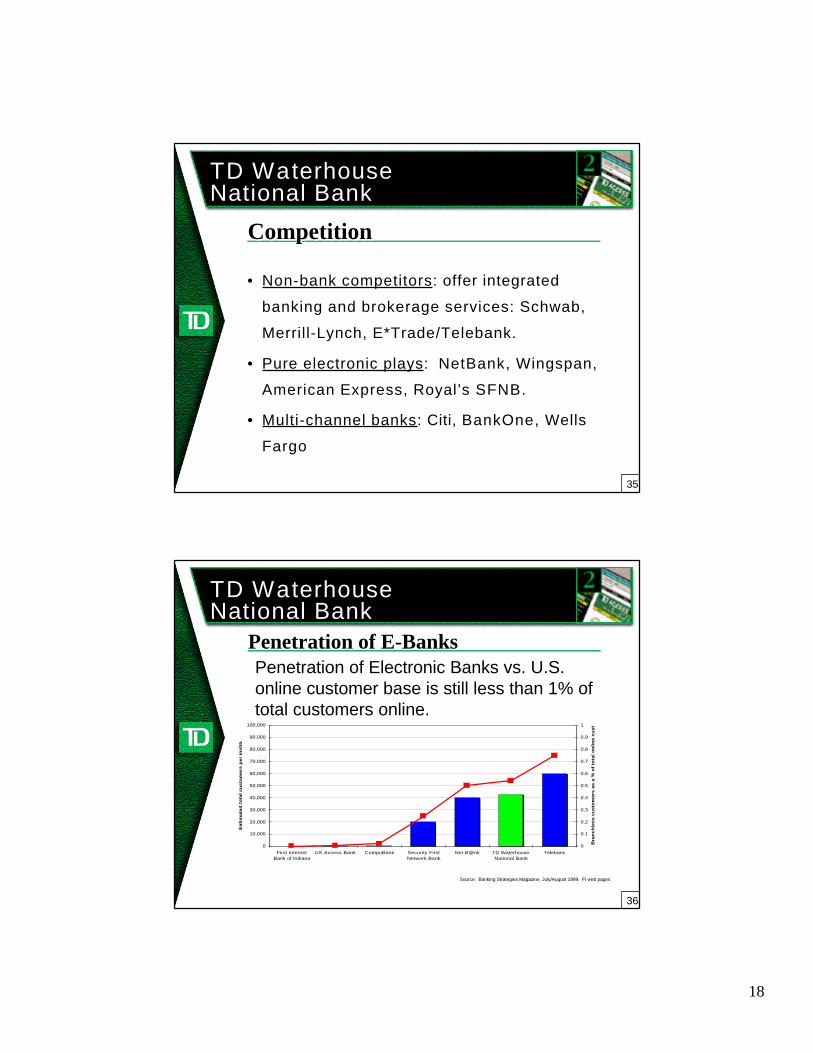
TD WaterhouseNational Bank
• Non-bank competitors: offer integrated
banking and brokerage services: Schwab,
Merrill-Lynch, E*Trade/Telebank.
• Pure electronic plays: NetBank, Wingspan,
American Express, Royal’s SFNB.
• Multi-channel banks: Citi, BankOne, Wells
Fargo
CompetitionCompetition
35
TD WaterhouseNational Bank
0
10,000
20,000
30,000
40,000
50,000
60,000
70,000
80,000
90,000
100,000
First InternetBank of Indiana
US Access Bank CompuBank Security FirstNetwork Bank
Net.B@nk TD WaterhouseNational Bank
Telebanc
Ea
tim
ate
d t
ota
l c
us
tom
ers
pe
r in
sti
tuti
on
0
0.1
0.2
0.3
0.4
0.5
0.6
0.7
0.8
0.9
1
Bra
nc
hle
ss
cu
sto
me
rs a
s a
% o
f to
tal
on
lin
e c
us
tom
ers
Penetration of E-Banks Penetration of E-Banks Penetration of Electronic Banks vs. U.S.online customer base is still less than 1% oftotal customers online.
Source: Banking Strategies Magazine, July/August 1999, FI web pages
36

19
TD WaterhouseNational Bank
• Growing TD Waterhouse customer base, of
which 837,000 are now on-line.
• Integration of Bank and Broker on both
sides of the border
• TDW branch network.
• TD Waterhouse brand
• Canadian E-Banking know-how.
Competitive Advantages:Competitive Advantages:
37
TD WaterhouseNational Bank
0
500
1,000
1,500
2,000
ac
co
un
ts (
00
0)
1996 1997 1998 q3/99
TWE accounts (US)
TWE accounts online(US)
WNB accounts
The opportunity is signficantThe opportunity is signficantTWE Customer Accounts showing penetrationof Online and Banking accounts. TD WNBaccounts represent 5% of target population.
38

20
TD WaterhouseNational Bank
• A Complete product suite:
• Credit cards
• ATM/Check cards
• checking accounts
• secured and unsecured lines of credit
• mortgages.
What we have built to date:What we have built to date:
39
TD WaterhouseNational Bank
• Fully functional phone support (based in Canada),
• Web Banking offering transactions, product
applications and bill payment,
• Marketing Web site with l inks to TWE Web Broker
and to TD.
• Funds transfer between TD and WNB.
• Coming this month: funds transfer on the Web
between Bank and Broker in the US.
• Partnership with TWE Branch network.
A complete set of Channels:A complete set of Channels:
40

21
TD WaterhouseNational Bank
• Sept. launch in conjunction with TD Waterhouse.
• More complete banking product suite,
incorporating the “Open Finance” model: a
commitment to provide“best of breed” banking
offers from other providers.
• Continued integration between bank and
brokerage, US and Canada.
• Loyalty Plan.
• Identify new profitable customer segments.
Next Steps:Next Steps:
41
Forward Looking Statements
42
This document may contain forward-looking statements, includingstatements regarding the business and anticipated financialperformance of TD. These statements are subject to a number ofrisks and uncertainties that may cause actual results to differmaterially from those contemplated by the forward-lookingstatements. Some of the factors that could cause such differencesinclude legislative or regulatory developments, competition,technological change, global capital market activity, interest rates,inflation and general economic conditions in geographic areas whereTD operates. Also, additional risk factors relating to the pendingacquisition of CT Financial Services Inc. are described in TD'sReport on Form 6-K, filed with the U.S. Securities and ExchangeCommission on August 3, 1999 and TD's Material Change Report,filed with the Ontario Securities Commission on August 3, 1999.
22
BBANKANK F FINANCIALINANCIAL G GROUPROUP
THIRDTHIRD Q QUARTERUARTER 1999 1999