Highlights from TIMSS 2011 Mathematics and Science Achievement ...
56
Highlights From TIMSS 2011 Mathematics and Science Achievement of U.S. Fourth- and Eighth-Grade Students in an International Context NCES 2013-009 U.S. DEPARTMENT OF EDUCATION
Transcript of Highlights from TIMSS 2011 Mathematics and Science Achievement ...
a
Highlights From TIMSS 2011Mathematics and Science Achievement of U.S. Fourth- and Eighth-Grade Students in an International Context
NCES 2013-009
U.S. DEPARTMENT OF EDUCATION
Highlights From
TIMS
S 2011
2012
ies.ed.govwww.ed.gov

Page intentionally left blank
b

Highlights From TIMSS 2011Mathematics and Science Achievement of U.S. Fourth- and Eighth-Grade Students in an International Context
DECEMBER 2012
Stephen ProvasnikProject Officer National Center for Education Statistics
David Kastberg
David Ferraro
Nita Lemanski
Stephen Roey
Frank Jenkins
Westat
NCES 2013-009 U.S. DEPARTMENT OF EDUCATION
U.S. Department of EducationArne DuncanSecretary
Institute of Education SciencesJohn Q. EastonDirector
National Center for Education StatisticsJack BuckleyCommissioner
The National Center for Education Statistics (NCES) is the primary federal entity for collecting, analyzing, and reporting data related to education in the United States and other nations. It fulfills a congressional mandate to collect, collate, analyze, and report full and complete statistics on the condition of education in the United States; conduct and publish reports and specialized analyses of the meaning and significance of such statistics; assist state and local education agencies in improving their statistical systems; and review and report on education activities in foreign countries.
NCES activities are designed to address high-priority education data needs; provide consistent, reliable, complete, and accurate indicators of education status and trends; and report timely, useful, and high-quality data to the U.S. Department of Education, the Congress, the states, other education policymakers, practitioners, data users, and the general public. Unless specifically noted, all information contained herein is in the public domain.
We strive to make our products available in a variety of formats and in language that is appropriate to a variety of audiences. You, as our customer, are the best judge of our success in communicating information effectively. If you have any comments or suggestions about this or any other NCES product or report, we would like to hear from you. Please direct your comments to
NCES, IES, U.S. Department of Education1990 K Street NWWashington, DC 20006-5651
December 2012
The NCES Home Page address is http://nces.ed.gov.The NCES Publications and Products address is http://nces.ed.gov/pubsearch.
This publication is only available online. To download, view, and print the report as a PDF file, go to the NCES Publications and Products address shown above.
This report was prepared in part under Contract No. ED-04-CO-0059/0026 with Westat. Mention of trade names, commercial products, or organizations does not imply endorsement by the U.S. Government.
Suggested Citation
Provasnik, S., Kastberg, D., Ferraro, D., Lemanski, N., Roey, S., and Jenkins, F. (2012). Highlights From TIMSS 2011: Mathematics and Science Achievement of U.S. Fourth- and Eighth-Grade Students in an International Context (NCES 2013-009). National Center for Education Statistics, Institute of Education Sciences, U.S. Department of Education. Washington, DC.
Content ContactStephen Provasnik(202) [email protected]
iii
HIGHLIGHTS FROM TIMSS 2011 EXECUTIVE SUMMARY
Executive SummaryThe Trends in International Mathematics and Science Study (TIMSS) is an international comparative study of student achievement. TIMSS 2011 represents the fifth such study since TIMSS was first conducted in 1995. Developed and implemented at the international level by the International Association for the Evaluation of Educational Achievement (IEA)—an international organization of national research institutions and governmental research agencies—TIMSS assesses the mathematics and science knowledge and skills of 4th- and 8th-graders. TIMSS is designed to align broadly with mathematics and science curricula in the participating countries and education systems.
This report focuses on the performance of U.S. students1 relative to their peers around the world in countries and other education systems that participated in TIMSS 2011. For the purposes of this report, “countries” are complete, independent political entities, whereas “other education systems” represent a portion of a country, nation, kingdom, or emirate or are other non-national entities (e.g., U.S. states, Canadian provinces, Flemish Belgium, and Northern Ireland). In this report, these “other education systems” are designated as such by their national three-letter international abbreviation appended to their name (e.g., England-GBR, Ontario-CAN). This report also examines changes in mathematics and science achievement compared with TIMSS 1995 and TIMSS 2007.
In 2011, TIMSS was administered at grade 4 in 57 countries and other education systems and, at grade 8, in 56 countries and other education systems.2 These total counts include U.S. states that participated in TIMSS 2011 not only as part of the U.S. national sample of public and private schools but also individually with state-level public school samples. At grade 4, this was Florida and North Carolina, and at grade 8 this was Alabama, California, Colorado, Connecticut, Florida, Indiana, Massachusetts, Minnesota, and North Carolina. Note that, because all TIMSS participants are treated equally, these states are compared with the United States (national sample) throughout this report. All differences described in this report are statistically significant at the .05 level. No statistical adjustments to account for multiple comparisons were used.
1At grade 4, a total of 369 schools and 12,569 students participated in the United States in 2011. At grade 8, a total of 501 schools and 10,477 students participated. The overall weighted school response rate in the United States was 79 percent at grade 4 before the use of substitute schools. The weighted student response rate at grade 4 was 95 percent. At grade 8, the overall weighted school response rate before the use of substitute schools was 87 percent. The weighted student response rate at grade 8 was 94 percent. 2The 57 education systems that administered TIMSS at grade 4 overlap only partially with the set of 56 education systems that administered it at grade 8 (see table 1 for details). The total number of education systems reported here differs from the total number reported in the international TIMSS reports (Mullis et al. 2012; Martin et al. 2012) because some education systems administered the TIMSS grade 4 assessment to 6th-grade students, and some administered the TIMSS grade 8 assessment to 9th-grade students. Education systems that did not assess students at the target grade level are not counted or included in this report.
Key findings from the report include the following:
Mathematics at grade 4• The U.S. average mathematics score at grade 4 (541)
was higher than the international TIMSS scale average, which is set at 500.3
• At grade 4, the United States was among the top 15 education systems in mathematics (8 education systems had higher averages and 6 were not measurably different) and scored higher, on average, than 42 education systems.
• The 8 education systems with average mathematics scores above the U.S. score were Singapore, Korea, Hong Kong-CHN, Chinese Taipei-CHN, Japan, Northern Ireland-GBR, North Carolina-USA, and Belgium (Flemish)-BEL.
• Among the U.S. states that participated in TIMSS at grade 4, North Carolina scored above the TIMSS scale average and the U.S. national average in mathematics, while Florida scored above the TIMSS scale average but was not measurably different from the U.S. national average.
• Compared with 1995, the U.S. average mathematics score at grade 4 was 23 score points higher in 2011 (541 vs. 518).
• Compared with 2007, the U.S. average mathematics score at grade 4 was 12 score points higher in 2011 (541 vs. 529).
• The percentage of 4th-graders performing at or above the Advanced international mathematics benchmark in 2011 was higher than in the United States in 7 education systems, was not different in 4 education systems, and was lower than in the United States in 45 education systems.4
3TIMSS provides two overall scales—mathematics and science—as well as several content and cognitive domain subscales for each of the overall scales. The scores are reported on a scale from 0 to 1,000, with the TIMSS scale average set at 500 and standard deviation set at 100.4TIMSS reports on four benchmarks to describe student performance in mathematics and science. Each benchmark is associated with a score on the achievement scale and a description of the knowledge and skills demonstrated by students at that level of achievement. The Advanced international benchmark indicates that students scored 625 or higher. More information on the benchmarks can be found in the main body of the report and appendix A.
iv
EXECUTIVE SUMMARY HIGHLIGHTS FROM TIMSS 2011
Mathematics at grade 8• The U.S. average mathematics score at grade 8 (509)
was higher than the international TIMSS scale average, which is set at 500.
• At grade 8, the United States was among the top 24 education systems in mathematics (11 education systems had higher averages and 12 were not measurably different) and scored higher, on average, than 32 education systems.
• The 11 education systems with average mathematics scores above the U.S. score were Korea, Singapore, Chinese Taipei-CHN, Hong Kong-CHN, Japan, Massachusetts-USA, Minnesota-USA, the Russian Federation, North Carolina-USA, Quebec-CAN, and Indiana-USA.
• Among the U.S. states that participated in TIMSS at grade 8, Massachusetts, Minnesota, North Carolina, and Indiana scored both above the TIMSS scale average and the U.S. national average in mathematics. Colorado, Connecticut, and Florida scored above the TIMSS scale average, but they were not measurably different from the U.S. national average. California was not measurably different from the TIMSS scale average but scored below the U.S. national average, while Alabama scored both below the TIMSS scale average and the U.S. national average in mathematics.
• Compared with 1995, the U.S. average mathematics score at grade 8 was 17 score points higher in 2011 (509 vs. 492).
• There was no measurable difference between the U.S. average score in 2007 (508) and in 2011 (509).
• The percentage of 8th-grade students performing at or above the Advanced international mathematics benchmark in 2011 was higher than in the United States in 11 education systems; was not different in 13 education systems; and was lower than in the United States in 31 education systems.
Science at grade 4• In 2011, the average science score of U.S. 4th-
graders (544) was higher than the international TIMSS scale average, which is set at 500.
• At grade 4, the United States was among the top 10 education systems in science (6 education systems had higher averages and 3 were not measurably different) and scored higher, on average, than 47 education systems.
• The 6 education systems with average science scores above the U.S. score were Korea, Singapore, Finland, Japan, the Russian Federation, and Chinese Taipei-CHN.
• Among the U.S. states that participated in TIMSS at grade 4, both Florida and North Carolina scored above the TIMSS scale average but were not measurably different from the U.S. national average.
• There was no measurable difference between the U.S. average science score at grade 4 in 1995 (542) and in 2011 (544).
• There was no measurable difference between the U.S. average score in 2007 (539) and in 2011 (544).
• The percentage of 4th-graders performing at or above the Advanced international science benchmark in 2011 was higher than in the United States in 3 education systems, was not different in 6 education systems, and was lower than in the United States in 47 education systems.
Science at grade 8• In 2011, the average science score of U.S.
8th-graders (525) was higher than the TIMSS scale average, which is set at 500.
• At grade 8, the United States was among the top 23 education systems in science (12 education systems had higher averages and 10 were not measurably different) and scored higher, on average, than 33 education systems.
• The 12 education systems with average science scores above the U.S. score were Singapore, Massachusetts-USA, Chinese Taipei-CHN, Korea, Japan, Minnesota-USA, Finland, Alberta-CAN, Slovenia, the Russian Federation, Colorado-USA, and Hong Kong-CHN.
• Among the U.S. states that participated in TIMSS at grade 8, Massachusetts, Minnesota, and Colorado scored both above the TIMSS scale average and the U.S. national average in science. Indiana, Connecticut, North Carolina, and Florida scored above the TIMSS scale average, but they were not measurably different from the U.S. national average. California was not measurably different from the TIMSS scale average but scored below the U.S. national average, while Alabama scored both below the TIMSS scale average and the U.S. national average in science.
• Compared with 1995, the U.S. average science score was 12 score points higher in 2011 (525 vs. 513).
• There was no measurable difference between the U.S. average score in 2007 (520) and in 2011 (525).
• The percentage of 8th-grade students performing at or above the Advanced international science benchmark in 2011 was higher than in the United States in 12 education systems, was not different in 10 education systems, and was lower than in the United States in 33 education systems.
v
HIGHLIGHTS FROM TIMSS 2011 ACKNOWLEDGMENTS
AcknowledgmentsThe authors wish to thank the students, teachers, and school officials who participated in TIMSS 2011. Without their assistance and cooperation, this study would not be possible. The authors also wish to thank all those who contributed to the TIMSS design, implementation, and data collection as well as the writing, production, and review of this report. We especially want to thank the TIMSS state coordinators: Rhonda Patton (Alabama), Jessica Valdez (California), Pam Sandoval (Colorado), Renee Savoie (Connecticut), Todd Clark (Florida), Mark O’Malley (Indiana), Rebecca Bennett (Massachusetts), Kate Beattie (Minnesota), and Iris Garner (North Carolina).

Page intentionally left blank
vii
HIGHLIGHTS FROM TIMSS 2011 CONTENTS
Contents Page
Executive Summary .....................................................................................................................................................iii
Acknowledgments ....................................................................................................................................................... v
Contents ......................................................................................................................................................................vii
List of Tables ................................................................................................................................................................ ix
List of Figures ...............................................................................................................................................................xii
List of Exhibits .............................................................................................................................................................xiii
Introduction.................................................................................................................................................................. 1
TIMSS in brief ................................................................................................................................................................... 1
Countries or Education Systems? .................................................................................................................................. 1
Design and administration of TIMSS .............................................................................................................................. 3
The mathematics assessment ....................................................................................................................................... 4
The science assessment ................................................................................................................................................ 4
For more detailed information ....................................................................................................................................... 4
Reporting TIMSS results ................................................................................................................................................... 5
Nonresponse bias in the U.S. TIMSS samples ................................................................................................................. 6
Further information ......................................................................................................................................................... 7
Mathematics Performance in the United States and Internationally ......................................................................... 9
Average scores in 2011 .................................................................................................................................................. 9
Change in scores ......................................................................................................................................................... 12
Content domain scores in 2011 .................................................................................................................................. 16
Performance on the TIMSS international benchmarks ............................................................................................... 19
Average scores of male and female students ........................................................................................................... 24
Performance within the United States ......................................................................................................................... 27
Average scores of students of different races and ethnicities ............................................................................ 27
Average scores of students attending public schools of various poverty levels ............................................... 28
TIMSS 2011 results for Alabama ............................................................................................................................ 29
TIMSS 2011 results for California ............................................................................................................................ 30
TIMSS 2011 results for Colorado ............................................................................................................................ 31
TIMSS 2011 results for Connecticut ....................................................................................................................... 32
TIMSS 2011 results for Florida ................................................................................................................................. 33
TIMSS 2011 results for Indiana ............................................................................................................................... 35
TIMSS 2011 results for Massachusetts ................................................................................................................... 36

viii
CONTENTS HIGHLIGHTS FROM TIMSS 2011
Contents — Continued
Page
TIMSS 2011 results for Minnesota ........................................................................................................................... 37
TIMSS 2011 results for North Carolina ................................................................................................................... 38
Science Performance in the United States and Internationally ............................................................................... 41
Average scores in 2011 ................................................................................................................................................ 41
Change in scores ........................................................................................................................................................ 41
Content domain scores in 2011 .................................................................................................................................. 48
Performance on the TIMSS international benchmarks ............................................................................................... 50
Average scores of male and female students ........................................................................................................... 56
Performance within the United States ......................................................................................................................... 58
Average scores of students of different races and ethnicities ............................................................................ 58
Average scores of students attending public schools of various poverty levels ............................................... 59
TIMSS 2011 results for Alabama ............................................................................................................................ 60
TIMSS 2011 results for California ............................................................................................................................ 61
TIMSS 2011 results for Colorado ............................................................................................................................ 62
TIMSS 2011 results for Connecticut ....................................................................................................................... 63
TIMSS 2011 results for Florida ................................................................................................................................. 64
TIMSS 2011 results for Indiana ............................................................................................................................... 66
TIMSS 2011 results for Massachusetts ................................................................................................................... 67
TIMSS 2011 results for Minnesota ........................................................................................................................... 68
TIMSS 2011 results for North Carolina ................................................................................................................... 69
References ................................................................................................................................................................. 71
Appendix A: Technical Notes ...................................................................................................................................A-1
Appendix B: Example Items ...................................................................................................................................... B-1
Appendix C: TIMSS-NAEP Comparison .....................................................................................................................C-1
Appendix D: Online Resources and Publications ....................................................................................................D-1
Appendix E: Standard Error Tables (ONLINE ONLY)
ix
HIGHLIGHTS FROM TIMSS 2011 CONTENTS
List of Tables Page
Table 1. Participation in the TIMSS assessment, by education system: 1995, 1999, 2003, 2007, and 2011 ................... 2
Table 2. Percentage of TIMSS mathematics and science assessment score points at grade 4 and 8 devoted to content and cognitive domains: 2011 ............................................................................................................... 5
Table 3. Average mathematics scores of 4th-grade students, by education system: 2011 ........................................ 10
Table 4. Average mathematics scores of 8th-grade students, by education system: 2011 ........................................ 11
Table 5. Average mathematics content domain scores of 4th-grade students, by education system: 2011 ........... 17
Table 6. Average mathematics content domain scores of 8th-grade students, by education system: 2011 ........... 18
Table 7. Description of TIMSS international mathematics benchmarks, by grade: 2011 ............................................ 19
Table 8. Average mathematics scores of 8th-grade students in Alabama public schools compared with other participating education systems: 2011 .......................................................................................... 29
Table 9. Average mathematics scores in grade 8 for selected student groups in public schools in Alabama: 2011............................................................................................................................................... 29
Table 10. Average mathematics scores of 8th-grade students in California public schools compared with other participating education systems: 2011 .......................................................................................... 30
Table 11. Average mathematics scores in grade 8 for selected student groups in public schools in California: 2011 .............................................................................................................................................. 30
Table 12. Average mathematics scores of 8th-grade students in Colorado public schools compared with other participating education systems: 2011 .......................................................................................... 31
Table 13. Average mathematics scores in grade 8 for selected student groups in public schools in Colorado: 2011 .............................................................................................................................................. 31
Table 14. Average mathematics scores of 8th-grade students in Connecticut public schools compared with other participating education systems: 2011 .......................................................................................... 32
Table 15. Average mathematics scores in grade 8 for selected student groups in public schools in Connecticut: 2011 ......................................................................................................................................... 32
Table 16. Average mathematics scores of 4th- and 8th-grade students in Florida public schools compared with other participating education systems: 2011 ....................................................................... 33
Table 17. Average mathematics scores in grade 4 and 8 for selected student groups in public schools in Florida: 2011 ................................................................................................................................................... 34
Table 18. Average mathematics scores of 8th-grade students in Indiana public schools compared with other participating education systems: 2011 .......................................................................................... 35
Table 19. Average mathematics scores in grade 8 for selected student groups in public schools in Indiana: 2011 ................................................................................................................................................. 35
Table 20. Average mathematics scores of 8th-grade students in Massachusetts public schools compared with other participating education systems: 2011 ....................................................................... 36
Table 21. Average mathematics scores in grade 8 for selected student groups in public schools in Massachusetts: 2011 ..................................................................................................................................... 36
Table 22. Average mathematics scores of 8th-grade students in Minnesota public schools compared with other participating education systems: 2011 .......................................................................................... 37
x
APPENDIX B HIGHLIGHTS FROM TIMSS 2011APPENDIX C HIGHLIGHTS FROM TIMSS 2011HIGHLIGHTS FROM TIMSS 2011 CONTENTS
List of Tables — Continued
Page
Table 23. Average mathematics scores in grade 8 for selected student groups in public schools in Minnesota: 2011 ............................................................................................................................................. 37
Table 24. Average mathematics scores of 4th- and 8th-grade students in North Carolina public schools compared with other participating education systems: 2011 .......................................................... 38
Table 25. Average mathematics scores in grade 4 and 8 for selected student groups in public schools in North Carolina: 2011 ........................................................................................................ 39
Table 26. Average science scores of 4th-grade students, by education system: 2011 ................................................. 42
Table 27. Average science scores of 8th-grade students, by education system: 2011 ................................................. 43
Table 28. Average science content domain scores of 4th-grade students, by education system: 2011..................... 48
Table 29. Average science content domain scores of 8th-grade students, by education system: 2011..................... 49
Table 30. Description of TIMSS international science benchmarks, by grade: 2011 ..................................................... 51
Table 31. Average science scores of 8th-grade students in Alabama public schools compared with other participating education systems: 2011 .......................................................................................... 60
Table 32. Average science scores in grade 8 for selected student groups in public schools in Alabama: 2011 .............................................................................................................................................. 60
Table 33. Average science scores of 8th-grade students in California public schools compared with other participating education systems: 2011 .......................................................................................... 61
Table 34. Average science scores in grade 8 for selected student groups in public schools in California: 2011 .............................................................................................................................................. 61
Table 35. Average science scores of 8th-grade students in Colorado public schools compared with other participating education systems: 2011 .......................................................................................... 62
Table 36. Average science scores in grade 8 for selected student groups in public schools in Colorado: 2011 .............................................................................................................................................. 62
Table 37. Average science scores of 8th-grade students in Connecticut public schools compared with other participating education systems: 2011 .......................................................................................... 63
Table 38. Average science scores in grade 8 for selected student groups in public schools in Connecticut: 2011 ......................................................................................................................................... 63
Table 39. Average science scores of 4th- and 8th-grade students in Florida public schools compared with other participating education systems: 2011 .......................................................................................... 64
Table 40. Average science scores in grade 4 and 8 for selected student groups in public schools in Florida: 2011 ................................................................................................................................................... 65
Table 41. Average science scores of 8th-grade students in Indiana public schools compared with other participating education systems: 2011 ............................................................................................................ 66
Table 42. Average science scores in grade 8 for selected student groups in public schools in Indiana: 2011 .......... 66
Table 43. Average science scores of 8th-grade students in Massachusetts public schools compared with other participating education systems: 2011 .......................................................................................... 67
Table 44. Average science scores in grade 8 for selected student groups in public schools in Massachusetts: 2011 ..................................................................................................................................... 67
xi
CONTENTS HIGHLIGHTS FROM TIMSS 2011
List of Tables — Continued
Page
Table 45. Average science scores of 8th-grade students in Minnesota public schools compared with other participating education systems: 2011 .......................................................................................... 68
Table 46. Average science scores in grade 8 for selected student groups in public schools in Minnesota: 2011 ............................................................................................................................................. 68
Table 47. Average science scores of 4th– and 8th-grade students in North Carolina public schools compared with other participating education systems: 2011 ....................................................................... 69
Table 48. Average science scores in grade 4 and 8 for selected student groups in public schools in North Carolina: 2011 ...................................................................................................................................... 70
Table A-1. Coverage of target populations, school participation rates, and student response rates, by grade and education system: 2011 ........................................................................................................... A-8
Table A-2. Total number of schools and students, by grade and education system: 2011 ........................................ A-12
Table A-3. Number and percentage distribution of new and trend mathematics and science items in the TIMSS assessment, by grade and domain: 2011 ............................................................................... A-18
Table A-4. Number of mathematics and science items in the TIMSS grade 4 and grade 8 assessments, by type and content domain: 2011 ............................................................................................................... A-19
Table A-5. Weighted response rates for unimputed variables for TIMSS, by grade: 2011 ............................................. A-25
xii
List of Figures Page
Figure 1. Change in average mathematics scores of 4th-grade students, by education system: 2007–2011 and 1995–2011 ................................................................................................................................ 12
Figure 2. Change in average mathematics scores of 8th-grade students, by education system: 2007–2011 and 1995–2011 ................................................................................................................................ 14
Figure 3. Percentage of 4th-grade students reaching the TIMSS international benchmarks in mathematics, by education system: 2011 .................................................................................................. 20
Figure 4. Percentage of 8th-grade students reaching the TIMSS international benchmarks in mathematics, by education system: 2011 ................................................................................................... 22
Figure 5. Difference in average mathematics scores of 4th-grade students, by sex and education system: 2011 ................................................................................................................. 25
Figure 6. Difference in average mathematics scores of 8th-grade students, by sex and education system: 2011 ................................................................................................................ 26
Figure 7. Average mathematics scores of U.S. 4th- and 8th-grade students, by race/ethnicity: 2011 ........................ 27
Figure 8. Average mathematics scores of U.S. 4th- and 8th-grade students, by percentage of public school students eligible for free or reduced-price lunch: 2011 ...................................................... 28
Figure 9. Change in average science scores of 4th-grade students, by education system: 2007–2011 and 1995–2011 ................................................................................................................................ 44
Figure 10. Change in average science scores of 8th-grade students, by education system: 2007–2011 and 1995–2011 ................................................................................................................................ 46
Figure 11. Percentage of 4th-grade students reaching the TIMSS international benchmarks in science, by education system: 2011 ............................................................................................................ 52
Figure 12. Percentage of 8th-grade students reaching the TIMSS international benchmarks in science, by education system: 2011............................................................................................................. 54
Figure 13. Difference in average science scores of 4th-grade students, by sex and education system: 2011 ........... 56
Figure 14. Difference in average science scores of 8th-grade students, by sex and education system: 2011 ........... 57
Figure 15. Average science scores of U.S. 4th- and 8th-grade students, by race/ethnicity: 2011 ................................. 58
Figure 16. Average science scores of U.S. 4th- and 8th-grade students, by percentage of public school students eligible for free or reduced-price lunch: 2011 ....................................................... 59
xiii
List of Exhibits Page
Exhibit B-1. Sample TIMSS 2011 mathematics items, by grade level, international benchmark level, content domain, cognitive domain, and item response type ...................................................................B-1
Exhibit B-2. Sample TIMSS 2011 science items, by grade level, international benchmark level, content domain, cognitive domain, and item response type ...................................................................B-1
Exhibit B-3. Example 4th-grade mathematics item: 2011 Favorite colors of Darin's friends ..................................................................................................................B-2
Exhibit B-4. Example 4th-grade mathematics item: 2011 Which dotted line is a line of symmetry?.....................................................................................................B-3
Exhibit B-5. Example 4th-grade mathematics item: 2011 Distance between towns using map...........................................................................................................B-4
Exhibit B-6. Example 4th-grade mathematics item: 2011 Recipe for 3 people ......................................................................................................................................B-5
Exhibit B-7. Example 8th-grade mathematics item: 2011 Add 42.65 to 5.748 ........................................................................................................................................B-6
Exhibit B-8. Example 8th-grade mathematics item: 2011 Next term in the pattern ...............................................................................................................................B-7
Exhibit B-9. Example 8th-grade mathematics item: 2011 Probability that the marble is red .................................................................................................................B-8
Exhibit B-10. Example 8th-grade mathematics item: 2011 Degrees minute hand of clock turns ...........................................................................................................B-9
Exhibit B-11. Example 4th-grade science item: 2011 Birds/bats/butterflies share ........................................................................................................................B-10
Exhibit B-12. Example 4th-grade science item: 2011 Temperature of ice, steam, water ...............................................................................................................B-11
Exhibit B-13. Example 4th-grade science item: 2011 Better way to travel around town ...............................................................................................................B-12
Exhibit B-14. Example 4th-grade science item: 2011 Disadvantage to farming by a river ...........................................................................................................B-13
Exhibit B-15. Example 8th-grade science item: 2011 Which rod causes the bulb to light?..........................................................................................................B-14
Exhibit B-16. Example 8th-grade science item: 2011 Cells that destroy bacteria .........................................................................................................................B-15
Exhibit B-17. Example 8th-grade science item: 2011 Volcanic eruption effects ...........................................................................................................................B-16
Exhibit B-18. Example 8th-grade science item: 2011 Water wheel: Faster rotation .......................................................................................................................B-17
HIGHLIGHTS FROM TIMSS 2011 CONTENTS

Page intentionally left blank
1
HIGHLIGHTS FROM TIMSS 2011 INTRODUCTION
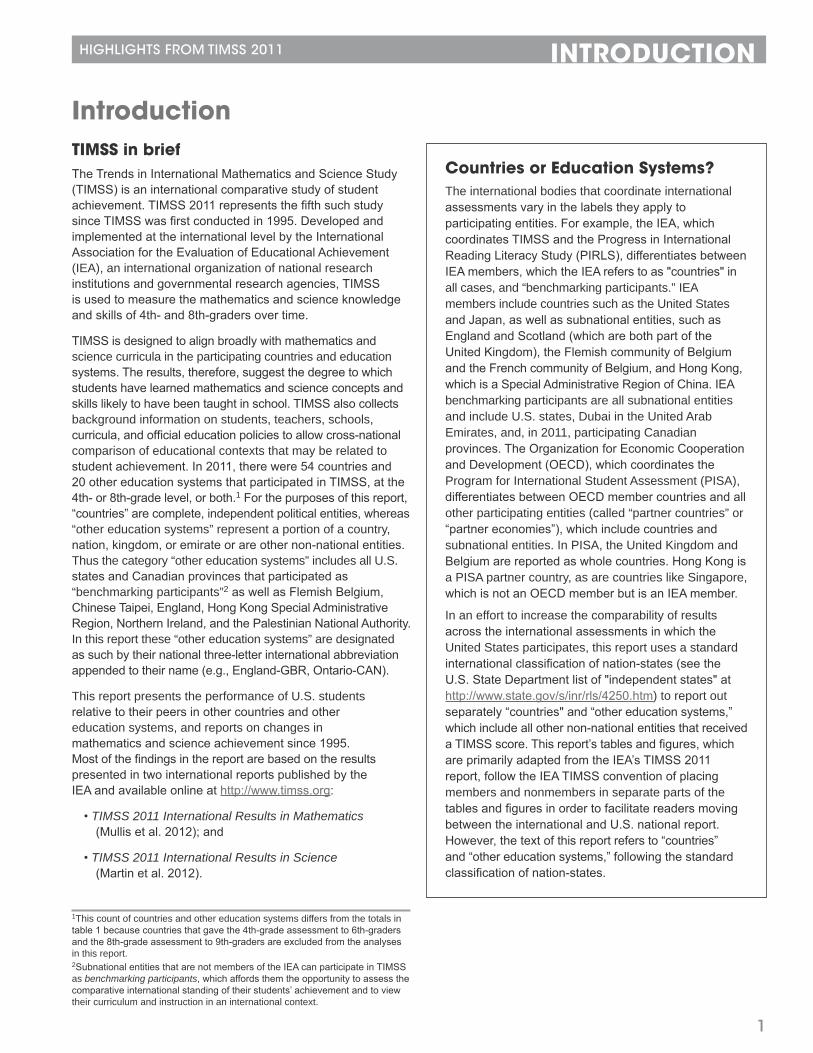
IntroductionTIMSS in briefThe Trends in International Mathematics and Science Study (TIMSS) is an international comparative study of student achievement. TIMSS 2011 represents the fifth such study since TIMSS was first conducted in 1995. Developed and implemented at the international level by the International Association for the Evaluation of Educational Achievement (IEA), an international organization of national research institutions and governmental research agencies, TIMSS is used to measure the mathematics and science knowledge and skills of 4th- and 8th-graders over time.
TIMSS is designed to align broadly with mathematics and science curricula in the participating countries and education systems. The results, therefore, suggest the degree to which students have learned mathematics and science concepts and skills likely to have been taught in school. TIMSS also collects background information on students, teachers, schools, curricula, and official education policies to allow cross-national comparison of educational contexts that may be related to student achievement. In 2011, there were 54 countries and 20 other education systems that participated in TIMSS, at the 4th- or 8th-grade level, or both.1 For the purposes of this report, “countries” are complete, independent political entities, whereas “other education systems” represent a portion of a country, nation, kingdom, or emirate or are other non-national entities. Thus the category “other education systems” includes all U.S. states and Canadian provinces that participated as “benchmarking participants”2 as well as Flemish Belgium, Chinese Taipei, England, Hong Kong Special Administrative Region, Northern Ireland, and the Palestinian National Authority. In this report these “other education systems” are designated as such by their national three-letter international abbreviation appended to their name (e.g., England-GBR, Ontario-CAN).
This report presents the performance of U.S. students relative to their peers in other countries and other education systems, and reports on changes in mathematics and science achievement since 1995. Most of the findings in the report are based on the results presented in two international reports published by the IEA and available online at http://www.timss.org:
• TIMSS 2011 International Results in Mathematics (Mullis et al. 2012); and
• TIMSS 2011 International Results in Science (Martin et al. 2012).
1This count of countries and other education systems differs from the totals in table 1 because countries that gave the 4th-grade assessment to 6th-graders and the 8th-grade assessment to 9th-graders are excluded from the analyses in this report.2Subnational entities that are not members of the IEA can participate in TIMSS as benchmarking participants, which affords them the opportunity to assess the comparative international standing of their students’ achievement and to view their curriculum and instruction in an international context.
Countries or Education Systems?The international bodies that coordinate international assessments vary in the labels they apply to participating entities. For example, the IEA, which coordinates TIMSS and the Progress in International Reading Literacy Study (PIRLS), differentiates between IEA members, which the IEA refers to as "countries" in all cases, and “benchmarking participants.” IEA members include countries such as the United States and Japan, as well as subnational entities, such as England and Scotland (which are both part of the United Kingdom), the Flemish community of Belgium and the French community of Belgium, and Hong Kong, which is a Special Administrative Region of China. IEA benchmarking participants are all subnational entities and include U.S. states, Dubai in the United Arab Emirates, and, in 2011, participating Canadian provinces. The Organization for Economic Cooperation and Development (OECD), which coordinates the Program for International Student Assessment (PISA), differentiates between OECD member countries and all other participating entities (called “partner countries” or “partner economies”), which include countries and subnational entities. In PISA, the United Kingdom and Belgium are reported as whole countries. Hong Kong is a PISA partner country, as are countries like Singapore, which is not an OECD member but is an IEA member.
In an effort to increase the comparability of results across the international assessments in which the United States participates, this report uses a standard international classification of nation-states (see the U.S. State Department list of "independent states" at http://www.state.gov/s/inr/rls/4250.htm) to report out separately “countries" and “other education systems,” which include all other non-national entities that received a TIMSS score. This report’s tables and figures, which are primarily adapted from the IEA’s TIMSS 2011 report, follow the IEA TIMSS convention of placing members and nonmembers in separate parts of the tables and figures in order to facilitate readers moving between the international and U.S. national report. However, the text of this report refers to “countries” and “other education systems,” following the standard classification of nation-states.
2
APPENDIX B HIGHLIGHTS FROM TIMSS 2011INTRODUCTION HIGHLIGHTS FROM TIMSS 2011
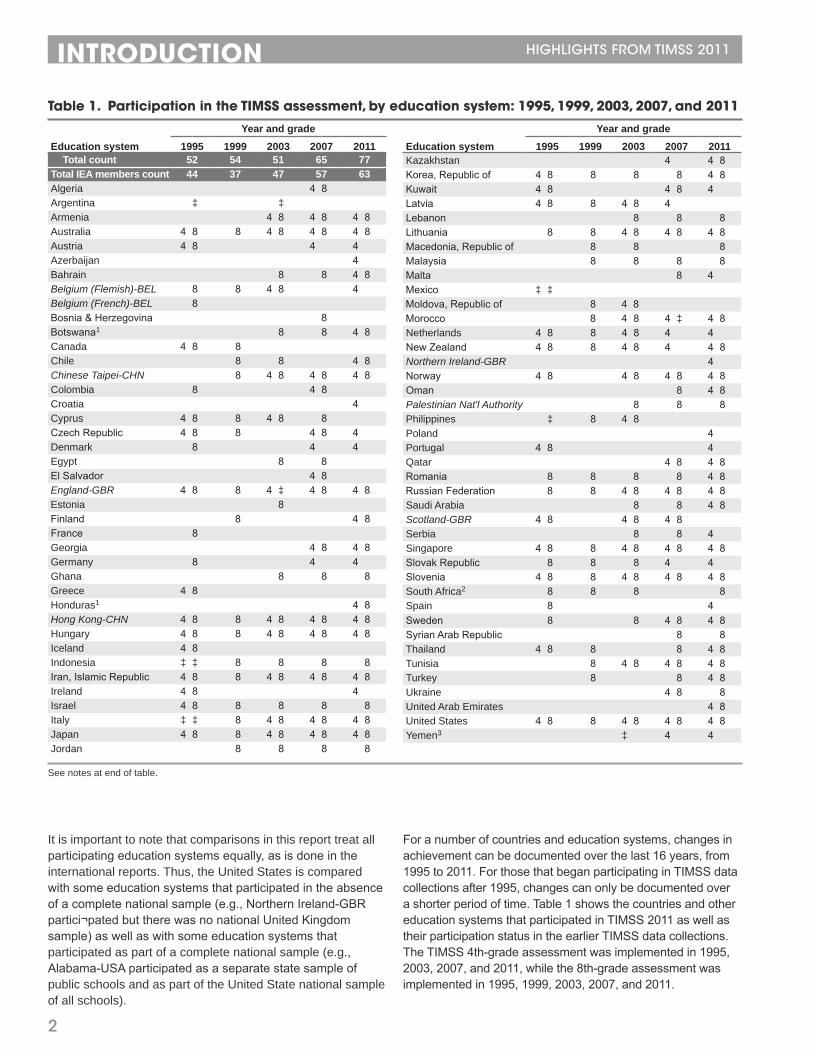
Table 1. Participation in the TIMSS assessment, by education system: 1995, 1999, 2003, 2007, and 2011
Year and gradeEducation system 1995 1999 2003 2007 2011
Total count 52 54 51 65 77Total IEA members count 44 37 47 57 63Algeria 4 8 Argentina ‡ ‡ Armenia 4 8 4 8 4 8Australia 4 8 8 4 8 4 8 4 8Austria 4 8 4 4 Azerbaijan 4 Bahrain 8 8 4 8Belgium (Flemish)-BEL 8 8 4 8 4 Belgium (French)-BEL 8 Bosnia & Herzegovina 8 Botswana1 8 8 4 8Canada 4 8 8 Chile 8 8 4 8Chinese Taipei-CHN 8 4 8 4 8 4 8Colombia 8 4 8 Croatia 4 Cyprus 4 8 8 4 8 8 Czech Republic 4 8 8 4 8 4 Denmark 8 4 4 Egypt 8 8 El Salvador 4 8 England-GBR 4 8 8 4 ‡ 4 8 4 8Estonia 8 Finland 8 4 8France 8 Georgia 4 8 4 8Germany 8 4 4 Ghana 8 8 8Greece 4 8 Honduras1 4 8Hong Kong-CHN 4 8 8 4 8 4 8 4 8Hungary 4 8 8 4 8 4 8 4 8Iceland 4 8 Indonesia ‡ ‡ 8 8 8 8Iran, Islamic Republic 4 8 8 4 8 4 8 4 8Ireland 4 8 4 Israel 4 8 8 8 8 8Italy ‡ ‡ 8 4 8 4 8 4 8Japan 4 8 8 4 8 4 8 4 8Jordan 8 8 8 8
Year and gradeEducation system 1995 1999 2003 2007 2011Kazakhstan 4 4 8Korea, Republic of 4 8 8 8 8 4 8Kuwait 4 8 4 8 4 Latvia 4 8 8 4 8 4 Lebanon 8 8 8Lithuania 8 8 4 8 4 8 4 8Macedonia, Republic of 8 8 8Malaysia 8 8 8 8Malta 8 4 Mexico ‡ ‡ Moldova, Republic of 8 4 8 Morocco 8 4 8 4 ‡ 4 8Netherlands 4 8 8 4 8 4 4 New Zealand 4 8 8 4 8 4 4 8Northern Ireland-GBR 4 Norway 4 8 4 8 4 8 4 8Oman 8 4 8Palestinian Nat'l Authority 8 8 8Philippines ‡ 8 4 8 Poland 4Portugal 4 8 4 Qatar 4 8 4 8Romania 8 8 8 8 4 8Russian Federation 8 8 4 8 4 8 4 8Saudi Arabia 8 8 4 8Scotland-GBR 4 8 4 8 4 8 Serbia 8 8 4 Singapore 4 8 8 4 8 4 8 4 8Slovak Republic 8 8 8 4 4 Slovenia 4 8 8 4 8 4 8 4 8South Africa2 8 8 8 8Spain 8 4 Sweden 8 8 4 8 4 8Syrian Arab Republic 8 8Thailand 4 8 8 8 4 8Tunisia 8 4 8 4 8 4 8Turkey 8 8 4 8Ukraine 4 8 8United Arab Emirates 4 8United States 4 8 8 4 8 4 8 4 8Yemen3 ‡ 4 4
See notes at end of table.
It is important to note that comparisons in this report treat all participating education systems equally, as is done in the international reports. Thus, the United States is compared with some education systems that participated in the absence of a complete national sample (e.g., Northern Ireland-GBR partici¬pated but there was no national United Kingdom sample) as well as with some education systems that participated as part of a complete national sample (e.g., Alabama-USA participated as a separate state sample of public schools and as part of the United State national sample of all schools).
For a number of countries and education systems, changes in achievement can be documented over the last 16 years, from 1995 to 2011. For those that began participating in TIMSS data collections after 1995, changes can only be documented over a shorter period of time. Table 1 shows the countries and other education systems that participated in TIMSS 2011 as well as their participation status in the earlier TIMSS data collections. The TIMSS 4th-grade assessment was implemented in 1995, 2003, 2007, and 2011, while the 8th-grade assessment was implemented in 1995, 1999, 2003, 2007, and 2011.

3
HIGHLIGHTS FROM TIMSS 2011 INTRODUCTION
Table 1. Participation in the TIMSS assessment, by education system: 1995, 1999, 2003, 2007, and 2011 —Continued
Benchmarking education systemsYear and grade
Education system 1995 1999 2003 2007 2011Total benchmarking 8 17 4 8 14Abu Dhabi-UAE 4 8Alabama-USA 8Alberta-CAN 4 8 8 4 4 8Basque Country-ESP 8 8 British Columbia-CAN 8 4 8 California-USA 8Colorado-USA 4 8Connecticut-USA 8 8Dubai-UAE 4 8 4 8Florida-USA 4 8Idaho-USA 8 Illinois-USA 8 8
Benchmarking education systemsYear and grade
Education system 1995 1999 2003 2007 2011Indiana-USA 8 4 8 8Maryland-USA 8 Massachusetts-USA 8 4 8 8Michigan-USA 8 Minnesota-USA 4 8 4 8 8Missouri-USA 8 8 North Carolina-USA 8 4 8Ontario-CAN 4 8 8 4 8 4 8 4 8Oregon-USA 8 8 Pennsylvania-USA 8 Quebec-CAN 4 8 8 4 8 4 8 4 8South Carolina-USA 8 Texas-USA 8
‡ Participated in assessment but results not reported.1Administered the TIMSS 4th-grade assessment to 6th-grade students and the 8th-grade assessment to 9th-grade students in 2011.2Administered the TIMSS 8th-grade assessment to 9th-grade students in 2011.3Administered the TIMSS 4th-grade assessment to a national sample of 4th-grade students and a national sample of 6th-grade students in 2011.NOTE: Italics indicates participants identified and counted in this report as an education system and not as a separate country. The number in the table indicates the grade level of the assessment administered. TIMSS did not assess grade 4 in 1999. Only education systems that completed the necessary steps for their data to meet TIMSS standards and be eligible to appear in the reports from the International Study Center are listed. Unless otherwise noted, education systems sampled students enrolled in the grade corresponding, respectively, to the 4th and 8th year of formal schooling, counting the International Standard Classification of Education (ISCED) Level 1 as the first year of formal schooling, providing that the mean age at the time of testing was, respectively, at least 9.5 and 13.5 years. In the United States and most other countries this corresponds, respectively, to grade 4 and grade 8. Benchmarking education systems are subnational entities that are not members of the IEA but chose to participate in TIMSS to be able to compare themselves internationally.SOURCE: International Association for the Evaluation of Educational Achievement (IEA), Trends in International Mathematics and Science Study (TIMSS), 1995, 1999, 2003, 2007, and 2011.
This report describes additional details about the achievement of U.S. students that are not available in the international reports, such as the achievement of students of different racial and ethnic and socioeconomic backgrounds. Results are presented in tables, figures, and text summaries of the tables and figures. In the interest of brevity, in most cases, the text reports only the names of countries and other education systems (including U.S. states) scoring higher than or not measurably different from the United States (not those scoring lower than the United States). In addition, because all TIMSS participants are treated equally, comparisons are made throughout this report between the United States (national sample) and the U.S. states that participated in TIMSS 2011 not only as part of the U.S. national sample of public and private schools but also individually with state-level public school samples. Summaries for each of these U.S. states are included in the section, “Performance within the United States.”
Design and administration of TIMSSTIMSS 2011 is sponsored by the IEA and carried out under a contract with the TIMSS & PIRLS International Study Center at Boston College.3 The National Center for Education
3The International Study Center takes its name from the two main IEA studies it coordinates: the Trends in International Mathematics and Science Study (TIMSS) and the Progress in International Reading Literacy Study (PIRLS).
Statistics (NCES), in the Institute of Education Sciences at the U.S. Department of Education, is responsible for the implementation of TIMSS in the United States. Data collection in the United States was carried out under contract to Westat and its subcontractor, Pearson Educational Measurement.
Participating countries and education systems administered TIMSS to a probability sample of 4th- and 8th-grade students and schools, based on standardized definitions. TIMSS required participating countries and other education systems to draw samples of students who were nearing the end of their fourth or eighth year of formal schooling, counting from the first year of the International Standard Classification of Education (ISCED) Level 1.4 In most education systems, including the United States, these students were in the 4th and 8th grades. Details on the average age at the time of testing in each education system are included in appendix A.
In the United States, one sample was drawn to represent the nation at grade 4 and another at grade 8. In addition to these two national samples, several state public school samples
4The ISCED was developed by the United Nations Educational, Scientific, and Cultural Organization (UNESCO) to assist countries in providing comparable, cross-national data. ISCED Level 1 is termed primary schooling, and in the United States is equivalent to the first through sixth grades (Matheson et al. 1996).
4
INTRODUCTION HIGHLIGHTS FROM TIMSS 2011
were also drawn at both grades in order to benchmark those states’ student performance internationally. Separate state public school samples were drawn, at grade 4, for Florida and North Carolina and, at grade 8, for Alabama, California, Colorado, Connecticut, Florida, Indiana, Massachusetts, Minnesota, and North Carolina. Some of these states chose to participate as benchmarking participants in order to compare their performance internationally, and others were invited to participate in TIMSS by the National Assessment of Educational Progress (NAEP), which is conducting a study to link TIMSS and NAEP (as explained in appendix A). The states invited to participate were selected based on state enrollment size and willingness to participate, as well as on their general NAEP performance (above or below the national average on NAEP), their previous experience in benchmarking to TIMSS, and their regional distribution.
In the United States, TIMSS was administered between April and June 2011. The U.S. national sample included both public and private schools, randomly selected and weighted to be representative of the nation at grade 4 and at grade 8.5 In total, the U.S. national sample consisted of 369 schools and 12,569 students at grade 4, and 501 schools and 10,477 students at grade 8. (For the participation rates for all the U.S. state samples, see table A-1 in appendix A.) The weighted school response rate for the United States was 79 percent at grade 4 before the use of substitute schools (schools substituted for originally sampled schools that refused to participate) and 84 percent with the inclusion of substitute schools.6 At grade 8, the weighted school response rate before the use of substitute schools as well as with the inclusion of substitute schools was 87 percent. The weighted student response rate at grade 4 was 95 percent and at grade 8 was 94 percent. Student response rates are based on a combined total of students from both sampled and substitute schools. (For the response rates for each of the U.S. states that participated in TIMSS, see table A-1 in appendix A.) Detailed information on sampling, administration, response rates, and other technical issues are in appendix A.
5The sample frame for public schools in the United States was based on the 2011 National Assessment of Educational Progress (NAEP) sampling frame. The 2011 NAEP sampling frame was based on the 2007–08 Common Core of Data (CCD). The data for private schools are from the 2007–08 Private School Universe Survey (PSS). Any school containing at least one grade 4 or one grade 8 class was included in the school sampling frame. For more information about the NAEP sampling frame, see http://nces.ed.gov/nationsreportcard/tdw/sample_design/. 6Two kinds of response rates are reported here in the interests of comparability with the TIMSS international reports, which report response rates before and after “replacement.” However, NCES standards advise that substitute schools should not be included in the calculation of response rates (Statistical Standard 1-3-8; National Center for Education Statistics 2002). Thus, response rates calculated before the use of substitute schools (“before replacement”) are consistent with this standard, while response rates calculated with the inclusion of substitute schools (“after replacement”) are not consistent with NCES standards.
The mathematics assessmentThe TIMSS mathematics assessment is organized around two dimensions: (1) a content dimension specifying the subject matter to be assessed and (2) a cognitive dimension specifying the cognitive or thinking processes to be assessed. At grade 4, TIMSS assesses student knowledge in three content domains: number, geometric shapes and measures, and data display. At grade 8, TIMSS assesses student knowledge in four content domains: number, algebra, geometry, and data and chance. At both grades (and across all content domains), TIMSS assesses students’ mathematical thinking in three cognitive domains: knowing, applying, and reasoning. Example items from the TIMSS mathematics assessment are included in appendix B (see items B-1 through B-10).
The proportion of item score points devoted to a content domain and, therefore, the contribution of the content domain to the overall mathematics scale score differ somewhat across grades (as shown in table 2). For example, in 2011 at grade 4, one-half or 50 percent of the TIMSS mathematics assessment focused on the number content domain, while the analogous percentage at grade 8 was 29 percent. The proportion of items devoted to each cognitive domain was similar across grades.
The science assessmentSimilarly, the TIMSS science assessment is organized around two dimensions: (1) a content dimension specifying the subject matter to be assessed and (2) a cognitive dimension specifying the cognitive or thinking processes to be assessed. At grade 4, TIMSS assesses student knowledge in three content domains: life science, physical science, and Earth science. At grade 8, TIMSS assesses student knowledge in four content domains: biology, chemistry, physics, and Earth science. At both grades (and across all content domains), TIMSS assesses students’ scientific thinking in three cognitive domains: knowing, applying, and reasoning. Example items from the TIMSS science assessment are included in appendix B (see items B-11 through B-18).
The proportion of item score points devoted to a content domain and, therefore, the contribution of the content domain to the overall science scale score differ somewhat across grades (as shown in table 2). For example, in 2011 at grade 4, some 21 percent of the TIMSS science assessment focused on the Earth science domain, while the analogous percentage at grade 8 was 18 percent. The proportion of items also differed slightly across grades. For example, 41 percent of the TIMSS science assessment at grade 4 focused on the knowing cognitive domain, whereas at grade 8 it was 32 percent.
For more detailed informationIn both the mathematics and science assessments, items vary in terms of difficulty and the form of knowledge and skills addressed; they also differ across grade levels to reflect the nature, difficulty, and emphasis of the subject matter

5
HIGHLIGHTS FROM TIMSS 2011 INTRODUCTION
encountered in school at each grade. For more detailed descriptions of the range of content and cognitive domains assessed in TIMSS, see the TIMSS 2011 Assessment Frameworks (Mullis et al. 2009). The development and validation of the mathematics cognitive domains is detailed in IEA’s TIMSS 2003 International Report on Achievement in the Mathematics Cognitive Domains: Findings From a Developmental Project (Mullis, Martin, and Foy 2005).
Reporting TIMSS resultsTIMSS achievement results are reported on a scale from 0 to 1,000, with a TIMSS scale average of 500 and standard deviation of 100. TIMSS provides an overall mathematics scale score and an overall science scale score as well as content and cognitive domain scores for each subject at each grade level. The scaling of data is conducted separately for each subject and grade. Data are also scaled separately for each of the content and cognitive domains.
Table 2. Percentage of TIMSS mathematics and science assessment score points at grade 4 and 8 devoted to content and cognitive domains: 2011
Mathematics content and cognitive domains
Grade 4
Content domainsPercent of
assessmentNumber 50Geometric shapes and measures 35Data display 15
Cognitive domainsPercent of
assessmentKnowing 39Applying 41Reasoning 20
Grade 8
Content domainsPercent of
assessmentNumber 29Algebra 33Geometry 19Data and chance 19
Cognitive domainsPercent of
assessmentKnowing 36Applying 39Reasoning 25
Science content and cognitive domains
Grade 4
Content domainsPercent of
assessmentLife science 45Physical science 35Earth science 21
Cognitive domainsPercent of
assessmentKnowing 41Applying 41Reasoning 18
Grade 8
Content domainsPercent of
assessmentBiology 37Chemistry 20Physics 25Earth science 18
Cognitive domainsPercent of
assessmentKnowing 32Applying 44Reasoning 24
NOTE: The percentages in this table are based on the number of score points and not the number of items. Some constructed-response items are worth more than one score point. For the corresponding percentages based on the number of items, see table A-3 in appendix A. The content domains define the specific mathematics and science subject matter covered by the assessment, and the cognitive domains define the sets of thinking processes students are likely to use as they engage with the respective subject’s content. Each of the subject content domains has several topic areas. Each topic area is presented as a list of objectives covered in a majority of participating education systems, at either grade 4 or 8. However, the cognitive domains of mathematics and science are defined by the same three sets of expected processing behaviors—knowing, applying, and reasoning. Detail may not sum to totals because of rounding.SOURCE: International Association for the Evaluation of Educational Achievement (IEA), Trends in International Mathematics and Science Study (TIMSS), 2011.
6
INTRODUCTION HIGHLIGHTS FROM TIMSS 2011
Although each scale was created to have a mean of 500 and a standard deviation of 100, the subject matter and the level of difficulty of items necessarily differ between subject, grade, and domains. Therefore, direct comparisons between scores across subjects, grades, and different domain types should not be made. (For details on why such comparisons are not warranted, see “Weighting, scaling, and plausible values” in appendix A.)
However, scores within a subject, grade, and domain (e.g., grade 4 mathematics content domain) are comparable over time. The TIMSS scale was established originally to have a mean of 500 set as the average of all of the countries and education systems that participated in TIMSS 1995 at the 4th and 8th grades. Successive TIMSS assessments since then (TIMSS 1999, 2003, 2007, and 2011) have scaled the achievement data so that scores are equivalent from assessment to assessment.7 Thus, for example, a score of 500 in 8th-grade mathematics in 2011 is equivalent to a score of 500 in 8th-grade mathematics in 2007, in 2003, in 1999, and in 1995. The same example would be true for 4th-grade mathematics scores as well as science scores at either grade. (For more information on how the TIMSS scale was created, see “Weighting, scaling, and plausible values” in appendix A.)
In addition to scale scores, TIMSS has also developed international benchmarks for each subject and grade. The TIMSS international benchmarks provide a way to interpret the scale scores and to understand how students’ proficiency in mathematics and science varies along the TIMSS scale. The TIMSS benchmarks describe four levels of student achievement (Advanced, High, Intermediate, and Low) for each subject and grade, based on the kinds of skills and knowledge students at each score cutpoint would need to successfully answer the mathematics and science items.
The score cutpoints for the TIMSS benchmarks were set in 2003 based on the distribution of students along the TIMSS scale in previous administrations.8 More information on the development of the benchmarks and the procedures used to set the score cutpoints can be found in the TIMSS and PIRLS Methods and Procedures (Martin and Mullis 2011).
7Even though the number and composition of education systems participating in TIMSS have changed between 1995 and 2011, comparisons between the 2011 results and prior results are still possible because the achievement scores in each of the TIMSS assessments are placed on a scale which is not dependent on the list of participating countries in any particular year. A brief description of the assessment equating and scaling is presented in appendix A to this volume. A more detailed presentation can be found in the TIMSS and PIRLS Methods and Procedures (Martin and Mullis 2011). 8For the TIMSS 1995 and 1999 assessments, the TIMSS scales were anchored using percentiles (90th, 75th, 50th, and 25th percentiles) instead of score cutpoints. By TIMSS 2003, however, it was clear that, with different education systems participating in each TIMSS cycle (and potentially different achievement for education systems in each cycles), TIMSS needed a set of points to serve as benchmarks that would not change in the future, that made sense, and that were similar to the points used in 1999. For these reasons, TIMSS selected the set of four score points (400, 475, 550, and 625) with equal intervals on the mathematics and science achievement scales that have been used ever since 2003 as the international benchmark cutpoints.
All differences described in this report are statistically significant at the .05 level. No statistical adjustments to account for multiple comparisons were used. Differences that are statistically significant are discussed using comparative terms such as “higher” and “lower.” Differences that are not statistically significant are either not discussed or referred to as “not measurably different” or “not statistically significant.” In the latter case, failure to find a difference as statistically significant does not necessarily mean that there was no difference. It could be that a real difference cannot be detected by the significance test because of small sample size or imprecise measurement in the sample. If the statistical test is significant, this means that there is convincing evidence (though no guarantee) of a real difference in the population. However, it is important to remember that statistically significant results do not necessarily identify those findings that have policy significance or practical importance. Supplemental tables providing all estimates and standard errors discussed in this report are available online at http://nces.ed.gov/pubsearch/pubsinfo.asp?pubid=2013009.
All data presented in this report are used to describe relationships between variables. These data are not intended, nor can they be used, to imply causality. Student performance can be affected by a complex mix of educational and other factors that are not examined here.
Nonresponse bias in the U.S. TIMSS samplesNCES Statistical Standards require a nonresponse bias analysis if school-level response rates fall below 85 percent, as they did for the 4th-grade school sample in TIMSS 2011. As a consequence, a nonresponse bias analysis was undertaken for the 4th-grade school sample similar to that used for TIMSS 2007 (Gonzales et al. 2008).9 Nonresponse bias analyses examined whether the participation status of schools (participant/non-participant) was related to seven school characteristics: region of the country in which the school was located (Northeast, Midwest, South, West); type of community served by the school (city, suburban, town, rural); whether the school was public or private; percentage of students eligible for free or reduced-price lunch; number of students enrolled in 4th-grade; total number of students; and percentage of students from minority backgrounds. (See appendix A for a detailed description of this analysis.)
The findings indicate some potential for bias in the data arising from school control, enrollment, regional and community-type differences in participation, along with the fact that schools with higher percentages of minority students were less likely to participate. Specifically, public schools were much more
9NCES standards require a nonresponse bias analysis if school-level response rates fall below 85 percent, and the 4th-grade school sample in TIMSS 2011 had a school response rate of 84 percent. (Statistical Standard 2-2-2 found in National Center for Education Statistics 2002, available at: http://nces.ed.gov/statprog/2002/stdtoc.asp.) The full text of the nonresponse bias analysis conducted for TIMSS 2011 will be included in a technical report released with the U.S. national dataset.
7
HIGHLIGHTS FROM TIMSS 2011 INTRODUCTION
likely to participate than private schools, grade 4 schools in the Midwest region were more likely to participate than schools in the other regions, and rural schools were more likely to participate than schools in central cities. However, with the inclusion of substitute schools and school nonresponse adjustments applied to the weights,10 there were no measurable differences by school control, enrollment, and community type; only differences by region remained. Grade 4 schools with higher percentages of minority students were less likely to participate, but the measurable differences were small after substitution. Since TIMSS is conducted under a set of standard rules designed to facilitate international comparisons, the U.S. nonresponse bias analysis results were not used to adjust the U.S. data for this source of bias. While this may be possible at some later date, at present the variables identified above remain as potential sources of bias in the published estimates. See appendix A for additional details on the findings. The full text of the nonresponse bias analysis conducted for TIMSS 2011 will be included in the technical report released with the U.S. national dataset.
Further informationTo assist the reader in understanding how TIMSS relates to the National Assessment of Educational Progress (NAEP), the primary source of national- and state-level data on U.S. students’ mathematics and science achievement, NCES compared the form and content of the TIMSS and NAEP mathematics and science assessments. A summary of the results of this comparison is included in appendix C. Appendix D includes a list of TIMSS publications and resources published by NCES and the IEA. Standard errors for the estimates discussed in this report are available online at http://nces.ed.gov/pubsearch/pubsinfo.asp?pubid=2013009. Detailed information on TIMSS can also be found on the NCES website at http://nces.ed.gov/timss and the international TIMSS website at http://www.timss.org.
10The international weighting procedures created a nonresponse adjustment class for each explicit stratum; see the TIMSS and PIRLS Methods and Procedures (Martin and Mullis 2011) for details. In the case of the U.S. 4th-grade sample, 8 explicit strata were formed by poverty level, school control, and Census region. The procedures could not be varied for individual countries to account for any specific needs. Therefore, the U.S. nonresponse bias analyses could have no influence on the weighting procedures and were undertaken after the weighting process was complete.

Page intentionally left blank
9
HIGHLIGHTS FROM TIMSS 2011 MATHEMATICS
Mathematics Performance in the United States and Internationally
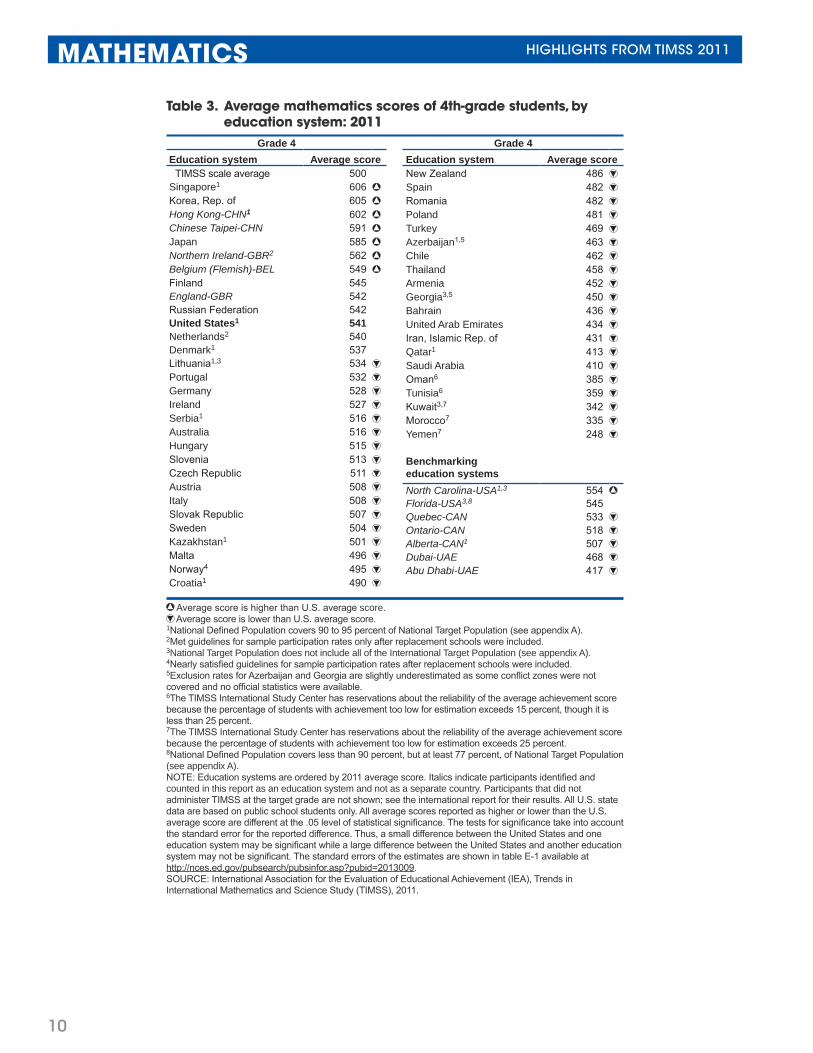
Average scores in 2011In mathematics, the U.S. national average score was 541 at grade 4 and 509 at grade 8 (tables 3 and 4). Both scores were higher than the TIMSS scale average, which is set at 500 for every administration of TIMSS at both grades.11
Among the 45 countries that participated at grade 4, the U.S. average mathematics score was among the top 8 (3 countries had higher averages and 4 had averages not measurably different from the United States). Thirty-seven countries had a lower average score than the United States.
Looking at all 57 education systems that participated at grade 4 (i.e., both countries and other education systems, including U.S. states that participated in TIMSS with individual state samples), the United States was among the top 15 education systems in average mathematics scores (8 education systems had higher averages and 6 were not measurably different). Singapore, Korea, Hong Kong-CHN, Chinese Taipei-CHN, Japan, Northern Ireland-GBR, North Carolina-USA, and Belgium (Flemish)-BEL had higher average scores than the United States; and Finland, Florida-USA, England-GBR, the Russian Federation, the Netherlands, and Denmark had average scores not measurably different from the U.S. average at grade 4. The United States outperformed 42 education systems.
11A score of 500 represents the international average of participants in the first administration of TIMSS in 1995. The TIMSS scale is the same in each administration such that a value of 500 in 2011 equals 500 in 1995.
At grade 8, among the 38 countries that participated in TIMSS, the U.S. average mathematics score was among the top 11 (4 countries had higher averages and 6 had averages not measurably different from the United States). Twenty-seven countries had lower average scores than the United States.
Looking at all 56 education systems that participated at grade 8, the United States was among the top 24 education systems in average mathematics scores (11 had higher averages and 12 were not measurably different). Korea, Singapore, Chinese Taipei-CHN, Hong Kong-CHN, Japan, Massachusetts-USA, Minnesota-USA, the Russian Federation, North Carolina-USA, Quebec-CAN, and Indiana-USA had higher average scores than the United States; and Colorado-USA, Connecticut-USA, Israel, Finland, Florida-USA, Ontario-CAN, England-GBR, Alberta-CAN, Hungary, Australia, Slovenia, and Lithuania had average scores not measurably different from the U.S. average at grade 8. The United States had a higher average mathematics score than 32 education systems.
Average score is higher than U.S. average score.
10
MATHEMATICS HIGHLIGHTS FROM TIMSS 2011
Table 3. Average mathematics scores of 4th-grade students, by education system: 2011
Grade 4Education system Average score
TIMSS scale average 500Singapore1 606Korea, Rep. of 605Hong Kong-CHN1 602Chinese Taipei-CHN 591Japan 585Northern Ireland-GBR2 562Belgium (Flemish)-BEL 549Finland 545 England-GBR 542 Russian Federation 542 United States1 541 Netherlands2 540 Denmark1 537 Lithuania1,3 534Portugal 532Germany 528Ireland 527Serbia1 516Australia 516Hungary 515Slovenia 513Czech Republic 511Austria 508Italy 508Slovak Republic 507Sweden 504Kazakhstan1 501Malta 496Norway4 495Croatia1 490
Grade 4Education system Average scoreNew Zealand 486Spain 482Romania 482Poland 481Turkey 469Azerbaijan1,5 463Chile 462Thailand 458Armenia 452Georgia3,5 450Bahrain 436United Arab Emirates 434Iran, Islamic Rep. of 431Qatar1 413Saudi Arabia 410Oman6 385Tunisia6 359Kuwait3,7 342Morocco7 335Yemen7 248
Benchmarking education systemsNorth Carolina-USA1,3 554Florida-USA3,8 545 Quebec-CAN 533Ontario-CAN 518Alberta-CAN1 507Dubai-UAE 468Abu Dhabi-UAE 417
Average score is lower than U.S. average score. 1National Defined Population covers 90 to 95 percent of National Target Population (see appendix A).2Met guidelines for sample participation rates only after replacement schools were included.3National Target Population does not include all of the International Target Population (see appendix A).4Nearly satisfied guidelines for sample participation rates after replacement schools were included.5Exclusion rates for Azerbaijan and Georgia are slightly underestimated as some conflict zones were not covered and no official statistics were available.6The TIMSS International Study Center has reservations about the reliability of the average achievement score because the percentage of students with achievement too low for estimation exceeds 15 percent, though it is less than 25 percent.7The TIMSS International Study Center has reservations about the reliability of the average achievement score because the percentage of students with achievement too low for estimation exceeds 25 percent.8National Defined Population covers less than 90 percent, but at least 77 percent, of National Target Population (see appendix A).NOTE: Education systems are ordered by 2011 average score. Italics indicate participants identified and counted in this report as an education system and not as a separate country. Participants that did not administer TIMSS at the target grade are not shown; see the international report for their results. All U.S. state data are based on public school students only. All average scores reported as higher or lower than the U.S. average score are different at the .05 level of statistical significance. The tests for significance take into account the standard error for the reported difference. Thus, a small difference between the United States and one education system may be significant while a large difference between the United States and another education system may not be significant. The standard errors of the estimates are shown in table E-1 available at http://nces.ed.gov/pubsearch/pubsinfor.asp?pubid=2013009.SOURCE: International Association for the Evaluation of Educational Achievement (IEA), Trends in International Mathematics and Science Study (TIMSS), 2011.
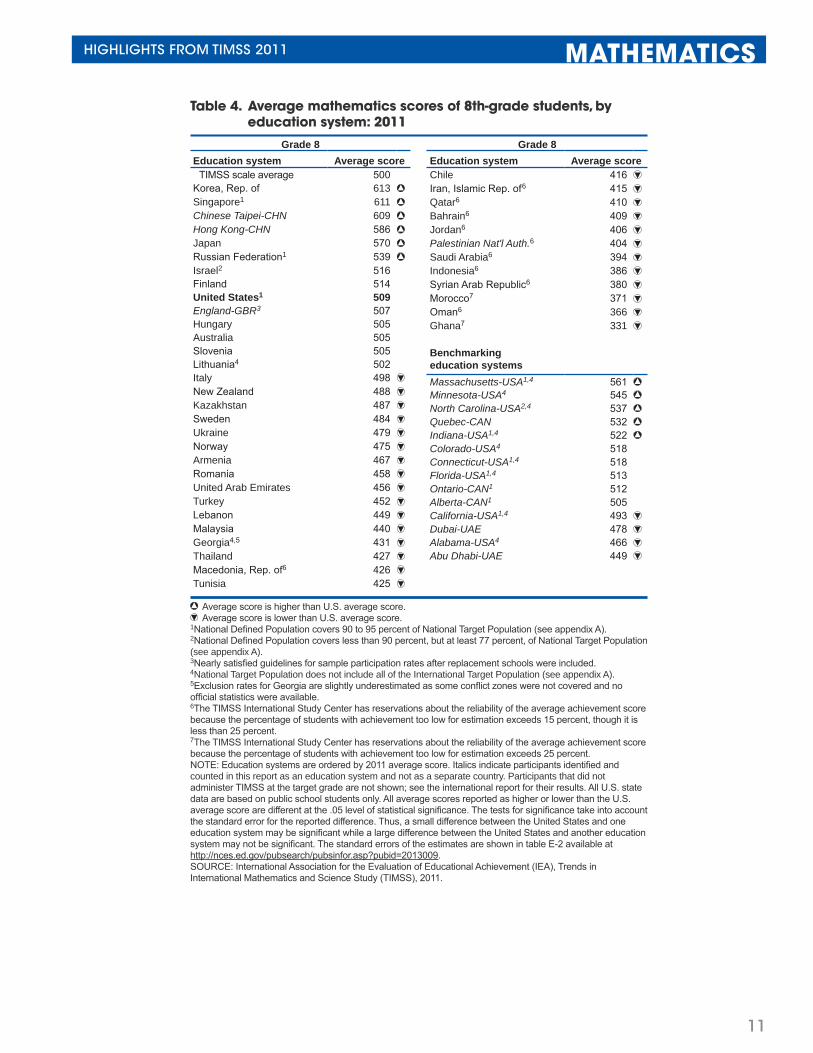
11
HIGHLIGHTS FROM TIMSS 2011 MATHEMATICS
Table 4. Average mathematics scores of 8th-grade students, by education system: 2011
Grade 8Education system Average score
TIMSS scale average 500Korea, Rep. of 613Singapore1 611Chinese Taipei-CHN 609Hong Kong-CHN 586Japan 570Russian Federation1 539Israel2 516 Finland 514 United States1 509 England-GBR3 507 Hungary 505 Australia 505 Slovenia 505 Lithuania4 502 Italy 498New Zealand 488Kazakhstan 487Sweden 484Ukraine 479Norway 475Armenia 467Romania 458United Arab Emirates 456Turkey 452Lebanon 449Malaysia 440Georgia4,5 431Thailand 427Macedonia, Rep. of6 426Tunisia 425
Grade 8Education system Average scoreChile 416Iran, Islamic Rep. of6 415Qatar6 410Bahrain6 409Jordan6 406Palestinian Nat'l Auth.6 404Saudi Arabia6 394Indonesia6 386Syrian Arab Republic6 380Morocco7 371Oman6 366Ghana7 331
Benchmarking education systemsMassachusetts-USA1,4 561Minnesota-USA4 545North Carolina-USA2,4 537Quebec-CAN 532Indiana-USA1,4 522Colorado-USA4 518 Connecticut-USA1,4 518 Florida-USA1,4 513 Ontario-CAN1 512 Alberta-CAN1 505 California-USA1,4 493Dubai-UAE 478Alabama-USA4 466Abu Dhabi-UAE 449
Average score is higher than U.S. average score. Average score is lower than U.S. average score.
1National Defined Population covers 90 to 95 percent of National Target Population (see appendix A).2National Defined Population covers less than 90 percent, but at least 77 percent, of National Target Population (see appendix A).3Nearly satisfied guidelines for sample participation rates after replacement schools were included.4National Target Population does not include all of the International Target Population (see appendix A).5Exclusion rates for Georgia are slightly underestimated as some conflict zones were not covered and no official statistics were available.6The TIMSS International Study Center has reservations about the reliability of the average achievement score because the percentage of students with achievement too low for estimation exceeds 15 percent, though it is less than 25 percent.7The TIMSS International Study Center has reservations about the reliability of the average achievement score because the percentage of students with achievement too low for estimation exceeds 25 percent.NOTE: Education systems are ordered by 2011 average score. Italics indicate participants identified and counted in this report as an education system and not as a separate country. Participants that did not administer TIMSS at the target grade are not shown; see the international report for their results. All U.S. state data are based on public school students only. All average scores reported as higher or lower than the U.S. average score are different at the .05 level of statistical significance. The tests for significance take into account the standard error for the reported difference. Thus, a small difference between the United States and one education system may be significant while a large difference between the United States and another education system may not be significant. The standard errors of the estimates are shown in table E-2 available at http://nces.ed.gov/pubsearch/pubsinfor.asp?pubid=2013009.SOURCE: International Association for the Evaluation of Educational Achievement (IEA), Trends in International Mathematics and Science Study (TIMSS), 2011.

12
MATHEMATICS HIGHLIGHTS FROM TIMSS 2011
Change in scoresSeveral education systems that participated in TIMSS 2011 also participated in the last administration of TIMSS in 2007 or in the first administration of TIMSS in 1995. Some education systems participated in both of these previous administrations. Comparing scores between previous administrations of TIMSS and the most recent administration provides perspective on change over time.12
12Several participating countries that are reported with the 2011 results in other tables in this report are excluded from these comparisons over time based on the International Study Center (ISC) review of the assessment results. Kuwait, Morocco, and Yemen participated at grade 4 in both 2007 or 1995 and 2011, but had unreliable 2011 mathematics scores. Armenia, Kazakhstan, and Qatar also participated in 2007 and 2011 at grade 4, but their 2007 mathematics scores were not comparable to their 2011 scores. Kuwait, Italy, and Thailand participated in 1995 and 2011 at both grades 4 and 8, but their 1995 mathematics scores were not comparable to their 2011 scores. Ghana and Morocco participated in 2007 and 2011 at grade 8, but their 2011 mathematics scores were unreliable. Armenia, Qatar, Saudi Arabia, and Turkey participated in 2007 and 2011 at grade 8, but their 2007 mathematics scores were not comparable to their 2011 scores. Lastly, Indonesia and Israel participated in both 1995 and 2011 at grade 8, but their 1995 mathematics scores were not comparable to their 2011 scores.
Change at grade 4 between 2007 and 2011Among the 28 education systems that participated in both the 2007 and 2011 TIMSS mathematics assessments at grade 4, the average mathematics score increased in 12 education systems, including the United States. There was no measurable change in the other 16 education systems that participated in TIMSS in both these years, and in none did average scores decrease measurably (figure 1).
The U.S. increase in average score at grade 4 between 2007 and 2011 was 12 score points (from 529 to 541). Five education systems had larger increases than the United States during this time: Tunisia (32 points), the Islamic Republic of Iran (28 points), the Czech Republic (24 points), Dubai-UAE (24 points), and Norway (22 points). Despite experiencing larger gains than the United States between the two time points, all five of these education systems had lower average scores than the United States in 2011. Thus, none of these increases changed these education systems’ standing relative to the United States between 2007 and 2011.
Figure 1. Change in average mathematics scores of 4th-grade students, by education system: 2007–2011 and 1995–2011
Grade 4Average score Change in average score1
1995 2007 2011 Education system590 599 606 Singapore2 Change from 2007 to 2011: 6. Change from 1995 to 2011: 16*
581 605 Korea, Rep. of Change from 1995 to 2011: 24*
557 607 602 Hong Kong-CHN2 Change from 2007 to 2011: -5. Change from 1995 to 2011: 45*
576 591 Chinese Taipei-CHN Change from 2007 to 2011: 15*
567 568 585 Japan Change from 2007 to 2011: 17*. Change from 1995 to 2011: 18*
484 541 542 England-GBR Change from 2007 to 2011: 1. Change from 1995 to 2011: 58*
544 542 Russian Federation Change from 2007 to 2011: -2
518 529 541 United States2 Change from 2007 to 2011: 12*. Change from 1995 to 2011: 23*
549 535 540 Netherlands3 Change from 2007 to 2011: 5. Change from 1995 to 2011: -9*
523 537 Denmark2 Change from 2007 to 2011: 14*
530 534 Lithuania2,4 Change from 2007 to 2011: 4
442 532 Portugal Change from 1995 to 2011: 90*
525 528 Germany Change from 2007 to 2011: 3
523 527 Ireland Change from 1995 to 2011: 5
495 516 516 Australia Change from 2007 to 2011: #. Change from 1995 to 2011: 21*
521 510 515 Hungary Change from 2007 to 2011: 6. Change from 1995 to 2011: -6
462 502 513 Slovenia Change from 2007 to 2011: 11*. Change from 1995 to 2011: 51*
541 486 511 Czech Republic Change from 2007 to 2011: 24*. Change from 1995 to 2011: -30*
531 505 508 Austria Change from 2007 to 2011: 3. Change from 1995 to 2011: -22*
507 508 Italy Change from 2007 to 2011: 1
496 507 Slovak Republic Change from 2007 to 2011: 11
503 504 Sweden Change from 2007 to 2011: 1
476 473 495 Norway5 Change from 2007 to 2011: 22*. Change from 1995 to 2011: 19*
469 492 486 New Zealand Change from 2007 to 2011: -6. Change from 1995 to 2011: 17*
438 450 Georgia4,6 Change from 2007 to 2011: 12*
387 402 431 Iran, Islamic Rep. of Change from 2007 to 2011: 28*. Change from 1995 to 2011: 44*
327 359 Tunisia7 Change from 2007 to 2011: 32*
See notes at end of table.
12*
18*17*
15*45*
24*16*
6
-5
21*#
4
5
5
14*
23*12*
1
-2
-9*
3
32*44*28*
19*-6 17*
22*
11
1
1
3
24*51*
90*
58*
11*6
-6
-30*-22*
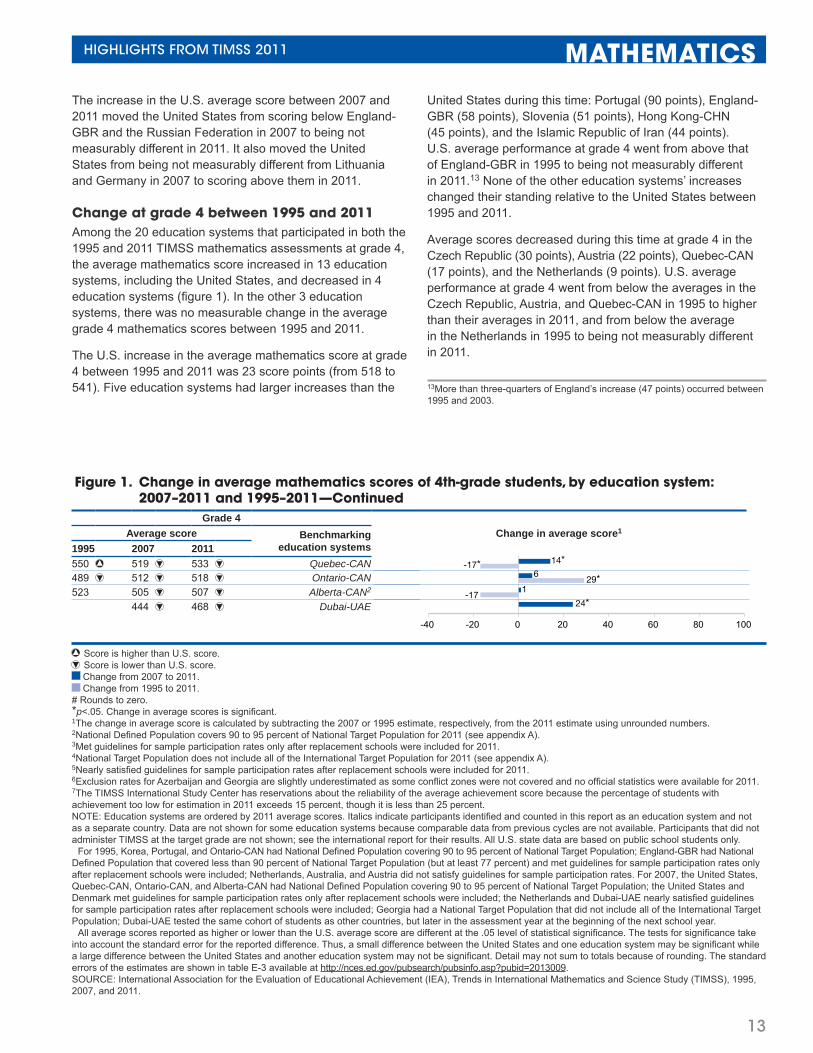
13
HIGHLIGHTS FROM TIMSS 2011 MATHEMATICS
The increase in the U.S. average score between 2007 and 2011 moved the United States from scoring below England-GBR and the Russian Federation in 2007 to being not measurably different in 2011. It also moved the United States from being not measurably different from Lithuania and Germany in 2007 to scoring above them in 2011.
Change at grade 4 between 1995 and 2011Among the 20 education systems that participated in both the 1995 and 2011 TIMSS mathematics assessments at grade 4, the average mathematics score increased in 13 education systems, including the United States, and decreased in 4 education systems (figure 1). In the other 3 education systems, there was no measurable change in the average grade 4 mathematics scores between 1995 and 2011.
The U.S. increase in the average mathematics score at grade 4 between 1995 and 2011 was 23 score points (from 518 to 541). Five education systems had larger increases than the
United States during this time: Portugal (90 points), England-GBR (58 points), Slovenia (51 points), Hong Kong-CHN (45 points), and the Islamic Republic of Iran (44 points). U.S. average performance at grade 4 went from above that of England-GBR in 1995 to being not measurably different in 2011.13 None of the other education systems’ increases changed their standing relative to the United States between 1995 and 2011.
Average scores decreased during this time at grade 4 in the Czech Republic (30 points), Austria (22 points), Quebec-CAN (17 points), and the Netherlands (9 points). U.S. average performance at grade 4 went from below the averages in the Czech Republic, Austria, and Quebec-CAN in 1995 to higher than their averages in 2011, and from below the average in the Netherlands in 1995 to being not measurably different in 2011.
13More than three-quarters of England’s increase (47 points) occurred between 1995 and 2003.
Figure 1. Change in average mathematics scores of 4th-grade students, by education system: 2007–2011 and 1995–2011—Continued
Grade 4Average score Benchmarking
education systemsChange in average score1
1995 2007 2011550 519 533 Quebec-CAN Change from 2007 to 2011: 14*. Change from 1995 to 2011: -17*
489 512 518 Ontario-CAN Change from 2007 to 2011: 6. Change from 1995 to 2011: 29*
523 505 507 Alberta-CAN2 Change from 2007 to 2011: 1. Change from 1995 to 2011: -17
444 468 Dubai-UAE Change from 2007 to 2011: 24*.
Score is higher than U.S. score. Score is lower than U.S. score. Change from 2007 to 2011. Change from 1995 to 2011.
# Rounds to zero. *p<.05. Change in average scores is significant.1The change in average score is calculated by subtracting the 2007 or 1995 estimate, respectively, from the 2011 estimate using unrounded numbers.2National Defined Population covers 90 to 95 percent of National Target Population for 2011 (see appendix A).3Met guidelines for sample participation rates only after replacement schools were included for 2011.4National Target Population does not include all of the International Target Population for 2011 (see appendix A).5Nearly satisfied guidelines for sample participation rates after replacement schools were included for 2011.6Exclusion rates for Azerbaijan and Georgia are slightly underestimated as some conflict zones were not covered and no official statistics were available for 2011.7The TIMSS International Study Center has reservations about the reliability of the average achievement score because the percentage of students with achievement too low for estimation in 2011 exceeds 15 percent, though it is less than 25 percent.NOTE: Education systems are ordered by 2011 average scores. Italics indicate participants identified and counted in this report as an education system and not as a separate country. Data are not shown for some education systems because comparable data from previous cycles are not available. Participants that did not administer TIMSS at the target grade are not shown; see the international report for their results. All U.S. state data are based on public school students only.For 1995, Korea, Portugal, and Ontario-CAN had National Defined Population covering 90 to 95 percent of National Target Population; England-GBR had National
Defined Population that covered less than 90 percent of National Target Population (but at least 77 percent) and met guidelines for sample participation rates only after replacement schools were included; Netherlands, Australia, and Austria did not satisfy guidelines for sample participation rates. For 2007, the United States, Quebec-CAN, Ontario-CAN, and Alberta-CAN had National Defined Population covering 90 to 95 percent of National Target Population; the United States and Denmark met guidelines for sample participation rates only after replacement schools were included; the Netherlands and Dubai-UAE nearly satisfied guidelines for sample participation rates after replacement schools were included; Georgia had a National Target Population that did not include all of the International Target Population; Dubai-UAE tested the same cohort of students as other countries, but later in the assessment year at the beginning of the next school year.All average scores reported as higher or lower than the U.S. average score are different at the .05 level of statistical significance. The tests for significance take
into account the standard error for the reported difference. Thus, a small difference between the United States and one education system may be significant while a large difference between the United States and another education system may not be significant. Detail may not sum to totals because of rounding. The standard errors of the estimates are shown in table E-3 available at http://nces.ed.gov/pubsearch/pubsinfo.asp?pubid=2013009.SOURCE: International Association for the Evaluation of Educational Achievement (IEA), Trends in International Mathematics and Science Study (TIMSS), 1995, 2007, and 2011.
-17
-17*
24*
14*6
129*
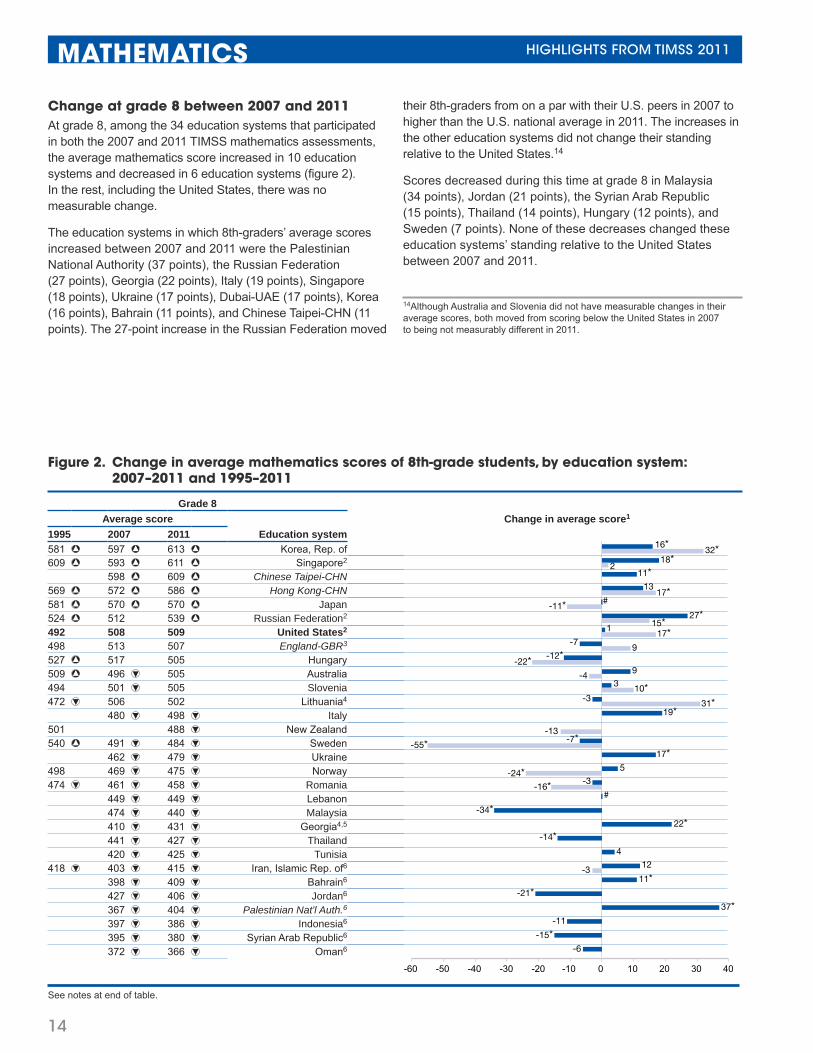
14
MATHEMATICS HIGHLIGHTS FROM TIMSS 2011
Change at grade 8 between 2007 and 2011At grade 8, among the 34 education systems that participated in both the 2007 and 2011 TIMSS mathematics assessments, the average mathematics score increased in 10 education systems and decreased in 6 education systems (figure 2). In the rest, including the United States, there was no measurable change.
The education systems in which 8th-graders’ average scores increased between 2007 and 2011 were the Palestinian National Authority (37 points), the Russian Federation (27 points), Georgia (22 points), Italy (19 points), Singapore (18 points), Ukraine (17 points), Dubai-UAE (17 points), Korea (16 points), Bahrain (11 points), and Chinese Taipei-CHN (11 points). The 27-point increase in the Russian Federation moved
their 8th-graders from on a par with their U.S. peers in 2007 to higher than the U.S. national average in 2011. The increases in the other education systems did not change their standing relative to the United States.14
Scores decreased during this time at grade 8 in Malaysia (34 points), Jordan (21 points), the Syrian Arab Republic (15 points), Thailand (14 points), Hungary (12 points), and Sweden (7 points). None of these decreases changed these education systems’ standing relative to the United States between 2007 and 2011.
14Although Australia and Slovenia did not have measurable changes in their average scores, both moved from scoring below the United States in 2007 to being not measurably different in 2011.
Figure 2. Change in average mathematics scores of 8th-grade students, by education system: 2007–2011 and 1995–2011
Grade 8Average score Change in average score1
1995 2007 2011 Education system581 597 613 Korea, Rep. of Change from 2007 to 2011: 16*. Change from 1995 to 2011: 32*
609 593 611 Singapore2 Change from 2007 to 2011: 18*. Change from 1995 to 2011: 2
598 609 Chinese Taipei-CHN Change from 2007 to 2011: 11*.
569 572 586 Hong Kong-CHN Change from 2007 to 2011: 13. Change from 1995 to 2011:17*
581 570 570 Japan Change from 2007 to 2011: #. Change from 1995 to 2011: -11*
524 512 539 Russian Federation2 Change from 2007 to 2011: 27*. Change from 1995 to 2011: 15*
492 508 509 United States2 Change from 2007 to 2011: 1. Change from 1995 to 2011: 17*
498 513 507 England-GBR3 Change from 2007 to 2011: -7. Change from 1995 to 2011: 9
527 517 505 Hungary Change from 2007 to 2011: -12*. Change from 1995 to 2011: -22*
509 496 505 Australia Change from 2007 to 2011: 9. Change from 1995 to 2011: -4
494 501 505 Slovenia Change from 2007 to 2011: 3. Change from 1995 to 2011:10*
472 506 502 Lithuania4 Change from 2007 to 2011: -3. Change from 1995 to 2011: 31*
480 498 Italy Change from 2007 to 2011: 19* .
501 488 New Zealand Change from 1995 to 2011: -13.
540 491 484 Sweden Change from 2007 to 2011:- 7*. Change from 1995 to 2011: -55*
462 479 Ukraine Change from 2007 to 2011: 17*.
498 469 475 Norway Change from 2007 to 2011: 5. Change from 1995 to 2011: -24*
474 461 458 Romania Change from 2007 to 2011: -3. Change from 1995 to 2011: -16*
449 449 Lebanon Change from 2007 to 2011: #.
474 440 Malaysia Change from 2007 to 2011: -34*.
410 431 Georgia4,5 Change from 2007 to 2011: 22*.
441 427 Thailand Change from 2007 to 2011: -14*.
420 425 Tunisia Change from 2007 to 2011: 4.
418 403 415 Iran, Islamic Rep. of6 Change from 2007 to 2011: 12. Change from 1995 to 2011: -3
398 409 Bahrain6 Change from 2007 to 2011: 11*.
427 406 Jordan6 Change from 2007 to 2011: -21*.
367 404 Palestinian Nat'l Auth.6 Change from 2007 to 2011: 37*.
397 386 Indonesia6 Change from 2007 to 2011: -11.
395 380 Syrian Arab Republic6 Change from 2007 to 2011: -15*.
372 366 Oman6 Change from 2007 to 2011: -6.
See notes at end of table.
-14*
18*32*16*
211*13
17*#
27*15*17*1
9
93 10*
19*31*
-7*-55*
-13
-3
-4
-7
-11*
-12*-22*
17*5
-24*
#
-3-16*
22*-34*
4
12
11*
37*
-3
-21*
-11
-15*-6
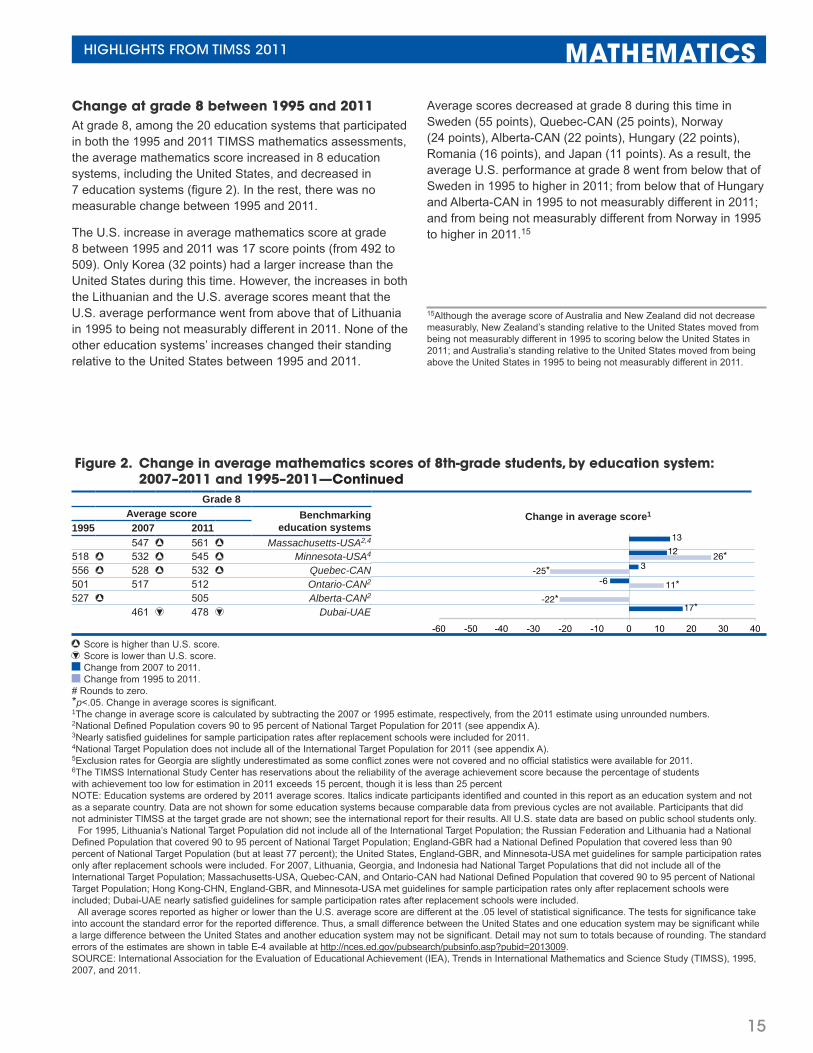
15
HIGHLIGHTS FROM TIMSS 2011 MATHEMATICS
Change at grade 8 between 1995 and 2011At grade 8, among the 20 education systems that participated in both the 1995 and 2011 TIMSS mathematics assessments, the average mathematics score increased in 8 education systems, including the United States, and decreased in 7 education systems (figure 2). In the rest, there was no measurable change between 1995 and 2011.
The U.S. increase in average mathematics score at grade 8 between 1995 and 2011 was 17 score points (from 492 to 509). Only Korea (32 points) had a larger increase than the United States during this time. However, the increases in both the Lithuanian and the U.S. average scores meant that the U.S. average performance went from above that of Lithuania in 1995 to being not measurably different in 2011. None of the other education systems’ increases changed their standing relative to the United States between 1995 and 2011.
Average scores decreased at grade 8 during this time in Sweden (55 points), Quebec-CAN (25 points), Norway (24 points), Alberta-CAN (22 points), Hungary (22 points), Romania (16 points), and Japan (11 points). As a result, the average U.S. performance at grade 8 went from below that of Sweden in 1995 to higher in 2011; from below that of Hungary and Alberta-CAN in 1995 to not measurably different in 2011; and from being not measurably different from Norway in 1995 to higher in 2011.15
15Although the average score of Australia and New Zealand did not decrease measurably, New Zealand’s standing relative to the United States moved from being not measurably different in 1995 to scoring below the United States in 2011; and Australia’s standing relative to the United States moved from being above the United States in 1995 to being not measurably different in 2011.
Figure 2. Change in average mathematics scores of 8th-grade students, by education system: 2007–2011 and 1995–2011—Continued
Grade 8Average score Benchmarking
education systemsChange in average score1
1995 2007 2011 547 561 Massachusetts-USA2,4 Change from 2007 to 2011: 13
518 532 545 Minnesota-USA4 Change from 2007 to 2011: 12. Change from 1995 to 2011: 26*
556 528 532 Quebec-CAN Change from 2007 to 2011: 3. Change from 1995 to 2011: -25*
501 517 512 Ontario-CAN2 Change from 2007 to 2011: -6. Change from 1995 to 2011: 11*
527 505 Alberta-CAN2 Change from 1995 to 2011: -22*
461 478 Dubai-UAE Change from 2007 to 2011: 17*
Score is higher than U.S. score. Score is lower than U.S. score. Change from 2007 to 2011. Change from 1995 to 2011.
# Rounds to zero.*p<.05. Change in average scores is significant.1The change in average score is calculated by subtracting the 2007 or 1995 estimate, respectively, from the 2011 estimate using unrounded numbers.2National Defined Population covers 90 to 95 percent of National Target Population for 2011 (see appendix A).3Nearly satisfied guidelines for sample participation rates after replacement schools were included for 2011.4National Target Population does not include all of the International Target Population for 2011 (see appendix A).5Exclusion rates for Georgia are slightly underestimated as some conflict zones were not covered and no official statistics were available for 2011.6The TIMSS International Study Center has reservations about the reliability of the average achievement score because the percentage of students with achievement too low for estimation in 2011 exceeds 15 percent, though it is less than 25 percent NOTE: Education systems are ordered by 2011 average scores. Italics indicate participants identified and counted in this report as an education system and not as a separate country. Data are not shown for some education systems because comparable data from previous cycles are not available. Participants that did not administer TIMSS at the target grade are not shown; see the international report for their results. All U.S. state data are based on public school students only.For 1995, Lithuania’s National Target Population did not include all of the International Target Population; the Russian Federation and Lithuania had a National
Defined Population that covered 90 to 95 percent of National Target Population; England-GBR had a National Defined Population that covered less than 90 percent of National Target Population (but at least 77 percent); the United States, England-GBR, and Minnesota-USA met guidelines for sample participation rates only after replacement schools were included. For 2007, Lithuania, Georgia, and Indonesia had National Target Populations that did not include all of the International Target Population; Massachusetts-USA, Quebec-CAN, and Ontario-CAN had National Defined Population that covered 90 to 95 percent of National Target Population; Hong Kong-CHN, England-GBR, and Minnesota-USA met guidelines for sample participation rates only after replacement schools were included; Dubai-UAE nearly satisfied guidelines for sample participation rates after replacement schools were included.All average scores reported as higher or lower than the U.S. average score are different at the .05 level of statistical significance. The tests for significance take
into account the standard error for the reported difference. Thus, a small difference between the United States and one education system may be significant while a large difference between the United States and another education system may not be significant. Detail may not sum to totals because of rounding. The standard errors of the estimates are shown in table E-4 available at http://nces.ed.gov/pubsearch/pubsinfo.asp?pubid=2013009.SOURCE: International Association for the Evaluation of Educational Achievement (IEA), Trends in International Mathematics and Science Study (TIMSS), 1995, 2007, and 2011.
13
1226*
3-25*
17*
11*-22*
-6
16
MATHEMATICS HIGHLIGHTS FROM TIMSS 2011
Content domain scores in 2011In addition to overall average mathematics scores, TIMSS provides average scores by specific mathematics topics called content domains. At grade 4, TIMSS tested student knowledge in three content domains: number, geometric shapes and measures, and data display. At grade 8, TIMSS tested student knowledge in four content domains: number, algebra, geometry, and data and chance.
At grade 4, the U.S. average was higher than the TIMSS scale average of 500 in all three content domains (table 5). In comparison with other education systems, U.S. 4th-graders performed better on average in number and data display than in geometric shapes and measures. That is, fewer education systems had higher average scores than the United States in these two domains than in geometric shapes and measures. In both number and data display, 8 education systems had higher average scores than the United States, whereas 12 education systems had a higher average score than the United States in the geometric shapes and measures.
At grade 8, the U.S. average was higher than the TIMSS scale average of 500 in three of the four 8th-grade content domains and below the TIMSS scale average in the fourth—geometry (table 6). In comparison with other education systems, U.S. 8th-graders performed better on average in algebra than in the other three domains. That is, fewer education systems had higher average scores than the United States in algebra than in data and chance, number, or geometry. In algebra, 9 education systems had a higher average score than the United States, whereas in both number and data and chance 14 education systems had higher average scores, and in geometry 21 education systems had a higher average score.

17
HIGHLIGHTS FROM TIMSS 2011 MATHEMATICS
Table 5. Average mathematics content domain scores of 4th-grade students, by education system: 2011
Education system Number
Geometric shapes and
measures Data displaySingapore1 619 589 588Korea, Rep. of 606 607 603Hong Kong-CHN1 604 605 593Chinese Taipei-CHN 599 573 600Japan 584 589 590Northern Ireland-GBR2 566 560 555Belgium (Flemish)-BEL 552 552 536Finland 545 543 551 Russian Federation 545 542 533Netherlands2 543 524 559United States1 543 535 545 England-GBR 539 545 549 Lithuania1,3 537 531 526Denmark1 534 548 532Ireland 533 520 523Serbia1 529 497 503Portugal 522 548 548 Germany 520 536 546 Hungary 515 520 510Kazakhstan1 515 491 476Slovak Republic 511 500 504Italy 510 513 495Czech Republic 509 513 519Australia 508 534 515Austria 506 512 515Slovenia 503 526 532Sweden 500 500 523Malta 498 487 498Romania 497 469 457Croatia1 491 490 488
Education system Number
Geometric shapes and
measures Data displayAzerbaijan1,4 491 437 407Norway5 488 507 494Spain 487 476 479Armenia 484 424 386New Zealand 483 483 491Poland 480 475 489Turkey 477 447 478Georgia3,4 473 411 433Thailand 464 437 467Chile 462 455 465Iran, Islamic Rep. of 440 435 397Bahrain 439 422 442United Arab Emirates 438 418 437Qatar1 417 399 416Saudi Arabi 410 404 403Tunisia6 390 329 300Oman6 384 376 381Morocco7 340 350 271Kuwait3,7 333 321 347Yemen7 261 193 204
Benchmarking education systemsNorth Carolina-USA1,3 564 536 558Florida-USA3,8 548 546 541 Quebec-CAN 531 536 538 Alberta-CAN1 505 496 524Ontario-CAN 504 535 536Dubai-UAE 474 449 471Abu Dhabi-UAE 420 401 418
Average score is higher than U.S. score. Average score is lower than U.S. score.
1National Defined Population covers 90 to 95 percent of National Target Population (see appendix A).2Met guidelines for sample participation rates only after replacement schools were included.3National Target Population does not include all of the International Target Population (see appendix A).4Exclusion rates for Azerbaijan and Georgia are slightly underestimated as some conflict zones were not covered and no official statistics were available.5Nearly satisfied guidelines for sample participation rates after replacement schools were included.6The TIMSS International Study Center has reservations about the reliability of the average achievement score because the percentage of students with achievement too low for estimation exceeds 15 percent, though it is less than 25 percent.7The TIMSS International Study Center has reservations about the reliability of the average achievement score because the percentage of students with achievement too low for estimation exceeds 25 percent.8National Defined Population covers less than 90 percent, but at least 77 percent, of National Target Population (see appendix A).NOTE: Education systems are ordered by 2011 average score in number domain. Italics indicate participants identified and counted in this report as an education system and not as a separate country. Participants that did not administer TIMSS at the target grade are not shown; see the international report for their results. All U.S. state data are based on public school students only. All average scores reported as higher or lower than U.S. average score are different at the .05 level of statistical significance. The tests for significance take into account the standard error for the reported difference. Thus, a small difference between the United States and one education system may be significant while a large difference between the United States and another education system may not be significant. The standard errors of the estimates are shown in table E-5 available at http://nces.ed.gov/pubsearch/pubsinfor.asp?pubid=2013009.SOURCE: International Association for the Evaluation of Educational Achievement (IEA), Trends in International Mathematics and Science Study (TIMSS), 2011.
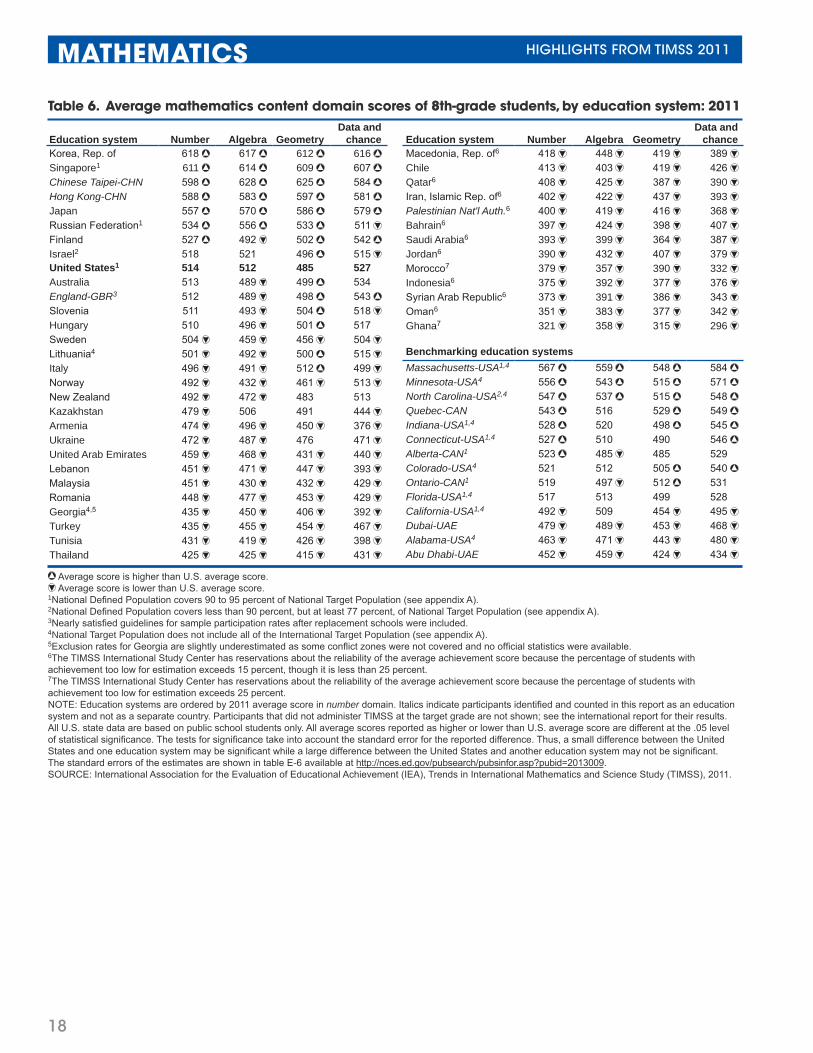
18
MATHEMATICS HIGHLIGHTS FROM TIMSS 2011
Table 6. Average mathematics content domain scores of 8th-grade students, by education system: 2011
Education system Number Algebra GeometryData and
chanceKorea, Rep. of 618 617 612 616Singapore1 611 614 609 607Chinese Taipei-CHN 598 628 625 584Hong Kong-CHN 588 583 597 581Japan 557 570 586 579Russian Federation1 534 556 533 511Finland 527 492 502 542Israel2 518 521 496 515United States1 514 512 485 527 Australia 513 489 499 534 England-GBR3 512 489 498 543Slovenia 511 493 504 518Hungary 510 496 501 517 Sweden 504 459 456 504Lithuania4 501 492 500 515Italy 496 491 512 499Norway 492 432 461 513New Zealand 492 472 483 513 Kazakhstan 479 506 491 444Armenia 474 496 450 376Ukraine 472 487 476 471United Arab Emirates 459 468 431 440Lebanon 451 471 447 393Malaysia 451 430 432 429Romania 448 477 453 429Georgia4,5 435 450 406 392Turkey 435 455 454 467Tunisia 431 419 426 398Thailand 425 425 415 431
Education system Number Algebra GeometryData and
chanceMacedonia, Rep. of6 418 448 419 389Chile 413 403 419 426Qatar6 408 425 387 390Iran, Islamic Rep. of6 402 422 437 393Palestinian Nat'l Auth.6 400 419 416 368Bahrain6 397 424 398 407Saudi Arabia6 393 399 364 387Jordan6 390 432 407 379Morocco7 379 357 390 332Indonesia6 375 392 377 376Syrian Arab Republic6 373 391 386 343Oman6 351 383 377 342Ghana7 321 358 315 296
Benchmarking education systemsMassachusetts-USA1,4 567 559 548 584Minnesota-USA4 556 543 515 571North Carolina-USA2,4 547 537 515 548Quebec-CAN 543 516 529 549Indiana-USA1,4 528 520 498 545Connecticut-USA1,4 527 510 490 546Alberta-CAN1 523 485 485 529 Colorado-USA4 521 512 505 540Ontario-CAN1 519 497 512 531 Florida-USA1,4 517 513 499 528 California-USA1,4 492 509 454 495Dubai-UAE 479 489 453 468Alabama-USA4 463 471 443 480Abu Dhabi-UAE 452 459 424 434
Average score is higher than U.S. average score. Average score is lower than U.S. average score.
1National Defined Population covers 90 to 95 percent of National Target Population (see appendix A).2National Defined Population covers less than 90 percent, but at least 77 percent, of National Target Population (see appendix A).3Nearly satisfied guidelines for sample participation rates after replacement schools were included.4National Target Population does not include all of the International Target Population (see appendix A).5Exclusion rates for Georgia are slightly underestimated as some conflict zones were not covered and no official statistics were available.6The TIMSS International Study Center has reservations about the reliability of the average achievement score because the percentage of students with achievement too low for estimation exceeds 15 percent, though it is less than 25 percent.7The TIMSS International Study Center has reservations about the reliability of the average achievement score because the percentage of students with achievement too low for estimation exceeds 25 percent.NOTE: Education systems are ordered by 2011 average score in number domain. Italics indicate participants identified and counted in this report as an education system and not as a separate country. Participants that did not administer TIMSS at the target grade are not shown; see the international report for their results. All U.S. state data are based on public school students only. All average scores reported as higher or lower than U.S. average score are different at the .05 level of statistical significance. The tests for significance take into account the standard error for the reported difference. Thus, a small difference between the United States and one education system may be significant while a large difference between the United States and another education system may not be significant. The standard errors of the estimates are shown in table E-6 available at http://nces.ed.gov/pubsearch/pubsinfor.asp?pubid=2013009.SOURCE: International Association for the Evaluation of Educational Achievement (IEA), Trends in International Mathematics and Science Study (TIMSS), 2011.
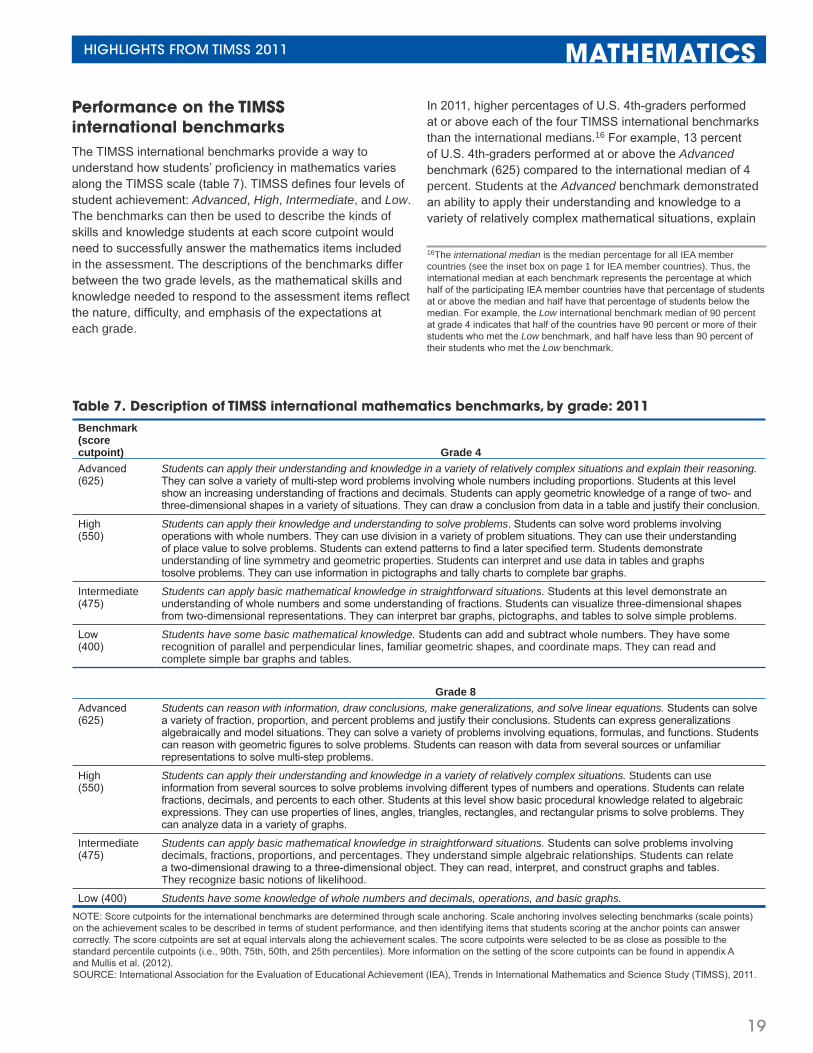
19
HIGHLIGHTS FROM TIMSS 2011 MATHEMATICS
Performance on the TIMSS international benchmarksThe TIMSS international benchmarks provide a way to understand how students’ proficiency in mathematics varies along the TIMSS scale (table 7). TIMSS defines four levels of student achievement: Advanced, High, Intermediate, and Low. The benchmarks can then be used to describe the kinds of skills and knowledge students at each score cutpoint would need to successfully answer the mathematics items included in the assessment. The descriptions of the benchmarks differ between the two grade levels, as the mathematical skills and knowledge needed to respond to the assessment items reflect the nature, difficulty, and emphasis of the expectations at each grade.
In 2011, higher percentages of U.S. 4th-graders performed at or above each of the four TIMSS international benchmarks than the international medians.16 For example, 13 percent of U.S. 4th-graders performed at or above the Advanced benchmark (625) compared to the international median of 4 percent. Students at the Advanced benchmark demonstrated an ability to apply their understanding and knowledge to a variety of relatively complex mathematical situations, explain
16The international median is the median percentage for all IEA member countries (see the inset box on page 1 for IEA member countries). Thus, the international median at each benchmark represents the percentage at which half of the participating IEA member countries have that percentage of students at or above the median and half have that percentage of students below the median. For example, the Low international benchmark median of 90 percent at grade 4 indicates that half of the countries have 90 percent or more of their students who met the Low benchmark, and half have less than 90 percent of their students who met the Low benchmark.
Table 7. Description of TIMSS international mathematics benchmarks, by grade: 2011 Benchmark(score cutpoint) Grade 4Advanced(625)
Students can apply their understanding and knowledge in a variety of relatively complex situations and explain their reasoning. They can solve a variety of multi-step word problems involving whole numbers including proportions. Students at this level show an increasing understanding of fractions and decimals. Students can apply geometric knowledge of a range of two- and three-dimensional shapes in a variety of situations. They can draw a conclusion from data in a table and justify their conclusion.
High(550)
Students can apply their knowledge and understanding to solve problems. Students can solve word problems involving operations with whole numbers. They can use division in a variety of problem situations. They can use their understanding of place value to solve problems. Students can extend patterns to find a later specified term. Students demonstrate understanding of line symmetry and geometric properties. Students can interpret and use data in tables and graphs tosolve problems. They can use information in pictographs and tally charts to complete bar graphs.
Intermediate(475)
Students can apply basic mathematical knowledge in straightforward situations. Students at this level demonstrate an understanding of whole numbers and some understanding of fractions. Students can visualize three-dimensional shapes from two-dimensional representations. They can interpret bar graphs, pictographs, and tables to solve simple problems.
Low(400)
Students have some basic mathematical knowledge. Students can add and subtract whole numbers. They have some recognition of parallel and perpendicular lines, familiar geometric shapes, and coordinate maps. They can read and complete simple bar graphs and tables.
Grade 8Advanced(625)
Students can reason with information, draw conclusions, make generalizations, and solve linear equations. Students can solve a variety of fraction, proportion, and percent problems and justify their conclusions. Students can express generalizations algebraically and model situations. They can solve a variety of problems involving equations, formulas, and functions. Students can reason with geometric figures to solve problems. Students can reason with data from several sources or unfamiliar representations to solve multi-step problems.
High(550)
Students can apply their understanding and knowledge in a variety of relatively complex situations. Students can use information from several sources to solve problems involving different types of numbers and operations. Students can relate fractions, decimals, and percents to each other. Students at this level show basic procedural knowledge related to algebraic expressions. They can use properties of lines, angles, triangles, rectangles, and rectangular prisms to solve problems. They can analyze data in a variety of graphs.
Intermediate(475)
Students can apply basic mathematical knowledge in straightforward situations. Students can solve problems involving decimals, fractions, proportions, and percentages. They understand simple algebraic relationships. Students can relate a two-dimensional drawing to a three-dimensional object. They can read, interpret, and construct graphs and tables. They recognize basic notions of likelihood.
Low (400) Students have some knowledge of whole numbers and decimals, operations, and basic graphs.NOTE: Score cutpoints for the international benchmarks are determined through scale anchoring. Scale anchoring involves selecting benchmarks (scale points) on the achievement scales to be described in terms of student performance, and then identifying items that students scoring at the anchor points can answer correctly. The score cutpoints are set at equal intervals along the achievement scales. The score cutpoints were selected to be as close as possible to the standard percentile cutpoints (i.e., 90th, 75th, 50th, and 25th percentiles). More information on the setting of the score cutpoints can be found in appendix A and Mullis et al. (2012). SOURCE: International Association for the Evaluation of Educational Achievement (IEA), Trends in International Mathematics and Science Study (TIMSS), 2011.
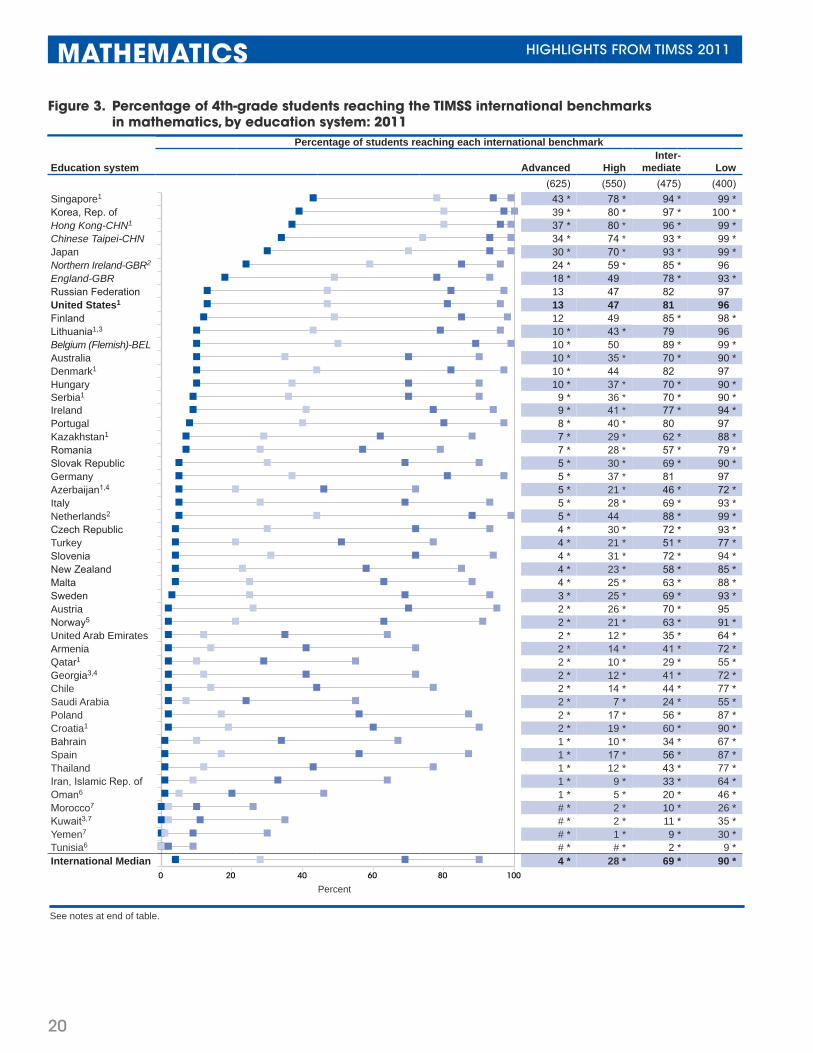
20
MATHEMATICS HIGHLIGHTS FROM TIMSS 2011
0 20 40 60 80 100
Figure 3. Percentage of 4th-grade students reaching the TIMSS international benchmarks in mathematics, by education system: 2011
Percentage of students reaching each international benchmark
Education system Advanced HighInter-
mediate Low(625) (550) (475) (400)
Singapore1 43 * 78 * 94 * 99 *Korea, Rep. of 39 * 80 * 97 * 100 *Hong Kong-CHN1 37 * 80 * 96 * 99 *Chinese Taipei-CHN 34 * 74 * 93 * 99 *Japan 30 * 70 * 93 * 99 *Northern Ireland-GBR2 24 * 59 * 85 * 96England-GBR 18 * 49 78 * 93 *Russian Federation 13 47 82 97United States1 13 47 81 96Finland 12 49 85 * 98 *Lithuania1,3 10 * 43 * 79 96Belgium (Flemish)-BEL 10 * 50 89 * 99 *Australia 10 * 35 * 70 * 90 *Denmark1 10 * 44 82 97Hungary 10 * 37 * 70 * 90 *Serbia1 9 * 36 * 70 * 90 *Ireland 9 * 41 * 77 * 94 *Portugal 8 * 40 * 80 97Kazakhstan1 7 * 29 * 62 * 88 *Romania 7 * 28 * 57 * 79 *Slovak Republic 5 * 30 * 69 * 90 *Germany 5 * 37 * 81 97Azerbaijan1,4 5 * 21 * 46 * 72 *Italy 5 * 28 * 69 * 93 *Netherlands2 5 * 44 88 * 99 *Czech Republic 4 * 30 * 72 * 93 *Turkey 4 * 21 * 51 * 77 *Slovenia 4 * 31 * 72 * 94 *New Zealand 4 * 23 * 58 * 85 *Malta 4 * 25 * 63 * 88 *Sweden 3 * 25 * 69 * 93 *Austria 2 * 26 * 70 * 95Norway5 2 * 21 * 63 * 91 *United Arab Emirates 2 * 12 * 35 * 64 *Armenia 2 * 14 * 41 * 72 *Qatar1 2 * 10 * 29 * 55 *Georgia3,4 2 * 12 * 41 * 72 *Chile 2 * 14 * 44 * 77 *Saudi Arabia 2 * 7 * 24 * 55 *Poland 2 * 17 * 56 * 87 *Croatia1 2 * 19 * 60 * 90 *Bahrain 1 * 10 * 34 * 67 *Spain 1 * 17 * 56 * 87 *Thailand 1 * 12 * 43 * 77 *Iran, Islamic Rep. of 1 * 9 * 33 * 64 *Oman6 1 * 5 * 20 * 46 *Morocco7 # * 2 * 10 * 26 *Kuwait3,7 # * 2 * 11 * 35 *Yemen7 # * 1 * 9 * 30 *Tunisia6 # * # * 2 * 9 *International Median 4 * 28 * 69 * 90 *
Percent
See notes at end of table.
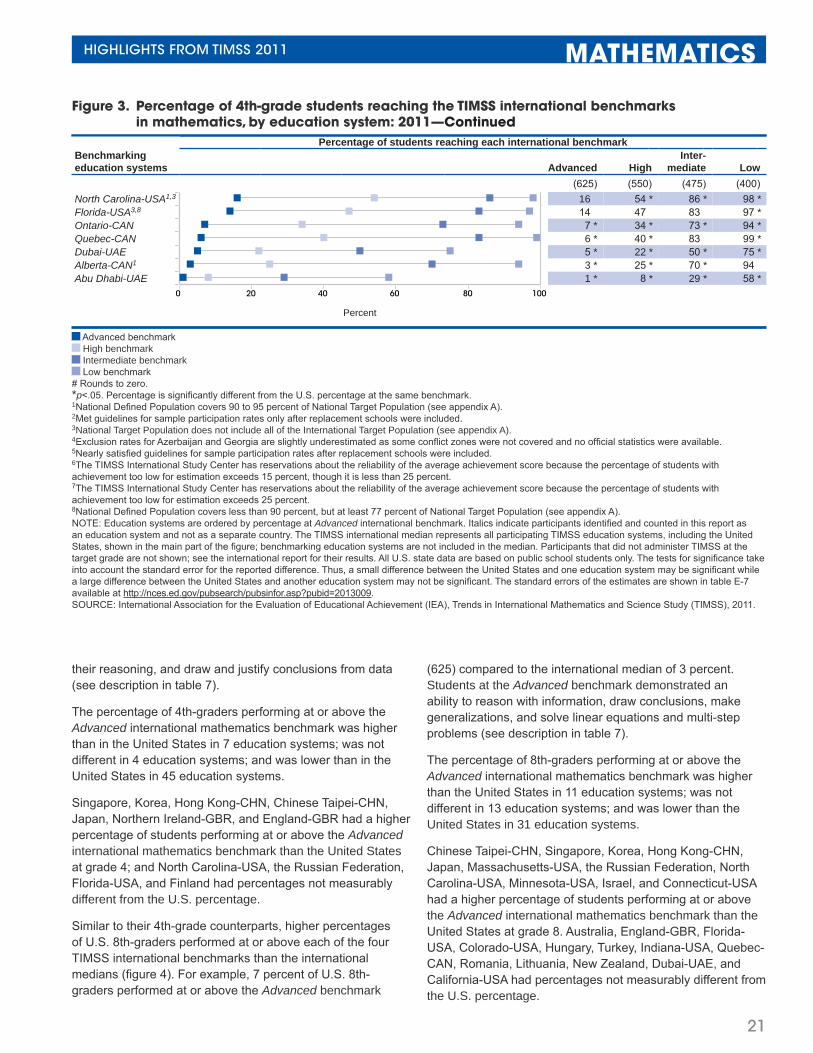
21
HIGHLIGHTS FROM TIMSS 2011 MATHEMATICS
Figure 3. Percentage of 4th-grade students reaching the TIMSS international benchmarks in mathematics, by education system: 2011—Continued
Percentage of students reaching each international benchmarkBenchmarking education systems Advanced High
Inter-mediate Low
(625) (550) (475) (400)North Carolina-USA1,3 16 54 * 86 * 98 *Florida-USA3,8 14 47 83 97 *Ontario-CAN 7 * 34 * 73 * 94 *Quebec-CAN 6 * 40 * 83 99 *Dubai-UAE 5 * 22 * 50 * 75 *Alberta-CAN1 3 * 25 * 70 * 94Abu Dhabi-UAE 1 * 8 * 29 * 58 *
Percent
Advanced benchmark High benchmark Intermediate benchmark Low benchmark
# Rounds to zero.*p<.05. Percentage is significantly different from the U.S. percentage at the same benchmark.1National Defined Population covers 90 to 95 percent of National Target Population (see appendix A).2Met guidelines for sample participation rates only after replacement schools were included.3National Target Population does not include all of the International Target Population (see appendix A).4Exclusion rates for Azerbaijan and Georgia are slightly underestimated as some conflict zones were not covered and no official statistics were available.5Nearly satisfied guidelines for sample participation rates after replacement schools were included.6The TIMSS International Study Center has reservations about the reliability of the average achievement score because the percentage of students with achievement too low for estimation exceeds 15 percent, though it is less than 25 percent.7The TIMSS International Study Center has reservations about the reliability of the average achievement score because the percentage of students with achievement too low for estimation exceeds 25 percent.8National Defined Population covers less than 90 percent, but at least 77 percent of National Target Population (see appendix A).NOTE: Education systems are ordered by percentage at Advanced international benchmark. Italics indicate participants identified and counted in this report as an education system and not as a separate country. The TIMSS international median represents all participating TIMSS education systems, including the United States, shown in the main part of the figure; benchmarking education systems are not included in the median. Participants that did not administer TIMSS at the target grade are not shown; see the international report for their results. All U.S. state data are based on public school students only. The tests for significance take into account the standard error for the reported difference. Thus, a small difference between the United States and one education system may be significant while a large difference between the United States and another education system may not be significant. The standard errors of the estimates are shown in table E-7 available at http://nces.ed.gov/pubsearch/pubsinfor.asp?pubid=2013009.SOURCE: International Association for the Evaluation of Educational Achievement (IEA), Trends in International Mathematics and Science Study (TIMSS), 2011.
0 20 40 60 80 100
their reasoning, and draw and justify conclusions from data (see description in table 7).
The percentage of 4th-graders performing at or above the Advanced international mathematics benchmark was higher than in the United States in 7 education systems; was not different in 4 education systems; and was lower than in the United States in 45 education systems.
Singapore, Korea, Hong Kong-CHN, Chinese Taipei-CHN, Japan, Northern Ireland-GBR, and England-GBR had a higher percentage of students performing at or above the Advanced international mathematics benchmark than the United States at grade 4; and North Carolina-USA, the Russian Federation, Florida-USA, and Finland had percentages not measurably different from the U.S. percentage.
Similar to their 4th-grade counterparts, higher percentages of U.S. 8th-graders performed at or above each of the four TIMSS international benchmarks than the international medians (figure 4). For example, 7 percent of U.S. 8th-graders performed at or above the Advanced benchmark
(625) compared to the international median of 3 percent. Students at the Advanced benchmark demonstrated an ability to reason with information, draw conclusions, make generalizations, and solve linear equations and multi-step problems (see description in table 7).
The percentage of 8th-graders performing at or above the Advanced international mathematics benchmark was higher than the United States in 11 education systems; was not different in 13 education systems; and was lower than the United States in 31 education systems.
Chinese Taipei-CHN, Singapore, Korea, Hong Kong-CHN, Japan, Massachusetts-USA, the Russian Federation, North Carolina-USA, Minnesota-USA, Israel, and Connecticut-USA had a higher percentage of students performing at or above the Advanced international mathematics benchmark than the United States at grade 8. Australia, England-GBR, Florida-USA, Colorado-USA, Hungary, Turkey, Indiana-USA, Quebec-CAN, Romania, Lithuania, New Zealand, Dubai-UAE, and California-USA had percentages not measurably different from the U.S. percentage.
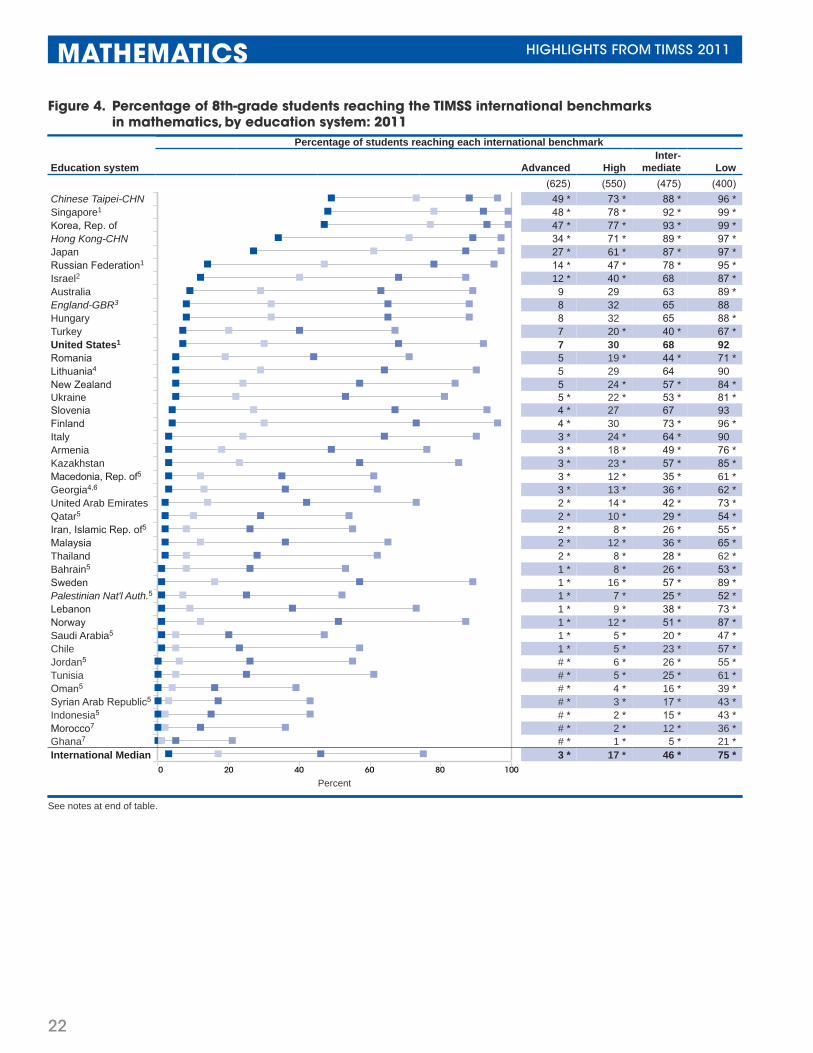
22
MATHEMATICS HIGHLIGHTS FROM TIMSS 2011
0 40 60 2 0 80 100
Figure 4. Percentage of 8th-grade students reaching the TIMSS international benchmarks in mathematics, by education system: 2011
Percentage of students reaching each international benchmark
Education system Advanced HighInter-
mediate Low(625) (550) (475) (400)
Chinese Taipei-CHN 49 * 73 * 88 * 96 *Singapore1 48 * 78 * 92 * 99 *Korea, Rep. of 47 * 77 * 93 * 99 *Hong Kong-CHN 34 * 71 * 89 * 97 *Japan 27 * 61 * 87 * 97 *Russian Federation1 14 * 47 * 78 * 95 *Israel2 12 * 40 * 68 87 *Australia 9 29 63 89 *England-GBR3 8 32 65 88Hungary 8 32 65 88 *Turkey 7 20 * 40 * 67 *United States1 7 30 68 92Romania 5 19 * 44 * 71 *Lithuania4 5 29 64 90New Zealand 5 24 * 57 * 84 *Ukraine 5 * 22 * 53 * 81 *Slovenia 4 * 27 67 93Finland 4 * 30 73 * 96 *Italy 3 * 24 * 64 * 90Armenia 3 * 18 * 49 * 76 *Kazakhstan 3 * 23 * 57 * 85 *Macedonia, Rep. of5 3 * 12 * 35 * 61 *Georgia4,6 3 * 13 * 36 * 62 *United Arab Emirates 2 * 14 * 42 * 73 *Qatar5 2 * 10 * 29 * 54 *Iran, Islamic Rep. of5 2 * 8 * 26 * 55 *Malaysia 2 * 12 * 36 * 65 *Thailand 2 * 8 * 28 * 62 *Bahrain5 1 * 8 * 26 * 53 *Sweden 1 * 16 * 57 * 89 *Palestinian Nat'l Auth.5 1 * 7 * 25 * 52 *Lebanon 1 * 9 * 38 * 73 *Norway 1 * 12 * 51 * 87 *Saudi Arabia5 1 * 5 * 20 * 47 *Chile 1 * 5 * 23 * 57 *Jordan5 # * 6 * 26 * 55 *Tunisia # * 5 * 25 * 61 *Oman5 # * 4 * 16 * 39 *Syrian Arab Republic5 # * 3 * 17 * 43 *Indonesia5 # * 2 * 15 * 43 *Morocco7 # * 2 * 12 * 36 *Ghana7 # * 1 * 5 * 21 *International Median 3 * 17 * 46 * 75 *
Percent
See notes at end of table.
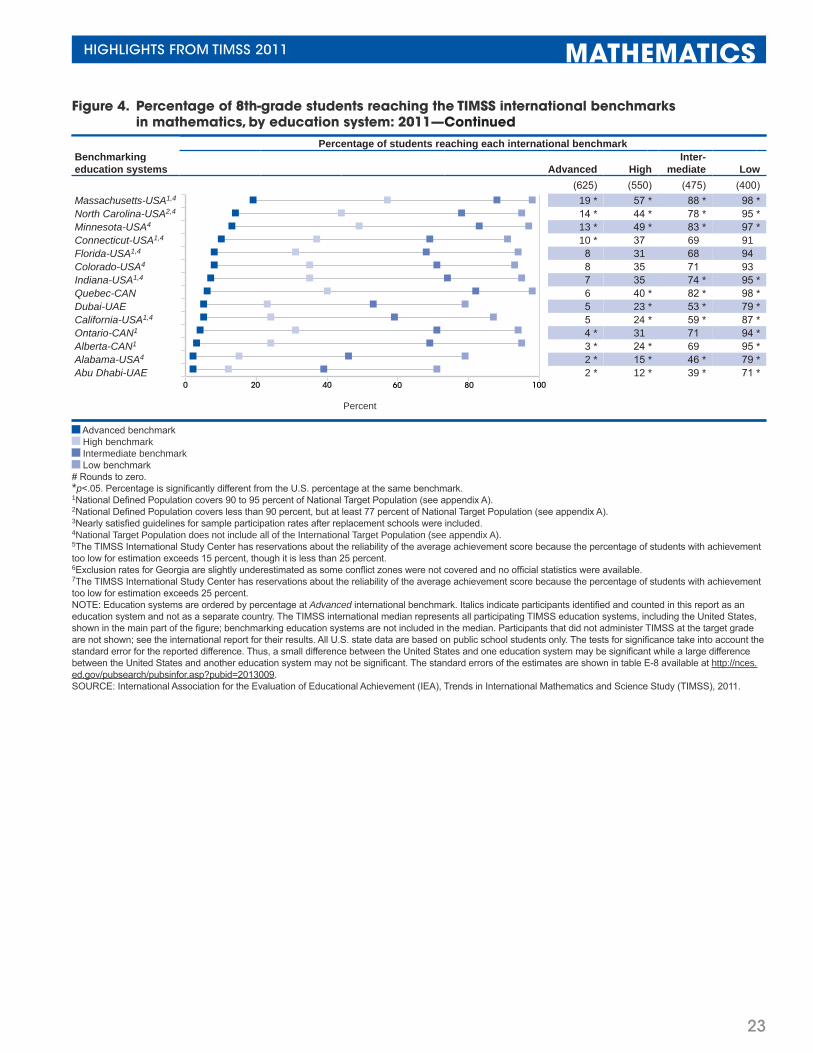
23
HIGHLIGHTS FROM TIMSS 2011 MATHEMATICS
0 20 40 1008060
Figure 4. Percentage of 8th-grade students reaching the TIMSS international benchmarks in mathematics, by education system: 2011—Continued
Percentage of students reaching each international benchmarkBenchmarking education systems Advanced High
Inter-mediate Low
(625) (550) (475) (400)Massachusetts-USA1,4 19 * 57 * 88 * 98 *North Carolina-USA2,4 14 * 44 * 78 * 95 *Minnesota-USA4 13 * 49 * 83 * 97 *Connecticut-USA1,4 10 * 37 69 91Florida-USA1,4 8 31 68 94Colorado-USA4 8 35 71 93Indiana-USA1,4 7 35 74 * 95 *Quebec-CAN 6 40 * 82 * 98 *Dubai-UAE 5 23 * 53 * 79 *California-USA1,4 5 24 * 59 * 87 *Ontario-CAN1 4 * 31 71 94 *Alberta-CAN1 3 * 24 * 69 95 *Alabama-USA4 2 * 15 * 46 * 79 *Abu Dhabi-UAE 2 * 12 * 39 * 71 *
Percent
Advanced benchmark High benchmark Intermediate benchmark Low benchmark
# Rounds to zero.*p<.05. Percentage is significantly different from the U.S. percentage at the same benchmark.1National Defined Population covers 90 to 95 percent of National Target Population (see appendix A).2National Defined Population covers less than 90 percent, but at least 77 percent of National Target Population (see appendix A).3Nearly satisfied guidelines for sample participation rates after replacement schools were included.4National Target Population does not include all of the International Target Population (see appendix A).5The TIMSS International Study Center has reservations about the reliability of the average achievement score because the percentage of students with achievement too low for estimation exceeds 15 percent, though it is less than 25 percent.6Exclusion rates for Georgia are slightly underestimated as some conflict zones were not covered and no official statistics were available.7The TIMSS International Study Center has reservations about the reliability of the average achievement score because the percentage of students with achievement too low for estimation exceeds 25 percent.NOTE: Education systems are ordered by percentage at Advanced international benchmark. Italics indicate participants identified and counted in this report as an education system and not as a separate country. The TIMSS international median represents all participating TIMSS education systems, including the United States, shown in the main part of the figure; benchmarking education systems are not included in the median. Participants that did not administer TIMSS at the target grade are not shown; see the international report for their results. All U.S. state data are based on public school students only. The tests for significance take into account the standard error for the reported difference. Thus, a small difference between the United States and one education system may be significant while a large difference between the United States and another education system may not be significant. The standard errors of the estimates are shown in table E-8 available at http://nces.ed.gov/pubsearch/pubsinfor.asp?pubid=2013009.SOURCE: International Association for the Evaluation of Educational Achievement (IEA), Trends in International Mathematics and Science Study (TIMSS), 2011.

24
MATHEMATICS HIGHLIGHTS FROM TIMSS 2011
Average scores of male and female studentsIn 2011, at grade 4, the U.S. average score in mathematics was 9 score points higher for males than for females (figure 5). Among all 57 education systems that participated in TIMSS at grade 4, there were 30 education systems that showed a significant difference in the average mathematics scores of males and females: 25 in favor of males (including Florida-USA and North Carolina-USA, as well as the nation as a whole) and 5 in favor of females. The difference in average scores between males and females ranged from 35 score points in Kuwait in favor of females to 12 score points in North Carolina-USA in favor of males. In 27 education systems, there was no measurable difference between the average mathematics scores of males and females.
At grade 8, there was no statistically significant difference between the average scores of U.S. males and females (figure 6). Among all 56 education systems that participated in TIMSS at grade 8, there were 21 education systems that showed a significant difference in the average mathematics scores of males and females: 8 in favor of males (including Indiana-USA) and 13 in favor of females. The difference in average scores between males and females ranged from 63 score points in Oman in favor of females to 23 score points in Ghana in favor of males. In 35 education systems, there was no statistical difference between the average mathematics scores of males and females (including the U.S. states of Alabama, California, Colorado, Connecticut, Florida, Massachusetts, Minnesota, and North Carolina, as well as the nation as a whole).
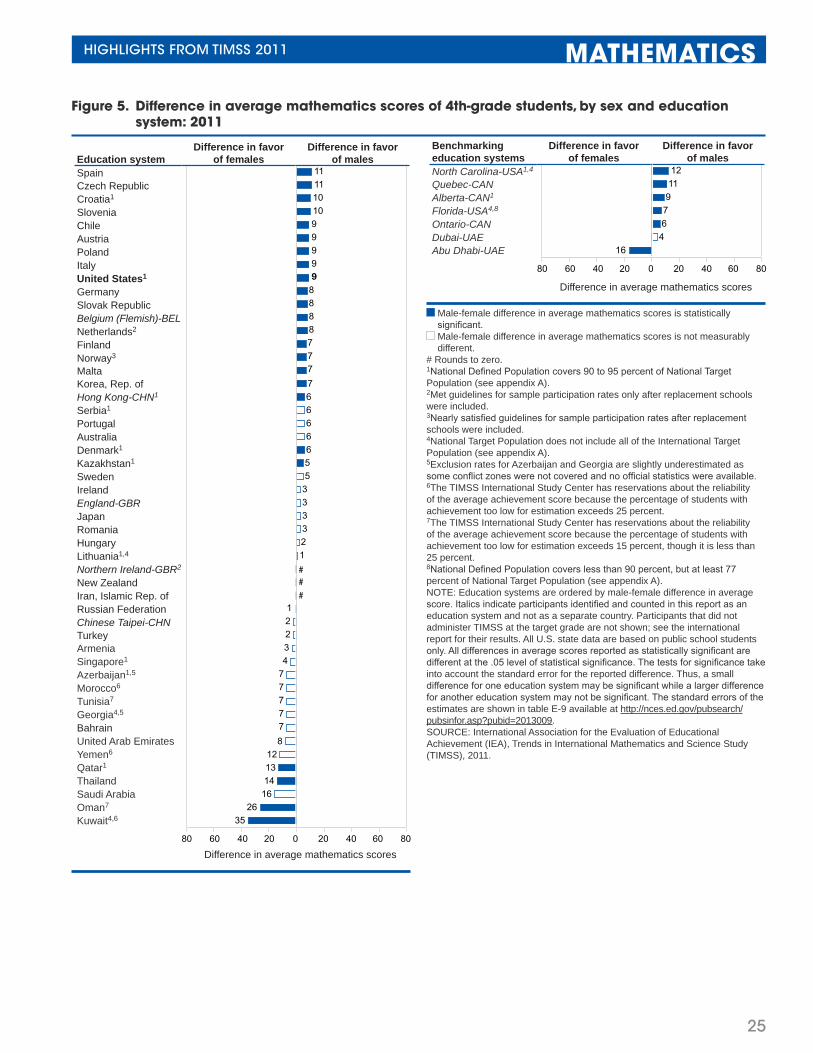
25
HIGHLIGHTS FROM TIMSS 2011 MATHEMATICS
Figure 5. Difference in average mathematics scores of 4th-grade students, by sex and education system: 2011
Education systemDifference in favor
of femalesDifference in favor
of malesSpain 11 is statistically significant
Czech Republic 11 is statistically significant
Croatia1 10 is statistically significant
Slovenia 10 is statistically significant
Chile 9 is statistically significant
Austria 9 is statistically significant
Poland 9 is statistically significant
Italy 9 is statistically significant
United States1 9 is statistically significant
Germany 8 is statistically significant
Slovak Republic 8 is statistically significant
Belgium (Flemish)-BEL 8 is statistically significant
Netherlands2 8 is statistically significant
Finland 7 is statistically significant
Norway3 7 is statistically significant
Malta 7 is statistically significant
Korea, Rep. of 7 is statistically significant
Hong Kong-CHN1 6 is statistically significant
Serbia1 6 is not measurably different
Portugal 6 is not measurably different
Australia 6 is not measurably different
Denmark1 6 is statistically significant
Kazakhstan1 5 is statistically significant
Sweden 5 is not measurably different
Ireland 3 is not measurably different
England-GBR 3 is not measurably different
Japan 3 is not measurably different
Romania 3 is not measurably different
Hungary 2 is not measurably different
Lithuania1,4 1 is not measurably different
Northern Ireland-GBR2 #
New Zealand #
Iran, Islamic Rep. of #
Russian Federation 1 is not measurably different
Chinese Taipei-CHN 2 is not measurably different
Turkey 2 is not measurably different
Armenia 3 is not measurably different
Singapore1 4 is not measurably different
Azerbaijan1,5 7 is not measurably different
Morocco6 7 is not measurably different
Tunisia7 7 is not measurably different
Georgia4,5 7 is not measurably different
Bahrain 7 is not measurably different
United Arab Emirates 8 is not measurably different
Yemen6 12 is not measurably different
Qatar1 13 is statistically significant
Thailand 14 is statistically significant
Saudi Arabia 16 is not measurably different
Oman7 26 is statistically significant
Kuwait4,6 35 is statistically significant
Difference in average mathematics scores
Benchmarking education systems
Difference in favor of females
Difference in favor of males
North Carolina-USA1,4 12 is statistically significant
Quebec-CAN 11 is statistically significant
Alberta-CAN1 9 is statistically significant
Florida-USA4,8 7 is statistically significant
Ontario-CAN 6 is statistically significant
Dubai-UAE 4 is not measurably different
Abu Dhabi-UAE 16 is statistically significant
Difference in average mathematics scores
Male-female difference in average mathematics scores is statistically significant. Male-female difference in average mathematics scores is not measurably different.
# Rounds to zero.1National Defined Population covers 90 to 95 percent of National Target Population (see appendix A).2Met guidelines for sample participation rates only after replacement schools were included.3Nearly satisfied guidelines for sample participation rates after replacement schools were included.4National Target Population does not include all of the International Target Population (see appendix A).5Exclusion rates for Azerbaijan and Georgia are slightly underestimated as some conflict zones were not covered and no official statistics were available.6The TIMSS International Study Center has reservations about the reliability of the average achievement score because the percentage of students with achievement too low for estimation exceeds 25 percent.7The TIMSS International Study Center has reservations about the reliability of the average achievement score because the percentage of students with achievement too low for estimation exceeds 15 percent, though it is less than 25 percent.8National Defined Population covers less than 90 percent, but at least 77 percent of National Target Population (see appendix A).NOTE: Education systems are ordered by male-female difference in average score. Italics indicate participants identified and counted in this report as an education system and not as a separate country. Participants that did not administer TIMSS at the target grade are not shown; see the international report for their results. All U.S. state data are based on public school students only. All differences in average scores reported as statistically significant are different at the .05 level of statistical significance. The tests for significance take into account the standard error for the reported difference. Thus, a small difference for one education system may be significant while a larger difference for another education system may not be significant. The standard errors of the estimates are shown in table E-9 available at http://nces.ed.gov/pubsearch/pubsinfor.asp?pubid=2013009.SOURCE: International Association for the Evaluation of Educational Achievement (IEA), Trends in International Mathematics and Science Study (TIMSS), 2011.
9
###
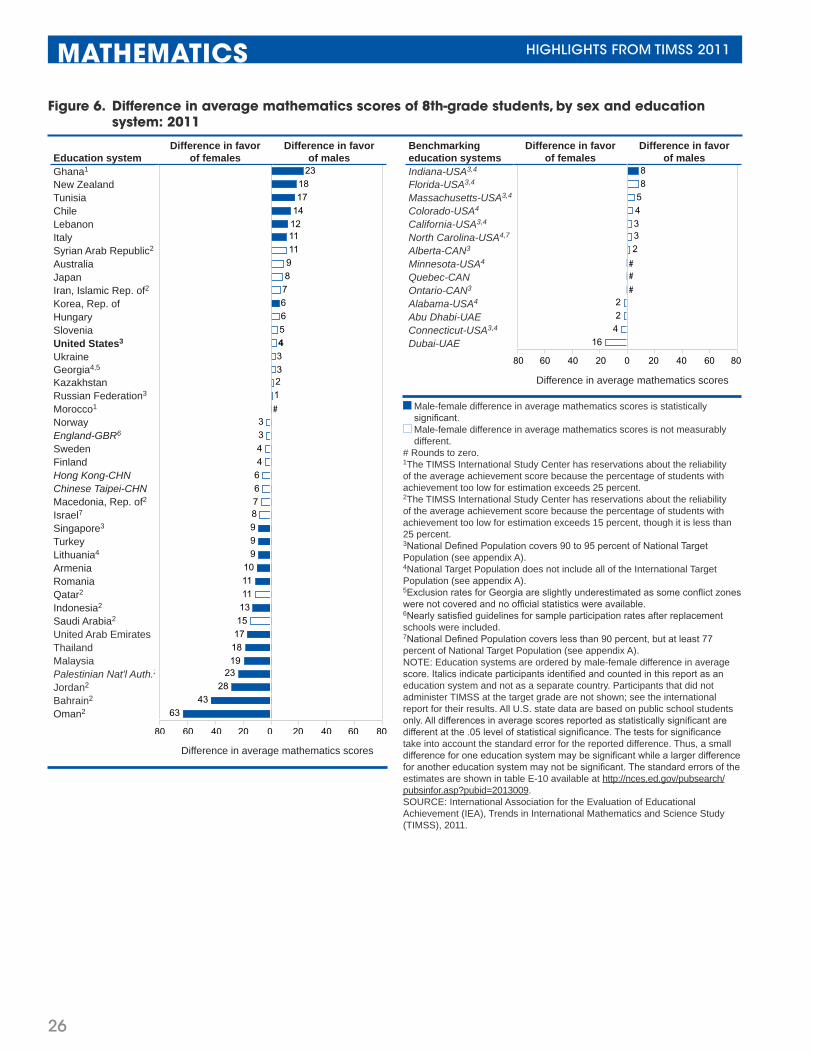
26
MATHEMATICS HIGHLIGHTS FROM TIMSS 2011
Figure 6. Difference in average mathematics scores of 8th-grade students, by sex and education system: 2011
Education systemDifference in favor
of femalesDifference in favor
of malesGhana1 23 is statistically significant
New Zealand 18 is statistically significant
Tunisia 17 is statistically significant
Chile 14 is statistically significant
Lebanon 12 is statistically significant
Italy 11 is statistically significant
Syrian Arab Republic2 11 is not measurably different
Australia 9 is not measurably different
Japan 8 is not measurably different
Iran, Islamic Rep. of2 7 is not measurably different
Korea, Rep. of 6 is statistically significant
Hungary 6 is not measurably different
Slovenia 5 is not measurably different
United States3 4 is not measurably different
Ukraine 3 is not measurably different
Georgia4,5 3 is not measurably different
Kazakhstan 2 is not measurably different
Russian Federation3 1 is not measurably different
Morocco1 #
Norway 3 is not measurably different
England-GBR6 3 is not measurably different
Sweden 4 is not measurably different
Finland 4 is not measurably different
Hong Kong-CHN 6 is not measurably different
Chinese Taipei-CHN 6 is not measurably different
Macedonia, Rep. of2 7 is not measurably different
Israel7 8 is not measurably different
Singapore3 9 is statistically significant
Turkey 9 is statistically significant
Lithuania4 9 is statistically significant
Armenia 10 is statistically significant
Romania 11 is statistically significant
Qatar2 11 is not measurably different
Indonesia2 13 is statistically significant
Saudi Arabia2 15 is not measurably different
United Arab Emirates 17 is statistically significant
Thailand 18 is statistically significant
Malaysia 19 is statistically significant
Palestinian Nat'l Auth.2 23 is statistically significant
Jordan2 28 is statistically significant
Bahrain2 43 is statistically significant
Oman2 63 is statistically significant
Difference in average mathematics scores
Benchmarking education systems
Difference in favor of females
Difference in favor of males
Indiana-USA3,4 8 is statistically significant
Florida-USA3,4 8 is not measurably different
Massachusetts-USA3,4 5 is not measurably different
Colorado-USA4 4 is not measurably different
California-USA3,4 3 is not measurably different
North Carolina-USA4,7 3 is not measurably different
Alberta-CAN3 2 is not measurably different
Minnesota-USA4 #
Quebec-CAN #
Ontario-CAN3 #
Alabama-USA4 2 is not measurably different
Abu Dhabi-UAE 2 is not measurably different
Connecticut-USA3,4 4 is not measurably different
Dubai-UAE 16 is not measurably different
Difference in average mathematics scores
Male-female difference in average mathematics scores is statistically significant. Male-female difference in average mathematics scores is not measurably different.
# Rounds to zero.1The TIMSS International Study Center has reservations about the reliability of the average achievement score because the percentage of students with achievement too low for estimation exceeds 25 percent.2The TIMSS International Study Center has reservations about the reliability of the average achievement score because the percentage of students with achievement too low for estimation exceeds 15 percent, though it is less than 25 percent.3National Defined Population covers 90 to 95 percent of National Target Population (see appendix A).4National Target Population does not include all of the International Target Population (see appendix A).5Exclusion rates for Georgia are slightly underestimated as some conflict zones were not covered and no official statistics were available.6Nearly satisfied guidelines for sample participation rates after replacement schools were included.7National Defined Population covers less than 90 percent, but at least 77 percent of National Target Population (see appendix A).NOTE: Education systems are ordered by male-female difference in average score. Italics indicate participants identified and counted in this report as an education system and not as a separate country. Participants that did not administer TIMSS at the target grade are not shown; see the international report for their results. All U.S. state data are based on public school students only. All differences in average scores reported as statistically significant are different at the .05 level of statistical significance. The tests for significance take into account the standard error for the reported difference. Thus, a small difference for one education system may be significant while a larger difference for another education system may not be significant. The standard errors of the estimates are shown in table E-10 available at http://nces.ed.gov/pubsearch/pubsinfor.asp?pubid=2013009.SOURCE: International Association for the Evaluation of Educational Achievement (IEA), Trends in International Mathematics and Science Study (TIMSS), 2011.
4
#
##
#
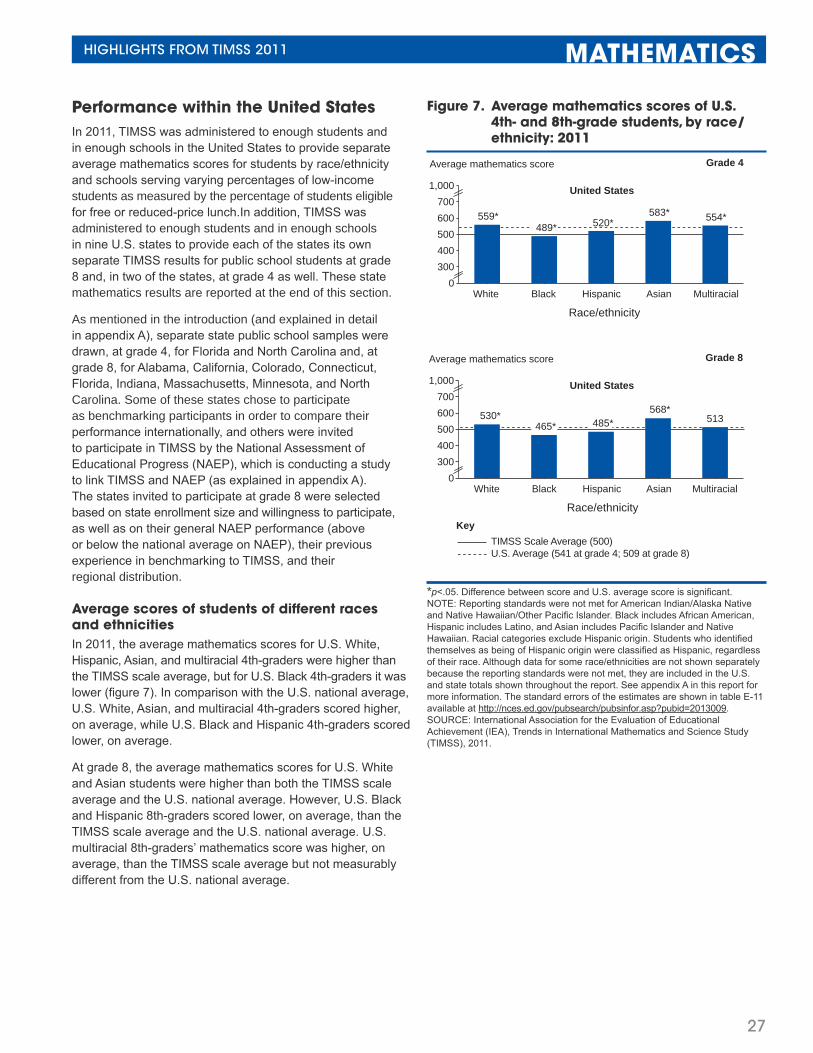
27
HIGHLIGHTS FROM TIMSS 2011 MATHEMATICS
Performance within the United StatesIn 2011, TIMSS was administered to enough students and in enough schools in the United States to provide separate average mathematics scores for students by race/ethnicity and schools serving varying percentages of low-income students as measured by the percentage of students eligible for free or reduced-price lunch.In addition, TIMSS was administered to enough students and in enough schools in nine U.S. states to provide each of the states its own separate TIMSS results for public school students at grade 8 and, in two of the states, at grade 4 as well. These state mathematics results are reported at the end of this section.
As mentioned in the introduction (and explained in detail in appendix A), separate state public school samples were drawn, at grade 4, for Florida and North Carolina and, at grade 8, for Alabama, California, Colorado, Connecticut, Florida, Indiana, Massachusetts, Minnesota, and North Carolina. Some of these states chose to participate as benchmarking participants in order to compare their performance internationally, and others were invited to participate in TIMSS by the National Assessment of Educational Progress (NAEP), which is conducting a study to link TIMSS and NAEP (as explained in appendix A). The states invited to participate at grade 8 were selected based on state enrollment size and willingness to participate, as well as on their general NAEP performance (above or below the national average on NAEP), their previous experience in benchmarking to TIMSS, and their regional distribution.
Average scores of students of different races and ethnicitiesIn 2011, the average mathematics scores for U.S. White, Hispanic, Asian, and multiracial 4th-graders were higher than the TIMSS scale average, but for U.S. Black 4th-graders it was lower (figure 7). In comparison with the U.S. national average, U.S. White, Asian, and multiracial 4th-graders scored higher, on average, while U.S. Black and Hispanic 4th-graders scored lower, on average.
At grade 8, the average mathematics scores for U.S. White and Asian students were higher than both the TIMSS scale average and the U.S. national average. However, U.S. Black and Hispanic 8th-graders scored lower, on average, than the TIMSS scale average and the U.S. national average. U.S. multiracial 8th-graders’ mathematics score was higher, on average, than the TIMSS scale average but not measurably different from the U.S. national average.
Figure 7. Average mathematics scores of U.S. 4th- and 8th-grade students, by race/ethnicity: 2011
Percentage of public school students eligible for free or reduced-price lunch
Grade 8Average mathematics score
75 percentor more
Less than 10 percent
10 to 24.9percent
25 to 49.9percent
50 to 74.9percent
United States
533* 519* 498* 468*
0300400500600700
1,000
537*
75 percentor more
Percentage of public school students eligible for free or reduced-price lunch
Less than 10 percent
10 to 24.9percent
25 to 49.9percent
50 to 74.9percent
Grade 4
United States
Average mathematics score
596*525* 505*
0300400500600700
1,000
570* 557*
Multiracial
Race/ethnicity
Race/ethnicity
White Black Hispanic Asian
Grade 4
United States
Average mathematics score
559* 583* 554*
Grade 8Average mathematics score
489*
MultiracialWhite Black Hispanic Asian
United States
530*485*
568*513
0300400500600700
1,000
465*
520*
TIMSS Scale Average (500)U.S. Average (541 at grade 4; 509 at grade 8)
Key
0300400500600700
1,000
TIMSS Scale Average (500)U.S. Average (541 at grade 4; 509 at grade 8)
Key
*p<.05. Difference between score and U.S. average score is significant. NOTE: Reporting standards were not met for American Indian/Alaska Native and Native Hawaiian/Other Pacific Islander. Black includes African American, Hispanic includes Latino, and Asian includes Pacific Islander and Native Hawaiian. Racial categories exclude Hispanic origin. Students who identified themselves as being of Hispanic origin were classified as Hispanic, regardless of their race. Although data for some race/ethnicities are not shown separately because the reporting standards were not met, they are included in the U.S. and state totals shown throughout the report. See appendix A in this report for more information. The standard errors of the estimates are shown in table E-11 available at http://nces.ed.gov/pubsearch/pubsinfor.asp?pubid=2013009.SOURCE: International Association for the Evaluation of Educational Achievement (IEA), Trends in International Mathematics and Science Study (TIMSS), 2011.
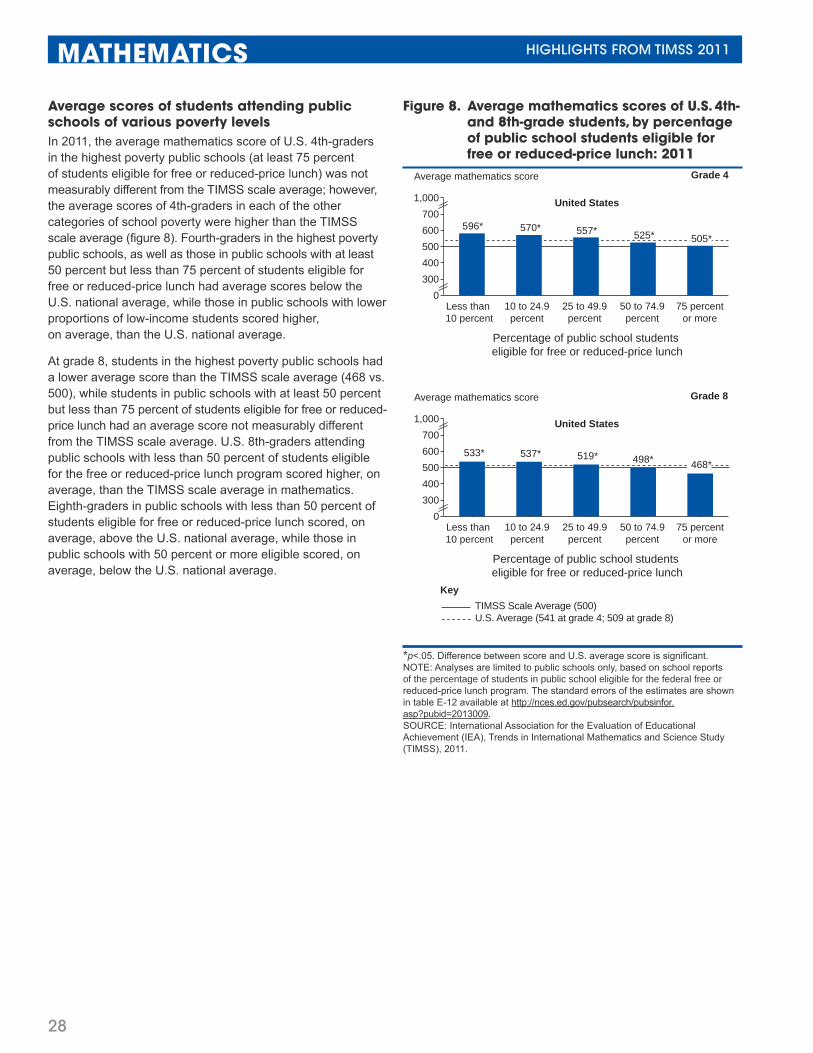
28
MATHEMATICS HIGHLIGHTS FROM TIMSS 2011
Average scores of students attending public schools of various poverty levelsIn 2011, the average mathematics score of U.S. 4th-graders in the highest poverty public schools (at least 75 percent of students eligible for free or reduced-price lunch) was not measurably different from the TIMSS scale average; however, the average scores of 4th-graders in each of the other categories of school poverty were higher than the TIMSS scale average (figure 8). Fourth-graders in the highest poverty public schools, as well as those in public schools with at least 50 percent but less than 75 percent of students eligible for free or reduced-price lunch had average scores below the U.S. national average, while those in public schools with lower proportions of low-income students scored higher, on average, than the U.S. national average.
At grade 8, students in the highest poverty public schools had a lower average score than the TIMSS scale average (468 vs. 500), while students in public schools with at least 50 percent but less than 75 percent of students eligible for free or reduced-price lunch had an average score not measurably different from the TIMSS scale average. U.S. 8th-graders attending public schools with less than 50 percent of students eligible for the free or reduced-price lunch program scored higher, on average, than the TIMSS scale average in mathematics. Eighth-graders in public schools with less than 50 percent of students eligible for free or reduced-price lunch scored, on average, above the U.S. national average, while those in public schools with 50 percent or more eligible scored, on average, below the U.S. national average.
Figure 8. Average mathematics scores of U.S. 4th- and 8th-grade students, by percentage of public school students eligible for free or reduced-price lunch: 2011
Percentage of public school students eligible for free or reduced-price lunch
Grade 8Average mathematics score
75 percentor more
Less than 10 percent
10 to 24.9percent
25 to 49.9percent
50 to 74.9percent
United States
533* 519* 498* 468*
0300400500600700
1,000
537*
75 percentor more
Percentage of public school students eligible for free or reduced-price lunch
Less than 10 percent
10 to 24.9percent
25 to 49.9percent
50 to 74.9percent
Grade 4
United States
Average mathematics score
596*525* 505*
0300400500600700
1,000
570* 557*
Multiracial
Race/ethnicity
Race/ethnicity
White Black Hispanic Asian
Grade 4
United States
Average mathematics score
559* 583* 554*
Grade 8Average mathematics score
489*
MultiracialWhite Black Hispanic Asian
United States
530*485*
568*513
0300400500600700
1,000
465*
520*
TIMSS Scale Average (500)U.S. Average (541 at grade 4; 509 at grade 8)
Key
0300400500600700
1,000
TIMSS Scale Average (500)U.S. Average (541 at grade 4; 509 at grade 8)
Key
*p<.05. Difference between score and U.S. average score is significant.NOTE: Analyses are limited to public schools only, based on school reports of the percentage of students in public school eligible for the federal free or reduced-price lunch program. The standard errors of the estimates are shown in table E-12 available at http://nces.ed.gov/pubsearch/pubsinfor.asp?pubid=2013009.SOURCE: International Association for the Evaluation of Educational Achievement (IEA), Trends in International Mathematics and Science Study (TIMSS), 2011.
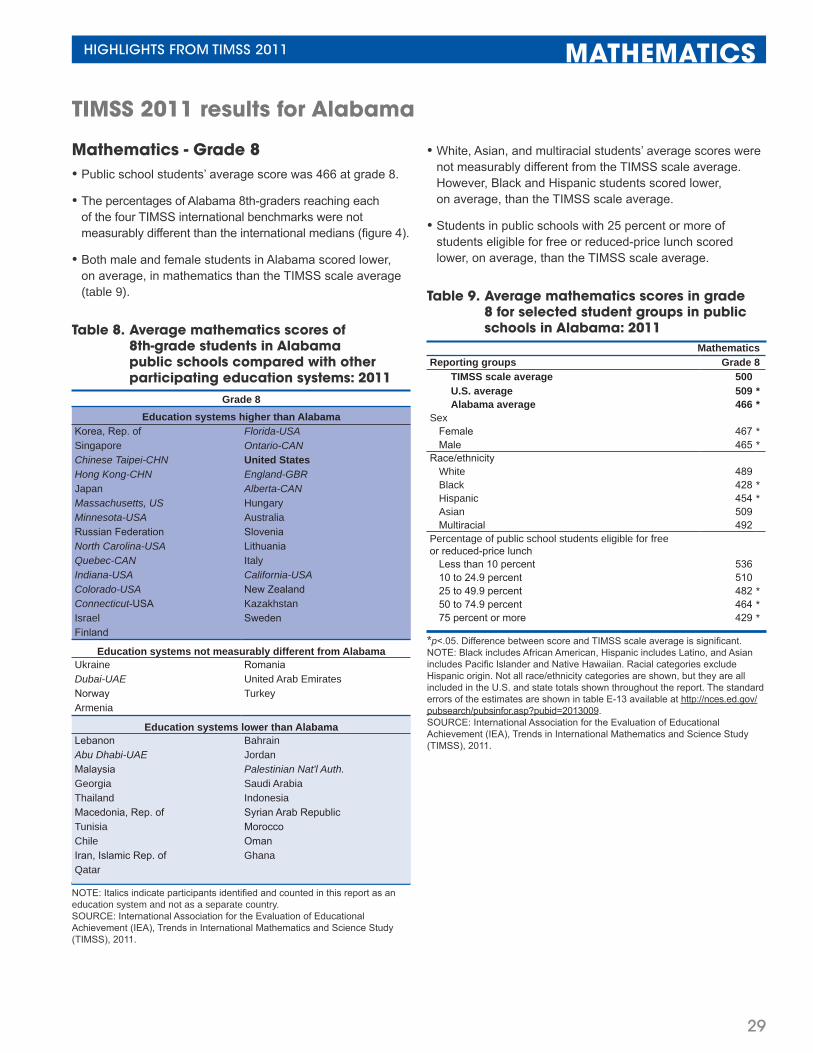
29
HIGHLIGHTS FROM TIMSS 2011 MATHEMATICS
TIMSS 2011 results for Alabama
Mathematics - Grade 8• Public school students’ average score was 466 at grade 8.
• The percentages of Alabama 8th-graders reaching eachof the four TIMSS international benchmarks were notmeasurably different than the international medians (figure 4).
• Both male and female students in Alabama scored lower,on average, in mathematics than the TIMSS scale average(table 9).
Table 8. Average mathematics scores of 8th-grade students in Alabama public schools compared with other participating education systems: 2011
Grade 8Education systems higher than Alabama
Korea, Rep. of Florida-USA Singapore Ontario-CAN Chinese Taipei-CHN United States Hong Kong-CHN England-GBR Japan Alberta-CANMassachusetts, US Hungary Minnesota-USA Australia Russian Federation Slovenia North Carolina-USA Lithuania Quebec-CAN Italy Indiana-USA California-USA Colorado-USA New Zealand Connecticut-USA Kazakhstan Israel SwedenFinland
Education systems not measurably different from AlabamaUkraine Romania Dubai-UAE United Arab Emirates Norway Turkey Armenia
Education systems lower than AlabamaLebanon Bahrain Abu Dhabi-UAE Jordan Malaysia Palestinian Nat'l Auth. Georgia Saudi Arabia Thailand Indonesia Macedonia, Rep. of Syrian Arab Republic Tunisia Morocco Chile Oman Iran, Islamic Rep. of Ghana Qatar
NOTE: Italics indicate participants identified and counted in this report as an education system and not as a separate country.SOURCE: International Association for the Evaluation of Educational Achievement (IEA), Trends in International Mathematics and Science Study (TIMSS), 2011.
• White, Asian, and multiracial students’ average scores werenot measurably different from the TIMSS scale average.However, Black and Hispanic students scored lower,on average, than the TIMSS scale average.
• Students in public schools with 25 percent or more ofstudents eligible for free or reduced-price lunch scoredlower, on average, than the TIMSS scale average.
Table 9. Average mathematics scores in grade 8 for selected student groups in public schools in Alabama: 2011
MathematicsReporting groups Grade 8
TIMSS scale average 500U.S. average 509 *Alabama average 466 *
SexFemale 467 *Male 465 *
Race/ethnicityWhite 489Black 428 *Hispanic 454 *Asian 509Multiracial 492
Percentage of public school students eligible for free or reduced-price lunch
Less than 10 percent 53610 to 24.9 percent 51025 to 49.9 percent 482 *50 to 74.9 percent 464 *75 percent or more 429 *
*p<.05. Difference between score and TIMSS scale average is significant.NOTE: Black includes African American, Hispanic includes Latino, and Asian includes Pacific Islander and Native Hawaiian. Racial categories exclude Hispanic origin. Not all race/ethnicity categories are shown, but they are all included in the U.S. and state totals shown throughout the report. The standard errors of the estimates are shown in table E-13 available at http://nces.ed.gov/pubsearch/pubsinfor.asp?pubid=2013009.SOURCE: International Association for the Evaluation of Educational Achievement (IEA), Trends in International Mathematics and Science Study (TIMSS), 2011.
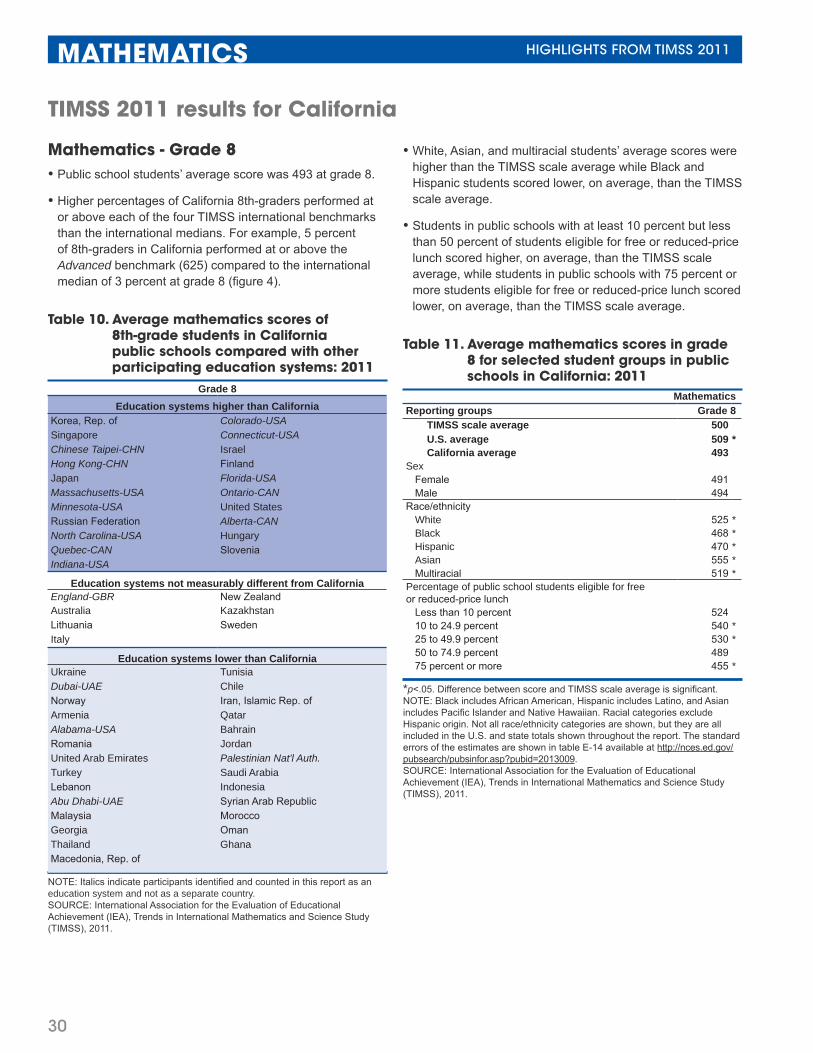
30
MATHEMATICS HIGHLIGHTS FROM TIMSS 2011
TIMSS 2011 results for California
Mathematics - Grade 8Public school students’ average score was 493 at grade 8.
Higher percentages of California 8th-graders performed at or above each of the four TIMSS international benchmarks than the international medians. For example, 5 percent of 8th-graders in California performed at or above the Advanced benchmark (625) compared to the international median of 3 percent at grade 8 (figure 4).
White, Asian, and multiracial students’ average scores were higher than the TIMSS scale average while Black and Hispanic students scored lower, on average, than the TIMSS scale average.
Students in public schools with at least 10 percent but less than 50 percent of students eligible for free or reduced-price lunch scored higher, on average, than the TIMSS scale average, while students in public schools with 75 percent or more students eligible for free or reduced-price lunch scored lower, on average, than the TIMSS scale average.
Table 10. Average mathematics scores of 8th-grade students in California public schools compared with other participating education systems: 2011
Grade 8Education systems higher than California
Korea, Rep. of Colorado-USA Singapore Connecticut-USA Chinese Taipei-CHN Israel Hong Kong-CHN Finland Japan Florida-USA Massachusetts-USA Ontario-CAN Minnesota-USA United States Russian Federation Alberta-CANNorth Carolina-USA Hungary Quebec-CAN Slovenia Indiana-USA
Education systems not measurably different from CaliforniaEngland-GBR New Zealand Australia Kazakhstan Lithuania Sweden Italy
Education systems lower than CaliforniaUkraine Tunisia Dubai-UAE Chile Norway Iran, Islamic Rep. of Armenia Qatar Alabama-USA Bahrain Romania Jordan United Arab Emirates Palestinian Nat'l Auth. Turkey Saudi Arabia Lebanon Indonesia Abu Dhabi-UAE Syrian Arab Republic Malaysia Morocco Georgia Oman Thailand Ghana Macedonia, Rep. of
NOTE: Italics indicate participants identified and counted in this report as an education system and not as a separate country.SOURCE: International Association for the Evaluation of Educational Achievement (IEA), Trends in International Mathematics and Science Study (TIMSS), 2011.
Table 11. Average mathematics scores in grade 8 for selected student groups in public schools in California: 2011
MathematicsReporting groups Grade 8
TIMSS scale average 500U.S. average 509 *California average 493
SexFemale 491Male 494
Race/ethnicityWhite 525 *Black 468 *Hispanic 470 *Asian 555 *Multiracial 519 *
Percentage of public school students eligible for free or reduced-price lunch
Less than 10 percent 52410 to 24.9 percent 540 *25 to 49.9 percent 530 *50 to 74.9 percent 48975 percent or more 455 *
*p<.05. Difference between score and TIMSS scale average is significant.NOTE: Black includes African American, Hispanic includes Latino, and Asian includes Pacific Islander and Native Hawaiian. Racial categories exclude Hispanic origin. Not all race/ethnicity categories are shown, but they are all included in the U.S. and state totals shown throughout the report. The standard errors of the estimates are shown in table E-14 available at http://nces.ed.gov/pubsearch/pubsinfor.asp?pubid=2013009.SOURCE: International Association for the Evaluation of Educational Achievement (IEA), Trends in International Mathematics and Science Study (TIMSS), 2011.
•
•
•
•
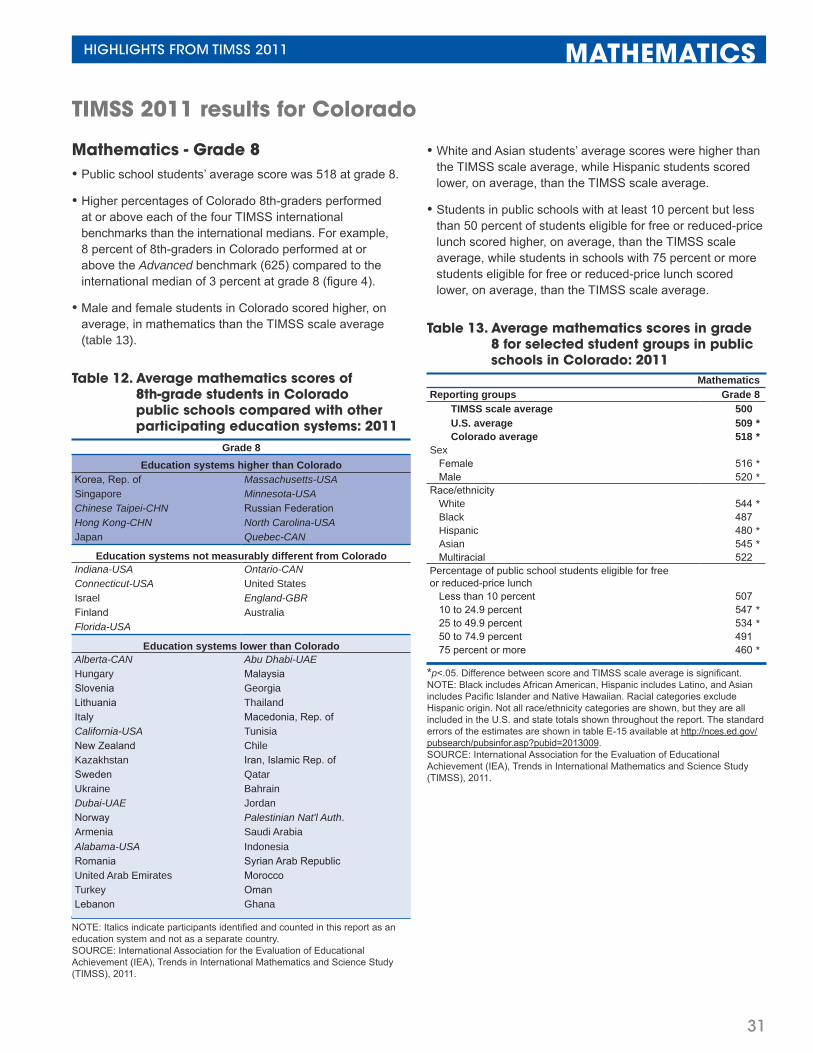
31
HIGHLIGHTS FROM TIMSS 2011 MATHEMATICS
TIMSS 2011 results for Colorado
Mathematics - Grade 8• Public school students’ average score was 518 at grade 8.
• Higher percentages of Colorado 8th-graders performedat or above each of the four TIMSS internationalbenchmarks than the international medians. For example, 8 percent of 8th-graders in Colorado performed at orabove the Advanced benchmark (625) compared to theinternational median of 3 percent at grade 8 (figure 4).
• Male and female students in Colorado scored higher, onaverage, in mathematics than the TIMSS scale average(table 13).
Table 12. Average mathematics scores of 8th-grade students in Colorado public schools compared with other participating education systems: 2011
Grade 8Education systems higher than Colorado
Korea, Rep. of Massachusetts-USA Singapore Minnesota-USA Chinese Taipei-CHN Russian Federation Hong Kong-CHN North Carolina-USAJapan Quebec-CAN
Education systems not measurably different from ColoradoIndiana-USA Ontario-CAN Connecticut-USA United States Israel England-GBR Finland Australia Florida-USA
Education systems lower than ColoradoAlberta-CAN Abu Dhabi-UAE Hungary Malaysia Slovenia Georgia Lithuania Thailand Italy Macedonia, Rep. of California-USA Tunisia New Zealand Chile Kazakhstan Iran, Islamic Rep. of Sweden Qatar Ukraine Bahrain Dubai-UAE Jordan Norway Palestinian Nat'l Auth. Armenia Saudi Arabia Alabama-USA Indonesia Romania Syrian Arab Republic United Arab Emirates Morocco Turkey Oman Lebanon Ghana
NOTE: Italics indicate participants identified and counted in this report as an education system and not as a separate country.SOURCE: International Association for the Evaluation of Educational Achievement (IEA), Trends in International Mathematics and Science Study (TIMSS), 2011.
• White and Asian students’ average scores were higher thanthe TIMSS scale average, while Hispanic students scoredlower, on average, than the TIMSS scale average.
• Students in public schools with at least 10 percent but lessthan 50 percent of students eligible for free or reduced-pricelunch scored higher, on average, than the TIMSS scaleaverage, while students in schools with 75 percent or morestudents eligible for free or reduced-price lunch scoredlower, on average, than the TIMSS scale average.
Table 13. Average mathematics scores in grade 8 for selected student groups in public schools in Colorado: 2011
MathematicsReporting groups Grade 8
TIMSS scale average 500U.S. average 509 *Colorado average 518 *
SexFemale 516 *Male 520 *
Race/ethnicityWhite 544 *Black 487Hispanic 480 *Asian 545 *Multiracial 522
Percentage of public school students eligible for free or reduced-price lunch
Less than 10 percent 50710 to 24.9 percent 547 *25 to 49.9 percent 534 *50 to 74.9 percent 49175 percent or more 460 *
*p<.05. Difference between score and TIMSS scale average is significant.NOTE: Black includes African American, Hispanic includes Latino, and Asian includes Pacific Islander and Native Hawaiian. Racial categories exclude Hispanic origin. Not all race/ethnicity categories are shown, but they are all included in the U.S. and state totals shown throughout the report. The standard errors of the estimates are shown in table E-15 available at http://nces.ed.gov/pubsearch/pubsinfor.asp?pubid=2013009.SOURCE: International Association for the Evaluation of Educational Achievement (IEA), Trends in International Mathematics and Science Study (TIMSS), 2011.
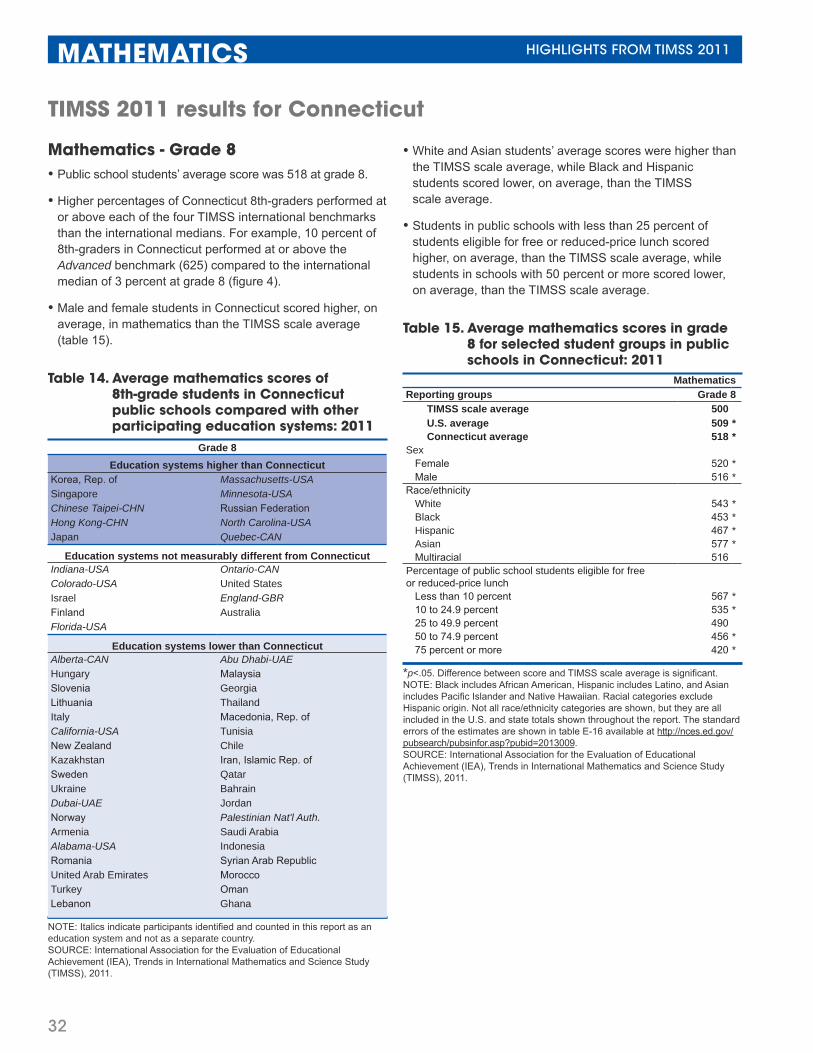
32
MATHEMATICS HIGHLIGHTS FROM TIMSS 2011
TIMSS 2011 results for Connecticut
Mathematics - Grade 8• Public school students’ average score was 518 at grade 8.
• Higher percentages of Connecticut 8th-graders performed ator above each of the four TIMSS international benchmarksthan the international medians. For example, 10 percent of8th-graders in Connecticut performed at or above theAdvanced benchmark (625) compared to the internationalmedian of 3 percent at grade 8 (figure 4).
• Male and female students in Connecticut scored higher, onaverage, in mathematics than the TIMSS scale average(table 15).
Table 14. Average mathematics scores of 8th-grade students in Connecticut public schools compared with other participating education systems: 2011
Grade 8Education systems higher than Connecticut
Korea, Rep. of Massachusetts-USA Singapore Minnesota-USA Chinese Taipei-CHN Russian Federation Hong Kong-CHN North Carolina-USA Japan Quebec-CAN
Education systems not measurably different from ConnecticutIndiana-USA Ontario-CANColorado-USA United States Israel England-GBRFinland Australia Florida-USA
Education systems lower than ConnecticutAlberta-CAN Abu Dhabi-UAE Hungary Malaysia Slovenia Georgia Lithuania Thailand Italy Macedonia, Rep. of California-USA Tunisia New Zealand Chile Kazakhstan Iran, Islamic Rep. of Sweden Qatar Ukraine Bahrain Dubai-UAE Jordan Norway Palestinian Nat'l Auth. Armenia Saudi Arabia Alabama-USA Indonesia Romania Syrian Arab Republic United Arab Emirates Morocco Turkey Oman Lebanon Ghana
NOTE: Italics indicate participants identified and counted in this report as an education system and not as a separate country.SOURCE: International Association for the Evaluation of Educational Achievement (IEA), Trends in International Mathematics and Science Study (TIMSS), 2011.
• White and Asian students’ average scores were higher thanthe TIMSS scale average, while Black and Hispanicstudents scored lower, on average, than the TIMSSscale average.
• Students in public schools with less than 25 percent ofstudents eligible for free or reduced-price lunch scoredhigher, on average, than the TIMSS scale average, whilestudents in schools with 50 percent or more scored lower,on average, than the TIMSS scale average.
Table 15. Average mathematics scores in grade 8 for selected student groups in public schools in Connecticut: 2011
MathematicsReporting groups Grade 8
TIMSS scale average 500U.S. average 509 *Connecticut average 518 *
SexFemale 520 *Male 516 *
Race/ethnicityWhite 543 *Black 453 *Hispanic 467 *Asian 577 *Multiracial 516
Percentage of public school students eligible for free or reduced-price lunch
Less than 10 percent 567 *10 to 24.9 percent 535 *25 to 49.9 percent 49050 to 74.9 percent 456 *75 percent or more 420 *
*p<.05. Difference between score and TIMSS scale average is significant.NOTE: Black includes African American, Hispanic includes Latino, and Asian includes Pacific Islander and Native Hawaiian. Racial categories exclude Hispanic origin. Not all race/ethnicity categories are shown, but they are all included in the U.S. and state totals shown throughout the report. The standard errors of the estimates are shown in table E-16 available at http://nces.ed.gov/pubsearch/pubsinfor.asp?pubid=2013009.SOURCE: International Association for the Evaluation of Educational Achievement (IEA), Trends in International Mathematics and Science Study (TIMSS), 2011.
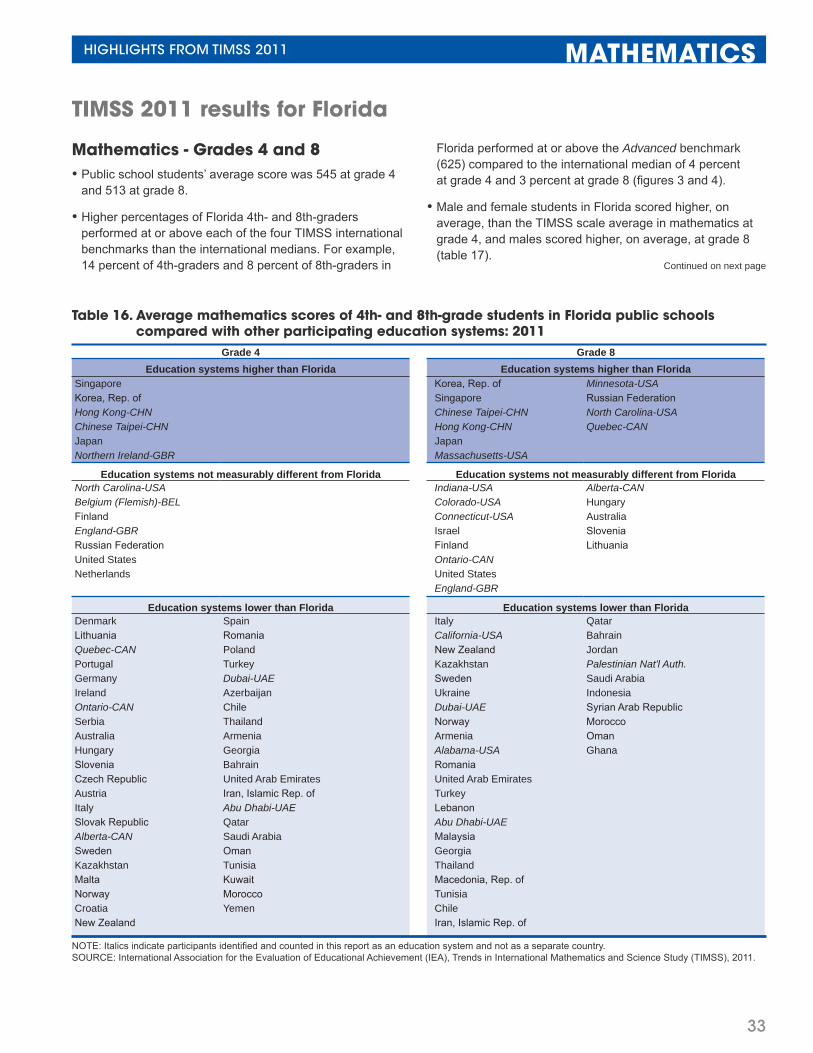
33
HIGHLIGHTS FROM TIMSS 2011 MATHEMATICS
TIMSS 2011 results for Florida
Mathematics - Grades 4 and 8• Public school students’ average score was 545 at grade 4
and 513 at grade 8.
• Higher percentages of Florida 4th- and 8th-graders performed at or above each of the four TIMSS international benchmarks than the international medians. For example, 14 percent of 4th-graders and 8 percent of 8th-graders in
Florida performed at or above the Advanced benchmark (625) compared to the international median of 4 percent at grade 4 and 3 percent at grade 8 (figures 3 and 4).
• Male and female students in Florida scored higher, on average, than the TIMSS scale average in mathematics at grade 4, and males scored higher, on average, at grade 8 (table 17).
Continued on next page
Table 16. Average mathematics scores of 4th- and 8th-grade students in Florida public schools compared with other participating education systems: 2011
Grade 4Education systems higher than Florida
Singapore Korea, Rep. of Hong Kong-CHNChinese Taipei-CHNJapan Northern Ireland-GBR
Education systems not measurably different from FloridaNorth Carolina-USABelgium (Flemish)-BEL Finland England-GBR Russian Federation United States Netherlands
Education systems lower than FloridaDenmark Spain Lithuania Romania Quebec-CAN Poland Portugal Turkey Germany Dubai-UAE Ireland Azerbaijan Ontario-CAN Chile Serbia Thailand Australia Armenia Hungary Georgia Slovenia Bahrain Czech Republic United Arab Emirates Austria Iran, Islamic Rep. of Italy Abu Dhabi-UAE Slovak Republic Qatar Alberta-CAN Saudi Arabia Sweden Oman Kazakhstan Tunisia Malta Kuwait Norway Morocco Croatia YemenNew Zealand
Grade 8Education systems higher than Florida
Korea, Rep. of Minnesota-USA Singapore Russian Federation Chinese Taipei-CHN North Carolina-USA Hong Kong-CHN Quebec-CAN Japan Massachusetts-USA
Education systems not measurably different from FloridaIndiana-USA Alberta-CANColorado-USA Hungary Connecticut-USA Australia Israel Slovenia Finland Lithuania Ontario-CAN United States England-GBR
Education systems lower than FloridaItaly Qatar California-USA Bahrain New Zealand Jordan Kazakhstan Palestinian Nat'l Auth. Sweden Saudi Arabia Ukraine Indonesia Dubai-UAE Syrian Arab Republic Norway Morocco Armenia Oman Alabama-USA Ghana Romania United Arab Emirates Turkey Lebanon Abu Dhabi-UAE Malaysia Georgia Thailand Macedonia, Rep. of Tunisia Chile Iran, Islamic Rep. of
NOTE: Italics indicate participants identified and counted in this report as an education system and not as a separate country.SOURCE: International Association for the Evaluation of Educational Achievement (IEA), Trends in International Mathematics and Science Study (TIMSS), 2011.
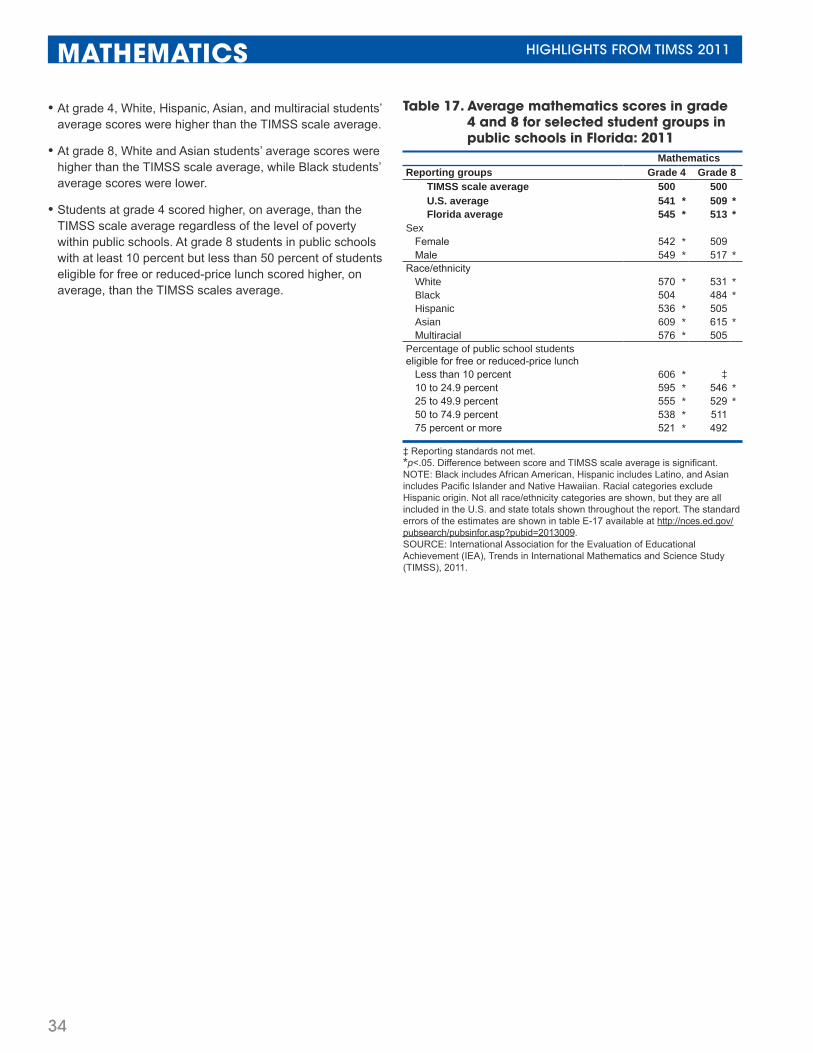
34
MATHEMATICS HIGHLIGHTS FROM TIMSS 2011
• At grade 4, White, Hispanic, Asian, and multiracial students’average scores were higher than the TIMSS scale average.
• At grade 8, White and Asian students’ average scores werehigher than the TIMSS scale average, while Black students’average scores were lower.
• Students at grade 4 scored higher, on average, than theTIMSS scale average regardless of the level of povertywithin public schools. At grade 8 students in public schoolswith at least 10 percent but less than 50 percent of studentseligible for free or reduced-price lunch scored higher, onaverage, than the TIMSS scales average.
Table 17. Average mathematics scores in grade 4 and 8 for selected student groups in public schools in Florida: 2011
MathematicsReporting groups Grade 4 Grade 8
TIMSS scale average 500 500U.S. average 541 * 509 *Florida average 545 * 513 *
SexFemale 542 * 509Male 549 * 517 *
Race/ethnicityWhite 570 * 531 *Black 504 484 *Hispanic 536 * 505Asian 609 * 615 *Multiracial 576 * 505
Percentage of public school students eligible for free or reduced-price lunch
Less than 10 percent 606 * ‡10 to 24.9 percent 595 * 546 *25 to 49.9 percent 555 * 529 *50 to 74.9 percent 538 * 51175 percent or more 521 * 492
‡ Reporting standards not met.*p<.05. Difference between score and TIMSS scale average is significant.NOTE: Black includes African American, Hispanic includes Latino, and Asian includes Pacific Islander and Native Hawaiian. Racial categories exclude Hispanic origin. Not all race/ethnicity categories are shown, but they are all included in the U.S. and state totals shown throughout the report. The standard errors of the estimates are shown in table E-17 available at http://nces.ed.gov/pubsearch/pubsinfor.asp?pubid=2013009.SOURCE: International Association for the Evaluation of Educational Achievement (IEA), Trends in International Mathematics and Science Study (TIMSS), 2011.
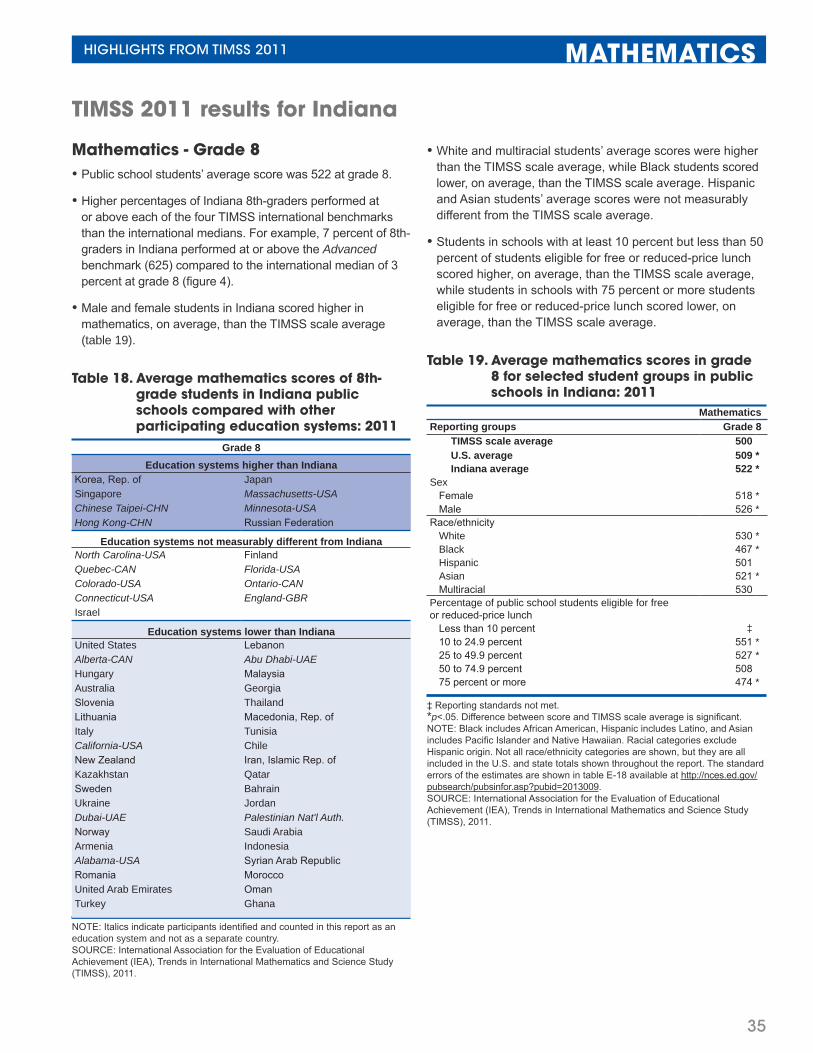
35
HIGHLIGHTS FROM TIMSS 2011 MATHEMATICS
TIMSS 2011 results for Indiana
Mathematics - Grade 8• Public school students’ average score was 522 at grade 8.
• Higher percentages of Indiana 8th-graders performed at or above each of the four TIMSS international benchmarksthan the international medians. For example, 7 percent of 8th-graders in Indiana performed at or above the Advancedbenchmark (625) compared to the international median of 3percent at grade 8 (figure 4).
• Male and female students in Indiana scored higher in mathematics, on average, than the TIMSS scale average(table 19).
Table 18. Average mathematics scores of 8th-grade students in Indiana public schools compared with other participating education systems: 2011
Grade 8Education systems higher than Indiana
Korea, Rep. of Japan Singapore Massachusetts-USA Chinese Taipei-CHN Minnesota-USA Hong Kong-CHN Russian Federation
Education systems not measurably different from IndianaNorth Carolina-USA Finland Quebec-CAN Florida-USA Colorado-USA Ontario-CAN Connecticut-USA England-GBR Israel
Education systems lower than IndianaUnited States Lebanon Alberta-CAN Abu Dhabi-UAE Hungary Malaysia Australia Georgia Slovenia Thailand Lithuania Macedonia, Rep. of Italy Tunisia California-USA Chile New Zealand Iran, Islamic Rep. of Kazakhstan Qatar Sweden Bahrain Ukraine Jordan Dubai-UAE Palestinian Nat'l Auth. Norway Saudi Arabia Armenia Indonesia Alabama-USA Syrian Arab Republic Romania Morocco United Arab Emirates Oman Turkey Ghana
NOTE: Italics indicate participants identified and counted in this report as an education system and not as a separate country.SOURCE: International Association for the Evaluation of Educational Achievement (IEA), Trends in International Mathematics and Science Study (TIMSS), 2011.
• White and multiracial students’ average scores were higherthan the TIMSS scale average, while Black students scoredlower, on average, than the TIMSS scale average. Hispanicand Asian students’ average scores were not measurablydifferent from the TIMSS scale average.
• Students in schools with at least 10 percent but less than 50percent of students eligible for free or reduced-price lunchscored higher, on average, than the TIMSS scale average,while students in schools with 75 percent or more studentseligible for free or reduced-price lunch scored lower, onaverage, than the TIMSS scale average.
Table 19. Average mathematics scores in grade 8 for selected student groups in public schools in Indiana: 2011
MathematicsReporting groups Grade 8
TIMSS scale average 500U.S. average 509 *Indiana average 522 *
SexFemale 518 *Male 526 *
Race/ethnicityWhite 530 *Black 467 *Hispanic 501Asian 521 *Multiracial 530
Percentage of public school students eligible for free or reduced-price lunch
Less than 10 percent ‡10 to 24.9 percent 551 *25 to 49.9 percent 527 *50 to 74.9 percent 50875 percent or more 474 *
‡ Reporting standards not met.*p<.05. Difference between score and TIMSS scale average is significant.NOTE: Black includes African American, Hispanic includes Latino, and Asian includes Pacific Islander and Native Hawaiian. Racial categories exclude Hispanic origin. Not all race/ethnicity categories are shown, but they are all included in the U.S. and state totals shown throughout the report. The standard errors of the estimates are shown in table E-18 available at http://nces.ed.gov/pubsearch/pubsinfor.asp?pubid=2013009.SOURCE: International Association for the Evaluation of Educational Achievement (IEA), Trends in International Mathematics and Science Study (TIMSS), 2011.
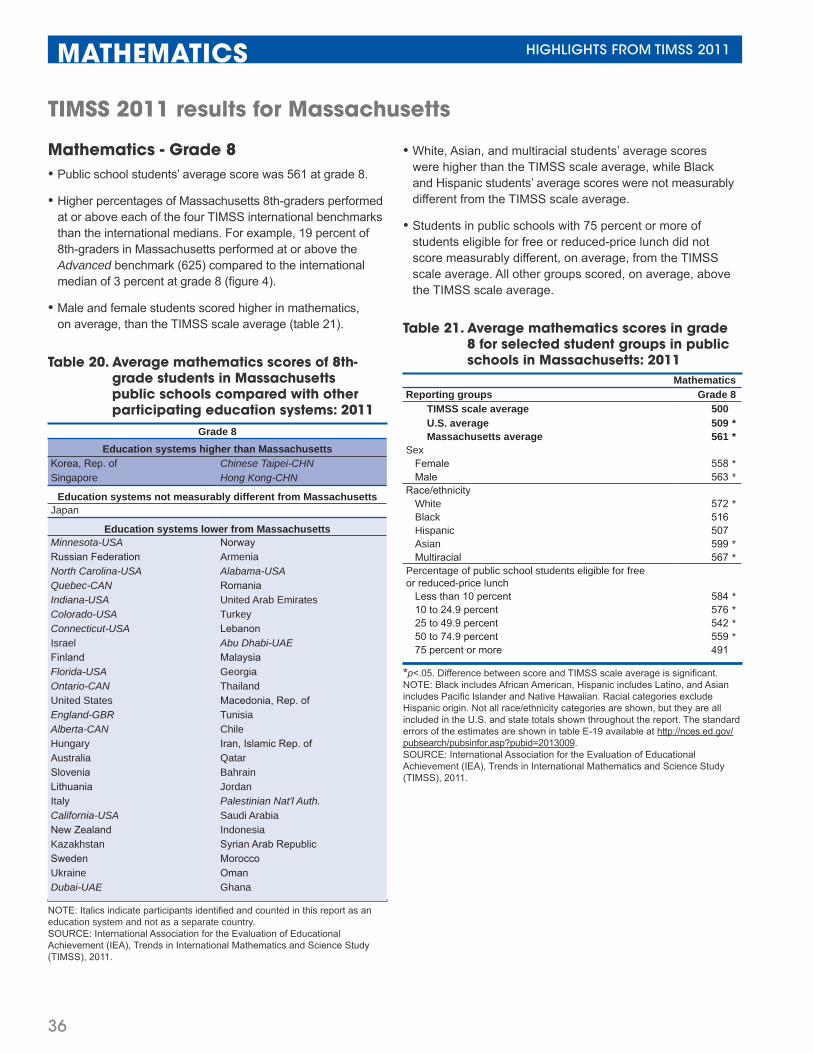
36
MATHEMATICS HIGHLIGHTS FROM TIMSS 2011
TIMSS 2011 results for Massachusetts
Mathematics - Grade 8• Public school students’ average score was 561 at grade 8.
• Higher percentages of Massachusetts 8th-graders performedat or above each of the four TIMSS international benchmarksthan the international medians. For example, 19 percent of 8th-graders in Massachusetts performed at or above the Advanced benchmark (625) compared to the international median of 3 percent at grade 8 (figure 4).
• Male and female students scored higher in mathematics,on average, than the TIMSS scale average (table 21).
Table 20. Average mathematics scores of 8th-grade students in Massachusetts public schools compared with other participating education systems: 2011
Grade 8Education systems higher than Massachusetts
Korea, Rep. of Chinese Taipei-CHNSingapore Hong Kong-CHN
Education systems not measurably different from MassachusettsJapan
Education systems lower from MassachusettsMinnesota-USA Norway Russian Federation Armenia North Carolina-USA Alabama-USA Quebec-CAN Romania Indiana-USA United Arab Emirates Colorado-USA Turkey Connecticut-USA Lebanon Israel Abu Dhabi-UAE Finland Malaysia Florida-USA Georgia Ontario-CAN Thailand United States Macedonia, Rep. of England-GBR Tunisia Alberta-CAN Chile Hungary Iran, Islamic Rep. of Australia Qatar Slovenia Bahrain Lithuania Jordan Italy Palestinian Nat'l Auth. California-USA Saudi Arabia New Zealand Indonesia Kazakhstan Syrian Arab Republic Sweden Morocco Ukraine Oman Dubai-UAE Ghana
NOTE: Italics indicate participants identified and counted in this report as an education system and not as a separate country.SOURCE: International Association for the Evaluation of Educational Achievement (IEA), Trends in International Mathematics and Science Study (TIMSS), 2011.
• White, Asian, and multiracial students’ average scoreswere higher than the TIMSS scale average, while Blackand Hispanic students’ average scores were not measurablydifferent from the TIMSS scale average.
• Students in public schools with 75 percent or more ofstudents eligible for free or reduced-price lunch did notscore measurably different, on average, from the TIMSSscale average. All other groups scored, on average, abovethe TIMSS scale average.
Table 21. Average mathematics scores in grade 8 for selected student groups in public schools in Massachusetts: 2011
MathematicsReporting groups Grade 8
TIMSS scale average 500U.S. average 509 *Massachusetts average 561 *
SexFemale 558 *Male 563 *
Race/ethnicityWhite 572 *Black 516Hispanic 507Asian 599 *Multiracial 567 *
Percentage of public school students eligible for free or reduced-price lunch
Less than 10 percent 584 *10 to 24.9 percent 576 *25 to 49.9 percent 542 *50 to 74.9 percent 559 *75 percent or more 491
*p<.05. Difference between score and TIMSS scale average is significant.NOTE: Black includes African American, Hispanic includes Latino, and Asian includes Pacific Islander and Native Hawaiian. Racial categories exclude Hispanic origin. Not all race/ethnicity categories are shown, but they are all included in the U.S. and state totals shown throughout the report. The standard errors of the estimates are shown in table E-19 available at http://nces.ed.gov/pubsearch/pubsinfor.asp?pubid=2013009.SOURCE: International Association for the Evaluation of Educational Achievement (IEA), Trends in International Mathematics and Science Study (TIMSS), 2011.
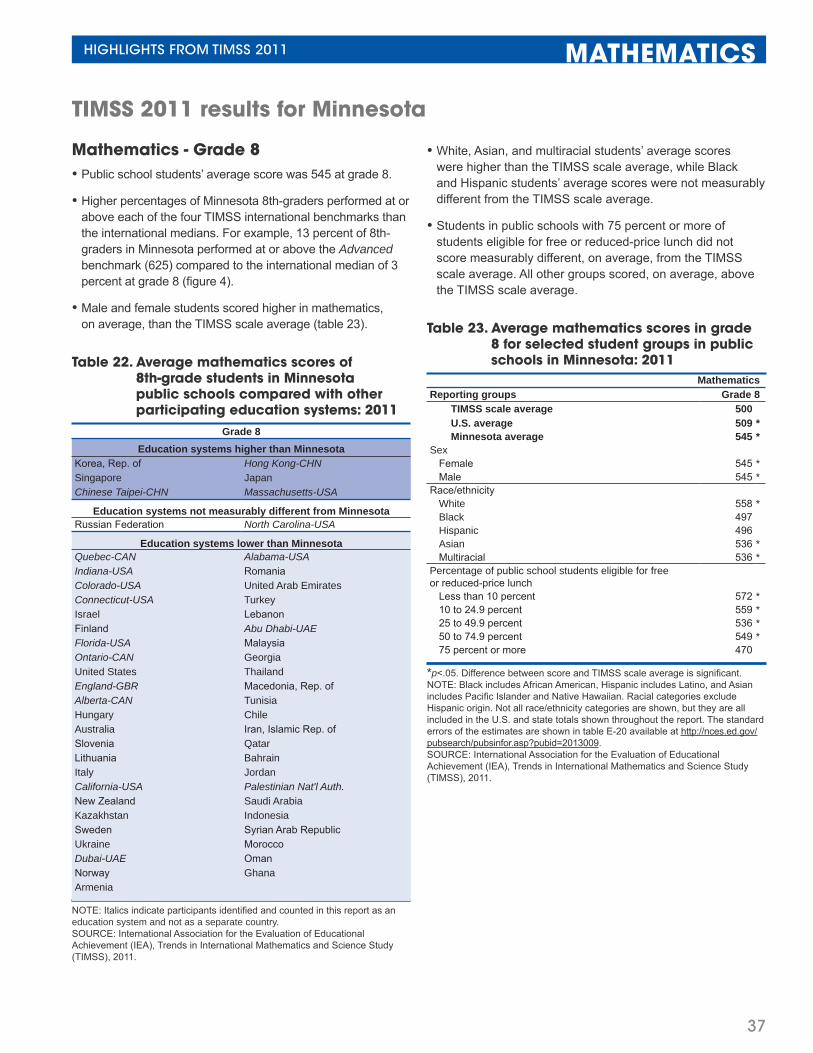
37
HIGHLIGHTS FROM TIMSS 2011 MATHEMATICS
TIMSS 2011 results for Minnesota
Mathematics - Grade 8• Public school students’ average score was 545 at grade 8.
• Higher percentages of Minnesota 8th-graders performed at or above each of the four TIMSS international benchmarks thanthe international medians. For example, 13 percent of 8th-graders in Minnesota performed at or above the Advancedbenchmark (625) compared to the international median of 3 percent at grade 8 (figure 4).
• Male and female students scored higher in mathematics,on average, than the TIMSS scale average (table 23).
Table 22. Average mathematics scores of 8th-grade students in Minnesota public schools compared with other participating education systems: 2011
Grade 8Education systems higher than Minnesota
Korea, Rep. of Hong Kong-CHNSingapore Japan Chinese Taipei-CHN Massachusetts-USA
Education systems not measurably different from MinnesotaRussian Federation North Carolina-USA
Education systems lower than MinnesotaQuebec-CAN Alabama-USA Indiana-USA Romania Colorado-USA United Arab Emirates Connecticut-USA Turkey Israel Lebanon Finland Abu Dhabi-UAE Florida-USA Malaysia Ontario-CAN Georgia United States Thailand England-GBR Macedonia, Rep. of Alberta-CAN Tunisia Hungary Chile Australia Iran, Islamic Rep. of Slovenia Qatar Lithuania Bahrain Italy Jordan California-USA Palestinian Nat'l Auth. New Zealand Saudi Arabia Kazakhstan Indonesia Sweden Syrian Arab Republic Ukraine Morocco Dubai-UAE Oman Norway Ghana Armenia
NOTE: Italics indicate participants identified and counted in this report as an education system and not as a separate country.SOURCE: International Association for the Evaluation of Educational Achievement (IEA), Trends in International Mathematics and Science Study (TIMSS), 2011.
• White, Asian, and multiracial students’ average scoreswere higher than the TIMSS scale average, while Blackand Hispanic students’ average scores were not measurablydifferent from the TIMSS scale average.
• Students in public schools with 75 percent or more ofstudents eligible for free or reduced-price lunch did notscore measurably different, on average, from the TIMSSscale average. All other groups scored, on average, abovethe TIMSS scale average.
Table 23. Average mathematics scores in grade 8 for selected student groups in public schools in Minnesota: 2011
MathematicsReporting groups Grade 8
TIMSS scale average 500U.S. average 509 *Minnesota average 545 *
SexFemale 545 *Male 545 *
Race/ethnicityWhite 558 *Black 497Hispanic 496Asian 536 *Multiracial 536 *
Percentage of public school students eligible for free or reduced-price lunch
Less than 10 percent 572 *10 to 24.9 percent 559 *25 to 49.9 percent 536 *50 to 74.9 percent 549 *75 percent or more 470
*p<.05. Difference between score and TIMSS scale average is significant.NOTE: Black includes African American, Hispanic includes Latino, and Asian includes Pacific Islander and Native Hawaiian. Racial categories exclude Hispanic origin. Not all race/ethnicity categories are shown, but they are all included in the U.S. and state totals shown throughout the report. The standard errors of the estimates are shown in table E-20 available at http://nces.ed.gov/pubsearch/pubsinfor.asp?pubid=2013009.SOURCE: International Association for the Evaluation of Educational Achievement (IEA), Trends in International Mathematics and Science Study (TIMSS), 2011.
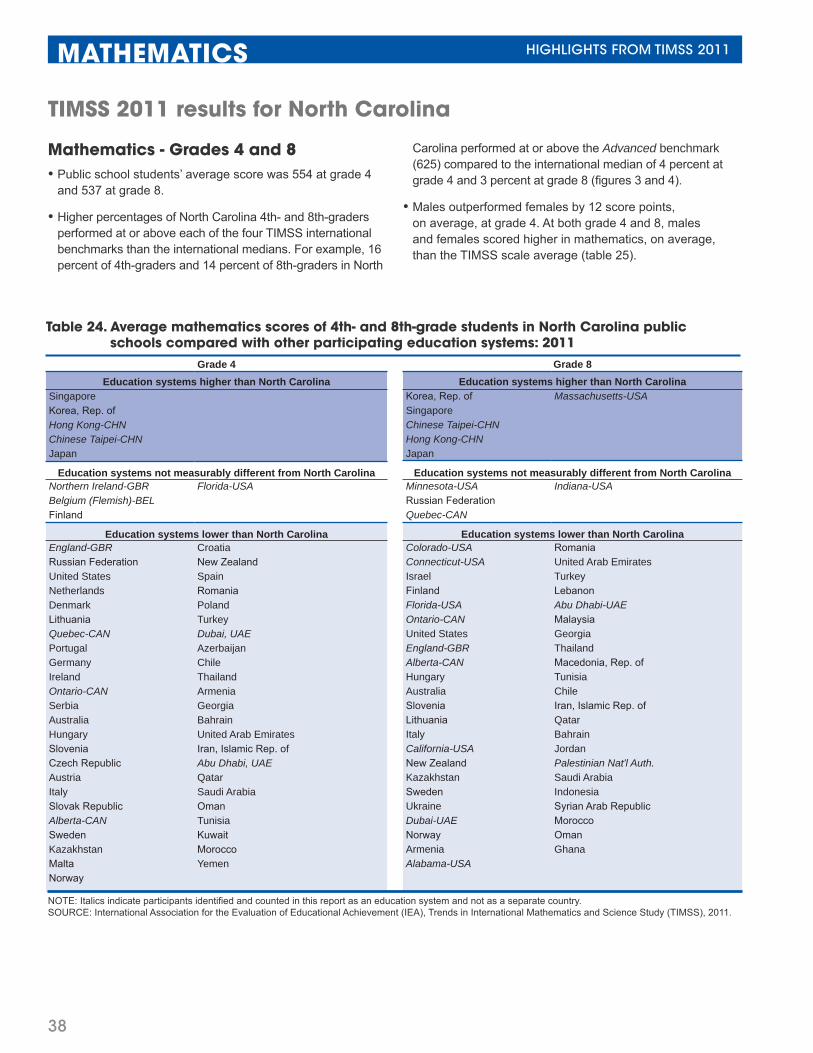
38
MATHEMATICS HIGHLIGHTS FROM TIMSS 2011
TIMSS 2011 results for North Carolina
Mathematics - Grades 4 and 8• Public school students’ average score was 554 at grade 4
and 537 at grade 8.
• Higher percentages of North Carolina 4th- and 8th-graders performed at or above each of the four TIMSS international benchmarks than the international medians. For example, 16 percent of 4th-graders and 14 percent of 8th-graders in North
Carolina performed at or above the Advanced benchmark (625) compared to the international median of 4 percent at grade 4 and 3 percent at grade 8 (figures 3 and 4).
• Males outperformed females by 12 score points, on average, at grade 4. At both grade 4 and 8, males and females scored higher in mathematics, on average, than the TIMSS scale average (table 25).
Table 24. Average mathematics scores of 4th- and 8th-grade students in North Carolina public schools compared with other participating education systems: 2011
Grade 4Education systems higher than North Carolina
Singapore Korea, Rep. of Hong Kong-CHNChinese Taipei-CHNJapan
Education systems not measurably different from North CarolinaNorthern Ireland-GBR Florida-USA Belgium (Flemish)-BEL Finland
Education systems lower than North CarolinaEngland-GBR Croatia Russian Federation New Zealand United States Spain Netherlands Romania Denmark Poland Lithuania Turkey Quebec-CAN Dubai, UAE Portugal Azerbaijan Germany Chile Ireland Thailand Ontario-CAN Armenia Serbia Georgia Australia Bahrain Hungary United Arab Emirates Slovenia Iran, Islamic Rep. of Czech Republic Abu Dhabi, UAE Austria Qatar Italy Saudi Arabia Slovak Republic Oman Alberta-CAN Tunisia Sweden Kuwait Kazakhstan Morocco Malta Yemen Norway
Grade 8Education systems higher than North Carolina
Korea, Rep. of Massachusetts-USA Singapore Chinese Taipei-CHNHong Kong-CHNJapan
Education systems not measurably different from North CarolinaMinnesota-USA Indiana-USA Russian Federation Quebec-CAN
Education systems lower than North CarolinaColorado-USA Romania Connecticut-USA United Arab Emirates Israel Turkey Finland Lebanon Florida-USA Abu Dhabi-UAE Ontario-CAN Malaysia United States Georgia England-GBR Thailand Alberta-CAN Macedonia, Rep. of Hungary Tunisia Australia Chile Slovenia Iran, Islamic Rep. of Lithuania Qatar Italy Bahrain California-USA Jordan New Zealand Palestinian Nat'l Auth. Kazakhstan Saudi Arabia Sweden Indonesia Ukraine Syrian Arab Republic Dubai-UAE Morocco Norway Oman Armenia Ghana Alabama-USA
NOTE: Italics indicate participants identified and counted in this report as an education system and not as a separate country.SOURCE: International Association for the Evaluation of Educational Achievement (IEA), Trends in International Mathematics and Science Study (TIMSS), 2011.

39
HIGHLIGHTS FROM TIMSS 2011 MATHEMATICS
• At grade 4, all racial/ethnic groups performed abovethe TIMSS scale average. At grade 8, White, Asian,and multiracial students’ average scores were above theTIMSS scale average, while Black and Hispanic students’average scores were not measurably different from theTIMSS scale average (table 25).
• In general, students at grade 4 scored higher, on average,than the TIMSS scale average. At grade 8 students in publicschools with less than 50 percent of students eligible for freeor reduced-price lunch scored higher, on average, than theTIMSS scale average, while average scores for students inpublic schools with 50 percent or more students eligible forfree or reduced-price lunch were not measurably differentfrom the TIMSS scale average.
Table 25. Average mathematics scores in grade 4 and 8 for selected student groups in public schools in North Carolina: 2011
MathematicsReporting groups Grade 4 Grade 8
TIMSS scale average 500 500U.S. average 541 * 509 *North Carolina average 554 * 537 *
SexFemale 548 * 535 *Male 560 * 539 *
Race/ethnicityWhite 577 * 563 *Black 512 * 495Hispanic 538 * 510Asian 613 * 605 *Multiracial 572 * 525 *
Percentage of public school students eligible for free or reduced-price lunch
Less than 10 percent ‡ 605 *10 to 24.9 percent 587 * 572 *25 to 49.9 percent 568 * 543 *50 to 74.9 percent 550 * 52175 percent or more 519 * 516
‡ Reporting standards not met.*p<.05. Difference between score and TIMSS scale average is significant.NOTE Black includes African American, Hispanic includes Latino, and Asian includes Pacific Islander and Native Hawaiian. Racial categories exclude Hispanic origin. Not all race/ethnicity categories are shown, but they are all included in the U.S. and state totals shown throughout the report. The standard errors of the estimates are shown in table E-21 available at http://nces.ed.gov/pubsearch/pubsinfor.asp?pubid=2013009.SOURCE: International Association for the Evaluation of Educational Achievement (IEA), Trends in International Mathematics and Science Study (TIMSS), 2011.

Page intentionally left blank