Highlights Brochure - Arctic Monitoring and Assessment Programme
20
Transcript of Highlights Brochure - Arctic Monitoring and Assessment Programme


The Arctic is of special importance to the world and it is changing rapidly. This brochure is a brief presentation of highlights drawn from Impacts of a WarmingArctic the plain language synthesis report of the Arctic Climate Impact Assessment (ACIA).ACIA publications also include an extensive technical volume on which the synthesisreport and these highlights are based.
The ACIA is a comprehensively researched, fully referenced, and independently reviewedevaluation of arctic climate change and its impacts for the region and for the world. Ithas involved an international effort by hundreds of scientists over four years, and alsoincludes the special knowledge of indigenous people.
This assessment was called for by the Arctic Council and the International Arctic ScienceCommittee (IASC). The Arctic Council is a high-level intergovernmental forum comprisedof the eight arctic nations (Canada, Denmark/Greenland/Faroe Islands, Finland, Iceland,Norway, Russia, Sweden, and the United States of America) and six Indigenous Peoplesorganizations. IASC is an international scientific organization appointed by 18 nationalacademies of science.
The Arctic is extremely vulnerable to observedand projected climate change and itsimpacts. The Arctic is now experiencingsome of the most rapid and severe climatechange on earth. Over the next 100 years,climate change is expected to accelerate,contributing to major physical, ecological,social, and economic changes, many ofwhich have already begun. Changes inarctic climate will also affect the rest of
the world through increased global warming and rising sea levels.
Changes in summer sea-ice extent and tree-line are projected to occur by the end ofthis century. The change in the permafrostboundary assumes that present areas of dis-continuous permafrost will be free of anypermafrost in the future and this is likely tooccur beyond the 21st century.
Impacts of a Warming Arctic is published byCambridge University Press with copies availableat http://www.cambridge.org
Arctic Climate Change and Its Impacts
Earth's climate is changing, with the global temperature now rising at a rate unprecedented inthe experience of modern human society. While some historical changes in climate have resultedfrom natural causes and variations, the strength of the trends and the patterns of change thathave emerged in recent decades indicate that human influences, resulting primarily fromincreased emissions of carbon dioxide and other greenhouse gases, have now become the dominant factor.
These climate changes are being experienced particularly intensely in the Arctic. Arctic average temperature has risen at almost twice the rate as the rest of the world in the past few decades.Widespread melting of glaciers and sea ice and rising permafrost temperatures present additionalevidence of strong arctic warming. These changes in the Arctic provide an early indication of theenvironmental and societal significance of global warming.
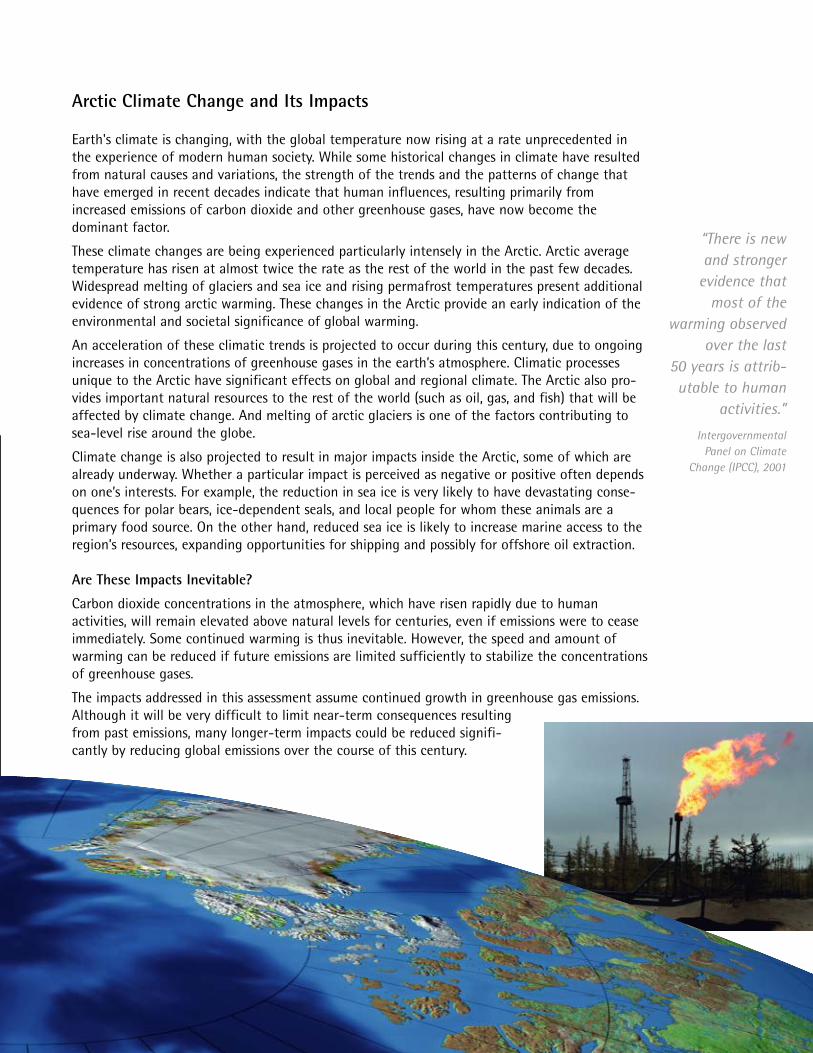
An acceleration of these climatic trends is projected to occur during this century, due to ongoingincreases in concentrations of greenhouse gases in the earth’s atmosphere. Climatic processesunique to the Arctic have significant effects on global and regional climate. The Arctic also pro-vides important natural resources to the rest of the world (such as oil, gas, and fish) that will beaffected by climate change. And melting of arctic glaciers is one of the factors contributing tosea-level rise around the globe.
Climate change is also projected to result in major impacts inside the Arctic, some of which arealready underway. Whether a particular impact is perceived as negative or positive often dependson one’s interests. For example, the reduction in sea ice is very likely to have devastating conse-quences for polar bears, ice-dependent seals, and local people for whom these animals are a primary food source. On the other hand, reduced sea ice is likely to increase marine access to theregion’s resources, expanding opportunities for shipping and possibly for offshore oil extraction.
Are These Impacts Inevitable?
Carbon dioxide concentrations in the atmosphere, which have risen rapidly due to human activities, will remain elevated above natural levels for centuries, even if emissions were to ceaseimmediately. Some continued warming is thus inevitable. However, the speed and amount ofwarming can be reduced if future emissions are limited sufficiently to stabilize the concentrationsof greenhouse gases.
The impacts addressed in this assessment assume continued growth in greenhouse gas emissions.Although it will be very difficult to limit near-term consequences resultingfrom past emissions, many longer-term impacts could be reduced signifi-cantly by reducing global emissions over the course of this century.
“There is new and stronger
evidence thatmost of the
warming observedover the last
50 years is attrib-utable to human
activities.”
IntergovernmentalPanel on Climate
Change (IPCC), 2001
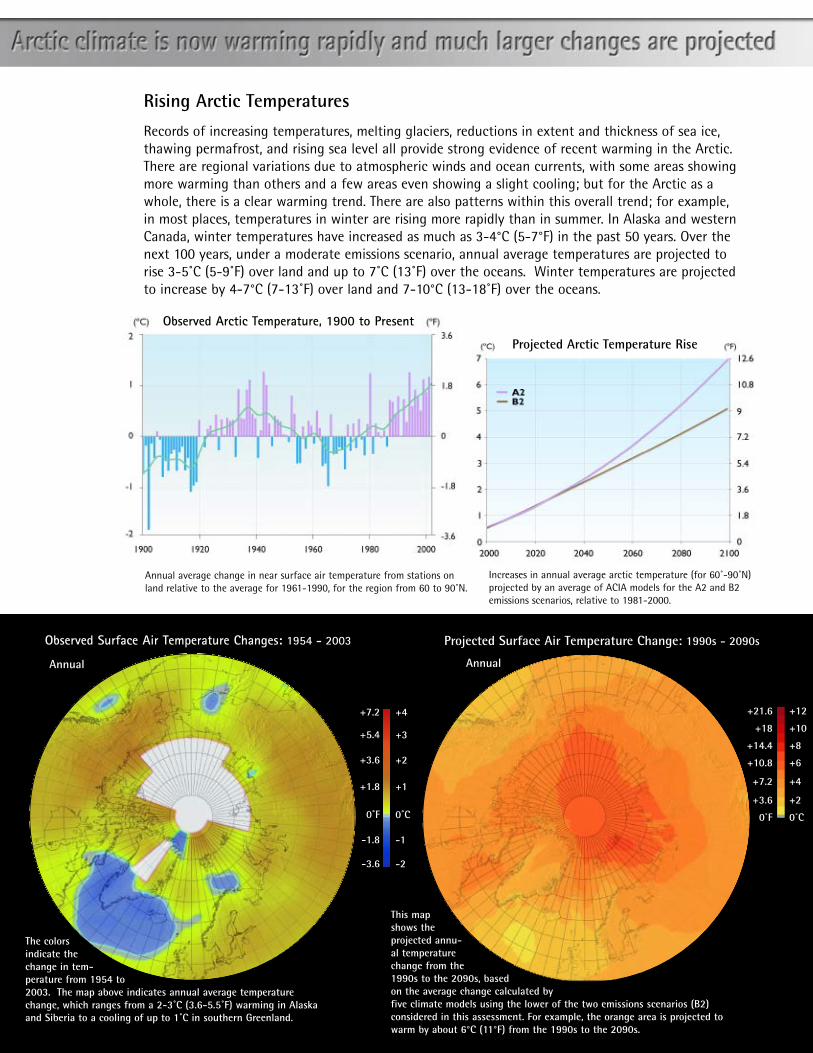
Records of increasing temperatures, melting glaciers, reductions in extent and thickness of sea ice,thawing permafrost, and rising sea level all provide strong evidence of recent warming in the Arctic.There are regional variations due to atmospheric winds and ocean currents, with some areas showingmore warming than others and a few areas even showing a slight cooling; but for the Arctic as awhole, there is a clear warming trend. There are also patterns within this overall trend; for example,in most places, temperatures in winter are rising more rapidly than in summer. In Alaska and westernCanada, winter temperatures have increased as much as 3-4°C (5-7°F) in the past 50 years. Over thenext 100 years, under a moderate emissions scenario, annual average temperatures are projected torise 3-5˚C (5-9˚F) over land and up to 7˚C (13˚F) over the oceans. Winter temperatures are projectedto increase by 4-7°C (7-13˚F) over land and 7-10°C (13-18˚F) over the oceans.
+4
+3
+2
+1
0˚C
-1
-2
The colorsindicate thechange in tem-perature from 1954 to2003. The map above indicates annual average temperaturechange, which ranges from a 2-3˚C (3.6-5.5˚F) warming in Alaskaand Siberia to a cooling of up to 1˚C in southern Greenland.
This mapshows theprojected annu-al temperaturechange from the1990s to the 2090s, basedon the average change calculated byfive climate models using the lower of the two emissions scenarios (B2) considered in this assessment. For example, the orange area is projected towarm by about 6°C (11°F) from the 1990s to the 2090s.
Annual average change in near surface air temperature from stations onland relative to the average for 1961-1990, for the region from 60 to 90˚N.
Observed Arctic Temperature, 1900 to Present
AnnualAnnual
+12
+10
+8
+6
+4
+2
0˚C
+21.6
+18
+14.4
+10.8
+7.2
+3.6
0˚F
Increases in annual average arctic temperature (for 60˚-90˚N)projected by an average of ACIA models for the A2 and B2emissions scenarios, relative to 1981-2000.
Projected Arctic Temperature Rise
Rising Arctic Temperatures
Observed Surface Air Temperature Changes: 1954 - 2003 Projected Surface Air Temperature Change: 1990s - 2090s
+7.2
+5.4
+3.6
+1.8
0˚F
-1.8
-3.6

3
Over the past 30 years, the annual average sea-iceextent has decreased by about 8%, or nearly one mil-lion square kilometers (386,100 square miles), an arealarger than all of Norway, Sweden, and Denmark (orTexas and Arizona) combined, and the melting trend isaccelerating. Sea-ice extent in summer has declinedmore dramatically than the annual average, with aloss of 15-20% of the late-summer ice coverage.Additional declines of 10-50% in annual average sea-ice extent are projected by 2100. Loss of sea ice duringsummer is projected to be considerably greater, with a5-model average projecting more than a 50% declineby late this century, and some models showing near-complete disappearance of summer sea ice.
Projected Sea Ice Extent
September sea-ice extent, already declining markedly, is projected to decline even more rapidly in the future. The three imagesabove show the average of the projections from five climate models for three future time periods. As the century progresses, seaice moves further and further from the coasts of arctic land masses, retreating to the central Arctic Ocean. Some models projectthe nearly complete loss of summer sea ice in this century.
2010 - 2030 2040 - 2060 2070 - 2090
Observed Seasonal Arctic Sea-ice Extent (1900-2003)
Just as miners once had canaries to warn
of rising concentrationsof noxious gases,
researchers working onclimate change rely on
arctic sea ice as anearly warning system.
Declining Sea Ice: A Key Climate Change Indicator
Observed Sea Ice September 1979 Observed Sea Ice September 2003
These two images, constructed from satellite data, compare arctic sea ice concentrations in September of 1979 and 2003.September is the month in which sea ice is at its yearly minimum and 1979 marks the first year that data of this kindbecame available in meaningful form. The lowest concentration of sea ice on record was in September 2002.
Observed Ice ExtentSeptember 2002
4
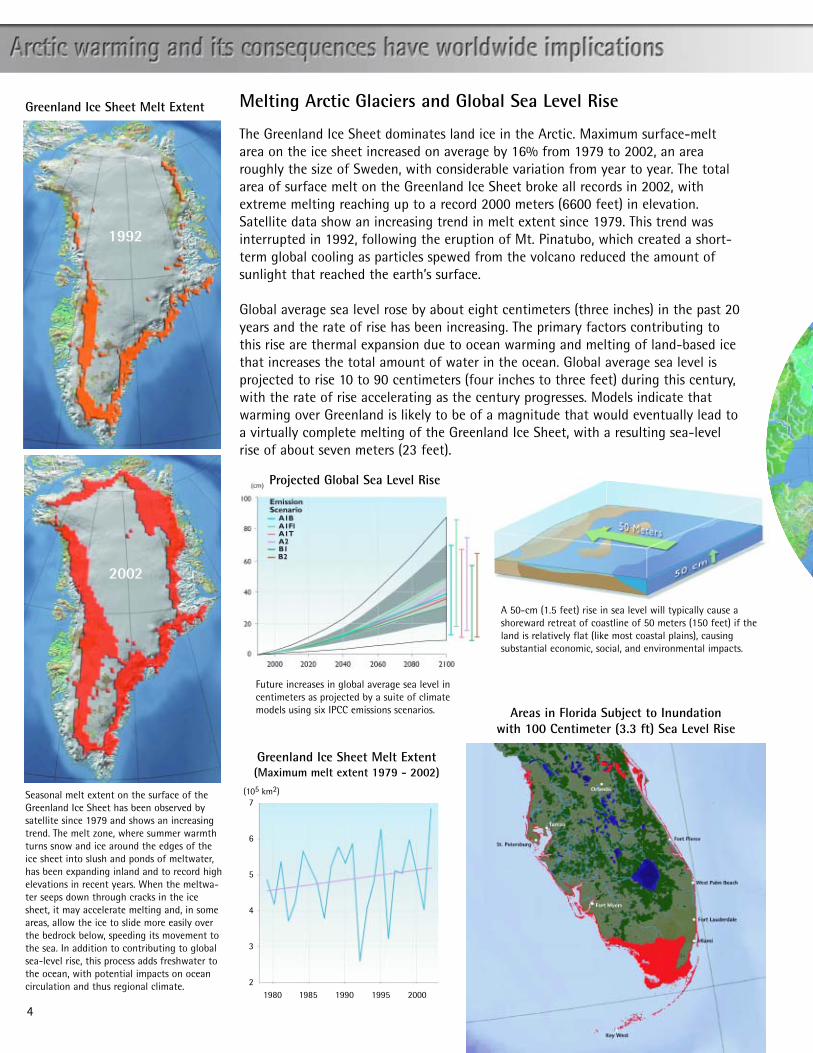
The Greenland Ice Sheet dominates land ice in the Arctic. Maximum surface-meltarea on the ice sheet increased on average by 16% from 1979 to 2002, an arearoughly the size of Sweden, with considerable variation from year to year. The totalarea of surface melt on the Greenland Ice Sheet broke all records in 2002, withextreme melting reaching up to a record 2000 meters (6600 feet) in elevation.Satellite data show an increasing trend in melt extent since 1979. This trend wasinterrupted in 1992, following the eruption of Mt. Pinatubo, which created a short-term global cooling as particles spewed from the volcano reduced the amount ofsunlight that reached the earth’s surface.
Global average sea level rose by about eight centimeters (three inches) in the past 20years and the rate of rise has been increasing. The primary factors contributing tothis rise are thermal expansion due to ocean warming and melting of land-based icethat increases the total amount of water in the ocean. Global average sea level isprojected to rise 10 to 90 centimeters (four inches to three feet) during this century,with the rate of rise accelerating as the century progresses. Models indicate thatwarming over Greenland is likely to be of a magnitude that would eventually lead toa virtually complete melting of the Greenland Ice Sheet, with a resulting sea-levelrise of about seven meters (23 feet).
Melting Arctic Glaciers and Global Sea Level Rise
Seasonal melt extent on the surface of theGreenland Ice Sheet has been observed bysatellite since 1979 and shows an increasingtrend. The melt zone, where summer warmthturns snow and ice around the edges of theice sheet into slush and ponds of meltwater,has been expanding inland and to record highelevations in recent years. When the meltwa-ter seeps down through cracks in the icesheet, it may accelerate melting and, in someareas, allow the ice to slide more easily overthe bedrock below, speeding its movement tothe sea. In addition to contributing to globalsea-level rise, this process adds freshwater tothe ocean, with potential impacts on oceancirculation and thus regional climate.
Greenland Ice Sheet Melt Extent
1992
2002
Greenland Ice Sheet Melt Extent (Maximum melt extent 1979 - 2002)
(105 km2)
1980 1985 1990 1995 2000
7
6
5
4
3
2
Projected Global Sea Level Rise
Future increases in global average sea level in centimeters as projected by a suite of climatemodels using six IPCC emissions scenarios. Areas in Florida Subject to Inundation
with 100 Centimeter (3.3 ft) Sea Level Rise
A 50-cm (1.5 feet) rise in sea level will typically cause ashoreward retreat of coastline of 50 meters (150 feet) if theland is relatively flat (like most coastal plains), causing substantial economic, social, and environmental impacts.

5
There are several major mechanisms by which arctic processes cancause additional climate change for the planet. One involveschanges in the reflectivity of the land and ocean surface as snowand ice melt and vegetation cover changes. As the surfacebecomes darker, it absorbs more of the sun's energy, amplifyingglobal warming.
Another mechanism involves potential changes to the global oceancirculation than can cause large scale climatic changes. Such
changes can be brought about as meltingarctic ice and increasing precipita-
tion and river runoff add fresh-water to the oceans, dis-
turbing the salinity bal-ance that sustains the
ocean circulation pat-tern that carrieswarmth from thetropics northward.
Arctic Changes Impact Global Climate
Sea icecov-eredwith snowreflects about 85-90% ofsunlight, while ocean waterreflects just 10%. Similar differ-ences in reflectivity exist between snow- and ice-covered landareas and the ground beneath them. Thus, as sea ice and land-based snow and ice melt, revealing more and more of the oceanor land beneath them, the increasing absorption of solar radia-tion adds to global warming, which causes more melting, whichin turn causes more warming, and so on…
Major Arctic Rivers
Global Ocean Circulation
The map shows the major river net-works of the Arctic. The thickness ofthe blue lines represents the relativeriver discharge (the numbers arecubic kilometers of discharge peryear). As the line chart shows, risingair temperatures lead to rising riverdischarge as glaciers melt and precip-itation increases. As more freshwaterenters the ocean, it has the potentialto slow or even shut down theoceanic overturning (sometimescalled the conveyor belt circulation)that carries warmth from the tropicsnorthward. The illustration belowshows how this circulation functions,with red representing warm surfacewaters that carry heat poleward, andblue representing cold deep watersthat return towards the tropics.
Rising Winter River Discharge
Surface Reflectivity
(European river discharge in winter)
6
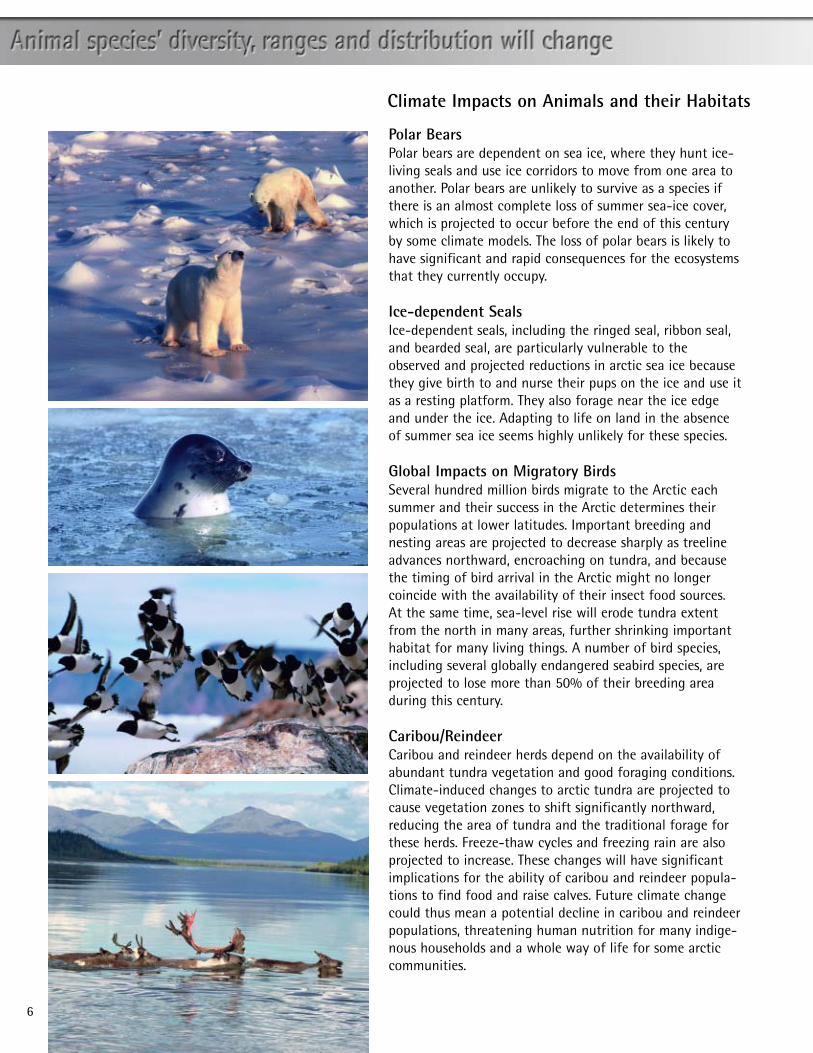
Polar BearsPolar bears are dependent on sea ice, where they hunt ice-living seals and use ice corridors to move from one area toanother. Polar bears are unlikely to survive as a species ifthere is an almost complete loss of summer sea-ice cover,which is projected to occur before the end of this centuryby some climate models. The loss of polar bears is likely tohave significant and rapid consequences for the ecosystemsthat they currently occupy.
Ice-dependent SealsIce-dependent seals, including the ringed seal, ribbon seal,and bearded seal, are particularly vulnerable to theobserved and projected reductions in arctic sea ice becausethey give birth to and nurse their pups on the ice and use itas a resting platform. They also forage near the ice edgeand under the ice. Adapting to life on land in the absenceof summer sea ice seems highly unlikely for these species.
Global Impacts on Migratory BirdsSeveral hundred million birds migrate to the Arctic eachsummer and their success in the Arctic determines theirpopulations at lower latitudes. Important breeding andnesting areas are projected to decrease sharply as treelineadvances northward, encroaching on tundra, and becausethe timing of bird arrival in the Arctic might no longercoincide with the availability of their insect food sources.At the same time, sea-level rise will erode tundra extentfrom the north in many areas, further shrinking importanthabitat for many living things. A number of bird species,including several globally endangered seabird species, areprojected to lose more than 50% of their breeding areaduring this century.
Caribou/ReindeerCaribou and reindeer herds depend on the availability ofabundant tundra vegetation and good foraging conditions.Climate-induced changes to arctic tundra are projected tocause vegetation zones to shift significantly northward,reducing the area of tundra and the traditional forage forthese herds. Freeze-thaw cycles and freezing rain are alsoprojected to increase. These changes will have significantimplications for the ability of caribou and reindeer popula-tions to find food and raise calves. Future climate changecould thus mean a potential decline in caribou and reindeerpopulations, threatening human nutrition for many indige-nous households and a whole way of life for some arcticcommunities.
Climate Impacts on Animals and their Habitats
7
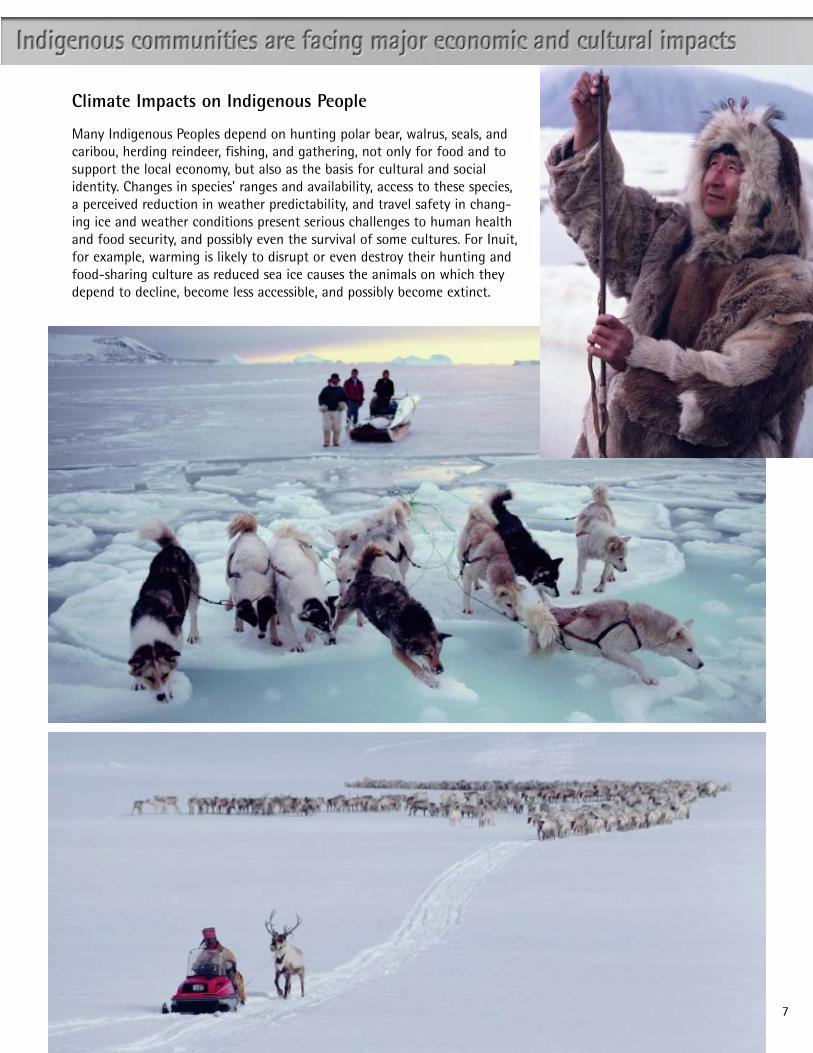
Climate Impacts on Indigenous People
Many Indigenous Peoples depend on hunting polar bear, walrus, seals, andcaribou, herding reindeer, fishing, and gathering, not only for food and tosupport the local economy, but also as the basis for cultural and socialidentity. Changes in species’ ranges and availability, access to these species,a perceived reduction in weather predictability, and travel safety in chang-ing ice and weather conditions present serious challenges to human healthand food security, and possibly even the survival of some cultures. For Inuit,for example, warming is likely to disrupt or even destroy their hunting andfood-sharing culture as reduced sea ice causes the animals on which theydepend to decline, become less accessible, and possibly become extinct.

8
Severe coastal erosion will be a growing problem as risingsea level and a reduction in sea ice allow higher waves andstorm surges to reach the shore. Along some arctic coast-lines, thawing permafrost weakens coastal lands, adding totheir vulnerability. Some communities and industrial facili-ties in coastal zones are already threatened or being forcedto relocate, while others face increasing risks and costs.
Coastal Erosion and Thawing PermafrostCOASTAL EROSION
The vulnerability of a coastline to erosion depends on sea level, theproperties of the coastal materials,wave action, and tectonic forces.Unsolidified arctic coasts (in green)containing variable amounts ofground ice, are more susceptible toerosion than solidified coasts (inorange). Some unstable coastalenvironments are shown in the inset photographs. Areas (in red) in whichelevation is less than 10 meters (33feet) above average sea level are particularly vulnerable.
Arctic Coastal Areas Susceptible to Erosion
Unsolidified Coasts
Solidified Coasts
Less than 10 Meters above average Sea Level
“Some of our communities are eroding into theocean in front of oureyes because of thedecrease in themulti-layered ice,which is allowing for larger storms to roll in.”
Duane SmithInuit CircumpolarConference, Canada

9
Thawing Permafrost
The number of days inwhich oil exploration activities on the tundraare allowed under AlaskaDepartment of NaturalResources standards hasbeen halved over the past30 years due to climatewarming. The standardsare based on tundra hardness and snow condi-tions and are designed to protect the tundrafrom damage.
THAWING PERMAFROST
The map highlights areas in which buildings, roads, and other infrastructureare at risk due to permafrost thaw by the middle of this century. Areas at
high risk encompass population centers, oil pipelines, natural gas pro-duction facilities, railroads, and a nuclear power plant.
Infrastructure at Risk by 2050 Due to Permafrost Thaw
The projected rate ofwarming and its effects
will need to be taken intoaccount in the design of
all new construction.
Alaska Winter Tundra Travel Days(1970-2002)
Transportation and industry on land, including oil and gasextraction and forestry, will increasingly be disrupted by theshortening of the periods during which ice roads and tun-dra are frozen sufficiently to permit travel.
As frozen ground thaws, many existing buildings, roads,pipelines, airports, and industrial facilities are likely to bedestabilized.
StableLowModerateHigh

Climate change is projected to cause vegetation shifts because rising temperatures favor taller,denser vegetation, and will thus promote the expansion of forests into the arctic tundra, and tun-dra into the polar deserts. The timeframe of these shifts will vary around the Arctic. Where suit-able soils and other conditions exist, changes are likely to be apparent in this century. Where theydo not, the changes can be expected to take longer. These vegetation changes, along with risingsea levels, are projected to shrink tundra area to its lowest extent in at least the past 21000 years,greatly reducing the breeding area for many birds and the grazing areas for land animals thatdepend on the open landscape of tundra and polar desert habitats. Not only are some threatenedspecies very likely to become extinct, some currently widespread species are projected to declinesharply.
The projected reduction in tundra and expansion of forest will cause a decrease in surface reflectiv-ity, amplifying global warming because the newly forested areas are darker and more textured andthus will absorb more solar radiation than the lighter, smoother tundra. For example, black spruceis the least reflective of any vegetation type and is likely to be a large part of the mix of new treesin North America. In addition, expanding forests will mask highly reflective snow. The darkeningof the surface that results from these changes will create a feedback loop whereby more warmingwill lead to more tree establishment and forest cover, which will cause more warming, and so on.
Studies suggestthat the increasein absorption ofsolar radiationwill dominateover the increasein carbon storage,resulting in a netincrease in warming.
This schematic illustratesthe projected upslopeand northward dis-placement of vegeta-tion zones in theArctic as a result offuture warming. Notethe difference in alti-tude of vegetationboundaries on northand south facingslopes. The altitudinaland latitudinal zonesare analogous, butnot identical.
Shifting Vegetation Zones
10

11
Spruce Beetle Activity, Kenai Peninsula 1994-1999
During the 1990s the Kenai Peninsula in Alaska experienced theworld’s largest outbreak of spruce bark beetles (SBB). Since1989, more than 1.6 million hectares of mature white spruceand Sitka/Lutz spruce forest in south-central Alaska have beenaffected with at least 10% to 20% tree mortality, the thresholdlevel for aerial mapping detection.
Tree Mortality due to SBB
Past Tree Mortality due to SBB
Forest
Non-Forest
Glacier
1994 1997 1999
Increasing Fires and Insect OutbreaksForest fires, insect infestations, and other disturbancesare projected to continue to increase in frequency andintensity in a warming climate.
The graph shows the area of North American boreal forest thatburned each year, in millions of hectares. The average areaburned has more than doubled since 1970, coinciding with climatic warming in the region.
Boreal Forest Burned in North America
Birch forest destroyed by autumnmoths in Abisko, Sweden, 2004.
Spruce Beetle Infestations in the Yukon, 1994-2002
The spruce bark beetle has killed trees on about300 000 hectares in the Alsek River corridor inKluane National Park and in the Shakwak Valleynorth of Haines Junction since an outbreak wasfirst identified in 1994. This is the largest and mostintense outbreak of spruce bark beetle ever toaffect Canadian trees.
Spruce Bark Beetle Extent1994-2002
12
Projected Ice Extent (5-Model Average for September)
2070-2090
Observed Ice Extent September 2002
NorthwestPassage
NorthernSea Route
2010-2030
2040-2060
Projected WinterSurface Air
Temperature Change:1990s-2090s
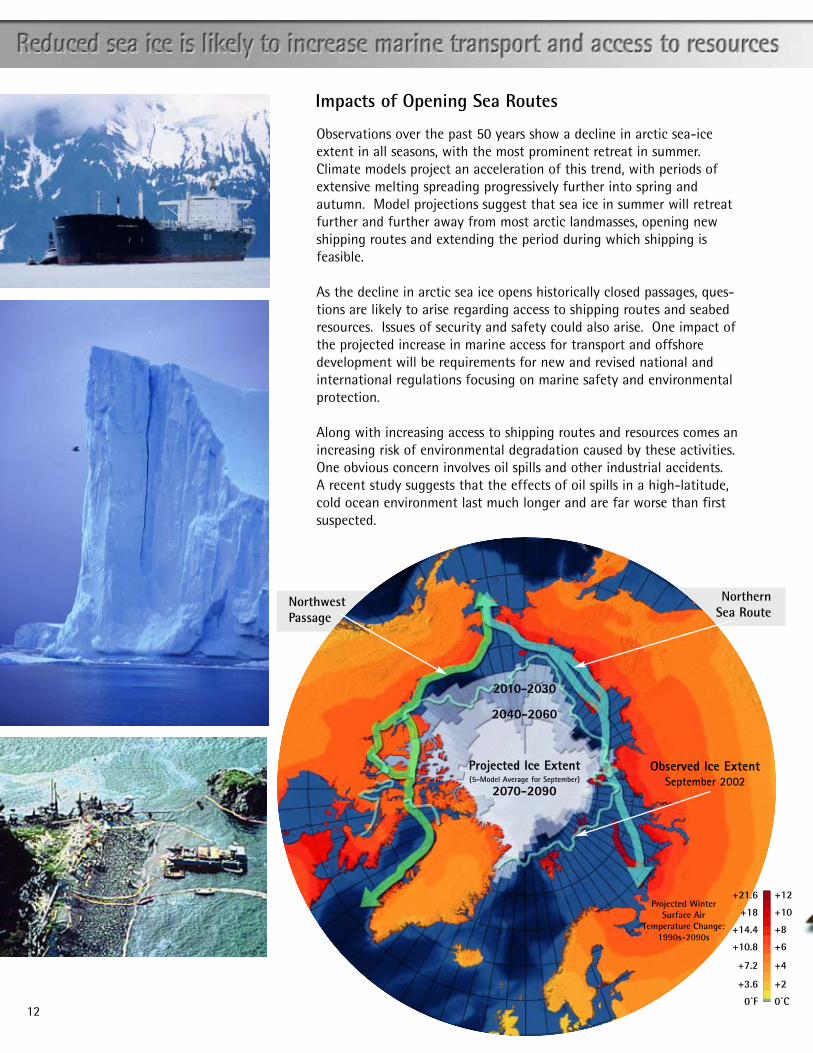
Observations over the past 50 years show a decline in arctic sea-iceextent in all seasons, with the most prominent retreat in summer.Climate models project an acceleration of this trend, with periods ofextensive melting spreading progressively further into spring andautumn. Model projections suggest that sea ice in summer will retreatfurther and further away from most arctic landmasses, opening newshipping routes and extending the period during which shipping is feasible.
As the decline in arctic sea ice opens historically closed passages, ques-tions are likely to arise regarding access to shipping routes and seabedresources. Issues of security and safety could also arise. One impact ofthe projected increase in marine access for transport and offshoredevelopment will be requirements for new and revised national andinternational regulations focusing on marine safety and environmentalprotection.
Along with increasing access to shipping routes and resources comes anincreasing risk of environmental degradation caused by these activities.One obvious concern involves oil spills and other industrial accidents. A recent study suggests that the effects of oil spills in a high-latitude,cold ocean environment last much longer and are far worse than firstsuspected.
Impacts of Opening Sea Routes
+12
+10
+8
+6
+4
+2
0˚C
+21.6
+18
+14.4
+10.8
+7.2
+3.6
0˚F

13
Impacts on Human Health
Climate change will continue to affect human health in the Arctic. The impacts will differ from placeto place due to regional differences in climate change as well as variations in health status and adap-tive capacity of different populations. Rural arctic residents in small, isolated communities with a frag-ile system of support, little infrastructure, and marginal or non-existent public health systems appear tobe most vulnerable. People who depend upon subsistence hunting and fishing, especially those whorely on just a few species, will be vulnerable to changes that heavily affect those species (for example,reduced sea ice and its impact on ringed seals and polar bears). Climate stress and shifting animal popu-lations also create conditions for the spread of infectious diseases in animals that can be transmitted tohumans, such as West Nile virus.
The West Nile encephalitis virus is a recent example of how far and fast a disease can spread once it becomes established in a new region.The West Nile virus can infect many bird and mammal species (including humans) and is transmitted by mosquitoes. It was first identifiedon the East Coast of North America in 1999 and spread to 43 states and six Canadian provinces by 2002. Migratory birds are responsiblefor its spread to other regions. Mosquitoes spread the virus to other birds (as well as to other animals and humans) within a region.Although the virus originated in tropical Africa, it has adapted to many North American mosquitoes, and so far, to over 110 species ofNorth American bird, some of which migrate to the Arctic. Mosquito species known to transmit the virus are also found in the Arctic.Climate has historically limited the range of some insect-borne diseases, but climate change and adaptive disease agents such as the WestNile virus tend to favor continued northerly expansion. Some arctic regions, such as the State of Alaska, have initiated West Nile virussurveillance programs.
West Nile Virus Change in Canada2001 2002 2003
Dead Birds Submitted for Testing
Tested Positive for West Nile Virus
amounts of deposition in the Arctic. Animal move-ments in response to warming can also increasecontaminant transport to the Arctic. For example,Pacific salmon may respond to warming by movingnorthward into arctic rivers. These salmon accumu-late and magnify contaminants in the Pacific Ocean,and transport them into arctic waters. In addition,more extensive melting of multi-year sea ice andglaciers results in the rapid release of large pulses ofpollutants that were captured in the ice over yearsor decades.
Contaminants
Winds carry contaminants to the Arctic, and precipi-tation deposits them onto the surface. Temperatureplays a role in determining the distribution of con-taminants between air, land, and water. Projectedclimate change-related alterations in wind patterns,precipitation, and temperature can thus change theroutes of contaminant entry and the locations and

The
su
rface
cools by radiating heat energyupward.
14
Most of the heat energy emitted from thesurface is absorbed by greenhouse gaseswhich radiate heat back down to warm thelower atmosphere and the surface. Increasingthe concentrations of greenhouse gasesincreases the warming of the surface andslows the loss of heat energy to space.
The Earth’s Greenhouse Effect
Ice cores and other evidence of climate conditions in the distant past provide evidence that rising atmospheric carbon dioxide levels are associated with rising global temperatures. Human activities, primarily the burning of fossil fuels (coal, oil, and natural gas), and secondarily the clearing of land, have increased the concentration of carbon dioxide, methane, and other heat-trapping (“greenhouse”) gases in the atmosphere.Since the start of the industrial revolution, the atmospheric carbon dioxide concentration hasincreased by about 35% and the global average temperature has risen by about 0.6˚C (1˚F). There is an international scientific consensus that most of the warming observed over the last 50 years is attributable to human activities.
Continuing to add carbon dioxide and other greenhouse gases to the atmosphere is projectedto lead to significant and persistent changes in climate, including an increase in averageglobal temperature of 1.4 to 5.8˚C (2.5 to 10.4˚F) (according to the IPCC) over the course ofthis century. Climatic changes are projected to include shifts in atmospheric and oceanic circulation patterns, an accelerating rate of sea-level rise, and wider variations in precipita-tion. Together, these changes are projected to lead to wide-ranging consequences including significant impacts on coastal communities, animal and plant species, water resources, and human health and well-being.
About 80% of the world's energy is currently derived from burning fossil fuels, and carbon dioxide emissions from these sources are growing rapidly. Because excess carbondioxide persists in the atmosphere for centuries, it will take at least a few decades for con-centrations to peak and then begin to decline even if concerted efforts to reduce emissionsare begun immediately. Altering the warming trend will thus be a long-term process, and the world will face some degree of climate change and its impacts for centuries.
The science suggests that responding to this challenge will require two sets of actions: one,called mitigation, to slow the speed and amount of future climate change by reducing greenhouse gas emissions; and the other, called adaptation, to attempt to limit adverseimpacts by becoming more resilient to the climate changes that will occur while society pursues the first set of actions. The scope of this assessment did not include an evaluation of either of these sets of actions. These are being addressed by efforts under the auspices ofthe United Nations Framework Convention on Climate Change and other bodies.
Global Climate Change
The earth is projected towarm morethan twice asmuch in thiscentury as itwarmed over the past century.
The su
rface
cools by radiating heat energyupw
ard.

15
1000 Years of Changes in Carbon Emissions, CO2 Concentrations and Temperature
This 1000-year record tracks the rise in carbon emissions due to human activities (fossil fuel burning and land clearing) and the subsequent increasein atmospheric carbon dioxide concentrations, and air temperatures. The earli-er parts of this Northern Hemisphere temperature reconstruction are derivedfrom historical data, tree rings, and corals, while the later parts were directlymeasured. Measurements of carbon dioxide (CO2) in air bubbles trapped in icecores form the earlier part of the CO2 record; direct atmospheric measure-ments of CO2 concentration began in 1957.
This record illustrates the relationship between temper-ature and atmospheric carbon dioxide concentrationsover the past 160 000 years and the next 100 years.Historical data are derived from ice cores, recent datawere directly measured, and model projections are usedfor the next 100 years.
Altering the warmingtrend will be a long-term
process, and the worldwill face some degree of
climate change and itsimpacts for centuries.
1. As snow and ice melt,darker land and ocean surfaces absorb more
solar energy.
2. More of the extra trappedenergy goes directly into warming
rather than into evaporation.
3. The atmospheric layer that hasto warm in order
to warm the surface is shallower in the Arctic.
4. As sea ice retreats,solar heat absorbed by the
oceans in summer is more easily transferred to the atmosphere
in winter.
5. Alterations in atmospheric and oceanic circulation can
increase warming.
Why Does the Arctic Warm Faster than Lower Latitudes?
AtmosphericCarbon DioxideConcentration and TemperatureChange

16
Concluding Thoughts
Climate change presents a major and growing challenge to the Arctic and the world.Some of the climate-related changes in the arctic environment that are most likelyto occur are expected to have major impacts; these include the decline in sea ice, theincrease in coastal erosion, and the thawing of permafrost. In addition, other con-cerns emerge from possible outcomes that appear to have only a low likelihood, butthe occurrence of which would have very large impacts - so-called "surprises".
Due to the complexity of the earth system, it is possible that climate change willevolve differently than the gradually changing scenarios used in this assessment. Forexample, storm intensities and tracks could change in unforeseen ways or tempera-tures could rise or fall abruptly due to unexpected disturbances of global weathersystems. Possible changes in the global oceanic circulation and widespread ramifica-tions of such changes provide another example of a potential climate surprise.Although such changes could cause major impacts, very little information is currentlyavailable for considering such possibilities.
Human-induced changes in arctic climate are among the largest on earth. As a con-sequence, the changes already underway in arctic landscapes, communities, and
unique features provide an early indication for the rest of the world ofthe environmental and societal significance of global cli-
mate change. As this assessment illustrates,changes in climate and their impacts in the
Arctic are already being widely felt, andare projected to become much greater.
These changes will also reach farbeyond the Arctic, affecting glob-
al climate, sea level, biodiversity,and many aspects of human
social and economic systems.Climate change in theArctic thus deserves andrequires urgent attentionby decision makers andthe public worldwide.

17
Text by Susan Joy Hassol
Photography and Graphics
All map backgrounds and map visualizations - ©Clifford Grabhorn/GrabhornStudio, with the exception of those listed below.Page 3: observed sea ice extent images - NASAPage 5: flat globe map background - NASAPage 11: spruce beetle map Yukon - Natural Resources Canada,
spruce beetle map Kenai Peninsula - USDA Forest Service
Cover: all photographs - ©Bryan and Cherry Alexander, Higher Cottage,Manston, Sturminster Newton, Dorset DT10 1EZ, England [email protected]
Inside Cover: ©Bryan and Cherry AlexanderPages 6 and 7: ©Bryan and Cherry AlexanderPage 9: damaged building - ©Vladimir E. Romanovsky, stuck truck - ©Paul
Grabhorn, pipeline in Alaska - ©Bryan and Cherry AlexanderPage 11: forest fire- ©John McColgan/BLM Alaska Fire Service, three autumn
moth damage images images - ©Staffan KarlssonPage 12: oil tanker and iceberg images - ©Bryan and Cherry Alexander, oil-
spill - Exxon Valdez Oil Spill Trustee CounciPage 15: inset photo 1 - ©Bryan and Cherry Alexander, inset photo 4 - NASAPage 16: all - ©Bryan and Cherry AlexanderBack Cover: ©Bryan and Cherry Alexander
ContributorsAssessment Integration Team
Robert Corell, Chair American Meteorological Society, USAPål Prestrud, Vice Chair Centre for Climate Research in Oslo, NorwayGunter Weller University of Alaska Fairbanks, USAPatricia A. Anderson University of Alaska Fairbanks, USASnorri Baldursson Liaison for the Arctic Council, IcelandElizabeth Bush Environment Canada, CanadaTerry V. Callaghan Abisko Scientific Research Station, Sweden
Sheffield Centre for Arctic Ecology, UK Paul Grabhorn Grabhorn Studio, Inc., USASusan Joy Hassol Independent Scholar and Science Writer, USA Gordon McBean University of Western Ontario, CanadaMichael MacCracken Climate Institute, USALars-Otto Reiersen Arctic Monitoring and Assessment Programme, NorwayJan Idar Solbakken Permanent Participants, Norway
Lead Authors of the Full Science Report
Jim Berner Alaska Native Tribal Health Consortium, USATerry V. Callaghan Abisko Scientific Research Station, Sweden
Sheffield Centre for Arctic Ecology, UKShari Fox University of Colorado at Boulder, USAChristopher Furgal Laval University, CanadaAlf Håkon Hoel University of Tromsø, NorwayHenry Huntington Huntington Consulting, USAArne Instanes Instanes Consulting Engineers, NorwayGlenn P. Juday University of Alaska Fairbanks, USAErland Källén Stockholm University, SwedenVladimir M. Kattsov Voeikov Main Geophysical Observatory, RussiaDavid R. Klein University of Alaska Fairbanks, USAHarald Loeng Institute of Marine Research, NorwayMarybeth Long Martello Harvard University, USA
Gordon McBean University of Western Ontario, CanadaJames J. McCarthy Harvard University, USAMark Nuttall University of Aberdeen, Scotland, UK
University of Alberta, CanadaTerry D. Prowse National Water Research Institute, CanadaJames D. Reist Fisheries and Oceans Canada, CanadaAmy Stevermer University of Colorado at Boulder, USAAapo Tanskanen Finnish Meteorological Institute, FinlandMichael B. Usher University of Stirling, Scotland, UKHjálmar Vilhjálmsson Marine Research Institute, IcelandJohn E. Walsh University of Alaska Fairbanks, USABetsy Weatherhead University of Colorado at Boulder, USAGunter Weller University of Alaska Fairbanks, USAFred J. Wrona National Water Research Institute, Canada
Note: A full list of additional contributors may be found in the full document: Impacts of a Warming Arctic.
International Arctic Research CenterUniversity of Alaska Fairbanks
Fairbanks, AK 99775-7740, USA Tel: +907 474 5818Fax +907 474 6722
http://www.acia.uaf.edu
ACIA Secretariat
©Arctic Climate Impact Assessment, 2004Impacts of a Warming Arctic is published by Cambridge University Press http://www.cambridge.org
The Arctic Council called for this assessment, and charged two of its working groups, the ArcticMonitoring and Assessment Programme (AMAP) andthe Conservation of Arctic Flora and Fauna (CAFF),along with the International Arctic Science Committee(IASC), with its implementation.