Higher Education Loans
21
1 Student Loans in Kenya: Past Experiences, Current Hurdles and Opportunities for the Future Wycliffe Otieno ∗ Introduction The genesis of student loans in Kenya dates back to 1952, when the then British colonial government set up the Higher Education Loans Fund (HELF) to assist those pursuing university education outside East Africa and mainly in Britain, the USA, India, the former USSR and South Africa. On attaining independence, the African government more or less suspended the scheme and opted to directly meet the cost of higher education. This policy was in line with the recommendation of the Kenya Education Commission to train highly skilled African personnel to take over the running of the government from the departing Europeans (Republic of Kenya, 1964). Subsequent policy documents such as the Sessional Paper No. 10 of 1965 on “African Socialism and its Application to Planning in Kenya” (Republic of Kenya 1965), the first Development Plan, 1965/70 (Republic of Kenya, 1965) as well as the report on High Level Manpower Requirements and Resources in Kenya, 1964 – 1970 (Republic of Kenya, 1964) all stressed that high and middle level manpower is a critical resource in achieving rapid economic growth and that the production of high-level manpower is one of the goals of university education. The government used these arguments as the basis for expanding and subsidizing higher education. University education as such became virtually free in terms of direct costs that were borne mostly by the government. The increased enrolments in university education coupled with dismal economic performance mainly occasioned by the oil shocks of 1970s forced the government to rethink its policies on financing university education. As a result, it “introduced” a loan program in the 1973-74 financial year. In reality, it was simply a reactivation of the 1952 program, which was never discontinued as the government only stopped funding it. The program was reintroduced as the University Students’ Loan Scheme (USLS), and not as an autonomous body but as a unit - the Loan Disbursement and Recovery Unit (LDRU) ∗ Wycliffe Otieno is a tutorial fellow in the School of Education and Human Resource Development, Kenyatta University, Nairobi, Kenya. This paper will be published in a forthcoming (2004) special issue of the Journal of Higher Education in Africa.
-
Upload
martinmulinge -
Category
Documents
-
view
16 -
download
0
description
.
Transcript of Higher Education Loans

1
Student Loans in Kenya: Past Experiences, Current Hurdles and Opportunities for the Future
Wycliffe Otieno∗
Introduction The genesis of student loans in Kenya dates back to 1952, when the then British colonial government set up the Higher Education Loans Fund (HELF) to assist those pursuing university education outside East Africa and mainly in Britain, the USA, India, the former USSR and South Africa. On attaining independence, the African government more or less suspended the scheme and opted to directly meet the cost of higher education. This policy was in line with the recommendation of the Kenya Education Commission to train highly skilled African personnel to take over the running of the government from the departing Europeans (Republic of Kenya, 1964). Subsequent policy documents such as the Sessional Paper No. 10 of 1965 on “African Socialism and its Application to Planning in Kenya” (Republic of Kenya 1965), the first Development Plan, 1965/70 (Republic of Kenya, 1965) as well as the report on High Level Manpower Requirements and Resources in Kenya, 1964 – 1970 (Republic of Kenya, 1964) all stressed that high and middle level manpower is a critical resource in achieving rapid economic growth and that the production of high-level manpower is one of the goals of university education. The government used these arguments as the basis for expanding and subsidizing higher education. University education as such became virtually free in terms of direct costs that were borne mostly by the government.
The increased enrolments in university education coupled with dismal economic performance mainly occasioned by the oil shocks of 1970s forced the government to rethink its policies on financing university education. As a result, it “introduced” a loan program in the 1973-74 financial year. In reality, it was simply a reactivation of the 1952 program, which was never discontinued as the government only stopped funding it. The program was reintroduced as the University Students’ Loan Scheme (USLS), and not as an autonomous body but as a unit - the Loan Disbursement and Recovery Unit (LDRU)
∗ Wycliffe Otieno is a tutorial fellow in the School of Education and Human Resource Development, Kenyatta University, Nairobi, Kenya. This paper will be published in a forthcoming (2004) special issue of the Journal of Higher Education in Africa.

2
in the Ministry of Education. There were no policies put in place guiding its operations. The overall aims of the scheme as reintroduced in 1974 were:
1. To ensure that the beneficiaries of higher education and training meet part of their education.
2. To promote equality of opportunity to qualified students irrespective of their background circumstances.
3. To provide a continuous source of finance, through a fund that becomes self-perpetuating.
4. To reduce dropout rates by giving students an added incentive through economic commitments to complete their studies.
5. To encourage students to make right choices for their career based on labor market opportunities.
6. To complement government’s financial commitment to university education and thereby increase the number of students.
7. To contribute to national development by encouraging investment in education to meet manpower requirements.
The goals and aims of the scheme as spelled out by the government were indeed noble. What is amazing is that nothing was practically done to ensure that they were achieved. The money was literally dished out to students and no serious attempts were made to recover it. Perhaps the government was blinded by the small university population, which meant that the proportion of budgetary allocation to the scheme was manageable. In the subsequent years, however, the proportion of budgetary allocation to the Ministry of Education taken up by the loan scheme increased steadily from 3.1 per cent in the 1974/75 financial year to 6.1 per cent in 1992/93 (Republic of Kenya, 1975/76 – 1992/93) and was the fastest growing component of university education (Mungai, 1989), even though the government acknowledged that it was poorly administered (Republic of Kenya, 1988a) and recoveries were low.
Several factors undermined the successful operation of the program. First, the ad hoc manner in which the program was started meant that there were no precautionary measures taken to guard against default. Second, it lacked people with requisite skills in debt recovery. By all accounts, it was grossly ill equipped to handle the challenges of running a loan program. Personnel were drawn from other ministry departments to man the scheme, while the government could have done better by seconding people with skills and experience in debt management from state owned commercial banks, the Treasury or even the Central Bank. Third, the beneficiaries were not educated on both their obligations and the benefits resulting from repayment. Indeed, when the program was introduced in 1974, students protested and rioted against its implementation, arguing that they were being forced to incur debts (ironically, when changes were later made in the 1990s in the program to reduce the amount of loans, students again protested--this time that they were being ‘impoverished’). Such backlash effects had not been anticipated by the government. Fourth, resulting from the hurried implementation, the scheme had no legal basis and it became difficult to enforce recoveries from past students. Other legal obstacles also stood in the way of recovery, such as the law on Limitations of Actions

3
Act which renders any debt not claimed within six years from the time it is due unrecoverable (the program has since been exempted from this law with the enactment of the HELB Act in 1995).
It was the need to overcome such hurdles coupled with pressure from the World Bank and the International Monetary Fund (IMF) that made the government embark on reforming the loan program. The two institutions were dissatisfied with the piecemeal program reforms that were made and were pushing for more comprehensive restructuring within the broader framework of Structural Adjustment Programs (SAPs) that they had been fronting from the late 1980s. The piecemeal reforms undertaken by the government had so far included requiring students to apply for and get the loans from their home districts as opposed to their campuses and having the loan application forms endorsed by the chiefs/local administrators, introducing meal cards and then what became known as PAYE (Pay-as-you-eat) instead of free meals and abolishing stipends popularly known as “boom”1. These measures however proved ineffective in improving the program since they did not address some of the fundamental shortcomings of the scheme.
More comprehensive reforms were realized in 1995, when the government set up the Higher Education Loans Board (HELB) through an Act of Parliament. The board was charged with five responsibilities, namely: to facilitate disbursement of loans, scholarships and bursaries to needy Kenyan students; to recover all outstanding loans given to former university students since 1952 through the Higher Education Loans Fund (HELF); to establish a revolving fund from which funds could be drawn and lent out to needy Kenyans pursuing higher education; to invest surplus funds in any investments authorized by law; and, to source for funds from other organizations (the private sector, philanthropic organizations, foundations etc). It was anticipated that the establishment of a revolving fund would also ease pressure on the national education expenditure, which had over the year been close to 40% of the national budget.
The Record of experience so far and the hurdles ahead Eight years after the Board was set up, a review of performance shows that the Board has tried to overcome some of the difficulties experienced by the previous LDRU. One of the major achievements of the Board has been the increase in the number of students funded in both public and private universities, made possible by an aggressive campaign by the board to recover outstanding loans. When it was set up, students in private universities were not entitled to the loans, since there was an assumption that they are from financially able families. Although the number applying for the loans is lower than those in the public universities, more than half of the private university students who apply do get the loans (Table 1). One crucial category of higher education students not covered is those in the national polytechnics. This is a challenge for Board because polytechnic education is not only equally expensive (thereby justifying assistance), but most of the graduates also have better job prospects than university graduates (increasingly the likelihood of better repayment).
1 The “boom” was a stipend/pocket money of Ksh 5,000 (US $64) per semester. Students mainly spent it on buying music systems and other forms of entertainment such as cinemas and for transport.

4
Table 1: Loan disbursement by university type and amount, 2002/2003 AY Applicants Loan amount University
All Awarded % Awarded
Ksh* US$ % of all students receiving
UEAB 416 332 79.81 10,462,000 454,870 25.4
CUEA 354 303 85.59 9,525,000 414,130 20.5
USIU 106 74 69.81 2,377,000 103,348 3.2
P R I V A T E Daystar 263 195 74.14 6,173,000 268,391 10.8
All private 1,139 904 77.3 28,537,000 1,240,739 15.0
Nairobi 8,931 8,426 94.35 284,982,500 12,390,543 60.3
Moi 6,551 6,276 95.80 210,159,000 9,137,348 61.5
Kenyatta 5,586 5,271 94.36 177,087,500 7,699,457 52.8
Egerton 5,006 4,775 95.36 159,887,000 6,951,609 47.9
JKUAT 2,205 1,997 96.99 67,320,000 2,926,957 51.3
P U B L I C
Maseno 2,524 2,370 93.90 79,389,000 3,451,696 34.4
All public 30,803 29,115 95.1 978,825,000 42,557,609 51.4
All universities 31,942 30,019 86.2 1,007,362,000 43,798,348 33.2
*Ksh = Kenya shillings. 1 US $ = Ksh 23 (2002 Purchasing Power Parity). Key: UEAB = University of Eastern Africa at Baraton; CUEA = Catholic University of Eastern Africa; USIU = United States International University; JKUAT = Jomo Kenyatta University of Agriculture and Technology
Information presented in Table 1 indicate that the achievements realized in widening participation in the loan program notwithstanding, HELB loans for 2002/03 AY were accessed by only one third of all university students in the country, thus leaving out a significant number of students. Those left out include students in parallel or alternative degree programs who are currently ineligible according to HELB criteria, as well as postgraduate students of which less than one percent access the loans. The limitation of loans to regular program students in itself amounts to serious inequity since the self-sponsored students account for about 22% of undergraduate enrolment (Table 2).

5
Table 2 Enrolment in undergraduate programs, 2001/2002
Male Female Total Program
n % n % n %
Regular 30,574 71 12,773 29 43,347 78
Module II/SSP* 7,901 65 4,185 35 12,086 22
All programs 38,475 69 16,958 31 55,433 100
Source: Mwiria and Ng’ethe, 2002 *SSP = self sponsored programs
The assumption that the self sponsored students are financially able does not hold as most were not admitted in the regular program for failure to meet the university admission requirements, itself a system which favors sons and daughters of rich people who access elite secondary schools and proceed to dominate the university admissions. The popularity of these programs is not therefore due to affordability but an increased demand for higher education, seen as the escape route out of the poverty that stalks the majority of the population (currently, up to 56% of Kenyans live below the poverty line – Republic of Kenya, 2002). This explains why even children of the poor sacrifice to enroll in public universities and alternative (Module II) programs in public universities, albeit in comparatively fewer numbers.
The low proportion of private university students applying for the loans, particularly at USIU, could be attributed both to the fact that majority are from rich families, and the perception that loans are ‘meant’ for public university students and they are therefore less likely to benefit. USIU (which is the largest, most expensive but yet the most popular private university) is patronized by students whose parents work with international organizations in Kenya including diplomatic missions. It is also the only university that is 100% dependent on fees, and yet is also the only one so far with functional student aid programs. Arguably, private university students are also averse to incurring future debts when their parents are able to meet the present cost of their education, a fact that cannot be discounted either, at least not with the behavior of some public university students. Among this latter group, between 25 and 30 per cent of the students do not apply for loans and opt to finance their studies directly2. These are students from able families. The reality is that some of them attended expensive high schools where the annual fees charged are way above the fees they pay in the universities. If this category of students are eliminated, together with the 22% enrolled in parallel programs, only about half of the students in universities apply for loans. It would therefore not be far fetched to argue that those who do not receive loans constitute less than 20% of the entire university population.
2 This came out in a conversation the author had with the Secretary of HELB.

6
The sheer growth in the amount of loans disbursed by the Board is also testimony to the progress it has made, particularly given the decline in government funding for higher education. While enrolment in public universities has grown in excess of 400% between 1987 and 2000, government funding increased by only 30% (Ramani, 2001). The loan program has also evolved from being the fastest growing component of university education (Mungai, 1989), with yearly funding reaching a high of Ksh 880 million in 1995 and dropping to the current Ksh 600 million, reflecting a 32% decline. In the face of this diminished government funding, however, there has been a gradual increase in the amount of loans disbursed by HELB (Table 3).
Table 3: Total loan disbursements, 1993/94 - 2002/03 AYs Cumulative disbursements Year Ksh US$
% Increase
1993/94 4,802,516,543.00 208,805,067 -
1994/95 5,845,769,503.00 254,163,891 17.8
1995/96 7,169,391,939.00 311,712,693 18.5
1996/97 8,124,181,961.30 353,255,303 17.6
1997/98 8,956,953,104.12 389,432,744 9.3
1998/99 9,814,187,581.12 426,703,808 8.7
1999/2000 10,761,479,881.12 467,890,430 8.8
2000/2001 11,700,952,981.12 508,737,086 8.0
2001/2002 12,633,945,331.12 549,301,971 7.4
2002/2003 13,641,307,331.12 593,100,319 7.4
Source: Higher Education Loans Board, 2002
The Board has made some steps towards limiting over-reliance on government funding. Currently, up to 50% of disbursed funds are generated from recoveries, which, as of 2002, averaged Ksh 50 million (US$2,173,913) per month. Despite this achievement, the Board is far from achieving full cost recovery, a daunting task for many loan programs.
One of the objectives for which the program was initiated is to establish a revolving fund. This assumes that it would be fully self-sustaining, or in other words, achieve full cost recovery. The notion has been challenged severally in literature on student loans (see Johnstone (2001) for a more elaborate discussion). Several factors militate against the theory of self-sustenance, or the so-called revolving fund. These include diminishing governmental outlays for loan programs relying on government capitation, natural increases in student population and consequent demand for financial

7
support, realities of unemployment, the hidden subsidies in most programs and death – a serious concern in some developing countries given the high morbidity resulting from the HIV/AIDS scourge. In Kenya, it is reported that more than 20 teachers succumb to the scourge per month, yet, repayments by teachers constitute more than half of all repayments in the program.
Another factor that is likely to impede the realization of ‘self reliance’ is the bursary component of the loans. Not only does it pose a challenge to the flow of funds for the program, it also raises deep equity issues. The bursaries on average constitute about 7% of the total funds disbursed (Table 4). The Board gives a maximum bursary of Ksh 8,000 (again given on the basis of need, meaning not everyone gets full bursary). This is equivalent to the full cost of tuition in a year. Given that the very poor constitute only 7.54 of university students (figure 2), the award of bursaries seem to be fairly generous, as the analysis in Table 4 indicates that in some instances more than half of those who get loans also get bursaries. This raises the possibility that even some who do not deserve the bursaries finally benefit. It is not surprising since the information indicates that students cheat about the financial backgrounds of their parents/guardians so as to benefit from the loan program. It is thus necessary to tighten the means testing procedures.
Table 4: Summary of bursary awards, 1995/96 – 2002/2003 Bursary Bursary awards
Year Ksh US $
% of loans
Loan awards All % loan
awards 1995/96 53,543,203.00 2,327,965 4.0 33,283 8,148 24.51996/97 60,027,555.00 2,609,894 6.3 31,441 8,606 27.41997/98 64,628,000.00 2,809,913 7.8 27,882 8,701 31.21998/99 64,622,000.00 2,809,652 7.5 28,748 9,026 31.41999/00 68,959,000.00 2,998,217 7.3 29,835 12,531 42.02000/01 79,980,000.00 3,477,391 8.5 29,019 13,527 46.62001/02 73,041,000.00 3,175,696 7.8 28,206 14,381 51.02002/03 56,051,000.00 2,437,000 5.6 31,942 10,630 33.3
Source: Computed from data provided by HELB, 2002
There is no doubt that bursaries are an important instrument in ensuring equity given that those from the upper and upper middle income groups who get the loans are invariably enrolled in more ‘prestigious’ programs like medicine and law and were qualified/admitted into these programs because of the higher grades they scored in national secondary examinations – again because of the better schools they attended. They, therefore, have higher prospects of landing better paying jobs faster, not only because of ‘ready’ jobs, but also due to their family connections. Bursaries are, therefore, one means of increasing poorer students’ access to funds. They also minimize the burden of repayment.

8
While the extent to which only the needy benefit from bursaries in the Kenyan program is yet to be investigated, they do limit the possibility of recovering the real value of loans, since bursaries are full grants. In effect, a loan program that has a bursary component can only hope to recover a certain proportion of funds disbursed, even if there are no subsidies such as low interest rates. Ideally, a loan program will never fully satisfy demand. In other words, there is not likely to be a situation where there are more funds than are needed.
The decline in the rate of growth of disbursements as reflected in Table 3 is mainly due to the increase in the number of students qualifying for HELB loans and the widening of the list of eligible applicants coupled with reduced government funding. Initially, the Board only gave loans to public undergraduate students. It has since included private university students as well as masters and doctoral students in public universities. Though fewer, the loan value for postgraduate students is significantly higher. For instance, while the maximum loan for undergraduate students is Ksh 42,000 (US 1,826), doctoral students get loans of up to Ksh 150,000 (US 6,522) per year, which is 3.5 times that for an undergraduate student. The doctoral students are given loans on the condition that they are currently repaying the previous one received during their undergraduate studies. This is one way of encouraging repayment among those envisaging postgraduate education.
Improving recovery When it was set up, the Board inherited a large portfolio of unpaid debts, with the rate of recovery being very low at only 3.3%. This rate has increased to over 18%. The increase is attributed to aggressive public education, the enactment of a legal instrument binding loanees and employers to ensure repayment, and streamlined record keeping, among other factors. It may be argued that the recovery rate of 18% in 2000/2001 is only a modest improvement and that it is still very low, but considering that it was only 3.3% less than 10 years ago, and further taking into account the prevailing economic conditions in Kenya (low economic growth rate, high unemployment, staff lay offs, high death rates resulting from HIV/AIDS pandemic, etc), all indications are that it will surpass the 20% mark by the end of 2002.
Sustained overall improvement in loan recoveries will depend to a great extent on the effort made by the Board to enforce recoveries from beneficiaries outside the public sector. Currently, the bulk of recoveries are from those in government and quasi government/public bodies (Table 5), with collections from teachers alone accounting for about 56%, while together with other government departments and state corporations, they account for nearly 76%. Whereas the recoveries reflect trends in employment, with the government being the largest employer, the low recoveries from other sectors point to the difficulty in reaching those in the private sector or in dealing with sheer unwillingness to repay. Non Governmental Organizations (NGOs) for example employ a significant number of past loanees but they are also very mobile (since they change jobs or they may be stationed in remote parts of the country or even in neighboring countries but with bases in Kenya). Equally difficult to reach, even though few in number are employees of diplomatic missions since their employers cannot be legally compelled to abide with the provisions of the HELB Act or any other law.

9
Table 5: HELB Loan Recovery by employment category, January – September 2002 Amount Sector/employment category Ksh US $
% of total
Agricultural organizations 332,482.10 14,456 0.71Diplomatic missions 19,696.60 856 0.04Educational institutions: schools, colleges 2,333,973.00 101,477 4.97Financial institutions 1,885,788.50 81,991 4.02Individuals/self employment 1,219,417.90 53,018 2.59Insurance companies 493,539.70 21,458 1.05Manufacturing 1,635,772.80 71,121 2.91Government ministries/departments 6,942,656.80 301,855 14.80Non Governmental Organizations (NGOs) 387,028.80 16,827 0.82Parastatals/state corporations 2,900,182.40 126,095 6.18Service industries 1,451,874.60 63,125 3.09Teachers’ Service Commission 26,167,766.30 1,137,729 55.77Others 1,420,806.80 61,774 3.03Average total 46, 920, 986.30 2,040,043
Source: Higher Education Loans Board, 2002
Recoveries depend both on accessing past borrowers and on enforcement. The Board may be able to access borrowers but be unable to enforce recoveries, the legal provisions notwithstanding. The issue of “what income” from which loan repayments could be drawn is more crucial in income contingent repayment plans than with mortgage type loans schemes. Consequently, the concern with this type of loan is not the total income of a borrower but with his/her ability to meet the fixed schedule of monthly repayments. Such thinking is reflected in the Kenyan program, although it overlooks the fact that some borrowers could be willing to repay but are not in salaried jobs. It is a fact that should not be overlooked especially in a country where the formal employment sector has contracted and a significant number of graduates find themselves in the informal sector. It is such failure to define “income’ that partly explains why the recoveries from individuals is low.
For loan programs that provide for a ‘grace’ period (the Kenyan program provides for two years), it makes sense to compute a ‘net’ recovery rate on the basis of the ‘matured’ loans. The recovery information discussed above represents ‘gross’ recovery. It would then mean that the actual recovery rate would be much higher if computed on the former criterion. While the provision of a grace period is contestable among others on the grounds that it delays recovery, it makes sense in systems that are characterized by high unemployment (currently at 26 percent - in itself a serious setback to recovery efforts because the economy is not generating enough jobs to make repayments – from the employed, possible). In such a case, a loanee is not penalized for late or delayed payment. However, where there is ‘chronic’ unemployment such as Kenya, the loanee

10
may not be able to start repaying even when the two-year period is over. To illustrate this point, Box 1 presents sample data prepared by HELB on matured loans for a cohort of loanees since its establishment in 1995. The data is for most of the university programs running for an average of 4 years.
Box 1
In 1995, HELB disbursed a total of Ksh 630 million as loans to 6,316 first year students. From this cohort, it has so far been recovering a total of about Ksh 6.420 million (US$279,000) monthly from 3,000 loanees, the majority of whom are teachers, instead of a possible Ksh 12.7 million (US$552,174) from all loan recipients for that year. This is less than 50% of this cohort who are repaying the loan (Cheboi, 2002).
Arguably, the lending authority may also lose track of the graduates in the two-year period through job mobility, emigration or mere difficulty in reaching those who go back to rural areas and remain unemployed. The situation is worsened by lack of follow up arrangements between loanees and universities on the one hand and loanees and HELB on the other. As noted elsewhere (Otieno, 1997), there are no arrangements for reconciliation of records between the program, universities and MoE/CHE and banks disbursing the loans.
The mere recovery of loans should not be taken to mean that a program is performing well. Even if recovery is 100% (though no loan program can so far claim to have achieved that feat, not even the much touted success stories of Australia and New Zealand (Johnstone, 2001), factors such as the length of repayment, interest rates, costs of administration, etc. will not make full cost recovery possible. One option for the Kenyan program is to convert itself into an income contingent scheme, the reasoning being that those with higher earning can repay their loans faster, even though Johnstone and Aemero (2001) discount the applicability of income contingent repayment plans in Ethiopia, and, by extension, in other developing countries. It should however be noted that there could be other ‘variants’ of income contingent repayment plans not necessarily modeled on the Australian HECS type and depending on each country’s socio-economic experience. Loan programs the world over are still evolving and none of them are perfect.
The conversion of the Kenyan program into an income contingent plan is likely to yield two advantages. First, the loans will be recovered in good time before their value is further eroded. Second, for the loanee, s/he will pay off debts fast enough to allow for further borrowing for other purposes, in the event that this is a possibility. Third, for the program, it is able to cushion itself against eventualities of death, emigration, lays offs (or, as popularly known in Kenya, retrenchment), etc especially in a depressed economy such as Kenya’s. Already, the Board is exploring this option (East African Standard, August 4th 2001, p.15). This option has become more attractive following the massive government layoffs in 2000 – 2001 period that saw several loanees lose their jobs before completing or even starting loan repayment.
11
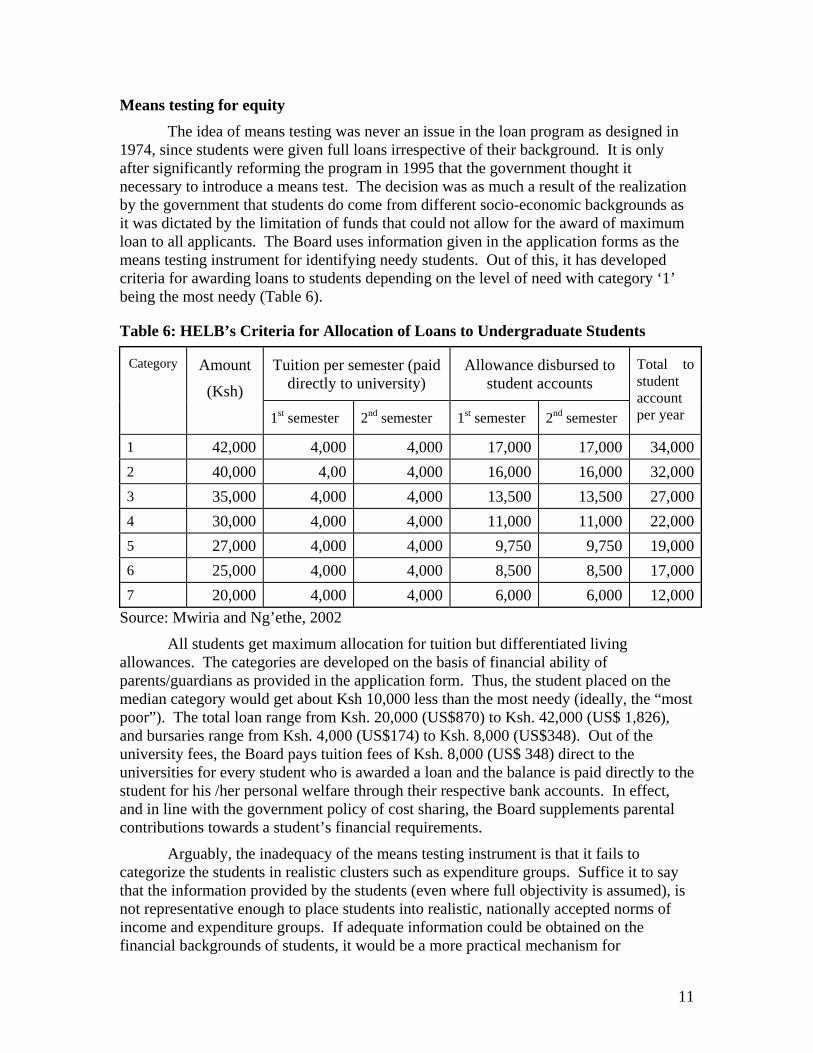
Means testing for equity The idea of means testing was never an issue in the loan program as designed in 1974, since students were given full loans irrespective of their background. It is only after significantly reforming the program in 1995 that the government thought it necessary to introduce a means test. The decision was as much a result of the realization by the government that students do come from different socio-economic backgrounds as it was dictated by the limitation of funds that could not allow for the award of maximum loan to all applicants. The Board uses information given in the application forms as the means testing instrument for identifying needy students. Out of this, it has developed criteria for awarding loans to students depending on the level of need with category ‘1’ being the most needy (Table 6).
Table 6: HELB’s Criteria for Allocation of Loans to Undergraduate Students
Source: Mwiria and Ng’ethe, 2002
All students get maximum allocation for tuition but differentiated living allowances. The categories are developed on the basis of financial ability of parents/guardians as provided in the application form. Thus, the student placed on the median category would get about Ksh 10,000 less than the most needy (ideally, the “most poor”). The total loan range from Ksh. 20,000 (US$870) to Ksh. 42,000 (US$ 1,826), and bursaries range from Ksh. 4,000 (US$174) to Ksh. 8,000 (US$348). Out of the university fees, the Board pays tuition fees of Ksh. 8,000 (US$ 348) direct to the universities for every student who is awarded a loan and the balance is paid directly to the student for his /her personal welfare through their respective bank accounts. In effect, and in line with the government policy of cost sharing, the Board supplements parental contributions towards a student’s financial requirements.
Arguably, the inadequacy of the means testing instrument is that it fails to categorize the students in realistic clusters such as expenditure groups. Suffice it to say that the information provided by the students (even where full objectivity is assumed), is not representative enough to place students into realistic, nationally accepted norms of income and expenditure groups. If adequate information could be obtained on the financial backgrounds of students, it would be a more practical mechanism for
Tuition per semester (paid directly to university)
Allowance disbursed to student accounts
Category Amount
(Ksh) 1st semester 2nd semester 1st semester 2nd semester
Total to student account per year
1 42,000 4,000 4,000 17,000 17,000 34,0002 40,000 4,00 4,000 16,000 16,000 32,0003 35,000 4,000 4,000 13,500 13,500 27,0004 30,000 4,000 4,000 11,000 11,000 22,0005 27,000 4,000 4,000 9,750 9,750 19,0006 25,000 4,000 4,000 8,500 8,500 17,0007 20,000 4,000 4,000 6,000 6,000 12,000

12
determining need and hence allocation of loans. However, the Board does not have the capacity to perform such a function and could borrow the expertise of the relevant government departments such as the Central Bureau of Statistics (CBS) that compiles yearly data on socio-economic aspects of the population. The problem with this is that it can actually lead to an increase in the overall cost of loan administration.
At this point, it is pertinent to ponder the question: how far can a financing instrument such as a loan program contribute to equity in university education? The answer depends on the pattern of university enrolments. Where majority of the students come from the higher socio-economic groups (as is the case in Kenya - Figure 2), the program can do little in redressing inequities inherent in an education system. Certainly, the Kenyan loan program exacerbates inequity in so far as it disproportionately benefits (subsidizes) education of the more affluent segment of the society, which constitutes 45 percent of the population of university students. Redressing such inequities is however beyond the means of the loan program since they stem from lower level (secondary) school education. Equally, where there are gender disparities in Kenyan university education, the loan program can do little to enhance equity. In a nutshell, it is highly debatable what means testing, no matter how rigorous it is, can do when the majority of the loan applicants already come from the higher income bracket, even though it could be further argued that in such a case, it is necessary to ensure that the few resources available go to the right/deserving people.
Figure 1: Distribution of university students across per capita expenditure quintiles (%), Kenya, 1994
4.46
44.78
7.54
20.96
22.25
Richest Fourth Third Second Poorest
Source: Deolalikar, 1999
Another deep equity issue is the sufficiency of the loan funds in meeting the needs of the recipients. While in theory the tuition component at public universities is fully defrayed for those students who get maximum loan amounts, it constitutes a very insignificant portion of tuition costs at private universities where on average tuition is as high as 11 times that of (regulated) public universities (Table 7).

13
For ‘high’ cost universities such as USIU, the maximum tuition fee portion covered by the loan program is a mere 4.7 percent while for ‘low’ cost ones like CUEA, it is still only 6.8 percent. The board cannot increase the tuition component to private university as it could trigger proposals by public universities for tuition fee increases, since the Board would more or less be obliged to provide loans covering half tuition costs (which would be good news for the universities since it would mean increased income). Given the foregoing, therefore, the current differences are almost certain to persist.
Table 7: Private universities tuition fees, 2001/2002AY Tuition fees
University Ksh US$
USIU 171,540 (57,180 per quarter) 7,458CUEA 117,760 (58,880 per term) 5,120UEA - B 144,000 (48,000 per quarter) 6,261Daystar 131,000 (65,500 per semester) 5,696
Source: Fees structures, various universities
Other hurdles on the way One of the major challenges facing the board is raising enough revenue to fully
satisfy the demand for loans. First, as already shown, though all students admitted in public and private universities are eligible for the loans, only a small fraction do eventually benefit. Even those who benefit complain that the loans they get constitute a paltry proportion of the expenses they have to meet. Consequently, some students have resorted to various coping mechanisms including doing menial jobs within the universities to the detriment of their studies. It is not uncommon to find university students working as barbers, cobblers, hairdressers, ‘brokers’ in computer typing and printing, vendors/hawkers of light goods such as writing/photocopying papers, electronics, cigarettes, etc.
In the period preceding the establishment of HELB, not much thought was given to recovery, and the government gave loans without expecting repayment. Attempts to recover the loans were casual at best. It is only with the establishment of HELB that serious efforts were made to recover the loans. Still, the current recovery rate of about 20% could be substantially improved. However, several obstacles stand in Board’s way in this regard. First, the Act of Parliament that established HELB empowers it to collect loans only from people who are in formal employment. With unemployment at 26%, many people have resorted to self-employment and cannot therefore be reached by the Board. The informal sector is currently the largest and fastest growing sector in Kenya.
Second, and as already stated, the board does not have enough manpower to visit all the employers to verify the status of their employees. It has only employed about four loans inspectors who cannot live up to the task. It should also be noted that when the idea of the loans Board was introduced in the country, it encountered some degree of hostility from the students, community and parents. Most students viewed the loans as free grants from the government. This attitude has slowed down loan repayments.

14
Recoveries are not likely to increase significantly due to the poor economy (with growth in the last three years having been less than one percent, sometimes negative), systematic lay offs in both public and private sectors, and, significantly, a freeze in public sector employment, massive unprecedented emigration, and high death rates resulting from HIV/AIDS pandemic, among others. Recovery will call for ingenuity in overcoming these hurdles.
While the Board has tried to improve its record keeping, it still faces the challenge of overcoming scanty records for past loanees before it was set up. Records of loanees between 1983 and 1986 are permanently missing and cannot be found (Bogonko, 1992). It is possible that either by collusion or connivance, somebody who was probably a beneficiary in the period deleted them so as to escape the responsibility of having to repay the loans. This is possible because some of the people employed in the disbanded LDRU were themselves loanees and may have used their presence in the section to ‘secure’ their future by tampering with the records. It is instructive to note that the missing records are for a full university circle of three years (as the system then was).
Despite the means testing instrument in place, it is not rigorous enough and students have often cheated and gotten loans when they did not deserve them. It has been reported that up to 25% of students who get loans lie about the education, employment and income status of their parents (Mwiria and Ng’ethe, 2002). Some even claim that their parents are dead when they are alive and working. The challenge of developing a tight means testing mechanism is also made difficult by the inability of the Board to verify the information provided by the applicants on the form. It would necessitate interviewing the parents/guardians or visiting their homes and families, a task that is beyond the Board.
The Board has tremendous powers conferred upon it by the Act. Before it was set up, a major limitation in loan recovery was the Limitations of Actions Act. In order to improve on recovery, HELB was exempted from this law and allowed to retroactively apply not only the exemption clause but also the entire Act. The Board also has powers to prosecute employers and beneficiaries who fail to comply with the provisions of the Act. In addition, employers are bound by the Act to provide the Board with records of loanees in its employment. However, there is no evidence so far that the Board has taken any employer/employee to court. There are several loanees even in public sector employment (e.g. the universities) who are not repaying and yet, no action has been taken against them by the Board. Part of the reason for this reluctance is due to the lack of political will to implement some measures that are seen as politically sensitive. Implicitly, prosecution of loanees for non-compliance can also be negative public relations, as it will project the Board as a vengeful taxman and discourage late but willing loanees. However, prosecution could also work positively as it will send a strong signal that the Board is determined to ensure that every employer and loanee meets her/his obligation.
Johnstone (2001a) and Johnstone and Aemero (2001) cited two major, and partly conflicting, goals for student loan programs: the supplementation of governmental revenues (which depends on the degree of effective cost recovery, and also the tapping of private capital), and the expansion of higher educational participation. The Kenyan program has not been very successful in either regard, save for a scholarship scheme that

15
it has with the Visa Oshwal community in Kenya that is benefiting 101 students for the entire duration of their studies in the public universities (Mwiria and Ng’ethe, 2002). Assuming that the board would give full loans of Ksh 42,00 for each of the students, the assistance amounts to (savings of) Ksh 4,242,000 (US$ 184,435) per year, and Ksh 16,968,000 (US $ 737,739) for the four-year study duration. Other than this one time assistance, the program is dependent on the traditional government subventions and recoveries, though it is mandated to secure other forms and sources of funding.
Without doubt, there has been a significant expansion of higher education in Kenya, particularly in the last five years, and the Board has been a significant source of funding for students particularly in the public universities. Be that as it may, the overall expansion of higher education in Kenya cannot be attributed solely to the loan program for several reasons, two of which stand out. First, a significant proportion of the expansion (22%) is due to the initiation of Module II or parallel programs as they are popularly called. So far, these students are not eligible for support from the loan program. Secondly, there has been a significant growth in the number of private universities in Kenya who enroll about 15% of all university students.
The Kenyan program is highly subsidized, given that it carries an interest rate of only 4% (effective on repayment after a ‘grace’ period of two years). This is way below the market interest rate of 17 - 20 percent and is one of the grounds on which the program has been criticized as being too lenient. However, subsidies associated with government funded student loans can be defended from the standpoint of the government’s obligation to provide social services to its citizens. This is part of its responsibility in exchange for the support it receives from its citizens in terms of taxes and compliance with the law. As the custodian of collective social interest, it should bear a portion of the cost of services it gives the citizens. However, it is also facing competing interests for the few resources it has. On this score, it makes sense to expect student loan programs to be able to generate sufficient funds not only to be able to sustain themselves but to release the limited resources to service other sectors.
Internally, the need to expand higher education access through the available cost sharing instruments such as student loans justify the elimination of subsidies and institution of real cost recovery measures. This constitutes part of the twin but competing (if not contradictory) goals of student loan programs as ably expounded by Johnstone and Aemero (2001). The issue of subsidies in loan programs is not only about the economics of lending and borrowing, but is also political, particularly in the developing world where students constitute an important and volatile political constituency that need to be mollified. The last thing a government would want to do is to provoke them by implementing decisions that they consider punitive. It is for this reason that the current loan repayment terms are likely to remain for a long time to come.
The Way forward for Kenya’s loan program Drawing from the seven-year existence of HELB as well as well as the lessons
from the previous years, there are several measures and policy considerations that need to be taken into consideration for the program to fully meet the objectives for which it was set up. The challenges include facilitating expansion of university education, addressing issues of equity and efficiency in funding universities and other post secondary/tertiary

16
education, enhancing recovery, and tapping additional sources of finance other than the government.
The Board needs to look beyond itself and recognize that there are other sources of borrowing which could be tapped by those desiring higher education, including commercial banks. The only reason why students and parents may not be going for these facilities is that they have so far been made to believe that HELB is the only local source of education funding and the idea of alternative borrowing may not have been sold to them. There is absolutely no reason why people should borrow money from commercial banks for physical investment but be unwilling to borrow the same for human capital/educational investment. In this regard, there is need for managers of the program to carry out public education for the loanees and Kenyan society in general. There are no reasons why students and their parents cannot, for instance, borrow from the market in order to finance the shortfalls from HELB assistance, more so given that 45 per cent of the students in Kenyan universities come from the richer sections of the society.
Accessing private credit would significantly release funds, which could in turn be used to expand higher education places. There have been no attempts so far to encourage banks to initiate softer loan facilities for education with probable government guarantees. The argument normally given for not accessing credit from commercial banks for education is that the bank rates are too high. While this is true (with some banks charging interest rates of over 25%), avenues do exist outside banks and mostly in the savings and credit societies that give loans for lower level/secondary education. Curiously, some beneficiaries are educated with loans from cooperative saving and credit societies at the secondary level but their parents are not ready to go for the same loans to finance university education, mostly due to the belief among Kenyans that university education should be ‘free’ as it has been for a long time.
Other opportunities relate to making university education more relevant to the needs of the Kenyan society. The Board does not have the capacity to ensure this on its own since its responsibility is to disburse loans to those qualifying for university education. However, it could insist on the adoption of some policies that will satisfy its clients. Currently, the Board disburses the tuition component of the loans to the university where a student has been admitted. It is only the living allowances that are disbursed directly to the students’ accounts. This policy has resulted into complacency among the universities, as they are sure that students will be forthcoming. Were the whole amount to be placed in the hands of the student in a liberalized admission regime, the students could opt to take the money to some other university for a different program other than the one where s/he is admitted. In this regard, the Board could lobby for a revision of admission policies that will allow students to invest the funds in courses/programs in which they see most returns, whether monetary or otherwise.
There are a number of equity concerns in the program that needs the attention of the Board. One of the aims of the program is to promote equality of opportunity in higher education. Equality implies justice or fairness. The loan program as such should open avenues for access to higher education for those who qualify and equitably distribute financial support to the qualifying students. The program has so far compromised this goal, as the bulk of the students benefiting have been public university students. Other higher education students (defined as post secondary tertiary institutions)

17
have so far been locked out of the program, understandably due to limited finances that the board can disburse in any given year. Even for all the public university students who qualify, the loans awarded do not take into account the demands of the programs or courses students are enrolled in. Some course such as medicine and engineering for instance are labour intensive and require greater financial commitments. Even other perceived laboratory courses as chemistry require a lot of input. Further, students enrolled in one program may have different financial needs and requirements than students in another program. If two students are admitted in the school of education, one taking subjects such as history and religious studies while the other takes fine art or home economics, and given similar loan values, equity is not addressed. The former category only needs a lecture room, board, chalk, and writing materials while the latter category has to spend additional money on fabrics, colourings, etc. The financial burden of this latter category is thus greater. Overall, however, that the program has enabled students who qualified for university education irrespective of gender or socio-economic background is to be appreciated. The increase in university opportunity index attests to this fact.
Indicatively, since primary and secondary education respectively form the foundation for higher education, achieving equality of opportunity and equity at the university is only possible when the provision of education at the base (primary and secondary levels) is equitable both in access to and distribution of educational resources. Given the manifestations of inequalities in the two levels of education (Deolalikar, 1999; Mitha, et. al, 1995; Karani, et.al.1995), it is only logical to address the two issues at these levels first. Suffice it to say then that achieving equality of opportunity and equality in higher education calls for the implementation of a whole set of intervention measures that will address ills inherent in the entire education system right from the primary level. When this is done, the loan program could be used, along with other measures (fees, grants and scholarships), to enhance equity.
Relying exclusively on the loan program to achieve equity goals in higher is both shortsighted and impractical. An examination of the rates of return to the different levels of education and the costs borne by the government and households in Kenya (Table 8) and their implications underscores the futility of trying to address the twin goals at the higher education level via the loan scheme without targeting the lower level of education. Within the framework of the loan program, options include infusing a more realistic interest rate as opposed to the current highly subsidized rate of 4%, which is 16 percentage points below the prevailing base market rates of over 20%. The perceived under investment in primary education, which clearly has higher social benefits, is lent credence by the current pattern of expenditure that is heavily tilted in favour of higher education, with the government bearing up to 92% of the costs of university education as opposed to the eight percent borne by the households.
Evidence also shows that by 1997, the government spent only Ksh 2,774 (US$ 121) per primary school pupil and Ksh 9,418 (US $409) per secondary school student while expenditure per every university student was Ksh 115, 812 (US $5,035), meaning that the government spends as much as 42 times on a university student as on a primary school pupil (Abagi, 1997). Taking a chunk of funds from university education and transferring it to the primary level would be more optimal. On the other hand, the

18
relatively low benefit to an individual from secondary education reflects the expensive nature of this level of schooling. The import of the high cost is that only those who are financially able to purchase secondary education eventually proceed to benefit from the highly subsidized loan program at the university. Students from the disadvantaged socio-economic background are as such excluded from both secondary and university education (see figure 2). Stated differently, the current loan arrangement in Kenya gives clear preference, at the university level, to the children of parent who were able to purchase secondary education for their children. This strengthens the case for a review of the loan program features in a way that would make the financing regime both realistic and equitable.
Table 8: Rates of return to education in Kenya, 1994 and cost borne by government and households
Rate of Return Percent of costs borne by: Level
Social Private Difference Government Households Primary 8.1 13.5 5.4 69 31 Secondary 7.4 12.6 5.2 40 60 University 5.7 19.7 14.0 92 8
Sources: Welfare Monitoring Survey, 1994; Republic of Kenya, 1998; Ayako, Katembu, Nzomo and Monyoncho, 2000
It has been argued elsewhere (Johnstone, 2001) that using more specialized government agencies such as the income tax departments could enhance recoveries. In Kenya, this could be done by contracting the state tax collection agency, the Kenya Revenue Authority (KRA). Such a move is likely to result in better recovery rate because the authority already has records of employed graduates, something that HELB does not have. Indeed, the rate is low because the program has relied heavily on recoveries from those graduates in government, parastatals (state corporations), the TSC and a few private companies, mostly because these are known entities and easy to reach. It otherwise does not know where many other graduates are currently working or if they are working at all.
The well organized operations and mandate of KRA puts it at an advantageous position both for tax collection and debt recovery. For example, the division of the country including Nairobi into tax regions for the purposes of ensuring tax compliance, and each region having assigned officers, makes it easier to visit offices at random and check if there are any traders or firms evading tax payments. This is a responsibility that the HELB inspectors have so far been unable to effectively discharge. KRA could arguably be singled out as one of the very few efficient public institutions in Kenya today. Given that it has records of loanees, it will not even need to look for them, but only put out a notice to graduates of the effective date when it will affect the recoveries. Such a move would not totally be new. In the past, KRA has undertaken collection of dues on behalf of National Hospital Insurance Fund (NHIF) and Catering Levy Trustees (CLT), resulting in significant increases in collections, even though the NHIF move was scuttled after a very short period without valid reasons being given. This should by no
19
means be a deterrent for the circumstances are quite different. However, there has to be very strong and visible political support for such an initiative to succeed.
Some of the plans by HELB indicate that it is indeed on the right track in ensuring a widened access to credit by those desiring to invest in higher education. It is currently negotiating with commercial banks, through their umbrella body, the Kenya Bankers Association (KBA) to offer soft loans to students3. Such loans will be guaranteed by HELB. It is envisaged that the negotiations might yield useful results by the beginning of the new year (2003). If it succeeds, it will revolutionize higher education financing in Kenya since previously, the banks had indicated that they were unwilling to engage in educational lending due to the high risks involved (Otieno, 1997). More significant is the likelihood of freeing funds that the Board could then use to expand access to higher education by giving out more, or increasing the amount of loan per student. The degree to which the initiative succeeds will depend on the number of banks involved, the total volume of the funds available for lending and the terms of lending. Ideally, given the positive increase in recovery rate, the Board should have no problem in convincing the banks that the loans are recoverable. If, as a non-banking institution it has been able to recover Ksh 50 million monthly, the banks with more experience and infrastructure in debt management should do better. It will however depend on the arrangement whether the banks will recover the monies directly or whether the Board will recover the loans on their behalf.
Conclusion The Kenyan loan program has come along way. From an institution making a
gross loss of over 103% (Albrecht and Ziderman, 1991), it is currently one of the few functional loan programs in Africa (with the possible exception of the South African program) which has significantly reduced government dependence to about 50% of its disbursements, yet, like most loan programs all over the world, it has a number of obstacles to overcome including raising enough funds to be able to serve as many as are the claimants thereby expanding access to higher education and ensuring real cost recovery while limiting debt burdens in such a way that it will encourage loanees to repay. While the current recovery rate is not good enough, it is a significant achievement in less than 10 years. Not only has the Board been able to raise recoveries significantly, it has also reduced the administration costs and procedures, including setting up an interactive website. Avenues for improvement do exist and in particular, means testing needs to be tightened in order to ensure that the loans serve the very purpose for which the program was introduced, namely, to expand access to higher education through equitable distribution of available funds.
3 Personal conversation with the Secretary of the Higher Education Loans Board

20
References
Abagi, O. (1997) “Public and Private Investment in Primary Education in Kenya: An Agenda for Action.” IPAR Discussion Paper No. DP/005/97. Nairobi: Institute of Policy Analysis and Research (IPAR)
Albrecht, D and A. Ziderman. (1991) Deferred Cost-Recovery for Higher Education: Student Loans in Developing Countries. Washington, D.C: IBRD/ The World Bank.
Ayako, A.B., T.M. Katembu, J. W. Nzomo and J.K.M. Monyoncho, (2000) “Education Financing in Africa: The Kenya Case Study.” Unpublished Research Report. Nairobi, September.
Bogonko, S.N. (1992) A History of Modern Education in Kenya, 1895 – 1991. Nairobi: Evans Brothers (Kenya Ltd.).
Cheboi, B.C. (2002) “Financing Higher Education: The Experience of the Higher Education Loans Board.” Paper presented at the first Exhibition by Kenyan Universities held at Kenyatta International Conference Centre, Nairobi, May 2002.
Daily Nation, February 19th (2002) “Blackboard. Emerging Trends in Higher Education.” pp. 23 – 31.
Deolalikar, A.B. 1999. “Primary and Secondary Education in Kenya. A Sector Review in Kenya.” Unpublished Research Report. Nairobi.
East African Standard. “Job Cuts Pose New Challenge to HELB”. Education. August 4th 2001, p.15.
Johnstone, D.B. (2001a) “Student Loans in International Perspective: Promises and Failures, Myths and Partial Truths.” International Comparative Higher Education Finance and Accessibility Project, Centre for Comparative and Global Studies in Education, State University of New York at Buffalo. www.gse.buffalo.edu/org/IntHigherEdFinance
Johnstone, D.B. (2001) “The Economics and Politics of Income Contingent Repayment Plans.” International Comparative Higher Education Finance and Accessibility Project, Centre for Comparative and Global Studies in Education, State University of New York at Buffalo. www.gse.buffalo.edu/org/IntHigherEdFinance
Johnstone, D.B. and A. Aemero. 2001. “Applicability for Developing Countries of Income Contingent Loans for Graduate Taxes, With Special Consideration of an Australian HECS – Type Income Contingent Loan Plans for Ethiopia”. International Comparative Higher Education Finance and Accessibility Project, Centre for Comparative and Global Studies in Education, State University of New York at Buffalo. www.gse.buffalo.edu/org/IntHigherEdFinance
Karani, A.F. et. al. (1995 “Cost and Financing of Education in Kenya: Access, Quality and Equity in Secondary Education. Nairobi: Ministry of Education
Mitha, N.J. et. al. (1995 “Costs and Financing of Education in Kenya: Access, Quality and Equity in Primary Education.” Nairobi: Ministry of Education/The World Bank

21
Mungai, M. (1989) “University Education in Kenya: Trends and Implications for Cost, Finance and Occupations.” Nairobi: Ministry of Education/The World Bank
Mwiria, K. and N. Ng’ethe. (2002) “Public University Reform in Kenya: Mapping the Key Changes of the Last Decade.” Unpublished Research Report, Nairobi, September.
Otieno, W.B. (1997) “Programme Performance Evaluation: University Students Loans Scheme.” Unpublished M.Ed. Thesis, Kenyatta University.
Ramani, K. (2001) “Scholar Talks on Problems in Universities." Education. East African Standard, July 7th 2001 p.17.
Republic of Kenya. (2002) “Poverty Reduction Strategy Paper.” Nairobi: Government Printer.
Republic of Kenya. (1996) “Welfare Monitoring Survey II: Basic Report.” Nairobi: Government Printer.
Republic of Kenya. (1988) Report of the Presidential Working Party on Education and
Manpower Training for the Next Decade and Beyond. Nairobi: Government Printer.
Republic of Kenya. (1972) Report of the Training Review Committee, 1971. Nairobi: Government Printer.
Republic of Kenya (1965) Kenya Education Commission Report. Nairobi: Government Printer.
Republic of Kenya (1965) National Development Plan, 1965/70. Nairobi: Government Printer.
Republic of Kenya (1964) High Level Manpower Requirements and Resources in Kenya, 1964 – 1970. Nairobi: Ministry of Planning and National Development.
Republic of Kenya, Economic Surveys, Various Issues, 1975/76 – 1992/93. Nairobi: Government Printer.