Perceptual Hysteresis Thresholding: Towards Driver Visibility Descriptors
High-Visibility
Enforcement on
Driver Compliance
With Pedestrian
Right-of-Way
Laws
i
This publication is distributed by the U.S. Department of Transportation, National Highway Traffic Safety Administration, in the interest of information exchange. The opinions, findings, and conclusions expressed in this publication are those of the authors and not necessarily those of the Department of Transportation or the National Highway Traffic Safety Administration. The United States Government assumes no liability for its contents or use thereof. If trade or manufacturers' names or products are mentioned, it is because they are considered essential to the object of the publication and should not be construed as an endorsement. The United States Government does not endorse products or manufacturers.
Suggested APA Citation Format: Van Houten, R., Malenfant, L., Blomberg, R. D., Huitema, B. E., & Casella, S. (2013, August).
High-Visibility Enforcement on Driver Compliance With Pedestrian Right-of-Way Laws. (Report No. DOT HS 811 786). Washington, DC: National Highway Traffic Safety Administration.

i
Technical Report Documentation Page 1. Report No.
DOT HS 811 786 2. Government Accession No. 3. Recipient’s Catalog No.
4. Title and Subject High-Visibility Enforcement on Driver Compliance With Pedestrian Right-of-Way Laws
5. Report Date August 2013 6. Performing Organization Code
7. Authors Ron Van Houten, Louis Malenfant, Richard D. Blomberg,a Bradley E. Huitema, and Sarah Casella
8. Performing Organization Report No.
9. Performing Organization Name and Address Western Michigan University Psychology Department 3700 Wood Hall Kalamazoo, MI 49008
10. Work Unit No. (TRAIS)
11. Contract or Grant No. DTNH22-06-D-00036
12. Sponsoring Agency Name and Address National Highway Traffic Safety Administration Office of Behavioral Safety Research 1200 New Jersey Avenue, SE. Washington, DC 20590
13. Type of Report and Period Covered Final Report 8/21/08 – 07/07/11 14. Sponsoring Agency Code
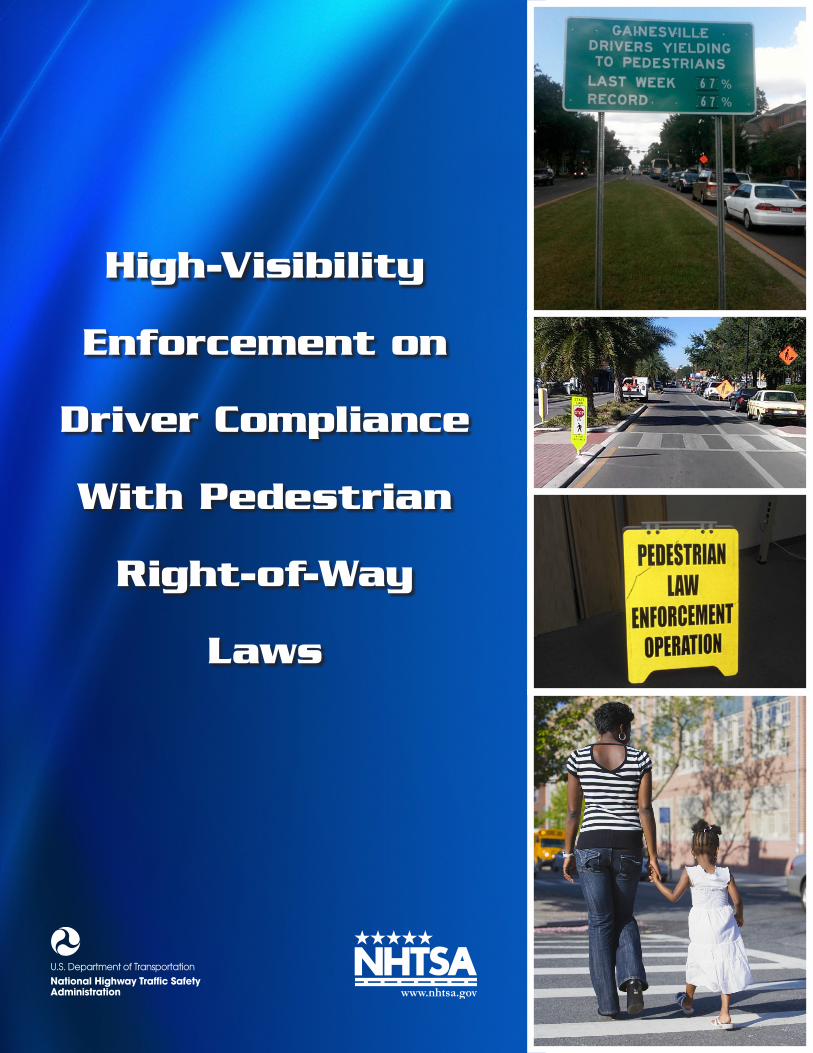
15. Supplementary Notes aRichard D. Blomberg is with Dunlap and Associates, Inc. Essie Wagner was the NHTSA Task Order Manager. 16. Abstract This study developed and evaluated strategies to increase driver yielding to pedestrians on a citywide basis using high-visibility pedestrian right-of-way enforcement. After a site recruitment process, Gainesville, Florida, participated in the project. The Gainesville Police Department (GPD) took the lead for the city and became a full partner in project development and research. Six pedestrian sites received enforcement and 6 more sites that did not receive enforcement were comparison sites to test for generalization effects. The program evaluation consisted of weekly measurement of driver yielding behavior at treated and comparison sites and crash analyses. The GPD conducted high-visibility crosswalk operations using decoy pedestrian crossings, inexpensive engineering (advance yield markings, in-street STATE LAW YIELD TO PEDESTRIAN signs), education (earned media, outreach efforts to elements within the community), and road signs that provided feedback on the percentage of drivers yielding right-of-way to pedestrians during the preceding week. The introduction of high-visibility enforcement over the course of a year led to a marked increase in yielding to pedestrians from a baseline level of 32% to 62% at enforcement crosswalk sites for staged crossings, and an increase from 54% to 83% for regular crosswalk users (unstaged crossings). At comparison crosswalk sites, yielding to pedestrians increased from 37% to 59% for staged crossings and from 50% to 73% for regular crosswalk users. A time-series regression model showed that all treatment sites (with the exception of one site with very high yield rates at the beginning of the study) showed a significant increase in yielding behavior. At the generalization sites, the change was approximately half that produced at the enforcement sites. A comparison of staged and unstaged pedestrian crossing results showed that, after adjustments for the difference in baseline levels, there was no difference in drivers who responded to a staged versus unstaged procedure. 17. Key Words Pedestrian sting operations; Pedestrian right-of-way enforcement; High-visibility enforcement; Crosswalk safety; Warning program; Multifaceted pedestrian right-of-way enforcement; Community feedback.
18. Distribution Statement This report is free of charge from the NHTSA Web site at www.nhtsa.dot.gov
19. Security Classif. (of this report) Unclassified
20. Security Classif. (of this page) Unclassified
21. No. of Pages
22. Price
Form DOT F 1700.7 (8-72)
ii
ACKNOWLEDGMENTS
The Gainesville Police Department (GPD) became a full partner in the research and implementation of the pedestrian project. The authors are grateful for the dedication and insights provided by the GPD personnel including Sergeant Joseph H. Raulerson, the head of the traffic division, without whose assistance many of the countermeasures would have been impossible to implement. The authors also acknowledge the efforts of Philip R. Mann, traffic authority for the City of Gainesville.
iii
EXECUTIVE SUMMARY Background
In large cities, pedestrians account for 40% to 50% of traffic fatalities. In 2010, there were 4,280 pedestrian fatalities and over 70,000 injuries in the United States (NHTSA, 2012). Past research (e.g., Hunter, Stutts, Pein, & Cox, 1996) indicates that a lack of driver compliance to pedestrian crossing laws is associated with pedestrian motor vehicle crashes. One countermeasure to increase driver compliance is to apply high-visibility enforcement (HVE) to pedestrian right-of-way laws. Increased enforcement coupled with increased publicity about the enforcement has led to substantial increases in compliance with occupant protection laws and a reduction in alcohol related crashes (Levy, Shea, & Asch, 1988 and 1990; Lacey, Jones, & Smith, 1999; Milano, McInturff, & Nichols, 2004). An underlying assumption of general deterrence theory is that sustained enforcement in conjunction with media attention will increase the public’s perception of the risk of being stopped by the police, thereby increasing compliance with traffic laws (Waller, Li, Stewart, & Ma, 1984). Raising drivers’ perceived risk of apprehension is an essential element of an effective high-visibility enforcement program.
In 1985, Van Houten and Malenfant developed a multifaceted, high-visibility
countermeasure described as a pedestrian decoy operation to increase the efficacy of pedestrian right-of-way enforcement operations. This program included a number of highly visible enforcement operations and highly visible educational and engineering elements that drew attention to the presence of enforcement. In 1989, Malenfant and Van Houten replicated their earlier work in three small Canadian cities and reported marked increases in yielding in each city and a reduction in pedestrian crashes. The purpose of the present study was to address whether highly visible enforcement could improve drivers yielding right-of-way to pedestrians in the United States and whether any improvements in yielding generalize to untreated sites.
The three objectives of the study were:
1) To identify communities with low levels of driver compliance to pedestrian right-of-way laws and select a community to conduct an HVE program that addressed drivers yielding to pedestrians at crosswalks; 2) To collect data and evaluate whether an HVE strategy to increase drivers yielding right-of-way to pedestrians on a citywide basis could produce a large and sustained change in the driving culture to favor yielding to pedestrians; and 3) To determine whether increases in yielding behavior produced by the program generalize to untreated locations.
Program
Gainesville, Florida conducted four waves of high-visibility enforcement of pedestrian yield right-of-way laws over the course of one year. The waves were conducted in February, May, July, and November, supported by paid radio ads, earned media, public outreach to schools and communities, street signage, and feedback signs. Before the enforcement began, Gainesville refreshed, as needed, pedestrian advance crossing markings at the 12 test and comparison sites. The Pedestrian Safety Program was a joint enforcement effort by the Gainesville Police Department, the University of Florida Police Department, and the Alachua Sheriff’s Department,
iv
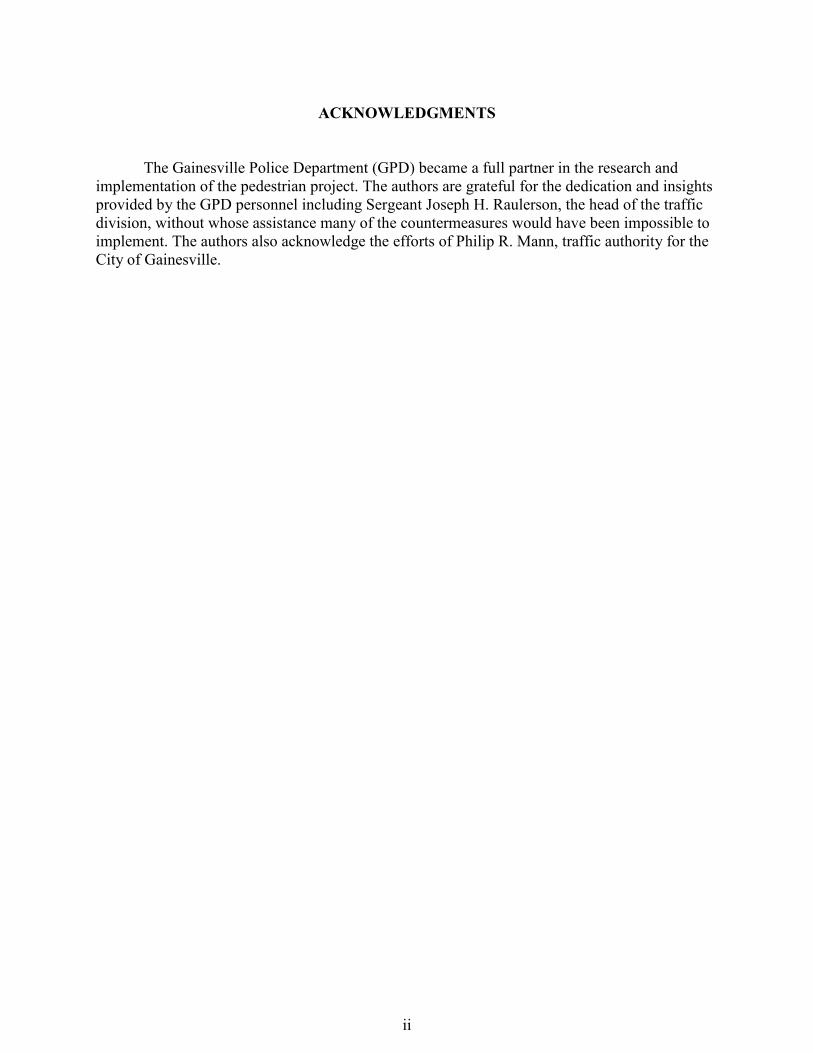
whose officers issued 182, 153, and 66 citations for failure to yield right-of-way to drivers during waves 2, 3, and 4, respectively. During the first wave, officers issued only warnings (1,177) except to flagrant violators, along with flyers that explained the law and announced future enforcement efforts. Officers used portable “Pedestrian Law Enforcement Operation” sandwich boards downstream of each enforcement wave to increase passing motorists’ awareness of the program at the time of the enforcement.
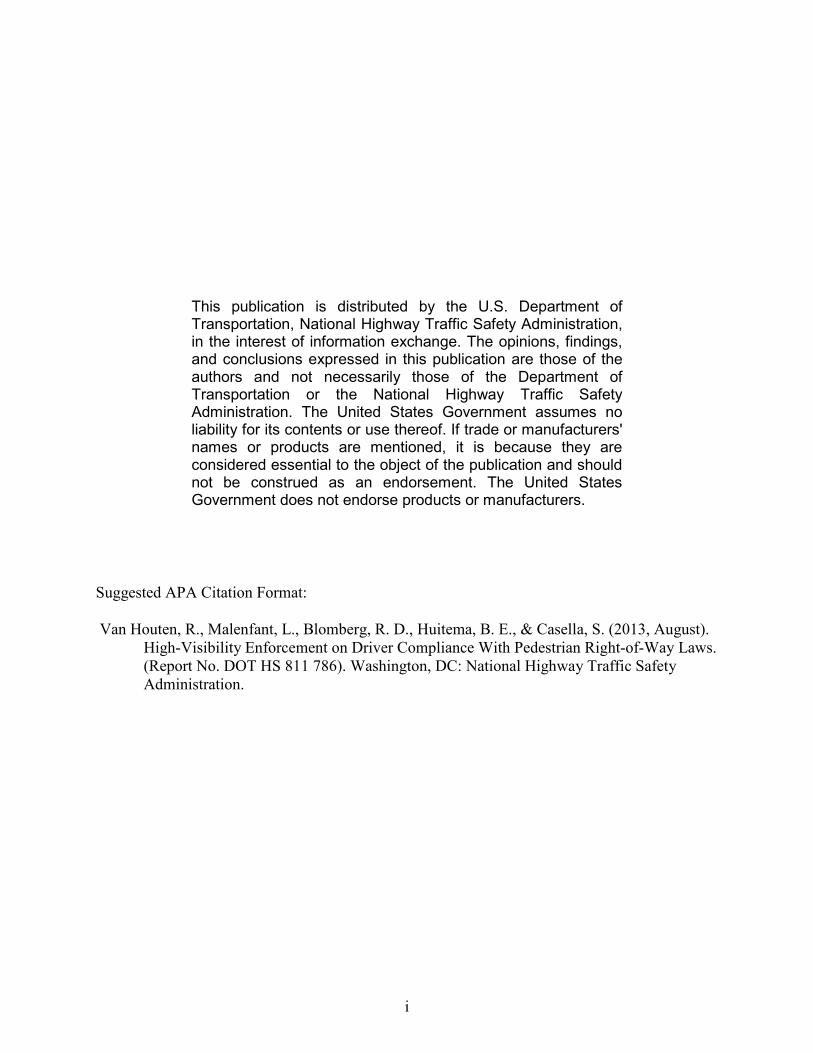
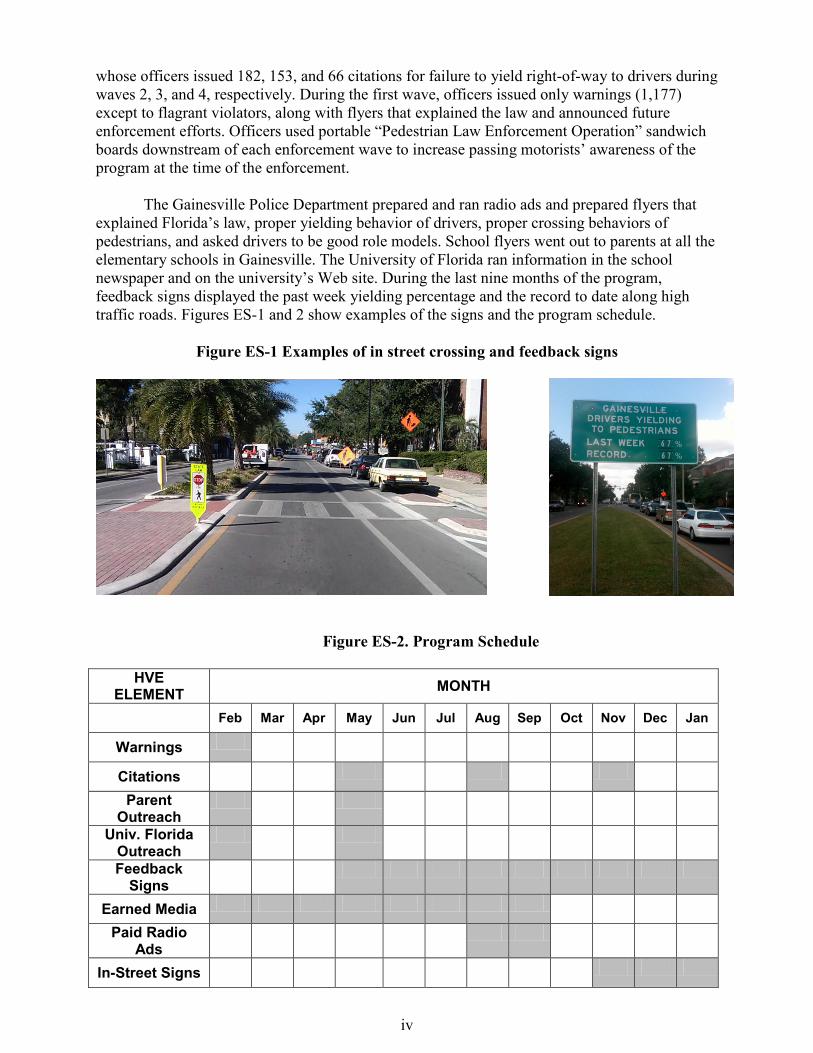
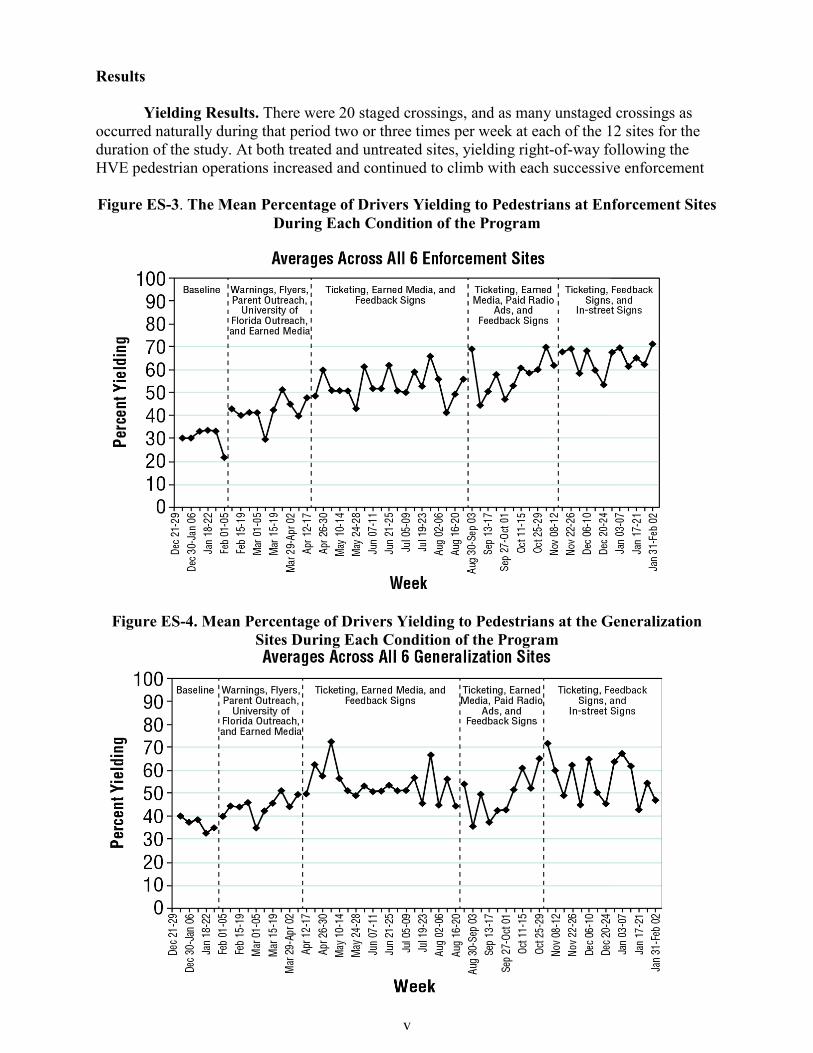
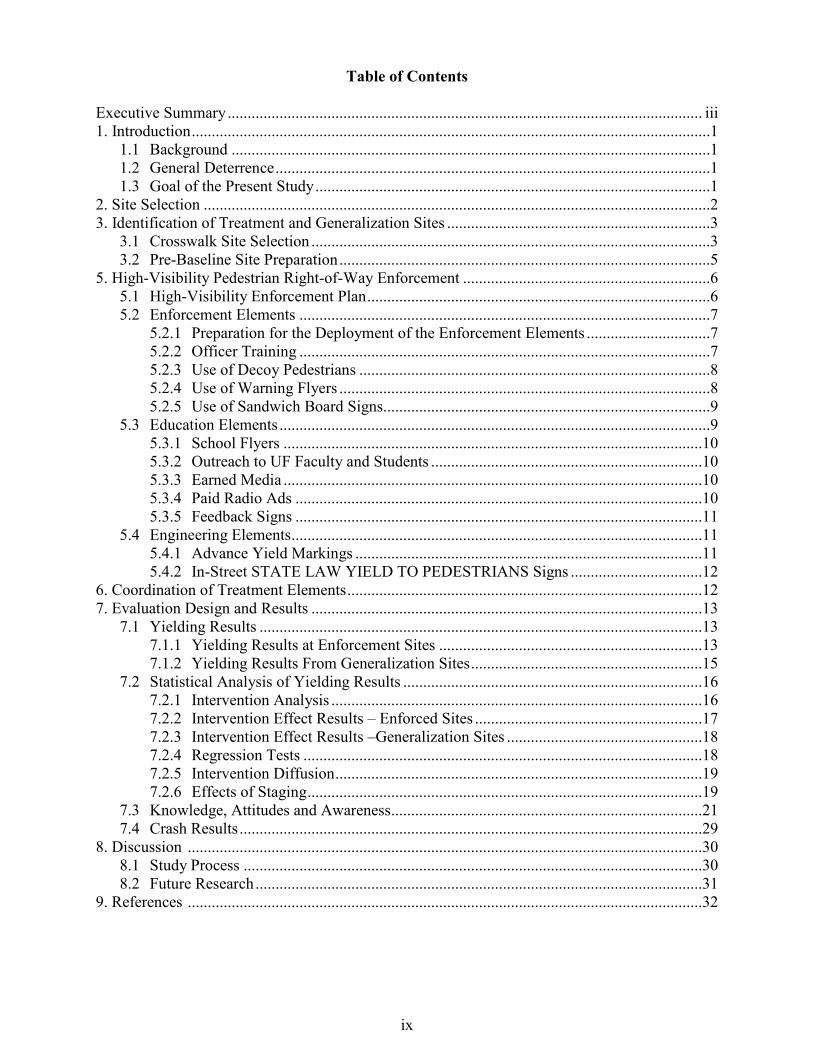
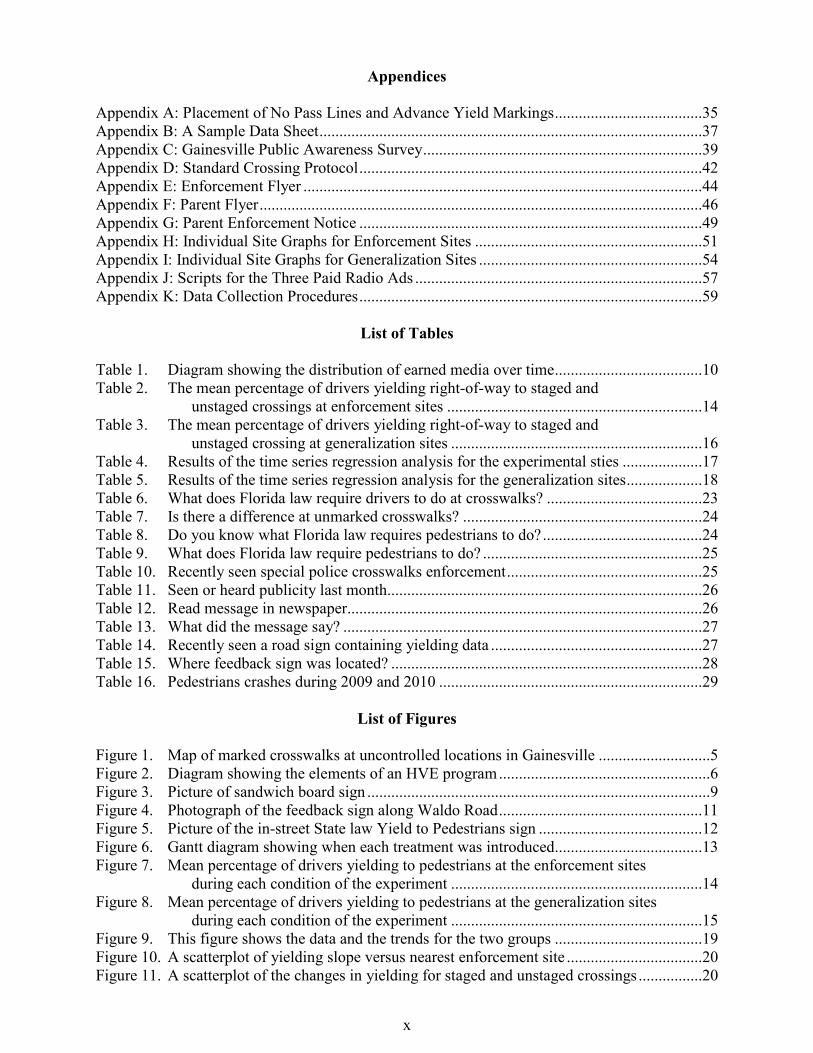
The Gainesville Police Department prepared and ran radio ads and prepared flyers that explained Florida’s law, proper yielding behavior of drivers, proper crossing behaviors of pedestrians, and asked drivers to be good role models. School flyers went out to parents at all the elementary schools in Gainesville. The University of Florida ran information in the school newspaper and on the university’s Web site. During the last nine months of the program, feedback signs displayed the past week yielding percentage and the record to date along high traffic roads. Figures ES-1 and 2 show examples of the signs and the program schedule.
Figure ES-1 Examples of in street crossing and feedback signs
Figure ES-2. Program Schedule
HVE ELEMENT MONTH
Feb Mar Apr May Jun Jul Aug Sep Oct Nov Dec Jan
Warnings
Citations
Parent Outreach
Univ. Florida Outreach
Feedback Signs
Earned Media
Paid Radio Ads
In-Street Signs
v
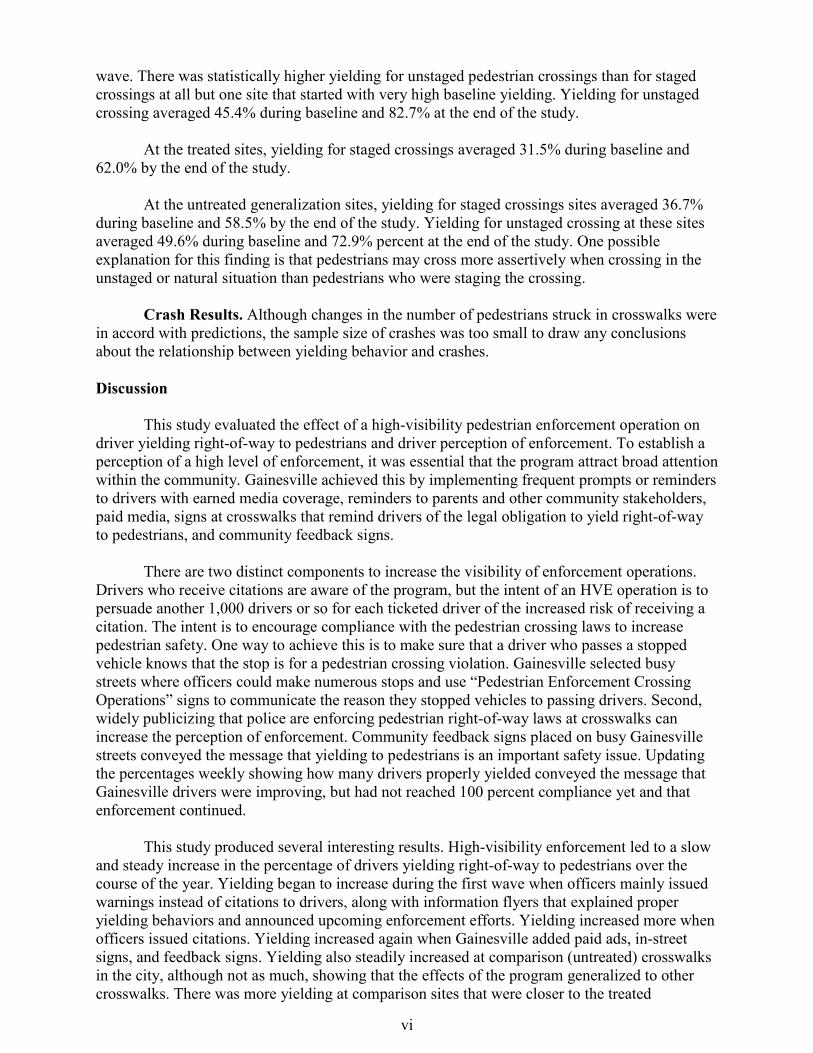
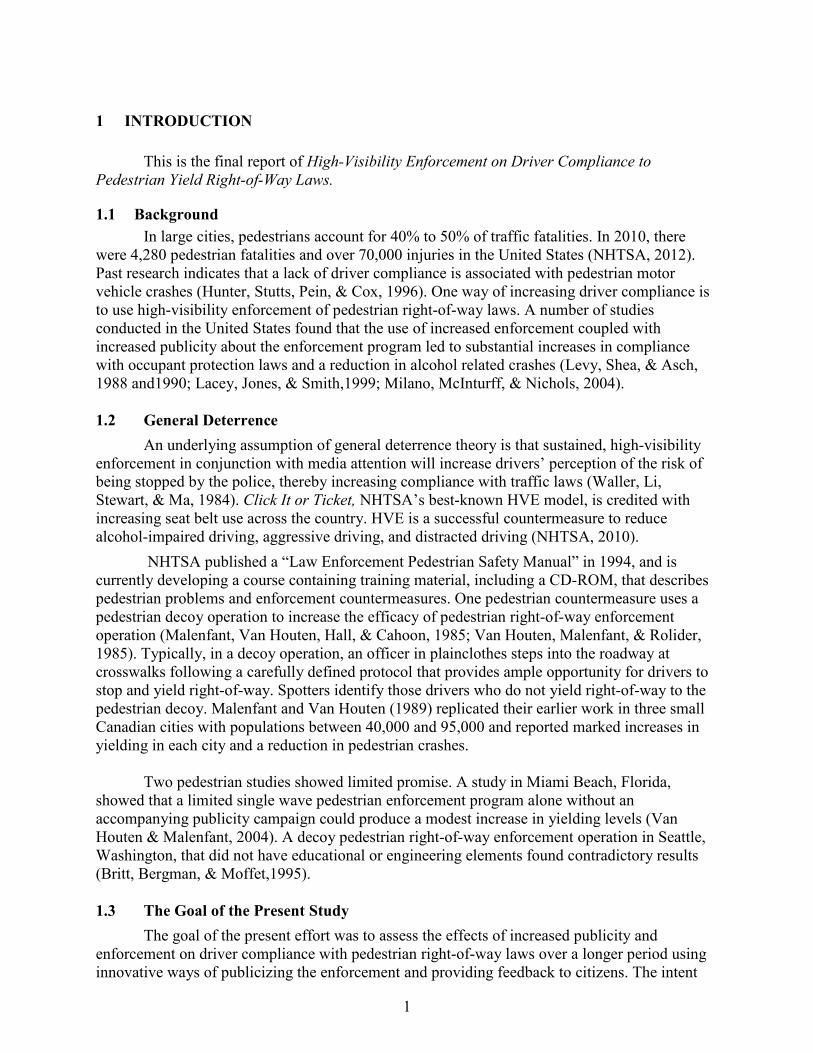
Results Yielding Results. There were 20 staged crossings, and as many unstaged crossings as occurred naturally during that period two or three times per week at each of the 12 sites for the duration of the study. At both treated and untreated sites, yielding right-of-way following the HVE pedestrian operations increased and continued to climb with each successive enforcement Figure ES-3. The Mean Percentage of Drivers Yielding to Pedestrians at Enforcement Sites
During Each Condition of the Program
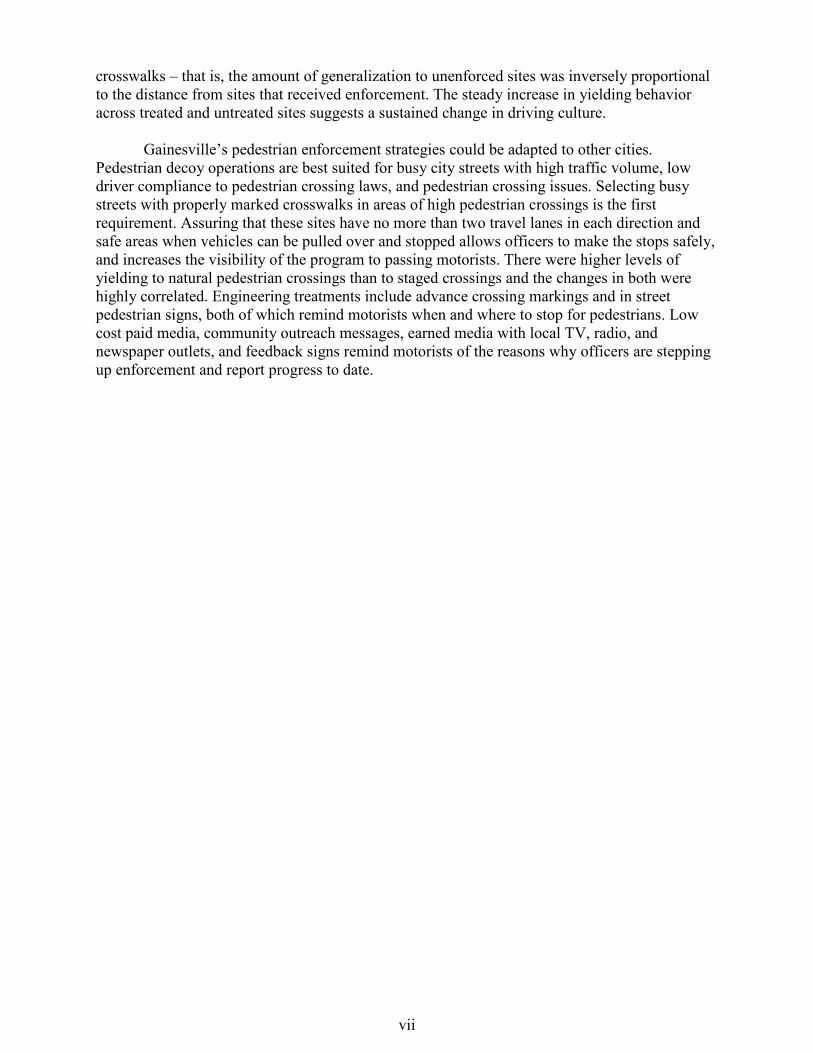
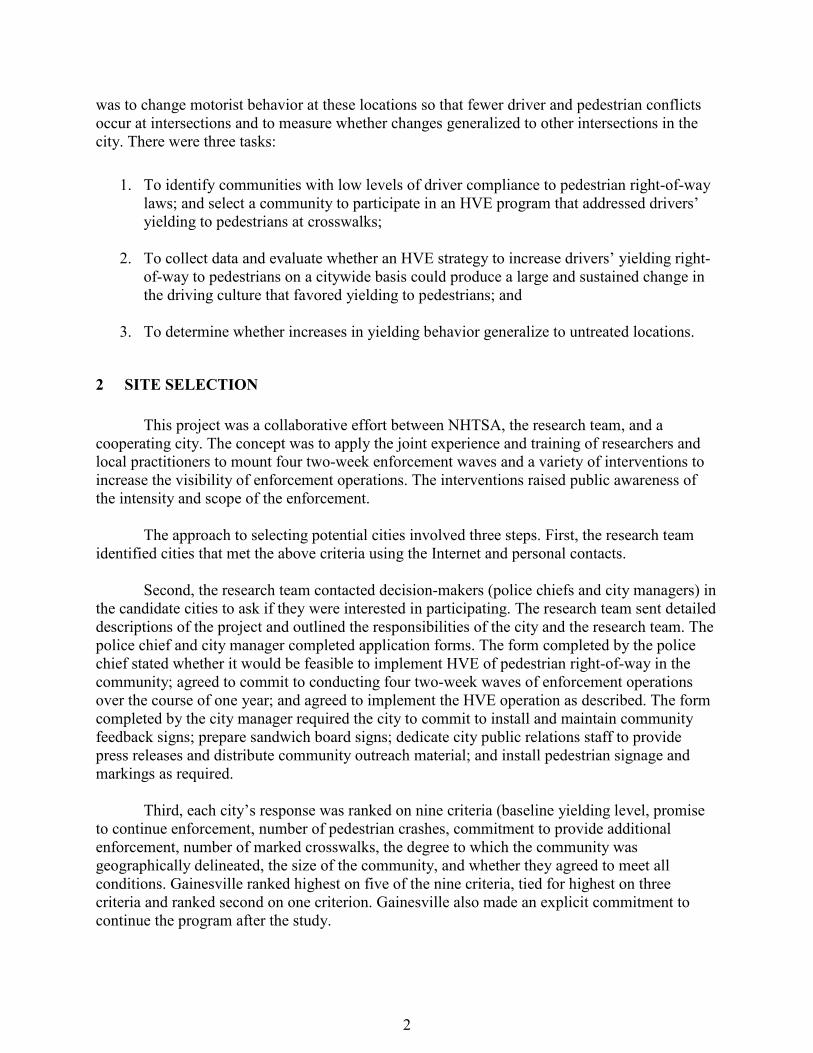
Figure ES-4. Mean Percentage of Drivers Yielding to Pedestrians at the Generalization Sites During Each Condition of the Program
vi
wave. There was statistically higher yielding for unstaged pedestrian crossings than for staged crossings at all but one site that started with very high baseline yielding. Yielding for unstaged crossing averaged 45.4% during baseline and 82.7% at the end of the study.
At the treated sites, yielding for staged crossings averaged 31.5% during baseline and 62.0% by the end of the study. At the untreated generalization sites, yielding for staged crossings sites averaged 36.7% during baseline and 58.5% by the end of the study. Yielding for unstaged crossing at these sites averaged 49.6% during baseline and 72.9% percent at the end of the study. One possible explanation for this finding is that pedestrians may cross more assertively when crossing in the unstaged or natural situation than pedestrians who were staging the crossing. Crash Results. Although changes in the number of pedestrians struck in crosswalks were in accord with predictions, the sample size of crashes was too small to draw any conclusions about the relationship between yielding behavior and crashes. Discussion
This study evaluated the effect of a high-visibility pedestrian enforcement operation on driver yielding right-of-way to pedestrians and driver perception of enforcement. To establish a perception of a high level of enforcement, it was essential that the program attract broad attention within the community. Gainesville achieved this by implementing frequent prompts or reminders to drivers with earned media coverage, reminders to parents and other community stakeholders, paid media, signs at crosswalks that remind drivers of the legal obligation to yield right-of-way to pedestrians, and community feedback signs. There are two distinct components to increase the visibility of enforcement operations. Drivers who receive citations are aware of the program, but the intent of an HVE operation is to persuade another 1,000 drivers or so for each ticketed driver of the increased risk of receiving a citation. The intent is to encourage compliance with the pedestrian crossing laws to increase pedestrian safety. One way to achieve this is to make sure that a driver who passes a stopped vehicle knows that the stop is for a pedestrian crossing violation. Gainesville selected busy streets where officers could make numerous stops and use “Pedestrian Enforcement Crossing Operations” signs to communicate the reason they stopped vehicles to passing drivers. Second, widely publicizing that police are enforcing pedestrian right-of-way laws at crosswalks can increase the perception of enforcement. Community feedback signs placed on busy Gainesville streets conveyed the message that yielding to pedestrians is an important safety issue. Updating the percentages weekly showing how many drivers properly yielded conveyed the message that Gainesville drivers were improving, but had not reached 100 percent compliance yet and that enforcement continued.
This study produced several interesting results. High-visibility enforcement led to a slow and steady increase in the percentage of drivers yielding right-of-way to pedestrians over the course of the year. Yielding began to increase during the first wave when officers mainly issued warnings instead of citations to drivers, along with information flyers that explained proper yielding behaviors and announced upcoming enforcement efforts. Yielding increased more when officers issued citations. Yielding increased again when Gainesville added paid ads, in-street signs, and feedback signs. Yielding also steadily increased at comparison (untreated) crosswalks in the city, although not as much, showing that the effects of the program generalized to other crosswalks. There was more yielding at comparison sites that were closer to the treated
vii
crosswalks – that is, the amount of generalization to unenforced sites was inversely proportional to the distance from sites that received enforcement. The steady increase in yielding behavior across treated and untreated sites suggests a sustained change in driving culture.
Gainesville’s pedestrian enforcement strategies could be adapted to other cities.
Pedestrian decoy operations are best suited for busy city streets with high traffic volume, low driver compliance to pedestrian crossing laws, and pedestrian crossing issues. Selecting busy streets with properly marked crosswalks in areas of high pedestrian crossings is the first requirement. Assuring that these sites have no more than two travel lanes in each direction and safe areas when vehicles can be pulled over and stopped allows officers to make the stops safely, and increases the visibility of the program to passing motorists. There were higher levels of yielding to natural pedestrian crossings than to staged crossings and the changes in both were highly correlated. Engineering treatments include advance crossing markings and in street pedestrian signs, both of which remind motorists when and where to stop for pedestrians. Low cost paid media, community outreach messages, earned media with local TV, radio, and newspaper outlets, and feedback signs remind motorists of the reasons why officers are stepping up enforcement and report progress to date.

viii
ix
Table of Contents
Executive Summary ....................................................................................................................... iii 1. Introduction ..................................................................................................................................1
1.1 Background ........................................................................................................................1 1.2 General Deterrence .............................................................................................................1 1.3 Goal of the Present Study ...................................................................................................1
2. Site Selection ...............................................................................................................................2 3. Identification of Treatment and Generalization Sites ..................................................................3
3.1 Crosswalk Site Selection ....................................................................................................3 3.2 Pre-Baseline Site Preparation .............................................................................................5
5. High-Visibility Pedestrian Right-of-Way Enforcement ..............................................................6 5.1 High-Visibility Enforcement Plan ......................................................................................6 5.2 Enforcement Elements .......................................................................................................7
5.2.1 Preparation for the Deployment of the Enforcement Elements ...............................7 5.2.2 Officer Training .......................................................................................................7 5.2.3 Use of Decoy Pedestrians ........................................................................................8 5.2.4 Use of Warning Flyers .............................................................................................8 5.2.5 Use of Sandwich Board Signs..................................................................................9
5.3 Education Elements ............................................................................................................9 5.3.1 School Flyers .........................................................................................................10 5.3.2 Outreach to UF Faculty and Students ....................................................................10 5.3.3 Earned Media .........................................................................................................10 5.3.4 Paid Radio Ads ......................................................................................................10 5.3.5 Feedback Signs ......................................................................................................11
5.4 Engineering Elements .......................................................................................................11 5.4.1 Advance Yield Markings .......................................................................................11 5.4.2 In-Street STATE LAW YIELD TO PEDESTRIANS Signs .................................12
6. Coordination of Treatment Elements .........................................................................................12 7. Evaluation Design and Results ..................................................................................................13
7.1 Yielding Results ...............................................................................................................13 7.1.1 Yielding Results at Enforcement Sites ..................................................................13 7.1.2 Yielding Results From Generalization Sites ..........................................................15
7.2 Statistical Analysis of Yielding Results ...........................................................................16 7.2.1 Intervention Analysis .............................................................................................16 7.2.2 Intervention Effect Results – Enforced Sites .........................................................17 7.2.3 Intervention Effect Results –Generalization Sites .................................................18 7.2.4 Regression Tests ....................................................................................................18 7.2.5 Intervention Diffusion ............................................................................................19 7.2.6 Effects of Staging ...................................................................................................19
7.3 Knowledge, Attitudes and Awareness ..............................................................................21 7.4 Crash Results ....................................................................................................................29
8. Discussion .................................................................................................................................30 8.1 Study Process ...................................................................................................................30 8.2 Future Research ................................................................................................................31
9. References .................................................................................................................................32
x
Appendices
Appendix A: Placement of No Pass Lines and Advance Yield Markings .....................................35 Appendix B: A Sample Data Sheet ................................................................................................37 Appendix C: Gainesville Public Awareness Survey ......................................................................39 Appendix D: Standard Crossing Protocol ......................................................................................42 Appendix E: Enforcement Flyer ....................................................................................................44 Appendix F: Parent Flyer ...............................................................................................................46 Appendix G: Parent Enforcement Notice ......................................................................................49 Appendix H: Individual Site Graphs for Enforcement Sites .........................................................51 Appendix I: Individual Site Graphs for Generalization Sites ........................................................54 Appendix J: Scripts for the Three Paid Radio Ads ........................................................................57 Appendix K: Data Collection Procedures ......................................................................................59
List of Tables
Table 1. Diagram showing the distribution of earned media over time .....................................10 Table 2. The mean percentage of drivers yielding right-of-way to staged and
unstaged crossings at enforcement sites ................................................................14 Table 3. The mean percentage of drivers yielding right-of-way to staged and
unstaged crossing at generalization sites ...............................................................16 Table 4. Results of the time series regression analysis for the experimental sties ....................17 Table 5. Results of the time series regression analysis for the generalization sites ...................18 Table 6. What does Florida law require drivers to do at crosswalks? .......................................23 Table 7. Is there a difference at unmarked crosswalks? ............................................................24 Table 8. Do you know what Florida law requires pedestrians to do? ........................................24 Table 9. What does Florida law require pedestrians to do? .......................................................25 Table 10. Recently seen special police crosswalks enforcement .................................................25 Table 11. Seen or heard publicity last month...............................................................................26 Table 12. Read message in newspaper.........................................................................................26 Table 13. What did the message say? ..........................................................................................27 Table 14. Recently seen a road sign containing yielding data .....................................................27 Table 15. Where feedback sign was located? ..............................................................................28 Table 16. Pedestrians crashes during 2009 and 2010 ..................................................................29
List of Figures
Figure 1. Map of marked crosswalks at uncontrolled locations in Gainesville ............................5 Figure 2. Diagram showing the elements of an HVE program .....................................................6 Figure 3. Picture of sandwich board sign ......................................................................................9 Figure 4. Photograph of the feedback sign along Waldo Road ...................................................11 Figure 5. Picture of the in-street State law Yield to Pedestrians sign .........................................12 Figure 6. Gantt diagram showing when each treatment was introduced.....................................13 Figure 7. Mean percentage of drivers yielding to pedestrians at the enforcement sites
during each condition of the experiment ...............................................................14 Figure 8. Mean percentage of drivers yielding to pedestrians at the generalization sites
during each condition of the experiment ...............................................................15 Figure 9. This figure shows the data and the trends for the two groups .....................................19 Figure 10. A scatterplot of yielding slope versus nearest enforcement site ..................................20 Figure 11. A scatterplot of the changes in yielding for staged and unstaged crossings ................20
1
1 INTRODUCTION This is the final report of High-Visibility Enforcement on Driver Compliance to Pedestrian Yield Right-of-Way Laws.
1.1 Background In large cities, pedestrians account for 40% to 50% of traffic fatalities. In 2010, there
were 4,280 pedestrian fatalities and over 70,000 injuries in the United States (NHTSA, 2012). Past research indicates that a lack of driver compliance is associated with pedestrian motor vehicle crashes (Hunter, Stutts, Pein, & Cox, 1996). One way of increasing driver compliance is to use high-visibility enforcement of pedestrian right-of-way laws. A number of studies conducted in the United States found that the use of increased enforcement coupled with increased publicity about the enforcement program led to substantial increases in compliance with occupant protection laws and a reduction in alcohol related crashes (Levy, Shea, & Asch, 1988 and1990; Lacey, Jones, & Smith,1999; Milano, McInturff, & Nichols, 2004).
1.2 General Deterrence
An underlying assumption of general deterrence theory is that sustained, high-visibility enforcement in conjunction with media attention will increase drivers’ perception of the risk of being stopped by the police, thereby increasing compliance with traffic laws (Waller, Li, Stewart, & Ma, 1984). Click It or Ticket, NHTSA’s best-known HVE model, is credited with increasing seat belt use across the country. HVE is a successful countermeasure to reduce alcohol-impaired driving, aggressive driving, and distracted driving (NHTSA, 2010).
NHTSA published a “Law Enforcement Pedestrian Safety Manual” in 1994, and is currently developing a course containing training material, including a CD-ROM, that describes pedestrian problems and enforcement countermeasures. One pedestrian countermeasure uses a pedestrian decoy operation to increase the efficacy of pedestrian right-of-way enforcement operation (Malenfant, Van Houten, Hall, & Cahoon, 1985; Van Houten, Malenfant, & Rolider, 1985). Typically, in a decoy operation, an officer in plainclothes steps into the roadway at crosswalks following a carefully defined protocol that provides ample opportunity for drivers to stop and yield right-of-way. Spotters identify those drivers who do not yield right-of-way to the pedestrian decoy. Malenfant and Van Houten (1989) replicated their earlier work in three small Canadian cities with populations between 40,000 and 95,000 and reported marked increases in yielding in each city and a reduction in pedestrian crashes.
Two pedestrian studies showed limited promise. A study in Miami Beach, Florida,
showed that a limited single wave pedestrian enforcement program alone without an accompanying publicity campaign could produce a modest increase in yielding levels (Van Houten & Malenfant, 2004). A decoy pedestrian right-of-way enforcement operation in Seattle, Washington, that did not have educational or engineering elements found contradictory results (Britt, Bergman, & Moffet,1995).
1.3 The Goal of the Present Study
The goal of the present effort was to assess the effects of increased publicity and enforcement on driver compliance with pedestrian right-of-way laws over a longer period using innovative ways of publicizing the enforcement and providing feedback to citizens. The intent
2
was to change motorist behavior at these locations so that fewer driver and pedestrian conflicts occur at intersections and to measure whether changes generalized to other intersections in the city. There were three tasks:
1. To identify communities with low levels of driver compliance to pedestrian right-of-way laws; and select a community to participate in an HVE program that addressed drivers’ yielding to pedestrians at crosswalks;
2. To collect data and evaluate whether an HVE strategy to increase drivers’ yielding right-of-way to pedestrians on a citywide basis could produce a large and sustained change in the driving culture that favored yielding to pedestrians; and
3. To determine whether increases in yielding behavior generalize to untreated locations.
2 SITE SELECTION This project was a collaborative effort between NHTSA, the research team, and a cooperating city. The concept was to apply the joint experience and training of researchers and local practitioners to mount four two-week enforcement waves and a variety of interventions to increase the visibility of enforcement operations. The interventions raised public awareness of the intensity and scope of the enforcement. The approach to selecting potential cities involved three steps. First, the research team identified cities that met the above criteria using the Internet and personal contacts. Second, the research team contacted decision-makers (police chiefs and city managers) in the candidate cities to ask if they were interested in participating. The research team sent detailed descriptions of the project and outlined the responsibilities of the city and the research team. The police chief and city manager completed application forms. The form completed by the police chief stated whether it would be feasible to implement HVE of pedestrian right-of-way in the community; agreed to commit to conducting four two-week waves of enforcement operations over the course of one year; and agreed to implement the HVE operation as described. The form completed by the city manager required the city to commit to install and maintain community feedback signs; prepare sandwich board signs; dedicate city public relations staff to provide press releases and distribute community outreach material; and install pedestrian signage and markings as required. Third, each city’s response was ranked on nine criteria (baseline yielding level, promise to continue enforcement, number of pedestrian crashes, commitment to provide additional enforcement, number of marked crosswalks, the degree to which the community was geographically delineated, the size of the community, and whether they agreed to meet all conditions. Gainesville ranked highest on five of the nine criteria, tied for highest on three criteria and ranked second on one criterion. Gainesville also made an explicit commitment to continue the program after the study.

3
3 IDENTIFICATION OF TREATMENT AND GENERALIZATION SITES
3.1 Crosswalk Site Selection
The City of Gainesville, Florida provided the research team with a database of all marked crosswalks at locations without a traffic signal or stop sign control. The research team visited the crosswalks located near pedestrian trip generators such as bus stops or parks and selected crosswalk locations using the following criteria:
1. Locations near hospitals with parking located across the street.
2. Locations near transit stops that require street crossing to reach nearby neighborhoods or transfer points.
3. Locations near civic facilities such as arenas, city hall, or libraries.
4. Locations near civic parks.
5. Locations near schools with playgrounds, or high school crosswalk locations that do not have crossing guards.
6. Locations with shops on both sides of the street.
7. Locations with infrequent gaps to allow safe crossing. If gaps are so frequent that pedestrians frequently arrive at a gap, the need for enforcement will not be evident.
8. Driver yielding to pedestrians varies between 0% and 70%. If drivers yield to pedestrians more often at a particular site, officers likely would not see the need for enforcement.
Deploying safe pedestrian right-of-way enforcement operations required sites that met additional criteria:
1. Flaggers should be clearly visible to violators. This is critical for the officer to pull over
violators safely.
2. Storage or parking capacity should be adequate to pull over at least four violators. 3. It should be easy for drivers to pull over and re-enter the roadway safely when stopped by
police.
4. If it is a multilane road, the officers should be able to stop both travel lanes safely. Multilane roads are limited to two travel lanes in each direction.
5. Officers should be able to talk with the stopped driver without danger from passing vehicles.

4
6. Flaggers should be able to see the violation and determine whether the driver was beyond the dilemma zone (see below) when the pedestrian entered the crosswalk.
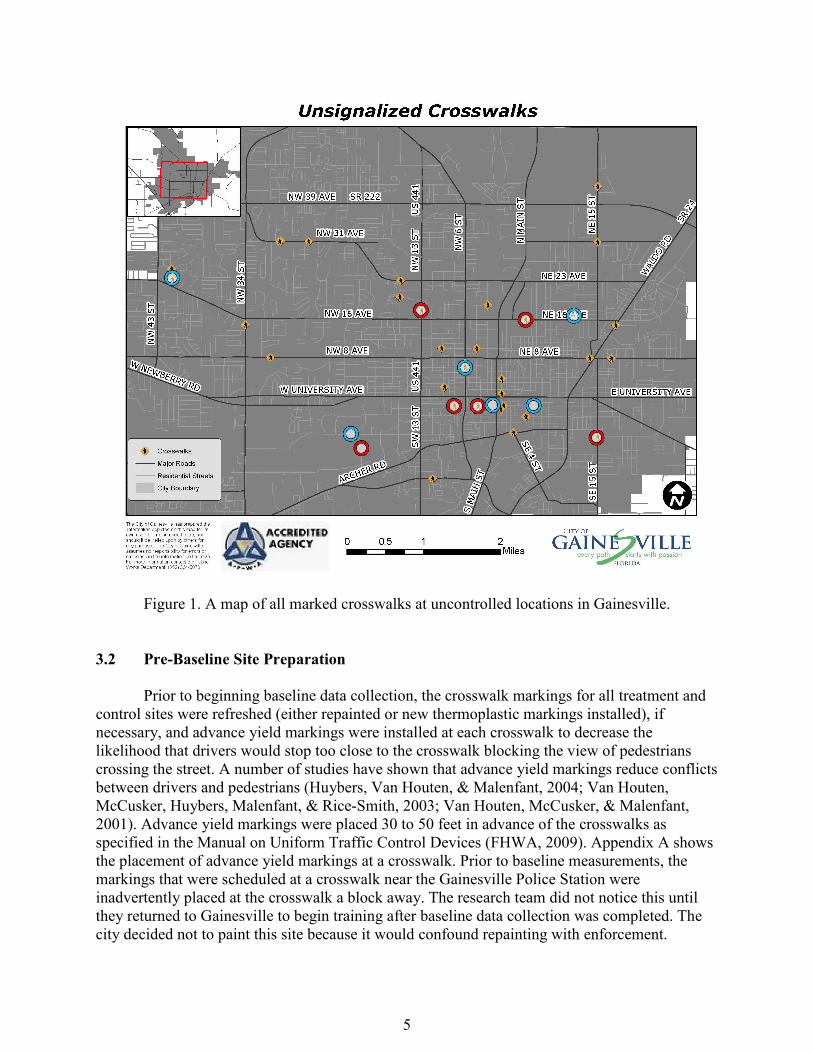
The research team selected 12 sites that met the above criteria. The team randomly assigned 6 of these crosswalk sites to receive HVE and 6 crosswalks to serve as untreated sites. Figure 1 shows the uncontrolled crosswalks in Gainesville; red circles mark the HVE pedestrian sites and blue circles mark the crosswalk sites that did not receive HVE pedestrian right-of-way enforcement (control sites). Enforcement sites:
• NE 16th Street at Saint Patrick’s Middle School • NW 13th Avenue midblock multilane crosswalk at Gainesville High School • SW 2nd Avenue at Shands Hospital • SW 2nd Avenue at 1st Presbyterian Church • SE 15th Street at 11th Avenue Lincoln Middle School • University of Florida crosswalk on Gale Lemerand Drive.
Control sites:
• University of Florida crosswalk on Museum Road • NW 41st Street at a shopping center • NW 16th Avenue at 12th Street WA Metcalfe Elementary School • SW 2nd Avenue at SW 1st Street at the courthouse • NW 6th Street at the police station (This was a brick crosswalk with white transverse
lines that were not repainted) • SW 2nd Avenue at Sweetwater Park.
5
Figure 1. A map of all marked crosswalks at uncontrolled locations in Gainesville. 3.2 Pre-Baseline Site Preparation Prior to beginning baseline data collection, the crosswalk markings for all treatment and control sites were refreshed (either repainted or new thermoplastic markings installed), if necessary, and advance yield markings were installed at each crosswalk to decrease the likelihood that drivers would stop too close to the crosswalk blocking the view of pedestrians crossing the street. A number of studies have shown that advance yield markings reduce conflicts between drivers and pedestrians (Huybers, Van Houten, & Malenfant, 2004; Van Houten, McCusker, Huybers, Malenfant, & Rice-Smith, 2003; Van Houten, McCusker, & Malenfant, 2001). Advance yield markings were placed 30 to 50 feet in advance of the crosswalks as specified in the Manual on Uniform Traffic Control Devices (FHWA, 2009). Appendix A shows the placement of advance yield markings at a crosswalk. Prior to baseline measurements, the markings that were scheduled at a crosswalk near the Gainesville Police Station were inadvertently placed at the crosswalk a block away. The research team did not notice this until they returned to Gainesville to begin training after baseline data collection was completed. The city decided not to paint this site because it would confound repainting with enforcement.
6
5 HIGH-VISIBILITY PEDESTRIAN RIGHT-OF-WAY ENFORCEMENT
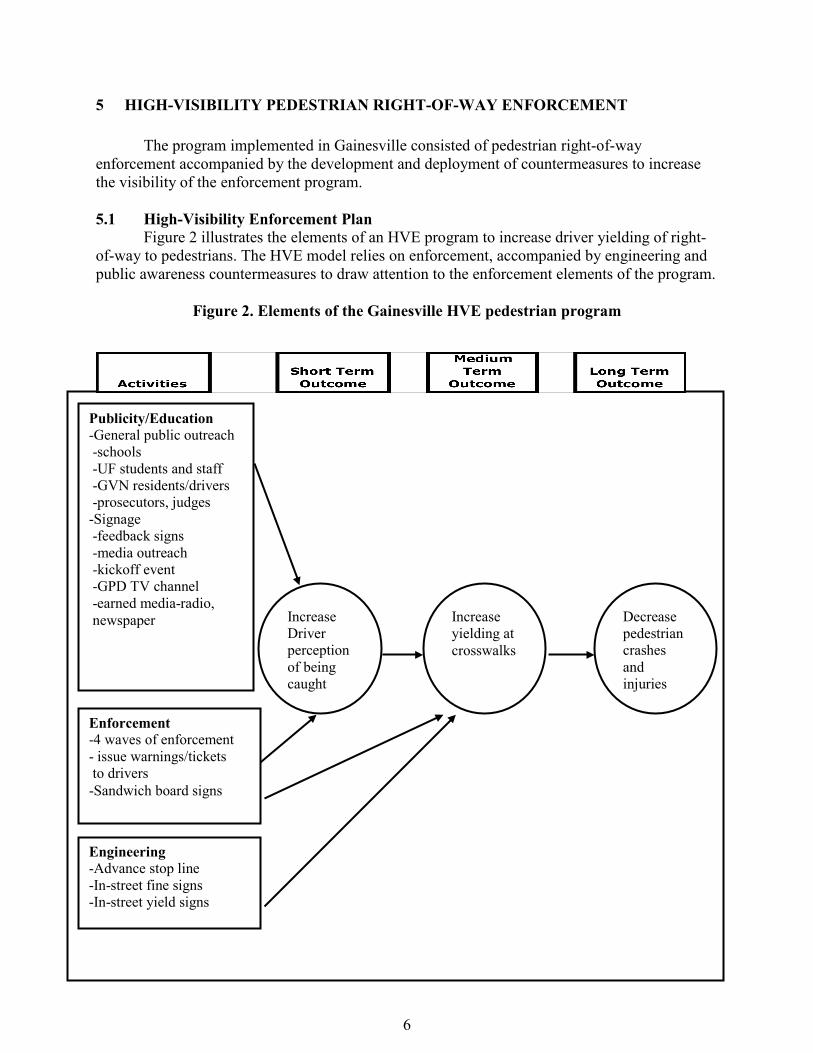
The program implemented in Gainesville consisted of pedestrian right-of-way enforcement accompanied by the development and deployment of countermeasures to increase the visibility of the enforcement program. 5.1 High-Visibility Enforcement Plan Figure 2 illustrates the elements of an HVE program to increase driver yielding of right-of-way to pedestrians. The HVE model relies on enforcement, accompanied by engineering and public awareness countermeasures to draw attention to the enforcement elements of the program.
Figure 2. Elements of the Gainesville HVE pedestrian program
Publicity/Education -General public outreach -schools -UF students and staff -GVN residents/drivers -prosecutors, judges -Signage -feedback signs -media outreach -kickoff event -GPD TV channel -earned media-radio, newspaper
Engineering -Advance stop line -In-street fine signs -In-street yield signs
Increase Driver perception of being caught
Increase yielding at crosswalks
Decrease pedestrian crashes and injuries
Enforcement -4 waves of enforcement - issue warnings/tickets to drivers -Sandwich board signs
7
5.2 Enforcement Elements Each enforcement wave consisted of 2 weeks of enforcement plus educational and
engineering components such as advance stops lines, in-street yield signs, and in-street fine signs.1 During the enforcement wave, there were 2 or 3 enforcement operations at each of the 6 enforcement sites, for a total of 16 enforcement operations per wave. Table 1 shows the schedule of enforcement operations and concomitant education and engineering interventions.
Because Gainesville had not conducted previous pedestrian right-of-way enforcement,
during the first two-week wave, officers issued warnings instead of citations unless the violation was flagrant. Issuing warnings generated driver and public support for the program goals and maximized the number of traffic stops observed by other drivers. Examples of flagrant violations that always resulted in a citation were driving very close to the pedestrian, swerving to avoid hitting the pedestrian, or causing a pedestrian to step back to avoid a non-yielding vehicle. During the first wave, officers issued 1,177 warnings. In the remaining three two-week enforcement operations, officers issued 182, 153, and 66 citations, respectively, to drivers that violated the pedestrian right-of-way statutes. There were fewer violators during the last enforcement wave, resulting in fewer citations. 5.2.1 Preparation for the deployment of the enforcement elements
The research team briefed traffic magistrates and the county prosecutor’s office on the elements of the enforcement program to address the perception of any legal issue such as entrapment related to HVE operations. This was done so traffic magistrates would understand the procedures used to operationally define failure to yield if the violators chose to contest their citations.
The team also briefed civic leaders because the support of government leaders is essential
for the long-term success of police enforcement of pedestrian right-of-way programs for two reasons. First, civic leaders shape funding priorities and their support is essential if the program is to continue. Second, if civic leaders are not briefed, they may also be caught by surprise if residents caught failing to yield make complaints that could undermine the program.
Prior to the start of the first enforcement wave, the local team conducted outreach to the
public. Informing the public prior to the start of the program helps ensure people are aware of why police are enforcing pedestrian right-of-way and that the police will begin enforcement soon. More detail on this program component is included under the section on public education. 5.2.2 Officer Training The research team trained officers prior to the start of the first enforcement wave. Training materials included a DVD that showed how to conduct the operations, PowerPoint slides, and field training to practice in a variety of crosswalk situations. After viewing the DVD summarizing the program, officers viewed a series of PowerPoint slides comparing the
1 In the context of this study, engineering involved bringing each of the intervention and comparison sites up to prevailing standards as specified in the Manual on Uniform Traffic Control Devices or the State equivalent manual. Some intersections that were deficient before the program were improved to achieve homogeneous engineering treatments at all 12 sites, treated and untreated.
8
pedestrian injury and fatality statistics in the Gainesville area, followed by a lesson on State pedestrian right-of-way laws at uncontrolled crosswalks. Officers received a card that showed the statute number for each offense. This training segment also included the definition of a crosswalk, the requirements for motorists and pedestrians at marked uncontrolled crosswalks, and the definition of an unmarked crosswalk. It explained the importance of employing an HVE approach to pedestrian right-of-way enforcement and reviewed enforcement, education, and engineering components of an HVE pedestrian right-of-way operation.
The next section taught officers how to conduct safe and effective pedestrian enforcement operations with considerable emphasis placed on using the standard crossing protocol. Use of the protocol helps ensure that the courts will uphold the citations and, most importantly, ensures the safety of officers serving as decoy pedestrians. A description of the standard crossing protocol is in Appendix D. Much of the training involved conducting actual pedestrian right-of-way enforcement operations in the field. Field training occurred at three sites that sampled very different crosswalk characteristics to ensure that officers were prepared to conduct operations at all of the selected enforcement sites. 5.2.3 Use of Decoy Pedestrians
Police officers in plain clothes crossed as decoy pedestrians. This feature of the program
provided three important advantages:
• Officers could maximize the number of stops during an operation. If police had to wait for pedestrians to cross, there would have been down time because pedestrians sometimes arrive when there are no vehicles present, and because there are not as many pedestrians as vehicles at most locations.
• Officers crossed in accordance with the crosswalk statutes to ensure that citations, when they are given, stand up in court.
• Officers did not cross if the vehicle was inside the dilemma zone. This ensured that they could stop all vehicles that did not yield right-of-way.
5.2.4 Use of Warning Flyers
For the first enforcement wave, officers issued warning flyers and asked for drivers’
cooperation. The warning serves as an initial education phase, allowing officers to stop a larger number of violators. Warnings take less time to issue than citations, which gives officers time to use a short standardized script that points out how serious the problem is. The officer tells the person they are only getting a warning this time, and asks them to help make their community a safer place by sharing the information they have received with friends and neighbors. The warning stop also permits the officer to ask the driver to serve as a model by yielding the next time he or she sees a pedestrian in a crosswalk. Appendix E shows a copy of the warning flyer.
9
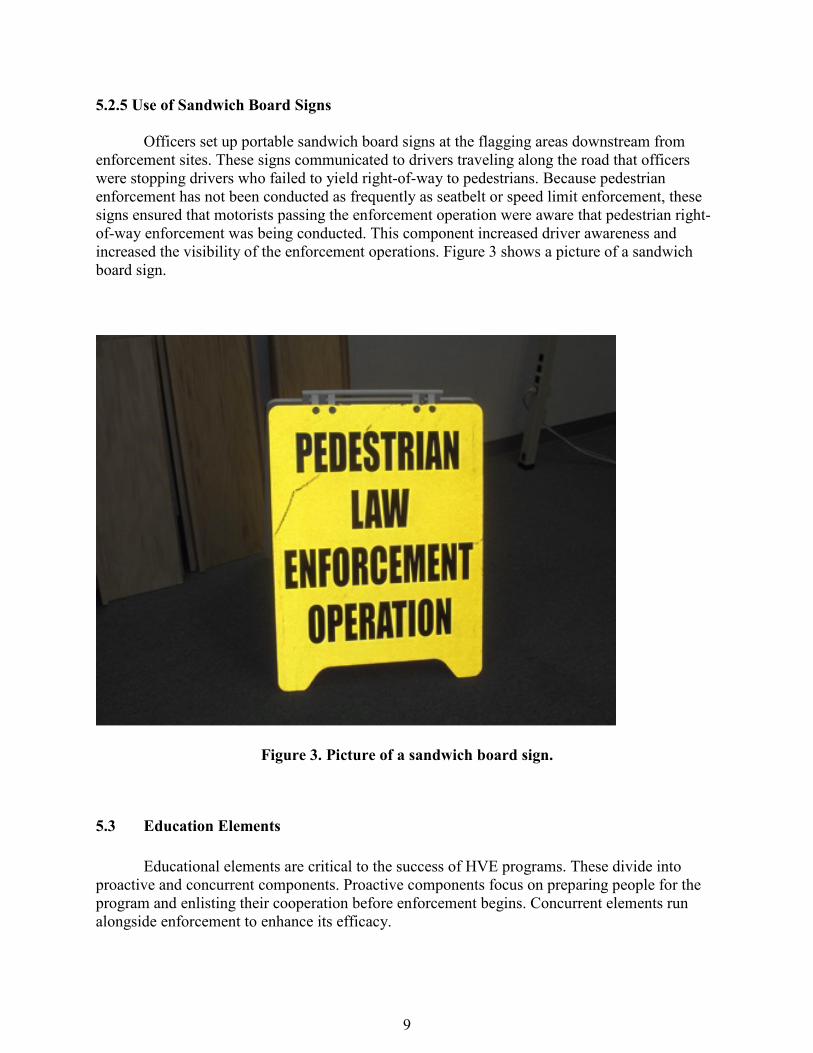
5.2.5 Use of Sandwich Board Signs
Officers set up portable sandwich board signs at the flagging areas downstream from enforcement sites. These signs communicated to drivers traveling along the road that officers were stopping drivers who failed to yield right-of-way to pedestrians. Because pedestrian enforcement has not been conducted as frequently as seatbelt or speed limit enforcement, these signs ensured that motorists passing the enforcement operation were aware that pedestrian right-of-way enforcement was being conducted. This component increased driver awareness and increased the visibility of the enforcement operations. Figure 3 shows a picture of a sandwich board sign.
Figure 3. Picture of a sandwich board sign.
5.3 Education Elements Educational elements are critical to the success of HVE programs. These divide into proactive and concurrent components. Proactive components focus on preparing people for the program and enlisting their cooperation before enforcement begins. Concurrent elements run alongside enforcement to enhance its efficacy.

10
5.3.1 School Flyers School flyers were proactive and had two components. One flyer provided information on pedestrian safety for children and drivers. The second flyer was a notice that warned parents that enforcement was about to begin and asked them to be good community models by yielding to pedestrians. The safety flyer and notice went home to the parents of all elementary and middle school students in Gainesville. The flyer and notice are in Appendices F and G. 5.3.2 Outreach to UF Faculty and Students The University of Florida prepared material to appear in the University of Florida newspaper and Web site “Inside UF.” These articles mentioned the requirement that drivers yield to pedestrians in crosswalks and publicized the ongoing enforcement operations. 5.3.3 Earned Media The Gainesville Police Department sent out press releases and was very effective in attracting the attention of print and electronic new media. Table 1 shows that the Gainesville Sun newspaper covered pedestrian enforcement in a relatively consistent manner over the year. These stories sometimes appeared on the front page. The program also attracted attention from TV, radio, and the UF news. Although someone monitored newspaper and TV stories, it was more difficult to monitor radio stories, which is likely underestimated.
Table 1. The distribution of earned media over time.
Month The Gainesville
Sun newspaper TV News Radio UF News
February 3 3 2 March 1 1 1 April 2 May 1 June 1 July 1 August 1 September 2 October November December 5.3.4 Paid Radio Ads
The Gainesville Police Department prepared four radio ads and paid for prime time frequent presentation over a 5-week period. These ads focused on the requirement to yield right-of-way to pedestrians, the requirement that pedestrians wait for the WALK sign before crossing, the presence of enforcement, and the danger of striking a pedestrian in a crosswalk. The scripts for the three ads are in Appendix J. These ads played 41 times.
11
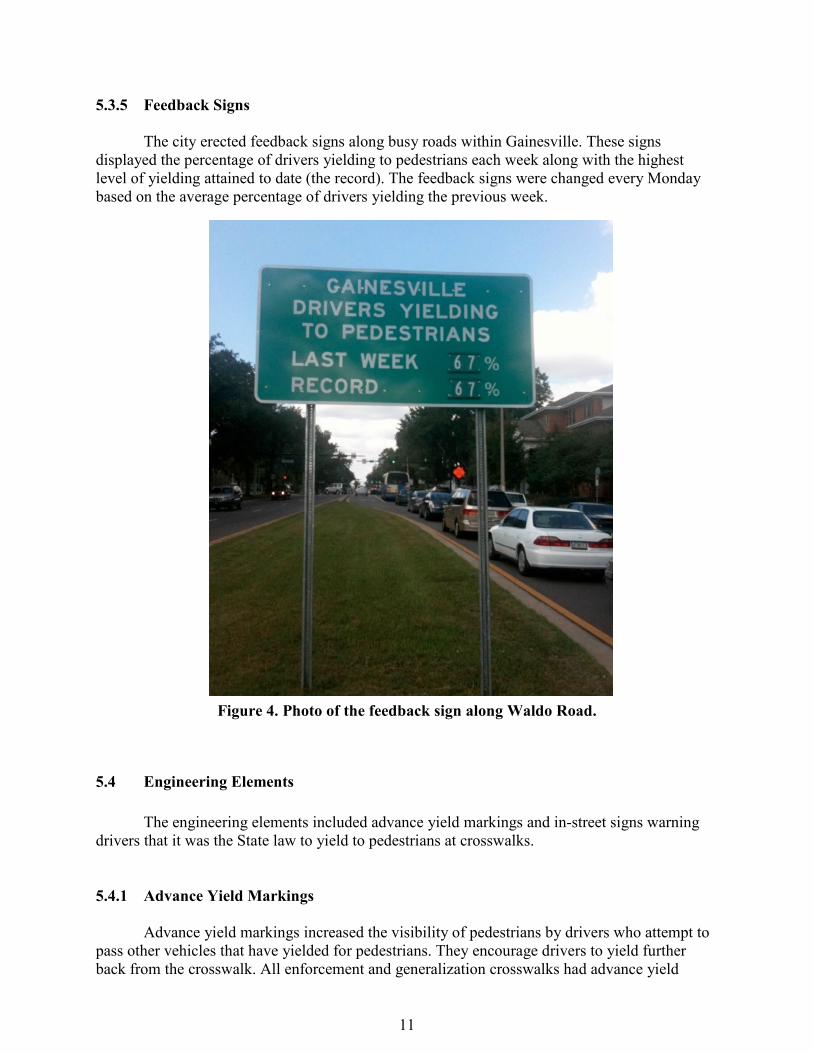
5.3.5 Feedback Signs
The city erected feedback signs along busy roads within Gainesville. These signs displayed the percentage of drivers yielding to pedestrians each week along with the highest level of yielding attained to date (the record). The feedback signs were changed every Monday based on the average percentage of drivers yielding the previous week.
Figure 4. Photo of the feedback sign along Waldo Road.
5.4 Engineering Elements
The engineering elements included advance yield markings and in-street signs warning drivers that it was the State law to yield to pedestrians at crosswalks.
5.4.1 Advance Yield Markings
Advance yield markings increased the visibility of pedestrians by drivers who attempt to pass other vehicles that have yielded for pedestrians. They encourage drivers to yield further back from the crosswalk. All enforcement and generalization crosswalks had advance yield
12
markings installed at the start of the program to ensure that increased driver yielding did not increase the risk to pedestrians from drivers in adjacent lanes. When drivers rarely yield, multiple threat or passing crashes are rare because yielding is rare. When most drivers yield, multiple threat or passing crashes are also rare because almost all drivers yield. When half of the drivers yield, there can be an increase in multiple threat crashes if the drivers that yield stop too close to the crosswalks. The city placed advance yield markings between 30 to 50 feet in advance of the crosswalk dependent upon engineering considerations such as the location of intersections or driveways.
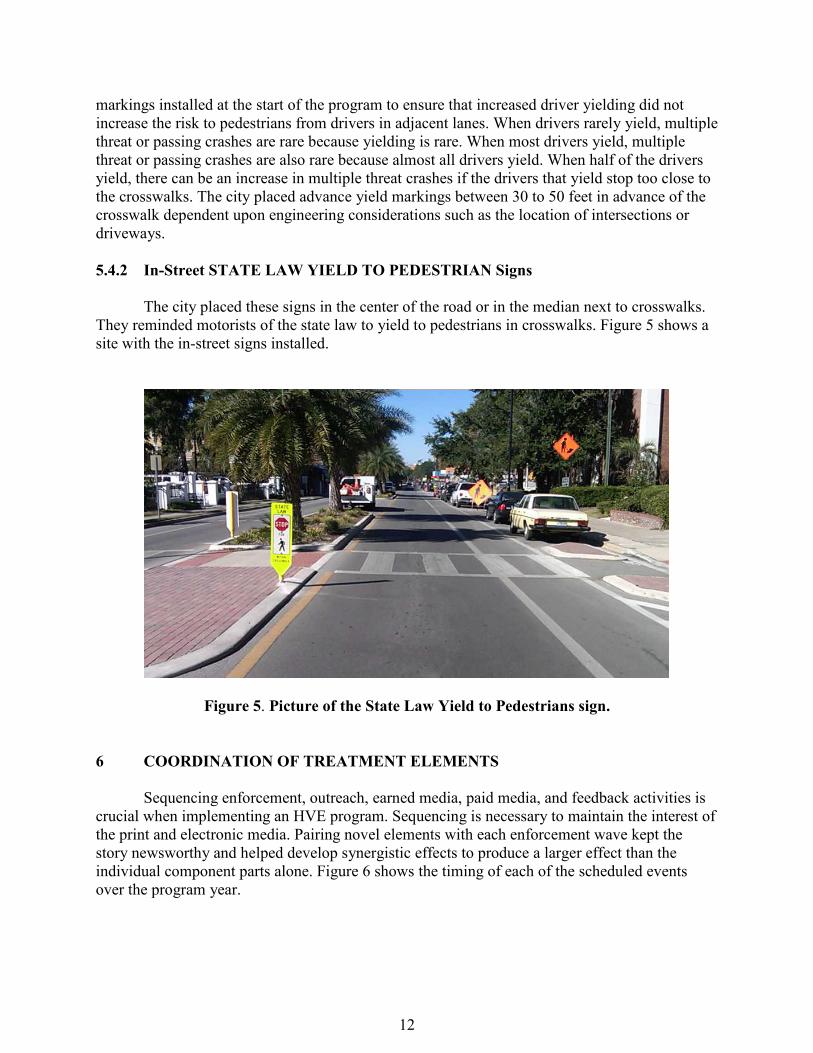
5.4.2 In-Street STATE LAW YIELD TO PEDESTRIAN Signs The city placed these signs in the center of the road or in the median next to crosswalks. They reminded motorists of the state law to yield to pedestrians in crosswalks. Figure 5 shows a site with the in-street signs installed.
Figure 5. Picture of the State Law Yield to Pedestrians sign. 6 COORDINATION OF TREATMENT ELEMENTS
Sequencing enforcement, outreach, earned media, paid media, and feedback activities is crucial when implementing an HVE program. Sequencing is necessary to maintain the interest of the print and electronic media. Pairing novel elements with each enforcement wave kept the story newsworthy and helped develop synergistic effects to produce a larger effect than the individual component parts alone. Figure 6 shows the timing of each of the scheduled events over the program year.

13
Figure 6. Program Schedule
HVE ELEMENT MONTH
Feb Mar Apr May Jun Jul Aug Sep Oct Nov Dec Jan
Warnings
Citations
Parent Outreach
Univ. Florida Outreach
Feedback Signs
Earned Media
Paid Radio Ads
In-Street Signs
7 EVALUATION DESIGN AND RESULTS
The evaluation included measurements of yielding, an intercept survey of knowledge and awareness, and analyses of crashes.
7.1 Yielding Results
Yielding results for enforcement and generalization sites were examined for staged and naturally occurring pedestrians. 7.1.1 Yielding Results at Enforcement Sites Figure 7 shows the average percent of drivers yielding for staged crossings during baseline and following each successive enforcement wave averaged across all enforcement sites. It is clear that yielding increased following the initiation of the high-visibility pedestrian right-of-way enforcement program at enforcement sites and increased over the duration of the program. Similar graphs for each individual enforcement site are in Appendix H.
14
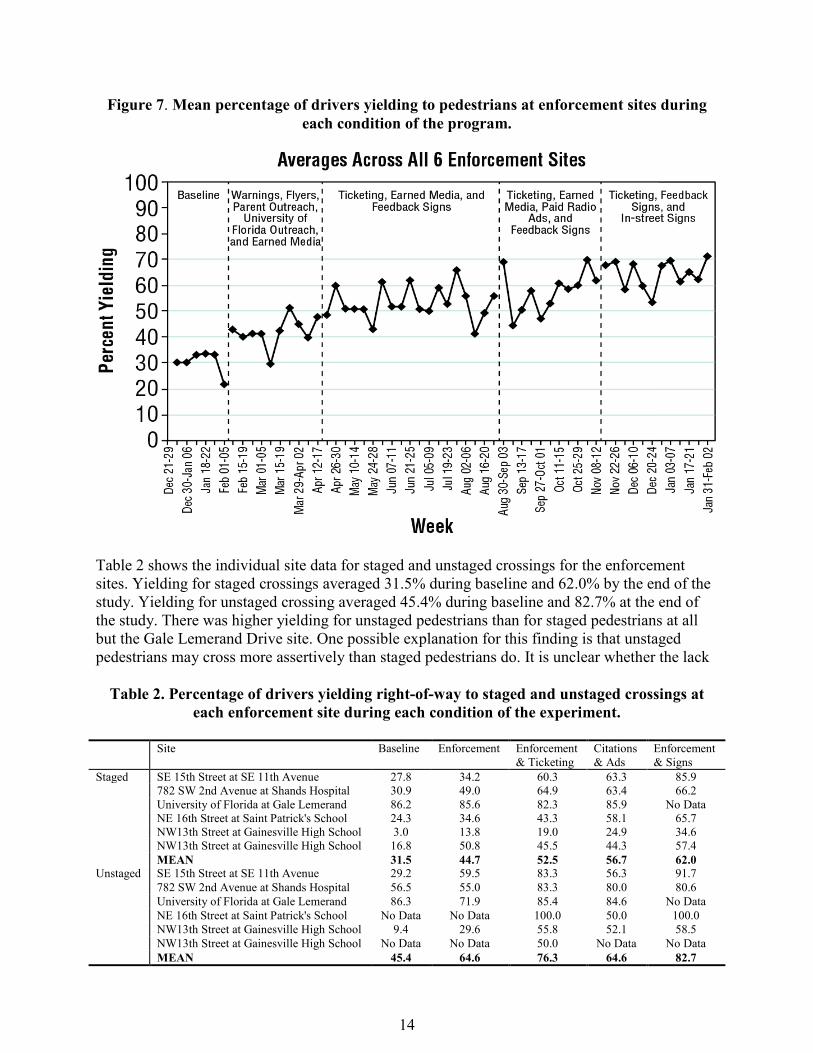
Figure 7. Mean percentage of drivers yielding to pedestrians at enforcement sites during each condition of the program.
Table 2 shows the individual site data for staged and unstaged crossings for the enforcement sites. Yielding for staged crossings averaged 31.5% during baseline and 62.0% by the end of the study. Yielding for unstaged crossing averaged 45.4% during baseline and 82.7% at the end of the study. There was higher yielding for unstaged pedestrians than for staged pedestrians at all but the Gale Lemerand Drive site. One possible explanation for this finding is that unstaged pedestrians may cross more assertively than staged pedestrians do. It is unclear whether the lack
Table 2. Percentage of drivers yielding right-of-way to staged and unstaged crossings at
each enforcement site during each condition of the experiment. Site Baseline Enforcement Enforcement
& Ticketing Citations & Ads
Enforcement & Signs
Staged SE 15th Street at SE 11th Avenue 27.8 34.2 60.3 63.3 85.9 782 SW 2nd Avenue at Shands Hospital 30.9 49.0 64.9 63.4 66.2 University of Florida at Gale Lemerand 86.2 85.6 82.3 85.9 No Data NE 16th Street at Saint Patrick's School 24.3 34.6 43.3 58.1 65.7 NW13th Street at Gainesville High School 3.0 13.8 19.0 24.9 34.6 NW13th Street at Gainesville High School 16.8 50.8 45.5 44.3 57.4 MEAN 31.5 44.7 52.5 56.7 62.0 Unstaged SE 15th Street at SE 11th Avenue 29.2 59.5 83.3 56.3 91.7 782 SW 2nd Avenue at Shands Hospital 56.5 55.0 83.3 80.0 80.6 University of Florida at Gale Lemerand 86.3 71.9 85.4 84.6 No Data NE 16th Street at Saint Patrick's School No Data No Data 100.0 50.0 100.0 NW13th Street at Gainesville High School 9.4 29.6 55.8 52.1 58.5 NW13th Street at Gainesville High School No Data No Data 50.0 No Data No Data MEAN 45.4 64.6 76.3 64.6 82.7
15
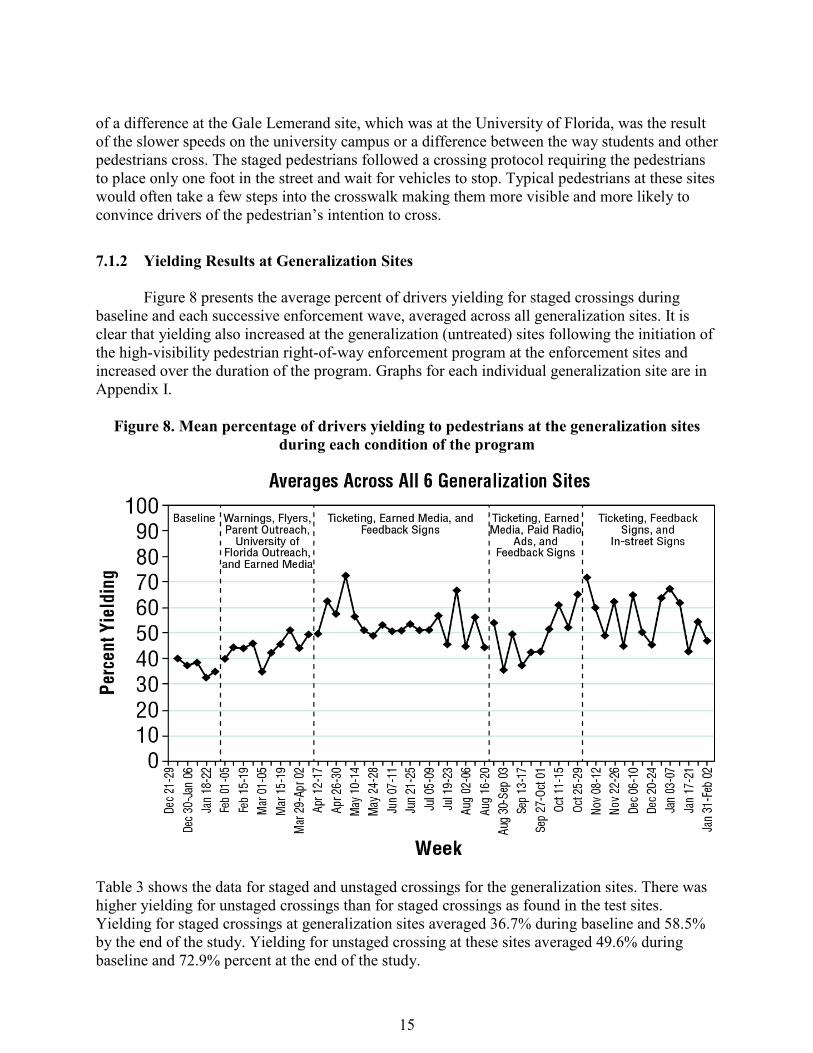
of a difference at the Gale Lemerand site, which was at the University of Florida, was the result of the slower speeds on the university campus or a difference between the way students and other pedestrians cross. The staged pedestrians followed a crossing protocol requiring the pedestrians to place only one foot in the street and wait for vehicles to stop. Typical pedestrians at these sites would often take a few steps into the crosswalk making them more visible and more likely to convince drivers of the pedestrian’s intention to cross. 7.1.2 Yielding Results at Generalization Sites Figure 8 presents the average percent of drivers yielding for staged crossings during baseline and each successive enforcement wave, averaged across all generalization sites. It is clear that yielding also increased at the generalization (untreated) sites following the initiation of the high-visibility pedestrian right-of-way enforcement program at the enforcement sites and increased over the duration of the program. Graphs for each individual generalization site are in Appendix I.
Figure 8. Mean percentage of drivers yielding to pedestrians at the generalization sites
during each condition of the program
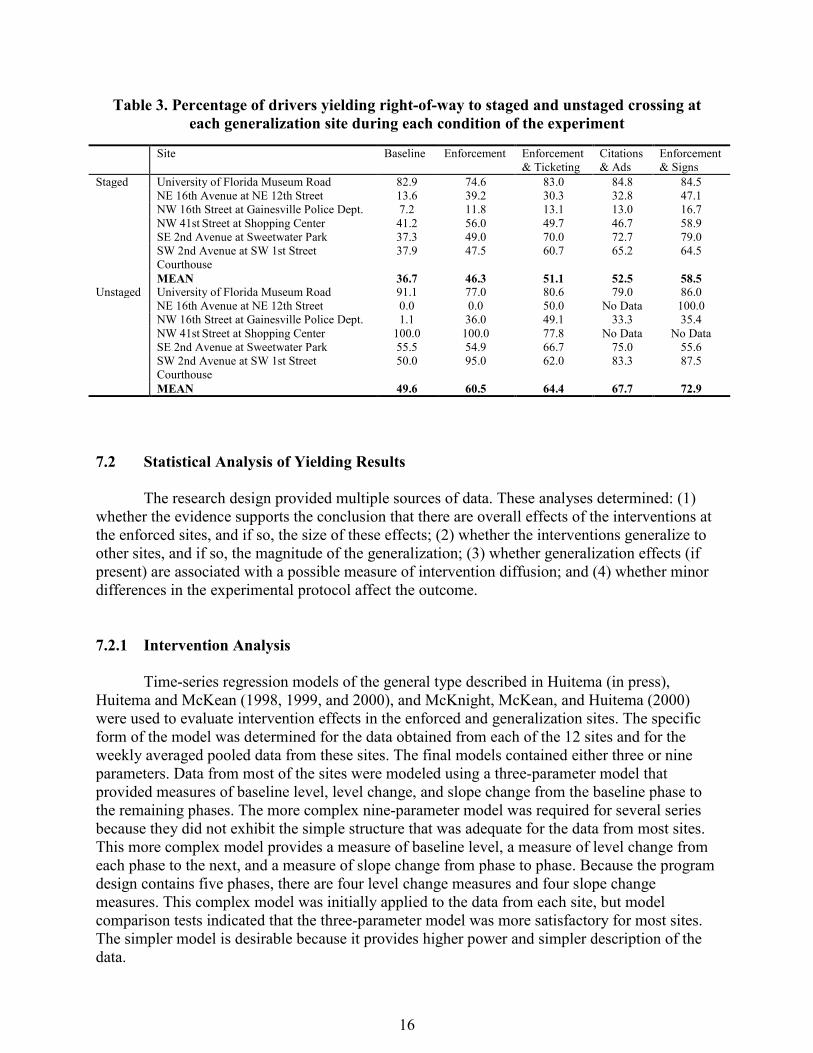
Table 3 shows the data for staged and unstaged crossings for the generalization sites. There was higher yielding for unstaged crossings than for staged crossings as found in the test sites. Yielding for staged crossings at generalization sites averaged 36.7% during baseline and 58.5% by the end of the study. Yielding for unstaged crossing at these sites averaged 49.6% during baseline and 72.9% percent at the end of the study.
16
Table 3. Percentage of drivers yielding right-of-way to staged and unstaged crossing at each generalization site during each condition of the experiment
Site Baseline Enforcement Enforcement
& Ticketing Citations & Ads
Enforcement & Signs
Staged University of Florida Museum Road 82.9 74.6 83.0 84.8 84.5 NE 16th Avenue at NE 12th Street 13.6 39.2 30.3 32.8 47.1 NW 16th Street at Gainesville Police Dept. 7.2 11.8 13.1 13.0 16.7 NW 41st Street at Shopping Center 41.2 56.0 49.7 46.7 58.9 SE 2nd Avenue at Sweetwater Park 37.3 49.0 70.0 72.7 79.0 SW 2nd Avenue at SW 1st Street
Courthouse 37.9 47.5 60.7 65.2 64.5
MEAN 36.7 46.3 51.1 52.5 58.5 Unstaged University of Florida Museum Road 91.1 77.0 80.6 79.0 86.0 NE 16th Avenue at NE 12th Street 0.0 0.0 50.0 No Data 100.0 NW 16th Street at Gainesville Police Dept. 1.1 36.0 49.1 33.3 35.4 NW 41st Street at Shopping Center 100.0 100.0 77.8 No Data No Data SE 2nd Avenue at Sweetwater Park 55.5 54.9 66.7 75.0 55.6 SW 2nd Avenue at SW 1st Street
Courthouse 50.0 95.0 62.0 83.3 87.5
MEAN 49.6 60.5 64.4 67.7 72.9 7.2 Statistical Analysis of Yielding Results
The research design provided multiple sources of data. These analyses determined: (1) whether the evidence supports the conclusion that there are overall effects of the interventions at the enforced sites, and if so, the size of these effects; (2) whether the interventions generalize to other sites, and if so, the magnitude of the generalization; (3) whether generalization effects (if present) are associated with a possible measure of intervention diffusion; and (4) whether minor differences in the experimental protocol affect the outcome.
7.2.1 Intervention Analysis
Time-series regression models of the general type described in Huitema (in press), Huitema and McKean (1998, 1999, and 2000), and McKnight, McKean, and Huitema (2000) were used to evaluate intervention effects in the enforced and generalization sites. The specific form of the model was determined for the data obtained from each of the 12 sites and for the weekly averaged pooled data from these sites. The final models contained either three or nine parameters. Data from most of the sites were modeled using a three-parameter model that provided measures of baseline level, level change, and slope change from the baseline phase to the remaining phases. The more complex nine-parameter model was required for several series because they did not exhibit the simple structure that was adequate for the data from most sites. This more complex model provides a measure of baseline level, a measure of level change from each phase to the next, and a measure of slope change from phase to phase. Because the program design contains five phases, there are four level change measures and four slope change measures. This complex model was initially applied to the data from each site, but model comparison tests indicated that the three-parameter model was more satisfactory for most sites. The simpler model is desirable because it provides higher power and simpler description of the data.
17
7.2.2 Intervention Effect Results - Enforced Sites
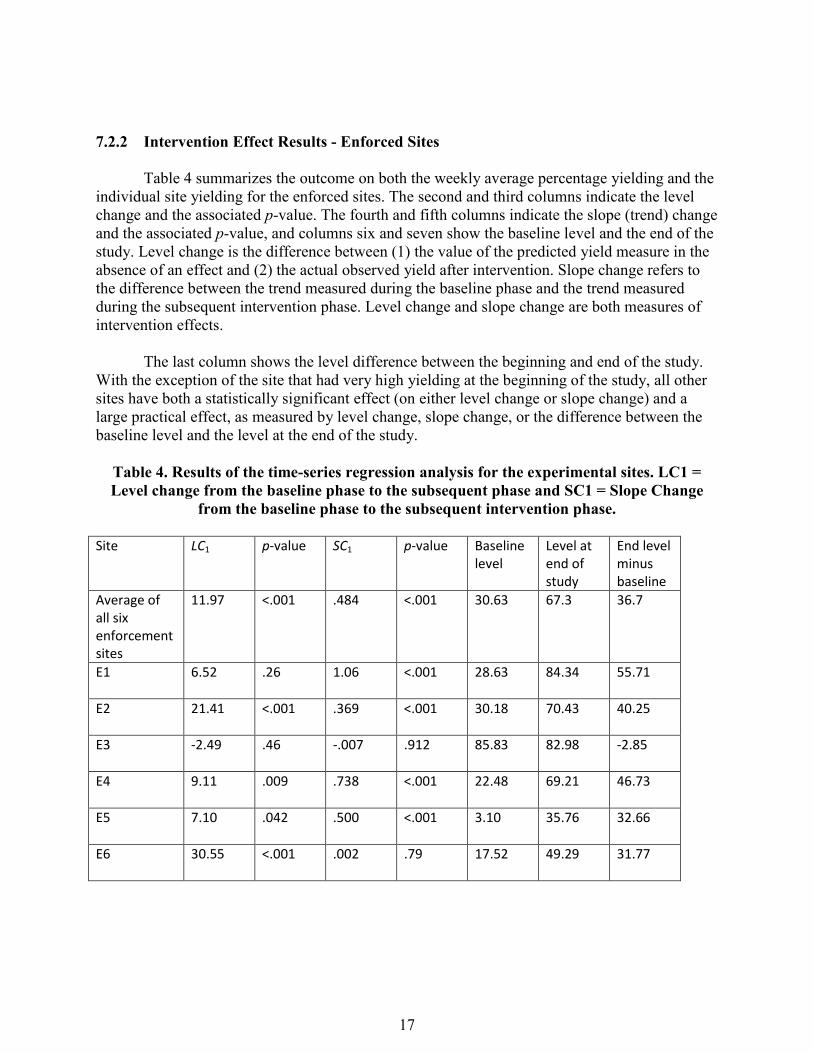
Table 4 summarizes the outcome on both the weekly average percentage yielding and the individual site yielding for the enforced sites. The second and third columns indicate the level change and the associated p-value. The fourth and fifth columns indicate the slope (trend) change and the associated p-value, and columns six and seven show the baseline level and the end of the study. Level change is the difference between (1) the value of the predicted yield measure in the absence of an effect and (2) the actual observed yield after intervention. Slope change refers to the difference between the trend measured during the baseline phase and the trend measured during the subsequent intervention phase. Level change and slope change are both measures of intervention effects.
The last column shows the level difference between the beginning and end of the study.
With the exception of the site that had very high yielding at the beginning of the study, all other sites have both a statistically significant effect (on either level change or slope change) and a large practical effect, as measured by level change, slope change, or the difference between the baseline level and the level at the end of the study.
Table 4. Results of the time-series regression analysis for the experimental sites. LC1 = Level change from the baseline phase to the subsequent phase and SC1 = Slope Change
from the baseline phase to the subsequent intervention phase. Site LC1 p-value SC1 p-value Baseline
level Level at end of study
End level minus baseline
Average of all six enforcement sites
11.97 <.001 .484 <.001 30.63 67.3 36.7
E1 6.52 .26 1.06 <.001 28.63 84.34 55.71
E2 21.41 <.001 .369 <.001 30.18 70.43 40.25
E3 -2.49 .46 -.007 .912 85.83 82.98 -2.85
E4 9.11 .009 .738 <.001 22.48 69.21 46.73
E5 7.10 .042 .500 <.001 3.10 35.76 32.66
E6 30.55 <.001 .002 .79 17.52 49.29 31.77

18
7.2.3 Intervention Effect Results - Generalization Sites
Table 5 shows that the difference between the average weekly baseline level and the level at the end of the study is approximately one-half the corresponding difference in the enforcement sites. All but one of the individual generalization sites had a statistically significant level or slope change. Both site types increased yielding behavior but the enforcement sites had larger increases. The site that did not show a significant change was the site near the police station that did not have a painted crosswalk.
Table 5. Results of the time-series regression analysis for the generalization (control) sites.
LC1 = Level change from the baseline phase to the subsequent phase and SC1 = Slope Change from the baseline phase to the subsequent intervention phase.
Site LC1 p-value SC1 p-value Baseline level
Level at end of study
End level minus baseline
Average of all generalization sites
10.80 .010 .158 .044 37.48 56.30 18.82
G1 -9.74 .002 .243 <.001 85.00 87.64 2.64
G2 22.33 <.001 .129 .204 12.77 47.69 34.92
G3 4.94 .011 .095 .017 6.52 16.29 9.77
G4 23.08 <.001 -2.28 .004 43.06 59.46 12.73
G5 15.34 .036 -.406 .73 35.04 79.69 44.65
G6 10.76 .018 .447 <.001 37.03 70.59 33.56
7.2.4 Regression Tests
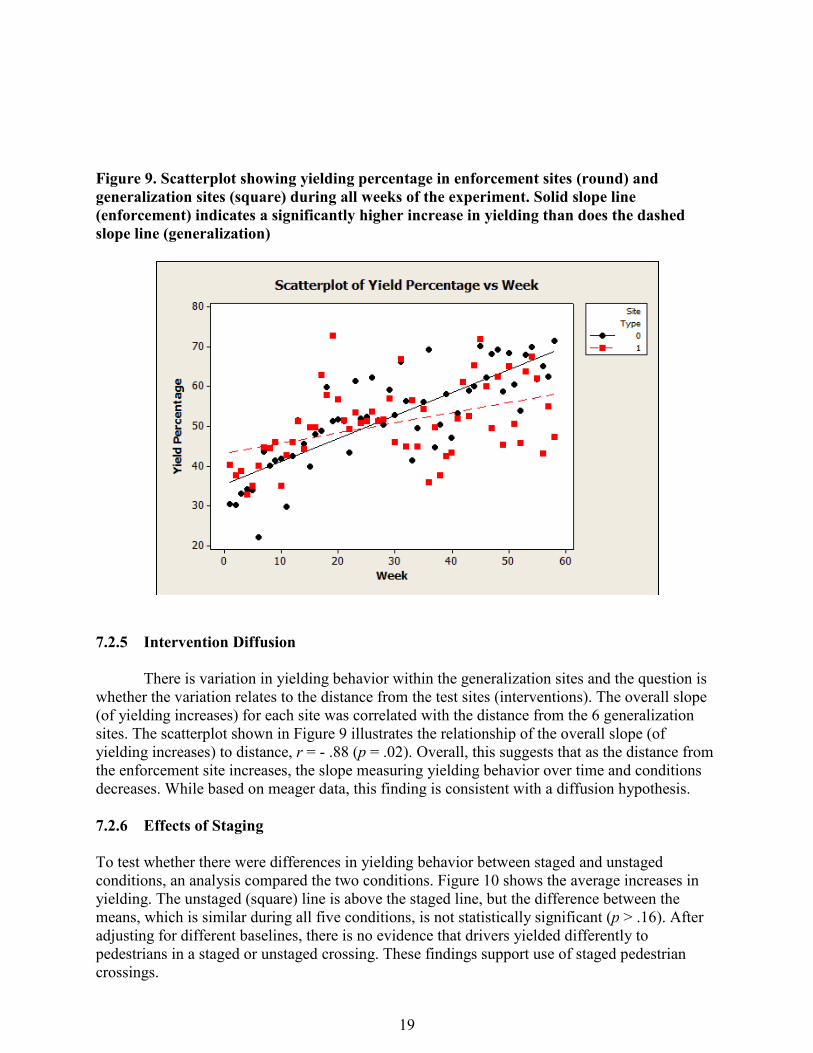
Figure 8 illustrates the data and the trends for the two groups of sites (0 for enforcement and 1 for the generalization control group). The enforcement group slope (.484) is approximately three times the value of the generalization group slope (.157). A test on the difference (enforcement versus generalization) between the overall rate of increase in yielding for the two groups of sites is statistically significant (p <.001). The test used is similar to a conventional homogeneity of regression test often used in analysis of covariance applications, but modified for the time-series context of the present study. These analyses show clear increases in yielding behavior for both groups of sites, but the enforcement group was associated with much larger increases.
19
Figure 9. Scatterplot showing yielding percentage in enforcement sites (round) and generalization sites (square) during all weeks of the experiment. Solid slope line (enforcement) indicates a significantly higher increase in yielding than does the dashed slope line (generalization)
7.2.5 Intervention Diffusion
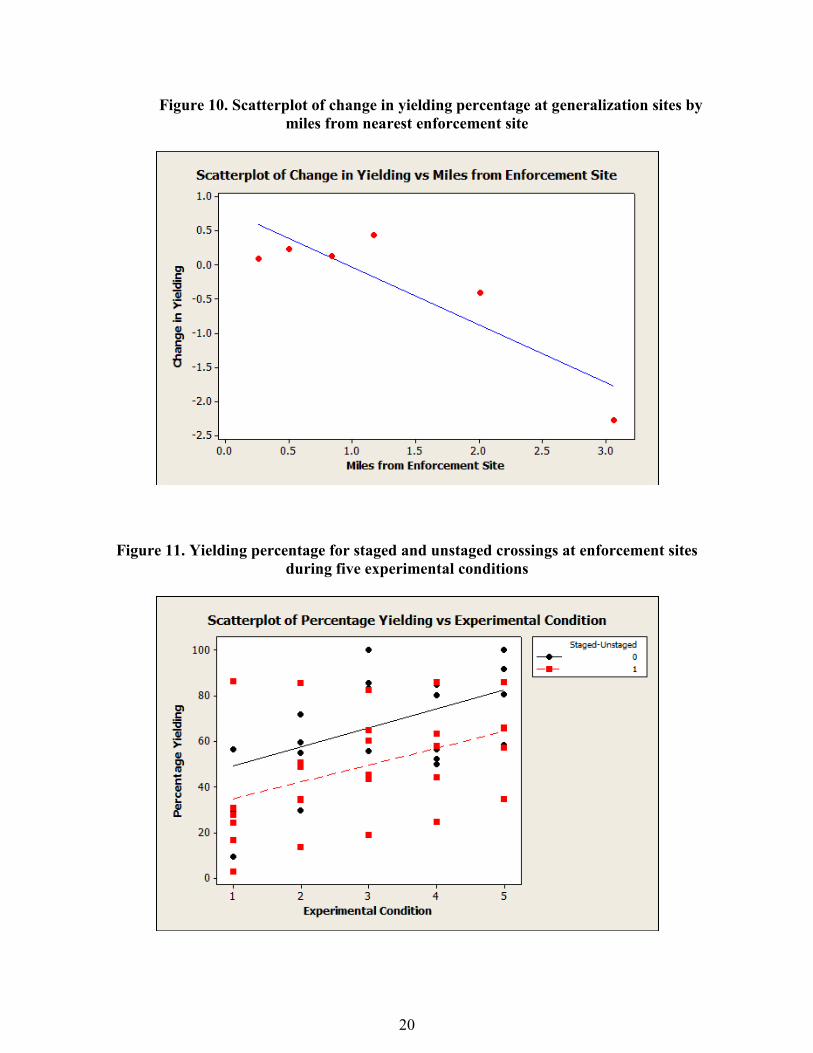
There is variation in yielding behavior within the generalization sites and the question is whether the variation relates to the distance from the test sites (interventions). The overall slope (of yielding increases) for each site was correlated with the distance from the 6 generalization sites. The scatterplot shown in Figure 9 illustrates the relationship of the overall slope (of yielding increases) to distance, r = - .88 (p = .02). Overall, this suggests that as the distance from the enforcement site increases, the slope measuring yielding behavior over time and conditions decreases. While based on meager data, this finding is consistent with a diffusion hypothesis. 7.2.6 Effects of Staging
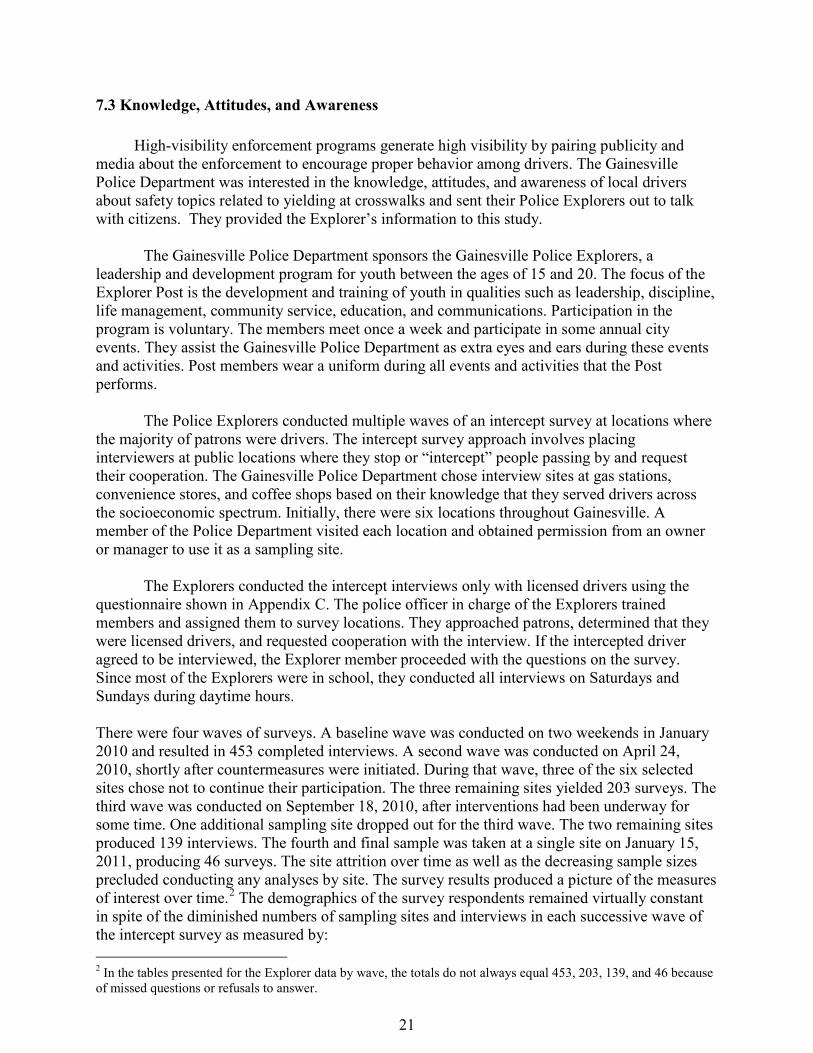
To test whether there were differences in yielding behavior between staged and unstaged conditions, an analysis compared the two conditions. Figure 10 shows the average increases in yielding. The unstaged (square) line is above the staged line, but the difference between the means, which is similar during all five conditions, is not statistically significant (p > .16). After adjusting for different baselines, there is no evidence that drivers yielded differently to pedestrians in a staged or unstaged crossing. These findings support use of staged pedestrian crossings.
20
Figure 10. Scatterplot of change in yielding percentage at generalization sites by miles from nearest enforcement site
Figure 11. Yielding percentage for staged and unstaged crossings at enforcement sites during five experimental conditions
21
7.3 Knowledge, Attitudes, and Awareness
High-visibility enforcement programs generate high visibility by pairing publicity and media about the enforcement to encourage proper behavior among drivers. The Gainesville Police Department was interested in the knowledge, attitudes, and awareness of local drivers about safety topics related to yielding at crosswalks and sent their Police Explorers out to talk with citizens. They provided the Explorer’s information to this study. The Gainesville Police Department sponsors the Gainesville Police Explorers, a leadership and development program for youth between the ages of 15 and 20. The focus of the Explorer Post is the development and training of youth in qualities such as leadership, discipline, life management, community service, education, and communications. Participation in the program is voluntary. The members meet once a week and participate in some annual city events. They assist the Gainesville Police Department as extra eyes and ears during these events and activities. Post members wear a uniform during all events and activities that the Post performs.
The Police Explorers conducted multiple waves of an intercept survey at locations where the majority of patrons were drivers. The intercept survey approach involves placing interviewers at public locations where they stop or “intercept” people passing by and request their cooperation. The Gainesville Police Department chose interview sites at gas stations, convenience stores, and coffee shops based on their knowledge that they served drivers across the socioeconomic spectrum. Initially, there were six locations throughout Gainesville. A member of the Police Department visited each location and obtained permission from an owner or manager to use it as a sampling site. The Explorers conducted the intercept interviews only with licensed drivers using the questionnaire shown in Appendix C. The police officer in charge of the Explorers trained members and assigned them to survey locations. They approached patrons, determined that they were licensed drivers, and requested cooperation with the interview. If the intercepted driver agreed to be interviewed, the Explorer member proceeded with the questions on the survey. Since most of the Explorers were in school, they conducted all interviews on Saturdays and Sundays during daytime hours. There were four waves of surveys. A baseline wave was conducted on two weekends in January 2010 and resulted in 453 completed interviews. A second wave was conducted on April 24, 2010, shortly after countermeasures were initiated. During that wave, three of the six selected sites chose not to continue their participation. The three remaining sites yielded 203 surveys. The third wave was conducted on September 18, 2010, after interventions had been underway for some time. One additional sampling site dropped out for the third wave. The two remaining sites produced 139 interviews. The fourth and final sample was taken at a single site on January 15, 2011, producing 46 surveys. The site attrition over time as well as the decreasing sample sizes precluded conducting any analyses by site. The survey results produced a picture of the measures of interest over time.2 The demographics of the survey respondents remained virtually constant in spite of the diminished numbers of sampling sites and interviews in each successive wave of the intercept survey as measured by: 2 In the tables presented for the Explorer data by wave, the totals do not always equal 453, 203, 139, and 46 because of missed questions or refusals to answer.
22
• Question 1 (how long licensed to drive)—The mean years licensed was 21.7, 24.8, 28.2, and 22.6 in waves 1-4, respectively. Neither the mean by wave (as tested by a t-test) nor the distribution of driving experience by wave (as tested by a Pearson chi-square test3) was significant (p > .05).
• Question 2 (vehicle driven most often)—In all four waves, “Car” was the most frequent response (56.4% overall) followed by “SUV” (16.2%), “Pickup” (14.7%), “Other” (6.7%), and “Van” (5.2%). Less than 1% of respondents said they drove a “Fleet Vehicle” most often. Vehicle driven most often was not significantly associated with wave (p > .05).
• Question 3 (seat belt use)—There was no significant association between self-reported seat belt use and survey wave (p > .05). Overall, 88.0% of respondents said they “Always” wore their seat belts. Less than 2.0% indicated they wore belts “Seldom” or “Never.”
• Question 10 (Gainesville residency)—The distribution of yes/no responses by survey wave was significant (p = .05, but no two waves had a significantly different distribution of responses.4 Overall, 80.4% of respondents indicated they lived in Gainesville. Among those who answered “No,” 76.5% lived less than 50 miles from Gainesville, and the distribution of distances from Gainesville was not significantly associated with wave (p > .05).
• Question 11 (respondent age)—The distribution of age of respondent by survey wave was significant (p = .05) when coded into the categories of “< 25,” “25-49,” “50-64,” and “65+,” but no two waves had a significantly different distribution of responses. The mean age by wave was, respectively, 40.5, 39.3, 42.3, and 44.5. There were no significant differences in mean age among the waves based on a t-test (p > .05).
• Question 12 (respondent gender)—Gender did not vary significantly by wave. Overall, 57.2% were males.
These response patterns suggest that the composition of the survey sample remained approximately the same across the waves. Thus, any changes in the responses over time to the remaining questions relating to knowledge, attitudes, and program exposure can be considered free of any meaningful biases due to changes in sample composition. Question 4 asked whether the respondent knew what Florida law requires drivers to do when they approach a pedestrian in a crosswalk. In the baseline measurement, 95.2% of the respondents in each wave answered in the affirmative. This percentage remained at 95% or greater in all waves except the second (April 2010) when it slipped slightly to 89.7%. Almost all respondents thought they knew what the Florida law required.
3 The Pearson chi-square test and all other statistics reported herein were calculated using the SPSS Version 13 software. Unless otherwise stated, the chi-square test was used for all examinations of association between survey variables and wave of survey. 4 When the Pearson chi-square statistic was significant, all pairwise comparisons between waves were tested using the Z test of column proportions. Significance is reported if two-sided tests met the 0.05 level.
23
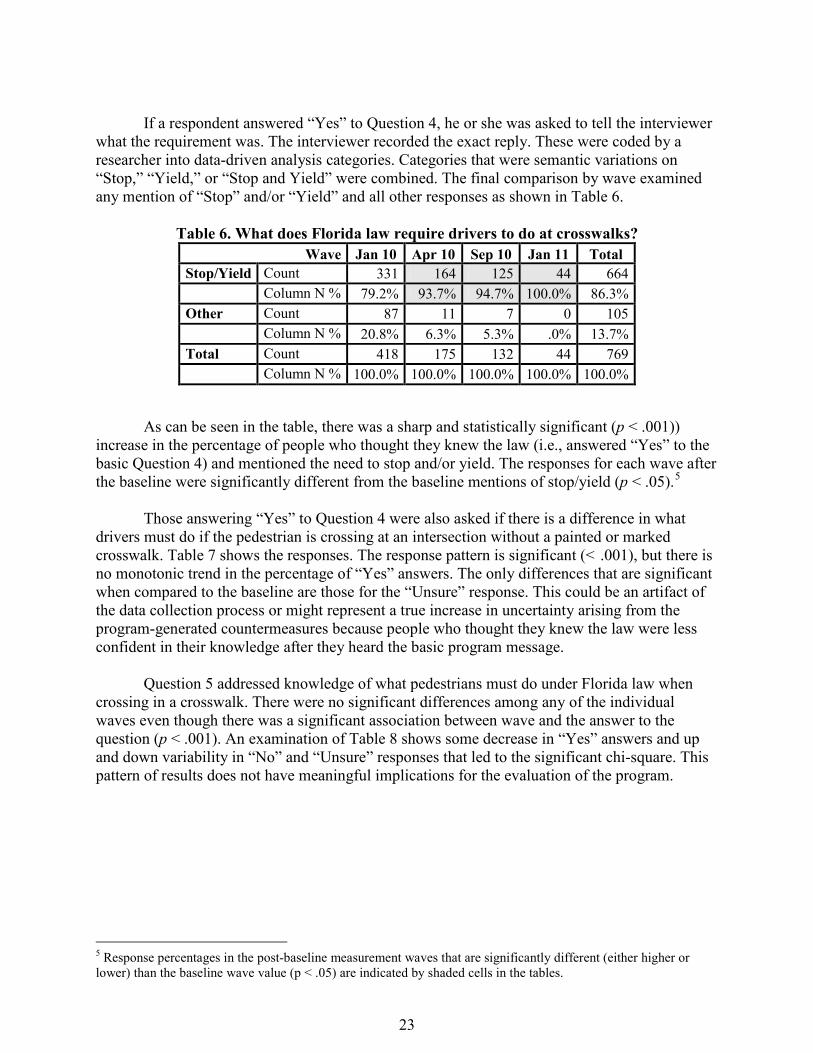
If a respondent answered “Yes” to Question 4, he or she was asked to tell the interviewer what the requirement was. The interviewer recorded the exact reply. These were coded by a researcher into data-driven analysis categories. Categories that were semantic variations on “Stop,” “Yield,” or “Stop and Yield” were combined. The final comparison by wave examined any mention of “Stop” and/or “Yield” and all other responses as shown in Table 6.
Table 6. What does Florida law require drivers to do at crosswalks? Wave Jan 10 Apr 10 Sep 10 Jan 11 Total
Stop/Yield Count 331 164 125 44 664 Column N % 79.2% 93.7% 94.7% 100.0% 86.3% Other Count 87 11 7 0 105 Column N % 20.8% 6.3% 5.3% .0% 13.7% Total Count 418 175 132 44 769 Column N % 100.0% 100.0% 100.0% 100.0% 100.0%
As can be seen in the table, there was a sharp and statistically significant (p < .001)) increase in the percentage of people who thought they knew the law (i.e., answered “Yes” to the basic Question 4) and mentioned the need to stop and/or yield. The responses for each wave after the baseline were significantly different from the baseline mentions of stop/yield (p < .05).5 Those answering “Yes” to Question 4 were also asked if there is a difference in what drivers must do if the pedestrian is crossing at an intersection without a painted or marked crosswalk. Table 7 shows the responses. The response pattern is significant (< .001), but there is no monotonic trend in the percentage of “Yes” answers. The only differences that are significant when compared to the baseline are those for the “Unsure” response. This could be an artifact of the data collection process or might represent a true increase in uncertainty arising from the program-generated countermeasures because people who thought they knew the law were less confident in their knowledge after they heard the basic program message. Question 5 addressed knowledge of what pedestrians must do under Florida law when crossing in a crosswalk. There were no significant differences among any of the individual waves even though there was a significant association between wave and the answer to the question (p < .001). An examination of Table 8 shows some decrease in “Yes” answers and up and down variability in “No” and “Unsure” responses that led to the significant chi-square. This pattern of results does not have meaningful implications for the evaluation of the program.
5 Response percentages in the post-baseline measurement waves that are significantly different (either higher or lower) than the baseline wave value (p < .05) are indicated by shaded cells in the tables.
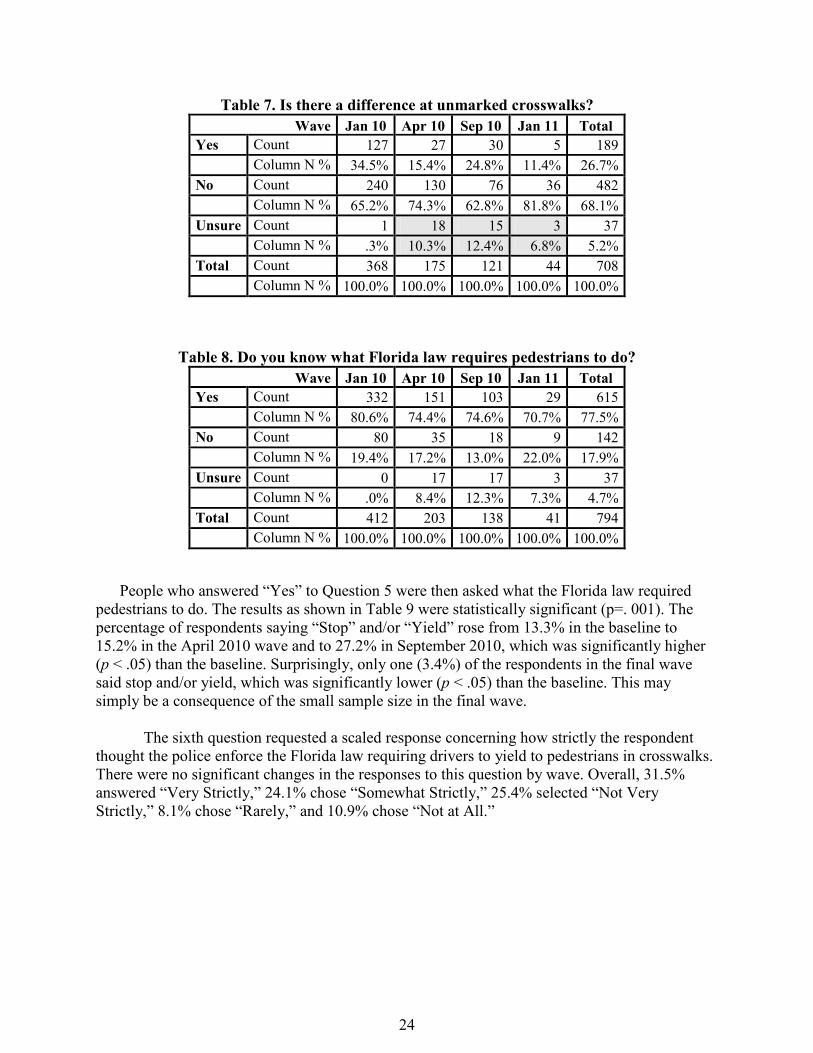
24
Table 7. Is there a difference at unmarked crosswalks? Wave Jan 10 Apr 10 Sep 10 Jan 11 Total
Yes Count 127 27 30 5 189 Column N % 34.5% 15.4% 24.8% 11.4% 26.7% No Count 240 130 76 36 482 Column N % 65.2% 74.3% 62.8% 81.8% 68.1% Unsure Count 1 18 15 3 37 Column N % .3% 10.3% 12.4% 6.8% 5.2% Total Count 368 175 121 44 708 Column N % 100.0% 100.0% 100.0% 100.0% 100.0%
Table 8. Do you know what Florida law requires pedestrians to do? Wave Jan 10 Apr 10 Sep 10 Jan 11 Total
Yes Count 332 151 103 29 615 Column N % 80.6% 74.4% 74.6% 70.7% 77.5% No Count 80 35 18 9 142 Column N % 19.4% 17.2% 13.0% 22.0% 17.9% Unsure Count 0 17 17 3 37 Column N % .0% 8.4% 12.3% 7.3% 4.7% Total Count 412 203 138 41 794 Column N % 100.0% 100.0% 100.0% 100.0% 100.0%
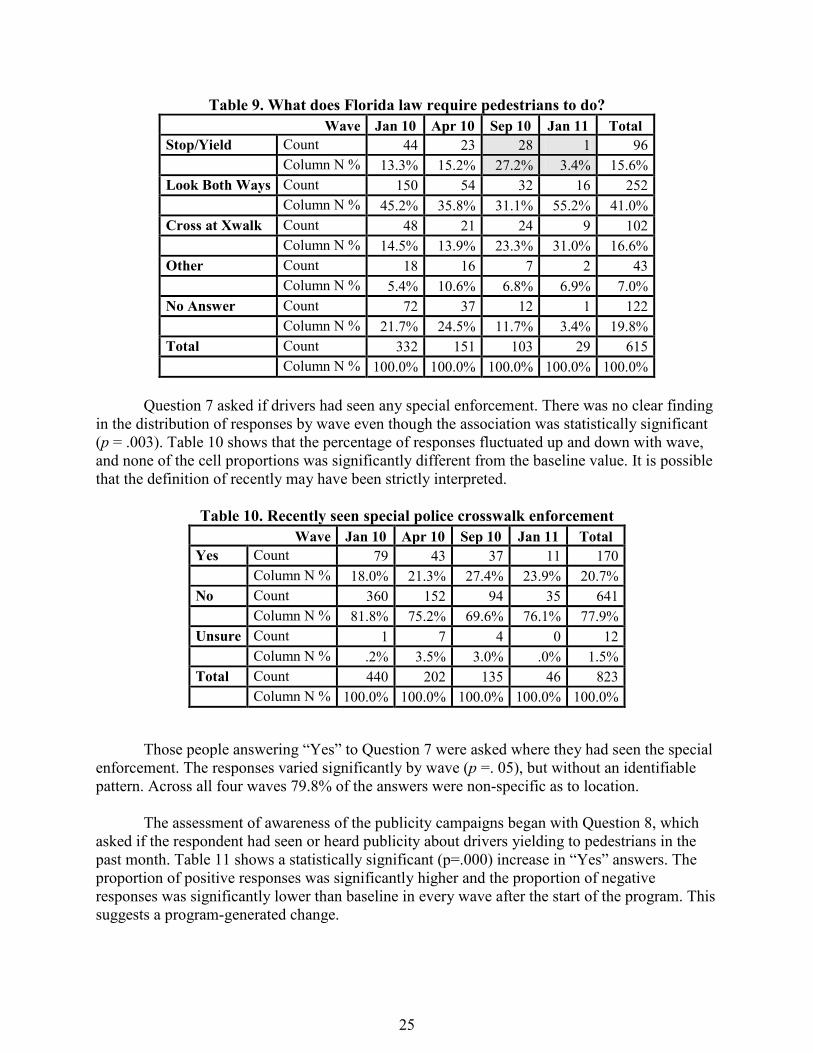
People who answered “Yes” to Question 5 were then asked what the Florida law required pedestrians to do. The results as shown in Table 9 were statistically significant (p=. 001). The percentage of respondents saying “Stop” and/or “Yield” rose from 13.3% in the baseline to 15.2% in the April 2010 wave and to 27.2% in September 2010, which was significantly higher (p < .05) than the baseline. Surprisingly, only one (3.4%) of the respondents in the final wave said stop and/or yield, which was significantly lower (p < .05) than the baseline. This may simply be a consequence of the small sample size in the final wave. The sixth question requested a scaled response concerning how strictly the respondent thought the police enforce the Florida law requiring drivers to yield to pedestrians in crosswalks. There were no significant changes in the responses to this question by wave. Overall, 31.5% answered “Very Strictly,” 24.1% chose “Somewhat Strictly,” 25.4% selected “Not Very Strictly,” 8.1% chose “Rarely,” and 10.9% chose “Not at All.”
25
Table 9. What does Florida law require pedestrians to do? Wave Jan 10 Apr 10 Sep 10 Jan 11 Total
Stop/Yield Count 44 23 28 1 96 Column N % 13.3% 15.2% 27.2% 3.4% 15.6% Look Both Ways Count 150 54 32 16 252 Column N % 45.2% 35.8% 31.1% 55.2% 41.0% Cross at Xwalk Count 48 21 24 9 102 Column N % 14.5% 13.9% 23.3% 31.0% 16.6% Other Count 18 16 7 2 43 Column N % 5.4% 10.6% 6.8% 6.9% 7.0% No Answer Count 72 37 12 1 122 Column N % 21.7% 24.5% 11.7% 3.4% 19.8% Total Count 332 151 103 29 615 Column N % 100.0% 100.0% 100.0% 100.0% 100.0%
Question 7 asked if drivers had seen any special enforcement. There was no clear finding in the distribution of responses by wave even though the association was statistically significant (p = .003). Table 10 shows that the percentage of responses fluctuated up and down with wave, and none of the cell proportions was significantly different from the baseline value. It is possible that the definition of recently may have been strictly interpreted.
Table 10. Recently seen special police crosswalk enforcement
Wave Jan 10 Apr 10 Sep 10 Jan 11 Total Yes Count 79 43 37 11 170 Column N % 18.0% 21.3% 27.4% 23.9% 20.7% No Count 360 152 94 35 641 Column N % 81.8% 75.2% 69.6% 76.1% 77.9% Unsure Count 1 7 4 0 12 Column N % .2% 3.5% 3.0% .0% 1.5% Total Count 440 202 135 46 823 Column N % 100.0% 100.0% 100.0% 100.0% 100.0%
Those people answering “Yes” to Question 7 were asked where they had seen the special enforcement. The responses varied significantly by wave (p =. 05), but without an identifiable pattern. Across all four waves 79.8% of the answers were non-specific as to location. The assessment of awareness of the publicity campaigns began with Question 8, which asked if the respondent had seen or heard publicity about drivers yielding to pedestrians in the past month. Table 11 shows a statistically significant (p=.000) increase in “Yes” answers. The proportion of positive responses was significantly higher and the proportion of negative responses was significantly lower than baseline in every wave after the start of the program. This suggests a program-generated change.

26
Table 11. Seen or heard publicity in the last month Wave Jan 10 Apr 10 Sep 10 Jan 11 Total
Yes Count 87 98 62 23 270 Column N % 20.0% 56.0% 51.2% 51.1% 34.8% No Count 348 73 52 21 494 Column N % 80.0% 41.7% 43.0% 46.7% 63.7% Unsure Count 0 4 7 1 12 Column N % .0% 2.3% 5.8% 2.2% 1.5% Total Count 435 175 121 45 776 Column N % 100.0% 100.0% 100.0% 100.0% 100.0%
The 270 respondents across all waves who indicated they had seen or heard some relevant publicity were then asked where they had been exposed to the message they saw or heard. They were read the categories of “Newspaper,” “Radio,” “TV,” “Banner,” “Brochure/Flyer,” “Newsletter,” “Poster,” and “Other.” Table 12 presents the significant (p = .002) distribution of people saying they read a message in the newspaper. The proportion of people in April 2010 responding positively to a newspaper exposure is significantly higher (p < .05) than the baseline value. This wave occurred just after program initiation when there was significant press activity.
Table 12. Read message in newspaper Wave Jan 10 Apr 10 Sep 10 Jan 11 Total
Yes Count 18 41 14 3 76 Column N % 20.7% 41.8% 22.6% 13.0% 28.1% No Count 69 57 48 20 194 Column N % 79.3% 58.2% 77.4% 87.0% 71.9% Total Count 87 98 62 23 270 Column N % 100.0% 100.0% 100.0% 100.0% 100.0%
Posters were the only other medium that showed a significant increase in mentions, and that was based on only 18 responses across all four waves. There was a clear increase in people who said they had heard, seen, or read some message related to the program, but only newspapers reached statistical significance. Since other media were used as part of the program, it is reasonable to assume that they contributed to the increase in “Yes” responses but the sample size could not detect their contribution. Only 145 of the 270 respondents who said they were exposed to publicity provided a response to the question “What did it say?” Table 13 shows these responses. The distribution of responses is significantly associated with wave (p = .005), but many cells in the table with counts of less than five could invalidate the chi-square test. Notwithstanding this limitation, however, Table 13 shows some interesting patterns. The percentage of respondents who mentioned the feedback signs jumped from 0 to 56% by the end of the fourth wave. The fact that these mentions were unprompted suggests that the feedback signs used by the program were particularly powerful.

27
There was a marked drop from 41.2% (baseline survey wave) to a low of 6.7% (September 2010 survey wave) in the percentage of respondents who indicated that the message said that drivers must yield to pedestrians (Table 13). Although this drop was not statistically significant, its magnitude and direction are curious. One possible explanation is that the specific messages disseminated by the Gainesville high-visibility enforcement program about increased enforcement and the resulting percentage of drivers yielding were more memorable in the context of the interview than was the “classic” highway safety message, “Yield to pedestrians.” The novel publicity presented by feedback signs may have been at least part of the reason for the observed pattern of responses.
Table 13. What did the message say? Wave Jan 10 Apr 10 Sep 10 Jan 11 Total
Enforcing Laws Count 4 15 18 4 41 Column N % 23.5% 23.1% 40.0% 22.2% 28.3% Percentage Yielding Count 0 25 13 10 48 Column N % .0% 38.5% 28.9% 55.6% 33.1% Drivers Must Yield Count 7 9 3 2 21 Column N % 41.2% 13.8% 6.7% 11.1% 14.5% Be More Careful Count 3 7 2 0 12 Column N % 17.6% 10.8% 4.4% .0% 8.3% Other Count 3 9 9 2 23 Column N % 17.6% 13.8% 20.0% 11.1% 15.9% Total Count 17 65 45 18 145 Column N % 100.0% 100.0% 100.0% 100.0% 100.0%
Question 9 asked specifically if the respondent had seen a road sign with the feedback information on the percentage of Gainesville drivers who were yielding to pedestrians. Table 14 shows a clear and strong response. The percentage of the sample who said they had seen a sign jumped from 13% in the baseline (before the signs were erected), to 53% in April 2010, to 75% in September 2010, and to 78% in January 2011. The overall distribution is significant (p=.001, and each of the three post-baseline waves is significantly higher in “Yes” responses (and lower in “No” responses) than the baseline wave (p < .05). It is also noteworthy that the September 2010 and January 2011 percentage of “Yes” responses is also significantly higher than the April 2010 level (p < .05).
Table 14. Recently seen a road sign containing yielding data? Wave Jan 10 Apr 10 Sep 10 Jan 11 Total
Yes Count 58 104 103 35 300 Column N % 13.0% 52.8% 75.2% 77.8% 36.3% No Count 389 93 34 10 526 Column N % 87.0% 47.2% 24.8% 22.2% 63.7% Total Count 447 197 137 45 826 Column N % 100.0% 100.0% 100.0% 100.0% 100.0%
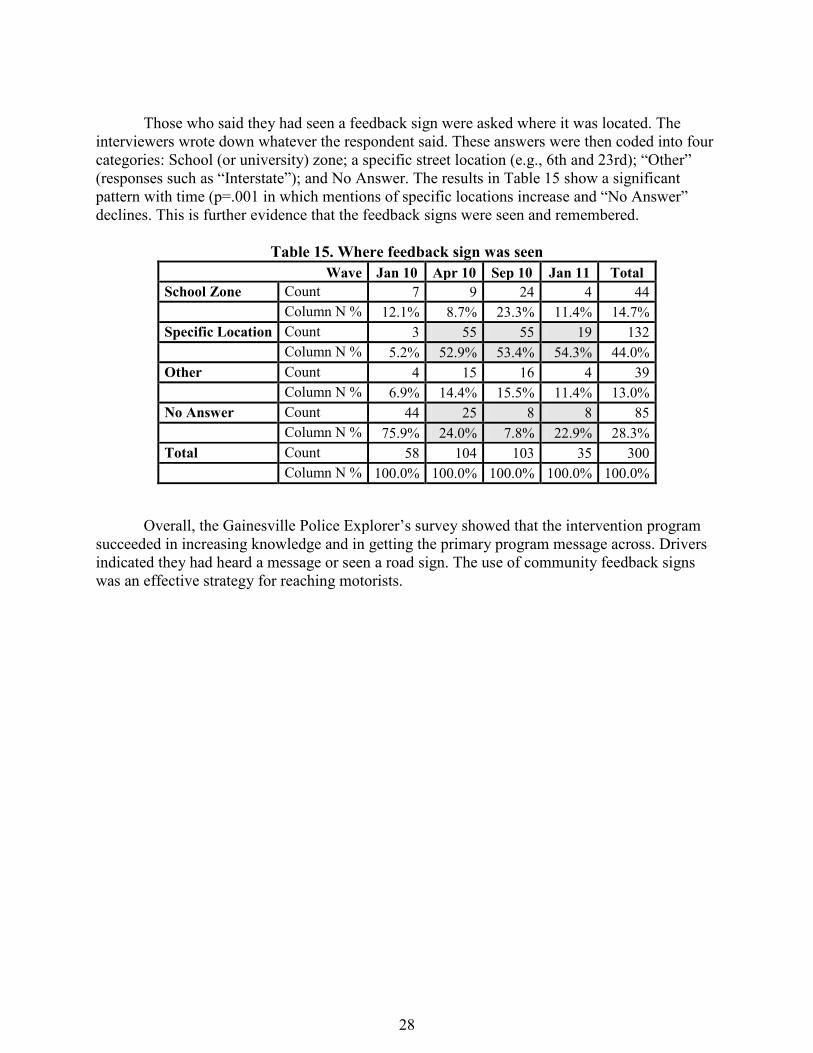
28
Those who said they had seen a feedback sign were asked where it was located. The interviewers wrote down whatever the respondent said. These answers were then coded into four categories: School (or university) zone; a specific street location (e.g., 6th and 23rd); “Other” (responses such as “Interstate”); and No Answer. The results in Table 15 show a significant pattern with time (p=.001 in which mentions of specific locations increase and “No Answer” declines. This is further evidence that the feedback signs were seen and remembered.
Table 15. Where feedback sign was seen Wave Jan 10 Apr 10 Sep 10 Jan 11 Total
School Zone Count 7 9 24 4 44 Column N % 12.1% 8.7% 23.3% 11.4% 14.7% Specific Location Count 3 55 55 19 132 Column N % 5.2% 52.9% 53.4% 54.3% 44.0% Other Count 4 15 16 4 39 Column N % 6.9% 14.4% 15.5% 11.4% 13.0% No Answer Count 44 25 8 8 85 Column N % 75.9% 24.0% 7.8% 22.9% 28.3% Total Count 58 104 103 35 300 Column N % 100.0% 100.0% 100.0% 100.0% 100.0%
Overall, the Gainesville Police Explorer’s survey showed that the intervention program succeeded in increasing knowledge and in getting the primary program message across. Drivers indicated they had heard a message or seen a road sign. The use of community feedback signs was an effective strategy for reaching motorists.

29
7.4 Crash Results The Gainesville Police Department provided crash files in PDF format. Each file included the report narrative and a crash diagram. To be included as a pedestrian crash, the pedestrian had to be struck in the roadway; parking lot crashes were excluded. Injury crashes included crashes that resulted in transport of the pedestrian to the hospital for care. Pedestrian crosswalk crashes included those that occurred in a crosswalk at a traffic signal or at an uncontrolled crosswalk. In both categories, the officer recorded either that the person was crossing in a crosswalk or showed that the pedestrian was in the crosswalk in the crash diagram. For traffic signal crashes, the officer noted whether the pedestrian was crossing with or against the signal. In cases where pedestrians darted out or ran into the crosswalk before the vehicle struck them, the pedestrian was scored as a violator. In 2009, the year before the program, there were 40 pedestrian crashes in Gainesville. In 2010, during the year of the program, there were 38 pedestrian crashes. The program started in February 2010 and yielding behavior increased gradually over time. Table 16 shows the frequency and type of pedestrian crashes that occurred in 2009 and in 2010. While the sample sizes are very small, there were fewer crosswalk crashes, fewer crosswalk injury crashes, and fewer driver-at-fault crosswalk crashes in the second half of 2010. While crash reductions are in the expected direction, the sample size is far too small to draw firm conclusions about the relationship between yielding behavior and crashes. Table 16. Pedestrian crashes during 2009 and 2010
Gainesville Pedestrian Crashes 2009 2010 Pedestrian Crosswalk Injury Crashes First Half of Year 5 7 Pedestrian Crosswalk Injury Crashes Second Half of Year 3 0
All Crosswalk Crashes First Half of Year 9 12 All Crosswalk Crashes Second Half of Year 8 5
Driver at Fault Crosswalk Crashes First Half of Year 9 11
Driver at Fault Crosswalk Crashes Second Half of Year 6 3
30
8 DISCUSSION
This study implemented and evaluated the effect of a high-visibility pedestrian enforcement operation on drivers yielding right-of-way to pedestrians. Gainesville, Florida worked with NHTSA to conduct a comprehensive year-long pedestrian program built on the foundations of engineering, outreach, education, paid and earned media, pedestrian decoy enforcement, and feedback signs. Before the program began, the city installed or refreshed advance yield markings at 12 pedestrian crossings in high pedestrian locations to clarify where drivers should stop for pedestrians. Local schools sent home flyers to parents of children to alert them that special enforcement of the State’s pedestrian yielding laws would begin soon. Paid radio ads spread news about enforcement. During the first month of the enforcement program, officers issued only warnings to drivers who failed to yield to pedestrians in the six test crosswalks, along with flyers explaining Florida’s pedestrian yielding laws. In the second and subsequent waves, officers issued citations to offending drivers. The city conducted a succession of earned media and outreach to keep news about the enforcement program fresh and newsworthy for local media. Each week the city updated feedback signs along busy roadways to inform motorists how the previous week’s yielding percentage compared to the record.
There are two distinct components to increase the visibility of enforcement operations. The intent is for all motorists, not just those who receive citations, to understand that they will get a citation if they fail to yield to pedestrians. First, passing drivers must know that the numerous vehicles they see officers stopping are being stopped for a pedestrian violation. The Gainesville officers accomplished this by using portable “Pedestrian Law Enforcement Operation” sandwich board signs during the enforcement waves on busy streets. The second method is to increase the perception of enforcement by widely publicizing that police will be enforcing pedestrian right-of-way at crosswalks.
There were slow and steady increases in the percentage of drivers yielding right-of-way to pedestrians over the course of the year, ending with marked increases in yielding behavior. The evaluation included staged and unstaged (or natural) crossings. There were higher levels of yielding to natural pedestrian crossings than to staged crossing and the changes in both were highly correlated. Pedestrian yielding behavior at six comparison crosswalks also increased over the course of the program with higher pedestrian yielding occurring on crosswalks closer to the test sites. The amount of generalization to unenforced sites was inversely proportional to the distance from sites that received enforcement.
The slow but steady increase in yielding behavior over the course of the study suggests
that introducing components of the high-visibility program in a stepwise manner contributed to the overall success of the program. The presence of a high degree of generalization also helps confirm the effectiveness of the Pedestrian Safety Program. If drivers only responded to actual enforcement operations, it would be more likely that the effects would be confined to sites that received enforcement. This diffusion of effects suggests that programs should select enforcement sites throughout the city to maximize generalization to sites that do not receive enforcement.
It is interesting that drivers yielded at higher levels to naturally occurring pedestrian crossings than to staged crossings. These data replicate a finding by Van Houten, Ellis, and
31
Marmolejo (2008) who found that yielding to an engineering treatment was higher for natural occurring pedestrians than for staged crossings. One possible reason for this effect is that naturally occurring pedestrians may cross more assertively than pedestrians following a safety protocol for staged crossing. For example, in staged crossing the pedestrian only steps into the crosswalk with one foot while natural occurring pedestrians often take several steps into the crosswalk. While drivers are legally required to yield to pedestrians that enter the crosswalk either way, pedestrians that take several steps are likely more visible and may be perceived as more determined to cross the street.
The large changes in yielding behavior provide support for the program’s success. One
interesting survey result was the magnitude of recognition of the community feedback signs showing the percentage of drivers yielding to pedestrians. The percentage of the sample saying they had seen a sign jumped from 13.0% at baseline before the signs were erected, to 52.8% in April 2010 and then 75.2% and 77.8% in September 2010 and January 2011, respectively.
It was not possible to conclude that the program reduced pedestrian crashes. Although the observed changes were in the right direction, the sample size was too small to yield data for statistical analysis. Crashes in crosswalks related to drivers failing to yield right-of-way to pedestrians are only a subset of all pedestrian crashes, which reduces the sample size even further. Finally, the program did not produce an instantaneous increase in yielding behavior to high levels but instead produced a steady but slow increase over the course of the year.
8.2 Future Research
Additional research should determine the number or duration of enforcement waves needed to produce similar changes in yielding behavior in larger cities. One very interesting finding was the role the feedback signs played on driver program awareness. These signs may be an effective way to promote both enforcement and community support for safer driving behavior. Other research has shown that community feedback signs can also increase seatbelt use (Malenfant, Wells, Van Houten, & Williams, 1996; Wells, Malenfant, Williams, & Van Houten, 2000) and reduce speeding behavior (Van Houten & Nau, 1983; Van Houten, et al., 1985). It would be interesting to determine whether reducing the frequency of feedback from weekly to monthly can help maintain increased yielding. Another possible avenue for research is whether providing feedback on the number of citations given on large signs can further increase yielding behavior, particularly during early enforcement waves. A potential strategy would involve providing concurrent feedback on citations given and yielding behavior.
32
9. References
Britt, J. W., Bergman A. B., & Moffat J. (1995). Law enforcement, pedestrian safety and driver compliance with crosswalk laws: Evaluation of a four-year campaign in Seattle, Washington. Transportation Research Record, 1485, 160-167.
Federal Highway Administration. (2009). Manual on uniform traffic control devices for streets
and highways. 2009 edition. Washington, DC. Available at http://mutcd.fhwa.dot.gov/pdfs/2009/mutcd2009edition.pdf
Huitema, B. E. (In press). The Analysis of Covariance and Alternatives: Statistical Methods for Experiments, Quasi-Experiments, and Single-Case Studies (2nd ed.). New York: Wiley. Huitema, B. E., & McKean, J. W. (1998). Irrelevant autocorrelation in least-squares intervention models. Psychological Methods, 3, 104-116. Huitema, B. E., & McKean, J. W. (1999). Autocorrelation effects on least-squares intervention analysis of short time series. Educational and Psychological Measurement, 59, 767-786. Huitema, B. E., & McKean, J. W. (2000). Design specification issues in time-series intervention models. Educational and Psychological Measurement, 60, 38-58. Hunter, W. W., Stutts, J. C., Pein, W. E., & Chante, L. C. (1996). Pedestrian and bicycle crash
types of the early 1990s. (Report No. FHWA-RD-95-163). Washington, DC: Federal Highway Administration.
Huybers, S., Van Houten, R., & Malenfant, J. E. L. (2004). Reducing conflicts between motor
vehicles and pedestrians: The separate and combined effects of pavement markings and a sign prompt. Journal of Applied Behavior Analysis, 37, 445-456.
Lacey, J. H., Jones, R. K., & Smith, R. G. (1999). An evaluation of Checkpoint Tennessee:
Tennessee's statewide sobriety checkpoint program. (Report No. DOT HS 808 841). Washington, DC: National Highway Traffic Safety Administration. Available at: http://ntl.bts.gov/lib/25000/25900/25990/DOT-HS-808-841.pdf
Levy, D, Shea, D., & Asch, P. (1988). Traffic safety effects of sobriety checkpoints and other
local DWI programs in New Jersey. American Journal of Public Health, 79, 291-293. Levy, D., Asch, P., & Shea, D. (1990). An assessment of county programs to reduce driving
while intoxicated. Health Education Research, 5, 247-255. Malenfant, L., & Van Houten, R. (1989). Increasing the percentage of drivers yielding to
pedestrians in three Canadian cities with a multifaceted safety program. Health Education Research, 5, 275-279.
Malenfant, L., Van Houten, R., Hall, R. V., & Cahoon, G. (1985). The use of public posting,
prompting and police enforcement procedures to increase driver yielding and pedestrian
33
signalling at marked crosswalks. Journal of Police Science and Administration, 13, 295-302.
Malenfant, L., Wells, J. K., Van Houten, R., & Williams, A. F. (1996). The use of feedback signs
to increase observed daytime seat belt use in two cities in North Carolina. Accident Analysis & Prevention, 28, 771-777.
McKnight, S., McKean, J. W., & Huitema, B. E. (2000). A double bootstrap method to analyze linear models with autoregressive error terms. Psychological Methods, 5, 87- 101. Milano, M., McInturff, B., & Nichols, J. L. (2004) The effect of earned and paid media strategies
in high visibility enforcement campaigns. Journal of Safety Research, 35, 203-214. National Highway Traffic Safety Administration. (2012). Traffic Safety Facts, 2010 Data:
Pedestrians. (Report No. DOT HS 811 625). Washington, DC. Available at www-nrd.nhtsa.dot.gov/Pubs/811625.pdf
NHTSA. (2010). Countermeasures that work: a highway safety countermeasure guide for state
highway safety offices. (Report No. DOT HS 811 258). Washington, DC. Available at http://ntl.bts.gov/lib/32000/32300/32358/811258.pdf
Scherer, M., Friedmann, R., Rolider, A., & Van Houten, R. (1985). The effects of a saturation
enforcement campaign on speeding in Haifa, Israel. Journal of Police Science and Administration, 12, 425-431.
Van Houten, R., Ellis, R. & Marmolejo, E. (2008). Stutter-flash light-emitting-diode beacons to
increase yielding to pedestrians at crosswalks. Transportation Research Record, 2073, 69-78.
Van Houten, R. & Malenfant, J. E. L. (2004). Effects of a driver enforcement program on
yielding to pedestrians. Journal of Applied Behavior Analysis, 37, 351-363 Van Houten, R., McCusker, D., Huybers, S., Malenfant, J. E. L., & Rice-Smith, D. (2003).
Advance yield markings and fluorescent yellow-green RA 4 signs at crosswalks with uncontrolled approaches. Transportation Research Record 1818, 119-124.
Van Houten, R., Malenfant, J. E. L., & McCusker, D. (2001). Advance yield markings -
Reducing motor vehicle-pedestrian conflicts at multilane crosswalks with uncontrolled approach. Transportation Research Record, 1773, 69-74.
Van Houten, R. & Nau, P. A. (1983). Feedback interventions and driving speed: A parametric
and comparative analysis. Journal of Applied Behavior Analysis, 16, 253-281. Van Houten, R., Malenfant, L., & Rolider, A. (1985). Increasing driver yielding and pedestrian
signalling with prompting, feedback, and enforcement. Journal of Applied Behavior Analysis, 18, 103-110.
34
Van Houten, R., Rolider, A., Nau, P. A., Friedmann, R., Becker, M., Chalodovsky, I., & Scherer, M. (1985). Large-scale reductions in speeding and accidents in Canada and Israel: A behavioral ecological perspective. Journal of Applied Behavior Analysis, 18, 87-93.
Waller, P. F., Li, L. K., Stewart, J. R., & Ma, J. M. (1983, December). Evaluation of the effect of
perception of risk messages on observed safety belt usage. Washington, DC: National Highway Traffic Safety Administration. Available at www.hsrc.unc.edu/research_library/PDFs/Evaluation83.ocr.pdf
Wells, J. K., Malenfant, J.E.L., Williams, A. F., & Van Houten, R. (2000). Use of community
program to increase seat belt use among shopping center patrons in Charlotte, North Carolina. Journal of Safety Research, 31, 93-99.
Williams, A. F., Lund, A. K., Preusser, D. F., & Blomberg, R. D. (1987). Results of a seat belt
use law enforcement and publicity campaign in Elmira, New York. Accident Analysis & Prevention, 19, 243-249
35
APPENDIX A: FLYERS USED IN ENFORCEMENT OPERATIONS
Appendix A
Diagram showing the placement of no pass lines and advance yield markings. The advance yield markings look like a series of isosceles triangles 30 ft. in advance of the crosswalk.
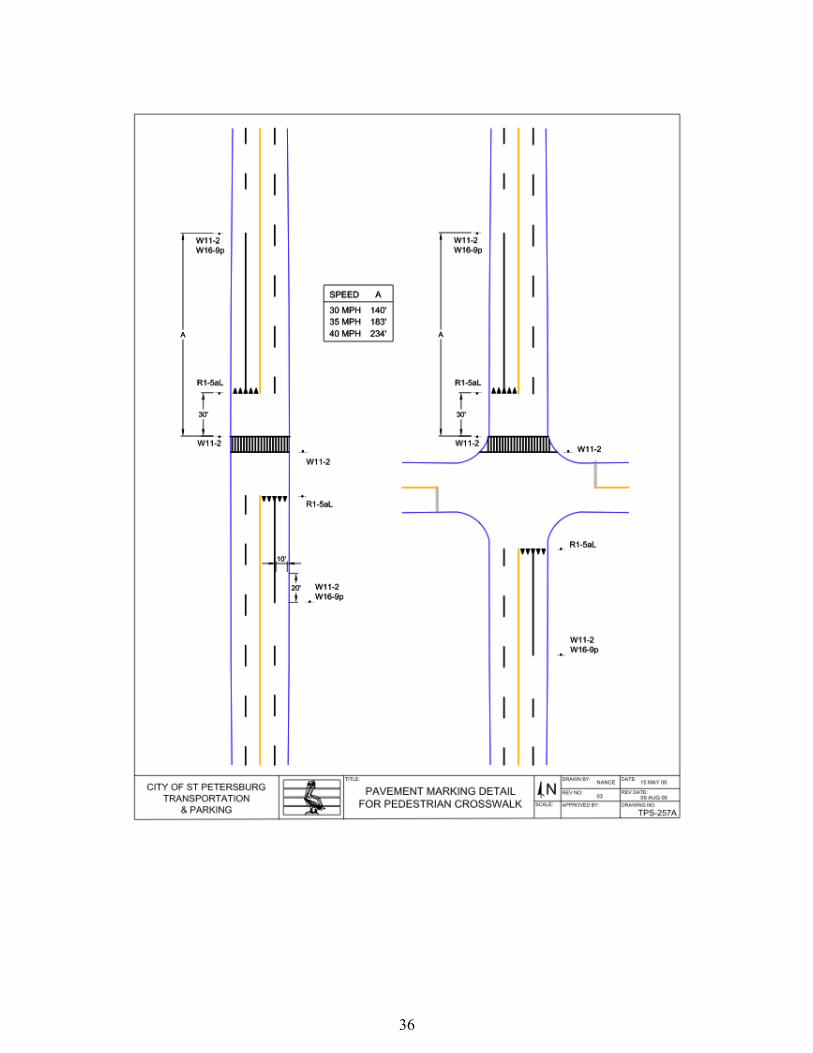
36

37
Appendix B

38
A sample data sheet used to collect data on motorists’ yielding behavior.
Location:Date:
__________________________________________BL ________________________ Start time _______
Enforcement _____ Follow-up _____Stop time ________
Peds Xing Cars Not Yielding
Cars Yielding
Yield Num Distance
Evasive Action Ped
Trapped in Center
Driver Passed
Stopped Veh
Veh Brake Hard<30ft > 30 ft Ped Veh
123456789
1011121314151617181920
Num Peds Xing Cars Not Yielding
Cars Yielding
Yield Distance
Evasive Action Ped
Trapped in Center
Driver Passed
Stopped Veh
Veh Brake Hard<30ft > 30 ft Ped Veh
123456789
101112131415
39
APPENDIX B: MATERIALS USED IN THE TAXI PROGRAM
Appendix C
Gainesville Public Awareness Survey

40
Are you a licensed driver? Yes No (or learner’s permit) do not interview 1. How long have you had a driver’s license? _______________Years 2. What type of vehicle do you drive most often?
Passenger car Pick-up truck SUV Van Fleet vehicle, e.g., taxi, mail truck Other
3. How often do you wear a seat belt when you drive or ride in a car, van, SUV, or pick-up?
Always Nearly always Sometimes Seldom Never
4. Do you know what Florida law requires drivers to do when they approach a pedestrian in a
crosswalk? Yes No Unsure If yes, What does Florida law require? ____________________________________________________________________________________ Is there a difference in what drivers must do if the pedestrian is crossing at an intersection but
there is no painted crosswalk? Yes No Unsure 5. Do you know what Florida law requires pedestrians to do when they cross the road in a
crosswalk? Yes No Unsure If yes, What does Florida law require? ___________________________________________________________________________________ 6. How strictly do you think the police enforce the Florida law requiring drivers to yield to
pedestrians in a crosswalk? Very strictly Somewhat strictly Not very strictly Rarely Not at all

41
7. Have you recently seen any special police enforcement at crosswalks near here?
Yes No Unsure If yes, Where was it? ___________________________________________________________________________
8. In the past month, have you seen or heard any publicity about drivers yielding to pedestrians in
crosswalks? Yes No Unsure If yes, Where did you see or hear the publicity? (read categories and check all that apply) newspaper radio TV banner brochure/flyer newsletter poster other__________________________________ What did it say? (Record exactly what is said) _________________________________________________________________________________ 9. Have you recently seen a road sign about the percent of Gainesville drivers yielding to
pedestrians? Yes No
If yes, Where was it? ___________________________________________________________________
10. Do you live in Gainesville?
Yes No If no, About how many miles from Gainesville do you live? _________________ Miles
11. How old are you? ________ Estimated age ________ 12. Sex (observe don’t ask) Male Female
13. Comments (interviewee or interviewer)
42
PPENDIX C: MATERIAL DISTRIBUTED TO ALCOHOL SELLERS AND SERVERS
Appendix D
Standard Crossing Protocol

43
Standard Crossing Protocol The safety crossing protocol involves the following procedure: Step 1: The officer places one foot into the crosswalk when an approaching vehicle is just
beyond the cone placement distance (this is the measured distance for the vehicle speed, which ensures a safe stopping distance for vehicles traveling at the posted speed).
Step 2: If the vehicle makes no attempt to stop, the officer does not proceed to cross and scores
the vehicle as not yielding. If the vehicle is traveling close to the curb face, the officer also will remove his or her foot from the crosswalk as the vehicle approaches. Subsequent vehicles are also scored as not yielding.
Step 3: If the vehicle clearly begins to yield and the next lane is free, the officer begins crossing. Step 4: The officer will always stop at the lane line, search and make sure the next lane is clear.
This step is essential to prevent the possibility of the officer being involved in a Multiple Threat crash.
Step 5: Score the vehicle that slowed or stopped as yielding. If a vehicle in the second lane
makes no attempt to slow and stop, let it pass and score it as not yielding. Step 6: If the vehicle yields, proceed to the centerline or median. Step 7: If a vehicle that is inside the cone yields, score the driver as yielding, but if they do not
yield, do not score them at all. If a large gap appears in the line of traffic, the officer can finish crossing.
Step 8: At four-lane crosswalks, the officer follows the same procedure for the second half of the
crossing. All vehicles that are beyond the cone when the officer is halfway across the second travel lanes that do not slow or stop to allow the officer to cross should be scored as not yielding.
44
ENDIX D: POSTER DISTRIBUTED TO BARS, FAST FOOD RESTAURANTS AND CONVENIENCE STORES CONVENIENCE STORES
Appendix E
Enforcement Flyer (front and back)
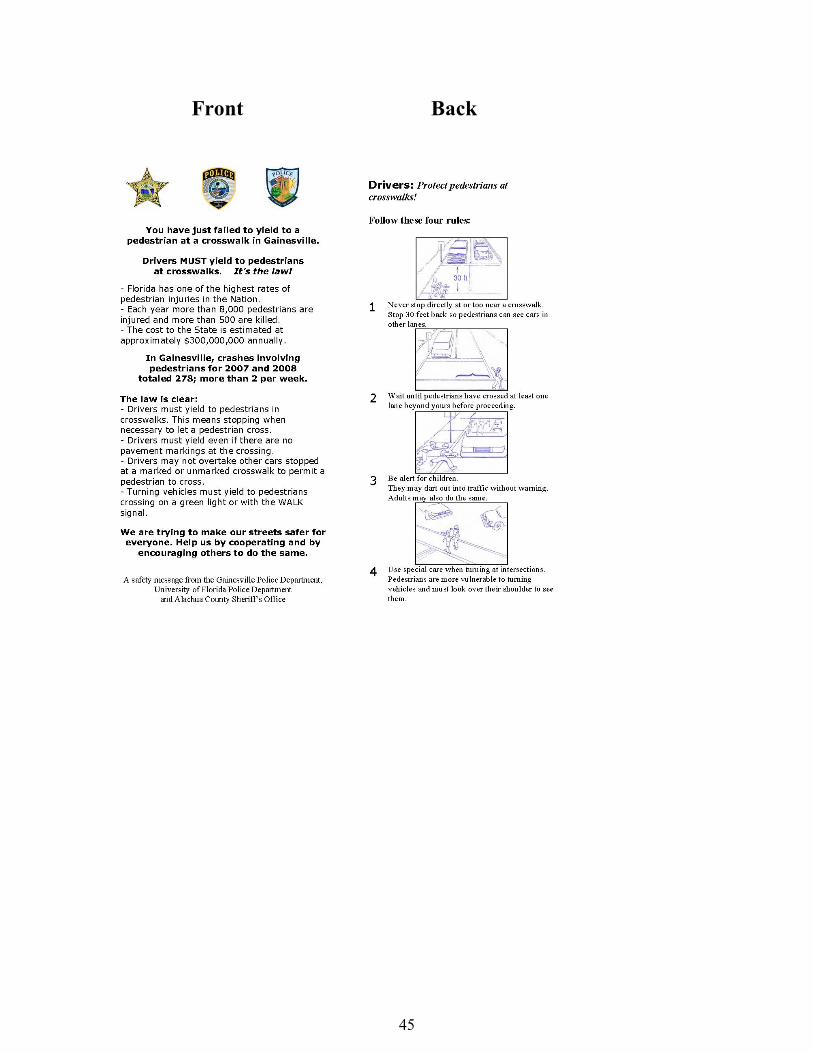
45
Front Back
ENDIX E: ENGINEERING INSTALLATIONS AT HIGH CRASH LOCATIONS IN WRIGLEYVILLE (ZONE
2)
46
Appendix F
Parent Flyer (front and back)
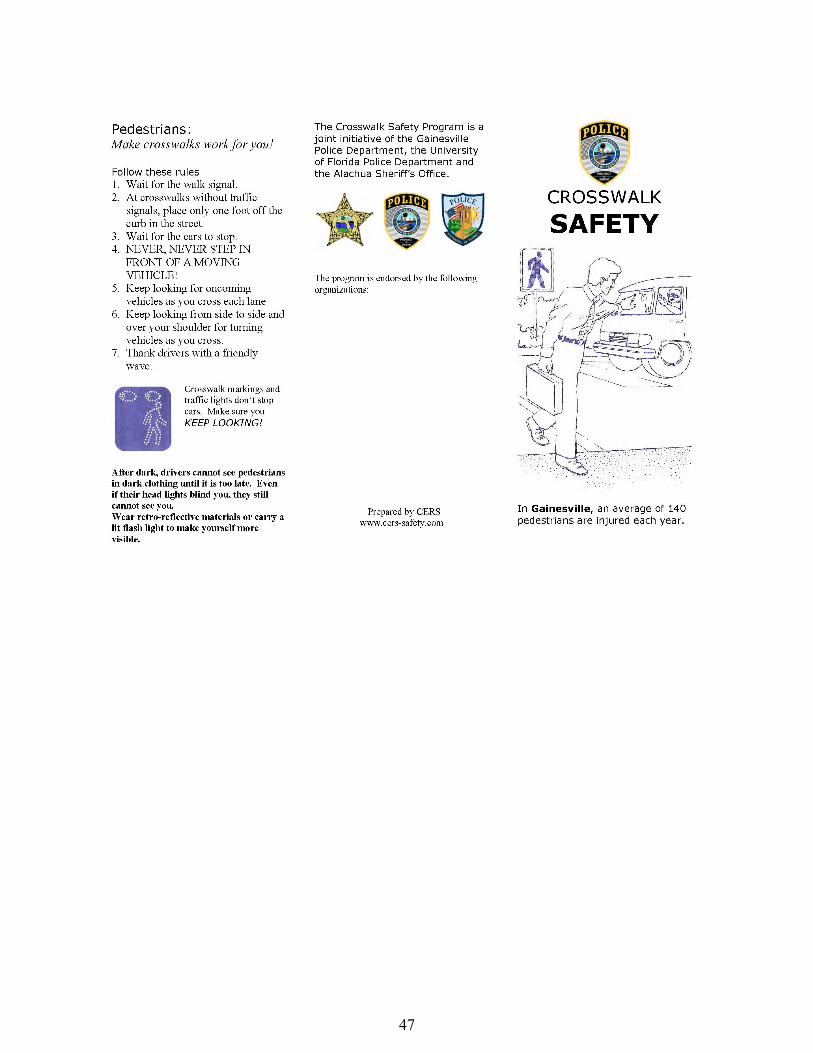
47
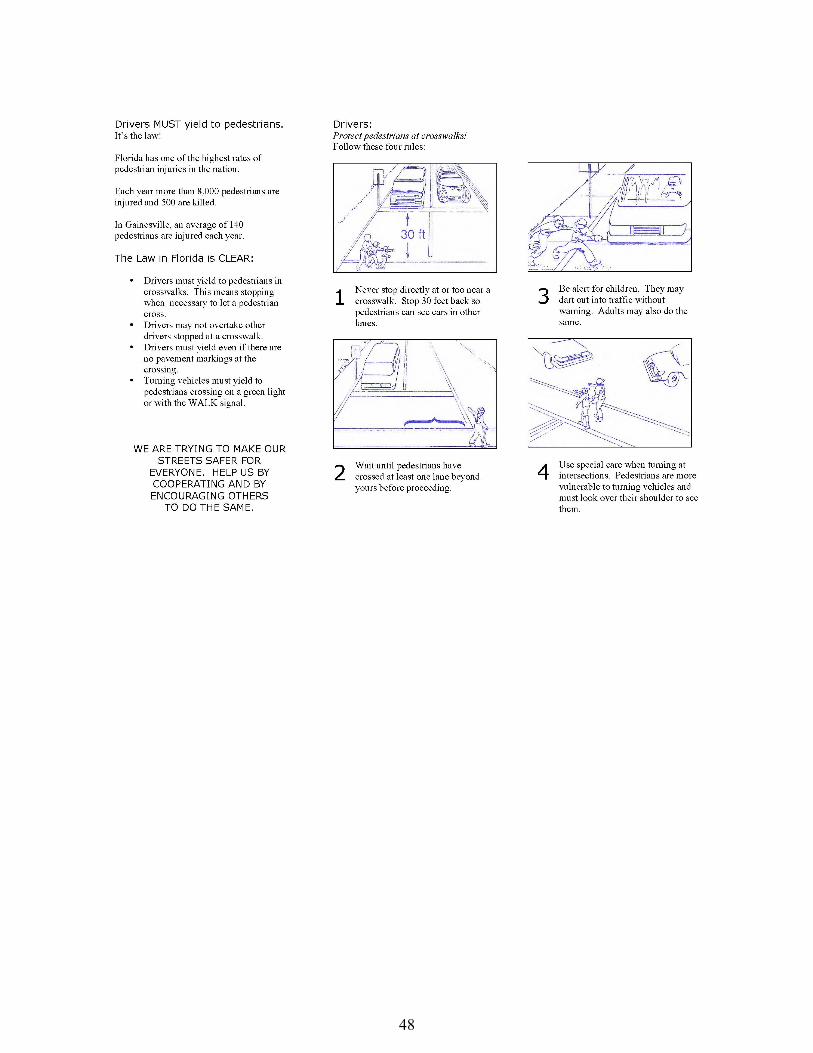
48
49
Appendix G
Parent Enforcement Notice
50
Notice
We are sending you this notice to alert you that the Gainesville Police Department, Alachua County Sheriff’s Department, and University of Florida Police Department will begin an intensive program of stopping and ticketing drivers that do not yield to pedestrians in crosswalks starting this coming week. We need your help to make Gainesville safer for pedestrians of all ages.
You can help by:
1. Looking for pedestrians in crosswalks 2. Yielding by stopping or slowing for the pedestrian as the law requires 3. Encouraging others to do the same
Be a Good Model. Yield, avoid a ticket, and help keep pedestrians safe
A safety message from the Gainesville Police Department
51
Appendix H
Individual Site Graphs for Enforcement Sites
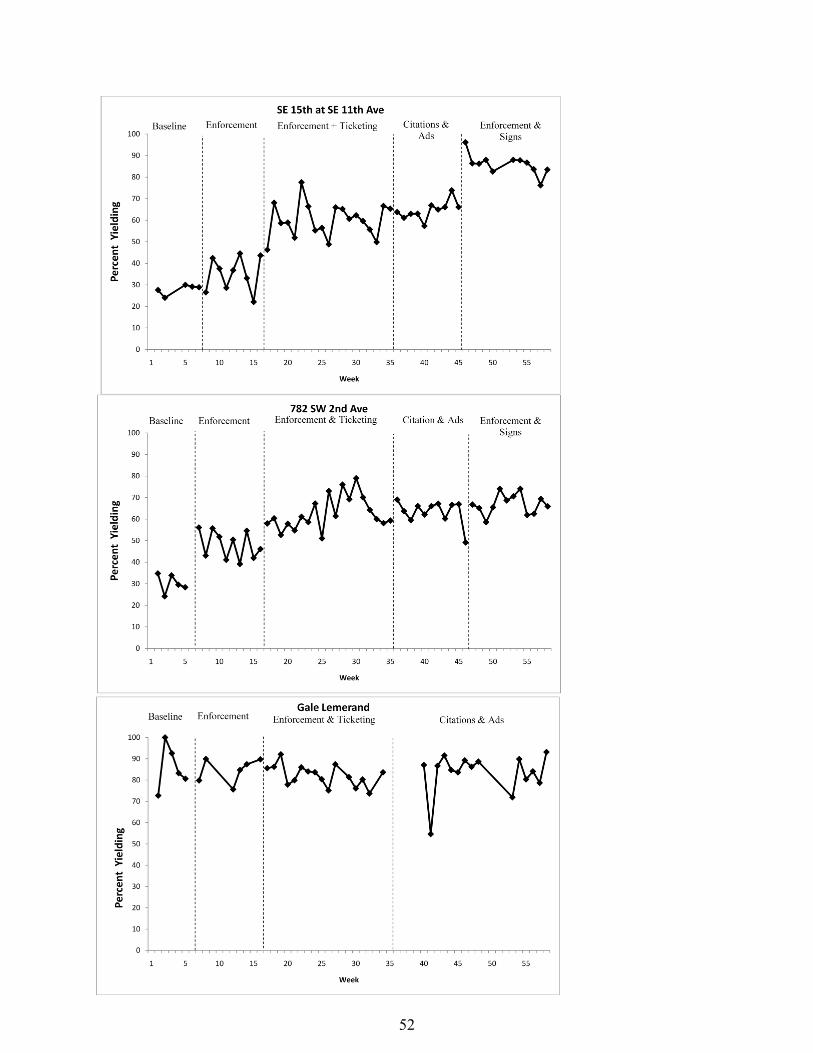
52
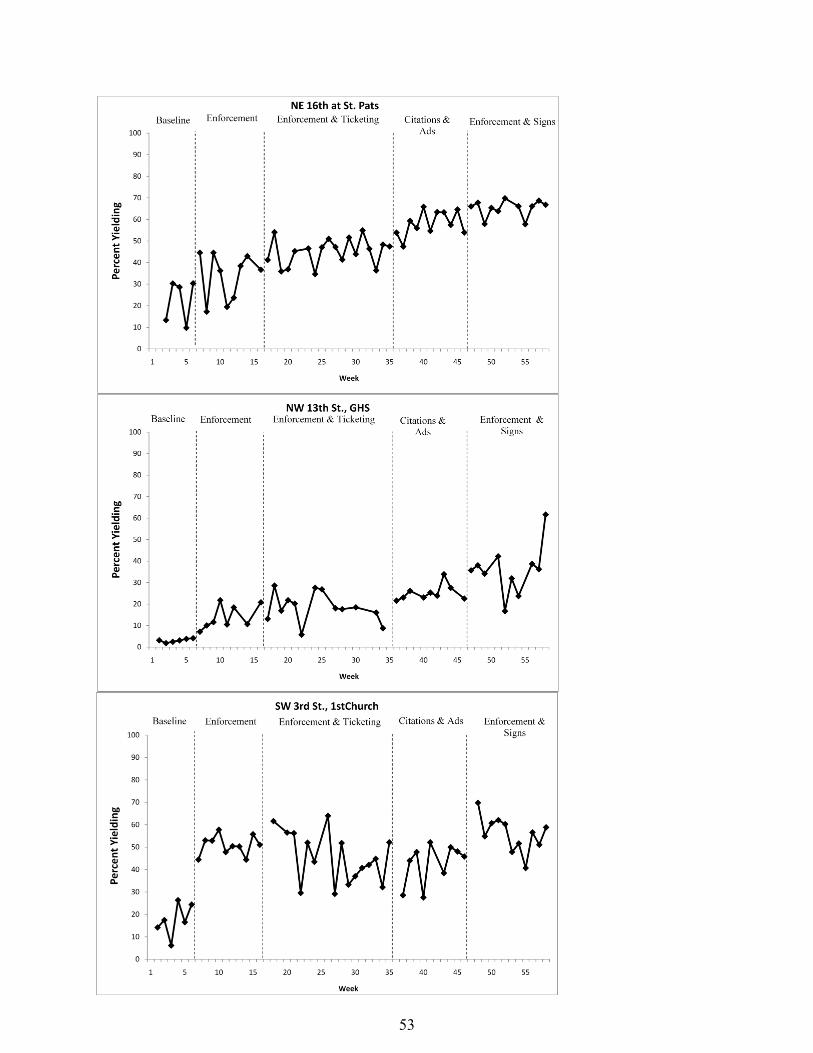
53

54
Appendix I
Individual Site Graphs for Generalization Sites
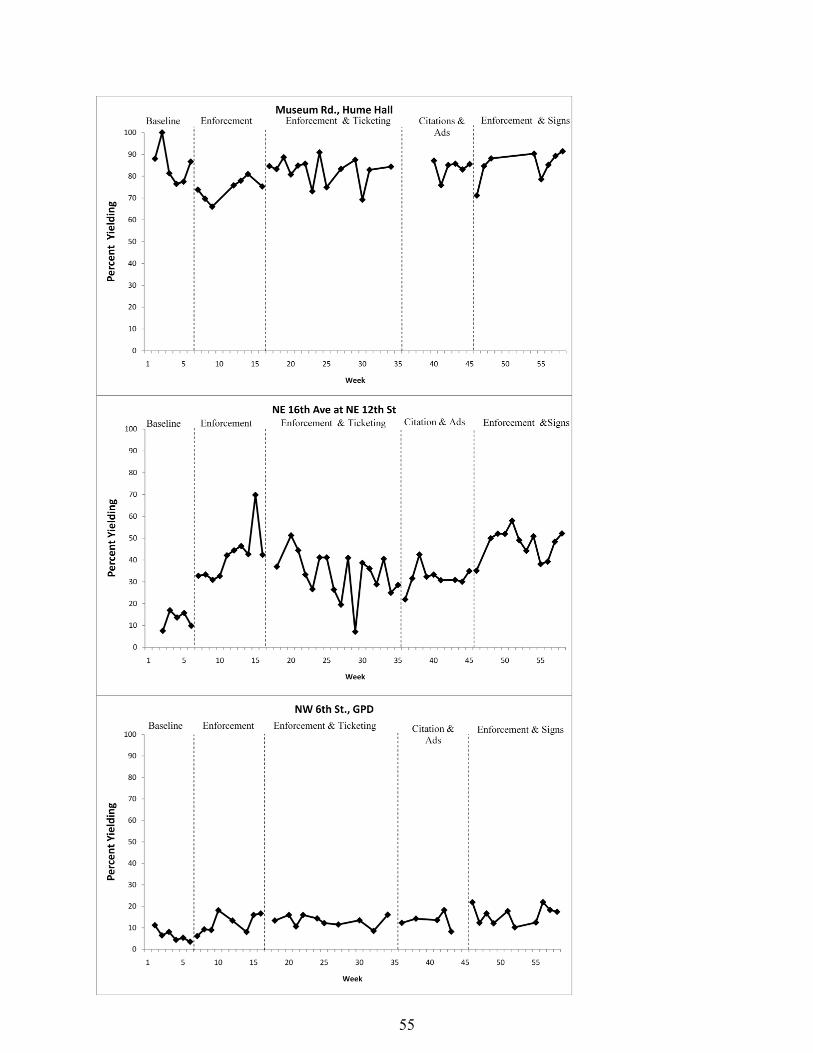
55
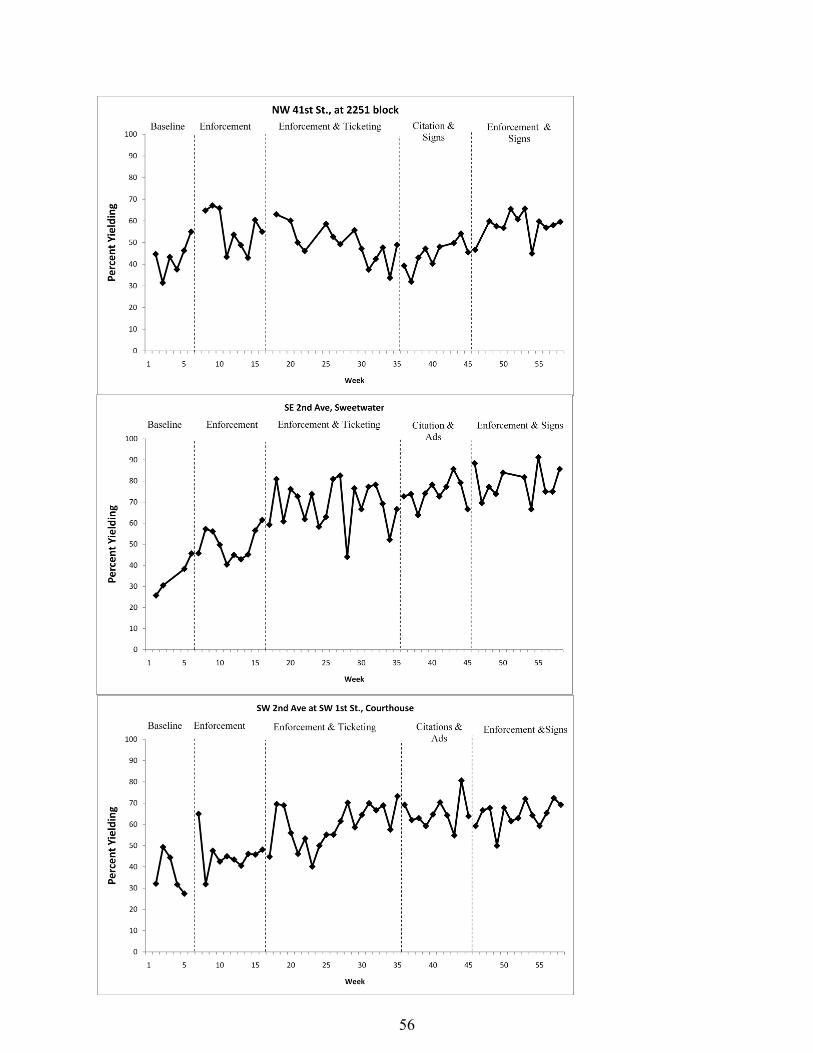
56
57
Appendix J
Scripts for the Three Paid Radio Ads
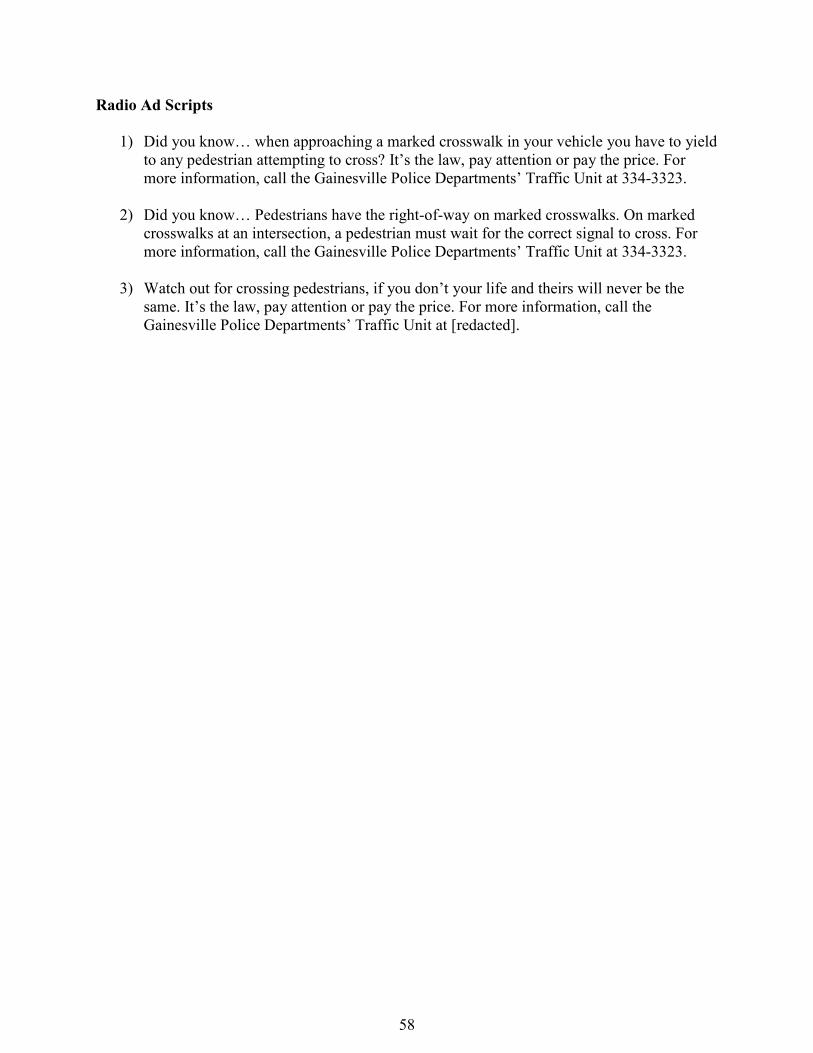
58
Radio Ad Scripts
1) Did you know… when approaching a marked crosswalk in your vehicle you have to yield to any pedestrian attempting to cross? It’s the law, pay attention or pay the price. For more information, call the Gainesville Police Departments’ Traffic Unit at 334-3323.
2) Did you know… Pedestrians have the right-of-way on marked crosswalks. On marked crosswalks at an intersection, a pedestrian must wait for the correct signal to cross. For more information, call the Gainesville Police Departments’ Traffic Unit at 334-3323.
3) Watch out for crossing pedestrians, if you don’t your life and theirs will never be the same. It’s the law, pay attention or pay the price. For more information, call the Gainesville Police Departments’ Traffic Unit at [redacted].

59
Appendix K
Data Collection Procedures
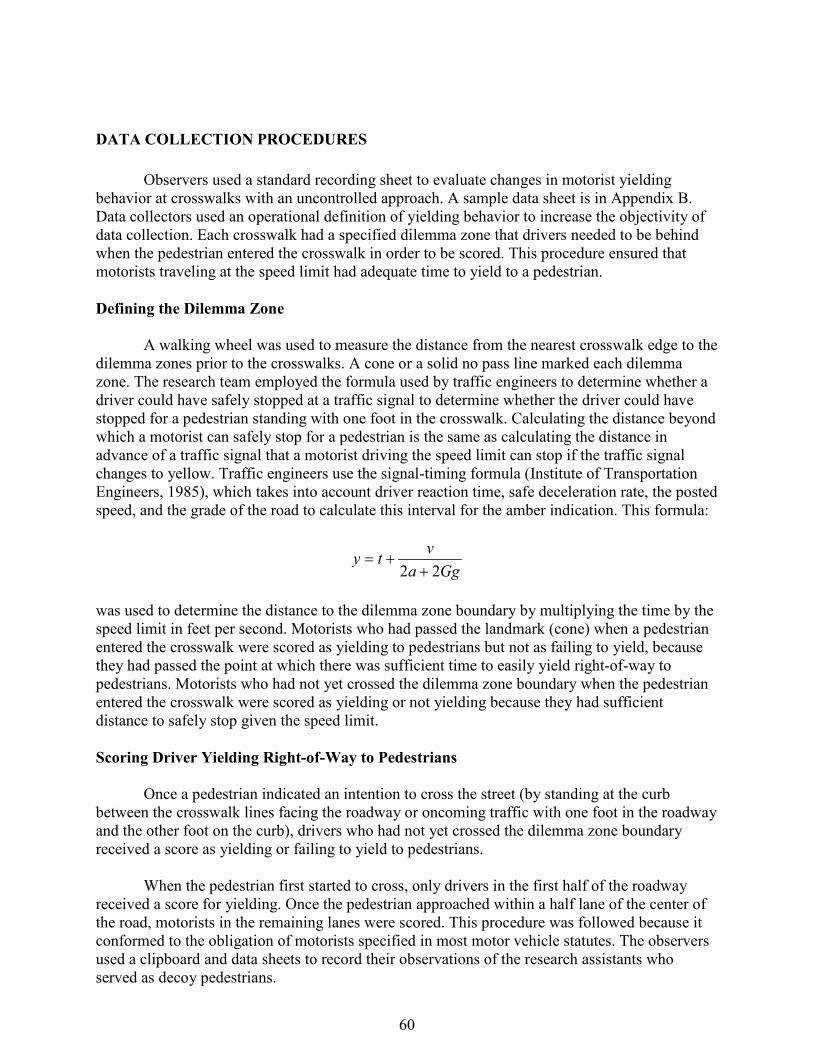
60
DATA COLLECTION PROCEDURES
Observers used a standard recording sheet to evaluate changes in motorist yielding behavior at crosswalks with an uncontrolled approach. A sample data sheet is in Appendix B. Data collectors used an operational definition of yielding behavior to increase the objectivity of data collection. Each crosswalk had a specified dilemma zone that drivers needed to be behind when the pedestrian entered the crosswalk in order to be scored. This procedure ensured that motorists traveling at the speed limit had adequate time to yield to a pedestrian. Defining the Dilemma Zone
A walking wheel was used to measure the distance from the nearest crosswalk edge to the dilemma zones prior to the crosswalks. A cone or a solid no pass line marked each dilemma zone. The research team employed the formula used by traffic engineers to determine whether a driver could have safely stopped at a traffic signal to determine whether the driver could have stopped for a pedestrian standing with one foot in the crosswalk. Calculating the distance beyond which a motorist can safely stop for a pedestrian is the same as calculating the distance in advance of a traffic signal that a motorist driving the speed limit can stop if the traffic signal changes to yellow. Traffic engineers use the signal-timing formula (Institute of Transportation Engineers, 1985), which takes into account driver reaction time, safe deceleration rate, the posted speed, and the grade of the road to calculate this interval for the amber indication. This formula:
Ggavty22 +
+=
was used to determine the distance to the dilemma zone boundary by multiplying the time by the speed limit in feet per second. Motorists who had passed the landmark (cone) when a pedestrian entered the crosswalk were scored as yielding to pedestrians but not as failing to yield, because they had passed the point at which there was sufficient time to easily yield right-of-way to pedestrians. Motorists who had not yet crossed the dilemma zone boundary when the pedestrian entered the crosswalk were scored as yielding or not yielding because they had sufficient distance to safely stop given the speed limit. Scoring Driver Yielding Right-of-Way to Pedestrians
Once a pedestrian indicated an intention to cross the street (by standing at the curb between the crosswalk lines facing the roadway or oncoming traffic with one foot in the roadway and the other foot on the curb), drivers who had not yet crossed the dilemma zone boundary received a score as yielding or failing to yield to pedestrians.
When the pedestrian first started to cross, only drivers in the first half of the roadway
received a score for yielding. Once the pedestrian approached within a half lane of the center of the road, motorists in the remaining lanes were scored. This procedure was followed because it conformed to the obligation of motorists specified in most motor vehicle statutes. The observers used a clipboard and data sheets to record their observations of the research assistants who served as decoy pedestrians.
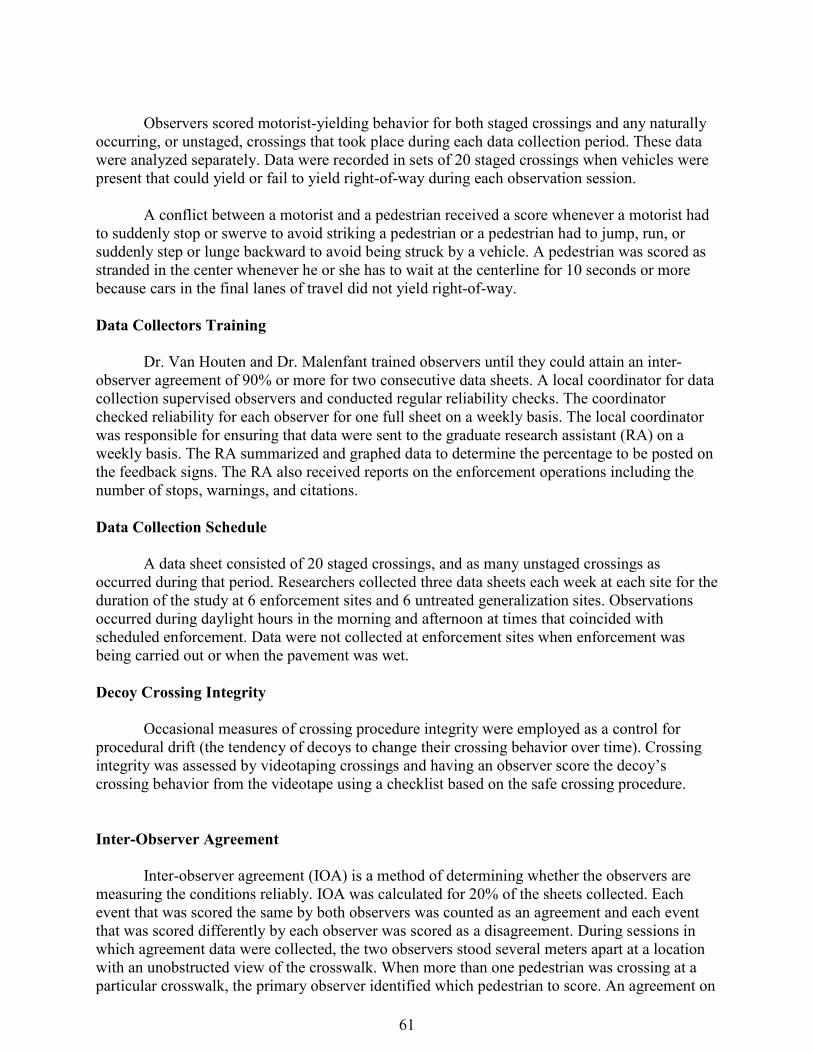
61
Observers scored motorist-yielding behavior for both staged crossings and any naturally
occurring, or unstaged, crossings that took place during each data collection period. These data were analyzed separately. Data were recorded in sets of 20 staged crossings when vehicles were present that could yield or fail to yield right-of-way during each observation session.
A conflict between a motorist and a pedestrian received a score whenever a motorist had to suddenly stop or swerve to avoid striking a pedestrian or a pedestrian had to jump, run, or suddenly step or lunge backward to avoid being struck by a vehicle. A pedestrian was scored as stranded in the center whenever he or she has to wait at the centerline for 10 seconds or more because cars in the final lanes of travel did not yield right-of-way. Data Collectors Training
Dr. Van Houten and Dr. Malenfant trained observers until they could attain an inter-observer agreement of 90% or more for two consecutive data sheets. A local coordinator for data collection supervised observers and conducted regular reliability checks. The coordinator checked reliability for each observer for one full sheet on a weekly basis. The local coordinator was responsible for ensuring that data were sent to the graduate research assistant (RA) on a weekly basis. The RA summarized and graphed data to determine the percentage to be posted on the feedback signs. The RA also received reports on the enforcement operations including the number of stops, warnings, and citations. Data Collection Schedule
A data sheet consisted of 20 staged crossings, and as many unstaged crossings as occurred during that period. Researchers collected three data sheets each week at each site for the duration of the study at 6 enforcement sites and 6 untreated generalization sites. Observations occurred during daylight hours in the morning and afternoon at times that coincided with scheduled enforcement. Data were not collected at enforcement sites when enforcement was being carried out or when the pavement was wet. Decoy Crossing Integrity
Occasional measures of crossing procedure integrity were employed as a control for procedural drift (the tendency of decoys to change their crossing behavior over time). Crossing integrity was assessed by videotaping crossings and having an observer score the decoy’s crossing behavior from the videotape using a checklist based on the safe crossing procedure.
Inter-Observer Agreement
Inter-observer agreement (IOA) is a method of determining whether the observers are measuring the conditions reliably. IOA was calculated for 20% of the sheets collected. Each event that was scored the same by both observers was counted as an agreement and each event that was scored differently by each observer was scored as a disagreement. During sessions in which agreement data were collected, the two observers stood several meters apart at a location with an unobstructed view of the crosswalk. When more than one pedestrian was crossing at a particular crosswalk, the primary observer identified which pedestrian to score. An agreement on

62
yielding was scored only if both observers scored all vehicles the same for each pedestrian. An agreement on the occurrence of conflicts was scored if both observers scored an event as a conflict, and an agreement for a pedestrian being trapped at the centerline is scored if both observers scored the pedestrian as trapped.
The percentage of IOA for yielding behavior for staged crossings averaged 96.8% with a
range of 70% to 100%. The percentage of IOA for unstaged, or natural, crossings averaged 84% with a range of 50% to 100%. Because instances of conflicts and trapped pedestrians were relatively rare, they were not reliably captured by observers with IOA for conflicts and trapped averaged between 48% and 56%. Because IOA for these measures was low, they were not included in the data analysis. Independent Variable Integrity
Specific observation procedures were used to assure the independent variables were introduced correctly. Verification of engineering components of the program was determined by taking photos of engineering installations. Cataloging of each newspaper story or DVR of television news coverage was used to verify the level of media coverage. Verification of enforcement was obtained from records of citations and warnings issued. Crash Data Pedestrian crashes in Gainesville were extracted from police reports for 2009 and 2010. It was not likely that a change in crash data would be detected because of the size of Gainesville and the relatively short duration of this intervention.


DOT HS 811 786August 2013
9702-080113-v3