High value information in engineering organizations · High value information in engineering...
29
•
Transcript of High value information in engineering organizations · High value information in engineering...

Loughborough UniversityInstitutional Repository
High value information inengineering organizations
This item was submitted to Loughborough University's Institutional Repositoryby the/an author.
Citation: ZHAO, Y. ... et al., 2007. High value information in engineer-ing organizations. KIM Project Conference 2007, 28-29 March, LoughboroughUniversity, Loughborough, UK
Additional Information:
• This is a conference paper presented at the KIM Project Con-ference 2007. More details of the KIM project can be foundat: http://www-edc.eng.cam.ac.uk/kim/ This paper was also pub-lished in the International Journal of Information Management, 28(4),pp. 246-258 [ c© Elsevier] and the definitive version is available at:http://dx.doi.org/10.1016/j.ijinfomgt.2007.09.007
Metadata Record: https://dspace.lboro.ac.uk/2134/5054
Version: Accepted for publication
Please cite the published version.
This item was submitted to Loughborough’s Institutional Repository (https://dspace.lboro.ac.uk/) by the author and is made available under the
following Creative Commons Licence conditions.
For the full text of this licence, please go to: http://creativecommons.org/licenses/by-nc-nd/2.5/
1
High Value Information in Engineering Organizations Yuyang Zhao1*, L. C. M Tang2, M. J. Darlington1, S. A. Austin2, and S. J. Culley1
1Department of Mechanical Engineering, University of Bath, Bath, BA2 7AY, United Kingdom. 2Department of Civil and Building Engineering, Loughborough University, Loughborough, Leicestershire, LE11 3TU,
United Kingdom
Published in International Journal of Information Management, 28(4), pp. 246-258. *Corresponding Author: Dr Yuyang Zhao Innovative Manufacturing Research Centre Department of Mechanical Engineering University of Bath Bath, BA2 7AY United Kingdom phone: +44 (0)1225 385366 fax: +44 (0)1225 386928 email: [email protected]
Biography:
Yuyang Zhao is Research Officer within the IdMRC, University of Bath. His education background includes B.Eng and M.Sc in chemical machinery and equipment, and a Ph.D in chemical engineering in China. He has research experience in the data model development for STEP (ISO10303) and ISO15926 for process industry during his PhD studentship. He started his research career in 2001 in the University of Manchester, UK and focused on the engineering information retrieval, information flow analysis and modeling, knowledge representation, document control, and specially the validation process for industry. He is now working on developing measures of information value and approaches to the support of decision-making on information retention.
Llewellyn CM Tang is Research Associate in the Department of Civil and Engineering at Loughborough University working for the KIM project-Immortal Information and Through-life Knowledge Management with special interest to the information evaluation in construction and aerospace sectors. He has researched and lectured in the field of decision science since he obtained a first-class honors degree in Construction Engineering and Management and a PhD in Knowledge and Innovation Management in Hong Kong. As a scholar, he has obtained several scholarships and fellowships from a number of prestigious institutions. His research interests are artificial intelligence, cash flow forecasting, computational decision support, operational research, information processing and knowledge management.
Mansur Darlington is a Research Officer in the Design Information & Knowledge Group of the Engineering IdMRC at the University of Bath. He joined the University of Bath from industry in 1997, and has a degree in Cognitive Science from the University of Exeter and a PhD in Engineering Cognition from the University of Bath. For the last ten years he has been involved in research associated with the capture and codification of engineers’ design knowledge and the development of methods for supporting engineers’ information needs, first in the University of Bath’s Engineering Design Centre latterly in the Innovative Design & Manufacturing Research Centre. He is currently research task co-ordinator for Work Package 2 ‘Learning from Use’ in the KIM Grand Challenge research project.
Simon Austin is Professor of Structural Engineering in the Department of Civil and Building Engineering at Loughborough University. He is also the founder director of Adept Management, a specialist management consultancy. Prior to this he worked for Scott Wilson Kirkpatrick & Partners and Tarmac Construction. He has undertaken industry-focused research for over 25 years into design processes, modeling, integrated working and management techniques, information management, process re-engineering, value management and structural materials and their design. The later includes the building design process, behavior and design of structural elements and innovative sprayed and cast concretes and mortars.
Steve Culley is Professor in Engineering Design and Head of Design in the Department of Mechanical Engineering at Bath University. He has researched in the engineering design field for many years. In particular, this has included the provision of information and support to engineering designers. Steve pioneered work in the introduction and use of the electronic catalogue for standard engineering components and has extended this work to deal with systems and assemblies.
2
High Value Information in Engineering Organizations Abstract The management of information in engineering organizations is facing a particular challenge in
the ever-increasing volume of information. It has been recognized that an effective methodology is
required to evaluate information in order to avoid information overload and to retain the right
information for reuse. By using, as a starting point, a number of the current tools and techniques
which attempt to obtain ‘the value’ of information, it is proposed that an assessment or filter
mechanism for information is needed to be developed. This paper addresses this issue firstly by
briefly reviewing the information overload problem, the definition of value, and related research
work on the value of information in various areas. Then a “characteristic” based framework of
information evaluation is introduced using the key characteristics identified from related work as an
example. A Bayesian Network diagram method is introduced to the framework to build the linkage
between the characteristics and information value in order to quantitatively calculate the quality and
value of information. The training and verification process for the model is then described using 60
real engineering documents as a sample. The model gives a reasonable accurate result and the
differences between the model calculation and training judgments are summarized as the potential
causes are discussed. Finally several further the issues including the challenge of the framework and
the implementations of this evaluation assessment method are raised.
Keywords: Value, Information, Information Evaluation, Bayesian Network

3
1. Introduction There are a number of challenges associated with managing information in engineering
organizations, and in particular the ever-increasing volumes of information, its continuously
changing nature and the wide variety of uses of even the same information. It has been recognized
that an effective methodology is required to be established to evaluate information in order to avoid
information overload and to retain the right information for reuse. Little seems available, however,
to help organisations address these challenges. The authors propose an assessment or filter
mechanism for information can be developed, utilising a combination of existing tools and
techniques which attempt to evaluate ‘the value’ of information.
Value is a key to a successful business, yet, like information and knowledge, it can be an elusive
concept. Tools and methodologies exist for valuing intangible assets in engineering, project
management, financial, accounting and many other fields, but they do not address fully the issues
associated with valuing information. However the existing works in a variety of fields, such as
supply chain management, network risk analysis, decision making support in management, financial
and accounting, and in the library sector, can be referred to the efforts of putting value on
information in some degree. The approaches have limitations when being used in the context of
engineering design while there is some potential for supporting information activities. In addition, it
is seen that the characteristics which make information a high quality asset are also one key to
support the evaluation process.
As the quantity of available information increases, its quality becomes an ever more important
factor for the effectiveness of organizations and individuals. Information quality has been a long-
standing concern within many approaches in a variety of domains; what these approaches have in
common is their primary concern with providing the right information, in the right format and
quantity, at the right time, to the right person, and at reasonable cost. These requirements relate to a
variety of information characteristics. There is a clear connection between quality and value of
information but this is not necessarily in direct proportion as will be discussed later. If the
information characteristic criteria can be regarded as individual nodes forming an evaluation
network, a mathematical method could be developed to carry out the calculations through the
network, to support the evaluation assessment and reasoning diagnosis process. A quantitative
evaluation of information can be obtained through this calculation method. Moreover decision
support based on assessment and reasoning diagnosis could also be developed.
The paper is organized as follow: in Section 2, a review of information overload, value and value of
information is introduced; then in Section 3, an information evaluation approach is presented;
Section 4 discusses a preliminary decision support model based on information evaluation and the
4
potential benefits and resources; finally Section 5 concludes by outlining the requirements and
challenges when implementing such an approach in the context of engineering design.
2. Information value The information overload problem is significant and is exacerbated when through-life activities –
which generate large amounts of information and knowledge – are considered. This information
overload problem has been a topic of discussion for approximate 20-30 years and various solutions
have been proposed such as concurrency management, new push technology, intelligent agents, and
so on (Edmunds & Morris, 2000). Putting a value on information to help to judge what to retain and
what to discard is an obvious potential solution and previous work will be discussed in later
sections.
2.1. Information overload
Modern industries are becoming more dynamic in nature due to the diverse and complex nature of
work tasks, trading relationships, environments, as well as the temporary and transitory nature of
workplaces and workforces. Information can be viewed as an asset of a corporate body, whilst at an
operational level appropriate and timely information is very important to the success of a project or
a design. If, as is widely argued, information and knowledge are commodities (Hicks & Culley,
2002) then it is truism for both the individual and the corporate body that they can only afford to
acquire and maintain so much. This is not solely for financial reasons, but because of the limits of
storage capacity and restricted processing capabilities. However, until recently, the approach of
many organisations has been to gather all information regardless of the cost, which leads to what
can be thought of as information waste and a cost burden. A recent survey (Inc. Staff, 2003)
revealed that 80 percent of information filed has never been used. Furthermore, it has been widely
reported that the performance of an individual or an organisation can be detrimentally affected by
too much information (Butcher, 1995; Eppler & Mengis, 2004).
The problem of information overload is increasing as new technological developments are fast
growing (Feather, 1998). Information burdens, including personal, organisational and customer
loading (Edmunds & Morris, 2000), can have a variety of side effects on people and the
organisation such as low productivity and stress leading to “information fatigue syndrome” (Lewis,
1996; Oppenheim, 1997). Many organisations are aware that these problems generate some
fundamental questions such as: how much information does an organisation need? Which pieces of
information does an organisation need? And when does the organisation need them? (Eppler &
Mengis, 2004). In particular, there can be a failure to learn from previous experience because the
information has not been captured or it is not readily retrievable in a meaningful context. The latter
problem may well be compounded by being lost amongst all the data.

5
Finding answers to these questions is important for any organisation operating in any business
sector. However, in the highly competitive global engineering markets the resolution of these issues
is particularly critical. This is because of the information-intensive nature of engineering and
construction processes, and in particular the design process, which relies upon and generates large
amounts of information during its execution (Thomson & Austin, 2003). Answering these questions
is made more complicated by the fact that there is a combination of creative processes, with team
activities, and also within and without of organisations undertaking large parts of the activity. In the
construction and engineering sector contexts, information can be easily captured but relevant
information that may be ready for reuse for the next project or next generation is not easy to be
identified along the information life cycle (Tang et al., 2006).
2.2. Value
Value is a widely used, but poorly defined term. In the abstract sense value encapsulates the core
beliefs, morals, and ideals of individuals and is reflected in their attitudes and behaviour in society.
Kohler said that “At the bottom of all human activities are values, the conviction that some things
‘ought to be’” (Kohler, 1966). Although valuation is a common process when people make a
judgment or assessment with regard to their beliefs and expectations, the concepts, definitions and
methodologies of valuation are very different in various fields.
From a philosophical point of view, Dent stated that value comprised “…three connected issues:
first, on what sort of property or characteristic ‘having value’ or ‘being of value’ is; second, on
whether having value is an objective or subjective matter, whether values repose in the object or is a
matter of how we feel towards it; third on trying to say what things have value” (Dent, 1995). When
assessing an object, people make judgments with regard to their beliefs and expectation such as the
‘users’ values, their goals, and the product the associated services, uses, and the situation being
encountered (Woodruff & Gardial, 1996). From this social point of view, value is a perception and
it is not measurable. However, despite its subjective nature, objective interpretations of value are
commonplace and are widely adopted in most fields and typically expressed as a price.
In the manufacturing sector, Miles suggested that the definition of value varies with the purpose,
viewpoint and intent of the person who defines it. He identified four forms of value: use, esteem,
cost and exchange value (Miles, 1972). Fowler (1990) too recognized that for a product, value is
how it fulfils a user’s need so that:
CostWorthValue = (1)
However he also recognized the difficulty of measuring the worth and suggested an alternative
expression with a more subjective view:

6
costsonfollowcostFirstuseinionsatisficatimpressioninitialUserValue
++
= (2)
From a management perspective, Dell'Isola reflected the objective view in the definition
(Dell’Isola, 1997):
CostQualityFunctionValue +
= (3)
Before that, Walters and Lancaster also introduced the notion of value taking various
interpretations, and more specifically in connection with customer satisfaction (Walters &
Lancaster, 1999). They argue that the traditional value chain begins with the company's core
competences, whereas evidence suggests that modern value chain analysis reverses this approach
and uses customers as its starting point.
Thomson et al (2003; 2006) argued that a common terminology is important when dealing with a
wide variety of stakeholders and a value adding toolbox was suggested when addressing customer
value expectations by means of problem solving (Lewis, 1996). They suggested that value is a
trade-off, in terms of:
)()(
giveyouwhatSacrificesgetyouwhatBenefitsValue = (4)
which is an output/input viewpoint in which each stakeholder has a unique perspective. In the
economic, financial, and accounting world, value is a fundamental topic connected with pricing or
costing systems. In these systems, the “what you get” part and the “what you sacrifice” part are both
always measured with price, cost, investment levels or some other financial measure. There are
many approaches, from a simple balance sheet to complicated professional analysis tools for
accounting and financial assessment to help value tangible or sometimes intangible objects.
2.3. Valuing Information
When information needs to be valued – for example in the calculation of either cost or benefits of
information – the commonly used evaluation methods are inadequate because of its tangible and
intangible characteristics. Past work on the subject mostly focuses on specific kinds of information
from particular backgrounds. The following have been chosen for study: supply chain management,
Value Of Information (VOI) for risk analysis, project management and business management
including financial, banking, IT, and librarianship (Zhao et al., 2007).
a) In the domain of supply chain management, work has been undertaken on valuing the
information shared throughout the supply chain using a number of mathematical models.
The information flow direction, the inventory information and production plan information
7
is a two-way communication between the downstream and upstream organisations in the
supply chain. The sales information and demand forecasting information are the flows from
downstream companies to their upstream partners. The value of information sharing lies in
the quick and efficient sharing at the place where the downstream and upstream meet with
each other (Ben-Haim, 2001; Dominguez & Lashkari, 2004; Ferrer & Ketzenberg, 2004;
Gavirneni & Kapuscinski, 1999).
b) In risk analysis or risk management in the engineering, financial, health, and environment
sectors, Value of Information (VOI) analysis provides useful insights. VOI analysis evaluates
the benefit of collecting additional information to reduce or eliminate uncertainty in a specific
decision-making context. As noted in one of the earliest VOI applications: “no theory that
involves just the probabilities of outcomes without considering their consequences could
possibly be adequate in describing the importance of uncertainty to a decision maker”. VOI
analysis makes explicit any potential losses from errors in decision making due to the
uncertainty and it also identifies the “best” information collection strategy, which leads to the
greatest net benefit to the decision maker (Yokota & Thompson, 2004).
An analysis of VOI applications reveals a tendency to focus on demonstrating the usefulness
of such an approach rather than to the influence on actual management decisions or
evaluations tools. Among these solutions, the simplest VOI application for uncertainty is the
decision tree. Little work has been done for complex continuous input but Yokota and
Thompson (2004) give a review of a possible solution of this and suggests that strategies
should be generated after the information has been gathered, when dealing with nonlinear
continuous information inputs. The combination of Bayesian decision theory and other
constraints that are relevant to information might be used to diagnose the overall system risk.
Mussi developed a methodology for building a theory-based VOI sequential decision support
system, and a design engine to build step-by-step knowledge-base and the related inference
(Mussi, 2004).
c) In the management domain, industries like construction, aerospace, automotive and
healthcare are context-dependent and involve proprietary information. Decision-makers may
find it difficult to value a piece of information especially if it has no intrinsic value (Broady-
Preston & Williams, 2004) and is time-dependent. Methods have been devised to assess
information value in relation to the profitability of a company, but are usually simple and
ignored the rationale of the decision-makers. Pickard & Dixon (2004) argued that the
rationale will be affected by cognitive, affective and social variables. However, these
approaches were not sufficiently comprehensive to cover the intangible dimensions of the

8
information. Overall this work showed the importance of information value but did not
divulge detail mechanisms to value individual information assets.
Knowledge derived from ‘valuable’ information, drives business and organisation success.
Thus information can be a key asset of a company and is often multi-dimensional with
sources such as the product, customer, market, human resource, management, supplier,
account, business process, and specialist knowledge (Oppenheim & Stenson, 2000).
However, it can be detrimental to the daily and even long-term operation of a company if
information is not properly managed or is unavailable. Information is organic (as it has a life
cycle of being reused, maintained and updated), mechanic (as it increases productivity and
competitiveness of a company) and dynamic (as it is time dependent). The value of
information also depends on the context. The use of information in turn depends on access,
tools and sequences (Cleveland, 1999).
d) The information evaluation research in the domain of IT has been mainly focused on search
and retrieval. Finding information seems no longer to be the major challenge of the state-of-
art search engines. Trying to convey relevant information rather than just data (where data is
regarded as information without context) seems to be a major concern nowadays. A simple
search engine scoring system for electronic documents, as the dominant form of project
information, may not be efficient enough for the large quantities of modern information.
Several attempts on this issue are more or less using value related solutions on both general
information and/or documents (Galzer, 1993; Lee, 2001; Weide & Bommel, 2006).
e) Other fields in which the value of information has been researched include librarianship.
Fenner (2002) gives a general summary about how to place value on information. Weissinger
(2005) gives a theoretical basis and analysed the materialist, idealist and critical metaphysical
theories about the evaluative nature of information.
The above methods represent the state of the art in activities associated with the “evaluation” of
information. They describe the key issues and some of the factors relevant to large engineering
projects. However none describe specific techniques that would be directly applicable to
engineering design information. It is clear that to undertake an information ‘valuing’ activity will
require some means of defining the information entities and an associated overall process. We
therefore propose the establishment of information characteristics, with associated metrics.
2.4. Information characteristics
Information characteristics can represent the nature of the information and assist the measurement
of information quality or value. Zhao et al. (2007) have introduced an approach to identify the key

9
information characteristics, in which a set of common evaluation criteria were derived from the
literature. Seven key characteristics were proposed, namely:
• Accessibility • Usability • Currency • Context • Accuracy • Availability • Relevance
Accessibility was the highest ranking information characteristic because information transactions
and sharing play a big role in the literature. Accessing the right information at the right time is vital
in an information transaction process, but not, we would argue, in research that treats information as
an object with a value tag. For this reason the Accessibility criteria was omitted.
Other characteristics, not prevalent in the literature, may be important and could emerge from on
going industry-based investigations of the information evaluation process. Nevertheless, the method
of identifying the information characteristics and using them as the basis of the evaluation process
has a sound basis.
3. An Information evaluation approach
3.1. The framework
In the last section, an instance of key information characteristics identified from the literature
reviews has been introduced. But there are two more issues that need to be considered and two
hypothesises are proposed before using them to build an overarching information evaluation
process.
• Information Quality does not equal Value. Information value has both implicit
(information itself) and explicit (the environment of the information) attributes and
information quality can only be regarded implicit (Galzer, 1993). Some explicit elements will
influence the value. The characteristics such as: Accessibility, quality. So the first hypothesis
is: the Context or more specifically, the Relevance and the Impact are explicit factors
that affect the value, judged from the result of analysis. For example, a person’s bank
statement is clearly a high quality piece of information judged on the basis that it is accurate,
useful and up-to-date; is from a trusted source; and relevant information can be accessed. But
the statement is of low value if it is evaluated in an unrelated work context and therefore the
“Relevance” level is low in this particular context. Another example is in a situation of an
information privation, the value of any information that can be found is significantly
increased by the factor of “Impact”. Referring to the trade-off between ‘what you get’ and
‘what you give’ in equation (4), information value is a trade-off between ‘benefits of
having information’ and ‘resources spending on storing and retrieving’. It is noted that
‘Relevance to a problem’, ‘Impact of having the information’, and ‘Quality’ inform
benefits that needs to be further elaborated.

10
• Cost. Although the list in Section 2.4 does not include Cost, it has been shown that the
various definitions of value have in common a sacrifice part, which most often expressed as
Cost (but also there can be other losses such as: time, effort, resources, opportunities as well
as negative outcomes). Cost is the key factor representing the ‘resources spending on
storing and retrieving’ part of the definition of information value and it is the second
hypothesis.
From these two hypothesises:
Saving X Relevance)(Quality
retrieving and storingon spending Resourcesninformatio having of Results n valueInformatio
+=
= (5)
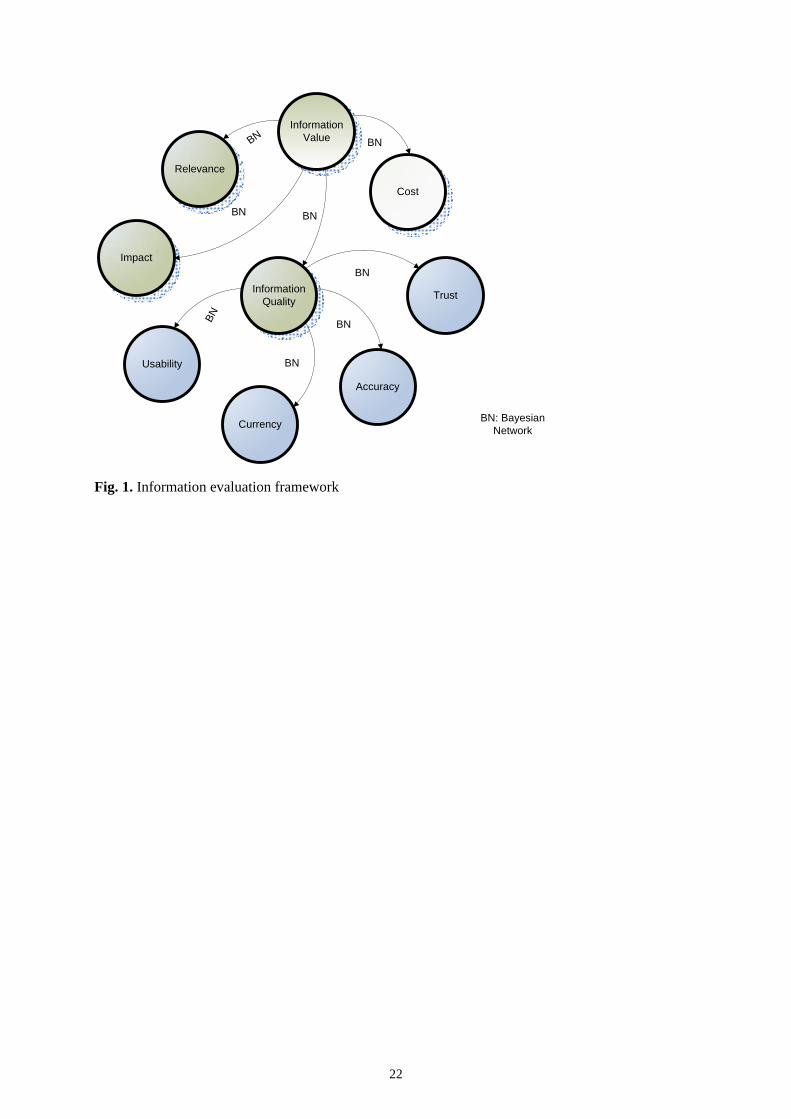
Based on the analysis result of the characteristics list and the two hypothesises, an information
evaluation framework can be represented as shown in Fig. 1.
“Take in fig. 1”
From this framework, the Information Quality can be quantified by measuring the information
characteristics such as: Accuracy, Usability and so on (or any other characteristics identified from
other approaches). Given the Information Quality the Information Value can be calculated using
Equation (5) with addition inputs of Relevance, Impact, and Cost. The linkage among them is based
on Bayesian Network, which is introduced in the next section. This framework just gives a
qualitative method of information evaluation and the next step is to find an approach to
quantitatively express the information characteristics and calculate the relationship between them
and the information value.
3.2. The Bayesian Network
The Bayesian Network (BN) is a graphical tool that combines elements of both graph and
probability theory. It has been shown that BNs are Directed Acyclic Graphs (DAG) with a set of
probability tables (Russell, 2003). A BN encodes the probability distribution of a set of random
variables by specifying a set of conditional independence assumptions together with a set of
relationships among these variables and their related joint probabilities. In general the DAGs can
model the set of relationships among the variables; each of a DAG’s nodes represents a variable,
and the arcs, which represent statistical dependence relations among the variables and local
probability distributions for each variable given values of its parents, are the causal or influential
links between the variables. A set of conditional probability functions associated with each node
model the uncertain relationship between the variable and its parents. BNs’ conditional
independence assumptions yield more compact models than those based on full joint probability
11
distributions, relaxing the issue of computational complexity when consider a large number of
variables (Russell, 2003). The nature of the BN makes it a potentially powerful representation
combining formalism with visual expression.
Basically, the Bayesian roles are: For any two events, A and B,
p(A)
p(B)p(A|B) p(B|A) ×= (6)
where ‘p(A)’ can be regarded as “the probability of A”, and ‘p(A|B)’ is "the probability of A given
that B has occurred".
Taking Information Quality and Trust in the information evaluation framework in Figure 1 as an
example, the probability of “Information Quality” (is high, mid, or low), can be calculated as:
p(Trust)
) p(Qualityality) p(Trust|Qu Trust) p(Quality| ×= (7)
More generally given nodes X = X1, … , Xn, the joint probability function for any Bayesian
Networks is:
∏=
=n
iii ))|parents(Xp(Xp(X)
1
(8)
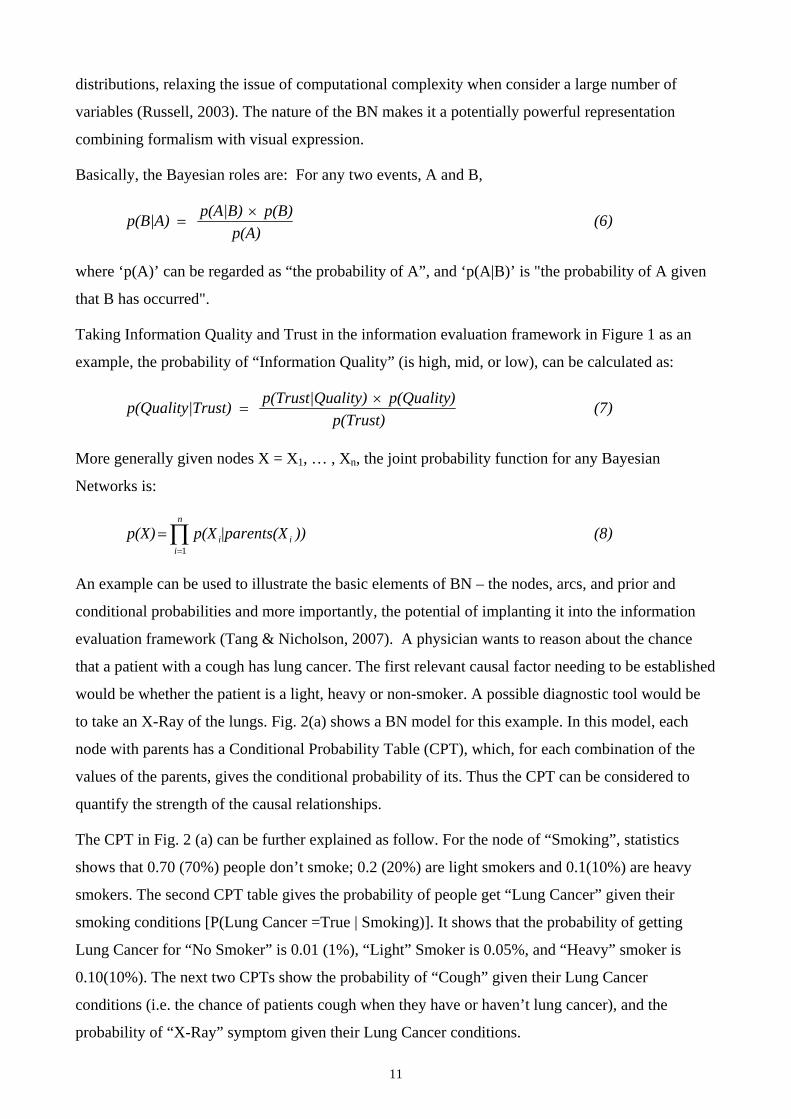
An example can be used to illustrate the basic elements of BN – the nodes, arcs, and prior and
conditional probabilities and more importantly, the potential of implanting it into the information
evaluation framework (Tang & Nicholson, 2007). A physician wants to reason about the chance
that a patient with a cough has lung cancer. The first relevant causal factor needing to be established
would be whether the patient is a light, heavy or non-smoker. A possible diagnostic tool would be
to take an X-Ray of the lungs. Fig. 2(a) shows a BN model for this example. In this model, each
node with parents has a Conditional Probability Table (CPT), which, for each combination of the
values of the parents, gives the conditional probability of its. Thus the CPT can be considered to
quantify the strength of the causal relationships.
The CPT in Fig. 2 (a) can be further explained as follow. For the node of “Smoking”, statistics
shows that 0.70 (70%) people don’t smoke; 0.2 (20%) are light smokers and 0.1(10%) are heavy
smokers. The second CPT table gives the probability of people get “Lung Cancer” given their
smoking conditions [P(Lung Cancer =True | Smoking)]. It shows that the probability of getting
Lung Cancer for “No Smoker” is 0.01 (1%), “Light” Smoker is 0.05%, and “Heavy” smoker is
0.10(10%). The next two CPTs show the probability of “Cough” given their Lung Cancer
conditions (i.e. the chance of patients cough when they have or haven’t lung cancer), and the
probability of “X-Ray” symptom given their Lung Cancer conditions.
12
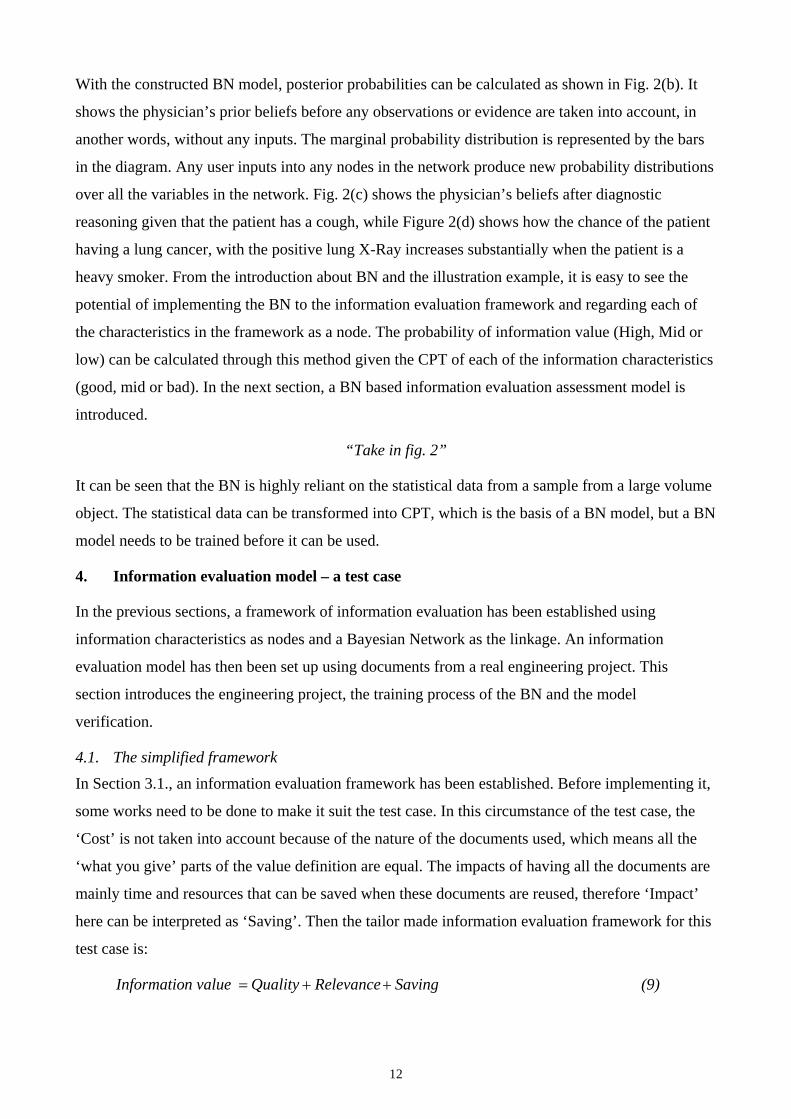
With the constructed BN model, posterior probabilities can be calculated as shown in Fig. 2(b). It
shows the physician’s prior beliefs before any observations or evidence are taken into account, in
another words, without any inputs. The marginal probability distribution is represented by the bars
in the diagram. Any user inputs into any nodes in the network produce new probability distributions
over all the variables in the network. Fig. 2(c) shows the physician’s beliefs after diagnostic
reasoning given that the patient has a cough, while Figure 2(d) shows how the chance of the patient
having a lung cancer, with the positive lung X-Ray increases substantially when the patient is a
heavy smoker. From the introduction about BN and the illustration example, it is easy to see the
potential of implementing the BN to the information evaluation framework and regarding each of
the characteristics in the framework as a node. The probability of information value (High, Mid or
low) can be calculated through this method given the CPT of each of the information characteristics
(good, mid or bad). In the next section, a BN based information evaluation assessment model is
introduced.
“Take in fig. 2”
It can be seen that the BN is highly reliant on the statistical data from a sample from a large volume
object. The statistical data can be transformed into CPT, which is the basis of a BN model, but a BN
model needs to be trained before it can be used.
4. Information evaluation model – a test case
In the previous sections, a framework of information evaluation has been established using
information characteristics as nodes and a Bayesian Network as the linkage. An information
evaluation model has then been set up using documents from a real engineering project. This
section introduces the engineering project, the training process of the BN and the model
verification.
4.1. The simplified framework
In Section 3.1., an information evaluation framework has been established. Before implementing it,
some works need to be done to make it suit the test case. In this circumstance of the test case, the
‘Cost’ is not taken into account because of the nature of the documents used, which means all the
‘what you give’ parts of the value definition are equal. The impacts of having all the documents are
mainly time and resources that can be saved when these documents are reused, therefore ‘Impact’
here can be interpreted as ‘Saving’. Then the tailor made information evaluation framework for this
test case is:
SavingRelevanceQualityn value Informatio ++= (9)
13
4.2. The training process
In this test case the engineering director’s project folder is picked up as the background. This folder
contains 60 documents including: technical specifications and procedures, meeting agendas, fax
(order forms), letters (order related), notices, reports, and memos. The scenario is set as: the
document management department needs to evaluate and archive these documents after the project
has finished. The training process is shown in Fig. 3. In this training process, the document
manager, or whoever is acting as the document manager with the knowledge of making the
judgements, accesses each of the 60 documents using a questionnaire (Fig. 4).
For each document, he or she needs to make a judgement about each information characteristic
identified in the framework (in Section 3.1) with some help of the definitions and question to be
asked as shown in the two middle columns in Fig. 4. For example: the Accuracy of this document is
(Good, Mid, or Bad); Trust level of this document (Yes or No), and so on. Also he or she needs to
make Quality (High, Mid or Low) and Value (High, Mid or Low) judgements after the judgements
of the information characteristics have been made. This is for the purpose of building a link
between the characteristics and the value. When the questionnaires have been completed, all the
inputs need to be re-organized into a Summary form and then calculated to build a CPT as shown in
Fig. 3. The CPT represents every line linkage in Fig. 1 mathematically and it is the basis for BN
model.
“Take in fig. 3” & “Take in fig. 4”
Having developed the evaluation framework using appropriate information characteristics as the
criteria and constructed the CPT for a BN tool which can provide both probability computing and
graph support, an information evaluation assessment model can be constructed. The Fig. 5 shows
the anterior evaluation model prior to the judgement of any information characteristics. The CPT
behind each node with parent node(s) is built on historical statistic data which represents the
probability gained from the training circumstance. For example, the 60 documents that were
evaluated have a 58 percent of chance of being high Accuracy, and 73 percent of chance that it can
be trusted, and so on.
“Take in fig. 5”
If there is enough evidence to support the judgement on each characteristic, and there is also
available input (however defined) for Relevance and Saving, both the quality and value of
information can be computed as shown in Fig. 6. It can be seen in this example that when the
information evaluator thinks that the Accuracy is good, the information can be trusted, and it is
usable and up to date (Currency); then the information has a 99 per cent probability of being high
quality. Once the quality of the information has been assessed, the next step is judging the context

14
to decide the relevance level, and assess the saving (savings when being reused, for example). Here,
the evaluator estimates that the information is relevant to the context and the saving is Big, which
gives a 98 per cent probability of information being high value, and so on.
“Take in fig. 6”
4.3. The verification process
When the model has been established on the basis of the training process using the 60 documents as
a test case, it is necessary to validate this model against the training documents in order to judge the
difference between the human judgement and the calculation results. The verification process is
shown in fig. 7 and was to input just the information characteristic judgements from the training
process summary form into the model and calculating each of the possibilities of the Quality and
Value being high, mid, or low; Then compare them with the Quality and Value judgements from the
training process. For example, the judgment for one document in the training process is:
Accuracy(Good), Trust(Yes), Usability(Very), Currency(Yes), Relevance(High), Saving(Big).
These judgements are input into the model and the model indicates that the probability of the
Quality of this document being high is: 99%; and the Value being high is 98%. When checking the
training process, the judgements indicate that the Quality and Value of this document are both high.
This can be seen that the model is reasonably accurate and gives strong possibility on the right
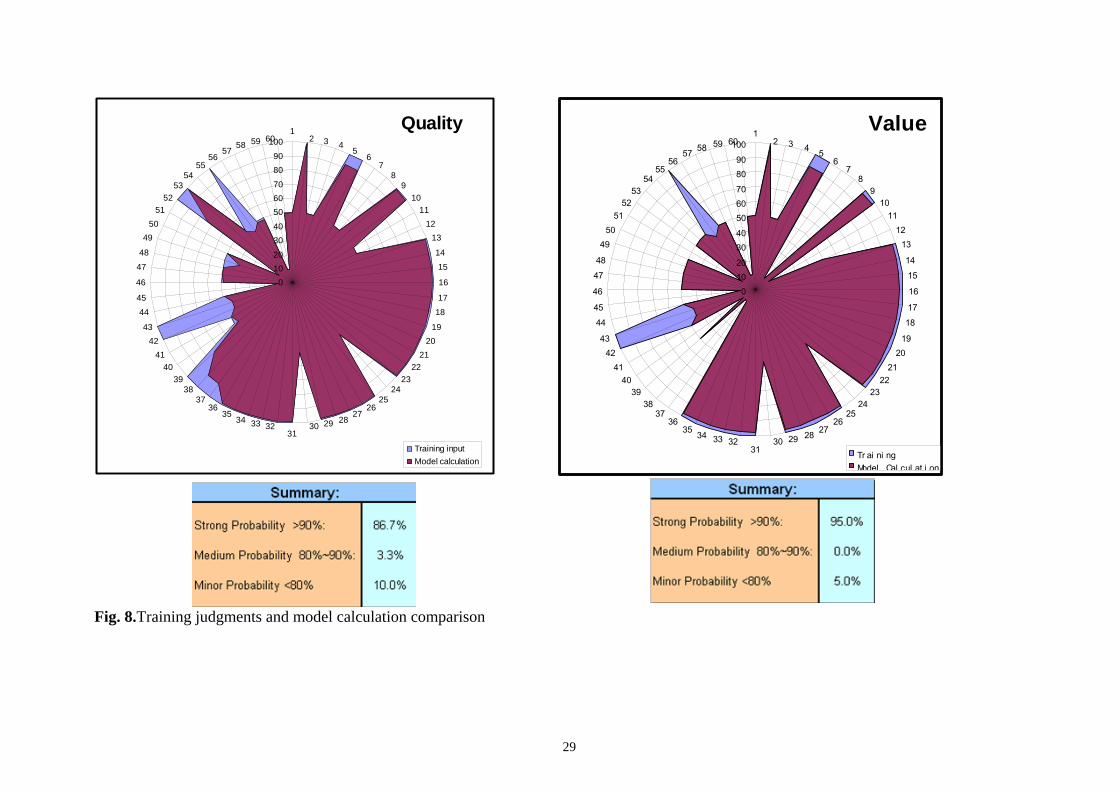
Value judgement. Two radar diagrams can be visualise the results as shown in Fig. 8.
“Take in fig. 7” & “Take in fig. 8”
It can be seen that the model gives relevant precision possibilities both on Quality and Value, where
the difference between model predictions and training judgments are less than 14% for Quality and
5% with Value for the 60 documents. To summarize, the Quality calculation and Value calculations
have an 87 and 95 percent chance of giving an accurate result, which is defined here as more than a
90 percent probability that the Quality/Value is high, mid or low. It can be seen that there are some
inaccurate calculation from the model, for example, document No. 42 and 43 are judged as high
Quality and high Value in the training process, but as it is shown in Fig. 7, the model only gives a
45 percent of probability of being high Quality and 44 percent of probability of being high Value.
This difference has been further analyzed and it is identified that the inconsistency during the
training process is responsible for this significant difference. In another word, giving the same
information characteristic judgments (Accuracy, Usability, and so on), the training process gives
different Quality and Value judgments. This inconsistency confuses the model later and can be
avoided during the training process.

15
5. Discussion and Further work With an information evaluation framework and assessment model, information can be evaluated
based on the judgement of the various information characteristics criteria. But there are some
contextual questions that need to be addressed. How much does the context affect the value
judgement? Does the information have a unique value in different contexts? How can the context or
relevance be classified? And how big is the impact of the value judgement within the context?
These issues, and more importantly, the analysis that leads to a possible decision support approach
are considered below.
5.1. Multi – context evaluation
A number of case studies have been identified in the engineering and construction field [49] and we
have described ‘value’ in a number of contexts [31][19]. Hence we can propose a number of
contexts for the evaluation of information.
• Any evaluation process is clearly context sensitive therefore the results of evaluation are also
context depended. Not only the results, but the process, the judgement criteria and the
manners of dealing with the information after evaluation process are different.
• An individual participating in an evaluation process can be a representative of him/her self,
their department or the whole organization. In this circumstance, individuals must clarify the
context in which they conduct the evaluation. This also does not necessarily require the
framework to be same, in fact the criteria or even the parameters in the calculation could
vary.
• In a typical evaluation process, information flows are treated differently, applying a
Department Evaluation or Personal Evaluation approach according to the context. More
broadly, apart from the enterprise and personal level contexts, there may still be other
contexts, such as the “Corporate” level and where the information evaluation decision
affects the whole corporate operation. Although the accurate definition of each of those
contexts, such as the corporate, the department, the personal, is not present, their existence is
obvious. So the hypothesis here is that the context is multiple for the information
evaluation process, which means the information evaluation model developed in Section 3
can be regarded as an instance of the information evaluation that fills into either of the
contexts, and can be tailored to suit for the particular requirements.
5.2. Further work
Further issues need to be discussed about this approach for more research and implements:
16
a) The information characteristics and the other criteria such as relevance, context, cost, and
impact are high level. Not only could the criteria be changed in a different modelling
approach, but also the method of measurement. It is thus required to establish metrics for
each of the characteristics and it is anticipated that more human factors need to be taken into
account;
b) The definition and measurement for context is a topic of much research and there may be
more levels of context rather than just corporate, department, and personal; [12] [14]
c) The model relies on the CPT (Conditional Probability Table) behind the diagrams which
requires considerable statistical work to obtain the data CPT in a formalized manner;
d) The approach uses the Bayesian theory as the basis of the computation of the model, which
can be reversed for reasoning inference. Take equation (7) as an example, it can be
expressed as:
p(Quality)
p(Trust)Trust) p(Quality Quality|) p(Trust ×=
|| (9)
The approach developed for the evaluation process uses the information characteristics like trust,
accuracy, and so on to calculate the quality and then the value of information. But an equation like
(9) can be manipulated to assist information searching. For a circumstance where the information
already exists and the job is to locate some particular information with certain characteristics, a
reversed Bayesian equation could be the basis of calculation for a probability of certain
characteristics such as trust level.
6. Concluding remarks This paper has developed an approach to build on an information evaluation assessment system
based on the information characteristics, Bayesian Network theory, and conditional probability
statistical data. This approach uses information characteristics which can be judged against each
information instance, as the fundamental elements to build the nodes of Bayesian Network; and
then make conditional probability statistical data to build the links among them; and finally applies
Bayesian theory to calculate the possibility of information value given the judgment input on
information characteristics. From the test case study with a model training process and a
verification one, it can be concluded that this approach can be used to build information evaluation
model that gives relevant precision possibilities both on information quality and information value.
Additionally the multi level context has been discussed and three levels, which are: cooperate,
department, and personal level of context for information evaluation have also been identified.
Several topics of further works for research and implements are raised with some in depth analysis
17
of the methodology. The key issue is the potential high workload in collecting the probability data
in the CPT (Conditional Probability Table) which is the core of the calculation of the evaluation.
But with the potential of applying the Bayesian theory reversely into reasoning inference, this
approach can also be used to design the information search system or flexible archiving system.
Acknowledgements The contribution of the KIM project team and its industrial collaborators to the development of the
research programme and thus to this paper is gratefully acknowledged. The KIM project is funded
by the UK Engineering and Physical Sciences Research Council (EPSRC) and the Economic and
Social Research Council (ESRC) under Grant Numbers EP/C534220/1 and RES-331-27-0006.
References Ben-Haim, Y. (2001). Info-gap value of information in model updating. Mechanical Systems and
Signal Processing, 15(3), 2001, 457-474. Broady-Preston, A. T., & Williams, J. (2004). Using information to create business value: City of
London legal firms, a case study. Performance Measurement and Metrics, 5(1), 5-10. Butcher, H. (1995). Information overload in management and business. IEE Colloquium Digest,
95(223), 1-2. Cleveland, A. B. J. (1999). Harvesting the Value of Information. Journal of Management in
Engineering ASCE, 15(4), 37-42. Dell'Isola, A. (1997). Value engineering: Practical applications for design, construction,
maintenance and operations. Kingston, MA: RS Means. Dent, N. (1995). Value. In: Honderich, T. (Eds.), The Oxford companion to philosophy. Oxford:
Oxford University Press. Dominguez, H. & Lashkari, R. S. (2004). Model for integrating the supply chain of an appliance
company: A value of information approach. International Journal of Production Research, 42(11), 2133-2140.
Edmunds, A., & Morris, A. (2000). The problem of information overload in business organisations: a review of the literature. International Journal of Information Management, 20(1), 17-28.
Eppler, M. J., & Mengis, J. (2004). The concept of information overload: a review of literature from organization science, accounting, marketing, MIS, and related disciplines. The Information Society, 20(5), 325-344.
Feather, J. (1998). The information society: A study of continuity and change. London: Library Association.
Fenner, A. (2002). Placing value on Information. Library Philosophy and Practice, 4(2), 2002, 6. Ferrer, G., & Ketzenberg, M. E. (2004). Value of information in remanufacturing complex
products. IIE Transactions, 36(3), 265-277. Fowler, T. C. (1990). Value analysis in design. New York: Van Nostrand Reinhold. Galzer, R. (1993). Measuring the value of information: the information-intensive organization.
Technical IBM System Journal, 32(1), 1993, pp. 99-110. Gavirneni, S. & Kapuscinski, R. (1999). Value of information in Capacitated Supply Chains,
Management Science, 45(1), 16-24. Hicks, B. J. & Culley, S. J. (2002). A framework for the requirements of capturing, storing and
reusing information and knowledge in engineering design. International Journal of Information Management, 22(4), 263-281.
Inc. Staff (2003). Data INC Magazine. Available at: http://www.inc.com/magazine/19990101/715.html

18
Kohler, W. (1966). The place of value in a world of facts. New York: Liverlight. Ladley, J. (2004). Stay informed: online column beyond the data warehouse: the value of
information. Available at: http://www.datawarehouse.com/article/. Lee, C. S. (2001). Modelling the business value of information technology. Information &
Management, 39(3), 191-210. Lewis, D. (1996). Dying for information? London: Reuters Business Information. Miles, L. D. (1972). Techniques of value analysis and engineering. New York: McGraw Hill. Mussi, S. (2004). Putting value of information theory into practice: a methodology for building
sequential decision support systems. Expert Systems, 21(2), 92-103. Oppenheim, C. (1997). Managers' use and handling of information. International Journal of
Information Management, 17(4), 39-248. Oppenheim, C., & Stenson, H. (2000). Valuing information assets in UK companies. Managing
Information, 7(3), 56-61. Pickard, A. J., & Dixon, P. (2004). Measuring electronic information resource: towards a
transferable quality framework for measuring value. The Journal of Information and Knowledge Management Systems, 34(3), 126-131.
Thomson, D. S., Austin, S. A., Devine-Wright, H., & Mills, G. R. (2003). Managing Value and quality in design. Building Research & Information, 31(5), 334-345.
Thomson, D. S., Austin, S. A., D.S. Root, D. S., & A. Thorpe, A. (2006). A problem-solving approach to value-adding decision making in construction design. Engineering Construction and Architectural Management, 13(1), 43-61.
Walters, D. & Lancaster, G. (1999). Value and information-concepts and issues for management. Management Decision, 37(8), 643-656.
Weide, T.P.v.d. , & Bommel, P.v. (2006). Measuring the incremental information value of documents. Information Sciences, 176(2), 91-119.
Weissinger, T. (2005). Information as a value concept: reconciling theory and practice. Library Philosophy and Practice, 8(1), 1-12.
Woodruff, R. B., & Gardial, S. F. (1996). Know your customer: New approaches to understanding customer value and satisfaction. Cambridge MA: Blackwell.
Yokota, F., Thompson, K, M, (2004). Value of information analysis in environmental health risk management decisions: Past, present, and future. Risk Analysis, 24(3), 635-650.
Zhao, Y. Y., Tang, L. C. M., Darlington, M. J., Austin, S. A., & Culley, S. J. (2007). Establishing information valuing characteristics for engineering design information. International Conference on Engineering Design, ICED’07, 28-31 August 2007, CITE DES SCIENCES ET DE L'INDUSTRIE, Paris, France.
Russell, S., & Norvig, P. (2003). Artificial Intelligence: A Modern Approach. (2nd ed.). NJ: Prentice-Hall.
Tang, A., & Nicholson, A. (2007). Using Bayesian belief network for change impact analysis in architecture design. The Journal of Systems and Software, 80(1), 127-148.
Tang, L. C. M., Austin, S. A., Zhao, Y. Y., Culley, S. J., & Darlington, M. J. (2006). Immortal information and through life knowledge management (KIM): how can valuable information be available in the future? The 3rd Asia-Pacific International Conference on Knowledge Management, KMAP2006, 11th to 13th December, 2006, The Hong Kong Polytechnic University, Hong Kong.

19
High Value Information in Engineering Organizations Figure Legends: Fig. 1. Information evaluation framework Fig. 2. A medical example: (a) BN nodes, arcs and CPTs; (b) BN graph without evidence; (c) patient has a cough(diagnostic reasoning); (d) patient has a cough and a heavy smoker (both predictive and diagnostic reasoning). Fig. 3. Training process for information evaluation model Fig. 4. Questionnaire for training process Fig. 5. Anterior information evaluation model Fig. 6. Posterior information evaluation model with input Fig. 7. Verification process Fig. 8. Training judgments and model calculation comparison
22
Information Value
Relevance
Information Quality Trust
Accuracy
Currency
Usability
BN
BN
BN
BN
BN
BN
Cost
BN
BN: Bayesian Network
Impact
BN
Fig. 1. Information evaluation framework

23
Fig. 2. A medical example: (a) BN nodes, arcs and CPTs; (b) BN graph without evidence; (c) patient has a cough(diagnostic reasoning); (d) patient has a cough and a heavy smoker (both predictive and diagnostic reasoning).
0.05LightHeavy
No Smoker
Smoking
0.10
0.01
P( Lung Cancer = T| Smoking)
0.05LightHeavy
No Smoker
Smoking
0.10
0.01
P( Lung Cancer = T| Smoking)
0.98Positive
Negative
Lung Cancer
0.05
P( X-Ray = P| Lung Cancer)0.98Positive
Negative
Lung Cancer
0.05
P( X-Ray = P| Lung Cancer)
P( Smoking= Heavy) = 0.1P( Smoking= Light) = 0.2P (Smoking= No smoking) =0.70
P( Smoking= Heavy) = 0.1P( Smoking= Light) = 0.2P (Smoking= No smoking) =0.70
0.10F
T
Lung Cancer
0.90
P( Cough = T| Lung Cancer)
0.10F
T
Lung Cancer
0.90
P( Cough = T| Lung Cancer)
(a)
(b)
(c) (d)

24
Fig. 3. Training process for information evaluation model

25
Fig. 4. Questionnaire for training process

26
Fig. 5. Anterior information evaluation model

27
Fig. 6. Posterior information evaluation model with input

28
Accuracy; Trust;
Usability; Currency;Relevance;
Saving
Verifier
Summary
Compare
Verification
Calculation
Fig. 7. Verification process
29
Quality
01020
3040
506070
8090
1001
2 3 45
67
89
1011
1213
14
15
16
17
18
1920
2122
2324
2526
27282930
31323334
3536
3738
3940
4142
43
44
45
46
47
48
4950
5152
5354
5556
5758 59 60
Training inputModel calculation
Value
0102030405060708090
1001
2 3 4 56
78
910
1112
13
1415
16
1718
1920
2122
2324
2526
2728293031
3233343536
3738
3940
4142
43
4445
46
4748
4950
5152
5354
5556
57 58 59 60
Tr ai ni ngModel Cal cul at i on
Fig. 8.Training judgments and model calculation comparison