High-unemployment neighbourhoods in weak labour markets
23
High-unemployment neighbourhoods in weak labour markets ”The socio-political challenges of medium-sized cities” 10 December 2010, Keele University Alex Fenton ([email protected]) CCHPR, Department of Land Economy
Transcript of High-unemployment neighbourhoods in weak labour markets
High-unemployment neighbourhoods in weak labour markets
”The socio-political challenges of medium-sized cities”10 December 2010, Keele University
Alex Fenton ([email protected])CCHPR, Department of Land Economy
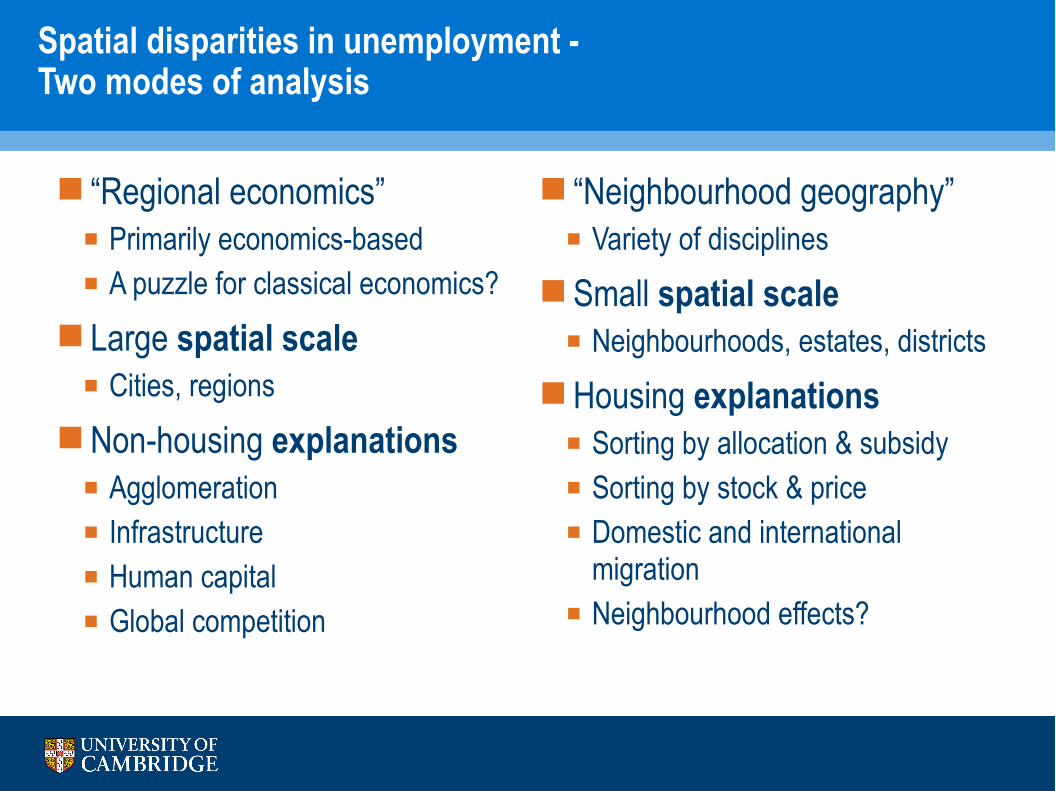
Spatial disparities in unemployment -Two modes of analysis
“Regional economics” Primarily economics-based A puzzle for classical economics?
Large spatial scale Cities, regions
Non-housing explanations Agglomeration Infrastructure Human capital Global competition
“Neighbourhood geography” Variety of disciplines
Small spatial scale Neighbourhoods, estates, districts
Housing explanations Sorting by allocation & subsidy Sorting by stock & price Domestic and international
migration Neighbourhood effects?
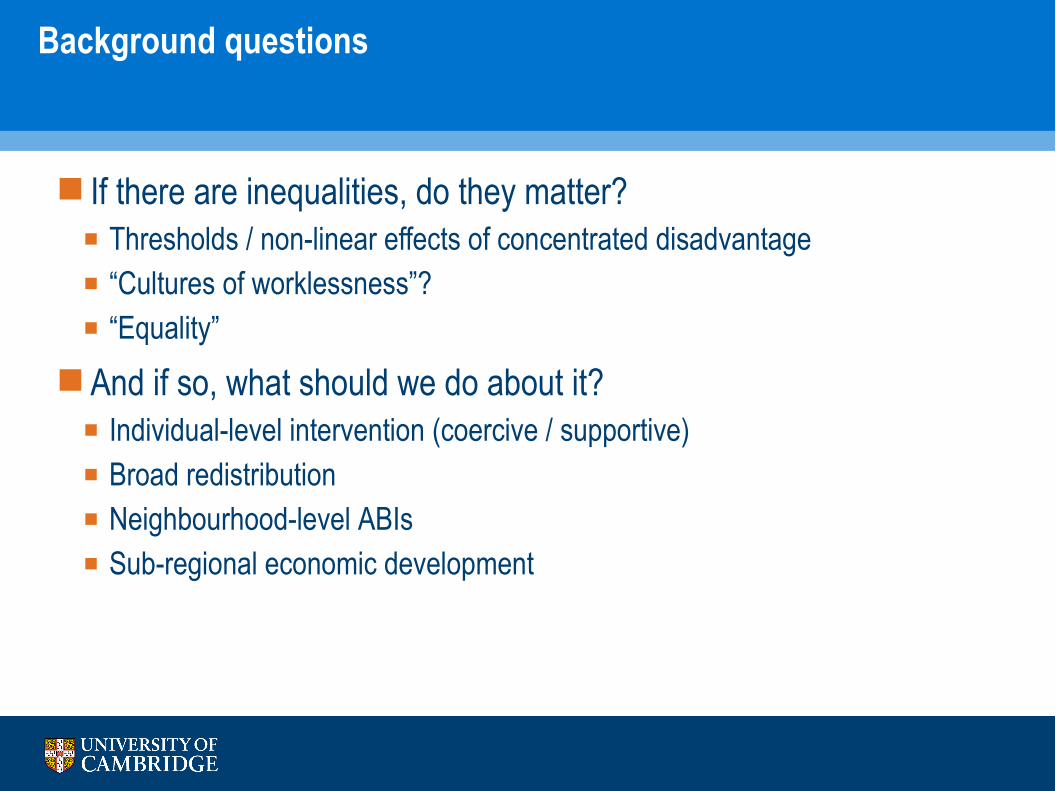
Background questions
If there are inequalities, do they matter? Thresholds / non-linear effects of concentrated disadvantage “Cultures of worklessness”? “Equality”
And if so, what should we do about it? Individual-level intervention (coercive / supportive) Broad redistribution Neighbourhood-level ABIs Sub-regional economic development
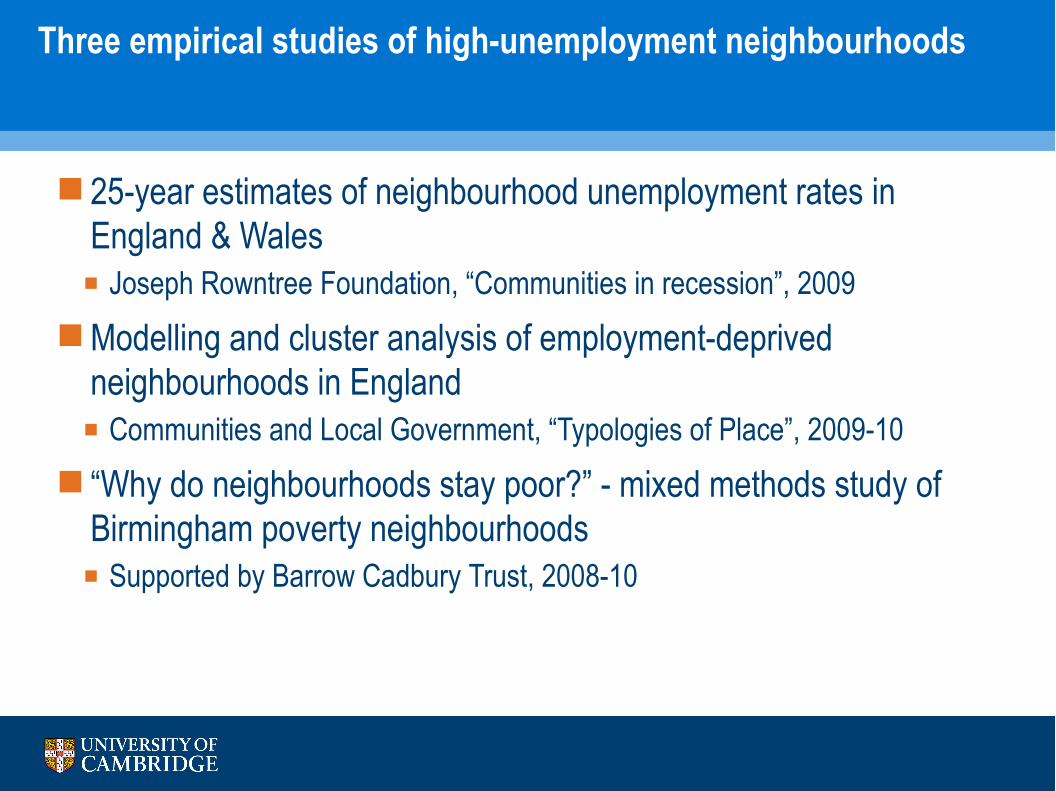
Three empirical studies of high-unemployment neighbourhoods
25-year estimates of neighbourhood unemployment rates in England & Wales Joseph Rowntree Foundation, “Communities in recession”, 2009
Modelling and cluster analysis of employment-deprived neighbourhoods in England Communities and Local Government, “Typologies of Place”, 2009-10
“Why do neighbourhoods stay poor?” - mixed methods study of Birmingham poverty neighbourhoods Supported by Barrow Cadbury Trust, 2008-10
Project 1: Neighbourhood unemployment rates 1985 - 2010
JSA claims data + GIS-derived population estimates For ~7,000 neighbourhoods in England & Wales, mean working age
population ~4,500 Monthly values 1985 - mid-2009 - so short-term effects visible Linked socio-economic characteristics of n'hoods (housing, occupation etc)
Research questions: “Vulnerability” to recession Persistence and change Inequality
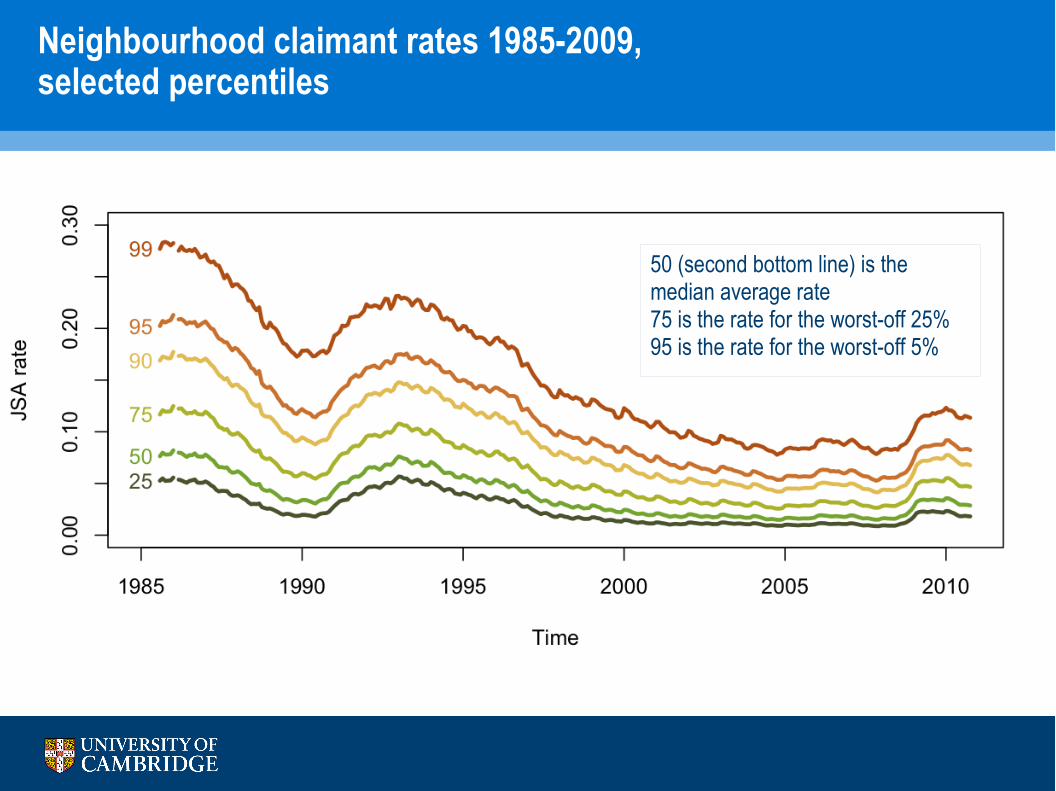
Neighbourhood claimant rates 1985-2009, selected percentiles
Chart with deciles!
50 (second bottom line) is the median average rate75 is the rate for the worst-off 25%95 is the rate for the worst-off 5%
What does it tell us?
JSA rates have fallen overall Displacement onto incapacity benefits from early 1990s Problem for comparability
Small number of areas have very high ratesGap between worst-off and average grows in absolute terms in
recessions Long-term high-unemployment neighbourhoods suffer most More stark if considered as risk-per-person of becoming unemployed
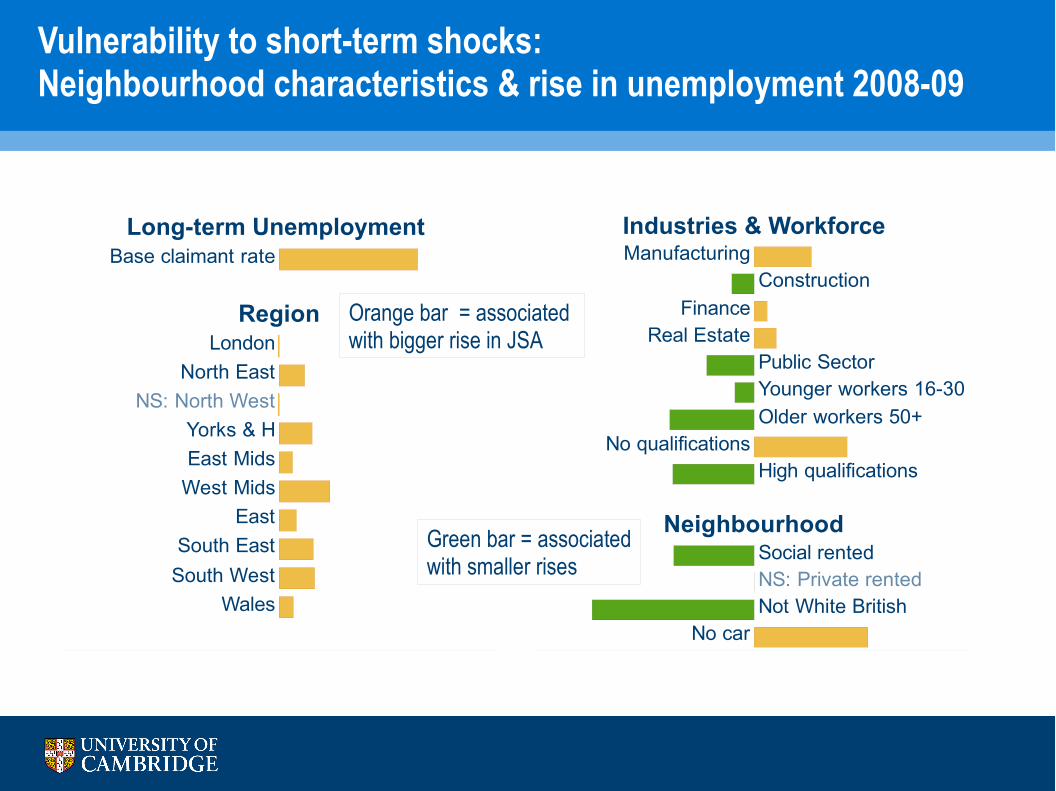
Vulnerability to short-term shocks:Neighbourhood characteristics & rise in unemployment 2008-09
Long-term Unemployment
Region
Base claimant rate
LondonNorth East
NS: North WestYorks & HEast Mids
West MidsEast
South EastSouth West
Wales
Industries & Workforce
Neighbourhood
Manufacturing
FinanceReal Estate
No qualifications
No car
Construction
Public SectorYounger workers 16-30Older workers 50+
High qualifications
Social rentedNS: Private rentedNot White British
Orange bar = associated with bigger rise in JSA
Green bar = associatedwith smaller rises
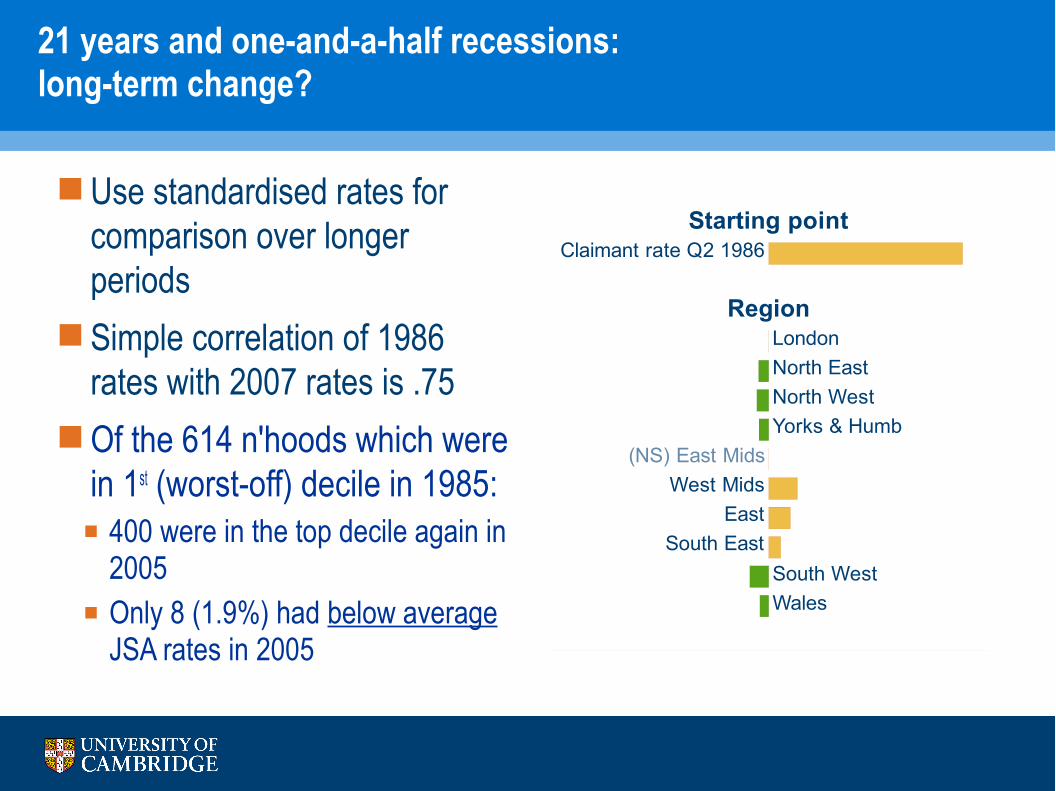
21 years and one-and-a-half recessions:long-term change?
Use standardised rates for comparison over longer periods
Simple correlation of 1986 rates with 2007 rates is .75
Of the 614 n'hoods which were in 1st (worst-off) decile in 1985: 400 were in the top decile again in
2005 Only 8 (1.9%) had below average
JSA rates in 2005
Starting point
Region
Claimant rate Q2 1986
(NS) East MidsWest Mids
EastSouth East
LondonNorth EastNorth WestYorks & Humb
South WestWales
Cities and their high-unemployment neighbourhoods
Some of the variation in rates is difference within cities and regions About 75% of overall variance is that between better-off and worse-off
n'hoods within each town/city About 25% (by one measure) is the variation between cities and
regionsDifference between cities was:
Highest in the late 1980s Lowest in the depths of the 1990s recession Has been gradually, though slightly, declining since 2000 Effects of the current recession not yet apparent

The trajectories of some small cities:Base neighbourhood JSA unemployment rate, relative to E&W

Project 2:Classifying high-unemployment neighbourhoods in 2008
Policy interest in use of spatial area classifications / typologies Allocation of resources Selection of suitable interventions Use in evaluation - identifying similar 'control' areas
Statistical typologies have to be based on a selection of variables But what is 'relevant' to concentrated unemployment depends on
perspective Regional or local causes? Housing, migration or people? Etc
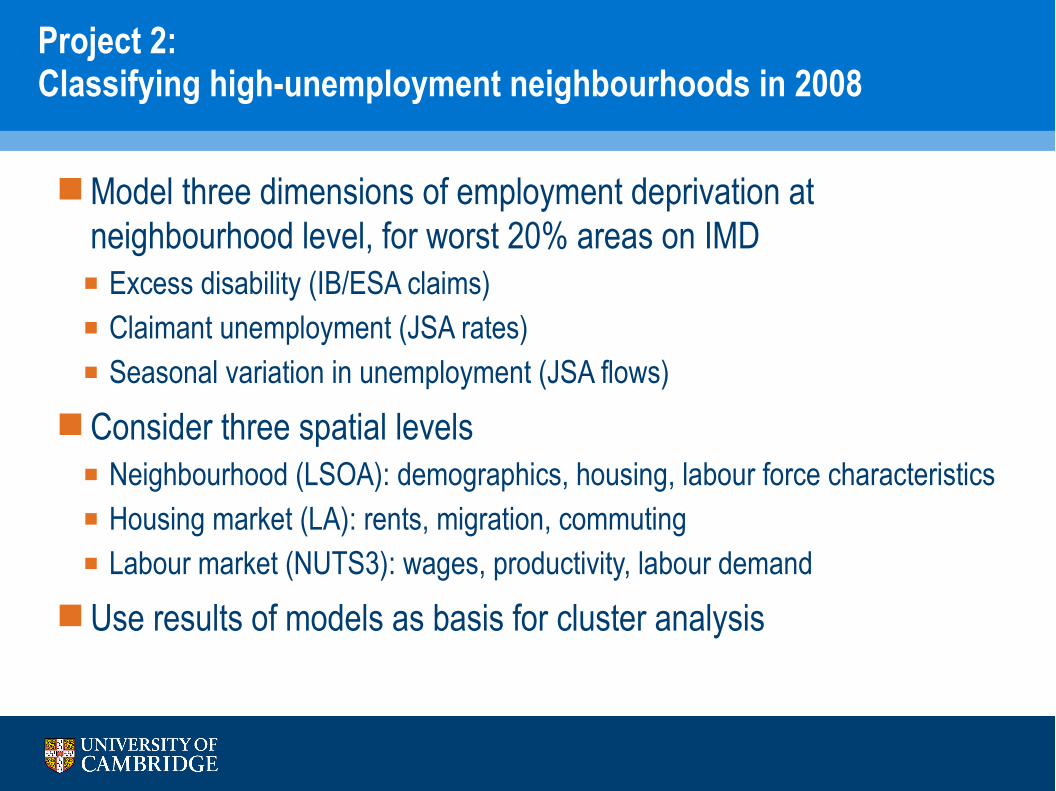
Project 2:Classifying high-unemployment neighbourhoods in 2008
Model three dimensions of employment deprivation at neighbourhood level, for worst 20% areas on IMD Excess disability (IB/ESA claims) Claimant unemployment (JSA rates) Seasonal variation in unemployment (JSA flows)
Consider three spatial levels Neighbourhood (LSOA): demographics, housing, labour force characteristics Housing market (LA): rents, migration, commuting Labour market (NUTS3): wages, productivity, labour demand
Use results of models as basis for cluster analysis
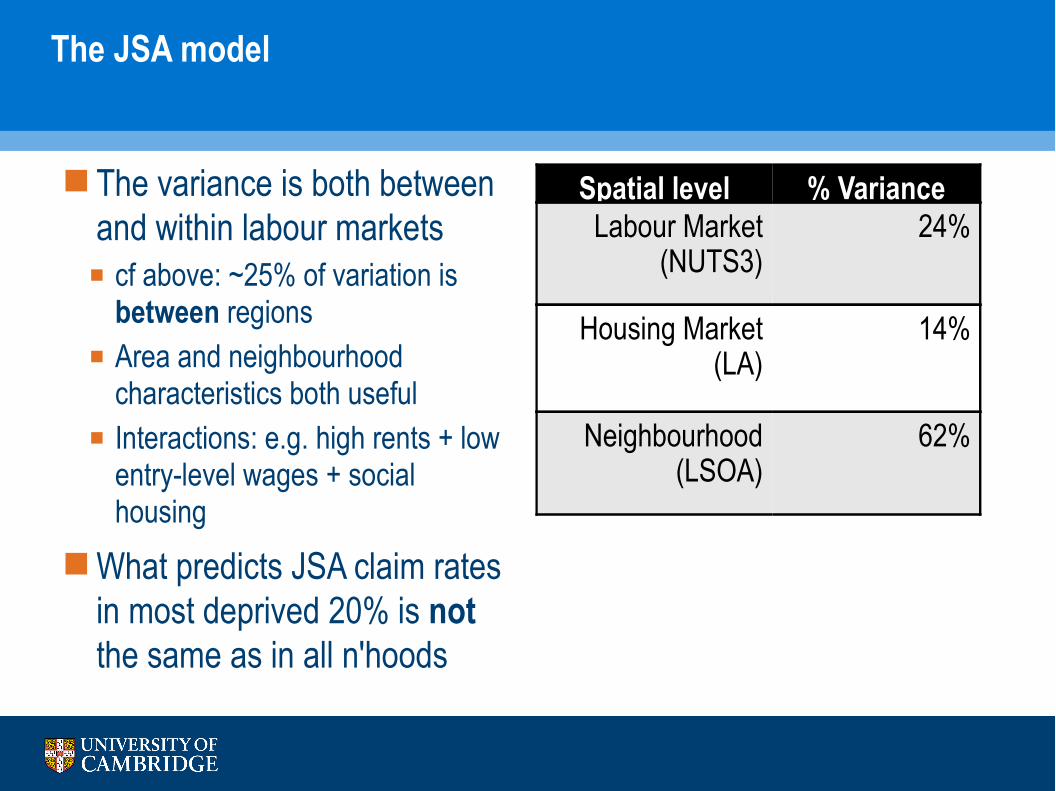
The JSA model
The variance is both between and within labour markets cf above: ~25% of variation is
between regions Area and neighbourhood
characteristics both useful Interactions: e.g. high rents + low
entry-level wages + social housing
What predicts JSA claim rates in most deprived 20% is not the same as in all n'hoods
Spatial level % VarianceLabour Market
(NUTS3)24%
Housing Market (LA)
14%
Neighbourhood (LSOA)
62%
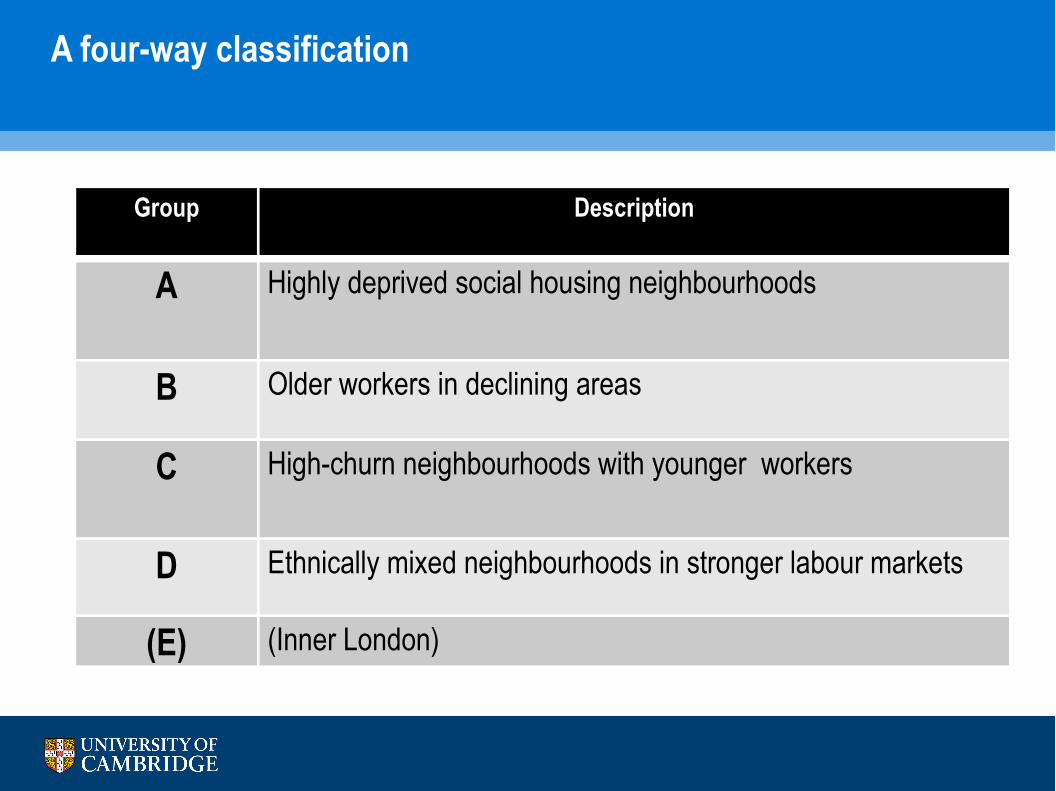
A four-way classification
Group Description
A Highly deprived social housing neighbourhoods
B Older workers in declining areas
C High-churn neighbourhoods with younger workers
D Ethnically mixed neighbourhoods in stronger labour markets
(E) (Inner London)
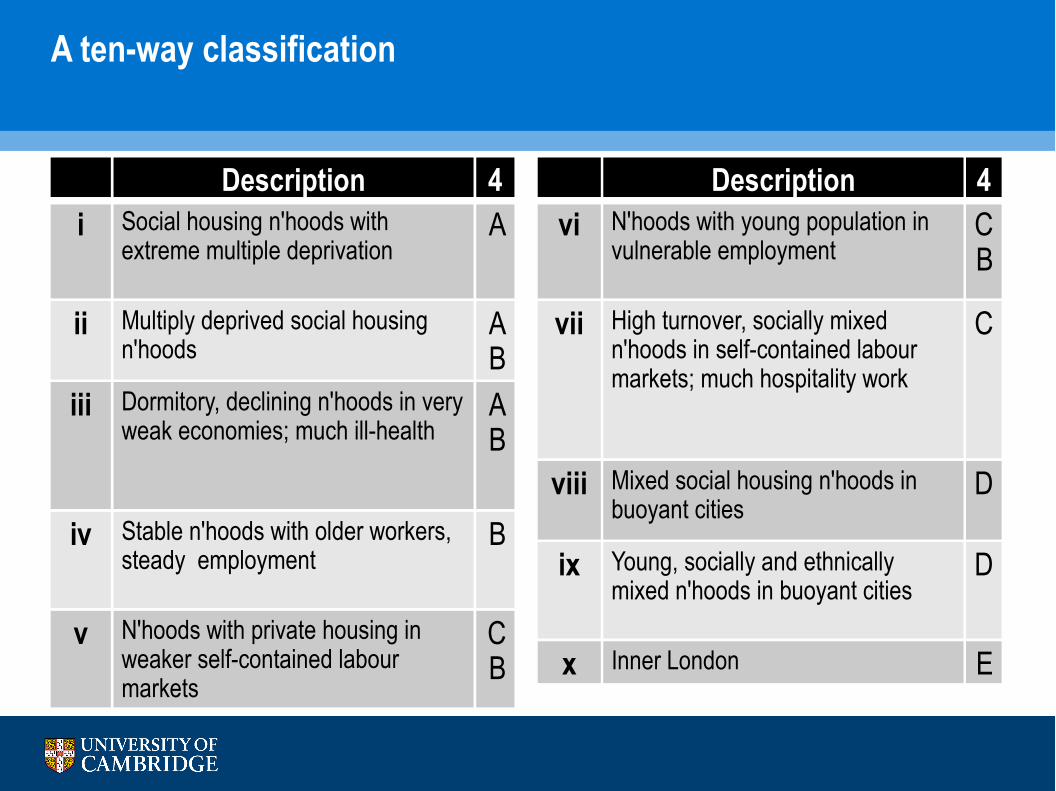
A ten-way classification
Description 4i Social housing n'hoods with
extreme multiple deprivationA
ii Multiply deprived social housing n'hoods
AB
iii Dormitory, declining n'hoods in very weak economies; much ill-health
AB
iv Stable n'hoods with older workers, steady employment
B
v N'hoods with private housing in weaker self-contained labour markets
CB
Description 4vi N'hoods with young population in
vulnerable employmentCB
vii High turnover, socially mixed n'hoods in self-contained labour markets; much hospitality work
C
viii Mixed social housing n'hoods in buoyant cities
D
ix Young, socially and ethnically mixed n'hoods in buoyant cities
D
x Inner London E
i Soc hsg, extreme depr
ii Soc hsg, multiple depr
iii Declining areas, older, IB
iv Older wrkrs, stable emp
v Weak self-cont markets
vi Young pop, vuln work
vii High turnover, soc mix
viii Soc hsg mix in buoyant
ix Soc / eth mix in buoyant
x Inner London
- Not in most deprived
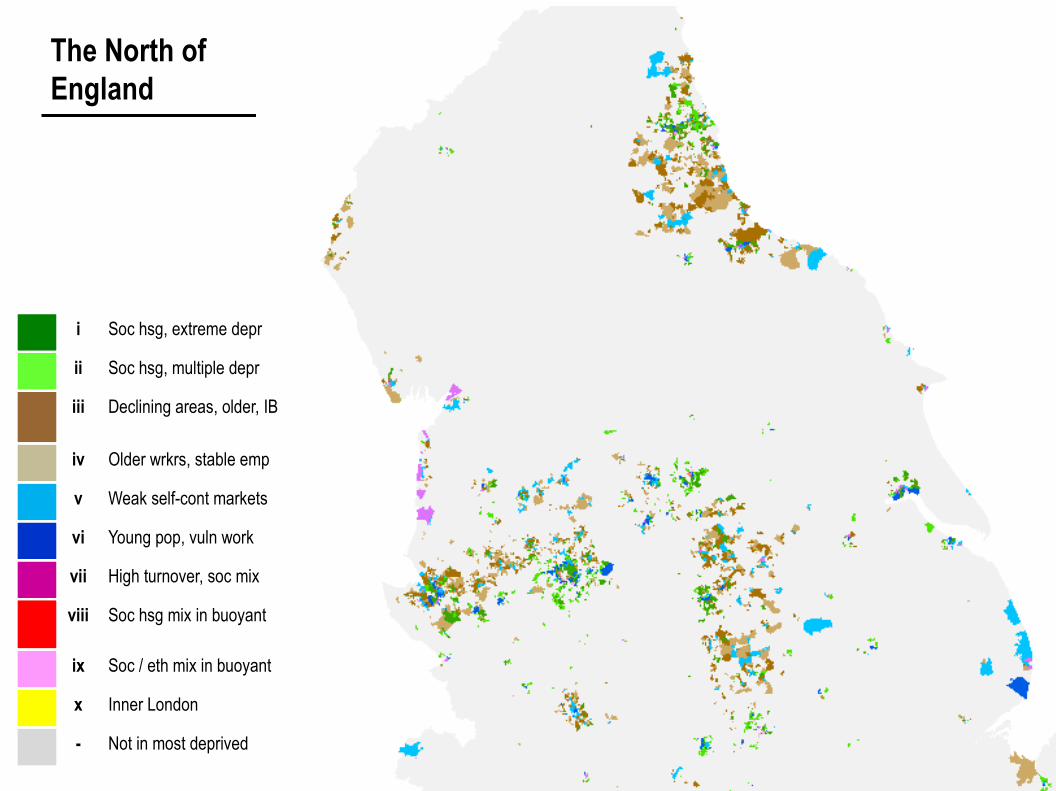
The North of England
i Soc hsg, extreme depr
ii Soc hsg, multiple depr
iii Declining areas, older, IB
iv Older wrkrs, stable emp
v Weak self-cont markets
vi Young pop, vuln work
vii High turnover, soc mix
viii Soc hsg mix in buoyant
ix Soc / eth mix in buoyant
x Inner London
- Not in most deprived
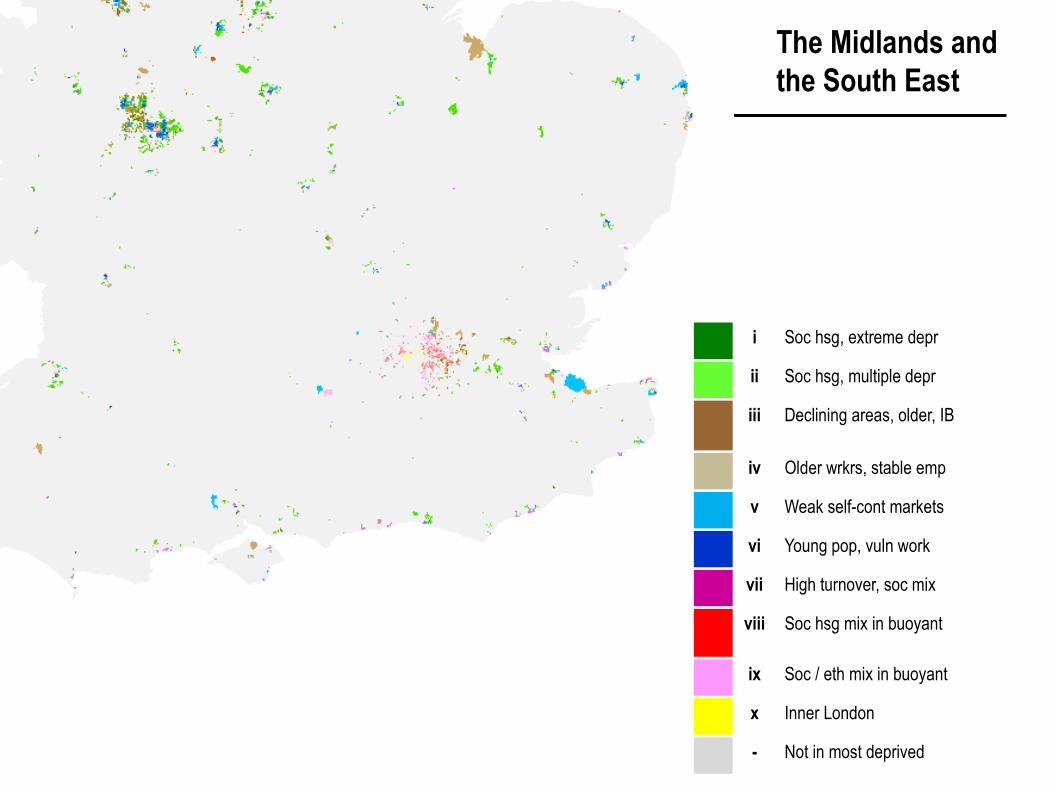
The Midlands and the South East
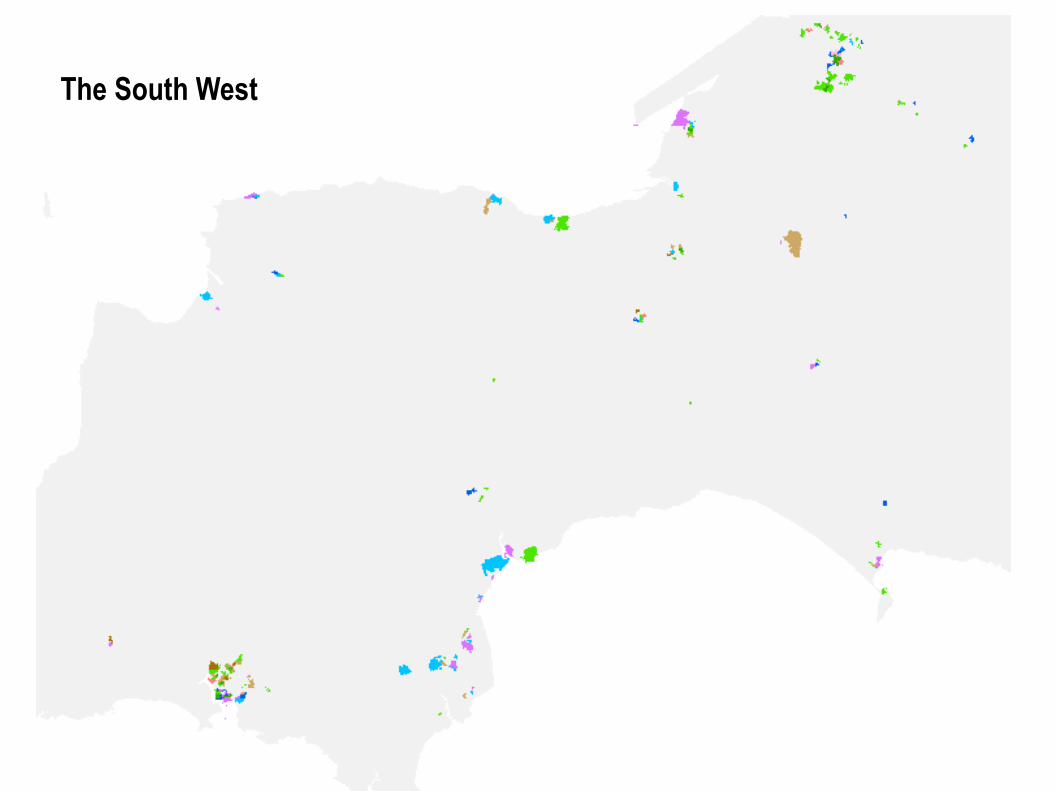
The South West
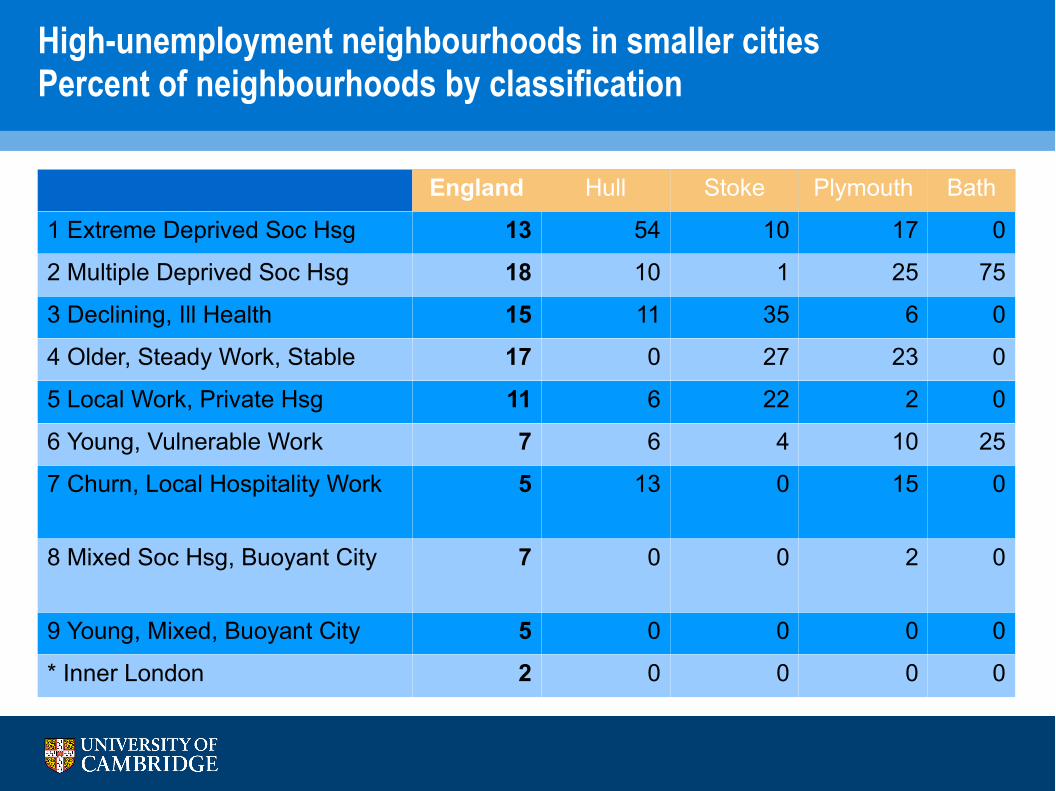
High-unemployment neighbourhoods in smaller citiesPercent of neighbourhoods by classification
England Hull Stoke Plymouth Bath
1 Extreme Deprived Soc Hsg 13 54 10 17 0
2 Multiple Deprived Soc Hsg 18 10 1 25 75
3 Declining, Ill Health 15 11 35 6 0
4 Older, Steady Work, Stable 17 0 27 23 0
5 Local Work, Private Hsg 11 6 22 2 0
6 Young, Vulnerable Work 7 6 4 10 25
7 Churn, Local Hospitality Work 5 13 0 15 0
8 Mixed Soc Hsg, Buoyant City 7 0 0 2 0
9 Young, Mixed, Buoyant City 5 0 0 0 0
* Inner London 2 0 0 0 0
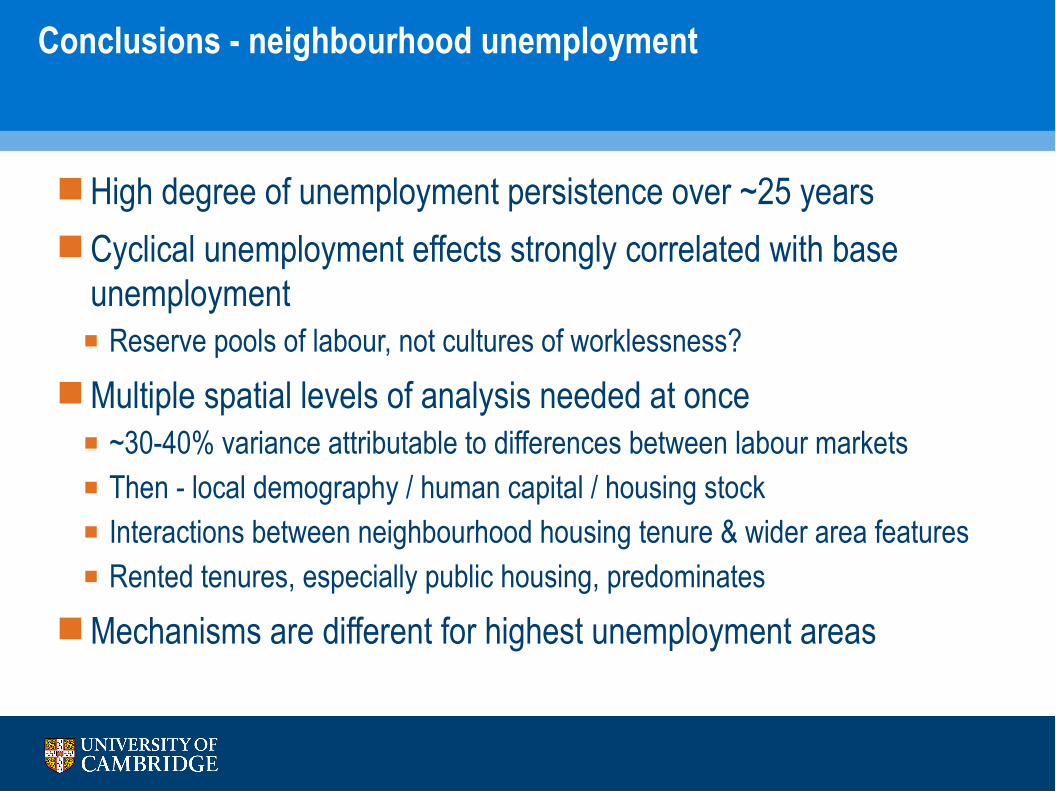
Conclusions - neighbourhood unemployment
High degree of unemployment persistence over ~25 yearsCyclical unemployment effects strongly correlated with base
unemployment Reserve pools of labour, not cultures of worklessness?
Multiple spatial levels of analysis needed at once ~30-40% variance attributable to differences between labour markets Then - local demography / human capital / housing stock Interactions between neighbourhood housing tenure & wider area features Rented tenures, especially public housing, predominates
Mechanisms are different for highest unemployment areas
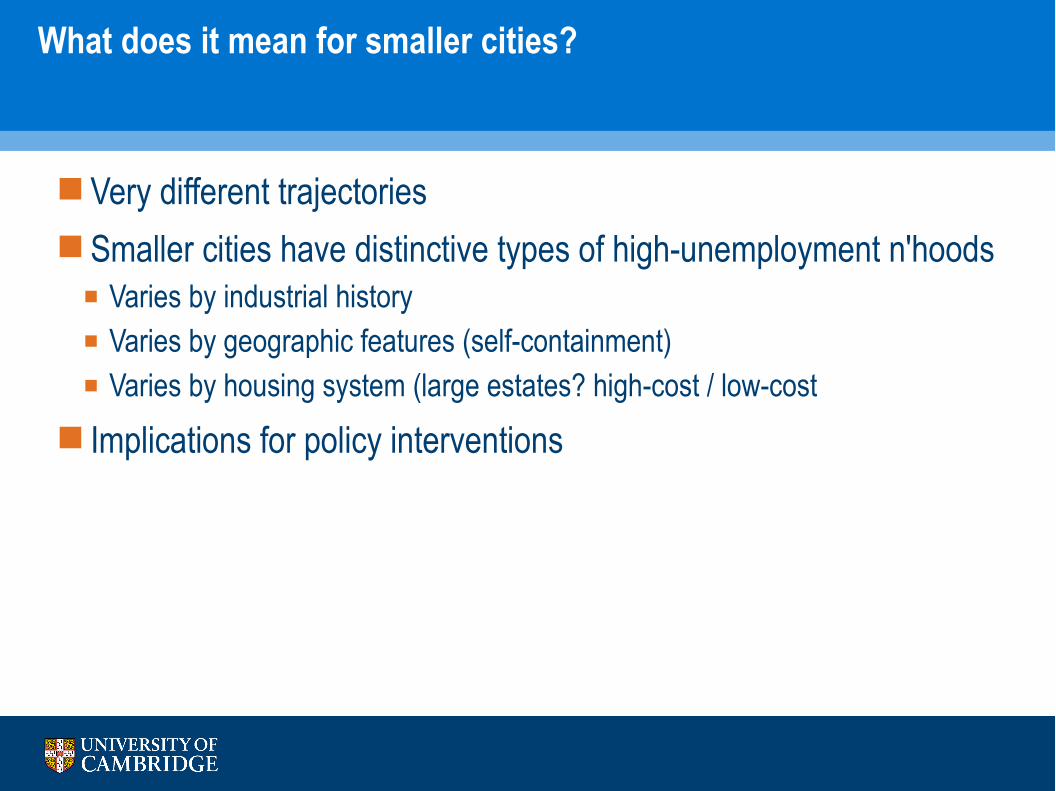
What does it mean for smaller cities?
Very different trajectoriesSmaller cities have distinctive types of high-unemployment n'hoods
Varies by industrial history Varies by geographic features (self-containment) Varies by housing system (large estates? high-cost / low-cost
Implications for policy interventions
Further research
Anthropological interpretation of poor neighbourhoods E.g. somatic aspects of long-term withdrawal through ill-health Broader correlates - violence, teenage conception, educational motivation Neighbourhood sociology of unemployment
Prediction and forecasting Recession effects, public sector cuts Benefits of regional development
Sociology of policy The language of interventions Reducing, or managing, unemployment? What sort of regeneration is realistic in different cities?