High-throughput RNA sequencing with Thermostable Group II Intron Reverse Transcriptase
13
High-throughput RNA sequencing with Thermostable Group II Intron Reverse Transcriptase Douglas C. Wu @wckdouglas wckdouglas.github.io Lambowitz’s Lab MBS Retreat 2016
-
Upload
douglas-wu -
Category
Science
-
view
445 -
download
0
Transcript of High-throughput RNA sequencing with Thermostable Group II Intron Reverse Transcriptase

High-throughput RNA sequencing with Thermostable Group II Intron
Reverse Transcriptase
Douglas C. Wu @wckdouglas wckdouglas.github.io Lambowitz’s Lab MBS Retreat 2016
Group II Intron Reverse TranscriptaseIntro
Differential expression
Summary
Sampling Bias
Total RNA
• Mobile genetic elements found in bacterial and organellar genomes • Ancestors of eukaryotic spliceosomal introns, retrotransposons and retroviruses
RT ORF
Lambowitz and Zimmerly. (2011) CSH Persp
Full-length cDNA of a highly structured intron RNA
DNA Target
Reverse splicing and bottom-strand cleavage
Target-DNA primed reverse transcription
Catalytically active intron RNA with stable secondary and tertiary
Group II intron RTs function in intron mobility

Thermostable Group II Intron Reverse Transcriptase (TGIRT)
Intro
Differential expression
Summary
Sampling Bias
Total RNA
Group II Intron RTs vs. Retroviral RTs
1. Group II intron RTs have high processivity and high fidelity
2. Group II intron RTs from thermophiles also have high thermostability
Mohr, et al. (2013) RNA
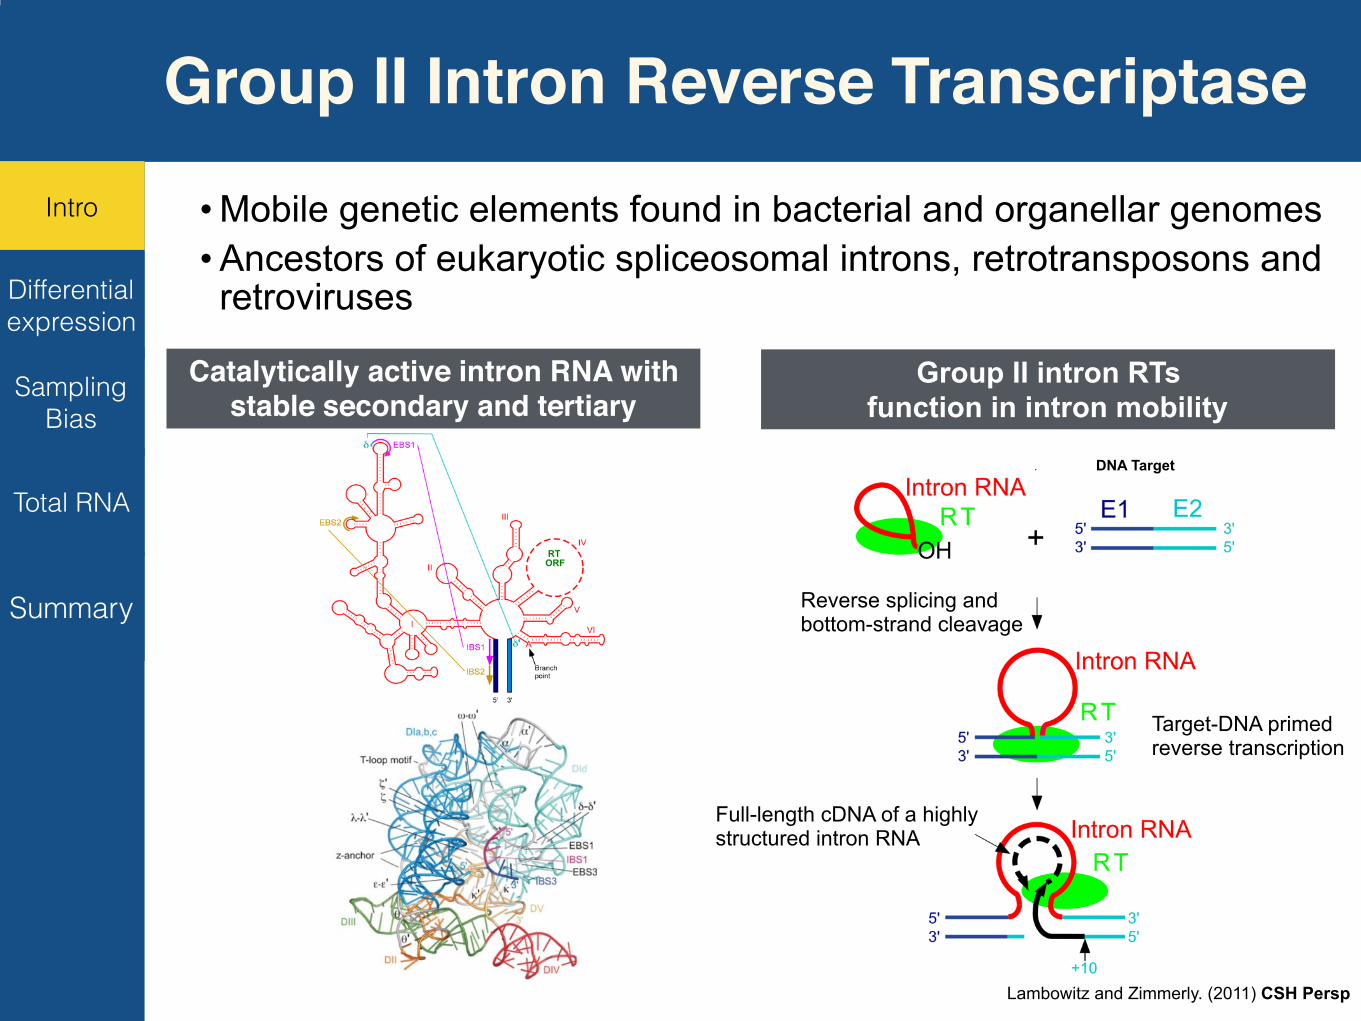
binds to an initial template–primer substrate comprised ofan RNA oligonucleotide containing an RNA-seq adaptersequence annealed to a complementary DNA primer. ForIllumina sequencing, the RNA oligonucleotide containsan Illumina Read 2 primer-binding site (R2 RNA), and theDNA primer contains the complementary sequence (R2RDNA) (Fig. 1A; Supplemental Fig. S1). After forming acomplex with the initial template–primer substrate, theTGIRT initiates reverse transcription by switching directlyfrom the 5′ end of the RNA-seq adapter to the 3′ end of a tar-get RNA, yielding a continuous cDNA linking the two se-quences. The RNA-seq adapter has a 3′-blocking groupthat impedes secondary template-switching to the 3′ end ofthat RNA.To increase the efficiency of template-switching, the DNA
primer annealed to the RNA-seq adapter in the initial tem-plate–primer substrate has a single-nucleotide 3′ overhang.This 3′-overhang nucleotide base-pairs to the 3′-terminal nu-cleotide of the target RNA, resulting in a seamless template-
switching junction between the RNA-seq adapter and the tar-get RNA (Mohr et al. 2013). In the present work, for the con-struction of RNA-seq libraries fromRNA pools with minimalbias, we used an initial template–primer substrate with anequimolar mixture of A, C, G, or T 3′ overhangs (denotedN; see Mohr et al. 2013). The ability of a single base pair be-tween the 3′-overhang nucleotide and the 3′ end of the targetRNA to direct TGIRT template-switching at 60°C, the oper-ational temperature of TGIRT enzymes, indicates a very po-tent strand annealing activity of group II intron RTs.Because an RNA-seq adapter is added directly during
cDNA synthesis, TGIRT-seq is inherently strand-specific.This strand specificity was confirmed here by the low fre-quency of antisense reads from a 74-nt RNA synthetic oligo-nucleotide template (7.2 × 10⁻⁶ and 1.9 × 10⁻⁵ for the TeI4cand GsI-IIC thermostable group II intron RTs, respectively;Materials and Methods) and by the lack of antisense readsfor a variety of small ncRNAs in the plasma RNA-seq datasets described below.
A B
Adaptortrimming
Tophat
Bowtielocal
Combine andremap to
tRNA referenceMAPQ15 filter
Downstream analysis
Combinedreads
Unmappedreads
Mappedreads
Unmappedreads
Mappedreads
Trimmedreads
tRNAreads
Rawreads(1) Template-switching by TGIRT
Alkaline treatment cDNA clean-up
(2) Adaptor ligation bythermostable 5’ AppDNA/RNA ligase
R2 RNA 3’-Blocker
5’
5’
3’-N R2R DNA
5’ 3’OH Target RNA
5’
3’-N
3’OH
Target RNA cDNA TGIRT
cDNA clean-up
(3) PCR amplification
5’-App 3’-Blocker 5’ 3’ Target RNA cDNA R1R R2R
5’
3’ R2R
R2
Target RNA cDNA
P53’
5’
Barcode+P7
R1R
R1
FIGURE 1. TGIRT-seq overview. (A) RNA-seq library construction via TGIRT template-switching. TGIRT template-switching reverse transcriptionreactions use an initial template–primer substrate comprised of an RNA oligonucleotide, which contains an Illumina Read 2 primer-binding site (R2RNA) and has a 3′-blocking group, annealed to a complementary DNA primer (R2R DNA), which leaves an equimolar mixture of A, C, G, and T(denoted N) single-nucleotide 3′ overhangs. In the protocol used in the present work, the initial R2 RNA-R2R DNA substrate was mixed with targetRNA and TGIRT enzyme in the reaction medium, with the enzyme added last, and then pre-incubated for 30 min at room temperature prior to ini-tiating reverse transcription reactions by adding dNTPs. The reactions were incubated for 15 min at 60°C and terminated by alkaline treatment, asdescribed in Materials and Methods. The cDNA products were then purified with a MinElute Reaction Cleanup Kit (QIAGEN) and ligated at their 3′
ends to a 5′-adenylated/3′-blocked DNA oligonucleotide complementary to an Illumina Read 1 primer (R1R) by using a Thermostable 5′ AppDNA/RNA Ligase (New England Biolabs). The ligated cDNAs were repurified and amplified by PCR for 12 cycles to add Illumina flow cell capture sites (P5and P7) and barcode sequences for sequencing. (B) Mapping pipeline for RNA-seq data sets constructed with TGIRT enzymes. After trimming adapt-er sequences and reads with low quality base calls by using cutadapt, reads of ≥18 nt were mapped by TopHat and Bowtie2 (default settings) to ahuman genome reference sequence (Ensembl GRCh38 release 76) supplemented with additional rRNA gene contigs and other sequences (Pass 1)(see Materials and Methods). Unmapped reads from Pass 1 were then remapped to the same human genome reference sequence using Bowtie2 localalignment (default settings) to recover reads from RNAs with post-transcriptionally added nucleotides [e.g., 3′ CCA, poly(U)] or short introns (e.g.,tRNA introns; Pass 2). Concordant read pairs that mapped uniquely with MAPQ ≥15 from Passes 1 and 2 were combined and mapped to genomicfeatures. Reads that mapped to tRNA genes were filtered and combined with the reads that remained unmapped after the Bowtie2 local alignment, andremapped to human tRNA reference sequences (UCSC genome browser website) to achieve optimal recovery andmapping of tRNA reads. tRNA readswith MAPQ ≥1 were combined with mapped genome reads from the prior steps for downstream analysis.
Human plasma RNA-seq using TGIRT enzymes
www.rnajournal.org 3
Cold Spring Harbor Laboratory Press on February 1, 2016 - Published by rnajournal.cshlp.orgDownloaded from
Illumina Sequencing Library Preparation with TGIRT
• cDNA synthesis and adaptor attachment in one step
• No RNA-ligation • Strand specific
Qin and Yao et al. (2016) RNA
Intro
Differential expression
Summary
Sampling Bias
Total RNA

All RNA samples were of high quality as evaluated byBioanalyzer profiles (Supplemental Fig. S1A). For RNA-seqlibrary preparation, each replicate of Samples A–D wasribo-depleted to remove rRNAs and then fragmented withMg2+ at high temperature (NEBNext Magnesium RNA Frag-mentation Kit) to yield fragments of ∼100 nt, as judged byBioanalyzer traces (Supplemental Fig. S1B). Following frag-mentation, the RNAs were treated with T4 polynucleotide ki-nase under conditions that remove 3′ phosphates, whichimpede TGIRT template switching (Mohr et al. 2013). Halfof this processed RNA was then used as the input for RNA-seq library preparation via the TGIRT template-switchingmethod developed in our laboratory (Fig. 1B; Qin et al.2016). The remainder was stored for comparisons with a sec-ond TGIRT enzyme denoted TeI4c RT to be done later.The synthesis of cDNAs by TGIRT template switching in-
volves the direct extension of an initial RNA template/DNAprimer substrate comprised of an RNA oligonucleotide con-taining an Illumina Read 2 sequencing primer-binding site(R2 RNA) annealed to a complementary DNA (R2R DNA).The DNA primer has a single nucleotide 3′ overhang thatcan base pair with the 3′ end of the target RNA, resultingin a seamless junction between the cDNA and the RNA-seqadapter (Fig. 1B). For the construction of RNA-seq libraries
with minimal 3′-end bias, the single nu-cleotide 3′ overhang is an equimolarmix of A, C, G, and T nucleotides (denot-ed N; Mohr et al. 2013). The resultingcDNAs are then ligated to a DNA oligo-nucleotide containing the complementof an Illumina Read 1 sequencing prim-er-binding site (R1R DNA) followed by12 cycles of PCR, which synthesizes thesecond DNA strand and adds Illumina-compatible capture and index sequences.
TGIRT-seq libraries for Samples A–Dwere constructed in triplicate and se-quenced using the Illumina NextSeq500 platform, with each replicate gener-ating 51.6–88.5 million 75-nt paired-end reads. After trimming, the reads weremapped to the human genome (GRCh38version 76) in two steps, as describedin Materials and Methods (Qin et al.2016). The first step was end-to-endmapping using HISAT, which mapsmost of the reads and identifies splicejunctions. In the second step, unmappedreads from the first step were remappedby using Bowtie2 local alignment to im-prove the mapping of RNAs that havepost-transcriptionally added nucleotides(e.g., the 3′ CCA of tRNAs).
Overview of TGIRT-seq versus TruSeq v2and v3 RNA-seq data sets
Mapping statistics for TGIRT-seq libraries of human refer-ence RNA Samples A–D are summarized in Table 1 (for com-bined replicates of Samples A–D) and Supplemental Table S1(for individual replicates of Samples A–D) and compared topublished ABRF data sets generated from similarly preparedribo-depleted and fragmented high quality Samples A–D byusing either the non-strand-specific TruSeq v2 or thestrand-specific TruSeq v3 protocol (see Supplemental TableS2 for sample IDs; Li et al. 2014). In contrast to theTGIRT-seq data sets, the TruSeq data sets were generatedfrom libraries that used the entire yield of fragmented,ribo-depleted RNA for each replicate as input (roughly twicethat of the TGIRT-seq libraries) and were amplified by 15 cy-cles of PCR instead of 12 cycles for TGIRT-seq. The ABRF li-braries had been sequenced on the Illumina HiSeq platformand generated 87.3–217.6 million 50-nt paired-end reads forTruSeq v2 libraries and 46.6–92.4 million 50-nt paired-endreads for TruSeq v3. The TruSeq v2 data sets were obtainedin triplicate at three different sites (denoted L/R/V), whilethe TruSeq v3 data sets were obtained at one site (site W)in quadruplicate.
FIGURE 1. RNA sample and TGIRT-seq library preparation. (A) Sample A is composed ofUniversal Human Reference RNA (UHR) mixed with ERCC Spike-in Mix 1, and Sample B iscomposed of Human Brain Reference RNA (HBR) mixed with ERCC Spike-in Mix 2. SamplesA and B were mixed at ratios of 3:1 or 1:3 to constitute Samples C and D, respectively. (B)TGIRT-seq library preparation was carried out as previously described (Qin et al. 2016). RNAsamples were ribo-depleted to remove cytosolic and mitochondrial rRNAs, fragmented to pre-dominantly 70–100 nucleotides (nt) by incubating with Mg2+ at high temperature, and treatedenzymatically to remove the resulting 3′ phosphates (–3′ P), which block TGIRT template switch-ing. The fragmented RNA (wavy line) was then used as input for cDNA synthesis by TGIRT tem-plate switching, which primes cDNA synthesis from an initial RNA template (R2 RNA)/DNAprimer (R2R DNA) substrate that has a single nucleotide 3′ overhang (N, an equimolar mix ofA, C, G, and T) that can base pair with the 3′ end of the target RNA, seamlessly adding anRNA-seq adapter sequence (R2R) at the start of the cDNA (solid line). This is followed by ligationof a DNA oligonucleotide containing the second RNA-seq adapter sequence (R1R) to the 3′ endof the cDNA. Finally, cDNAs were amplified by PCR to add capture (P5/P7) and index sequencescompatible with Illumina sequencing.
TGIRT-seq of human RNA reference samples
www.rnajournal.org 3
Cold Spring Harbor Laboratory Press on January 29, 2016 - Published by rnajournal.cshlp.orgDownloaded from
ERCC mix (92 transcripts)
Nottingham and Wu et al (2016). RNAThermoFisher
Validation with MAQC SamplesIntro
Differential expression
Summary
Sampling Bias
Total RNA
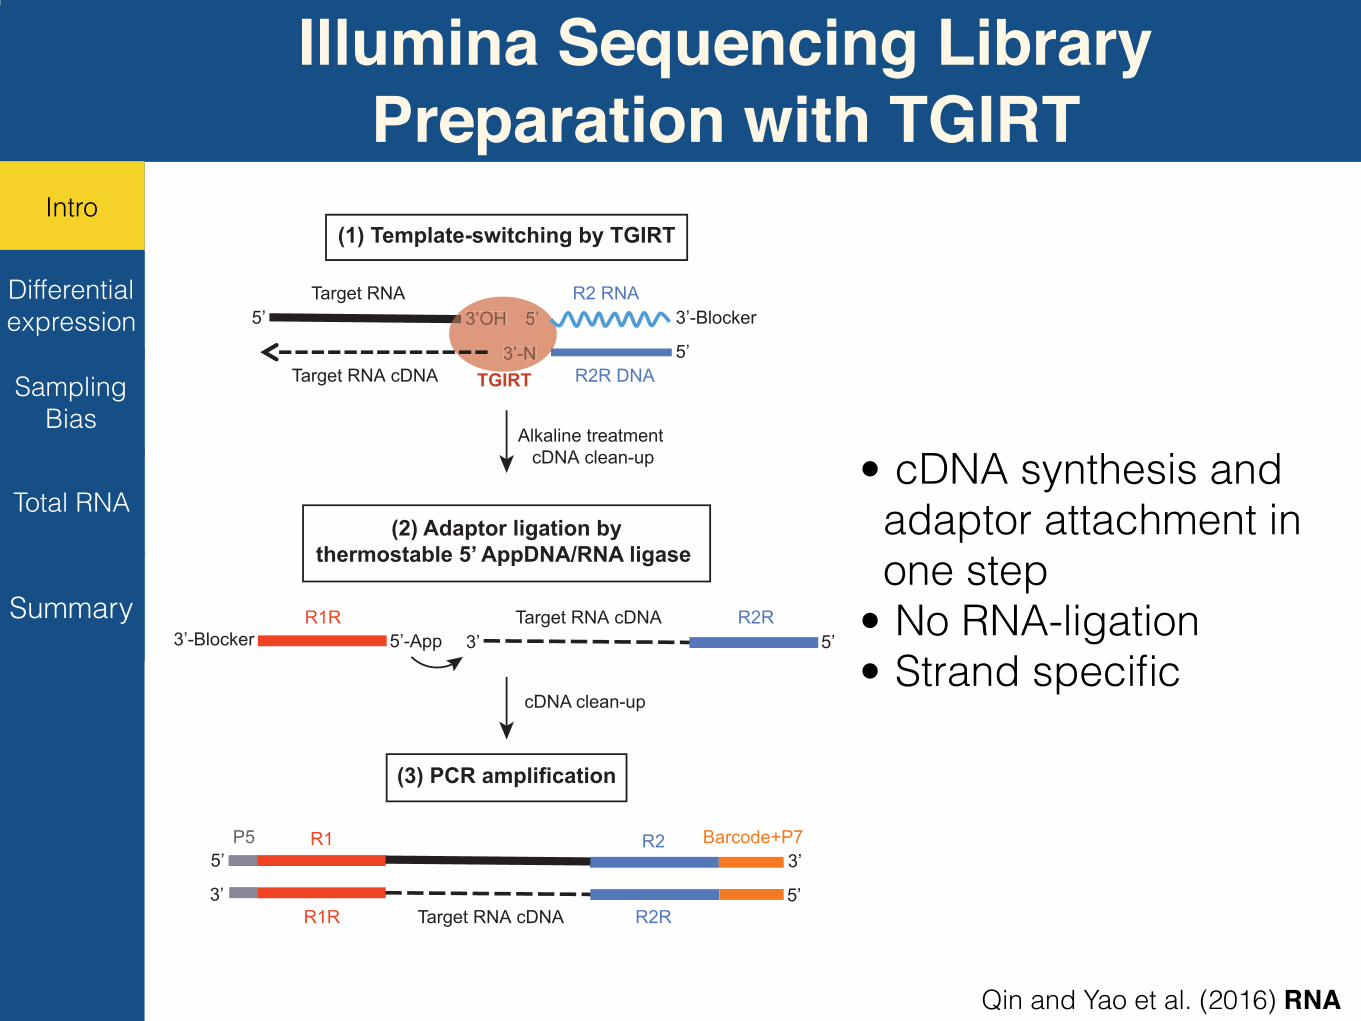
Relative abundance/Differential expression(Spike-in transcripts)
slightly lower than expected, while the TruSeq v3 librarieshad an observed mixing ratio slightly higher than expected,possibly reflecting small differences in hand mixing duringsample preparation. As expected, the mixing ratio was re-covered better for highly abundant transcripts than for lowerabundance transcripts (compare top 1% of transcripts [red]
versus bottom 75% of transcripts [gray]). Importantly, thedifference in relative abundance of protein-coding gene tran-scripts between Sample A and B determined by TGIRT-seqwas highly correlated with that determined by TaqManRT-qPCR of similarly prepared reference samples inthe MAQC study (MAQC Consortium 2006; Spearman
FIGURE 3. TGIRT-seq recapitulates the relative abundance of ERCC spike-ins added to human reference set RNAs. (A) Normalized read counts(fragments per kilobase per million mapped; FPKM) of each ERCC spike-in detected by ≥10 reads were plotted against their expected amountsin attomoles for combined data sets for different replicates obtained using different RNA-seq library preparation methods: (Left panels)TGIRT-seq; (middle panels) TruSeq v2 at sites L, R, and V; (right panels) TruSeq v3. The upper row displays data for ERCC Spike-in Mix 1 (inSample A), and the lower row displays data for ERCC Spike-in Mix 2 (in Sample B). Each dot represents a particular spike-in RNA. Pearson’s cor-relation coefficients (r) are shown on the graphs. Red lines at the bottom left indicate the lower limit of detection (LLD) in attomoles with a threshold ofFPKM= 1. (B) Observed fold differences between Mix 1 and Mix 2 of individual ERCC transcripts were plotted against the average of their expectedconcentrations in Samples A and B for each library preparation method: (left panel) TGIRT-seq; (middle panels) TruSeq v2; (right panel) TruSeq v3.Each RNA is color-coded to indicate its expected fold change according to the key shown at the bottom of the figure. Each colored line represents idealrecovery of the predicted fold change for each class of RNA. Root mean square error (RMSE) values are shown at the top.
TGIRT-seq of human RNA reference samples
www.rnajournal.org 7
Cold Spring Harbor Laboratory Press on January 29, 2016 - Published by rnajournal.cshlp.orgDownloaded from
Intro
Differential expression
Summary
Sampling Bias
Total RNA
Nottingham and Wu et al (2016). RNA

Relative abundance/Differential expression(Human genes)
Intro
Differential expression
Summary
Sampling Bias
Total RNA
Nottingham and Wu et al (2016). RNA

Strand-specificityIntro
Differential expression
Summary
Sampling Bias
Total RNA
panels). By the third nucleotide, however, the TGIRT-seqreads reverted to a relatively even distribution of all four nu-cleotides, while both TruSeq libraries showed nucleotide bi-
ases characteristic of random hexamerpriming (Hansen et al. 2010; Li et al.2014). At RNA 5′ ends, TGIRT-seq li-braries showed a high proportion of Uat the 5′-most nucleotide (position +1),which may reflect nontemplated addi-tion of an A residue to the 3′ end of thecDNA, and G at position +3, whichmay reflect a third position bias of theThermostable RNA/DNA Ligase usedfor adaptor ligation to the cDNAs (Jack-son et al. 2014), before reverting to rela-tively uniform nucleotide frequencies(Fig. 5C, upper left panel). In contrast,the TruSeq libraries have a high propor-tion of Cs at their 5′ ends (middle andlower left panels) and have biases up toposition +12, which are complementaryto the biases at the 3′ end of the readsand presumably result from random hex-amer priming of second-strand synthesis(Hansen et al. 2010). We conclude thatTGIRT template switching does not in-troduce substantial 3′-end bias and elim-inates biases due to random hexamerpriming that are inherent in TruSeq.
Gene coverage
Previous methods for constructingRNA-seq libraries using RNA fragmen-tation have been thought to give fairlyuniform coverage across protein-codinggenes (Mortazavi et al. 2008). However,in both TGIRT-Seq and TruSeq v2-gen-erated data sets, a higher proportion ofbases mapped to coding regions than inthe TruSeq v3 data sets, while TruSeqv3 reads had a higher proportion of basesmapping to introns. All three librarytypes gave similar proportions of basesmapping to mRNA 5′- and 3′-untranslat-ed regions (UTRs) and very low pro-portions of bases mapping to intergenicregions, indicating little contaminationby genomic DNA (Fig. 6A; SupplementalTable S1).
Further, comparison of base coveragefrom the 5′ to 3′ end of the one thousandmost abundant protein-coding geneRNAs in the combined data sets for eachmethod showed that TGIRT-seq libraries
gave better coverage of 5′-end sequences than did librariesprepared by either TruSeq protocol, while the strand-specificTruSeq v3 libraries overrepresented sequences at the 3′ ends of
FIGURE 5. TGIRT-seq is more strand specific than TruSeq v3 and eliminates biases due to ran-domhexamer priming. (A) Themean percentage of readsmapping to the correct annotated strandfor all protein-coding gene RNAs in combined data sets for different replicates was plotted for eachlibrary preparation method: (left panel) TGIRT-seq; (middle panel) TruSeq v2; (right panel)TruSeq v3. Error bars represent standard deviation. Asterisk indicates t-test P < 1.56 × 10⁻⁶ forthe difference in values between TGIRT-seq and TruSeq v3. (B) The mean percentage of readsmapping to the correct strand for ERCC spike-in RNAs was plotted for each library preparationmethod: (left panel) TGIRT-seq; (middle panels) TruSeq v2; (right panel) TruSeq v3. Error barsrepresent standard deviation. Double asterisk indicates t-test P < 2.45 × 10⁻⁶ for the differencein values between TGIRT-seq and TruSeq v3. TruSeq v2 data sets from all three sites (L/R/V)were combined for this analysis. (C) 5′ and 3′ end biases of different library preparation methods.The plots show the fraction of each nucleotide at each of the first 15 bases of Read 1 (equivalent tothe 5′ end of the RNA sequence) and the first 15 complementary bases of Read 2 (equivalent to the3′ end of the RNA sequence) after adapter trimming. (Upper panel) TGIRT-seq; (middle panel)TruSeq v2; (lower panel) TruSeq v3. TGIRT-seq shows similar 3′-nuclotide biases to TruSeqbut different 5′-nucleotide biases. The latter may reflect different patterns of nontemplated nucle-otide addition at the 5′ end of trimmed reads, preferred termination sites for the RTs, or biases in-troduced by DNA ligase for addition of the second RNA-seq adapter at the 3′ end of the cDNA.TGIRT-seq shows less bias than TruSeq at nucleotide positions 4–12 from the 5′ or 3′ ends, whichare likely introduced by random hexamer priming in the TruSeq methods (Hansen et al. 2010).TruSeq v2 data sets from all three sites (L/R/V) were combined for this analysis.
TGIRT-seq of human RNA reference samples
www.rnajournal.org 9
Cold Spring Harbor Laboratory Press on January 29, 2016 - Published by rnajournal.cshlp.orgDownloaded from
Nottingham and Wu et al (2016). RNA

these genes as reported previously (Fig. 6B; Li et al. 2014).Although TGIRT enzymes were shown previously to give bet-ter representation of 5′-proximal sequences than a retroviralRT in RNA-seq libraries prepared by oligo(dT) priming(Mohr et al. 2013), their ability to do so in RNA-seq librariesprepared from fragmented RNAwas surprising. These differ-ences may reflect a combination of somewhat shorter RNAfragment size in the TGIRT-seq libraries, which results inmore frequent sampling across RNA molecules (Mortazaviet al. 2008; Oshlack and Wakefield 2009), and the highprocessivity and strand displacement of the TGIRT enzymeoperating at 60°C, which enables it to reverse transcribe con-tinuously and through structured regions to the 5′ ends ofeven short RNA fragments more frequently than can retrovi-ral RTs operating at lower temperature (Mohr et al. 2013).
Detection of different mRNA species and splicejunctions
In both TGIRT-seq and TruSeq data sets, the large majorityof unique read pairs mapped to protein-coding genes (Fig.2A; Supplemental Table S3). When normalized for readdepth and with reads clipped to the same length, TGIRT-seq and TruSeq v2 detected more protein-coding gene tran-scripts and more annotated splice junctions than did TruSeqv3 (Fig. 7A,B, respectively). Closer analysis revealed that theTGIRT enzyme detected more splice junctions near the5′ end of mRNAs than either TruSeq method (Fig. 7C), con-sistent with the better representation of 5′ RNA ends in theTGIRT-seq libraries.
Comparison of Sashimi plots generated by the IntegrativeGenomics Viewer (IGV) for abundant protein-coding geneRNAs in TGIRT-seq and TruSeq v3 data sets (Sample A—UHR) shows substantial increases in reads detecting the 5′-
most splice junctions, as well as addi-tional junctions detected throughoutthe genes in the TGIRT-seq data sets(Fig. 8). Strikingly, TGIRT-seq also de-tected abundant reads correspondingto snoRNAs encoded within introns inribosomal protein genes, whereas theseembedded snoRNAs were not readilydetected by TruSeq v3 (Fig. 8, boxed re-gions for RPS8 and RPL17).Analysis of detected splice sites showed
that TGIRT-seq and TruSeq v3 detectedannotated and unannotated splice junc-tions, which were overwhelmingly ca-nonical GU–AG junctions (>90%), withrelatively few U12-type splice junctions(AU-AC, <0.1%; Supplemental Fig.S5A,B). The TruSeq v3 data sets showeda higher proportion of junctions thatwere the antisense to annotated junc-tions, consistent with a higher propor-
tion of cDNA recopying by the retroviral RT, even in thepresence of actinomycin D (Fig. 7D, green). Examinationof these junctions showed that they are the exact comple-ment of the annotated junctions and part of longer antisensereads that are not present in the TGIRT-seq data sets(Supplemental Fig. S6A,B). Both methods identified a lowproportion of novel junctions with noncanonical splicesites of unknown significance, with the proportion of suchreads appearing somewhat higher for TGIRT-seq (Fig. 7D,purple).
Profiles of small ncRNAs in TGIRT-seq libraries
A major difference between TGIRT-seq and TruSeq v2 andv3 libraries is the greater coverage of structured smallncRNAs by TGIRT-seq (Fig. 2B; Supplemental Table S3).To assess the ability of TGIRT-seq to quantitate smallncRNAs, we analyzed the titration order of small ncRNAsthat are differentially expressed between Samples A and B,as done previously for protein-coding gene transcripts (seeFig. 4A). As shown in Supplemental Figure S7, we foundthat the majority of all classes of small ncRNA analyzed(tRNAs, snoRNAs, snRNAs, miRNAs, Y-RNAs, and VaultRNAs) followed the expected titration order between sam-ples, albeit to different degrees for different RNA classes.Figure 9 shows profiles of small ncRNAs detected by
TGIRT-seq in Sample A and Sample B rank-ordered by rel-ative abundance. Each class of RNA shows a skewed distribu-tion, with a few predominant species followed by a longer tailof less abundant species. Glu tRNAs were the most abundanttRNA in both the UHR and HBR sets with >40% and 30% oftRNA reads mapping to Glu tRNAs with anticodon CTC(Fig. 9A). Read alignments via IGV showed that most ofthe tRNAs are fragmented by the library preparation
FIGURE 6. TGIRT-seq data sets show more uniform gene coverage than TruSeq data sets. (A)The percentage of bases of protein-coding genes classified as coding, intergenic, intronic, and un-translated region (UTR) was plotted for combined replicate data sets for each library preparationmethod: (left panel) TGIRT-seq; (middle panel) TruSeq v2; (right panel) TruSeq v3. Error barsrepresent the standard deviation. (B) The normalized coverage of the 1000 most abundant pro-tein-coding gene transcripts is plotted against normalized gene position from the 5′ (left) to the 3′
(right) end of the RNA transcript for combined replicate data sets for each library preparationmethod. Error bars represent standard deviation.
Nottingham et al.
10 RNA, Vol. 22, No. 4
Cold Spring Harbor Laboratory Press on January 29, 2016 - Published by rnajournal.cshlp.orgDownloaded from
Sampling Bias and Gene Coverage
1. More uniform gene coverage 2. Higher relative abundance of 5’ junctions
Intro
Differential expression
Summary
Sampling Bias
Total RNA
procedure as expected, but have 3′ termini corresponding tothose expected for mature tRNAs with post-transcriptionallyadded CCA tails (Supplemental Fig. S8). Certain base modi-fications were detected by distinctive patterns of nucleotidemisincorporation, as described previously (Auffinger andWesthof 1998; Katibah et al. 2014), including the highly con-
served 1-methyladenosine (m1A) at A58and 1-methylguanosine (m1G) at G9 iniMet-CAT and at G37 in Leu-CAG.
Similar analysis of snoRNAs (Fig 9B)and snRNAs (Fig. 9C) showed a broaddistribution of snoRNA species in eachsample, while the RNU2-2P accountedfor 30%–40% of reads mapping tosnRNAs in both Samples A and B. Readalignments of snoRNAs and snRNAs re-vealed that these transcripts were frag-mented by the Mg2+ treatment of theRNAs but had coverage profiles extend-ing the full-length of the mature RNA(Supplemental Figs. S9, S10). Many ofthe miRNA detected when mapping tothe genome were annotated as predictedbut not validated miRNAs (not shown).However, mapping of the TGIRT-seqreads to miRBase detected validatedmiRNAs, with miR-125b-5p being oneof the most abundant in both SamplesA and B (Fig. 9D). Read alignments ofthe miRBase-mapped miRNAs showedmainly full-length mature miRNAs,with some (e.g., let7a-5p) showing post-transcriptionally added 3′ A and U,which may influence miRNA functionor stability (Supplemental Fig. S11A;Burroughs et al. 2010; Wyman et al.2011; Koppers-Lalic et al. 2014). Finally,TGIRT-seq detected both Y-RNA andVault RNAs (Fig. 9E,F). Read alignmentplots of Y-RNAs showed that these spe-cies mostly shared common 3′ ends(Supplemental Fig. S11B), while VaultRNAs showed a mixture of mature3′ ends and 3′-end extensions, particu-larly for VTRNA1-2 and VTRNA1-3(Supplemental Fig. S11C).
DISCUSSION
The TGIRT-seq data sets obtained herefor well-characterized human RNA ref-erence samples validate this methodand indicate that it has several advantag-es compared to the widely used TruSeqmethods for transcriptome profiling.
These advantages include simplicity, rapid processing time,efficacy with very small amounts of RNA (previously dem-onstrated for human plasma RNAs; Qin et al. 2016), andsignificantly higher strand specificity than TruSeq v3.The higher strand specificity of TGIRT-seq is shown by thehigher proportion of reads mapping to the correct strand
FIGURE 7. TGIRT-seq detects more transcripts and splice junctions than does TruSeq. (A,B)The number of protein-coding gene transcripts and annotated splice junctions detected as a func-tion of mapped reads for combined data sets for Samples A–D for each library preparation meth-od. The TruSeq v2 libraries were down-sampled to match the sequencing depth of TGIRT-seqand TruSeq v3 libraries. Shaded areas represent 95% confidence intervals for the predicted fit.(C) Splice junction density plotted versus relative distance from the 5′ end of protein-codinggene RNAs for combined data sets for Samples A–D for each library preparation method. (D)Distribution of splice junction types for replicates of Samples A and B for TGIRT-seq andTruSeq v3. Antisense to annotated junctions are exact complements on the opposite strand ofthe annotated junctions. Novel junctions are those for which no annotation currently exists inthe reference genome used.
TGIRT-seq of human RNA reference samples
www.rnajournal.org 11
Cold Spring Harbor Laboratory Press on January 29, 2016 - Published by rnajournal.cshlp.orgDownloaded from
Nottingham and Wu et al (2016). RNA

Total RNA recovery
of protein-coding genes (Fig. 5A) and RNA spike-ins (Fig.5B), and by the lower frequency of antisense reads of an-notated mRNA splice junctions, which are surprisinglyabundant in the TruSeq v3 data sets (2.97 ± 1.58% ofsplice-junction reads for all replicates; Fig. 7D). We alsofind that the TGIRT-seq data sets obtained here show
more uniform 5′ to 3′ gene coverage and detect more splicejunctions, particularly near the 5′ ends of mRNAs, than dothe published TruSeq data sets. And finally, a major advan-tage of TGIRT-seq is the ability to profile protein-codingand lncRNAs together with small ncRNAs in the same se-quencing run.
FIGURE 8. Enrichment for 5′ proximal splice junctions by TGIRT-seq. IGV screen captures of Sashimi plots for protein-coding gene transcripts fromSample A2 for both methods (Universal Human Reference: FTL, RPS8, RP17A, PTPN1, PSMD4, and SNX27). (Upper plot for each gene) TGIRT-seq;(lower plot for each gene) TruSeq v3. Genes are identified by name above their gene maps, which are displayed at top in blue, with exons depicted asrectangular boxes and introns depicted as lines. Splice junctions are depicted in Sashimi plots as arcs between exons. The height and thickness of eacharc depict the depth of coverage for that particular junction. Splice junctions in the sense strand are displayed in maroon, and those in the antisensestrand are displayed in blue (e.g., TruSeq RPS8 gene). Read alignments are shown belowwith reads from eachmethod colored gray and splice junctionsdepicted as thin blue bars between gray reads. Reads corresponding to snoRNAs encoded in introns in ribosomal protein genes are shown in boxesalong with the snoRNA name.
Nottingham et al.
12 RNA, Vol. 22, No. 4
Cold Spring Harbor Laboratory Press on January 29, 2016 - Published by rnajournal.cshlp.orgDownloaded from
Intro
Differential expression
Summary
Sampling Bias
Total RNA
Nottingham and Wu et al (2016). RNA

Total RNA recovery
the three methods was similar with TGIRT-seq having aroughly twofold lower limit of detection when compared tothe TruSeq libraries at a threshold of 1 FPKM (fragmentsper kilobase per million mapped reads). TruSeq v2 librarieshad a slightly higher number of detected spike-in species,likely due to their greater sequencing depth (SupplementalTable S1).
Second, each of the 92 polyadenylated ERCC spike-in tran-scripts is grouped into one of four classes (0.5:1, 0.67:1, 1:1,4:1) according to the relative abundance of the spike-in be-tweenMix 1 (SampleA) andMix 2 (Sample B). TGIRT-seq re-capitulated these differences in abundance better than thestrand-specific TruSeq v3 method and almost as well as thenon-strand-specific TruSeq v2 method (Fig. 3B). ForTGIRT-seq and TruSeq v2, empirical fold-change ratioswere more highly correlated with their expected values forabundant spike-ins (those to the right of each panel), as previ-ously observed for TruSeq v2 (SEQC/MAQC-III Consortium
2014), whereas empirical fold-change ratios were poorly cor-related with their expected values for TruSeq v3 (Fig. 3B).Third, the mixing of Samples A and B to constitute
Samples C and D defines an expected order of dilution ofthe human reference set RNAs. For both TGIRT-seq andTruSeq v3 (Samples C and D were not analyzed by TruSeqv2 in the ABRF study), most protein-coding gene transcriptsfollowed a consistent titration order, with those following in-consistent order corresponding to transcripts with small foldchanges between Samples A and B (Fig. 4A). For both meth-ods, there was also a slight bias toward inconsistent titrationorder for transcripts higher in B than in A (tail on right side ofthe red peak).More detailed analysis of protein-coding gene transcripts
detected by TGIRT-seq and TruSeq v3 in Samples A–D(Fig. 4B) revealed that both protocols performed similarlyin recovering the known mixing ratios between samples.The TGIRT-seq libraries had an observed mixing ratio
FIGURE 2. TGIRT-seq reads mapmostly to protein-coding genes but with greater representation of small ncRNAs than TruSeq libraries. (A) Stackedbar graphs showing the percentage of uniquely mapped reads for each class of annotated genomic features in Ensembl GRCh38 release 76, GenomictRNA Database, and piRNABank (Qin et al. 2016) for different library preparation methods for numbered replicates of Samples A–D. (B) Stacked bargraphs showing the percentage of small noncoding RNA reads that map to different classes of small ncRNAs for different library preparation methodsfor numbered replicates of Samples A–D. MiscRNA includes ribozymes, such as RNase P RNA, imprinted transcripts, such as Xist, and other tran-scripts that cannot be classified into other RNA annotation categories. (Left panels) TGIRT-seq; (middle panels) TruSeq v2 (from ABRF at three dif-ferent sites, L/R/V); (right panels) TruSeq v3 (from ABRF at site W). Features and small ncRNA classes are color coded as indicated to the right of thebar graphs.
Nottingham et al.
6 RNA, Vol. 22, No. 4
Cold Spring Harbor Laboratory Press on January 29, 2016 - Published by rnajournal.cshlp.orgDownloaded from
Intro
Differential expression
Summary
Sampling Bias
Total RNA
Nottingham and Wu et al (2016). RNA
Intro
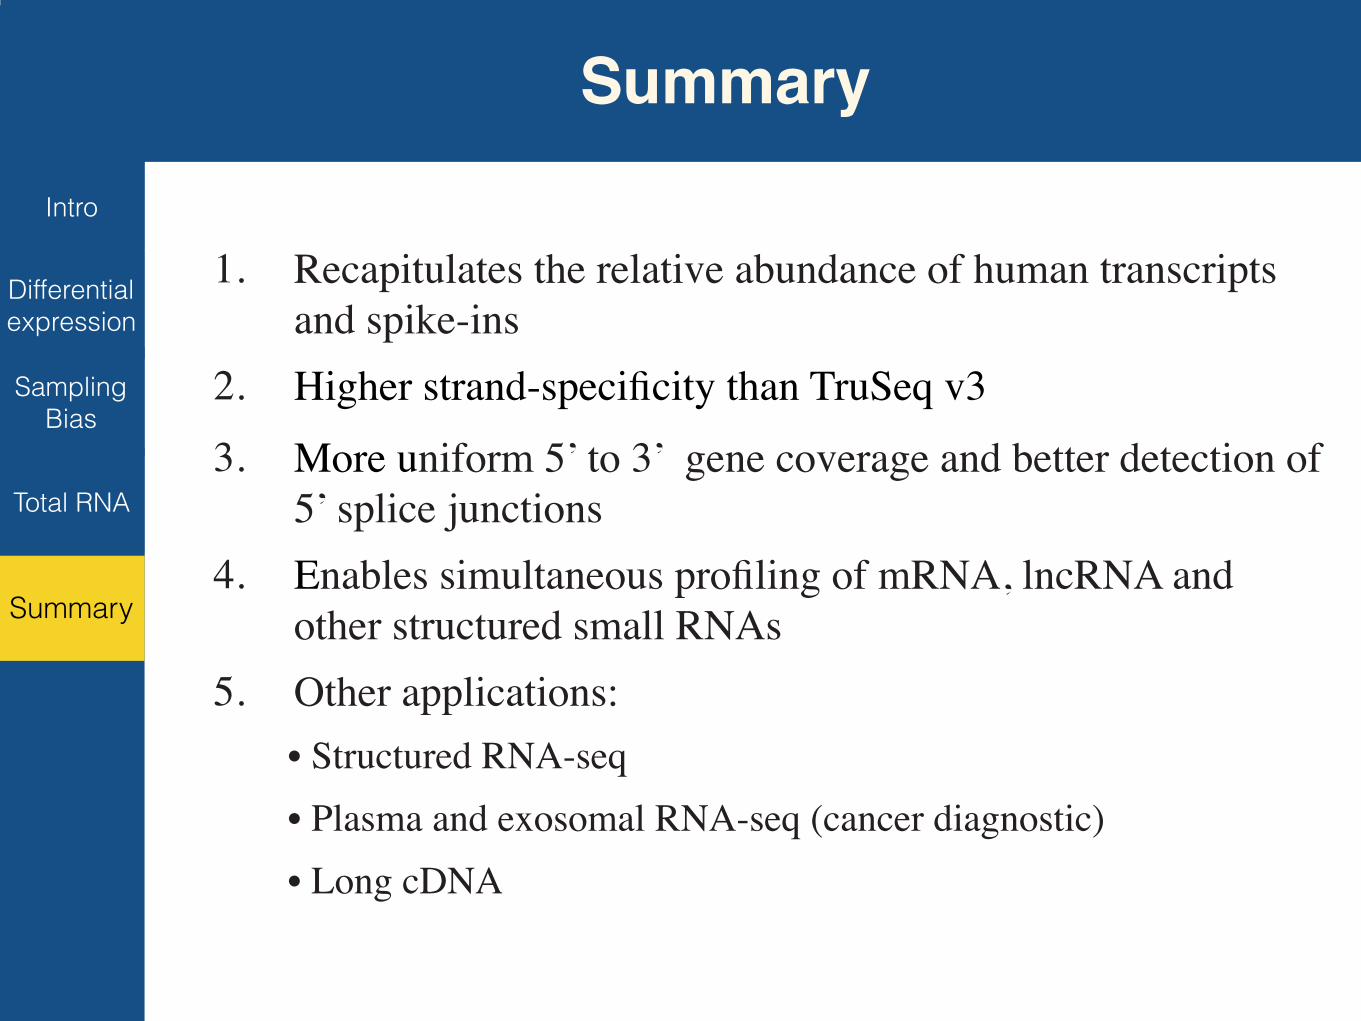
Summary
1. Recapitulates the relative abundance of human transcripts and spike-ins
2. Higher strand-specificity than TruSeq v33. More uniform 5’ to 3’ gene coverage and better detection of
5’ splice junctions 4. Enables simultaneous profiling of mRNA, lncRNA and
other structured small RNAs5. Other applications:
• Structured RNA-seq• Plasma and exosomal RNA-seq (cancer diagnostic)• Long cDNA
Differential expression
Summary
Sampling Bias
Total RNA
Acknowledgement
Lambowitz LabRyan Nottingham, Ph.D. Yidan Qin, almost Ph.D. Jun Yao, Ph.D. Sabine Mohr, Ph.D and other lab members.
GSAFScott Hunicke-Smith, Ph.D. and members of GSAF
Professor Vishy IyerArticle: Ryan M. Nottingham*, Douglas C. Wu*, Yidan Qin, Jun Yao, Scott Hunicke-Smith, and Alan M. Lambowitz (2016). RNA-seq of human reference RNA samples using a thermostable group II intron reverse transcriptase. RNA.Codes: https://github.com/wckdouglas/tgirtERCC.git Slides: http://www.slideshare.net/DouglasWu1/highthrouput-rna-sequencing-with-thermostable-group-ii-intron-reverse-transcriptase