High Temperature Fuel Cell Tri-Generation of Power, Heat & H from ...
45
© National Fuel Cell Research Center, 2012 1/35 High Temperature Fuel Cell Tri-Generation of Power, Heat & H 2 from Waste Jack Brouwer, Ph.D. December 6, 2012 AEE SoCal Chapter Monthly Luncheon
Transcript of High Temperature Fuel Cell Tri-Generation of Power, Heat & H from ...

© National Fuel Cell Research Center, 2012 1/35
High Temperature Fuel Cell Tri-Generation
of Power, Heat & H2 from Waste
Jack Brouwer, Ph.D. December 6, 2012
AEE SoCal Chapter Monthly Luncheon

© National Fuel Cell Research Center, 2012 2/35
Outline
• Introduction and Background
• Tri-Generation/Poly-Generation Analyses
• OCSD Project Introduction
• OCSD Project Performance
• Summary

© National Fuel Cell Research Center, 2012 3/35
Introduction and Background
• Hydrogen fuel cell vehicle performance is outstanding
• Energy density of H2 is much greater than batteries
• Rapid fueling, long range ZEV
• H2 must be produced
• energy intensive, may have emissions, fossil fuels, economies of scale
• Low volumetric energy density of H2 compared to current
infrastructure fuels (@ STP)
• H2 handling (storage, transport and dispensing) can be energy and
emissions intensive
An emerging strategy is poly-generation
of hydrogen, heat and power from a
high-temperature fuel cell (HTFC)
There is a need for a distributed,
high-efficiency, low emissions hydrogen
production method able to use a
variety of feedstocks

© National Fuel Cell Research Center, 2012 4/35
Tri-Generation Energy Station Concept 1, 2, 3
Locally
available
feedstock:
Natural Gas,
ADG,
Landfill Gas, ….
Electricity
Heat
Hydrogen
Energy Station Concept Introduction and Background
1 Brouwer et al., 2001; 2 CHHN Blueprint Plan, 2005; 3 Leal and Brouwer, 2006

© National Fuel Cell Research Center, 2012 5/35
Introduction and Background
Poly-generation of Power, Heat and H2
• Advantages: 4, 5, 6
• H2 production is at the point of use averting emissions and energy
impacts of hydrogen and electricity transport
• Fuel cell produces sufficient heat and steam as the primary inputs
for the endothermic reforming process
• Synergistic impacts of lower fuel utilization increase overall
efficiency (i.e., higher Nernst Voltage, lower polarization losses,
lower cooling requirement and associated air blower parasitic load)
• Potential Disadvantage:
• Distributed production may not be compatible with carbon
sequestration
4 Leal and Brouwer, 2006; 5 O’Hayre, R., 2009; 6 Margalef et. al, 2008

© National Fuel Cell Research Center, 2012 6/35
High Temperature Fuel Cell (HTFC) Stack
• Solid Oxide Fuel Cell Example
Introduction and Background
CH4+H2O 3H2+CO
2H2+O2- 2H2O + 4e-
O2 + 4e- 2O2-
Electrolyte
Reformation rxn
Fuel cell rxn
AN
C
AT
H
load
Stack Operating Temperature Range = 650oC to 950oC
HE
AT
{CH4, H2O}
O2 Depleted
Air
O2(Air)
{H2, CO,
CO2}
{H2}
HE
AT
• Fuel Utilization Factor (Uf) = ~ 85%
• Air Utilization Factor = ~ 15 %
~ 60%
~ 30%
O2-

© National Fuel Cell Research Center, 2012 7/35
Outline
• Introduction and Background
• Tri-Generation/Poly-Generation Analyses
• OCSD Project Introduction
• OCSD Project Performance
• Summary

© National Fuel Cell Research Center, 2012 8/35
~
C.C.
CH4 Air
Exhaust
gases
1
Water
S O F C
2
3
4
7 8
9
6
5
CH4
H2
H2O
Reformer
(1)
CH4
H2
H2O
Reformer
(2)
CH4
H2
H2O
Reformer
(3)
CH4
H2
H2O
Reformer
(4)
~
C.C.
Exhaust
gases
1
S O F C
2
3
4
7 8
9
6
5
CH4
H2
H2O
Reformer
(1)
CH4
H2
H2O
Reformer
(2)
CH4
H2
H2O
Reformer
(3)
CH4
H2
H2O
Reformer
(4)
Placement of a reformer in different locations:
Configuration 1 reformer after the air preheater,
Configuration 2 reformer after the water preheater,
Configuration 3 reformer after the natural gas preheater,
Configuration 4 reformer after the combustion chamber.
Cycle Configurations Air Water Natural Gas

© National Fuel Cell Research Center, 2012 9/35
Configuration 5: External reforming with
combustion chamber after the air preheater.
15
~
S O F C
H2
H2O
C.C.
Water Air
7
10
CH4
CH4
8
3
2
9
4 6
REF
11 12
Exhaust gases 13
14 16
5
1
Configuration 6: Internal reforming
1
C.C.
~
S O F C
H2
8 7
13
9
H2O CH4 Air
Exhaust gases
11
12
2 6 4
5 3
10
Cycle Configurations

© National Fuel Cell Research Center, 2012 10/35
0.00
0.50
1.00
1.50
2.00
2.50
3.00
3.50
1 (S
/C=2
)
1 (S
/C=3
)
2 (S
/C=2
)
2 (S
/C=3
)
3 (S
/C=2
)
3 (S
/C=3
)
4 (S
/C=2
)
4 (S
/C=3
)
5 (S
/C=2
)
5 (S
/C=3
)
6 (S
/C=2
)
6 (S
/C=3
)
Configurations
Hy
dro
ge
n p
rod
uc
tio
n [
g/s
]
0%
10%
20%
30%
40%
50%
60%
70%
80%
90%
Fir
st
La
w E
ffic
ien
cy
Hydrogen production Electrical efficiency Thermal efficiency Overall efficiency
Thermodynamic Analyses
• Energy performance analysis

© National Fuel Cell Research Center, 2012 11/35
0
1000
2000
3000
4000
5000
6000
7000
8000
0
0.1
0.2
0.3
0.4
0.5
0.6
0.7
0.8
0.9
1
1.1
1.2
1.3
0 1000 2000 3000 4000 5000 6000 7000 8000 9000 10000
Po
we
r D
en
sit
y [
W/m
2]
Cell
vo
ltag
e [
Vo
lts]
Current Density [A/m2]
Electrochemical heat at different utilization factors (P=5000 A/m2)
0.4 0.6 0.8 EMF 0.4 0.6 0.8
Poly-Generation Analyses
Electrochemical
Heat
]kW[hΔnV
)VV(Heat fH
max
cellmax
2
• Synergy #1: Electrochemical heat & voltage
Fuel Utilization Values

© National Fuel Cell Research Center, 2012 12/35
• Electrochemistry & Reformation Synergy #2 – Air Flow
30
40
50
60
70
80
90
100
0.4 0.5 0.6 0.7 0.8
Air
flo
w in
[km
ol/
hr]
Fuel Utilization Factor
Factor #1 electrochem.
heat
Poly-Generation Analyses
Factor#2 reformation
cooling

© National Fuel Cell Research Center, 2012 13/35
• EXAMPLE: Efficiency of a Poly-Generating Hydrogen
Energy Station (H2ES) without valuing heat
Poly-Generation Analyses
Electricity
production with
state-of-the-art
natural gas
combined cycle
Centralized SMR
Plant
(H2 production)
(Case: H2ES)
Poly-generating
HTFC
Fuel
Fuel
Fuel
Electricity
Hydrogen
η el,1 = 61.2%η el,2 = 51.7%η el,3 = 58.4%
η H2,1 = 80.9%η H2,2 = 54.9%η H2,3 = 83.5%
η el,pp = 60%
η H2,SMR = 79%
ηtot = 69.5%

© National Fuel Cell Research Center, 2012 14/35
Poly-Generation Dynamic Analyses
0 0.2 0.4 0.6 0.8 10
250
500
750
1000
Po
wer
[kW
]
0 0.2 0.4 0.6 0.8 10
20
40
H2 in
Tan
k [
kg
]
12:00 AM 6:00 AM 12:00 PM 6:00 PM 12:00 AM0.5
1
1.5
2
2.5
3
3.5
H2/C
O o
ut
of
co
llecto
r[g
/s]
H2
CO
• Diurnal dynamic operation of SOFC
• Hydrogen tank fills forcing end of tri-generation
• Control of system temperatures during transient is possible
12:00 AM 6:00 AM 12:00 PM 6:00 PM 12:00 AM950
1000
1050
1100
1150
1200
1250
1300
Tem
p [
K]
Tan,in
Tca,in
Tca,out
Tan,out

© National Fuel Cell Research Center, 2012 15/35
Outline
• Introduction and Background
• Tri-Generation/Poly-Generation Analyses
• OCSD Project Introduction
• OCSD Project Performance
• Summary

© National Fuel Cell Research Center, 2012 16/35
STORAGE
TANK
ADG
HOT
WATER
HEAT
EXCHANGER ANAEROBIC
DIGESTION
GAS HOLDER
SLUDGE
DIGESTER
BOILER
HYDROGEN HYDROGEN
STORAGE
HYDROGEN
DISPENSER
FUEL
TREATMENT
AC
POWER
HIGH-T
FUEL CELL
World’s First Demonstration
• Orange County Sanitation District
• Euclid Exit, I405, Fountain Valley
• Support: DOE, ARB, AQMD
Renewable Tri-Generation of Power, Heat & H2
Sponsors/Participants:

© National Fuel Cell Research Center, 2012 17/35
OCSD Project – World’s First
• Installation complete, Operation on natural gas (6 months),
ADG operation underway for ~1 year
Renewable H2
Filling Station
ADG fueled
DFC-H2 ®
Production Unit

© National Fuel Cell Research Center, 2012 18/35
FCE
Equipment
Air Products
Equipment
Anode
Exhaust
Skid
DFC
(Direct
Fuel
Cell)
ADG Clean-
up Skid
Syngas
Compressor
Skid PSA Skid (pressure swing
absorption)
Compressor
Skid
Hydrogen
Storage
Tubes
Inverter
&
Electrical
BoP
Mechanical
BoP

© National Fuel Cell Research Center, 2012 19/35
Renewable Fuel Flexibility
Anaerobic Digester Gas (ADG) Clean-up
• Sulfur compounds: e.g., H2S, COS, ethers, thioketones,
mercaptans – all catalyst poisons
• Siloxanes – e.g., hexamethylcyclotrisiloxane (D3 =
((CH3)2SiO)3), octamethylcyclotertrasiloxane (D4),
decamethylcyclopentasiloxane (D5) – break down into
amorphous silica when heated, covering catalytic surfaces
• Halogens – catalyst poison, toxic
• Heavy metals – e.g., Cd, As, Hg, Pb – toxic, plate out to
cover surfaces
• High MW volatile organic compounds - coking

© National Fuel Cell Research Center, 2012 20/35
Need Robust ADG Clean-Up
• Gas composition variability data summarized
• FuelCell Energy developed rigorous design specifications
• Allow use of H2 in the clean-up system design for first time
• Quadrogen produced the winning bid
• Very robust & reliable system
• Siloxanes removed by -10°F temperature (Pioneer System),
water condensation and removal
• Sulfur compounds removed by HDS/zinc-oxide
• Polisher beds for both siloxanes and sulfur compounds
• Factory acceptance test passed in April, 2011
• Site installation and start-up successful in June 2011
• Only minor outages due to the clean-up skid

© National Fuel Cell Research Center, 2012 21/35
DFC® Fuel Cell
• CO2 Diluent in Biogas
inhibits FC Anode
Performance – all fuel
cells
• DFC® has improved
Cathode Performance
• CO2 neutral techology
High Temperature Internal Reforming
Direct FuelCell®
CH 4 + 2H 2 O 4H 2 + CO 2
Anode
Catalyst
CATALYST CATHODE
Electrolyte
Internal Reforming
H 2 + CO 3 H 2 O + CO 2 + 2e =
= 1/2O 2 + CO 2 + 2e CO 3
Steam
Hydrocarbon Fuel
e.g. Natural Gas / Coal Gas
Air
-

© National Fuel Cell Research Center, 2012 22/35
Increase robust operation and system availability
0
5
10
15
20
25
30
0 10 20 30 40 50
Dig
este
r P
ressure
0
50
100
150
200
250
300
0 10 20 30 40 50
Pow
er,
kW
0
50
100
150
200
250
300
0 10 20 30 40 50
Pow
er,
kW
P
ow
er,
kW
0
50
100
150
200
250
300
0 10 20 30 40 50
0
10
20
30
40
50
60
70
80
90
100
Power, kW
DG Flow, scfm
NG flow, scfm
Flo
w,
scfm
• Anaerobic Digester Gas (ADG)
Availability Naturally Fluctuates
• Initial plant response trip offline
• Automated fuel switching/blending
developed
• With fuel switching/blending, full load is
maintained and rapid recovery from
trips supported
Automated Fuel Switching/Blending

© National Fuel Cell Research Center, 2012 23/35
Hydrogen Co-Production
“Hydrogen Booster” Anode Off-Gas Shift Reactors, water
removal
• Use water-gas-shift (WGS) reaction (CO + H2O(g) → CO2 + H2)
• Also includes Regenerative Heat Removal (heat transfer)
• Overall impact is to increase hydrogen concentration to meet
the inlet requirements of the PSA and reduce the parasitic
separation load of the PSA
• Also includes water condensation and drop-out (removal)
• WATER INDEPENDENT

© National Fuel Cell Research Center, 2012 24/35
Hydrogen Purification
Hydrogen Purification from dilute low-pressure stream:
• Improvement in hydrogen purification cycle:
• Phase 1: 300 psig inlet, 75% H2 recovery
• Phase 3: 150 psig inlet, > 85% H2 recovery
• Patent issued to APCI (13 April 2010)
US Patent 7,695,545

© National Fuel Cell Research Center, 2012 25/35
Hydrogen Pipeline
• More than
1000 ft. long
• SS tubing
• Into utility
tunnel
• Underground
• Along Santa
Ana river fence
• To fueling
station

© National Fuel Cell Research Center, 2012 26/35
Hydrogen Fueling Station
• Dispenses at 35 and
70 MPa (5000 and
10,000 psi)
• Fully compliant with
SAE standards for
rapid fueling
• 3-minute 6kg fill
(empty -> full for
typical FCV)
• Pre-cooling down to
-40oC before
dispensing
• IR communications in nozzle
• High pressure compression and high pressure storage

© National Fuel Cell Research Center, 2012 27/35
Outline
• Introduction and Background
• Tri-Generation/Poly-Generation Analyses
• OCSD Project Introduction
• OCSD Project Performance
• Summary

© National Fuel Cell Research Center, 2012 28/35
Steady State performance examples – Power & H2 only
• Overall efficiency 54.5% (Factory Test 8/28/09)
DFC @ 200 kW net AC
(without PSA)
Syngas 886 lb/hr
A/E
Skid PSA
225 kW
Gross AC + -
159 kW
Export to Grid
8.3 kW 39.4 kW Comp A Only
12.3 scfm
(3.9 lb/hr)
Hydrogen
Natural Gas 29.8 scfm, 491 kW eq.
Water 171 lb/hr, 60.2 scfm
19.8 scfm CO2
ADG Simulation
Syngas 407 lb/hr
Syngas 479 lb/hr
CO2 Return Gas
18.2 kW
Exceeds Efficiency Targets
Standard
Operation
NG or ADG
NG 10/27/10
268 kW
7.5 lb/hr H2
ADG 7/25/11
260 kW
7.6 lb/hr H2
ADG 7/28/11
260 kW
10.7 lb/hr H2
47% 54.3% 50.4% 53.2%
Site Tests

© National Fuel Cell Research Center, 2012 29/35
Additional Efficiency Improvements Possible
• CHHP Efficiency >70%
0%
10%
20%
30%
40%
50%
60%
70%
80%
90%
100%
NG 10/27/2010
268 kW Gross AC
7.5 lb/hr H2
NG 10/27/2010
260 kW Gross AC
7.7 lb/hr H2
NG 10/27/2010
260 kW Gross AC
10.7 lb/hr H2
Losses (Parasitic, Heat,Thermodynamic)
Exhaust Heat (to 120°F)
Hot Water (to 100°F)
Hydrogen
net AC

© National Fuel Cell Research Center, 2012 30/35
Grid Disturbance Issues
OCSD DFC-H2 Renewable H2 Production History
2-year Operating History at OCSD

© National Fuel Cell Research Center, 2012 31/35
OCSD Project – Quarterly Status Update
Last Quarter Performance:
MONTH OPERATING
HOURS GROSS AC GENERATED
kWh
NET AC GENERATED
kWh
July 665 146,528 96,061
August 595 121,520 69,468
September 720 153,099 91,286
Quarter Total
1,980 421,147 256,815

© National Fuel Cell Research Center, 2012 32/35
Outline
• Introduction and Background
• Tri-Generation/Poly-Generation Analyses
• OCSD Project Introduction
• OCSD Project Performance
• Summary

© National Fuel Cell Research Center, 2012 33/35
Summary
• > 2M kWh electricity; > 25,000 lbs H2; > 9M scf ADG processed
• Demonstrated many features of tri-generation with DFC®
technology
• Water Independence
• Fuel Flexibility
• Ultra-low Emissions
• Met Efficiency Target
• Dispensing to vehicles (meeting FCV quality requirements)
• Demonstrated system robustness
• Number of trips (mostly due to inverter/power issues)
• Robust operation
• Remote operation (re-integration, de-integration)
• High level of safety
• Very popular site due to innovative technology and
application – large number of visitors

The UC Irvine Team
Credit: Steve Zylius/UC Irvine Communications


© National Fuel Cell Research Center, 2012 36/35
Recall: High Temperature Fuel Cell (HTFC) Stack
• Molten Carbonate Fuel Cell Example
Analyses of Synergies
CH4+H2O 3H2+CO
2H2+2CO32- 2H2O + 2CO2 + 4e-
O2 + 2CO2 + 4e- 2CO3
2-
Electrolyte
Reformation
Electrochemistry
AN
C
AT
H
load
Stack Operating Temperature Range = 550oC to 650oC
CH4, H2O
O2 Depleted
Air
O2, CO2
H2, CO,
CO2
HE
AT
2CO32-
Air Flow and parasitic blower power can be reduced
Endothermic
Exothermic

© National Fuel Cell Research Center, 2012 37/35
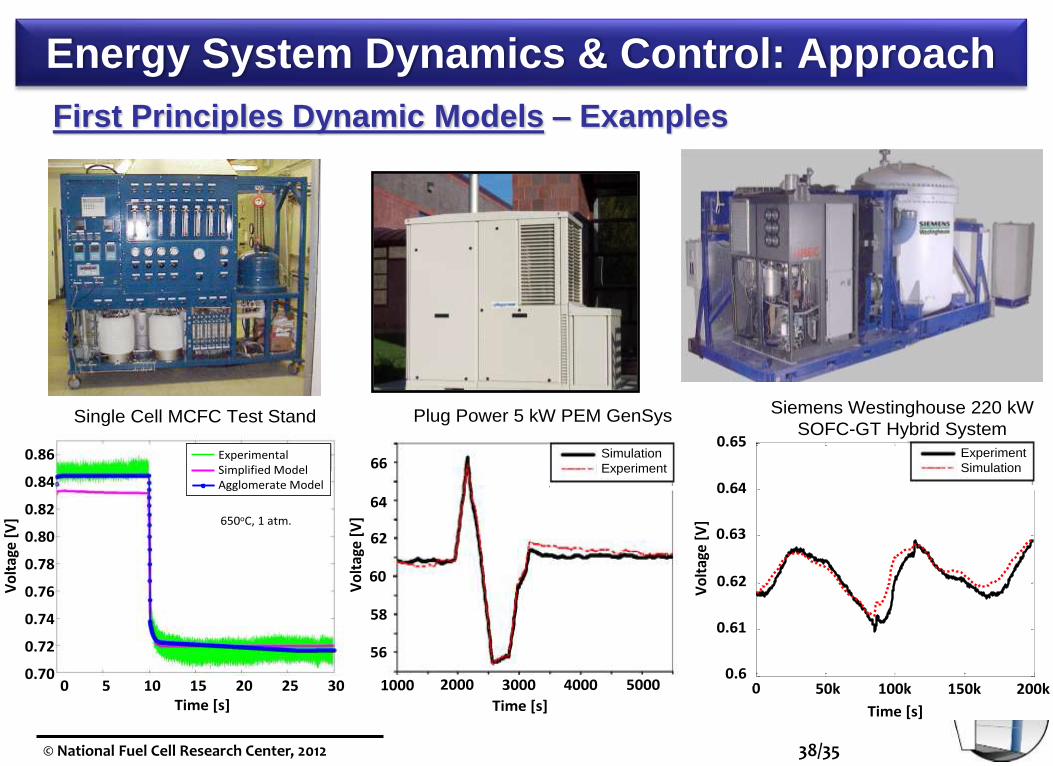
Energy System Dynamics & Control: Approach
First Principles Dynamic Models – Examples
© National Fuel Cell Research Center, 2012 38/35
Energy System Dynamics & Control: Approach
First Principles Dynamic Models – Examples
0 50000 100000 150000 2000000.6
0.61
0.62
0.63
0.64
0.65
FC
Voltage [
V]
Time [sec]
Experiment
Model
V
olt
age
[V]
Experiment
Simulation
0 50k 100k 150k 200k0.6
0.61
0.62
0.63
0.64
0.65
Time [s]
0 50000 100000 150000 2000000.6
0.61
0.62
0.63
0.64
0.65
FC
Voltage [
V]
Time [sec]
Experiment
Model
V
olt
age
[V]
Experiment
Simulation
0 50k 100k 150k 200k0.6
0.61
0.62
0.63
0.64
0.65
Time [s]
1000 2000 3000 4000 5000
Time [s]
56
58
60
62
64
66
Vo
ltag
e [V
]
Simulation
Experiment
1000 2000 3000 4000 5000
Time [s]
56
58
60
62
64
66
Vo
ltag
e [V
]
Simulation
Experiment
650oC, 1 atm.
ExperimentalSimplified ModelAgglomerate Model
0 5 10 15 20 25 30Time [s]
0.86
0.84
0.82
0.80
0.78
0.76
0.74
0.72
0.70
Vo
ltag
e [V
] 650oC, 1 atm.
ExperimentalSimplified ModelAgglomerate Model
ExperimentalSimplified ModelAgglomerate Model
0 5 10 15 20 25 30Time [s]
0.86
0.84
0.82
0.80
0.78
0.76
0.74
0.72
0.70
Vo
ltag
e [V
]
Siemens Westinghouse 220 kW
SOFC-GT Hybrid SystemPlug Power 5 kW PEM GenSysSingle Cell MCFC Test Stand

© National Fuel Cell Research Center, 2012 39/35
Poly-Generation Renewable Energy System
Orange County Sanitation District (OCSD) Project
Sponsors & Participants

© National Fuel Cell Research Center, 2012 40/35
• Steady-State AspenPlus® Modeling
Poly-Generation Analyses
HTFC Anode exhaust preparation PSA
550
1
561
42
1.0
REFRMATE
467
1
1603
52
1.0
13
700
1
919
46
1.0
ANEX
617
1
1244
41
1.0CAEX
0
HEATLOS
-901
FCWORKW
800
0
919
48
1.0
ANEX2-0
QEQUI
0
QFCNETQ
15
2
450
25
0.0
21
15
2
450
25
0.0
31
265
20
393
19
1.0
5
47
20
373
18
1.0
12
110
2
450
25
0.0
33
47
20
20
1
0.0
14
77
5
393
19
1.02
101
1
526
29
0.4
17
117
2
2702
150
0.01
22
15
2
450
25
0.06
277
5
393
19
1.03
62
2
450
25
0.0
24
77
1
526
29
0.025
235
1
919
48
1.07
77
1
393
19
1.0
18
25
1
1246
43
1.015
323
7
1246
43
1.016
106
30W
57
1
357
10
1.011
57
20
16
8
1.0
10500
2
919
48
1.0HSUIN2
200
2
919
48
1.0
8
0
0
9
32
500
2
128
8
1.0
FUELIN
FC
ANEQ
Q=0
Q
MIXER
QMIX
B13
Q=0
B4
W=35
B10
W=0
B9
Q=0
B3
Q=0
B2
W=106
B7
Q=0
B1
Q=0
B12Q=0
B5
W=37
B17
Q=0
REFORM
Q=0
Heat and Material Balance Table
Stream ID 8 32 7
Temperature C 200.0 234.7
Pressure bar 1 .793 1 .448 1 .448
Vapor Frac 1 .000 1 .000
Mole Flow kmol/hr 48.000 0 .000 48.000
Mass Flow kg/hr 919.095 0 .000 919.095
Volume Flow cum/hr 1048.382 0 .000 1395.517
Enthalpy MMkcal/hr -2 .425 -2 .425
Mole Flow kmol/hr
O2 trace
N2
AR
H2 8 .087 9 .573
CO 1 .513 0 .027
CO2 6 .487 7 .973
H2O 31.913 30.427
CH4 trace trace
HX1
Q=-0
PUMP2
W=0
15
1
450
25
0.0
H20IN
SEP1
102
1
94
5
0.42
WASTEW
102
1
432
24
0.42RECVDWAT
HX2
Q=0
96
1
432
24
0.99RCVDSTM
0
HEAT1
PUMP1
W=0
15
1
2702
150
0.0
WTRIN1
15
2
2702
150
0.0
WATER2
Hydrogen Separation Unit (HSU)
Water-Gas Shift
Reactor (WGSR)

© National Fuel Cell Research Center, 2012 41/35
Poly-Generating Efficiencies for HTFC
• Some have recently reported poly-generation efficiencies
that are misleading and unattractive
• Recent NFCRC paper published to address this issue
Poly-Generation Analyses
Etot Poly-generating
HTFC
Ee-
Electricity
(Pnet)
Heat (Qnet)
Chemicals
(C)
EC
EQ
Efficiency of poly-generating high temperature fuel cells, J. Power Sources,
Volume 196, Issue 4, 15 February 2011, Pages 2055-2060
Pere Margalef, Tim Brown, Jacob Brouwer, Scott Samuelsen

© National Fuel Cell Research Center, 2012 42/35
• Poly-Generating Efficiencies for HTFC
• State-of-the-Art plant efficiencies
Poly-Generation Analyses
Electrical Efficiency
(LHV) Thermal Efficiency (LHV)
Chemical Product
Efficiency (LHV)
Total Mixed Efficiency
(LHV)
ηe− ηQ ηC ηtot
Pnet Ee− Qnet EQ C EC (Pnet + Qnet + C) Etot
Comparable
Efficiency Considered
Value (based
upon LHV) Comments
Power plant Efficiency
ηPP
0.47 Distributed electricity generation using a stand-alone HTFC
without poly-generation or co-generation [6]
0.92 Average U.S. T&D system efficiency [7]
0.60 Typical modern natural gas combined cycle plant [7]
Boiler Efficiency
ηboiler
0.60 Fueled boiler at less than full load [5]
0.85 Natural gas boiler at full load [5]
Chemical Plant
Efficiency ηCP
0.79 Centralized steam methane reformation (SMR) to produce pure
hydrogen from natural gas [8]
0.65 Centralized methanol production from natural gas [9]
0.65 Distributed SMR to produce pure hydrogen [10]

© National Fuel Cell Research Center, 2012 43/35
• Efficiency of Poly-Generating Systems
Poly-Generation Analyses
Methodology Electrical Efficiency
ηel = Pnet /Ee−
Thermal Efficiency
ηth = Qnet /EQ
Chemical Product
Efficiency
ηC = C/EC
(1) State-of-the-art
method
Pnet
Etot − Qnetηboiler
− CηCP
Qnet
Etot − Pnet
ηPP−
CηCP
C
Etot − Pnet
ηPP−
Qnet
ηboiler
(2) Ideal
method
Pnet
Etot − Qnet − C
Qnet
Etot − Pnet − C
C
Etot − Pnet − Qnet
(3) Supplemental
input method
Pnet
Etot − EQ − ECP
Qnet
Qnet − Eburner ηburner ηboiler
+ EQ
C
ECP

© National Fuel Cell Research Center, 2012 44/35
Hydrogen Compression and Storage
Production Site:
Hydrogen compression:
• PDC Piston-metal diaphragm compressor
• Stationary high-pressure compressor, four-staged water-
cooled, 11–15 kW, 30–50 Nm3/h, 45 MPa (~6500psi) for
storage at site and in pipeline
Hydrogen storage:
• Six (6) metal tubes
• Storage at ~6500psi
• Total storage capacity of ~120 kg

© National Fuel Cell Research Center, 2012 45/35
Hydrogen Compression and Storage
Fueling Station:
Hydrogen compression:
• Hydro-Pac, single stage, piston intensifier
• 6,000 – 12,000 psi compressor, 40 hp motor
Hydrogen storage:
• Three (3) carbon fiber tanks
• Storage at ~10,000 psi
• Total storage capacity of ~36 kg