High Temperature Electrolysis Pressurized Experiment ...
29
INL/EXT-12-26891 High Temperature Electrolysis Pressurized Experiment Design, Operation, and Results J. E. O’Brien, X. Zhang, G. K. Housley, K. DeWall, L. Moore-McAteer, G. Tao September 2012
Transcript of High Temperature Electrolysis Pressurized Experiment ...

INL/EXT-12-26891
High Temperature Electrolysis Pressurized Experiment Design, Operation, and Results
J. E. O’Brien, X. Zhang, G. K. Housley, K. DeWall, L. Moore-McAteer, G. Tao
September 2012

DISCLAIMER This information was prepared as an account of work sponsored by an
agency of the U.S. Government. Neither the U.S. Government nor any agency thereof, nor any of their employees, makes any warranty, expressed or implied, or assumes any legal liability or responsibility for the accuracy, completeness, or usefulness, of any information, apparatus, product, or process disclosed, or represents that its use would not infringe privately owned rights. References herein to any specific commercial product, process, or service by trade name, trade mark, manufacturer, or otherwise, does not necessarily constitute or imply its endorsement, recommendation, or favoring by the U.S. Government or any agency thereof. The views and opinions of authors expressed herein do not necessarily state or reflect those of the U.S. Government or any agency thereof.

INL/EXT-12-26891
High Temperature Electrolysis Pressurized Experiment Design, Operation, and Results
J. E. O’Brien, X. Zhang, G. K. Housley, K. DeWall, L. Moore-McAteer, G. Tao
September 2012
Idaho National Laboratory VHTR TDO Program
Idaho Falls, Idaho 83415
http://www.inl.gov
Prepared for the U.S. Department of Energy Office of Nuclear Energy
Under DOE Idaho Operations Office Contract DE-AC07-05ID14517


v
SUMMARY A new facility has been developed at the Idaho National Laboratory for
pressurized testing of solid oxide electrolysis stacks. Pressurized operation is envisioned for large-scale hydrogen production plants, yielding higher overall efficiencies when the hydrogen product is to be delivered at elevated pressure for tank storage or pipelines. Pressurized operation also supports higher mass flow rates of the process gases with smaller components.
The test stand can accommodate planar cells with dimensions up to 8.5 cm x 8.5 cm and stacks of up to 25 cells. It is also suitable for testing other cell and stack geometries, including tubular cells. The pressure boundary for these tests is a water-cooled spool-piece pressure vessel designed for operation up to 5 MPa. Pressurized operation of a ten-cell internally manifolded solid oxide electrolysis stack has been successfully demonstrated up to 1.5 MPa. The stack is internally manifolded and operates in cross-flow with an inverted-U flow pattern. Feedthroughs for gas inlets/outlets, power, and instrumentation are all located in the bottom flange. The entire spool piece, with the exception of the bottom flange, can be lifted to allow access to the internal furnace and test fixture. Lifting is accomplished with a motorized, threaded drive mechanism attached to a rigid structural frame. Stack mechanical compression is accomplished using springs that are located inside of the pressure boundary, but outside of the hot zone. Initial stack heat up and performance characterization occurs at ambient pressure followed by lowering and sealing of the pressure vessel and subsequent pressurization. Pressure equalization between the anode and cathode sides of the cells and the stack surroundings is ensured by combining all of the process gases downstream of the stack. Steady pressure is maintained by means of a backpressure regulator and a digital pressure controller. A full description of the pressurized test apparatus is provided in this report.
Results of initial testing showed the expected increase in open-cell voltage associated with elevated pressure. However, stack performance in terms of area-specific resistance was enhanced at elevated pressure due to better gas diffusion through the porous electrodes of the cells. Some issues such as cracked cells and seals were encountered during testing. Full resolution of these issues will require additional testing to identify the optimum test configurations and protocols.

vi

vii
ACKNOWLEDGEMENTS
This work was supported by the United States Department of Energy Office of Nuclear Energy, Next Generation Nuclear Plant Research and Development Program. Idaho National Laboratory is operated for the United States Department of Energy Office of Nuclear Energy by Battelle Energy Alliance, LLC, under contract No. DE-AC07-05ID14517.

viii

ix
CONTENTS
SUMMARY .................................................................................................................................................. v�
ACKNOWLEDGEMENTS ........................................................................................................................ vii�
ACRONYMS ............................................................................................................................................... xi�
NOMENCLATURE .................................................................................................................................... xi�
UNITS .......................................................................................................................................................... xi�
1.� INTRODUCTION .............................................................................................................................. 1�
2.� PRESSURIZED TEST FACILITY .................................................................................................... 2�2.1� Process Details ......................................................................................................................... 2�2.2� Pressure Vessel and Lifting Structure ...................................................................................... 4�2.3� Test Stand ................................................................................................................................. 7�2.4� Hot Zone .................................................................................................................................. 8�
3.� OPERATING CONDITIONS ............................................................................................................ 9�
4.� TEST RESULTS .............................................................................................................................. 11�
5.� REFERENCES ................................................................................................................................. 15�
FIGURES Figure 1. Pressurized HTE piping and instrumentation diagram. ................................................................. 3�
Figure 2. Pressurized water system. .............................................................................................................. 4�
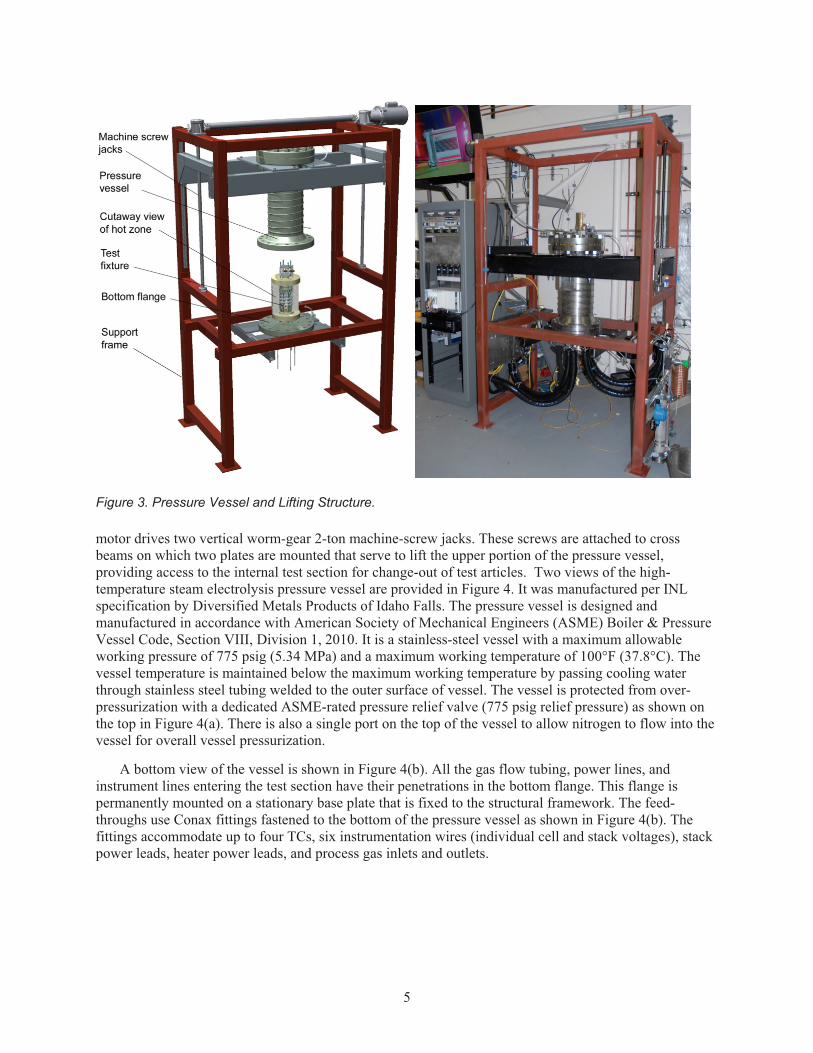
Figure 3. Pressure Vessel and Lifting Structure............................................................................................ 5�
Figure 4. Pressure vessel; (a) overview, (b) bottom view. ............................................................................ 6�
Figure 5. Test fixture (a) cross section inside furnace and pressure vessel (b) detail. .................................. 7�
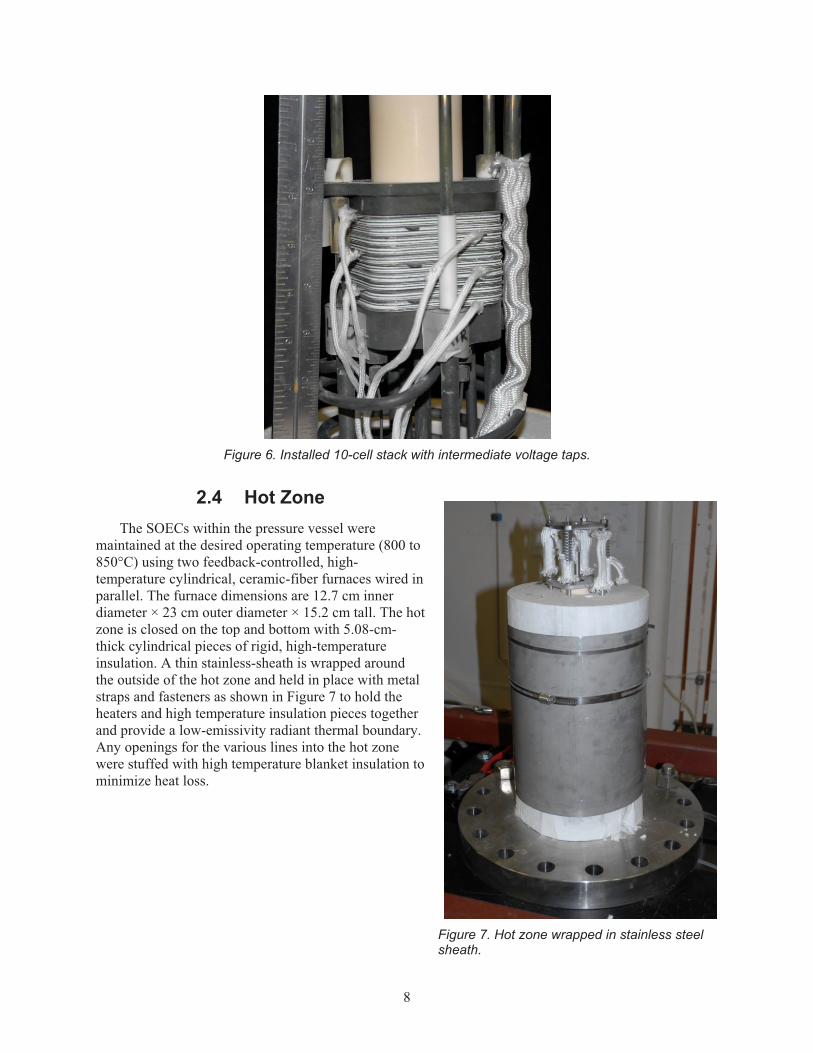
Figure 6. Installed 10-cell stack with intermediate voltage taps. .................................................................. 8�
Figure 7. Hot zone wrapped in stainless steel sheath. ................................................................................... 8�
Figure 8. iV sweeps, initial pressurized test, effect of composition and pressure. ..................................... 11�
Figure 9. Power supply voltage, initial long-term test. ............................................................................... 12�
Figure 10. Post-test photograph of stack, initial pressurized test. ............................................................... 12�
Figure 11. Vi sweeps, final pressurized test, effect of pressure. ................................................................. 13�
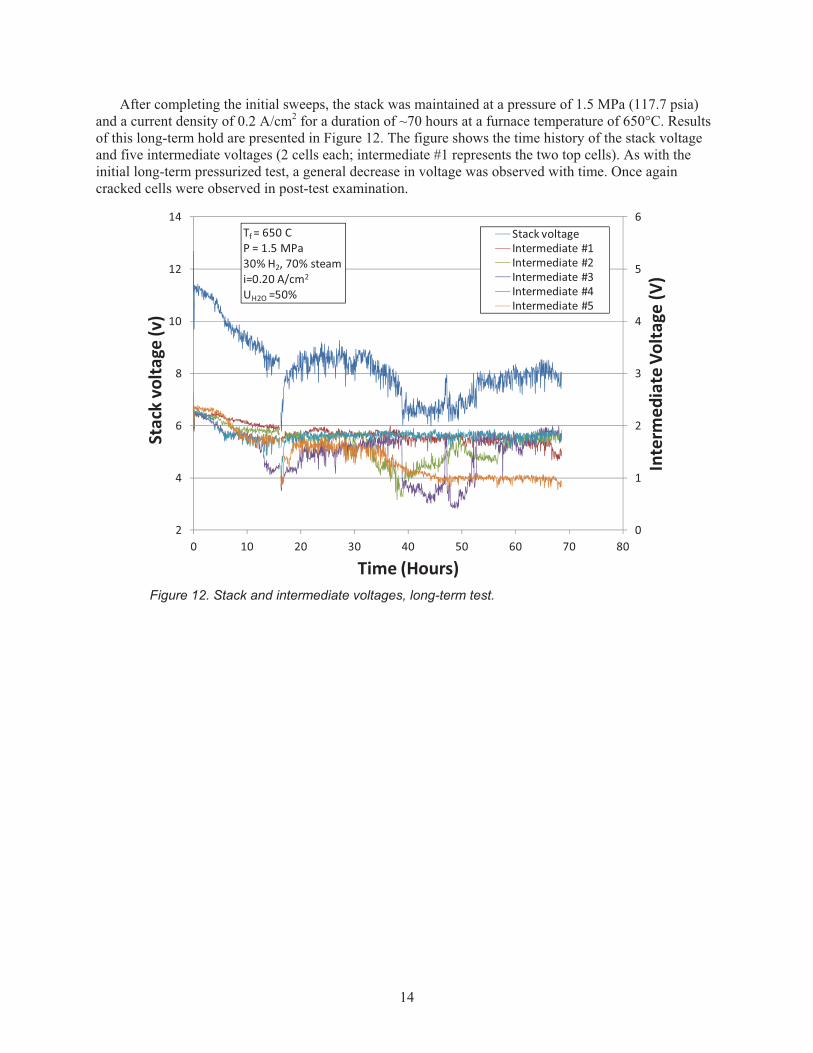
Figure 12. Stack and intermediate voltages, long-term test. ....................................................................... 14�

x

xi
ACRONYMS ASME American Society of Mechanical Engineers
ASR area-specific resistance
BCTC Bonneville County Technology Center
CEM controlled evaporation and mixing
HTE high-temperature electrolysis
INL Idaho National Laboratory
SOEC solid oxide electrolysis cell
TC thermocouple
TRL Technology Readiness Level
NOMENCLATURE F Faraday number, coulombs/mol or J/V mol
�GR Gibbs energy of reaction, J/mol
i current density, A/cm2
MPa megapascals
P pressure
Ru universal gas constant, J/V K mol
T temperature, K
V voltage, V
VN Nernst potential, V
y mole fraction
UNITS MPa megapascal
cm centimeter
cm2 square centimeter
cm3 cubic centimeter
psig pounds per square inch gauge
psia pounds per square inch absolute
°C degrees Celsius
°F degrees Fahrenheit
kg kilograms
V volts

xii
A amperes
W watts
sccm standard cubic centimeters per minute
� ohm
kPa kilopascals

1
High Temperature Electrolysis Pressurized Experiment Design, Operation, and Results
1. INTRODUCTION There is increasing interest in developing technologies for large-scale nonfossil hydrogen production.
This interest is driven by (a) the immediate demand for hydrogen, which is needed to refine increasingly low-quality petroleum resources, (b) the expected intermediate-term demand for carbon-neutral synthetic fuels, and (c) the potential long-term demand for hydrogen as an environmentally benign direct transportation fuel.1,2 Current worldwide hydrogen production is primarily based on the steam reforming of methane. From a long-term perspective, methane reforming is not a viable process for large-scale production of hydrogen because natural gas is a nonrenewable resource that exhibits large volatility in price, and methane reforming and other fossil-fuel conversion processes emit large quantities of greenhouse gases to the environment. Nonfossil carbon-free options for hydrogen production include conventional water electrolysis coupled to either renewable (e.g., wind) energy sources or nuclear energy. The renewable-hydrogen option may be viable as a supplementary source, but would be very expensive as a large-scale stand-alone option.3 Conventional electrolysis coupled to nuclear base-load power can approach economical viability when combined with off-peak power, but the capital cost is high.4 High-temperature electrolysis (HTE) can be used to achieve even higher overall hydrogen production efficiencies.5 The required high temperature process heat can be based on concentrated solar energy6 or nuclear energy from advanced high-temperature reactors.7
The hydrogen produced by HTE will generally have to be pressurized for tank storage, introduction into a pipeline, or for process applications. Recognizing this fact, elevated pressure operation is desirable for the entire process. Elevated pressure operation yields higher overall process efficiencies because the liquid water feedstock can be compressed in the liquid phase at the process inlet (liquid phase compression work is very small compared to compression of the gaseous product). Elevated pressure also supports higher mass flow rates for the same size components. Very little experimental work has been reported in the literature on pressurized operation of solid oxide electrolysis cells (SOECs), and no studies are known to have been performed on stacks. Pressurized operation of a single-cell was performed at Riso.8 Results of this study indicated improved cell area specific resistance at elevated pressure due to improved gas diffusion in the electrodes, but higher open-cell voltages, such that the cell voltage for a specified current density, was nearly constant with increasing pressure.
Detailed system analyses evaluating the performance of large-scale nuclear reactor-coupled pressurized hydrogen production plants based on HTE have been performed.9 These simulations incorporate realistic component efficiencies, heat exchanger performance, and operating conditions. The results presented by Das et al.10 indicate that overall thermal-to-hydrogen production efficiencies in excess of 50% can be achieved for HTE with reactor outlet temperatures above 800°C. Additional simulations of pressurized HTE with a focus on co-electrolysis were reported by Stoots et al.11
This report describes and updates the status of the high-temperature steam electrolysis pressurized test facility recently developed at Idaho National Laboratory (INL) to meet a DOE FY 2012 level 2 milestone for the VHTR TDO Program. Detailed descriptions of the piping layout, pressurized water delivery system, pressure vessel, pressure vessel lifting system, test fixture, hot zone, instrumentation, and operating conditions, are addressed. This facility demonstrated pressurized HTE operation. Pressurized operation is preferred in large-scale systems for efficient production and delivery of hydrogen product at a pressure suitable for tank storage or pipeline transport. Successful demonstration of pressurized HTE operation should advance the technology readiness level (TRL) of HTE to the TRL-5 level, which

2
corresponds to successful technology demonstration at the laboratory scale with integrated components in a near prototypical environment.
2. PRESSURIZED TEST FACILITY
2.1 Process Details A piping and instrumentation diagram of the pressurized HTE experimental apparatus is presented in
Figure 1. The diagram shows a planar electrolysis stack situated in a pressure vessel with supporting instrumentation, including mass-flow controllers, pressure controllers, thermocouples (TCs), and pressure transducers. The SOECs and stacks for these tests have been provided by Materials and Systems Research, Inc. of Salt Lake City, UT. The 10-cell stacks are made up of small-format advanced electrode-supported cells with an active area of 20 cm2 and outer dimensions of 7.62 × 7.62 cm. The cells have three flow passages on each side to support a cross-flow internally manifolded stack design. The stack is located inside of a cylindrical ceramic-fiber furnace within the pressure vessel. The inlet gases are preheated to 300°C prior to entering the furnace by means of special high-temperature heat-traced gas lines. This heat tracing necessarily has a higher temperature rating because of the higher saturation temperatures associated with pressurized operation and the need to avoid steam condensation in the lines. The gases are heated to their final 800°C operating temperature within the furnace via radiant heating. The inlet gases flow through coiled tubing inside the furnace upstream of the stack for this purpose.
For most tests, a mixture of hydrogen and steam is introduced to the cathode side of the electrolysis cells. Hydrogen is required on the inlet side to maintain reducing conditions on the SOEC’s nickel cermet electrode. Air or nitrogen flows across the anode side of the electrolysis cells as a sweep gas. Nitrogen also flows through the head space of the pressure vessel as a pressurization gas. Nitrogen is supplied by a cryogenic dewar for test pressures up to 250 psig or by compressed gas cylinders for higher pressure tests. Air must be supplied using compressed gas cylinders, since the outlet pressure of the shop air compressor is too low to support these tests. Inlet hydrogen will also be supplied from compressed gas cylinders.

3
Figure 1. Pressurized HTE piping and instrumentation diagram.
The pressurized flow system is constructed using high-pressure stainless-steel tubing, compression fittings, and valves with pressure ratings well above those of the pressure vessel. Downstream of each gas-supply regulator is a pressure-relief valve (850 psig setting—hydrogen vented to roof vents) designed to prevent over-pressurization of experiment components in the event a regulator fails or is improperly set. Flow rates of air, nitrogen, and hydrogen are controlled by precision mass-flow controllers. Steam is added to the nitrogen/hydrogen mixture using a controlled evaporation and mixing (CEM) unit.
Although the tests will be performed at elevated pressures up to 5 MPa, the pressure differential across the cells between the steam/hydrogen side and the oxygen side and between the stack internals and the surrounding gas inside the pressure vessel must be kept low in order to minimize leakage and prevent the possible cracking of cells. This pressure balance is accomplished by combining the process gases and vessel pressurization gas into a single exit flow line downstream of the stack, as shown in Figure 1. The exhaust gases (steam, nitrogen, hydrogen, oxygen) from the two sides of the stack are combined inside the hot zone, just downstream of the stack. Consequently, the electrolytically produced hydrogen will recombine with the produced oxygen at temperature, eliminating the possible build-up of a combustible mixture downstream of the pressure vessel while ensuring pressure equalization across the stack. The vessel pressurization gas is combined with the stack exhaust gases further downstream, outside of the pressure vessel, resulting in a safe gas mixture of nitrogen, hydrogen (the remaining hydrogen is from the inlet flow), and steam. This gas mixture is cooled in a tube-in-tube water-cooled heat exchanger to remove most of the residual steam by condensation. The condensate is collected in a stainless steel cylinder (400 cm3). A high-pressure magnetic level sensor, plumbed in parallel with the condenser cylinder, provides an analog output signal that allows for automated discharge of condensate from the cylinder when the condensate water level reaches a set point value.

4
Figure 2. Pressurized water system.
Pressurized water is supplied to the CEM using a custom pressurized water supply system, as shown in Figure 2, in which low-pressure deionized water is supplied to one of two stainless steel vessels that are alternately pressurized using nitrogen from the compressed gas line. Each pressurized water system holding cylinder has a length of high-pressure transparent tubing mounted adjacent to it so that the water level can be visually monitored. The holding cylinders each have a volume of 3.78 liters. At typical operating conditions, this volume is sufficient to supply water to the CEM for approximately 4 days, so automated operation of this system was determined to be unnecessary. The pressure rating on the CEM unit is 6 MPa, but the maximum outlet temperature is 200°C. Therefore, this unit may not be suitable for 5 MPa tests, since the saturation temperature of steam is greater than 260°C at 5 MPa.
Heat-traced and insulated stainless-steel tubing is used between the CEM and the pressure vessel to prevent steam condensation downstream of the CEM and to preheat the electrolysis inlet flow. The maximum rated temperature for these heat-traced lines is 300°C; a temperature of about 220°C will be maintained for the 1.5 MPa tests. The heat-traced lines incorporate thermal insulation so that the hot tubing is not exposed.
The operating pressure of the experiment is determined by the combination of a back-pressure regulator and a pressure controller—the back-pressure regulator provides the rough setting and the pressure controller provides fine control. The pressure controller regulates the gas flow out of the system using feedback control based on upstream pressure. The combination of the two pressure-control devices was needed because of the limitation on the total allowable pressure drop across the pressure controller.
2.2 Pressure Vessel and Lifting Structure
The completed pressurized test stand is shown in Figure 3. The structural steel framework was originally used on the INL Integrated Laboratory Scale experiment.9 It has been retrofitted for use with the pressurized experiment. A 3/4-horsepower electric motor is mounted on top of the framework. The
5
Figure 3. Pressure Vessel and Lifting Structure.
motor drives two vertical worm-gear 2-ton machine-screw jacks. These screws are attached to cross beams on which two plates are mounted that serve to lift the upper portion of the pressure vessel, providing access to the internal test section for change-out of test articles. Two views of the high-temperature steam electrolysis pressure vessel are provided in Figure 4. It was manufactured per INL specification by Diversified Metals Products of Idaho Falls. The pressure vessel is designed and manufactured in accordance with American Society of Mechanical Engineers (ASME) Boiler & Pressure Vessel Code, Section VIII, Division 1, 2010. It is a stainless-steel vessel with a maximum allowable working pressure of 775 psig (5.34 MPa) and a maximum working temperature of 100°F (37.8°C). The vessel temperature is maintained below the maximum working temperature by passing cooling water through stainless steel tubing welded to the outer surface of vessel. The vessel is protected from over-pressurization with a dedicated ASME-rated pressure relief valve (775 psig relief pressure) as shown on the top in Figure 4(a). There is also a single port on the top of the vessel to allow nitrogen to flow into the vessel for overall vessel pressurization.
A bottom view of the vessel is shown in Figure 4(b). All the gas flow tubing, power lines, and instrument lines entering the test section have their penetrations in the bottom flange. This flange is permanently mounted on a stationary base plate that is fixed to the structural framework. The feed-throughs use Conax fittings fastened to the bottom of the pressure vessel as shown in Figure 4(b). The fittings accommodate up to four TCs, six instrumentation wires (individual cell and stack voltages), stack power leads, heater power leads, and process gas inlets and outlets.

6
(a) (b)
Figure 4. Pressure vessel; (a) overview, (b) bottom view.

7
2.3 Test Stand Two views of the test fixture are shown in Figure 5: Figure 5(a) shows a cross section of the test
fixture and its position inside the pressure vessel and hot zone, and Figure 5(b) shows a detailed view of the test fixture. The top section of the test stand protrudes from the furnace and is positioned in the cool zone of the pressure vessel above the furnace. Four springs mechanically compress the stack with about 45 kg of load, ensuring good electrical contact throughout the stack and compressing the compliant seals used in the stack. A partial compression load of ~11 kg is applied to the stack before it is heated. The full load must be applied after the hot zone reaches 800°C. Consequently, initial heatup was performed at ambient pressure with the upper vessel raised so that the springs can be accessed and adjusted. Once the springs are compressed and the full compression load is imposed on the stack, the upper portion of the vessel is lowered and bolted into place on the bottom flange. Pressurization can then occur.
The lower electrode plate of the test stand (see Figure 5(b)) is used as the negative electrical terminal for the cell stack and as a gas manifold. It has slots that mate with the stack flow passages and distribute the gas flows in and out of the stack. The lower plate has four tabs with holes to accommodate threaded rods. These rods are used in conjunction with the compression springs and the alumina load transfer tube for mechanical compression of the stack. The upper electrode plate is in electrical contact with the top cell of the stack and serves as the positive current collector plate. The springs apply a nearly constant mechanical load, allowing for thermal expansion. The coiled tubing below the lower electrode plate provides a total heated length of about 42 inches for each of the inlet gases, providing the preheating needed for the inlet gases to achieve a temperature very close to 800ºC before entering the stack. Four legs hold the lower electrode plate at a specific height in the hot zone. The compression rods are threaded into those legs. A 10-cell stack installed in the test fixture with intermediate voltage taps in place is shown in Figure 6.
(a) (b)
Figure 5. Test fixture (a) cross section inside furnace and pressure vessel (b) detail.
8
Figure 6. Installed 10-cell stack with intermediate voltage taps.
2.4 Hot Zone The SOECs within the pressure vessel were
maintained at the desired operating temperature (800 to 850°C) using two feedback-controlled, high-temperature cylindrical, ceramic-fiber furnaces wired in parallel. The furnace dimensions are 12.7 cm inner diameter × 23 cm outer diameter × 15.2 cm tall. The hot zone is closed on the top and bottom with 5.08-cm-thick cylindrical pieces of rigid, high-temperature insulation. A thin stainless-sheath is wrapped around the outside of the hot zone and held in place with metal straps and fasteners as shown in Figure 7 to hold the heaters and high temperature insulation pieces together and provide a low-emissivity radiant thermal boundary. Any openings for the various lines into the hot zone were stuffed with high temperature blanket insulation to minimize heat loss.
Figure 7. Hot zone wrapped in stainless steel sheath.

9
3. OPERATING CONDITIONS There are two outlet streams from the electrolysis stack: the outlet from the anode side will be air or
nitrogen that is slightly enriched with oxygen, and the outlet from the cathode side will be a gas mixture of nitrogen, hydrogen, and steam. The electrolysis cells are extremely fragile with respect to differential pressure. Both the anode side and the cathode side must be maintained at a pressure that is equal to the vessel internal pressure. This is accomplished by passively allowing the hydrogen and oxygen exhaust streams to recombine within the furnace downstream of the stack. When these flow streams combine at high temperature, the hydrogen will react with oxygen to form steam. The combined exhaust stream exits the pressure vessel and is then combined with the nitrogen pressurizing gas from the pressure vessel exhaust stream to ensure equal pressure in the vessel head space as well. In the actual pressurized hydrogen production application, the hydrogen and sweep gas streams will of course have to remain separated downstream of the hot zone. This will require very fine control of the differential pressure across the stack with fully independent flow streams.
The composition of the exhaust gas depends on which sweep gas is used. If air is used, the exhaust gas will include only air and steam. In this case, all of the produced and inlet hydrogen will recombine with oxygen inside the hot zone downstream of the electrolysis stack to produce steam. If nitrogen is used as a sweep gas, the exhaust gas will include nitrogen, steam, and hydrogen (no oxygen). In this case the residual hydrogen mole fraction will be equal to the inlet hydrogen mole fraction (typically 10–15%) and the electrolytically produced hydrogen will recombine with the electrolytically produced oxygen to form steam. In any case, the exhaust stream is directly vented outside the building at the rooftop level by means of plastic tubing run through the entire length of a large-diameter PVC exhaust vent. The exhaust vent serves as a conduit that houses several smaller plastic exhaust tubes. This arrangement ensures that all exhaust gases are released outside the building and prevent the possibility of off-gas build-up inside the exhaust vent should the draft inside the vent be insufficient to remove the off-gases.
The hydrogen production rate was determined from the measurement of the electrical current supplied to the electrolysis cells using Faraday’s law. The voltage and current across the electrolysis cell(s) was continuously monitored. Typical per-cell operating voltages are in the range of 0.9 to 1.4 V. Typical current densities are in the range of 100 to 400 mA/cm2, yielding a total current of 2 to 8.0 A for the 20 cm2 active cell area of the pressurized stack. In the case of multiple-cell stacks, the individual cells are electrically wired in series so the amperage for the stack is the same as for each cell. The voltage across the stack, however, increases in direct proportion to the number of cells. The pressurized tests used 10-cell stacks, so total stack voltages will be in the range of 9 to 14 V. Typical operating conditions were as follows.
� Stack voltage = 12 V � Stack current = 5 A � Electrolysis power = 60 W � Gas flow rates:
- Inlet hydrogen = 373 sccm - Inlet mole fraction hydrogen = 30% - Inlet mole fraction steam = 70% - Hydrogen production rate = 348 sccm - Inlet steam = 870 sccm - Steam utilization = 40% - Nitrogen:
� Sweep gas = 1.0 slpm

10
� Vessel pressurization = 100 sccm � Vessel pressure = 0.085–1.5 MPa � Hot zone temperature = 800°C.
A gas-monitoring system is used to notify laboratory occupants of the presence of any potentially hazard gases. This system monitors the following gasses: CO, CO2, H2, and O2. The Drager Co., a recognized leader since 1889 in the field of safe industrial breathing environments, specified the gas monitoring system for Bonneville County Technology Center (BCTC) Bay 9 (Draegergard CCS 3000, 16-channel controller with Polytron sensing heads). The system monitors the four gases in two locations. The system has relay outputs, display readout, and visual and audible alarms. Maintenance and calibration of this system is performed in accordance with INL PLN-2896, “BCTC Bay 9 Gas Monitoring System Maintenance Plan.”

11
4. TEST RESULTS Three pressurized HTE tests were performed over a pressure range from ambient pressure (85 kPa,
12.5 psia) to 1.5 MPa (217 psia). Cell and stack performance was characterized at each operating condition by executing several direct current potential (iV) sweeps over a range of current densities from 0 to 0.4 A/cm2. Results showing the effect of gas composition and pressure of a series of sweeps for the initial pressurized test are presented in Figure 8. The 10-cell stack was instrumented with five intermediate voltage taps such that each curve represents the voltage for two cells in the 10-cell stack. Gas compositions were varied from 10 to 40 % hydrogen, the balance being steam. Results for three different pressures are presented, from ambient pressure to 690 kPa (100 psia). Open-cell voltages (at zero current density) increase with hydrogen mole fraction and pressure, in accordance with the Nernst equation
�� � ���� � � � �� �� ����
���������� � �
����� !�". (1)
Therefore, the highest open-cell voltage was observed for the case of 40% hydrogen and 690 kPa pressure. As the current density was increased during the sweeps, cell voltages increase approximately linearly. The slopes of the iV curves determine the value of the area-specific resistance (ASR); steeper slopes indicate higher ASR values. Observed ASR values decreased with pressure from ~0.6 � cm2 at ambient pressure to ~0.46 � cm2 at 690 kPa (100 psia). This decrease in ASR with pressure is associated with the improved diffusion transport characteristics of the reactant and product gases through the porous electrodes at elevated pressure.
Figure 8. iV sweeps, initial pressurized test, effect of composition and pressure.
1
1.2
1.4
1.6
1.8
2
2.2
2.4
2.6
0 0.05 0.1 0.15 0.2 0.25 0.3 0.35 0.4 0.45
Interm
ediate�Voltage�#5
�(2�ce
lls)�(V)
Current�Density�(A/cm2)
Tf =�800�C,�UH2O,max�=�40%balance�steam
40%�H2,�85�kPa�(12.5�psia)30%�H2,�85�kPa�(12.5�psia)20%�H2,�85�kPa�(12.5�psia)10%�H2,�85�kPa�(12.5�psia)40%�H2,�345�kPa�(50�psia)30%�H2,�345�kPa�(50�psia)20%�H2,�345�kPa�(50�psia)10%�H2,�345�kPa�(50�psia)40%�H2,�690�kPa�(100�psia)30%�H2,�690�kPa�(100�psia)20%�H2,�690�kPa�(100�psia)10%�H2,�690�kPa�(100�psia)

12
Results of the initial pressurized test are shown in Figure 9. The stack was operated for 80 hours at 690 kPa at a constant current of 5 A (0.25 A/cm2). The stack voltage, measured at the power supply was reasonably stable over the 80-hour period, but did exhibit a sudden drop at ~60 hours. Additional testing was performed with this stack up to 5 MPa (217 psia), but the data were not recorded because of an unknown issue with the data acquisition system. Also observed during this test was a significant increase in the furnace power required to maintain the stack operating temperature of 800°C, which increased with increasing pressure because of the increased effective thermal conductivity of the furnace thermal insulation at elevated pressure. A small steam leak from the nonhermetic seals of the electrolysis stack caused water to condense on the inside wall of the cooled pressure vessel. This water accumulated at the bottom of the vessel, infiltrating the base insulation disc and reducing its insulation effectiveness. Post-test examination of the stack shown in Figure 10 revealed evidence of cracked cells and compromised seals.
Figure 9. Power supply voltage, initial long-term test.
Figure 10. Post-test photograph of stack, initial pressurized test.
6
7
8
9
10
11
12
13
14
0 10 20 30 40 50 60 70 80 90
Power�Sup
ply�Vo
ltage�(V
)
Time�(Hours)
Tf =�800�CP�=�690�kPa�(100�psia)30%�H2,�70%�steam,�i=0.25�A/cm2
UH2O =40%�

13
Three pressurized tests were performed. Before the start of the second test, the TC designated for feedback control of the furnace was switched from one located in the center of the hot zone just below the stack (furnace TC) to one located in the inlet air plenum, which is machined into the lower electrode plate (inlet TC). The inlet TC was indicating a significantly lower temperature than the furnace TC, especially at high pressure. Since the inlet TC was physically closer to the actual stack, it was chosen for furnace control. The use of this TC for furnace control turned out to be a poor selection that resulted in the stack overheating when the pressure was increased to 1.03 MPa (150 psia). The overheating occurred because the stack temperature was much higher than the air inlet temperature. Therefore, since the furnace control was tied to the gas inlet temperature, which was maintained at 800°C, the actual stack temperature exceeded the recommended value. Stack overheating occurred, compromising the seals and causing some short circuiting between cells.
Results of the direct current potential sweeps for the final pressurized test are shown in Figure 11. Furnace control for this test was changed back to the original furnace temperature. Sweeps were performed at five pressures ranging from ambient (85 kPa, 12.5 psia) to 1.5 MPa (217.7 psia). The figure shows stack voltage versus current density from zero to 0.4 A/cm2, corresponding to an electric current range of 0 to 8 A. The furnace temperature was maintained at 800°C for all sweeps except for the 1.5 MPa sweep, which used a furnace temperature of 650°C. The general trends observed during these sweeps are similar to those described for the initial test. The open-cell voltage increases with increasing pressure. The slope of the iV curves decreases with increasing pressure, indicating lower ASR values associated with higher pressure operation because of improved gas diffusion in the porous electrodes at high pressure.
Figure 11. Vi sweeps, final pressurized test, effect of pressure.
4
5
6
7
8
9
10
11
12
13
14
0 0.05 0.1 0.15 0.2 0.25 0.3 0.35 0.4 0.45
Stack�Vo
ltage�(V
)
Current�Density�(A/cm2)
Tf =�800�C30%�H2,�70%�steamUH2O,max =�40%
85�kPa�(12.5�psia)220�kPa�(32�psia)576�kPa�(83.5�psia)1.034�MPa�(150�psia)1.5�Mpa�(217.7�psia)
14
After completing the initial sweeps, the stack was maintained at a pressure of 1.5 MPa (117.7 psia) and a current density of 0.2 A/cm2 for a duration of ~70 hours at a furnace temperature of 650°C. Results of this long-term hold are presented in Figure 12. The figure shows the time history of the stack voltage and five intermediate voltages (2 cells each; intermediate #1 represents the two top cells). As with the initial long-term pressurized test, a general decrease in voltage was observed with time. Once again cracked cells were observed in post-test examination.
Figure 12. Stack and intermediate voltages, long-term test.
0
1
2
3
4
5
6
2
4
6
8
10
12
14
0 10 20 30 40 50 60 70 80
Interm
ediate�Voltage�(V
)
Stack�volta
ge�(v)
Time�(Hours)
Tf�=�650�CP�=�1.5�MPa30%�H2,�70%�steam�i=0.20�A/cm2
UH2O =50%
Stack�voltageIntermediate�#1Intermediate�#2Intermediate�#3Intermediate�#4Intermediate�#5
15
5. REFERENCES 1 Forsberg, C. W., “The Hydrogen Economy is Coming. The Question is Where?” Chemical Eng.
Progress, pp. 20–22, Dec. 2005.
2 Schultz, K. R., Brown, L. C., Besenbruch, G. E. and Hamilton, C. J., Large-Scale Production of Hydrogen by Nuclear Energy for the Hydrogen Economy, Report GA-A24265, p. 22, Feb. 2003.
3 Granovskii, M., Dincer, I., and Rosen, M. A., “Greenhouse gas emissions reduction by use of wind and solar energies for hydrogen and electricity production: economic factors,” Int. J. Hydrogen Energy, Vol. 32, pp. 927–931, 2007.
4 Floch, P-H., Gabriel, S., Mansilla, C., and Werkoff, F., “On the production of hydrogen via alkaline electrolysis during off-peak periods,” Int. J. Hydrogen Energy, Vol. 32, pp. 4641–4647, 2007.
5 O’Brien, J. E., “Thermodynamics and Transport Phenomena in High Temperature Steam Electrolysis Cells,” Journal of Heat Transfer, Vol. 134, pp. 031017: 1–11, March 2012.
6 Steinfeld, A. “Solar thermochemical production of hydrogen,” Solar Energy, Vol. 78, No 5, pp. 603–615, May 2005.
7 O’Brien, J. E., “Review of the Potential of Nuclear Hydrogen for Addressing Energy Security and Climate Change,” Nuclear Technology, Vol. 178, April 2012.
8 Jensen, S. H., Sun, X., Ebbesen, S. D., Knibbe, R., and Mogensen, M., “Hydrogen and Synthetic Fuel Production using Pressurized Solid Oxide Electrolysis Cells,” Int. J. Hydrogen Energy, Vol. 35, pp. 9544–9549, 2010.
9 O’Brien, J. E., McKellar, M. G., and Herring, J. S., “Performance Predictions for Commercial-Scale High-Temperature Electrolysis Plants Coupled to Three Advanced Reactor Types,” 2008 International Congress on Advances in Nuclear Power Plants, June 8-12, 2008, Anaheim, CA.
10 Das, S., Frandsen, H. L., Ebbesen, S. D., Hendriksen, P. V., Hansen, J. B., and Mogensen, M., “Modeling Co-Electrolysis of CO2 and Steam for Dimethyl Ether Synthesis: Limitations,” Int. J. Hydrogen Energy, 2012.
11 Stoots, C. M., O’Brien, J. E., Condie, K., Moore-McAteer, L., Housley, G. K., Hartvigsen, J. J., and Herring, J. S., “The High-Temperature Electrolysis Integrated Laboratory Experiment,” Nuclear Technology, Vol. 166, No. 1, pp. 32–42, April 2009.