High Temperature Alloy 617 Properties for Engineering ... · High Temperature Alloy 617 Properties...
47
High Temperature Alloy 617 Properties for Engineering Design: Creep, Fatigue & Creep-Fatigue Thomas Lillo Idaho National Laboratory Program Lead: Dr. R.N. Wright Technical Meeting on High-Temperature Qualification of High Temperature Gas Cooled Reactor Materials 10-13 June 2014
Transcript of High Temperature Alloy 617 Properties for Engineering ... · High Temperature Alloy 617 Properties...
High Temperature Alloy 617 Properties for
Engineering Design:
Creep, Fatigue & Creep-Fatigue
Thomas Lillo
Idaho National Laboratory
Program Lead: Dr. R.N. Wright
Technical Meeting on High-Temperature Qualification of High Temperature Gas Cooled Reactor Materials
10-13 June 2014
Creep and Onset of Tertiary Creep
Lead: Thomas Lillo
Team Members: Julian Benz, J.K. Wright
Idaho National Laboratory
Technical Meeting on High-Temperature Qualification of High Temperature Gas Cooled Reactor Materials
10-13 June 2014
Relevance to Elevated Temperature
Design
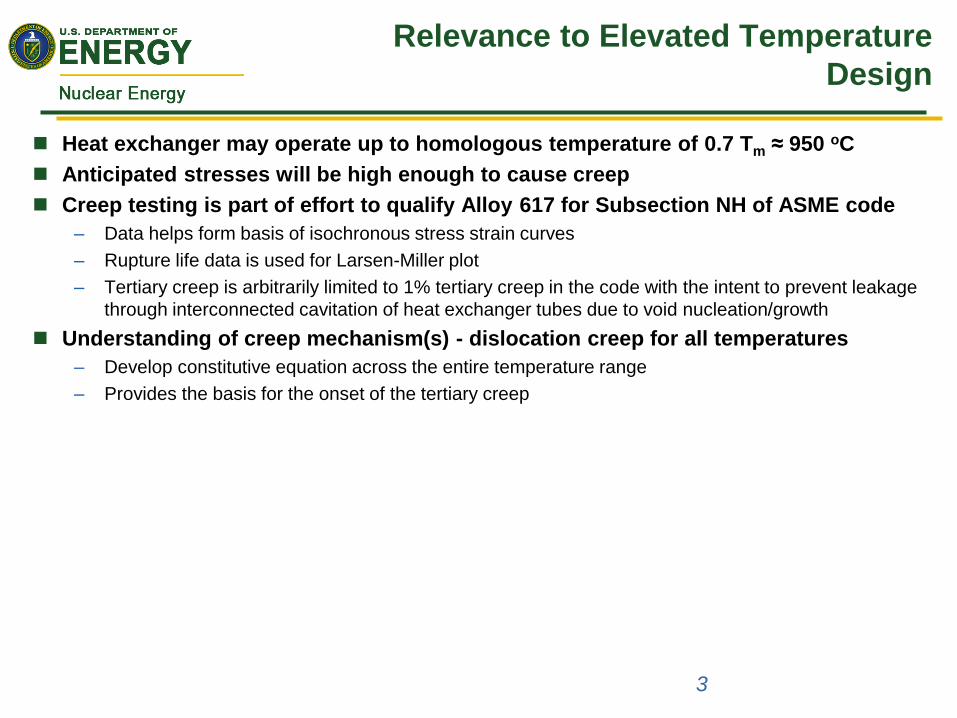
Heat exchanger may operate up to homologous temperature of 0.7 Tm ≈ 950 oC
Anticipated stresses will be high enough to cause creep
Creep testing is part of effort to qualify Alloy 617 for Subsection NH of ASME code
– Data helps form basis of isochronous stress strain curves
– Rupture life data is used for Larsen-Miller plot
– Tertiary creep is arbitrarily limited to 1% tertiary creep in the code with the intent to prevent leakage
through interconnected cavitation of heat exchanger tubes due to void nucleation/growth
Understanding of creep mechanism(s) - dislocation creep for all temperatures
– Develop constitutive equation across the entire temperature range
– Provides the basis for the onset of the tertiary creep
3
Time (h)
0 1000 2000 3000 4000 5000
Str
ain
(%
)
0
10
20
30
40
50
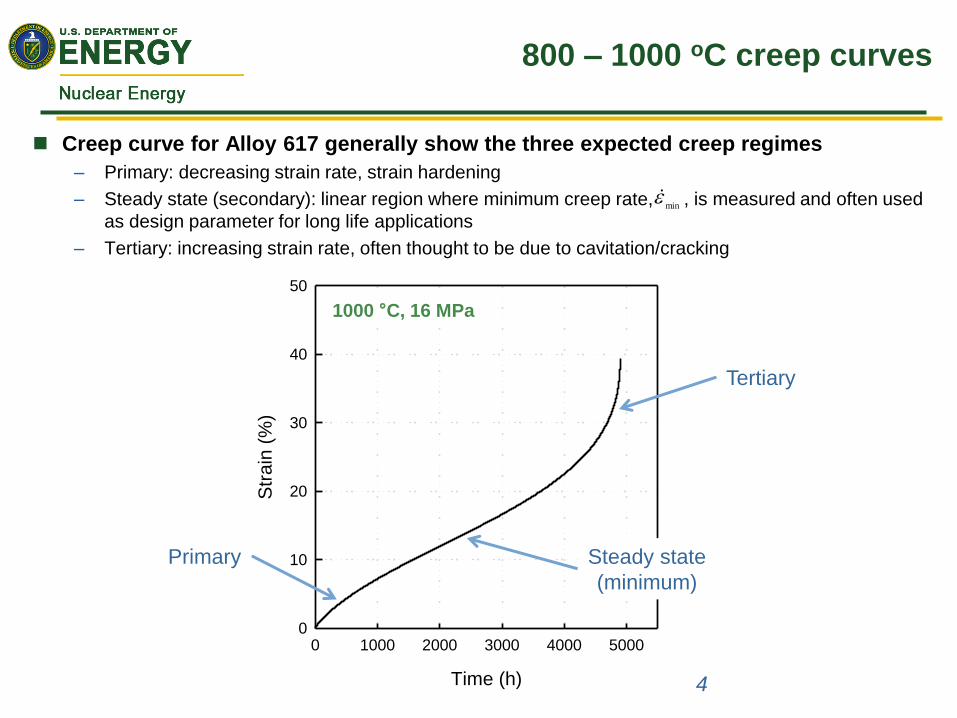
800 – 1000 oC creep curves
Creep curve for Alloy 617 generally show the three expected creep regimes
– Primary: decreasing strain rate, strain hardening
– Steady state (secondary): linear region where minimum creep rate, , is measured and often used
as design parameter for long life applications
– Tertiary: increasing strain rate, often thought to be due to cavitation/cracking
4
1000 °C, 16 MPa
Primary
Tertiary
Steady state
(minimum)
min
Time (h)
0 1000 2000 3000 4000 5000 6000
Str
ain
(%
)
0
5
10
15
20
25
121 MPa
145 MPa
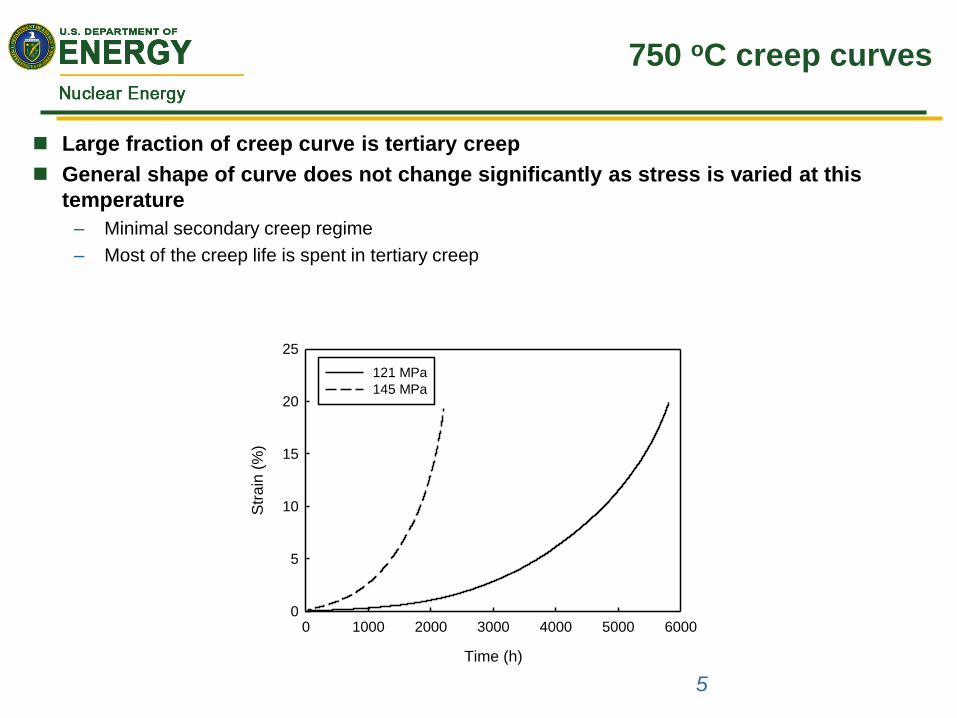
750 oC creep curves
Large fraction of creep curve is tertiary creep
General shape of curve does not change significantly as stress is varied at this
temperature
– Minimal secondary creep regime
– Most of the creep life is spent in tertiary creep
5
Minimum Creep Rates
6
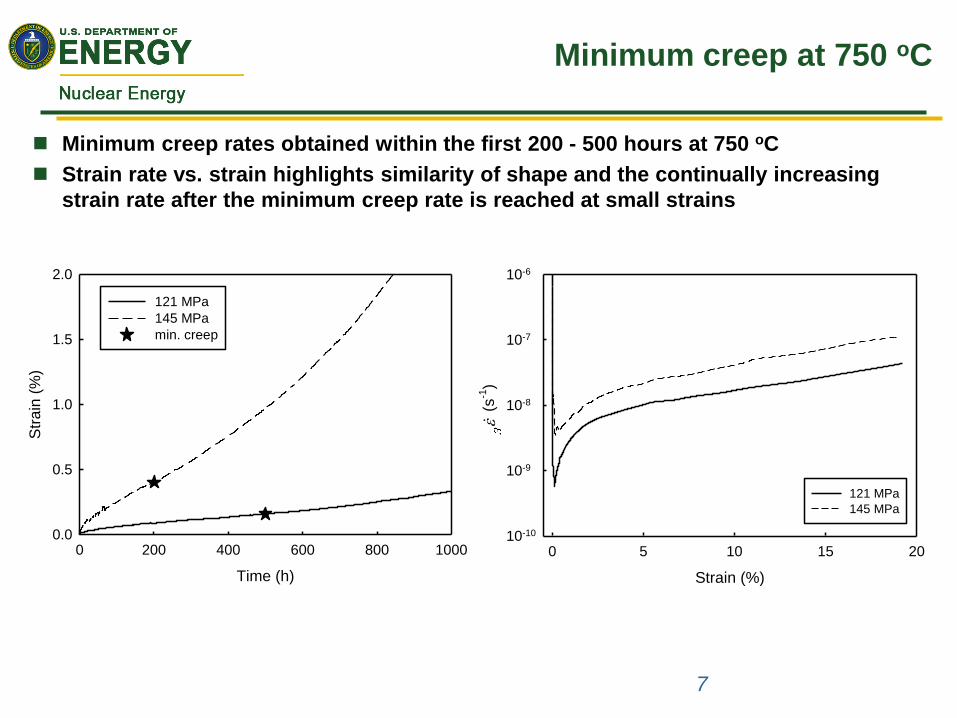
Minimum creep at 750 oC
Minimum creep rates obtained within the first 200 - 500 hours at 750 oC
Strain rate vs. strain highlights similarity of shape and the continually increasing
strain rate after the minimum creep rate is reached at small strains
7
Time (h)
0 200 400 600 800 1000
Str
ain
(%
)
0.0
0.5
1.0
1.5
2.0
121 MPa
145 MPa
min. creep
Strain (%)
0 5 10 15 20
(s-1
)
10-10
10-9
10-8
10-7
10-6
121 MPa
145 MPa
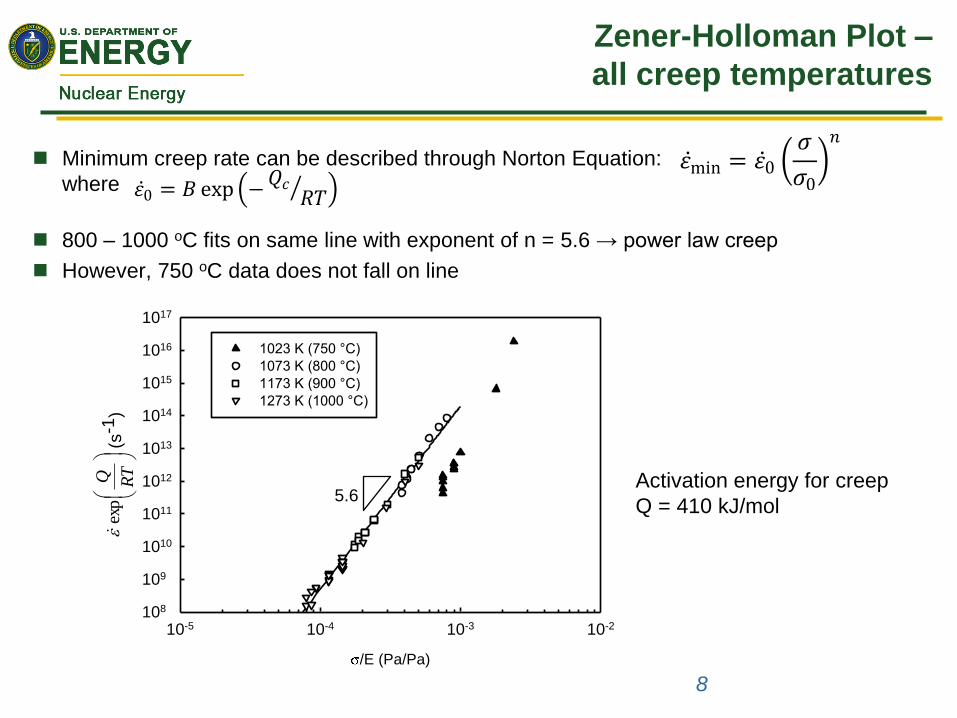
Zener-Holloman Plot –
all creep temperatures
Minimum creep rate can be described through Norton Equation:
where
800 – 1000 oC fits on same line with exponent of n = 5.6 → power law creep
However, 750 oC data does not fall on line
8
/E (Pa/Pa)
10-5 10-4 10-3 10-2
Z (s
-1)
108
109
1010
1011
1012
1013
1014
1015
1016
1017
1023 K (750 °C)
1073 K (800 °C)
1173 K (900 °C)
1273 K (1000 °C)
5.6
RTQ
exp
Activation energy for creep
Q = 410 kJ/mol
𝜀 min = 𝜀 0 𝜎
𝜎0 𝑛
𝜀 0 = 𝐵 exp −
𝑄𝑐𝑅𝑇
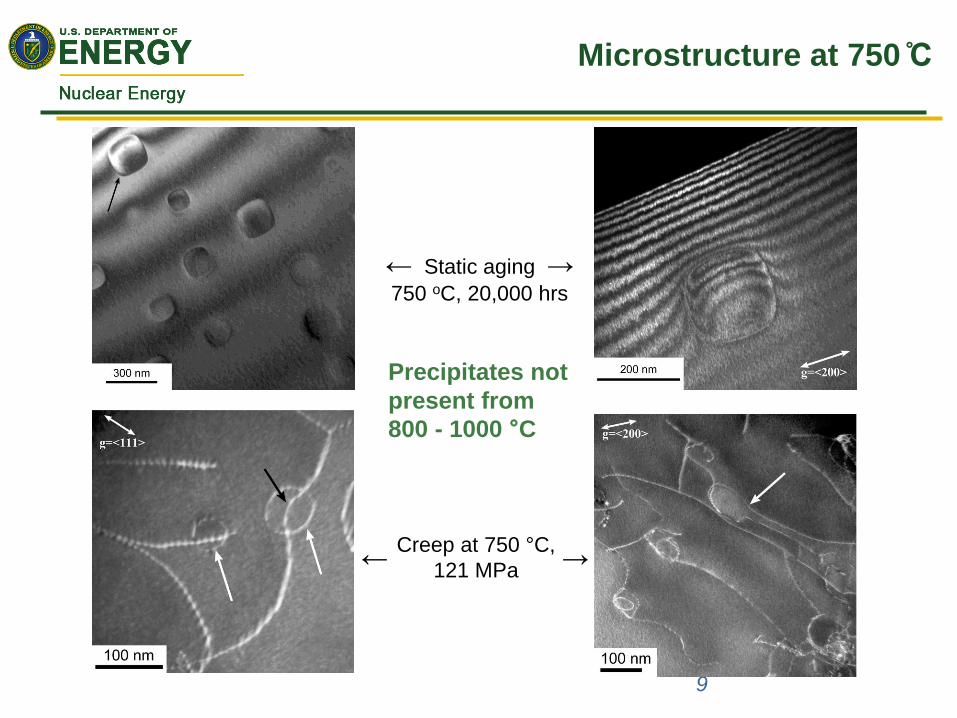
Microstructure at 750 ̊C
← Creep at 750 °C,
121 MPa →
9
← Static aging → 750 oC, 20,000 hrs
Precipitates not
present from
800 - 1000 °C
/E (Pa/Pa)
10-5 10-4 10-3 10-2
Z (
s-1
)
108
109
1010
1011
1012
1013
1014
1015
1016
1017
750 °C
800 °C
900 °C
1000 °C
σ0 = 65 MPa
RTQ
exp
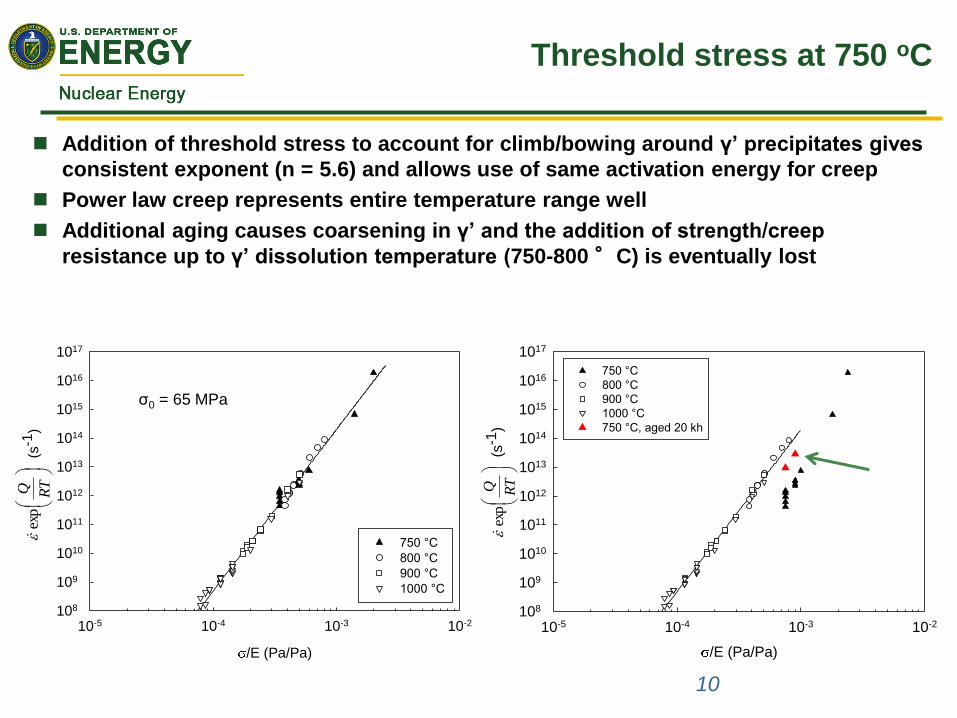
Threshold stress at 750 oC
Addition of threshold stress to account for climb/bowing around γ’ precipitates gives
consistent exponent (n = 5.6) and allows use of same activation energy for creep
Power law creep represents entire temperature range well
Additional aging causes coarsening in γ’ and the addition of strength/creep
resistance up to γ’ dissolution temperature (750-800 °C) is eventually lost
10
/E (Pa/Pa)
10-5 10-4 10-3 10-2
Z
(
s-1
)
108
109
1010
1011
1012
1013
1014
1015
1016
1017
750 °C
800 °C
900 °C
1000 °C
750 °C, aged 20 kh
RTQ
exp

Onset of Tertiary Creep
Onset of tertiary creep
In other alloys, tertiary creep generally initiates after significant time in steady state
(i.e. minimum) creep – a substantial portion of the creep life is spent in secondary
creep regime
Tertiary creep is usually correlated with the formation of creep cavities → less cross
section to carry load so stress increases and leads to increased strain rates
Creep voids can interconnect and cause cracking/rupture
Creep curves for our heat of Alloy 617 have shown that tertiary creep is established
very quickly at many conditions, sometimes at only few % strain (e.g. creep test at
1000 oC , 12 MPa → tertiary creep initiates at 1~2 % total strain,800 h but specimen
ruptures above 60% total strain)
Limit of 1% tertiary creep in subsection NH of ASME code may be overly conservative
for Alloy 617
12
0.0
0.2
0.4
0.6
0.8
1.0
1.2
1.4
0.0 5.0 10.0 15.0 20.0 25.0
Ave
rage
Po
rosi
ty in
th
e G
age
Sect
ion
(%
)
Interrupted Creep Strain (%)
750 C, 121 MPa
750 C, 145 MPa
0.0
0.2
0.4
0.6
0.8
1.0
1.2
1.4
0.0 5.0 10.0 15.0 20.0 25.0
Ave
rage
Po
rosi
ty in
th
e G
age
Sect
ion
(%
)
Interrupted Creep Strain (%)
1000 C, 10 MPa
1000 C, 16 MPa
1000 C, 20 MPa
1000 C, 28 MPa
1000 C, 41 MPa
1000 C, 56 MPa
1000 C, 70 MPa
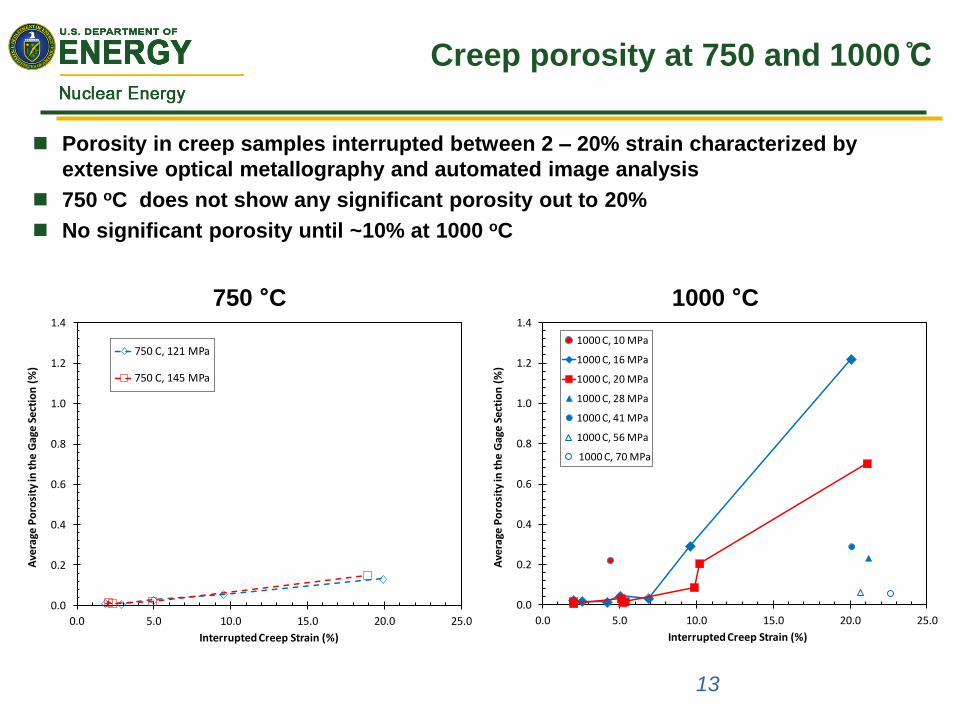
Creep porosity at 750 and 1000 ̊C
Porosity in creep samples interrupted between 2 – 20% strain characterized by
extensive optical metallography and automated image analysis
750 oC does not show any significant porosity out to 20%
No significant porosity until ~10% at 1000 oC
13
750 °C 1000 °C
0.0
0.2
0.4
0.6
0.8
1.0
1.2
1.4
0.0 5.0 10.0 15.0 20.0
Ave
rage
Po
rosi
ty in
th
e G
age
Se
ctio
n, %
Tertiary Creep Strain, %
1000 C, 10 MPa
1000 C, 16 MPa
1000 C, 20 MPa
1000 C, 28 MPa
1000 C, 41 MPa
1000 C, 56 MPa
1000 C, 70 MPa
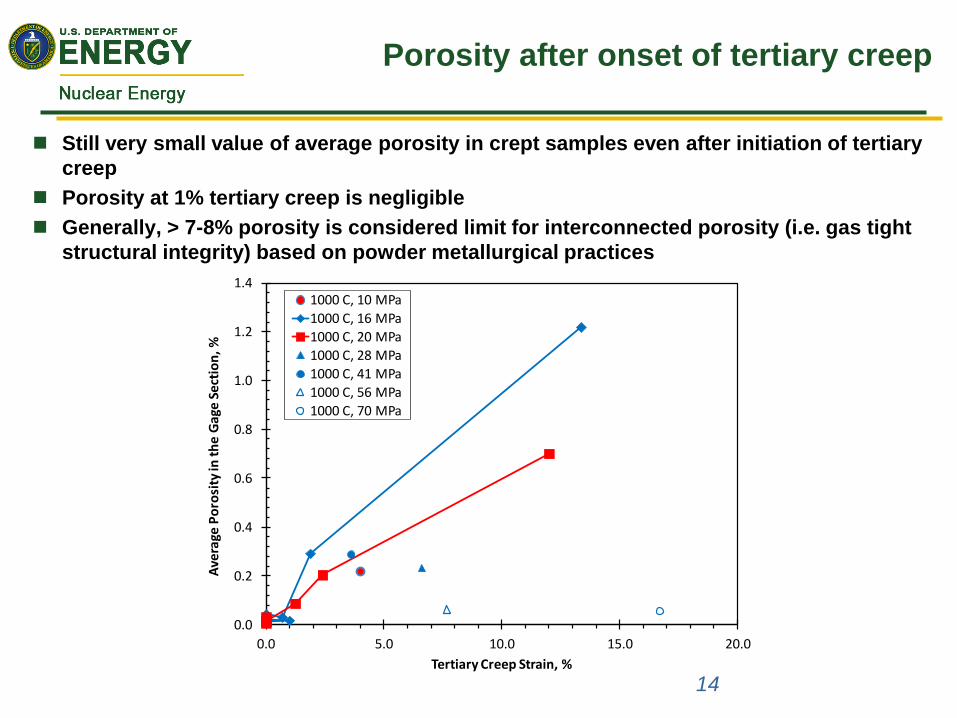
Porosity after onset of tertiary creep
Still very small value of average porosity in crept samples even after initiation of tertiary
creep
Porosity at 1% tertiary creep is negligible
Generally, > 7-8% porosity is considered limit for interconnected porosity (i.e. gas tight
structural integrity) based on powder metallurgical practices
14
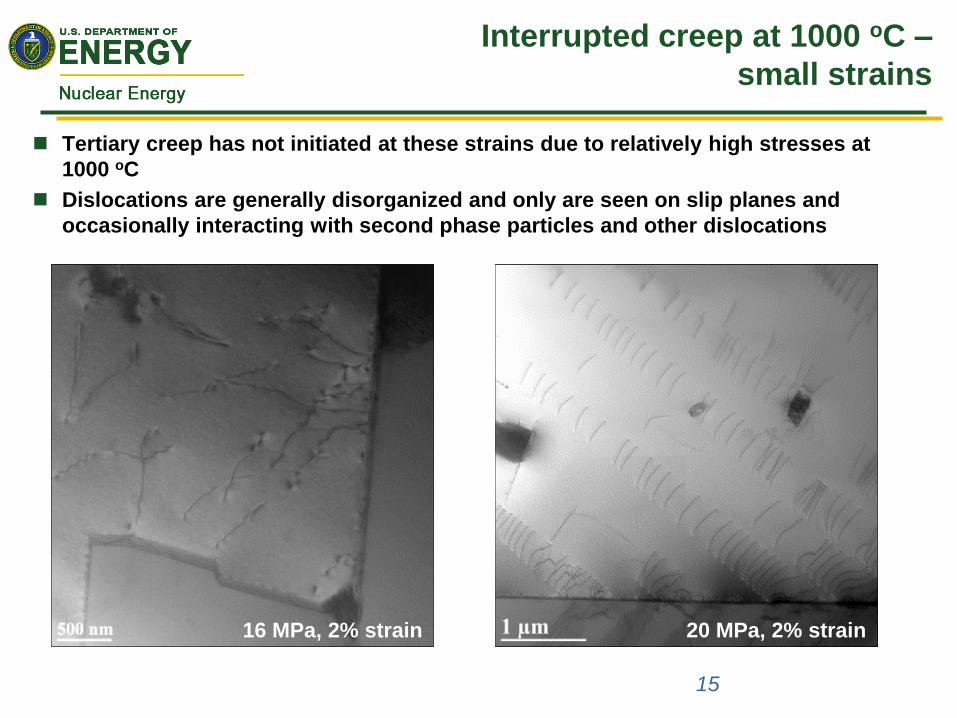
Interrupted creep at 1000 oC –
small strains
Tertiary creep has not initiated at these strains due to relatively high stresses at
1000 oC
Dislocations are generally disorganized and only are seen on slip planes and
occasionally interacting with second phase particles and other dislocations
15
16 MPa, 2% strain 20 MPa, 2% strain
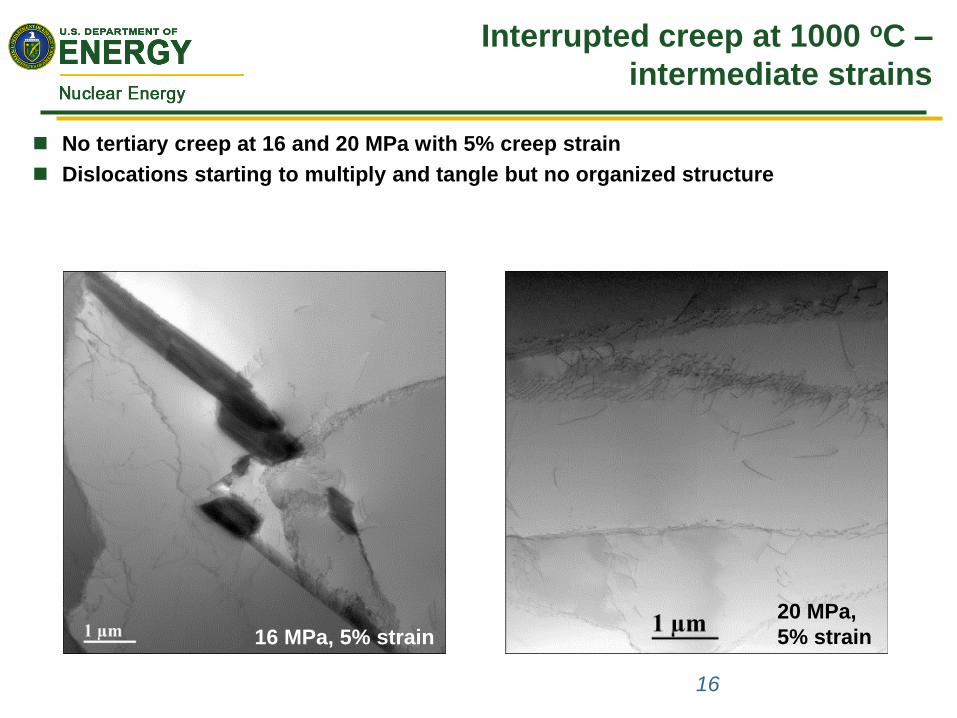
Interrupted creep at 1000 oC –
intermediate strains
No tertiary creep at 16 and 20 MPa with 5% creep strain
Dislocations starting to multiply and tangle but no organized structure
16
16 MPa, 5% strain
20 MPa,
5% strain
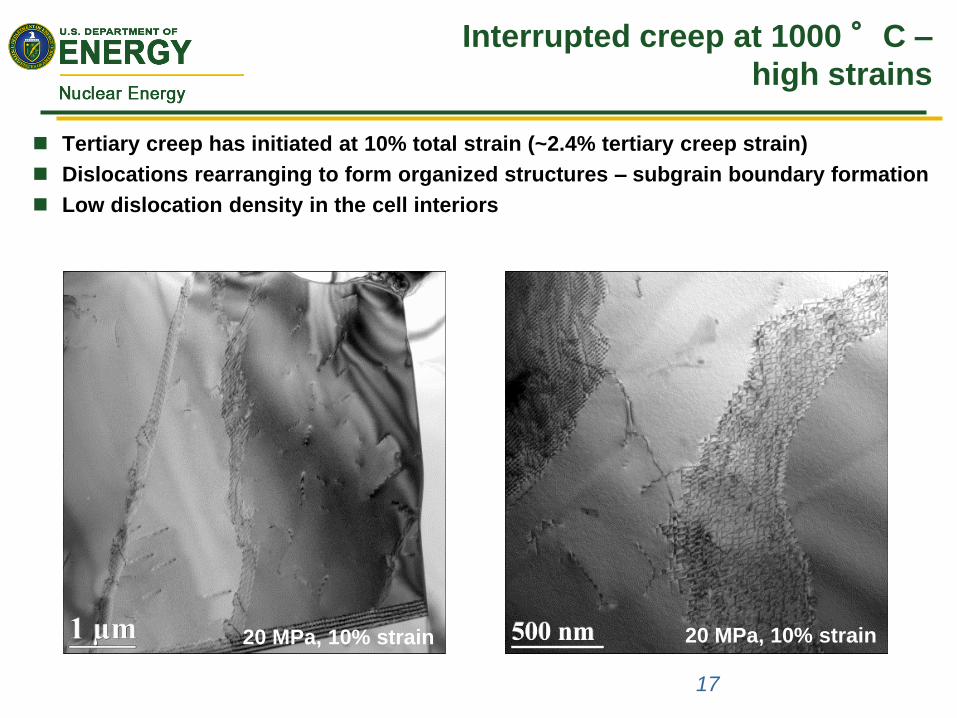
Interrupted creep at 1000 °C –
high strains
Tertiary creep has initiated at 10% total strain (~2.4% tertiary creep strain)
Dislocations rearranging to form organized structures – subgrain boundary formation
Low dislocation density in the cell interiors
17
20 MPa, 10% strain 20 MPa, 10% strain
Subgrain formation and relation to
tertiary creep
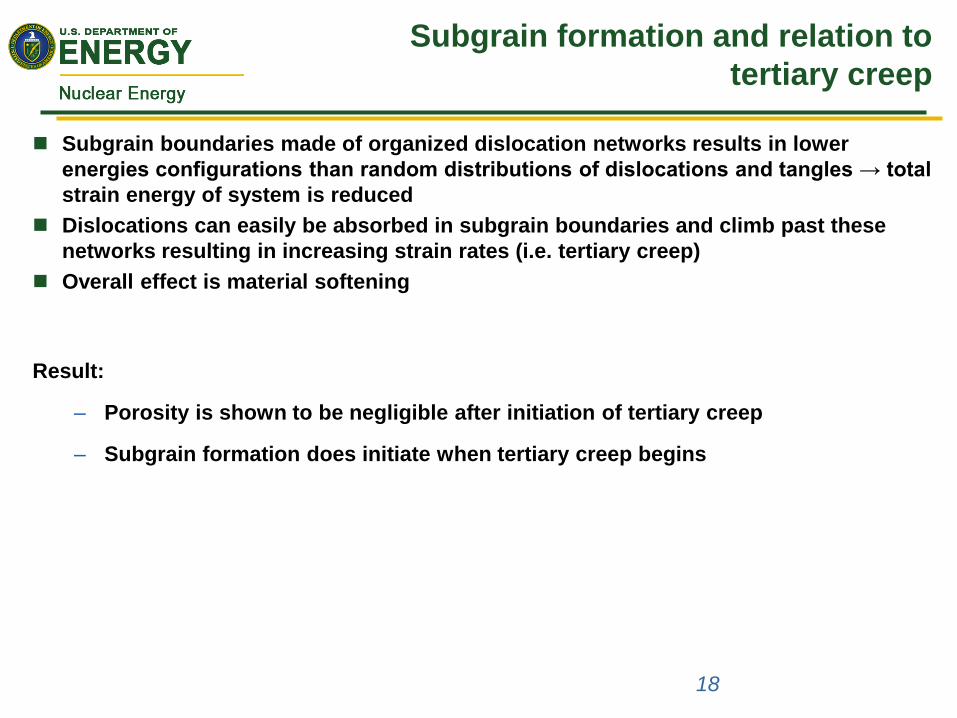
Subgrain boundaries made of organized dislocation networks results in lower
energies configurations than random distributions of dislocations and tangles → total
strain energy of system is reduced
Dislocations can easily be absorbed in subgrain boundaries and climb past these
networks resulting in increasing strain rates (i.e. tertiary creep)
Overall effect is material softening
Result:
– Porosity is shown to be negligible after initiation of tertiary creep
– Subgrain formation does initiate when tertiary creep begins
18
Summary
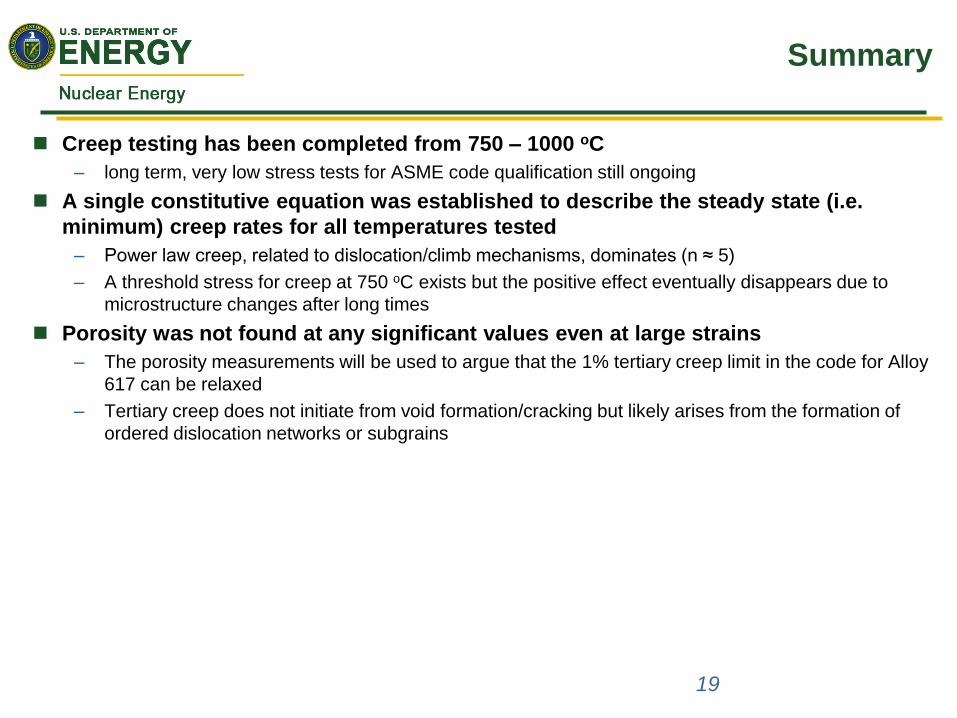
Creep testing has been completed from 750 – 1000 oC
– long term, very low stress tests for ASME code qualification still ongoing
A single constitutive equation was established to describe the steady state (i.e.
minimum) creep rates for all temperatures tested
– Power law creep, related to dislocation/climb mechanisms, dominates (n ≈ 5)
– A threshold stress for creep at 750 oC exists but the positive effect eventually disappears due to
microstructure changes after long times
Porosity was not found at any significant values even at large strains
– The porosity measurements will be used to argue that the 1% tertiary creep limit in the code for Alloy
617 can be relaxed
– Tertiary creep does not initiate from void formation/cracking but likely arises from the formation of
ordered dislocation networks or subgrains
19
Fatigue of Alloy 617 at Low and High Temperatures
Richard Wright
Idaho National Laboratory
Technical Meeting on High-Temperature Qualification of High Temperature Gas Cooled Reactor Materials
10-13 June 2014
Fatigue in the ASME Code
Section III – Nuclear Design
– Subsection NB
• Temperatures less than 427ºC (800ºF) for austenitic alloys
• Elastic deformation only
• Includes fatigue effects in the form of a fatigue design curve
– Subsection NH – Elevated Temperature Design
• Temperatures greater than 427ºC
• Inelastic deformation is permitted
• Interaction of creep and fatigue is believed to be most severe structural failure mode
21
Alloy 617 ASME Section III NB Code
Qualification
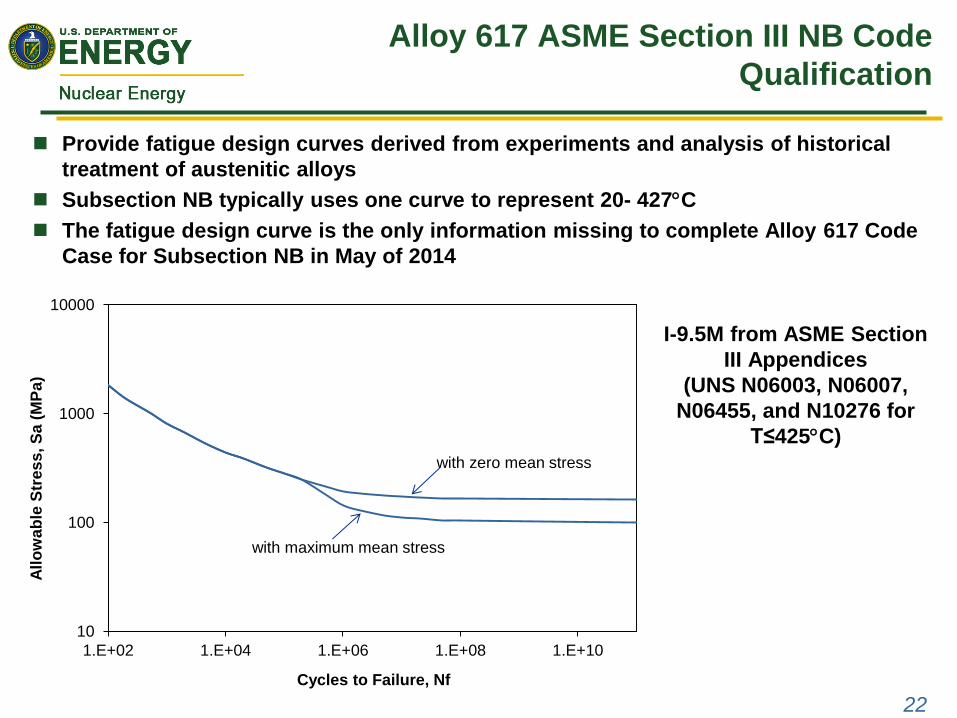
Provide fatigue design curves derived from experiments and analysis of historical
treatment of austenitic alloys
Subsection NB typically uses one curve to represent 20- 427C
The fatigue design curve is the only information missing to complete Alloy 617 Code
Case for Subsection NB in May of 2014
22
10
100
1000
10000
1.E+02 1.E+04 1.E+06 1.E+08 1.E+10
All
ow
ab
le S
tres
s, S
a (
MP
a)
Cycles to Failure, Nf
with zero mean stress
with maximum mean stress
I-9.5M from ASME Section
III Appendices
(UNS N06003, N06007,
N06455, and N10276 for
T≤425C)
ASME Fatigue Procedure
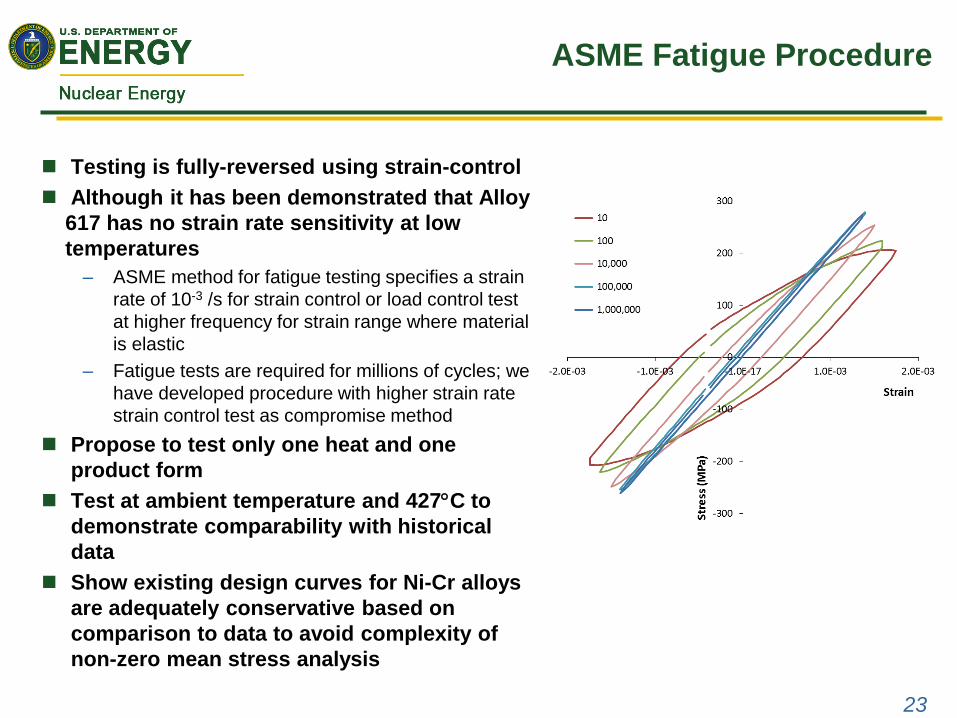
Testing is fully-reversed using strain-control
Although it has been demonstrated that Alloy
617 has no strain rate sensitivity at low
temperatures
– ASME method for fatigue testing specifies a strain
rate of 10-3 /s for strain control or load control test
at higher frequency for strain range where material
is elastic
– Fatigue tests are required for millions of cycles; we
have developed procedure with higher strain rate
strain control test as compromise method
Propose to test only one heat and one
product form
Test at ambient temperature and 427C to
demonstrate comparability with historical
data
Show existing design curves for Ni-Cr alloys
are adequately conservative based on
comparison to data to avoid complexity of
non-zero mean stress analysis
23
Definition of Parameters Used to Calculate
Design Curve
24
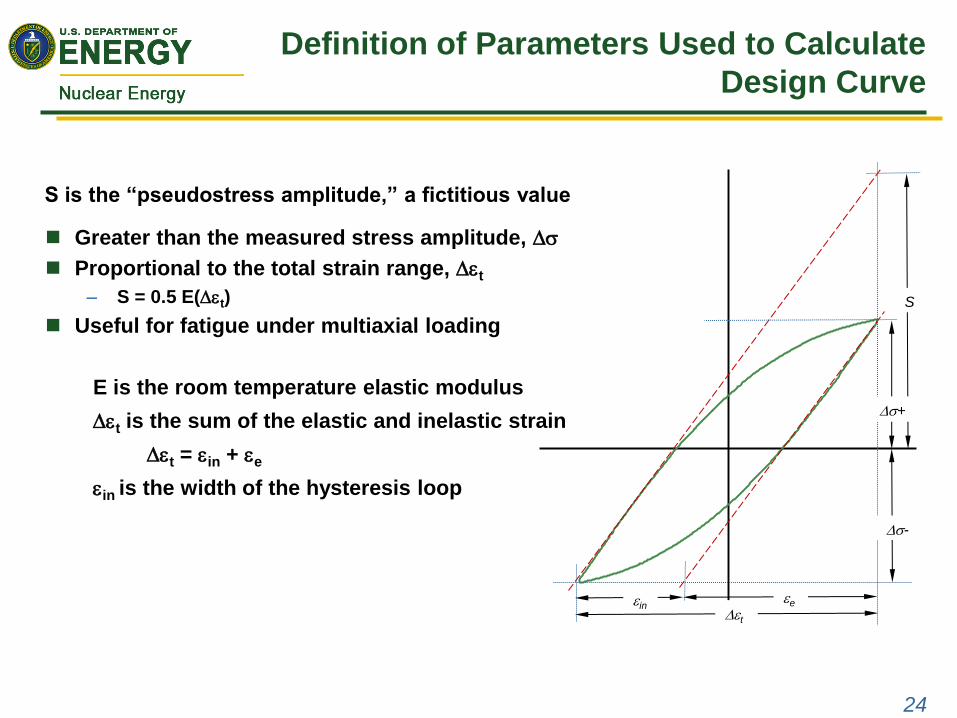
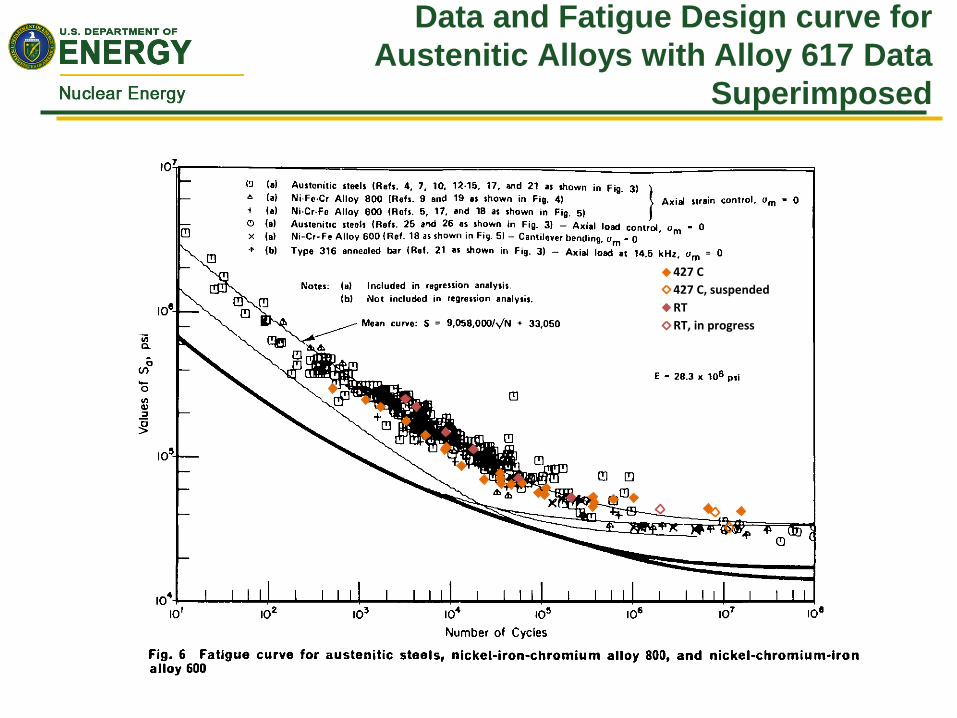
S is the “pseudostress amplitude,” a fictitious value
Greater than the measured stress amplitude, Ds
Proportional to the total strain range, Dt
– S = 0.5 E(Dt)
Useful for fatigue under multiaxial loading
E is the room temperature elastic modulus
Dt is the sum of the elastic and inelastic strain
Dt = in + e
in is the width of the hysteresis loop
Ds-
S
Ds+
in Dt
e
Process for Developing a Design Curve
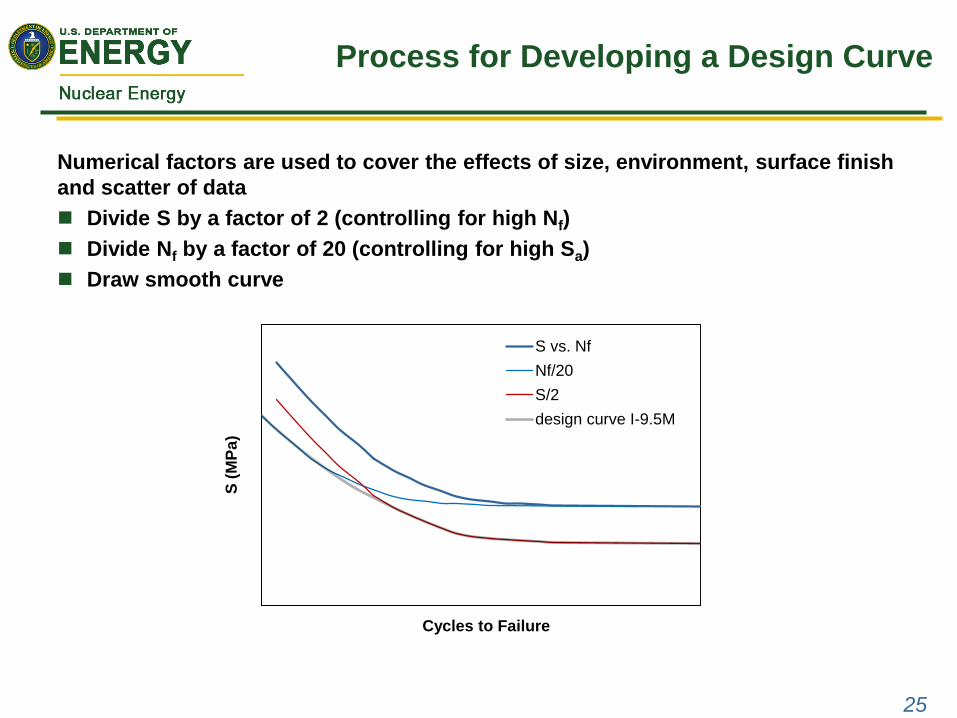
Numerical factors are used to cover the effects of size, environment, surface finish
and scatter of data
Divide S by a factor of 2 (controlling for high Nf)
Divide Nf by a factor of 20 (controlling for high Sa)
Draw smooth curve
25
S (
MP
a)
Cycles to Failure
S vs. Nf
Nf/20
S/2
design curve I-9.5M
427 C
427 C, suspended
RT
RT, in progress
Data and Fatigue Design curve for
Austenitic Alloys with Alloy 617 Data
Superimposed
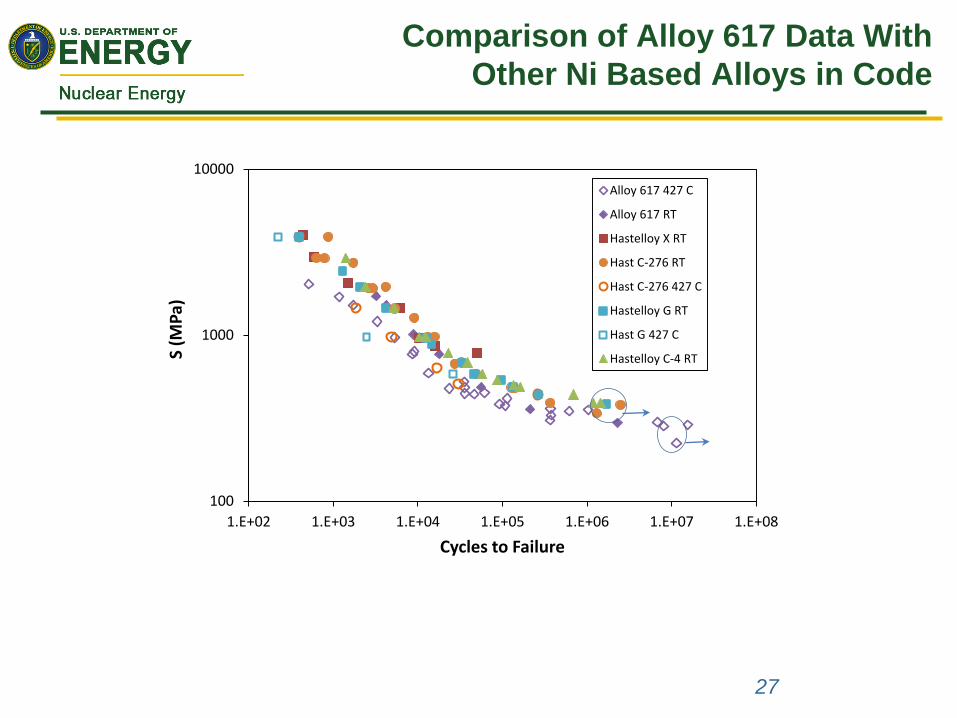
Comparison of Alloy 617 Data With
Other Ni Based Alloys in Code
27
100
1000
10000
1.E+02 1.E+03 1.E+04 1.E+05 1.E+06 1.E+07 1.E+08
S (M
Pa)
Cycles to Failure
Alloy 617 427 C
Alloy 617 RT
Hastelloy X RT
Hast C-276 RT
Hast C-276 427 C
Hastelloy G RT
Hast G 427 C
Hastelloy C-4 RT
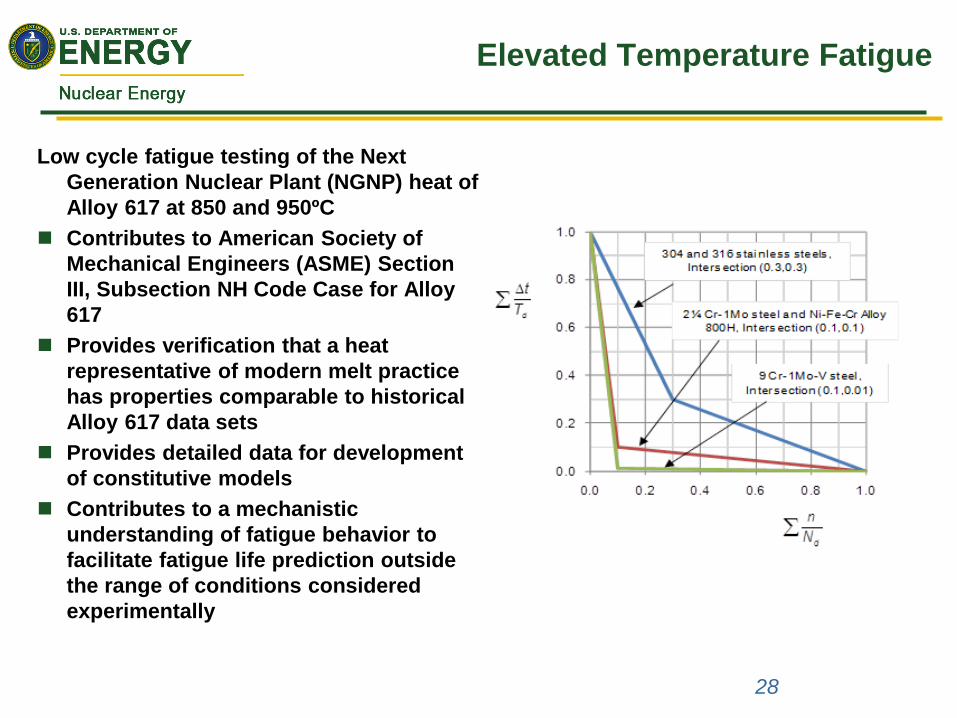
Elevated Temperature Fatigue
28
Low cycle fatigue testing of the Next
Generation Nuclear Plant (NGNP) heat of
Alloy 617 at 850 and 950ºC
Contributes to American Society of
Mechanical Engineers (ASME) Section
III, Subsection NH Code Case for Alloy
617
Provides verification that a heat
representative of modern melt practice
has properties comparable to historical
Alloy 617 data sets
Provides detailed data for development
of constitutive models
Contributes to a mechanistic
understanding of fatigue behavior to
facilitate fatigue life prediction outside
the range of conditions considered
experimentally
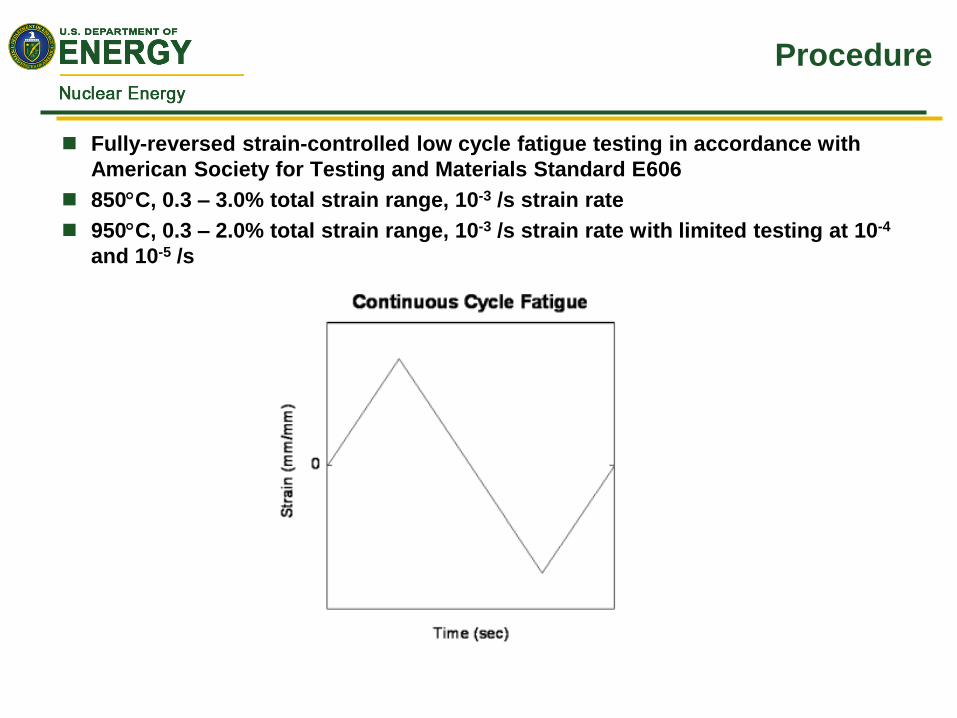
Procedure
Fully-reversed strain-controlled low cycle fatigue testing in accordance with
American Society for Testing and Materials Standard E606
850C, 0.3 – 3.0% total strain range, 10-3 /s strain rate
950C, 0.3 – 2.0% total strain range, 10-3 /s strain rate with limited testing at 10-4
and 10-5 /s
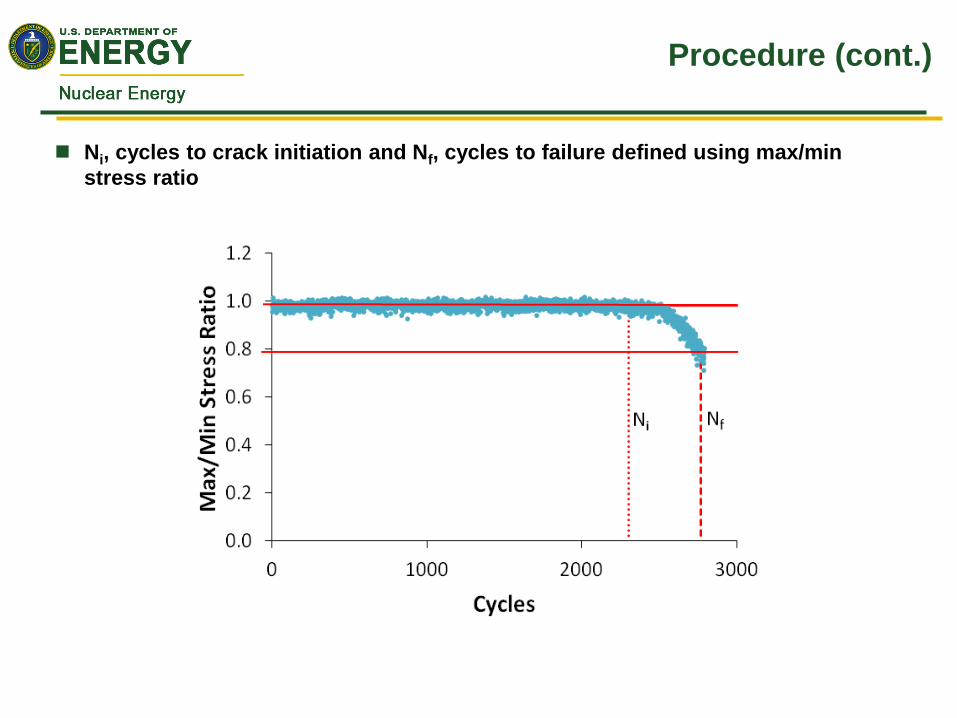
Procedure (cont.)
Ni, cycles to crack initiation and Nf, cycles to failure defined using max/min
stress ratio
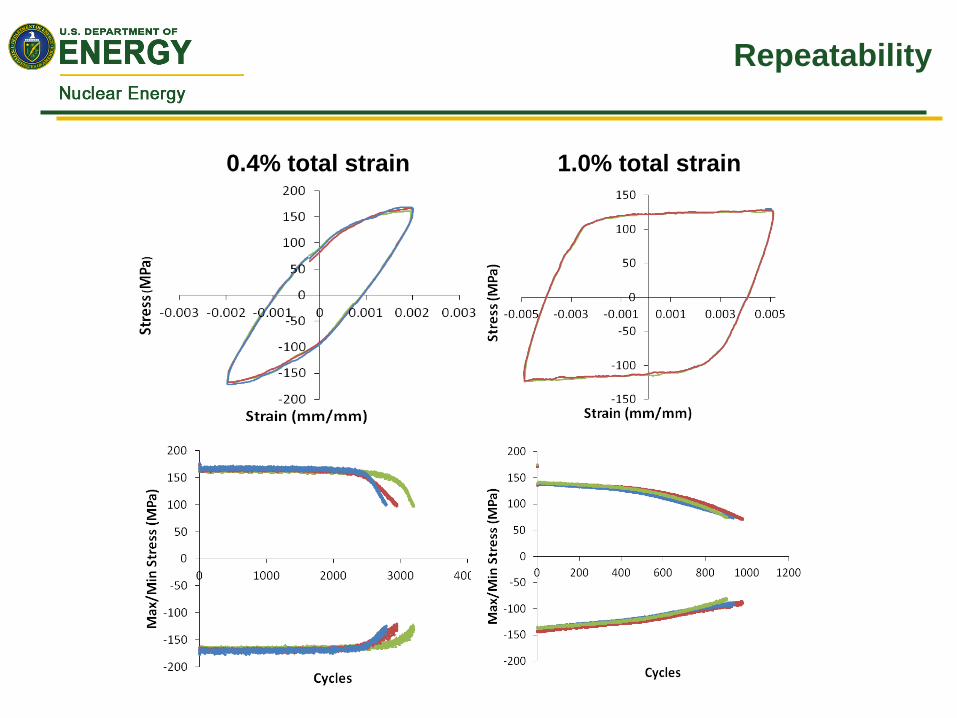
Repeatability
0.4% total strain 1.0% total strain
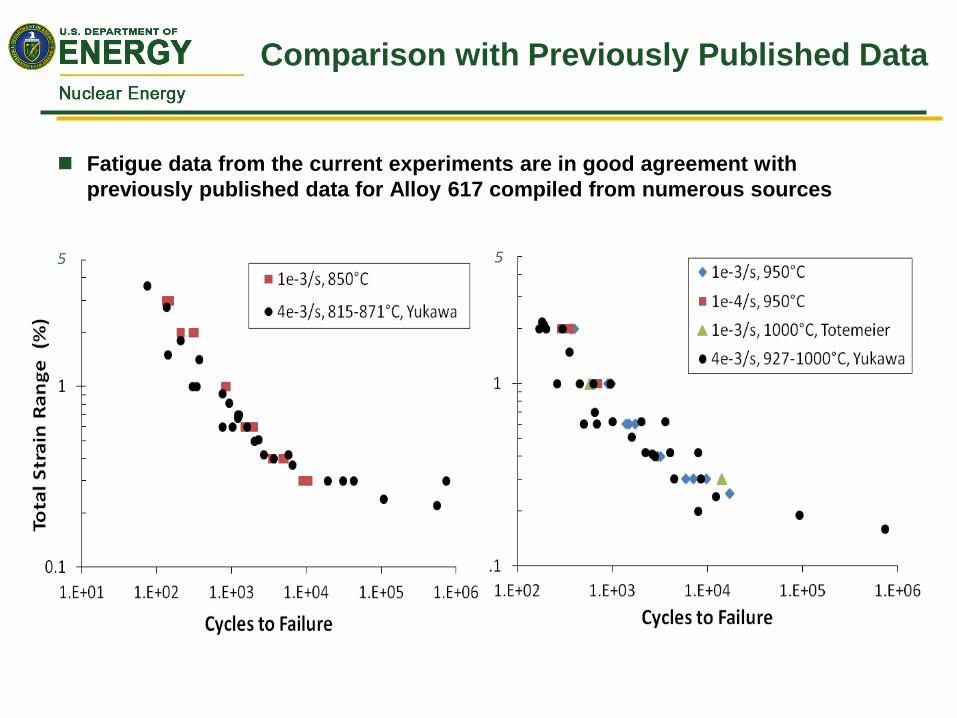
Comparison with Previously Published Data
Fatigue data from the current experiments are in good agreement with
previously published data for Alloy 617 compiled from numerous sources
5 5
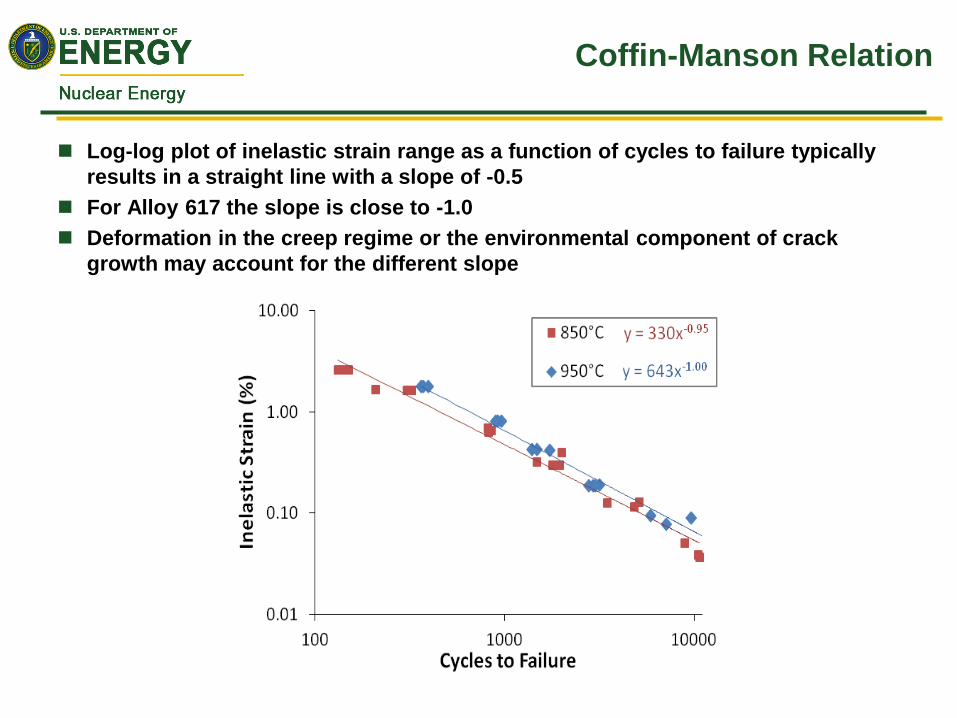
Coffin-Manson Relation
Log-log plot of inelastic strain range as a function of cycles to failure typically
results in a straight line with a slope of -0.5
For Alloy 617 the slope is close to -1.0
Deformation in the creep regime or the environmental component of crack
growth may account for the different slope
Summary
Fatigue testing to support low temperature (Section III NB) Code Case is
complete
Comparison of current test results with data used to develop existing Code
fatigue design curves supports the argument that Alloy 617 behavior is well
described by those curves
Low cycle fatigue testing of NGNP heat of Alloy 617 at 850 and 950ºC has been
completed
Low cycle fatigue properties are comparable to previously published data for
Alloy 617
Observed behavior for Alloy 617 follows a Coffin-Manson relationship
Alloy 617 Creep-Fatigue Characterization
Lead: Laura Carroll
Team Members: J. Simpson, Q.R. Lloyd, J.K. Wright
Idaho National Laboratory
Technical Meeting on High-Temperature Qualification of High Temperature Gas Cooled Reactor Materials
10-13 June 2014
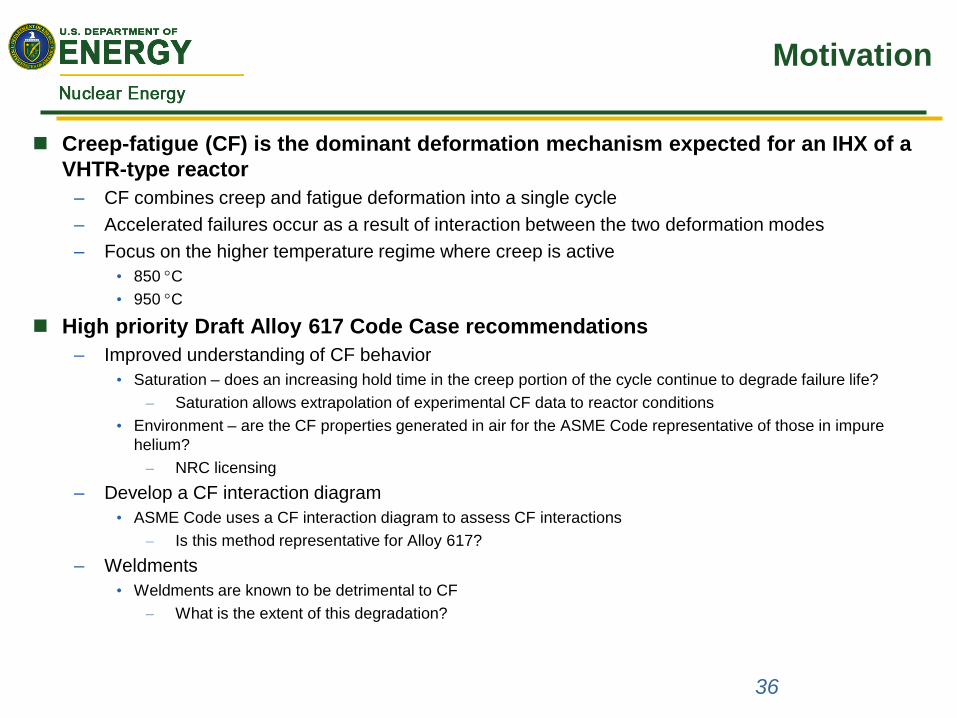
Motivation
36
Creep-fatigue (CF) is the dominant deformation mechanism expected for an IHX of a
VHTR-type reactor
– CF combines creep and fatigue deformation into a single cycle
– Accelerated failures occur as a result of interaction between the two deformation modes
– Focus on the higher temperature regime where creep is active
• 850 C
• 950 C
High priority Draft Alloy 617 Code Case recommendations
– Improved understanding of CF behavior
• Saturation – does an increasing hold time in the creep portion of the cycle continue to degrade failure life?
– Saturation allows extrapolation of experimental CF data to reactor conditions
• Environment – are the CF properties generated in air for the ASME Code representative of those in impure
helium?
– NRC licensing
– Develop a CF interaction diagram
• ASME Code uses a CF interaction diagram to assess CF interactions
– Is this method representative for Alloy 617?
– Weldments
• Weldments are known to be detrimental to CF
– What is the extent of this degradation?
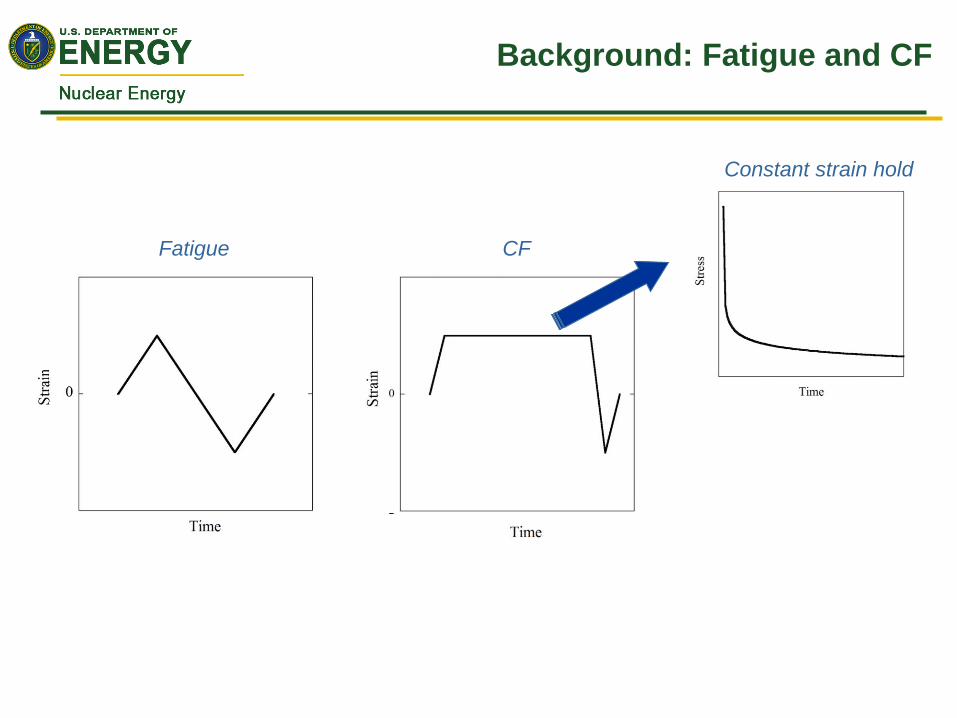
Background: Fatigue and CF
Fatigue
Constant strain hold
CF
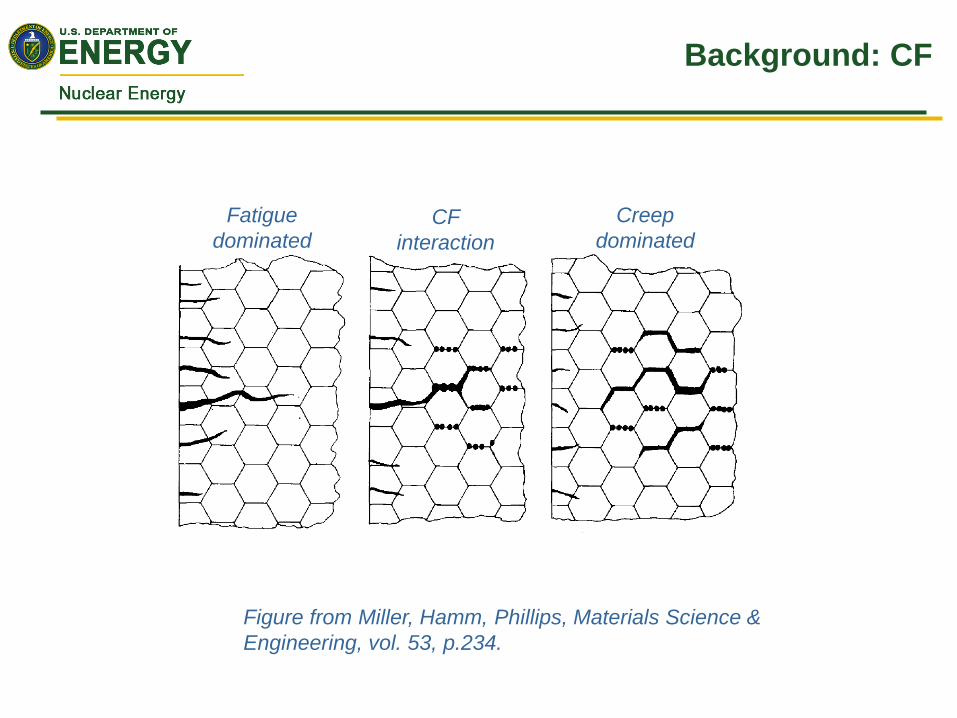
Background: CF
Figure from Miller, Hamm, Phillips, Materials Science &
Engineering, vol. 53, p.234.
CF
interaction
Fatigue
dominated
Creep
dominated
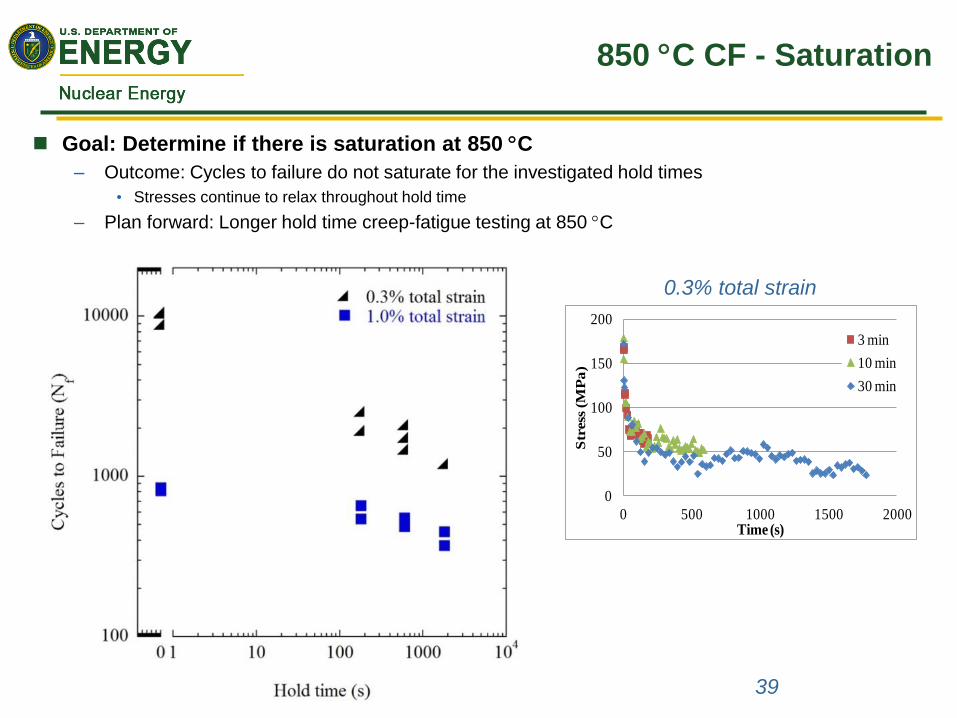
850 C CF - Saturation
39
Goal: Determine if there is saturation at 850 C
– Outcome: Cycles to failure do not saturate for the investigated hold times
• Stresses continue to relax throughout hold time
– Plan forward: Longer hold time creep-fatigue testing at 850 C
0
50
100
150
200
0 500 1000 1500 2000
Str
ess
(M
Pa
)
Time (s)
3 min
10 min
30 min
0.3% total strain
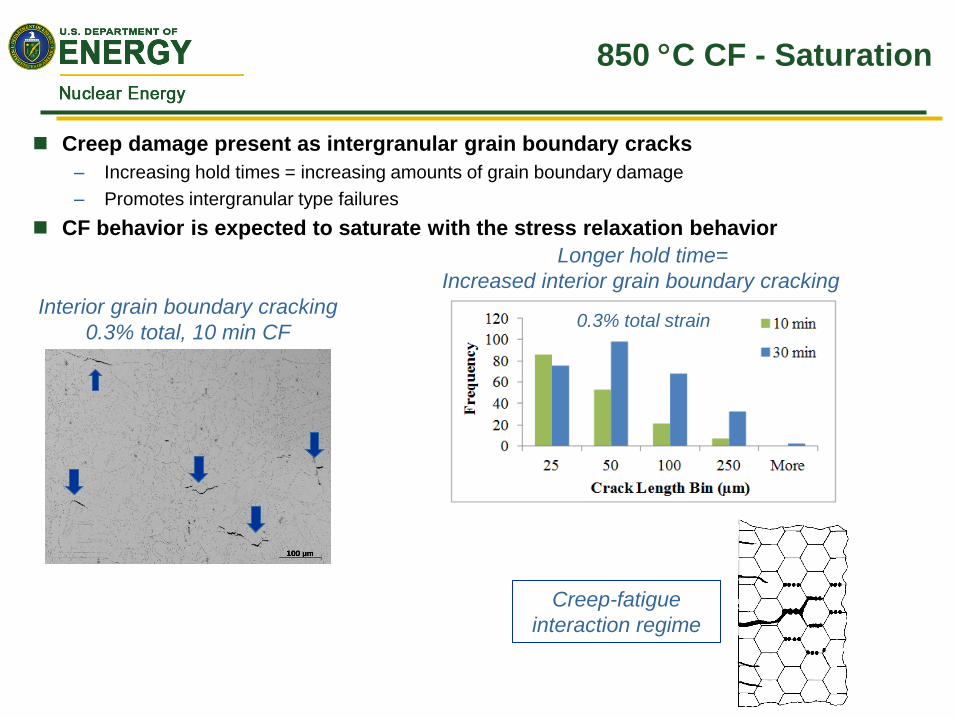
Creep damage present as intergranular grain boundary cracks
– Increasing hold times = increasing amounts of grain boundary damage
– Promotes intergranular type failures
CF behavior is expected to saturate with the stress relaxation behavior
850 C CF - Saturation
Creep-fatigue
interaction regime
Interior grain boundary cracking
0.3% total, 10 min CF 0.3% total strain
Longer hold time=
Increased interior grain boundary cracking
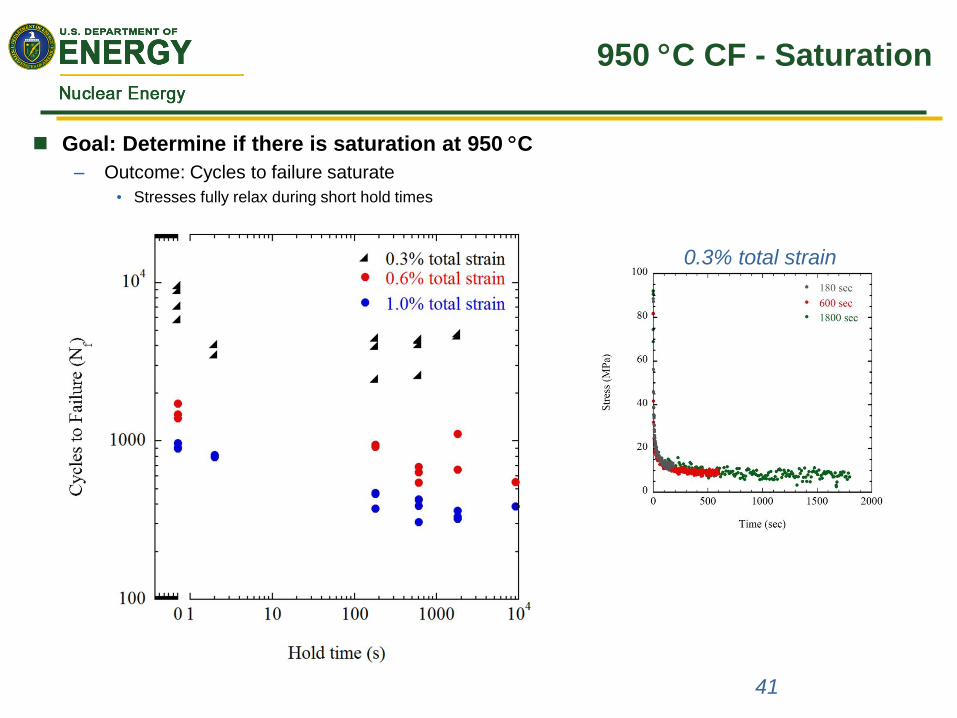
950 C CF - Saturation
41
Goal: Determine if there is saturation at 950 C
– Outcome: Cycles to failure saturate
• Stresses fully relax during short hold times
0.3% total strain
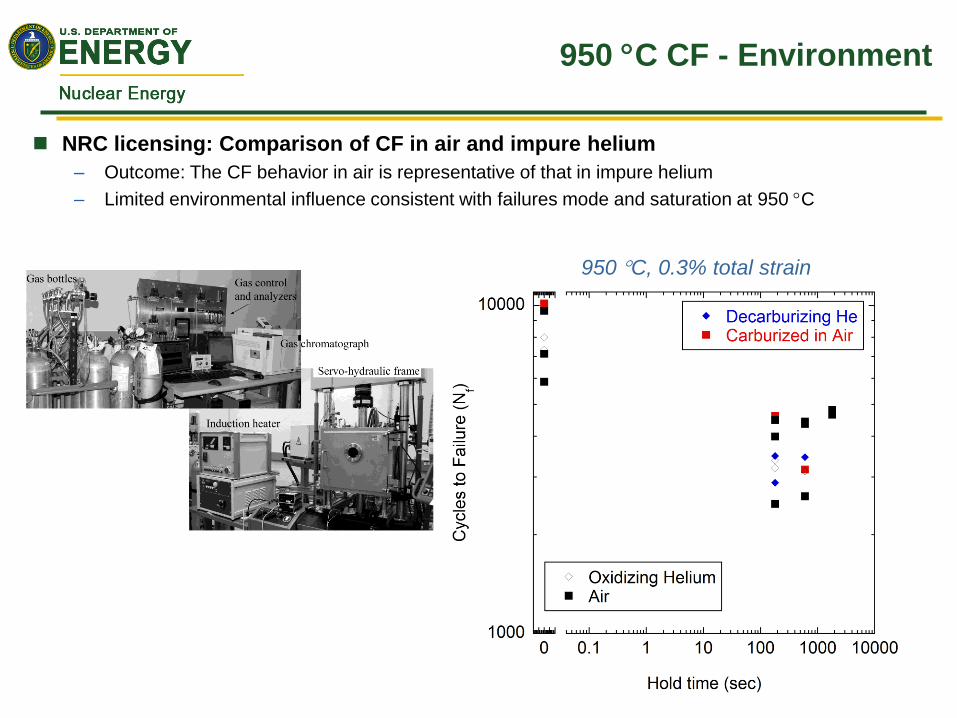
NRC licensing: Comparison of CF in air and impure helium
– Outcome: The CF behavior in air is representative of that in impure helium
– Limited environmental influence consistent with failures mode and saturation at 950 C
950 C CF - Environment
950 C, 0.3% total strain
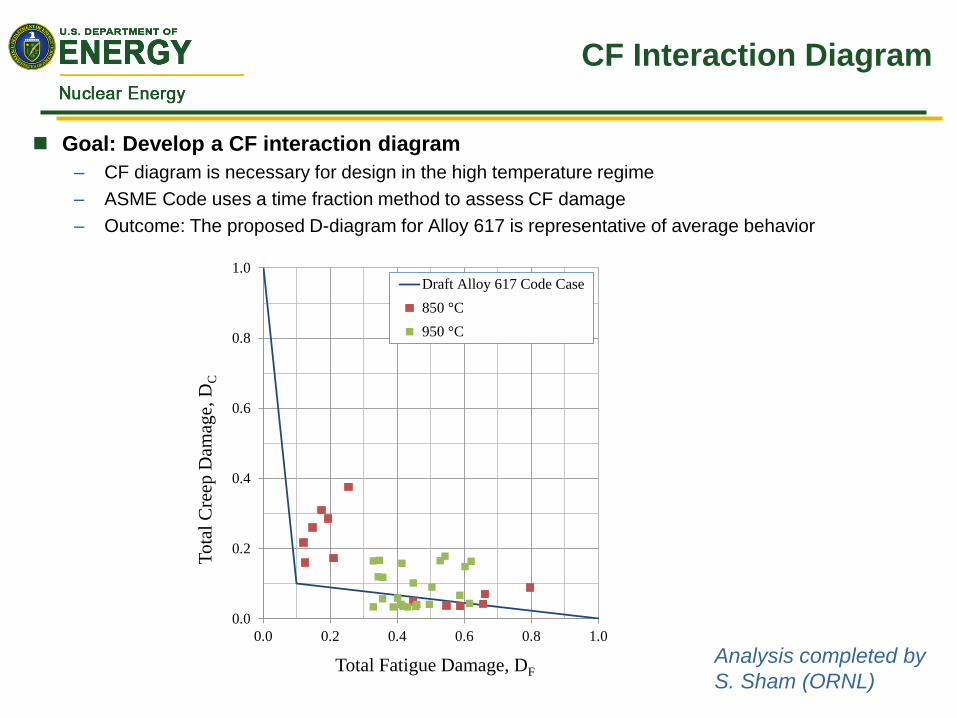
CF Interaction Diagram
Analysis completed by
S. Sham (ORNL)
Goal: Develop a CF interaction diagram
– CF diagram is necessary for design in the high temperature regime
– ASME Code uses a time fraction method to assess CF damage
– Outcome: The proposed D-diagram for Alloy 617 is representative of average behavior
0.0
0.2
0.4
0.6
0.8
1.0
0.0 0.2 0.4 0.6 0.8 1.0
Tota
l C
reep
Dam
age,
DC
Total Fatigue Damage, DF
Draft Alloy 617 Code Case
850 °C
950 °C
950 C CF Interaction Diagram
100
1000
10000
100 1000 10000
Ob
serv
ed
N2%
Predicted N2%
BE SMDE & Df by DT with Cyc by Cyc
Relax Strain
Cont. Cycling
3 min Dwell
10 min Dwell
30 min Dwell
150 min Dwell
1:1
x2
/2
100
1000
10000
100 1000 10000
Ob
serv
ed
N2%
Predicted N2%
BE time f ract & Df by DT with Cyc by Cyc
Relax Strain
Cont. Cycling
3 min Dwell
10 min Dwell
30 min Dwell
150 min Dwell
1:1
x2
/2
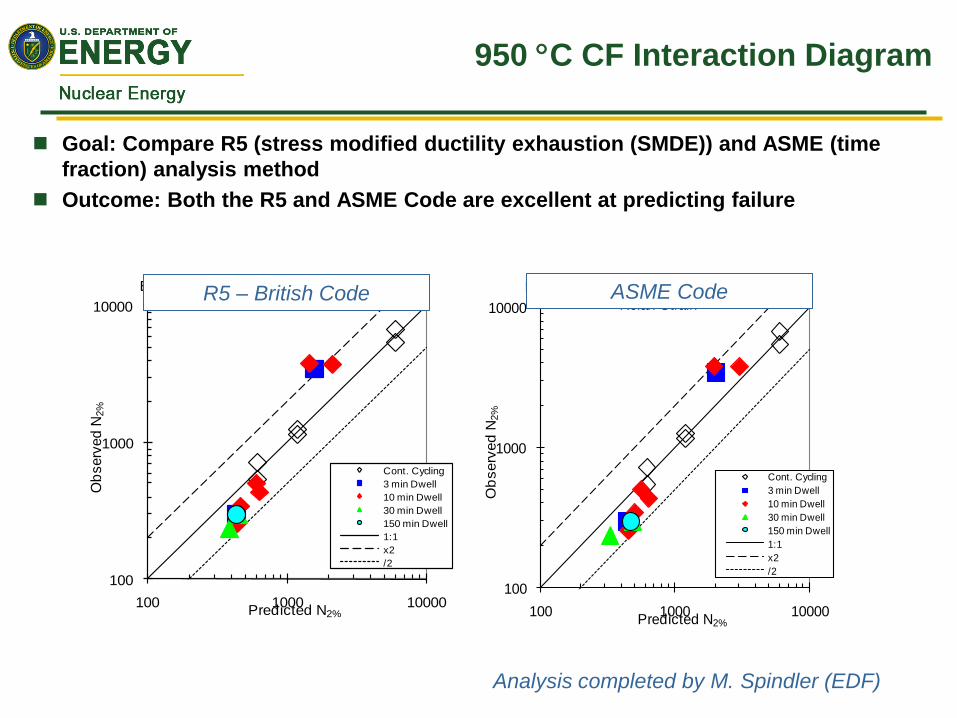
Goal: Compare R5 (stress modified ductility exhaustion (SMDE)) and ASME (time
fraction) analysis method
Outcome: Both the R5 and ASME Code are excellent at predicting failure
Analysis completed by M. Spindler (EDF)
R5 – British Code ASME Code
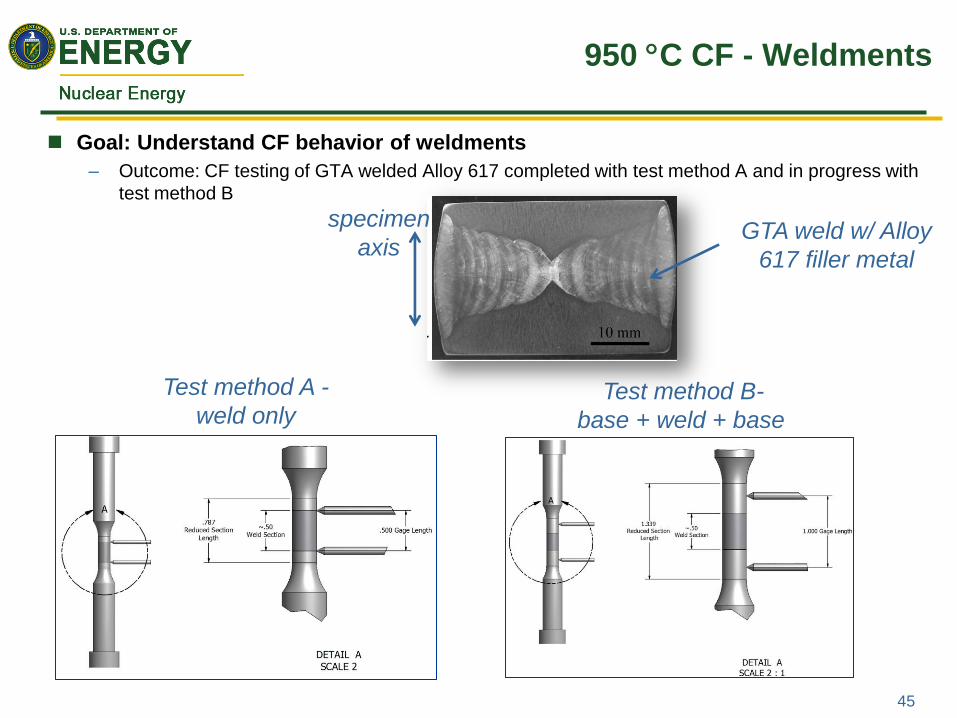
Test method B-
base + weld + base
45
950 C CF - Weldments
Test method A -
weld only
GTA weld w/ Alloy
617 filler metal
Goal: Understand CF behavior of weldments
– Outcome: CF testing of GTA welded Alloy 617 completed with test method A and in progress with
test method B
specimen
axis
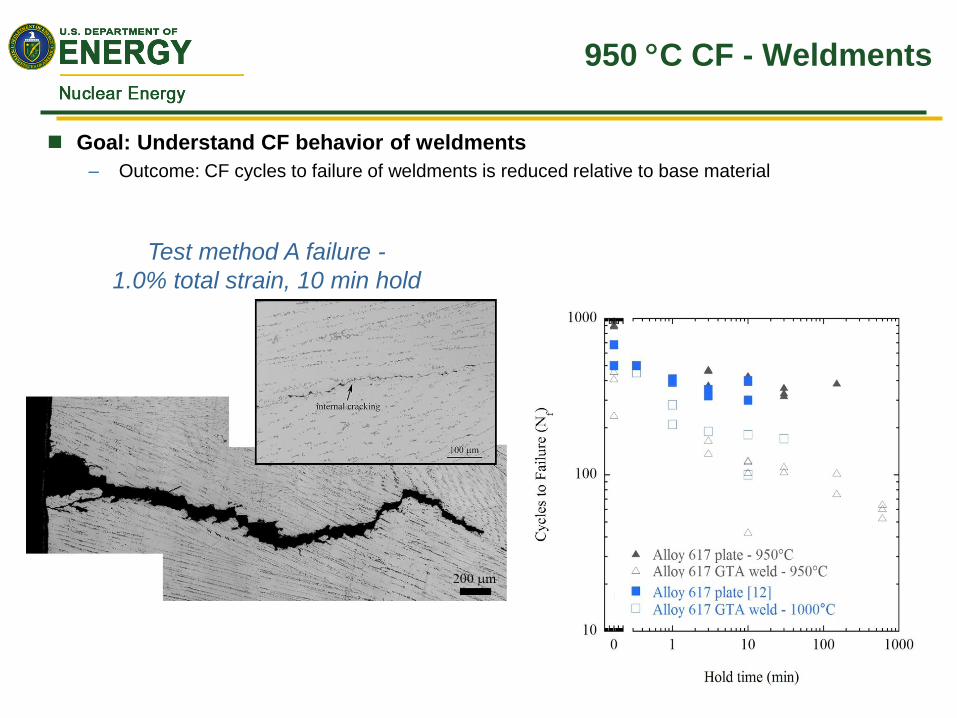
950 C CF - Weldments
Test method A failure -
1.0% total strain, 10 min hold
Goal: Understand CF behavior of weldments
– Outcome: CF cycles to failure of weldments is reduced relative to base material
Conclusions
CF saturation (ASME)
– 850 C
• Saturation not observed for hold times of as long as 30 min
• Longer hold time testing at durations sufficient to allow full stress relaxation is in progress
– 950 C
• Low strain range: saturation at hold times as short as 18 s
• High strain range: saturation at hold times of approximately 10 min
Environment: air v. impure helium (NRC)
– 850 C
• Likely creep-dominated based on interior grain boundary cracking analysis
• TBD from longer hold time CF tests
– 950 C
• Low strain range: negligible
• High strain range: saturation suggests limited influence
Creep-fatigue interaction diagram (ASME)
– Representative of average creep-fatigue behavior
Weldments (ASME)
– Cycles to failure of Alloy 617 GTA welds is reduced relative to base material
– Testing of configuration B is in progress
• Gage contains both the weld and base metal in the gage section