High-Temperature Acoustic Emission Sensing Tests … · johnson et al.: high-temperature acoustic...
10
IEEE TRANSACTIONS ON ULTRASONICS, FERROELECTRICS, AND FREQUENCY CONTROL, vol. 61, no. 5, MAY 2014 805 0885–3010 © 2014 IEEE High-Temperature Acoustic Emission Sensing Tests Using a Yttrium Calcium Oxyborate Sensor Joseph A. Johnson, Kyungrim Kim, Shujun Zhang, Di Wu, and Xiaoning Jiang Abstract—Piezoelectric materials have been broadly uti- lized in acoustic emission sensors, but are often hindered by the loss of piezoelectric properties at temperatures in the 500°C to 700°C range or higher. In this paper, a piezoelectric acoustic emission sensor was designed and fabricated using yt- trium calcium oxyborate (YCOB) single crystals, followed by Hsu–Nielsen tests for high-temperature (>700°C) applications. The sensitivity of the YCOB sensor was found to have minimal degradation with increasing temperature up to 1000°C. Dur- ing Hsu–Nielsen tests with a steel bar, this YCOB acoustic sensor showed the ability to detect zero-order symmetric and antisymmetric modes at 30 and 120 kHz, respectively, as well as distinguish a first-order antisymmetric mode at 240 kHz at elevated temperatures up to 1000°C. The frequency character- istics of the signal were verified using a finite-element model and wavelet transformation analysis. I. Introduction A. Acoustic Emission Sensor Acoustic emission (AE) sensing is a rapidly growing method for testing a broad spectrum of wear and fatigue in mechanical, aerospace, and civil structures. The AE test- ing method, originating in the field of structural monitor- ing in civil engineering, has the unique ability to evaluate an entire structure and locate a discontinuity as it forms and propagates [1]. Acoustic emission is usually caused by a stress-induced deformation and involves the release of energy from a localized source within a material, which takes the form of an elastic wave [2]. The deformation that is most associated with acoustic emission in research and industry is fatigue cracking, although the waves can be induced by friction wear, corrosion, and other forms of deformation [3]. Many different AE sensor mechanisms have been inves- tigated, including surface capacitive sensors, laser sensors, and piezoelectric sensors. Capacitive sensors have sensi- tivities that are highly dependent on their geometry and material properties, commonly ranging from one to hun- dreds of millivolts per gram for acceleration measurements [4]. These sensors, however, suffer from limited robustness because of their high sensitivity to electromagnetic noise [4]. Laser sensors, on the other hand, are inherently robust because they do not have to be in contact with the subject structure, but this leads to a lack of the sensitivity that is necessary for early detection of cracks [5]. Robustness and sensitivity are both critical properties of an acoustic emission sensor, so a method that can pro- vide both is necessary. Piezoelectric sensors are known to have a high sensitivity. The wide variety of piezoelec- tric material properties suggests that they can be easily adapted for many different applications. In addition, when incorporated into a steel housing with a pre-amplifier, the signal-to-noise ratio of piezoelectric sensors can be fur- ther improved, leading to a more robust system. Several piezoelectric materials that have been tested in high-tem- perature AE sensors are shown in Table I [6]–[10]. The advantages offered by each material at high temperature are presented, along with the main limitations to sensing at high temperatures. As examples, two high-temperature commercial piezo- electric sensors and a more common PAC R15a AE sensor (Physical Acoustics Corp., Princeton Jct., NJ) that has a lower operating temperature are compared in Table II [11], [12]. Each of the sensors in Table II offers alternative characteristics for different applications. The GE sensors use a delay block to help isolate the piezoelectric layer from hot surfaces, which could be an inhibitor if it were used as an AE sensor because it would alter the waveform detected by the sensor. The sensors offered by PAC are enclosed in an Inconel case, which allows it to be used in nuclear environments by reducing the exposure to radia- tion. B. High-Temperature Acoustic Emission Sensing There is a great potential for high-temperature piezo- electric sensors in several structural health monitoring ap- plications. Among them, nuclear structural monitoring is in an increasing need. Nuclear facilities operate on a 40- year license, and between 2000 and 2007, 44 commercial plants received 20-year extensions on their licenses [13]. As the average age of operating nuclear reactors continues to grow, issues such as fatigue stress become more promi- nent. Fatigue cracking in concrete support structures can be difficult to detect, especially during operating condi- tions, which can result in compromised structural integrity Manuscript received June 3, 2013; accepted February 12, 2014. This project was sponsored by a North Carolina Space Grant under contract number 2010-1662-NCSG Jiang. J. A. Johnson, K. Kim, D. Wu, and X. Jiang are with the Department of Mechanical and Aerospace Engineering, North Carolina State Univer- sity, Raleigh, NC (e-mail: [email protected]). S. Zhang is with the Materials Research Institute, The Pennsylvania State University, University Park, PA. D. Wu is also with the Department of Physics, Beijing Jiaotong Uni- versity, Beijing, China. DOI http://dx.doi.org/10.1109/TUFFC.2014.2972
Transcript of High-Temperature Acoustic Emission Sensing Tests … · johnson et al.: high-temperature acoustic...
IEEE TransacTIons on UlTrasonIcs, FErroElEcTrIcs, and FrEqUEncy conTrol, vol. 61, no. 5, May 2014 805
0885–3010 © 2014 IEEE
High-Temperature Acoustic Emission Sensing Tests Using a Yttrium Calcium
Oxyborate SensorJoseph a. Johnson, Kyungrim Kim, shujun Zhang, di Wu, and Xiaoning Jiang
Abstract—Piezoelectric materials have been broadly uti-lized in acoustic emission sensors, but are often hindered by the loss of piezoelectric properties at temperatures in the 500°C to 700°C range or higher. In this paper, a piezoelectric acoustic emission sensor was designed and fabricated using yt-trium calcium oxyborate (YCOB) single crystals, followed by Hsu–Nielsen tests for high-temperature (>700°C) applications. The sensitivity of the YCOB sensor was found to have minimal degradation with increasing temperature up to 1000°C. Dur-ing Hsu–Nielsen tests with a steel bar, this YCOB acoustic sensor showed the ability to detect zero-order symmetric and antisymmetric modes at 30 and 120 kHz, respectively, as well as distinguish a first-order antisymmetric mode at 240 kHz at elevated temperatures up to 1000°C. The frequency character-istics of the signal were verified using a finite-element model and wavelet transformation analysis.
I. Introduction
A. Acoustic Emission Sensor
acoustic emission (aE) sensing is a rapidly growing method for testing a broad spectrum of wear and fatigue in mechanical, aerospace, and civil structures. The aE test-ing method, originating in the field of structural monitor-ing in civil engineering, has the unique ability to evaluate an entire structure and locate a discontinuity as it forms and propagates [1]. acoustic emission is usually caused by a stress-induced deformation and involves the release of energy from a localized source within a material, which takes the form of an elastic wave [2]. The deformation that is most associated with acoustic emission in research and industry is fatigue cracking, although the waves can be induced by friction wear, corrosion, and other forms of deformation [3].
Many different aE sensor mechanisms have been inves-tigated, including surface capacitive sensors, laser sensors, and piezoelectric sensors. capacitive sensors have sensi-tivities that are highly dependent on their geometry and material properties, commonly ranging from one to hun-
dreds of millivolts per gram for acceleration measurements [4]. These sensors, however, suffer from limited robustness because of their high sensitivity to electromagnetic noise [4]. laser sensors, on the other hand, are inherently robust because they do not have to be in contact with the subject structure, but this leads to a lack of the sensitivity that is necessary for early detection of cracks [5].
robustness and sensitivity are both critical properties of an acoustic emission sensor, so a method that can pro-vide both is necessary. Piezoelectric sensors are known to have a high sensitivity. The wide variety of piezoelec-tric material properties suggests that they can be easily adapted for many different applications. In addition, when incorporated into a steel housing with a pre-amplifier, the signal-to-noise ratio of piezoelectric sensors can be fur-ther improved, leading to a more robust system. several piezoelectric materials that have been tested in high-tem-perature aE sensors are shown in Table I [6]–[10]. The advantages offered by each material at high temperature are presented, along with the main limitations to sensing at high temperatures.
as examples, two high-temperature commercial piezo-electric sensors and a more common Pac r15a aE sensor (Physical acoustics corp., Princeton Jct., nJ) that has a lower operating temperature are compared in Table II [11], [12]. Each of the sensors in Table II offers alternative characteristics for different applications. The GE sensors use a delay block to help isolate the piezoelectric layer from hot surfaces, which could be an inhibitor if it were used as an aE sensor because it would alter the waveform detected by the sensor. The sensors offered by Pac are enclosed in an Inconel case, which allows it to be used in nuclear environments by reducing the exposure to radia-tion.
B. High-Temperature Acoustic Emission Sensing
There is a great potential for high-temperature piezo-electric sensors in several structural health monitoring ap-plications. among them, nuclear structural monitoring is in an increasing need. nuclear facilities operate on a 40-year license, and between 2000 and 2007, 44 commercial plants received 20-year extensions on their licenses [13]. as the average age of operating nuclear reactors continues to grow, issues such as fatigue stress become more promi-nent. Fatigue cracking in concrete support structures can be difficult to detect, especially during operating condi-tions, which can result in compromised structural integrity
Manuscript received June 3, 2013; accepted February 12, 2014. This project was sponsored by a north carolina space Grant under contract number 2010-1662-ncsG Jiang.
J. a. Johnson, K. Kim, d. Wu, and X. Jiang are with the department of Mechanical and aerospace Engineering, north carolina state Univer-sity, raleigh, nc (e-mail: [email protected]).
s. Zhang is with the Materials research Institute, The Pennsylvania state University, University Park, Pa.
d. Wu is also with the department of Physics, Beijing Jiaotong Uni-versity, Beijing, china.
doI http://dx.doi.org/10.1109/TUFFc.2014.2972

IEEE TransacTIons on UlTrasonIcs, FErroElEcTrIcs, and FrEqUEncy conTrol, vol. 61, no. 5, May 2014806
and halted operations [14]. Therefore, a form of continu-ous structural health monitoring near the hot regions of a reactor, where fatigue is more likely to occur, is crucial for safe and continuous operation.
To enhance the sensitivity, acoustic emission sensors should be as close to the high-stress region of a machine as possible because of the attenuation of elastic waves in material [15]. However, the high-stress areas in a nuclear reactor, turbine, or internal combustion engine reach tem-peratures well above critical temperatures for conventional piezoelectric materials [16], [17].
yttrium calcium oxyborate [yca4o(Bo3)3; ycoB] is a promising high-temperature piezoelectric materials be-cause of its high resistivity at elevated temperatures and its relatively stable electromechanical and piezoelectric properties across a broad temperature range [6]. In this paper, a piezoelectric acoustic emission sensor was de-signed, fabricated, and tested with ycoB single crystals for use in high-temperature applications. The sensor was then mounted onto a plate substrate for Hsu–nielsen tests, in which a pencil lead is broken on the testing substrate to simulate the deformations that produce an acoustic emis-sion event [18]. Following the Hsu–nielsen tests, the fre-quency characteristics of the signal were verified using a fi-nite-element model and wavelet transform analysis. In the wavelet transform, windowed frequency transforms, such as fast Fourier transforms (FFTs), are used to relate the frequency components of a signal over time [19]. The sig-nal characteristics from the ycoB sensor were compared with the characteristics from a Pb(Mg1/3nb2/3)o3–PbTio3 (PMn-PT) sensor, which has a much higher sensitivity at room temperature. although a material like quartz with a piezoelectric coefficient on the same scale (~2 pc/n) as ycoB can be used for comparison, PMn-PT with a much
higher piezoelectric coefficient (>1500 pc/n) was selected in this study. The PMn-PT was used because an aE sen-sor with a high-sensitivity material can produce a signal with easily discernible frequency components, which will enable the verification of the frequency components of the ycoB sensor.
II. Modal analysis
Modal analysis is an important verification tool when testing the feasibility of an acoustic emission sensor. Most systems have an inherent noise that must be separated from the usable aE signal, and modal analysis provides some foresight into the frequency characteristics of the signal. Understanding the frequency characteristics of stress waves allows for effective signal processing, e.g., band-pass filtration and spectral analysis. The frequency characteristics of aE waves are dependent on several pa-rameters, such as the substrate material, substrate geom-etry, and sensor geometry. The aE test was conducted on a thin bar substrate, with cross-sectional dimensions of 6.50 mm thick by 26.7 mm wide and a length of 913 mm. Thus, lamb waves are expected for the thin substrate over rayleigh or love waves. lamb waves take a complex form that is a combination of extensional and flexural waves [20]. These wave modes are referred to as symmetric for extensional, and antisymmetric for flexural, because of the direction of particle displacement and wave propagation. an illustration of this concept is shown in Fig. 1. This figure displays the cross section of the substrate, in which the particle displacement and wave propagation direc-tions are shown. The red dashed line shows the neutral axis. The particle displacement direction illustrates why
TaBlE II. commercially available High-Temperature Piezoelectric sensors.
sensor model sensor typeFrequency/
frequency rangeMax operating
temperature (°c)
GE B4 GVn Ultrasonic 4 MHz 250Pac s9215 acoustic emission 50–650 kHz 540Pac r15a Vibration/aE 50–400 kHz 175
Pac r15a is a normal sensor, included for comparison of allowable operating ranges.
TaBlE I. Piezoelectric Materials Used in sensors for High-Temperature Environments [6]–[10].
Piezoelectric materialTemperature range (°c)
Piezoelectric constants (deff) advantages
limitations for high-temperature use
Gallium phosphate, GaPo4
<800 4.5 pc/n High Qm Increased disorder: lowers Qm
lithium niobate, linbo3
<700 6–68 pc/n High piezoelectric properties
chemical decomposition
aluminum nitride film, aln
1150 5.6 pc/n Ease of incorporation High-quality bulk fabrication
langasite, lGs <800 6.2 pc/n lack of phase transition oxygen diffusion: low resistivity and Qm
Gadolinium calcium oxyborate, GdcoB
<1200 5–13 pc/n High temperature stability decreased electromechanical coupling
yttrium calcium oxyborate, ycoB
>1200 3–10 pc/n High temperature stability Melting point (~1500°c)

johnson et al.: high-temperature acoustic emission sensing tests using a ycob sensor 807
the lamb wave modes are referred to as symmetric and antisymmetric modes, because of their motion relative to the neutral axis.
The dispersion curve reveals the relationship between the group or phase velocity and frequency for each wave mode; therefore, the dispersion curve for the test substrate was analyzed to verify lamb wave modes in the sensor signal obtained in experiments [21]. The Pacshare dis-persion curves commercial freeware (Physical acoustics corp., Princeton Junction, nJ) was used to create the dispersion curve [22]. The dispersion curve for the sin-gle-layer 309 stainless steel substrate was calculated, as shown in Fig. 2; the parameters used for the calculation are shown in Table III. The wave velocity is the same as group velocity for this application.
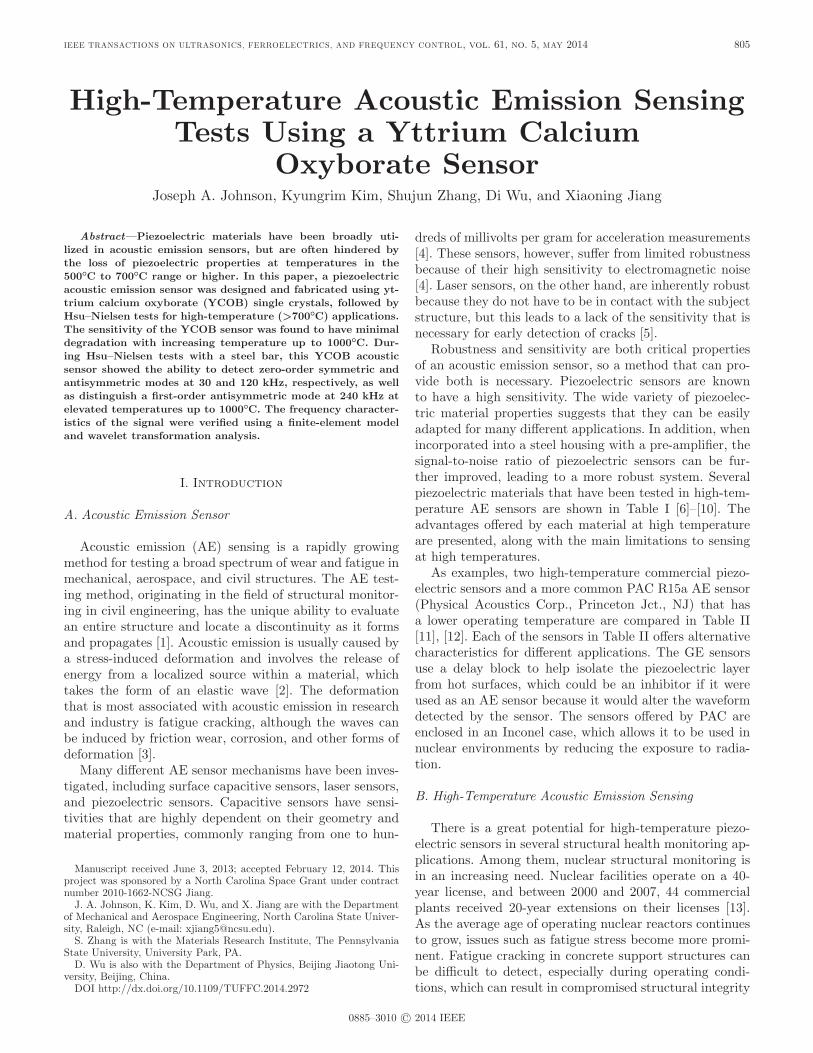
The dispersion curve can be used to show the relation-ship of mode frequency changing with time. The velocity axis can be converted to time as long as the source dis-tance is known and does not change. The dispersion curve relating time and frequency is shown in Fig. 3; a source distance of 200 mm was used for this calculation.
after the aE sensor data obtained from Hsu–nielsen tests is processed in the time and frequency domains, a wavelet or spectrogram transform can be performed to re-late the frequency components of the data with time [23]. The result of the wavelet transform is a contour plot, with the scale correlating to the magnitude of the frequency component at each sampled time step. By overlaying the theoretical dispersion curve and empirical spectrogram, the influence of each wave mode can be seen. When the
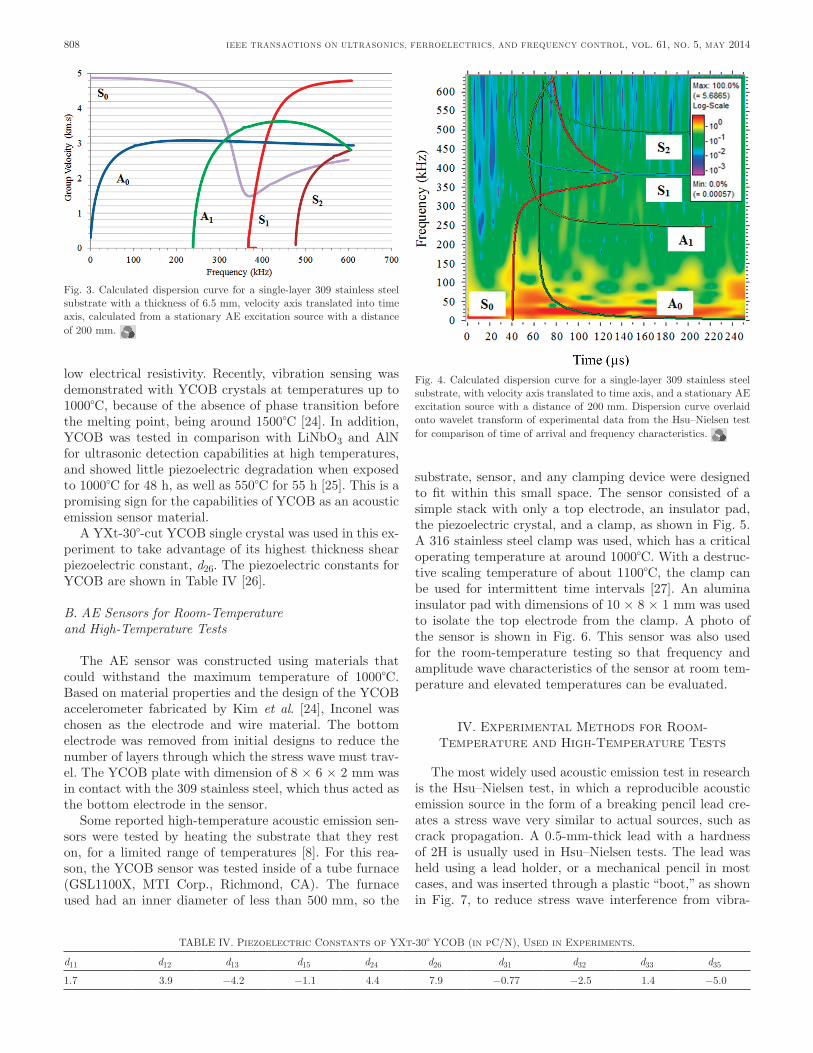
dispersion curves are overlaid onto the wavelet transform, the arrival of the wave modes are marked by the verti-cal sections of the dispersion curves, and appear with a broadband shape. The dispersion curves are corrected for the source distance and any time bias. Fig. 4 displays the dispersion curve for the stainless steel substrate overlaid onto the wavelet transform of the signal produced by the ycoB sensor for the room temperature Hsu–nielsen test, as an example. comparison of the times of arrival between the dispersion curve and wavelet transform shows that the antisymmetric and symmetric signals appear as expected. The frequencies associated with these antisymmetric and symmetric regions can likewise be recognized in the wave-let transformation, and then distinguished in the power spectral density (Psd) plots in section V. The zero-order antisymmetric and symmetric modes are the only domi-nant modes shown in Fig. 4. This form of post-processing analysis is used in this paper to evaluate the wave modes in the time and frequency domains, and to gauge the abil-ity of the ycoB sensor to detect the distinct wave modes, which is critical for an acoustic emission sensor to be fea-sible for structural health monitoring.
III. sensor design
A. Material Selection
There has been a strong demand for high-temperature piezoelectric materials. However, the usage temperature ranges of piezoelectric materials are generally limited by their phase-transition temperature, melting point, or
Fig. 1. Illustrations of antisymmetric and symmetric lamb wave modes. Bold black lines represent substrate displacement, and the red dashed line represents the neutral axis of the cross section of the substrate paral-lel to the propagation direction.
Fig. 2. calculated dispersion curve of a single-layer 309 stainless steel substrate with a thickness of 6.5 mm.
TaBlE III. Material Properties and Parameters for calculation of single-layer 309 stainless steel dispersion curve.
layerThickness
(mm)longitudinal
velocity (km/s)shear
velocity (km/s)surface
velocity (km/s)acoustic
impedancedensity (kg/m3)
air ∞ 0.34 n/a n/a 411 rayl 1.12309 ss 6.5 5 3.102 2.78 45 Mrayl 8000air ∞ 0.34 n/a n/a 411 rayl 1.12
IEEE TransacTIons on UlTrasonIcs, FErroElEcTrIcs, and FrEqUEncy conTrol, vol. 61, no. 5, May 2014808
low electrical resistivity. recently, vibration sensing was demonstrated with ycoB crystals at temperatures up to 1000°c, because of the absence of phase transition before the melting point, being around 1500°c [24]. In addition, ycoB was tested in comparison with linbo3 and aln for ultrasonic detection capabilities at high temperatures, and showed little piezoelectric degradation when exposed to 1000°c for 48 h, as well as 550°c for 55 h [25]. This is a promising sign for the capabilities of ycoB as an acoustic emission sensor material.
a yXt-30°-cut ycoB single crystal was used in this ex-periment to take advantage of its highest thickness shear piezoelectric constant, d26. The piezoelectric constants for ycoB are shown in Table IV [26].
B. AE Sensors for Room-Temperature and High-Temperature Tests
The aE sensor was constructed using materials that could withstand the maximum temperature of 1000°c. Based on material properties and the design of the ycoB accelerometer fabricated by Kim et al. [24], Inconel was chosen as the electrode and wire material. The bottom electrode was removed from initial designs to reduce the number of layers through which the stress wave must trav-el. The ycoB plate with dimension of 8 × 6 × 2 mm was in contact with the 309 stainless steel, which thus acted as the bottom electrode in the sensor.
some reported high-temperature acoustic emission sen-sors were tested by heating the substrate that they rest on, for a limited range of temperatures [8]. For this rea-son, the ycoB sensor was tested inside of a tube furnace (Gsl1100X, MTI corp., richmond, ca). The furnace used had an inner diameter of less than 500 mm, so the
substrate, sensor, and any clamping device were designed to fit within this small space. The sensor consisted of a simple stack with only a top electrode, an insulator pad, the piezoelectric crystal, and a clamp, as shown in Fig. 5. a 316 stainless steel clamp was used, which has a critical operating temperature at around 1000°c. With a destruc-tive scaling temperature of about 1100°c, the clamp can be used for intermittent time intervals [27]. an alumina insulator pad with dimensions of 10 × 8 × 1 mm was used to isolate the top electrode from the clamp. a photo of the sensor is shown in Fig. 6. This sensor was also used for the room-temperature testing so that frequency and amplitude wave characteristics of the sensor at room tem-perature and elevated temperatures can be evaluated.
IV. Experimental Methods for room-Temperature and High-Temperature Tests
The most widely used acoustic emission test in research is the Hsu–nielsen test, in which a reproducible acoustic emission source in the form of a breaking pencil lead cre-ates a stress wave very similar to actual sources, such as crack propagation. a 0.5-mm-thick lead with a hardness of 2H is usually used in Hsu–nielsen tests. The lead was held using a lead holder, or a mechanical pencil in most cases, and was inserted through a plastic “boot,” as shown in Fig. 7, to reduce stress wave interference from vibra-
Fig. 4. calculated dispersion curve for a single-layer 309 stainless steel substrate, with velocity axis translated to time axis, and a stationary aE excitation source with a distance of 200 mm. dispersion curve overlaid onto wavelet transform of experimental data from the Hsu–nielsen test for comparison of time of arrival and frequency characteristics.
TaBlE IV. Piezoelectric constants of yXt-30° ycoB (in pc/n), Used in Experiments.
d11 d12 d13 d15 d24 d26 d31 d32 d33 d35
1.7 3.9 −4.2 −1.1 4.4 7.9 −0.77 −2.5 1.4 −5.0
Fig. 3. calculated dispersion curve for a single-layer 309 stainless steel substrate with a thickness of 6.5 mm, velocity axis translated into time axis, calculated from a stationary aE excitation source with a distance of 200 mm.

johnson et al.: high-temperature acoustic emission sensing tests using a ycob sensor 809
tion. The boot was also intended to hold the lead at a constant angle for each test [18]. aE sensors fabricated with ycoB and PMn-PT crystals were used to detect the acoustic waves at room temperature for wave modes and sensitivity comparisons. Furthermore, sensitivity of ycoB at room temperature was also compared with that at high temperatures using the same testing procedure. all comparisons were conducted by frequency analysis. signal magnitude was only used for comparison of ycoB signals at different temperature ranges. It should be noted that the ycoB and PMn-PT outputs were not compared in magnitude.
The high temperature testing was conducted with the same Hsu–nielsen testing procedure. Fig. 7 shows the high-temperature test setup. The sensor tested in this research was located at the center of the horizontally oriented MTI Gsl1100X tube furnace. In contrast, current practices in acoustic emission sensing take advantage of a waveguide to separate the sensor from the high-temperature region, while allowing the stress wave to propagate to the sensor. nevertheless, this is not always a viable solution, because it introduces complexities when attempting to read the waveform and frequency response of an acoustic wave [7]. The pencil lead was broken outside of the insulated sec-tion of the tube furnace, and the Inconel wire extending out of the high temperature region was connected to the amplifier. a-frame stands and clamps were used to hold the substrate in place.
The aE-induced signal from the piezoelectric crystal was amplified using a Brüel & Kjær charge amplifier type 2635 (norcross, Ga), and was recorded using an agilent Technologies InfiniiVision dso7104B oscilloscope (Engle-wood, co). The data samples were transferred to a com-puter with Matlab (The MathWorks Inc., natick, Ma), Pacshare dispersion curves, and Vallen Wavelet soft-ware (Vallen systeme GmbH, Icking, Germany) for signal processing and analysis. The code for frequency analysis and all processing was written in Matlab. The Gsl1100X furnace was heated up to 1000°c by 100°c increments. The furnace would be heated to a value above the target temperature, and then unplugged to reduce the ac elec-tric noise created by the heating units. The starting tem-perature was set 20°c above for lower temperatures, and increased to 60°c above at high temperatures. This was because the furnace would cool during testing, and these
initial values were chosen so that the average temperature during testing would be close to the target temperature.
V. results and discussion
A. Experimental Results
The initial analysis at room temperature was conducted purely in the time domain, by comparing the response of the PMn-PT and ycoB aE sensors. Because of the dif-ferences in the magnitude of the piezoelectric constants of the two crystals (~8 pc/n for ycoB versus >1500 pc/n for PMn-PT), higher amplification is needed for the ycoB aE signal [6]. For testing at room temperature, the ycoB aE sensor signal was amplified by 100 times with the charge amplifier, and the PMn-PT aE sensor signal was not amplified. For a Hsu–nielsen test with a source–sensor distance of 20 cm, typical time responses for both crystals are shown in Fig. 8.
The symmetric and antisymmetric modes are discern-ible in these two time-domain plots by differences in fre-quency and times of arrival. The frequencies of the wave components cannot be easily distinguished from the time
Fig. 5. Illustration of high-temperature sensor design used in experiments.
Fig. 6. Photo of high-temperature acoustic emission sensor.
Fig. 7. High-temperature Hsu–nielsen acoustic emission testing setup. ycoB aE sensor located in center of furnace, clamped to substrate.

IEEE TransacTIons on UlTrasonIcs, FErroElEcTrIcs, and FrEqUEncy conTrol, vol. 61, no. 5, May 2014810
domain, but the earlier time of arrival of a higher frequen-cy signal, preceding a lower frequency signal, is in agree-ment with the dispersion curves in Figs. 3 and 4. There-fore, these signal components are labeled as the symmetric and antisymmetric components of the waves, although the particle mode order cannot be distinguished. The time domain signal was analyzed in the frequency domain by performing a fast Fourier transform, and finding the Psd. a Thomson multitaper Psd was adopted to reduce the ef-fect of noise [28]. The frequency responses for both signals are shown in Fig. 9.
The ability to detect the lamb wave modes displayed by the ycoB aE sensor is very promising for aE sensor applications. The voltage response of the ycoB aE sen-sor at 1000°c is shown in Fig. 10, with a room-temper-ature signal for comparison. The magnitude differences between the signal recorded at room temperature and 1000°c are induced by the reduction of the amplification to record the signal with increased noise. after factoring out amplification, the magnitudes are on the same scale of tens of millivolts.
The increased noise levels are apparent at high tem-peratures, but the high-frequency and low-frequency com-ponents of the original signal are still distinct. The same FFT and Psd were applied to this high-temperature re-sponse to analyze the frequency characteristics. although the frequency peaks are not as dominant in the Fourier transform, the zero-order modes are still the most preva-
lent and higher order modes are visible. The frequency response received from the ycoB aE sensor at 1000°c is shown in Fig. 11.
B. Finite-Element Analysis Results
The frequency components of the lamb wave caused by the Hsu–nielsen source are difficult to predict using an analytical model, so finite-element modeling was conduct-ed to help verify the characteristics of the signal received from aE sensors. The FEa program comsol Multiphysics 4.3 (comsol Inc., Burlington, Ma) was used for model-ing. The pencil lead break aE source is modeled as a uniformly distributed ramp load with a rise time of 0.5 µs and peak pressure amplitude of 3 kn·m−2 for an area of 0.4 mm2 [29]. With known substrate properties, the aE wave can be closely modeled and the wave characteristics can be determined with the appropriate FEa probes [30]. The parameters used to model the aE wave are shown in Table V.
smaller dimensions and a shorter time range were used to reduce the calculation time. The wave modes are only dependent on the thickness and material properties, so the outer dimensions and probe distance do not affect the stress wave frequency characteristics. an out-of-plane surface displacement probe was used because there should be little frequency change between the plate wave and the signal produced by the piezoelectric sensor. The sampling rate and mesh size were chosen to allow for distinct wave
Fig. 8. response of ycoB and PMn-PT sensors to Hsu–nielsen test at room temperature (time domain).
Fig. 9. Frequency-domain responses of ycoB and PMn-PT sensors to Hsu–nielsen tests at room temperature. Frequency spectrum was calcu-lated using the Thomson multitaper Psd method.

johnson et al.: high-temperature acoustic emission sensing tests using a ycob sensor 811
frequencies at the expected antisymmetric and symmetric nascent frequencies. The properties of 309 stainless steel were used to define the substrate material, and the force was induced at the center of the model with the parame-ters given at the beginning of section V-B. a multiphysics package was not used; because we were only deciphering the frequency characteristics of the wave, only a solid me-chanics package was necessary.
The finite-element analysis was also conducted to ana-lyze the cause of unexpected behavior in the frequency and spectrogram plots. The double band that is seen at 30 and 70 kHz in the room-temperature and high-tem-
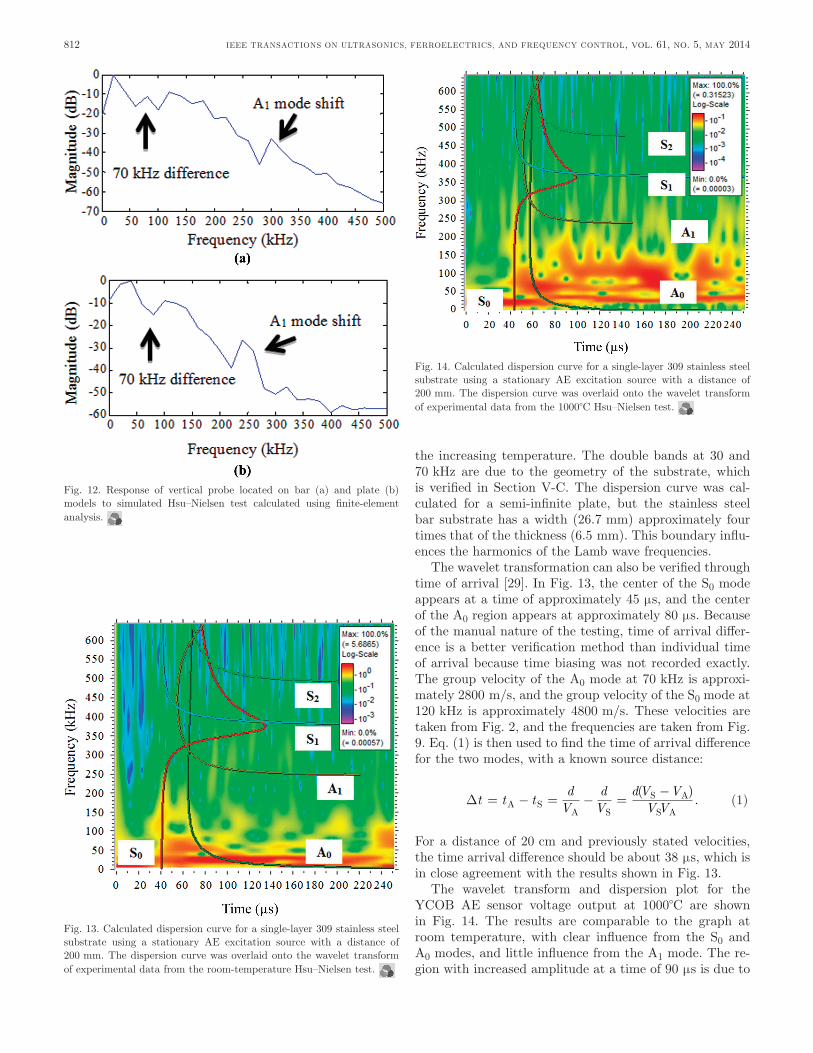
perature spectrograms was not expected. Based on the dispersion curve calculated, the 30 kHz frequency peak is anticipated, but a second peak in close proximity, like the one at 70 kHz, is not usually prevalent in acoustic emis-sion testing. This is because the test was conducted on a bar, whereas acoustic emission tests producing lamb waves are commonly conducted on plates, which are large and thin enough to ignore reflections in the early sensor response. To verify this, a bar and a plate substrate were both modeled. The frequency domain of the modeled re-sponse on the bar and plate are shown in Fig. 12.
The peak at 70 kHz is clearly not prevalent in the full plate model, and can be attributed to the boundaries cre-ated on the sides of the bar. The shift that is seen in the a1 mode is unexpected, but explains the double spikes in the frequency components at 250 and 300 kHz, as shown in Fig. 9.
C. Discussion
The antisymmetric and symmetric zero-order modes can be discerned in the frequency spectrum of the signal produced by the aE sensor, but relating these frequencies to the dispersion curves for the substrate requires another set of tools. The modes that are pointed out in Fig. 9 can be verified using a combination of the dispersion curves and wavelet transforms. The wavelet software shows how the frequency of the signal changes with time, exposing the separate modes. The combination of these two modes for the ycoB aE sensor response at room temperature is shown in Fig. 13.
Wavelet transformations can show distinct frequencies when applied to ultrasonic signals, but the complex modes of lamb waves in acoustic emission signals do not appear as well-defined lines [31], [32]. For the applications with lamb waves, the calculated dispersion curves are used for verification of the experimental wavelet transforms. Influ-ence of the a0 and s0 modes is distinguishable in Fig. 13, but the a1 mode is less prevalent. The a1 250-kHz frequency range can be seen in the frequency-domain plot for both ycoB and PMn-PT. These frequencies can be seen at all temperature levels, with some shifting as the temperature increases. This can be expected because of the changing mechanical properties of the steel bar with
Fig. 10. response of ycoB sensor to Hsu–nielsen test at room tempera-ture and at 1000°c (time domain).
Fig. 11. response of ycoB sensor to Hsu–nielsen test at room tem-perature (frequency domain). Frequency spectrum was calculated using Thomson multitaper Psd method.
TaBlE V. Geometrical sizes and Material Properties of Plate and Bar substrates Used for Finite Element Modeling.
Parameter Value
Bar model dimensions 400 × 26.7 × 6.5 mmPlate model dimensions 200 × 200 × 6.5 mmsubstrate density 8000 kg/m3
substrate young’s modulus 200 GPasubstrate shear modulus 77 GPaMesh size maximum 0.5 mmMesh size minimum 1 µmTime range 50 µsTime step size 1 µsProbe distance from force 50 mm
IEEE TransacTIons on UlTrasonIcs, FErroElEcTrIcs, and FrEqUEncy conTrol, vol. 61, no. 5, May 2014812
the increasing temperature. The double bands at 30 and 70 kHz are due to the geometry of the substrate, which is verified in section V-c. The dispersion curve was cal-culated for a semi-infinite plate, but the stainless steel bar substrate has a width (26.7 mm) approximately four times that of the thickness (6.5 mm). This boundary influ-ences the harmonics of the lamb wave frequencies.
The wavelet transformation can also be verified through time of arrival [29]. In Fig. 13, the center of the s0 mode appears at a time of approximately 45 µs, and the center of the a0 region appears at approximately 80 µs. Because of the manual nature of the testing, time of arrival differ-ence is a better verification method than individual time of arrival because time biasing was not recorded exactly. The group velocity of the a0 mode at 70 kHz is approxi-mately 2800 m/s, and the group velocity of the s0 mode at 120 kHz is approximately 4800 m/s. These velocities are taken from Fig. 2, and the frequencies are taken from Fig. 9. Eq. (1) is then used to find the time of arrival difference for the two modes, with a known source distance:
∆t t tdV
dV
dV VVV= − = − =−
A SA S
S A
S A
( ). (1)
For a distance of 20 cm and previously stated velocities, the time arrival difference should be about 38 µs, which is in close agreement with the results shown in Fig. 13.
The wavelet transform and dispersion plot for the ycoB aE sensor voltage output at 1000°c are shown in Fig. 14. The results are comparable to the graph at room temperature, with clear influence from the s0 and a0 modes, and little influence from the a1 mode. The re-gion with increased amplitude at a time of 90 µs is due to
Fig. 12. response of vertical probe located on bar (a) and plate (b) models to simulated Hsu–nielsen test calculated using finite-element analysis.
Fig. 13. calculated dispersion curve for a single-layer 309 stainless steel substrate using a stationary aE excitation source with a distance of 200 mm. The dispersion curve was overlaid onto the wavelet transform of experimental data from the room-temperature Hsu–nielsen test.
Fig. 14. calculated dispersion curve for a single-layer 309 stainless steel substrate using a stationary aE excitation source with a distance of 200 mm. The dispersion curve was overlaid onto the wavelet transform of experimental data from the 1000°c Hsu–nielsen test.

johnson et al.: high-temperature acoustic emission sensing tests using a ycob sensor 813
reflection, because the high-temperature test used clamps instead of simple supports for the substrate.
For most applications, an aE sensor is expected to at least detect the a0 and s0 modes. Both of these modes can be seen in the frequency domain and wavelet transfor-mation for the room-temperature and high-temperature signals. Thus, the ycoB aE sensor is viable for acous-tic emission detection with signal frequency component analysis.
Besides the frequency characteristics, the voltage ampli-tude output from the ycoB crystal gives a good measure of sensitivity. Because the voltage was not always mea-sured from a zero mark because of the noise, the peak-to-peak voltage at the maximum and minimum values were recorded for each test. The mean and standard deviation at each measurement are shown in Fig. 15.
The average value for peak-to-peak voltage across the measurement temperature range (room temperature to 1000°c) is 0.062 V. From Fig. 15, it can be seen that there is no major relationship between peak-to-peak voltage and temperature. This can be expected in reflection of recent publications on ycoB’s stability at high temperatures, such as Parks’ ratcheting test and Zhang’s testing of high-temperature reca4o(Bo3)3 materials, which includes ycoB [25], [33].
VI. conclusion
a ycoB acoustic emission sensor was designed, fabri-cated, and tested, demonstrating the capability of detect-ing acoustic emission stress waves at temperatures up to 1000°c. Both zero-order lamb wave modes at frequencies of 30 and 120 kHz and the first-order antisymmetric wave mode at the frequency of 240 kHz can be detected by the ycoB aE sensor. The frequency characteristics of the de-tected waves were verified using the FEa software comsol and wavelet transformation analysis.
acknowledgments
The authors acknowledge l. Tolliver for her helpful re-view of this paper.
references
[1] M. ohtsu, “History and fundamentals,” in Acoustic Emission Test-ing. Berlin, Germany: springer-Verlag, 2008, pp. 11–18.
[2] M. F. carlos, (2012, dec.) acoustic emission: Heeding the warn-ing sounds from materials. asTM International. West con-shohocken, Pa. [online]. available: http://www.astm.org/snEWs/ ocToBEr_2003/carlos_oct03.html
[3] a. Hase, H. Mishina, and M. Wada, “correlation between features of acoustic emission signals and mechanical wear mechanisms,” Wear, vol. 292–293, pp. 144–150, Jul. 2012.
[4] c. liu, Foundation of MEMS. Upper saddle river, nJ: Prentice Hall, 2011.
[5] M. ohtsu, “sensor and instrument,” in Acoustic Emission Testing. Berlin, Germany: springer-Verling, 2008, pp. 19–40.
[6] s. Zhang and F. yu, “Piezoelectric materials for high temperature sensors,” J. Am. Ceram. Soc., vol. 94, no. 10, pp. 3153–3170, 2011.
[7] r. c. Turner, P. a. Fuierer, r. E. newnham, and T. r. shrout, “Materials for high temperature acoustic and vibration sensors: a review,” Appl. Acoust., vol. 41, no. 4, pp. 299–324, 1994.
[8] K. J. Kirk, c. W. scheit, and n. schmarje, “High-temperature acoustic emission tests using lithium niobate piezocomposite tans-ducers,” Insight, vol. 49, no. 3, pp. 142–145, 2007.
[9] H. noma, E. Ushijima, y. ooishi, M. akiyama, n. Miyoshi, K. Kishi, T. Tabaru, I. ohshima, a. Kakami, and T. Kamohara, “de-velopment of high-temperature acoustic emission sensor using alu-minum nitride thin film,” Adv. Mater. Res., vol. 13–14, pp. 111–116, Feb. 2006.
[10] X. Jiang, K. Kim, s. Zhang, J. Johnson, and G. salazar, “High tem-perature piezoelectric sensing,” Sensors, vol. 14, no. 1, pp. 144–169, 2014.
[11] Mistras Group Inc. (2012, dec.). acoustic emission sensor summary chart. [online]. available: http://www.mistrasgroup.com/products/solutions/acousticemission/sensors/summary_chart.aspx
[12] GE Inspection Technologies. (2012, dec.). Probes for ultrasonic testing at high temperatures. [online]. available: http://www.geinspectiontechnologies.cn/download/products/ut/pc/GEIT-20107GB_probes-hightemperatures.pdf
[13] l. Parker and M. Holt, “nuclear power: outlook for new U.s. reac-tors,” congressional research service, Washington, d.c., 2007.
[14] J. s. Feinstein, “The safety regulation of U.s. nuclear power plants: Violations, inspections, and abnormal occurrences,” J. Polit. Econ., vol. 97, no. 1, pp. 115–154, 1989.
[15] r. Hill, s. a. Forsyth, and P. Macey, “Finite element modelling of ultrasound, with reference to transducer and aE waves,” Ultrason-ics, vol. 42, no. 1–9, pp. 253–258, 2004.
[16] r. l. Klueh, “Elevated temperature ferritic and martensitic steels and their application to future nuclear reactors,” Int. Mater. Rev., vol. 50, no. 5, pp. 287–310, 2005.
[17] M. dzida, “comparing combined gas turbine/steam turbine and marine low speed piston engine/steam turbine systems in naval ap-plications,” Pol. Marit. Res., vol. 18, no. 4, pp. 43–48, 2011.
[18] ndT.net. (2013, Mar.). Hsu–nielsen source. [online]. available: http://www.ndt.net/ndtaz/content.php?id=474
[19] s. Mallat, A Wavelet Tour of Signal Processing. san diego, ca: Elsevier, 1999.
[20] K. M. Holford, “acoustic emission—Basic principles and future di-rection,” Strain, vol. 36, no. 2, pp. 51–54, 2000.
[21] a. demčenko and l. Mažeika, “calculation of lamb waves disper-sion curves in multi-layered planar structures,” Ultragarsas, vol. 44, no. 3, pp. 15–17, 2002.
[22] Physical acoustic corp. (2012, oct.). Pacshare dispersionPlus curves software. [online]. available: http://www.acousticemission.com/index.aspx?go=products&focus=/software/dispersion.htm
[23] a. J. Pickwell, r. a. dorey, and d. Mba, “structurally integrated thick film acoustic emission sensors,” in Engineering Asset Man-agement and Infrastructure Sustainability. london, UK: springer-Verlag, 2011, pp. 739–747.
Fig. 15. average peak-to-peak voltage response of ycoB aE sensor for the Hsu–nielsen test versus temperature.

IEEE TransacTIons on UlTrasonIcs, FErroElEcTrIcs, and FrEqUEncy conTrol, vol. 61, no. 5, May 2014814
[24] K. Kim, s. Zhang, G. salazar, and X. Jiang, “design, fabrication and characteristics of high temperature piezoelectric vibration sen-sor using ycoB crystals,” Sens. Actuators A, vol. 178, pp. 40–48, May 2012.
[25] d. Parks, s. Zhang, and B. Tittmann, “High temperature (>500°c) ultrasonic transducers: an experimental comparison among three candidate piezoelectric materials,” IEEE Trans. Ultrason. Ferroelec-tr. Freq. Control, vol. 60, no. 5, pp. 1010–1015, 2013.
[26] F. yu, s. Hou, s. Zhang, q. lu, and X. Zhao, “Electro-elastic prop-erties of ycoB piezoelectric crystals,” Phys. Status Solidi A, http://dx.doi.org/10.1002/pssa.201330191. to be published.
[27] aK steel corp. (2013, nov.). 309/309s stainless steel data sheet. (online). available: http://www.aksteel.com/pdf/markets_prod-ucts/stainless/austenitic/309_309s_data_sheet.pdf
[28] J. Park, c. r. lindberg, and F. l. Vernon III, “Multitaper spectral analysis of high-frequency seismograms,” J. Geophys. Res., vol. 92, no. B12, pp. 12675–12684, 1987.
[29] M. a. Hamstead, J. Gary, and a. o’Gallagher, “Far-field acous-tic emission waves by three-dimensional finite element modeling of pencil-lead breaks on a thick plate,” Acoust. Emiss., vol. 14, no. 2, pp. 103–114, 1996.
[30] P. Gómez, J. P. Fernández, and P. d. García, “lamb waves and dispersion curves in plates and its applications in ndE experiences using comsol multiphysics,” in COMSOL Conf. Proc., 2011, art. no. 11002.
[31] J. Jiao, c. He, B. Wu, r. Fei, and X. Wang, “application of wavelet transform on modal acoustic emission source location in thin plates with one sensor,” Int. J. Press. Vessels Piping, vol. 81, no. 5, pp. 427–431, 2004.
[32] B. Friedlander and B. Porat, “detection of transient signals by the Gabor representation,” IEEE Trans. Acoust. Speech Signal Process., vol. 37, no. 2, pp. 169–180, 1989.
[33] s. Zhang, y. Fei, E. Frantz, d. W. snyder, B. H. T. chai, and T. r. shrout, “High-temperature piezoelectric single-crystal recoB for sensor applications,” IEEE Trans. Ultrason. Ferroelectr. Freq. Con-trol, vol. 55, no. 12, pp. 2703–2708, 2008.
Joseph Johnson received his B.s. degree in me-chanical engineering from north carolina state University in raleigh, nc, in 2011. In fall 2012, he began graduate studies at north carolina state University, working toward his master’s degree. He is currently working as a research assistant at the Micro/nano Engineering laboratory under dr. Jiang. His research interests are high-temper-ature piezoelectric sensors and structural health monitoring.
Kyungrim Kim received his B.s. degree in me-chanical and automotive engineering from Kook-min University in Korea. In Fall 2009, he started his work as a Ph.d. student in the department of Mechanical & aerospace Engineering, north car-olina state University. He is currently working as a research assistant at the Micro/nano Engi-neering laboratory under dr. Jiang. His main re-search interests are high-temperature piezoelectric sensors and ultrasonic sensors.
Shujun Zhang received his Ph.d. degree from The state Key laboratory of crystal Materials, shandong University, china, in 2000. He is cur-rently a senior research associate at the Material research Institute and associate Professor in the Materials science and Engineering department of The Pennsylvania state University. He is an as-sociate editor for the Journal of the American Ce-ramic Society. He is a senior member of the IEEE-UFFc chapter and a member of the american ceramic society. He holds one patent and has co-
authored more than 180 papers in the area of functional single crystals and ceramics.
Di Wu received his Ph.d. degree from the Insti-tute of acoustics, chinese academy of sciences, in china. In 2007, he started his work as a lecturer of the college of sciences in Beijing Jiaotong Univer-sity. currently, he is working as a visiting scholar at the Micro/nano Engineering laboratory of north carolina state University under dr. Jiang. His main research interests are ultrasonic trans-ducers and ultrasonic nondestructive testing.
Xiaoning Jiang received his Ph.d. degree from Tsinghua University in 1997 and postdoctoral training from nanyang Technological University and The Pennsylvania state University from 1997 to 2001. He worked in industry (standard MEMs Inc. and Trs Technologies Inc.) before joining north carolina state University in 2009 as an as-sociate Professor of mechanical and aerospace en-gineering. dr. Jiang is the author or co-author of two book chapters, one book, six issued Us pat-ents and more than 10 Us patent applications,
and more than 50 technical papers and presentations on piezoelectric composite micromachined ultrasound transducers, ultrasound for medi-cal imaging and ndE, smart materials and structures, and M/nEMs.