High-strain-rate response of ultra-fine-grained coppermeyersgroup.ucsd.edu/papers/journals/Meyers...
14
High-strain-rate response of ultra-fine-grained copper A. Mishra a , M. Martin c , N.N. Thadhani c , B.K. Kad b , E.A. Kenik d , M.A. Meyers a, * a Materials Science and Engineering Program, Departments of Mechanical and Aerospace Engineering and Nanoengineering, University of California, San Diego, La Jolla, CA 92093, USA b Department of Structural Engineering, University of California, San Diego, La Jolla, CA 92093, USA c School of Materials Science and Engineering, Georgia Institute of Technology, Atlanta, GA 30332, USA d Oak Ridge National Laboratory, Oak Ridge, TN 37830, USA Received 31 October 2007; received in revised form 6 February 2008; accepted 8 February 2008 Abstract The high-strain-rate response of ultra-fine-grained (UFG) copper processed by equal channel angular pressing (ECAP) was charac- terized by three different dynamic testing methods: reverse Taylor impact, cylindrical compression specimens, and hat-shaped specimens in Hopkinson bar experiments. Upon recovery after impact, the specimens were found to undergo dynamic recrystallization at a calcu- lated temperature of 360 K, indicating that the UFG copper is thermally unstable. Reverse Taylor tests were conducted on as-received oxygen-free high-conductivity copper rod and ECAP specimens with 2 and 8 sequential deformation passes. The dynamic deformation of the samples was modeled using AUTODYN-2D, and a modified Johnson–Cook constitutive equation was found to closely capture the dynamic response. Both the dynamic experiments and analysis from the reverse Taylor tests indicate enhanced strain-rate sensitivity in comparison with conventional polycrystalline copper, in agreement with predictions of reduced activation volume. The shear band thick- ness, as obtained in forced localization tests, showed a marked decrease, in comparison to conventional polycrystalline copper; this effect is interpreted as due to an accelerated thermal softening and inherent instability exhibited by the UFG structure. Ó 2008 Acta Materialia Inc. Published by Elsevier Ltd. All rights reserved. Keywords: Severe plastic deformation (SPD); Equal channel angular pressing (ECAP); Recrystallization; Finite element analysis 1. Introduction Nanocrystalline and ultra-fine-grained (UFG) metals have unique mechanical properties (strength, hardness, fatigue resistance) that have been the subject of widespread research [1–5]. Although the quasistatic mechanical response of these materials has been studied in great detail, the corresponding response at high-strain-rates is still less well known. Gray et al. [6] reported a higher strain-rate sensitivity of UFG copper in comparison with fully annealed polycrystalline copper. This effect has been explained by the inverse relationship between the strain- rate sensitivity, defined as o ln r=o ln _ e , and activation volume for plastic deformation; the latter decreases signif- icantly in face-centered cubic (fcc) metals at small grain sizes, due to a presumed change in rate-controlling mecha- nism from forest dislocation intersection to emission of dis- locations from grain-boundary sources. Thus, the strain- rate sensitivity is increased (e.g. [4,6–10]). A topic of recent significance and concern is the thermal stability of UFG and nano-structured materials. Thermal stability is an important issue that needs to be addressed for the suitability of these materials in structural applica- tions. The severe plastic deformation techniques and, in particular, equal channel angular pressing (ECAP), are known to produce grain sizes in the range of 200–500 nm with high density of high-angle grain boundaries and satu- rated dislocation density (e.g., [11–19]). Inherently, in sin- gle-phase pure metals, such a microstructure is thermally unstable and the propensity for heat-induced recrystalliza- tion is high. Indeed, Mishra et al. [20] showed that grain 1359-6454/$34.00 Ó 2008 Acta Materialia Inc. Published by Elsevier Ltd. All rights reserved. doi:10.1016/j.actamat.2008.02.023 * Corresponding author. Tel.: +1 619 534 5698x07. E-mail address: [email protected] (M.A. Meyers). www.elsevier.com/locate/actamat Available online at www.sciencedirect.com Acta Materialia xxx (2008) xxx–xxx ARTICLE IN PRESS Please cite this article in press as: Mishra A et al., High-strain-rate response of ultra-fine-grained copper, Acta Mater (2008), doi:10.1016/j.actamat.2008.02.023
Transcript of High-strain-rate response of ultra-fine-grained coppermeyersgroup.ucsd.edu/papers/journals/Meyers...

Available online at www.sciencedirect.com
ARTICLE IN PRESS
www.elsevier.com/locate/actamat
Acta Materialia xxx (2008) xxx–xxx
High-strain-rate response of ultra-fine-grained copper
A. Mishra a, M. Martin c, N.N. Thadhani c, B.K. Kad b, E.A. Kenik d, M.A. Meyers a,*
a Materials Science and Engineering Program, Departments of Mechanical and Aerospace Engineering and Nanoengineering,
University of California, San Diego, La Jolla, CA 92093, USAb Department of Structural Engineering, University of California, San Diego, La Jolla, CA 92093, USA
c School of Materials Science and Engineering, Georgia Institute of Technology, Atlanta, GA 30332, USAd Oak Ridge National Laboratory, Oak Ridge, TN 37830, USA
Received 31 October 2007; received in revised form 6 February 2008; accepted 8 February 2008
Abstract
The high-strain-rate response of ultra-fine-grained (UFG) copper processed by equal channel angular pressing (ECAP) was charac-terized by three different dynamic testing methods: reverse Taylor impact, cylindrical compression specimens, and hat-shaped specimensin Hopkinson bar experiments. Upon recovery after impact, the specimens were found to undergo dynamic recrystallization at a calcu-lated temperature of 360 K, indicating that the UFG copper is thermally unstable. Reverse Taylor tests were conducted on as-receivedoxygen-free high-conductivity copper rod and ECAP specimens with 2 and 8 sequential deformation passes. The dynamic deformation ofthe samples was modeled using AUTODYN-2D, and a modified Johnson–Cook constitutive equation was found to closely capture thedynamic response. Both the dynamic experiments and analysis from the reverse Taylor tests indicate enhanced strain-rate sensitivity incomparison with conventional polycrystalline copper, in agreement with predictions of reduced activation volume. The shear band thick-ness, as obtained in forced localization tests, showed a marked decrease, in comparison to conventional polycrystalline copper; this effectis interpreted as due to an accelerated thermal softening and inherent instability exhibited by the UFG structure.� 2008 Acta Materialia Inc. Published by Elsevier Ltd. All rights reserved.
Keywords: Severe plastic deformation (SPD); Equal channel angular pressing (ECAP); Recrystallization; Finite element analysis
1. Introduction
Nanocrystalline and ultra-fine-grained (UFG) metalshave unique mechanical properties (strength, hardness,fatigue resistance) that have been the subject of widespreadresearch [1–5]. Although the quasistatic mechanicalresponse of these materials has been studied in great detail,the corresponding response at high-strain-rates is still lesswell known. Gray et al. [6] reported a higher strain-ratesensitivity of UFG copper in comparison with fullyannealed polycrystalline copper. This effect has beenexplained by the inverse relationship between the strain-rate sensitivity, defined as o ln r=o ln _e , and activationvolume for plastic deformation; the latter decreases signif-
1359-6454/$34.00 � 2008 Acta Materialia Inc. Published by Elsevier Ltd. All
doi:10.1016/j.actamat.2008.02.023
* Corresponding author. Tel.: +1 619 534 5698x07.E-mail address: [email protected] (M.A. Meyers).
Please cite this article in press as: Mishra A et al., High-strain-radoi:10.1016/j.actamat.2008.02.023
icantly in face-centered cubic (fcc) metals at small grainsizes, due to a presumed change in rate-controlling mecha-nism from forest dislocation intersection to emission of dis-locations from grain-boundary sources. Thus, the strain-rate sensitivity is increased (e.g. [4,6–10]).
A topic of recent significance and concern is the thermalstability of UFG and nano-structured materials. Thermalstability is an important issue that needs to be addressedfor the suitability of these materials in structural applica-tions. The severe plastic deformation techniques and, inparticular, equal channel angular pressing (ECAP), areknown to produce grain sizes in the range of 200–500 nmwith high density of high-angle grain boundaries and satu-rated dislocation density (e.g., [11–19]). Inherently, in sin-gle-phase pure metals, such a microstructure is thermallyunstable and the propensity for heat-induced recrystalliza-tion is high. Indeed, Mishra et al. [20] showed that grain
rights reserved.
te response of ultra-fine-grained copper, Acta Mater (2008),

2 A. Mishra et al. / Acta Materialia xxx (2008) xxx–xxx
ARTICLE IN PRESS
boundaries can exhibit considerable mobility at tempera-tures as low as 360 K in UFG copper.
This paper addresses the issues of strain-rate sensitivityand thermal stability in pure copper processed by ECAP.A series of high-strain-rate deformation tests were carriedout via three different techniques (cylindrical and hat-shaped Hopkinson bar and reverse Taylor tests).
2. Experimental procedure
Commercially obtained cold-rolled oxygen-free high-conductivity (OFHC) Cu rods were processed using a hor-
shear band
SD
TDND
2.2 5 2.2
4.8
2
7.5
2.3 4.8 2.3
c
a
Fig. 1. (a) Geometry of the hat-shaped specimen (all dimensions are in mmcharacterization; and (d) extraction of TEM specimens.
Fig. 2. Schematic of reverse Taylor
Please cite this article in press as: Mishra A et al., High-strain-radoi:10.1016/j.actamat.2008.02.023
izontal split ECAP die with an interior channel angle of102� and an external arc of curvature of 20o. A series ofsamples with 0, 2 and 8 passes were processed using routeBC. In route BC the specimen is rotated 90� about its longi-tudinal axis after each pass. The experimental set-up forECAP was explained earlier [20]. The Route BC was foundto yield most equiaxed grains. For the Hopkinson bar tests,two kinds of samples were machined: cylindrical specimenswith dimensions of 4 � 4 mm and hat-shaped specimenswith dimensions as indicated in Fig. 1a. The hat-shapedesign [21] has been used extensively to study adiabaticshear bands in BCC steel [22,23], tantalum [24,25]; fcc cop-
b
d
); (b) longitudinal and transverse cuts; (c) three orientations of EBSD
anvil-on-rod impact test setup.
te response of ultra-fine-grained copper, Acta Mater (2008),

400
450
500
550
600
650
700
Tem
pera
ture
, K
A. Mishra et al. / Acta Materialia xxx (2008) xxx–xxx 3
ARTICLE IN PRESS
per [26,27], aluminum alloys [28], austenitic stainless steel[29,30]; hexagonal close-packed titanium [31], and zirco-nium [32]. The specimen shape, Fig. 1, is designed to con-centrate deformation in a narrow zone facilitating theformation of a shear band. Compression tests on cylindri-cal samples were performed at strain rates of 5 � 10�3, 0.1and 102 s�1.
For Taylor tests [33], cylindrical rod samples of 9.4 mmdiameter and 40.13 mm length were machined. The rodswere lapped on both ends with 45 lm diamond suspensionto insure parallel and polished surfaces. A schematic of thereverse Taylor impact test setup is shown in Fig. 2. Theprojectile consists of a 2024-Al 80 mm diameter sabot witha maraging steel rigid anvil plate secured to the front sur-face. The rod-shaped samples were mounted to a target
0
100
200
300
400
500
0 0.02 0.04 0.06 0.08 0.1
Initial2passes8passes
True
Str
ess
(MPa
)
True Strain
Fig. 3. Quasistatic true stress-true strain plots for Cu samples in as-received state and after 2 and 8 ECAP passes (_e ¼ 0:1 s�1).
0
100
200
300
400
500
600
700
0 0.05 0.1 0.15 0.2 0.25
2passes4 passes8 passes
True
Str
ess
(MPa
)
True Strain
Strain rate ~ 2500/s
Fig. 4. Dynamic true stress-true strain plots for the initial, 2 and 8 passECAP samples (_e ¼ 2500 s�1).
Please cite this article in press as: Mishra A et al., High-strain-radoi:10.1016/j.actamat.2008.02.023
ring and aligned with a laser beam to ensure parallelimpact. An IMACON-200 high-speed digital camera wasused to capture images of the deformation of the rods
300
350
0 0.5 1 1.5 2Strain
Fig. 5. Temperature as a function of strain for strain rate _e � 103 s�1,characteristic of cylindrical specimens in Hopkinson bar test (for a strainof 0.3 as in the case of cylindrical specimens, T = 360 K).
Fig. 6. Recrystallized microstructure upon compression testing (recrys-tallized regions denoted by ‘‘R”).
te response of ultra-fine-grained copper, Acta Mater (2008),

4 A. Mishra et al. / Acta Materialia xxx (2008) xxx–xxx
ARTICLE IN PRESS
during impact by the projectile. Velocity interferometry(VISAR) (placement shown in Fig. 2) was also used to cap-ture the free surface velocity of the tested rod.
AUTODYN simulations of the anvil-on-rod impactexperiments were performed to validate the constitutiveresponse of the specimens as a function of strain e usingthe Johnson–Cook [34] constitutive equation
r ¼ ½Aþ Ben�½1þ C ln _e��½1� T �m�; ð1Þ
where A, B, C, n, and m are experimentally determinedparameters. The unknown strain-rate sensitivity, C, wasobtained by fitting the simulated free surface velocity traceto that determined experimentally using VISAR, as de-scribed by Eakins and Thadhani [35] and Martin et al.[36]. The models were further validated by comparing thesimulated transient deformation profiles with the imagescaptured during deformation. Simulations were run intwo dimensions as an axi-symmetric problem, and gaugeswere placed on the specimen’s back surface to track the freesurface velocity.
The microstructure of the hat-shaped tested sample wascharacterized using optical microscopy (OM), electronbackscattering diffraction (EBSD), and transmission elec-tron microscopy (TEM). Fig. 1b shows how specimenswere machined out of the hat-shaped sample for micro-structural examination. EBSD examination was performedin the undeformed regions and in areas close to the shearband using a Philips XL 30 scanning electron microscopeoperating at 15 kV and TSL indexing software. A 3 mmdisk (cut as shown in Fig. 1d) was electropolished using7% H2SO4 and placed in the SEM sample holder as shownin Fig. 1c, i.e. the normal, transverse, and shear (longitudi-nal) directions in the EBSD maps.
Specimens for TEM examination were obtained fromthe same 3 mm diameter cylinder. Disks for TEM foilswere machined in such a way that the shear band wasoff-center as shown in Fig. 1d. Since electropolishing cre-ates a hole in the center of the sample, this ensured thatthere existed a region around the shear band that couldbe examined under TEM. Disks with thickness of 300 lmwere cut and polished down to 100 lm using 2400 and4000 grid SiC papers. Final thinning to electron transpar-ency was achieved by electropolishing in a solution con-taining 7 vol.% H2SO4 in methanol at –35 �C/25 V.Subsequently, as needed, the perforated disks were pro-gressively ion-milled using a Gatan PIPS unit at ambientconditions until the perforation grew to the edge of theshear band.
Thin foils were prepared for TEM examination by usinga twin-jet Struers Tenupol-3 polisher with an electro-pol-ishing solution composed of 7 vol.% sulfuric acid in meth-anol at a temperature of –40 �C. TEM analysis was carriedout on a Philips CM-30 (facility at ORNL, Tennessee)operating at 300 kV. Observations were made on bothtransverse and longitudinal directions in a series of sampleswith different number of ECAP passes.
Please cite this article in press as: Mishra A et al., High-strain-radoi:10.1016/j.actamat.2008.02.023
3. Results and discussion
3.1. Cylindrical specimens
Fig. 3 shows the quasistatic true stress–true strain curvesfor initial, 2- and 8-pass ECAP Cu at a strain rate of0.1 s�1. ECAP samples having undergone significant defor-mation during processing as expected exhibited higher flowstresses. Each additional pass adds to the cumulative strainvia dislocation generation and additional grain refinement.For example, the initial grain size of �30 lm was reducedto �200 nm after 8 ECAP passes. We note here that the ini-tial cold-rolled Cu sample also exhibited an extensivedeformation substructure consistent with the near zerowork-hardening observed in the corresponding stress–strain curves. This was analyzed in greater detail by Mishraet al. [20].
Results from the dynamic compression tests carried outat a strain rate of 2500 s�1 are plotted in Fig. 4. There wasa significant increase in strength at high-strain rate as com-pared to the quasistatic tests since UFG metals (like fcccopper) are known to have a higher strain-rate sensitivitythan their coarse-grained counterpart. This topic isaddressed in detail in Section 3.3.
The temperature rise in the Hopkinson bar test can becalculated from the constitutive response of copper whichis also applicable to shear localization process. The temper-ature rise, DTd (e.g. [8,25]) can be expressed as a function ofstrain:
DT d ¼b
qCp
Z e1
eo
r � de; ð2Þ
where q is the density, Cp the heat capacity, and b is theTaylor factor. Using Johnson–Cook equation [34] as theconstitutive equation for the response and assuming that90% of the work of deformation goes into heating, i.e.,b = 0.9, the temperature change due to plastic deformationcan be expressed as [37]:
DT d ¼ 1� exp�0:9 1þ C log _e
_e0
� �qCpðT m � T rÞ
� r0eþBenþ1
nþ 1
� �24
35;ð3Þ
where in our case, Tr = 300 K, Tm = 1356 K, B = 292 MPa,Cp = 394 J (kg K)�1, q = 8.97 � 103 kg m�3 , C = 0.025,and r0 = 400 MPa. Since the work-hardening in the UFGspecimens is negligible, n = 0.
Using Eq. (3), temperature is plotted as a function ofstrain (Fig. 5). For the cylindrical compression samples,at a strain e = 0.3, the temperature in the sample was calcu-lated to be 360 K (60 K above room temperature). Thethermal stability of these samples was investigated usingoptical microscopy and is presented in Fig. 6. Large regionsof recrystallized microstructure were observed adjacent tothe UFG microstructure. Recrystallization studies onECAP copper including texture have been reported in
te response of ultra-fine-grained copper, Acta Mater (2008),

A. Mishra et al. / Acta Materialia xxx (2008) xxx–xxx 5
ARTICLE IN PRESS
several recent publications [38–42]. Estrin et al. [40]reported grain coarsening in ECAP copper resulting fromnatural aging at room temperature. Modolova et al. [38]calculated the driving force due to dislocation density inECAP samples and found it to be higher than the drivingforce due to grain boundary energy. Mishra et al. [20]reported a dislocation density of 2 � 1015 m�2 and an aver-age grain size of 200 nm in ECAP copper after 8 passes.From their reported values, the driving force due to bound-ary curvature turns out to be larger than the driving forcefor recrystallization due to dislocation density differences.
Fig. 7. Shear stress- shear strain plot for the hat shaped specimen.
Fig. 8. Optical micrograph of shear band
Please cite this article in press as: Mishra A et al., High-strain-radoi:10.1016/j.actamat.2008.02.023
Mishra et al. [20] reported a high density of high angleboundaries in samples with a large number of ECAP passes(the sequence follows as: large grain size and high densityof high angle GBs in the initial sample ? high density oflow angle GBs after few ECAP passes ? small grain sizewith high density of high angle GBs after large numberof passes). This supports the argument that the activationenergy of recrystallization is low in severely deformed sam-ples, owing to the high density of high-angle grain bound-aries that facilitates nucleation.
Murr and coworkers [43–46] have carried out extensiveexperiments on dynamic recrystallization induced byhigh-rate plastic deformation in both ballistic impact andfriction stir-welding. The association of recrystallizationwith the dynamic deformation process is undeniable inthe regime of severe plastic deformation (SPD). Thus, theterm dynamic recrystallization refers to the complex inter-play between the high-strain, high-strain-rate deformationand thermal recovery processes taking place concurrentlyor sequentially. We adopt here their broader definition ofdynamic recrystallization (DRX).
3.2. Hat-shaped specimens
The shear stress–strain response of UFG hat-shapedsample tested by Hopkinson bar is shown in Fig. 7. Thepeak shear stress is 340 MPa, which translates to680 MPa normal stresses. This is the range of strengthfor ECAP Cu as can be verified from Fig. 4. Once thehat is completely compressed, the load rises since the
s in deformed hat shaped specimen.
te response of ultra-fine-grained copper, Acta Mater (2008),

6 A. Mishra et al. / Acta Materialia xxx (2008) xxx–xxx
ARTICLE IN PRESS
pressure is now being applied on the compressed flat sam-ple surface and not the hat itself. Two specimens weretested with displacements of 0.5 (3 ring) and 1.5 mm (1ring). The shear strain in the hat-shaped sample can be esti-mated by dividing the displacement by the thickness. Forthe 0.5 mm displacement (3 ring specimen) it is equal to100.
Fig. 8 shows optical micrographs of the shear band asobserved in one of the 3 mm disks that was electropolishedto a smooth shiny finish. A circular shear band is expectedin a hat sample and curved segments of this band appear insectioned TEM rods and disks (left side). A perforation inthis sample was created in such a way that the band waslocated in the thin area next to the hole for TEM analysis.The right-hand side shows the longitudinal section. Fromthe micrograph image, the thickness of the shear band
Fig. 9. (a), (b) SEM images of the shear band in a foil that cleaved along the shshown by backscatter image of (b).
Please cite this article in press as: Mishra A et al., High-strain-radoi:10.1016/j.actamat.2008.02.023
was measured to be 50–60 lm. This is in contrast to thevalues reported by Meyers et al. [27] and Andrade et al.[26] for copper. The thickness varied with grain size andpre-deformation of the specimen. For annealed copper, itwas � 500 lm, decreasing to �200 lm for shock-hardenedcopper. It was also shown by Andrade et al. [26] that theboundary between the plastic shear and undeformedregions in a shock-hardened sample is sharp while a well-annealed sample had a more diffuse plastic deformationregion. Fig. 9a and b shows SEM micrographs of abouthalf the shear band width.
In the shear band, the time for heat conductiondecreases as the strain rate increases, leading to higher tem-peratures (at the same strain) at higher strain rates. Baiet al. [47] obtained the following approximate equationfor d, the width of the shear band:
ear band, and (c) recrystallized grain structure visible inside the shear band
te response of ultra-fine-grained copper, Acta Mater (2008),

A. Mishra et al. / Acta Materialia xxx (2008) xxx–xxx 7
ARTICLE IN PRESS
d ffi 2kTs _c
� �1=2
ð4Þ
where k is the thermal conductivity (=10.3 � 10�4 m2 s�1)and T, s and _c are the temperature, stress, and strain rateinside the shear band.
Grady [48] has another equation, of the form
d ¼9q3C2
pk3
s3a2 _c
!1=4
ð5Þ
where a is the thermal softening rate, assuming linearbehavior (s = s0(1 – aT)) and the other parameters werepreviously defined. Grady [49] later proposed anotherequation, where the term 9 is replaced by 16.
Fig. 10 shows the prediction from the above equationsand the as-measured shear band thickness from experi-ments. Wright [50] states that the agreement of the Baiequation with experimental results is usually within a fac-tor of 2. For the experiments carried out by Andradeet al. [26], there is a reasonable correspondence with bothBai’s [47] and Grady’s [48] equations . The trend of theexperimental data parallels the two equations. Althoughboth Bai’s and Grady’s equations predict a decrease inband thickness with increasing flow stress, the precipitousdrop for the UFG copper has to be attributed to an addi-tional mechanism for the loss of mechanical stability. Thiscan be due to the increased propensity of thermal softeningin ECAP samples. In the original formulation of Grady[48] this parameter assumes a linear thermal softening withthe melting point marking the zero strength value; this pro-vides a value of a = 8.8 � 10�4 K�1. The results are givenin Eq. (1) in Fig. 10. In order to simulate a more drasticthermal softening of the UFG copper, consistent with the
Fig. 10. Shear band thickness obtained from experiments as compared toprediction by Bai’s [43] and Grady’s [44] equations.
Please cite this article in press as: Mishra A et al., High-strain-radoi:10.1016/j.actamat.2008.02.023
microstructural instability, it is assumed that the fullsoftening is achieved at 400 K. This corresponds to a =2.5 � 10�3. The results are plotted as Eq. (2) in Fig. 10.Thus, the agreement with the Grady equation for theUFG specimen can be significantly improved by modifyingthe linear softening parameter a. Wei et al. [8] measured theshear-band widths in iron processed by ECAP to a grainsize of 100 nm and found a value of 15 lm which they com-pared favorably with the Bai equation. However, they useda strain rate higher by three orders of magnitude. The pres-ent results, which cover the grain size range from polycrys-talline to UFG, definitely point to a change in mechanism.
Fig. 11 illustrates the EBSD maps corresponding to thenormal direction (ND), transverse direction (TD), andshear direction (SD) in an area spanning the shear bandand nearby region. The scan area is shown in Fig. 11d withthe shear band to the left end. From the EBSD pattern,large recrystallized grains can be seen in the shear bandand the heat-affected zone close to the band. However,most of the grains in the region outside shear band areultra-fine sized and elongated as is typical of the ECAPmicrostructure. There is a large scatter in grain sizes rang-ing from 0.2 lm to 4 lm, where most of the small grain sizeis retained from ECAP processing and the large grains arisefrom heat-induced recrystallization within the shear bandand heat-affected zone close to the band. This is corrobo-rated by TEM micrographs (Fig. 12a and b) taken fromthe shear band area and (SEM image in Fig. 9c).
A temperature rise to above 500 K is predicted in theshear band, and this can have a significant effect on itsneighboring regions. The observed effect is illustrated inFig. 13a and b. Recrystallized areas can be seen advancinginto the UFG region in Fig. 13a. This is characteristic ofmigration recrystallization. The size of these recrystallizedregions (with diameters of 1–5 lm) is strongly suggestiveof an additional post-deformation process. If the tempera-ture rise is sufficiently high after DRX, grain growth canoccur during the post-deformation cooling stage. Similarfeatures were observed by Andrade et al. [26,27] in quasi-static deformation of copper in the temperature range523–573 K. These recrystallized regions are identical tothe ones characterized by Wilbrandt et al. [51] in coldworked copper subjected to annealing treatment.
3.3. Reverse Taylor tests
3.3.1. Description of results
Table 1 is a matrix of the samples examined and theindividual respective velocities. Reverse anvil-on-rod Tay-lor impact experiments were performed on the initial Cuspecimen at 88 m s�1, the 2-pass ECAP Cu specimen at123 m s�1, and the 8-pass ECAP Cu specimen at125 m s�1. Table 2 lists the yield strengths obtained fromquasistatic experiments performed on each sample type,and the final axial and transverse (areal) strains for thesamples following the reverse Taylor tests. Since the 2-passand 8-pass specimens were tested at the same velocity, the
te response of ultra-fine-grained copper, Acta Mater (2008),

Fig. 11. EBSD maps corresponding to (a) ND, (b) TD, and (c) SD in the area close to the shear band, (d) SEM image showing the EBSD scan area.
8 A. Mishra et al. / Acta Materialia xxx (2008) xxx–xxx
ARTICLE IN PRESS
amount of strain can be compared, and it is clear that the8-pass sample is a stronger material, and thus more resis-tant to deformation.
AUTODYN simulations were performed using theJohnson–Cook constitutive model with hardening con-stants obtained from stress–strain curves measured at astrain rate of 0.1 s�1, and empirically determined strain rateconstants that were modified to fit the free surface velocitytraces measured for each experiment. Fig. 14 shows anexample of the match between the experimentally measuredfree surface velocity trace for the three samples, and thatobtained from simulation using the Johnson–Cook model.The final values of the Johnson–Cook constants used forcomparison of the recorded transient shapes of the speci-
Please cite this article in press as: Mishra A et al., High-strain-radoi:10.1016/j.actamat.2008.02.023
mens with the simulation profiles at corresponding timeintervals also show a close correlation with the direct mea-surements from cylindrical specimens. The fit betweenexperimental (black lines) and calculated (gray lines) free-surface velocities is excellent.
Once the Johnson–Cook equation and constants werevalidated via correlation with the measured free surfacevelocity trace and the transient deformation profiles, valuesof the dynamic yield strength were calculated as listed inTable 2. It can be seen that the 8-pass ECAP sample is con-sistently stronger than the 2-pass and the as-received Cusamples. The yield strength values are also higher thanthose obtained at lower strain rates, indicating the effectof strain rate on yield strength (see Table 3).
te response of ultra-fine-grained copper, Acta Mater (2008),
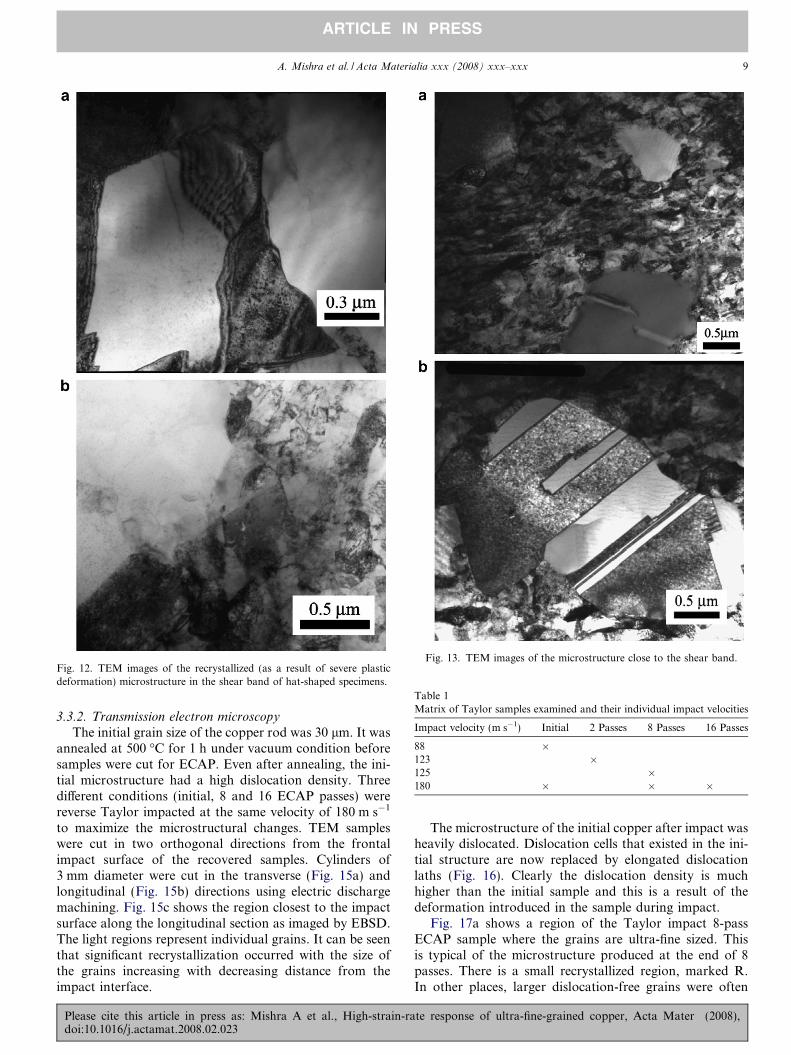
Fig. 12. TEM images of the recrystallized (as a result of severe plasticdeformation) microstructure in the shear band of hat-shaped specimens.
Fig. 13. TEM images of the microstructure close to the shear band.
Table 1Matrix of Taylor samples examined and their individual impact velocities
Impact velocity (m s�1) Initial 2 Passes 8 Passes 16 Passes
88 �123 �125 �180 � � �
A. Mishra et al. / Acta Materialia xxx (2008) xxx–xxx 9
ARTICLE IN PRESS
3.3.2. Transmission electron microscopy
The initial grain size of the copper rod was 30 lm. It wasannealed at 500 �C for 1 h under vacuum condition beforesamples were cut for ECAP. Even after annealing, the ini-tial microstructure had a high dislocation density. Threedifferent conditions (initial, 8 and 16 ECAP passes) werereverse Taylor impacted at the same velocity of 180 m s�1
to maximize the microstructural changes. TEM sampleswere cut in two orthogonal directions from the frontalimpact surface of the recovered samples. Cylinders of3 mm diameter were cut in the transverse (Fig. 15a) andlongitudinal (Fig. 15b) directions using electric dischargemachining. Fig. 15c shows the region closest to the impactsurface along the longitudinal section as imaged by EBSD.The light regions represent individual grains. It can be seenthat significant recrystallization occurred with the size ofthe grains increasing with decreasing distance from theimpact interface.
Please cite this article in press as: Mishra A et al., High-strain-radoi:10.1016/j.actamat.2008.02.023
The microstructure of the initial copper after impact washeavily dislocated. Dislocation cells that existed in the ini-tial structure are now replaced by elongated dislocationlaths (Fig. 16). Clearly the dislocation density is muchhigher than the initial sample and this is a result of thedeformation introduced in the sample during impact.
Fig. 17a shows a region of the Taylor impact 8-passECAP sample where the grains are ultra-fine sized. Thisis typical of the microstructure produced at the end of 8passes. There is a small recrystallized region, marked R.In other places, larger dislocation-free grains were often
te response of ultra-fine-grained copper, Acta Mater (2008),

Table 2Yield stresses from quasistatic and dynamic tests, and reverse Taylor test experiment details for initial, 2- and 8-pass ECAP Cu samples
No. ECAPpasses
Quasistatic yield stress(_e ¼ 4:7� 10�3s�1) (MPa)
Quasistatic yield stress(_e ¼ 0:1s�1) (MPa)
Impactvelocity(m s�1)
Axial strain,e = ln(Lf/L0)
Areal strain,e = 1 –A0/A
Dynamic flow stress,Johnson–Cook (Eq. 1)(_e ¼ 1:3� 1:7� 103s�1) (MPa)
0 298 319 88 0.137 0.377 4272 371 392 123 0.177 0.549 5138 397 430 125 0.169 0.518 571
Fig. 14. Simulated vs. experimental free surface velocity trace for Cu specimens. Simulation is based on modified Johnson–Cook parameters from stress–strain data and empirical fit to the experimental free surface velocity trace. (a) Initial Cu, 88 m/s, (b) 2- pass Cu, 123 m/s, and (c) 8-pass Cu, 125 m/s.
Table 3Table of modified J–C parameters
No. ECAPpasses
Yield stress,A (MPa)
Hardening constant,B (MPa)
Hardeningexponent, n
Strain rateconstant, C
Thermal softeningexponent, m
0 90 340 0.0334 0.009 1.092 90 390 0 0.011 1.098 90 423 0 0.017 1.09
(c)
(a) Transverse direction TEM specimens (b) Longitudinal direction TEM specimens
Fig. 15. (a and b), Orientations of TEM samples cut from cylindrical specimen after reverse Taylor impact; (c) change in microstructure as a function ofdistance from impact surface; light regions represent new grains.
10 A. Mishra et al. / Acta Materialia xxx (2008) xxx–xxx
ARTICLE IN PRESS
Please cite this article in press as: Mishra A et al., High-strain-rate response of ultra-fine-grained copper, Acta Mater (2008),doi:10.1016/j.actamat.2008.02.023

Fig. 16. Microstructure of the Taylor impact specimen.
Fig. 17. Longitudinal section (in Taylor impact specimen); (a) deformed rerecrystallized grains in heavily deformed ultra-fine grain microstructure (8 pas
A. Mishra et al. / Acta Materialia xxx (2008) xxx–xxx 11
ARTICLE IN PRESS
Please cite this article in press as: Mishra A et al., High-strain-radoi:10.1016/j.actamat.2008.02.023
observed adjacent to a heavily dislocated UFG region asshown in Fig. 17 (b–d). These are recrystallized grains thatwere formed during or immediately after Taylor impacttriggered by the temperature rise during impact. Fig. 17bis a low magnification image of large recrystallized grainsin a region of heavily deformed ultra-fine grains. Fromthese micrographs, it can be concluded that a possiblegrowth pattern of recrystallized grains is one in which thesenew grains sweep through the ultra-fine region thus replac-ing it by large, dislocation-free grains. Fig. 17c shows alarge recrystallized grain surrounded by a matrix of UFGmicrostructure. The size of these recrystallized grains variesdepending on when the nucleation of these new grains tookplace in the Taylor impact process. The features withinthese recrystallized grains show twins and stacking faults(e. g. Fig. 17d), typical of recrystallization features in fccmetals [48].
Fig. 18a shows the typical UFG microstructure in the 8-pass ECAP sample (transverse section). The correspondingselected area diffraction pattern (SADP) shows a ring-like
gion showing one apparently recrystallized grain (marked by R); (b–d)ses); and (d) annealing twins in the large recrystallized grains.
te response of ultra-fine-grained copper, Acta Mater (2008),

Fig. 18. Transverse section (in Taylor impact specimen); (a) Ultra-finegrained microstructure typical of ECAP; and (b) recrystallized grains withannealing twins in the transverse section of the Taylor shot ECAP sample.
Fig. 19. (a) Strain-rate dependence of flow stress of copper; and (b) strain-rate sensitivity, o ln r=o ln _e, as a function of grain size.
12 A. Mishra et al. / Acta Materialia xxx (2008) xxx–xxx
ARTICLE IN PRESS
pattern indicating that the microstructure consists of ultra-fine grain sizes. Other regions of this transverse sectionsample, however, show similar extent of recrystallizationas seen in the longitudinal section. Fig. 18b shows severalfully developed annealing twins in the recrystallized grains.
3.4. Strain-rate sensitivity
The combined results from Hopkinson bar tests oncylindrical specimens and Johnson–Cook predictions fromthe reverse Taylor experiments are shown in Fig. 19a. Theresults are consistent although the J–C predictions fallslightly below the dynamic flow stress directly measuredfrom the Hopkinson bar experiments. A linear fit is drawnin Fig. 19a between the two results. The slopes of theselines provide the strain-rate sensitivity. There is a slightbut clear increase in strain-rate sensitivity for the 8-passsample, in comparison with the initial condition. The
Please cite this article in press as: Mishra A et al., High-strain-radoi:10.1016/j.actamat.2008.02.023
strain-rate sensitivity is plotted in Fig. 19b and comparedwith the literature, in particular Wei et al. [8] and Grayet al. [6]. The current values of the strain-rate sensitivityare higher than the reports by Wei et al. [8] and Mayet al. [9]. However, the trend is consistent: an increasedstrain-rate sensitivity in the UFG and nanocrystallineregion. For comparison purposes data on nickel by Asaroand Suresh [7] are also given. They follow the same pattern.
4. Conclusions
The purpose of the present work was to investigate theresponse of UFG copper at high-strain-rates. ECAP cop-per specimens were subjected to three different types oftesting: Hopkinson bar compression testing of cylindrical
te response of ultra-fine-grained copper, Acta Mater (2008),

A. Mishra et al. / Acta Materialia xxx (2008) xxx–xxx 13
ARTICLE IN PRESS
samples, Hopkinson bar compression testing of hat-shapedsamples and reverse Taylor testing of ECAP specimens.The conclusions are as follows:
1. There is a significant jump in the strength of UFG cop-per in going from quasistatic to dynamic strain rate testswhich is indicative of high-strain-rate sensitivity. This isvalidated by reverse Taylor test results. Strain-rate sen-sitivities of ECAP copper after 0, 2 and 8 passes arereported to be 0.027, 0.028 and 0.034.
2. The modified Johnson–Cook equation provides a goodfit to the response of the reverse Taylor test impactedcopper.
3. Recovered specimens from Taylor and dynamic cylin-drical tests exhibit clear evidence of recrystallization atthe impact surface. The recrystallized structure is char-acterized by large grains with a profusion of annealingtwins and is thought to develop during and after defor-mation by dynamic recrystallization. The calculatedtemperature rise in the cylindrical specimens was�60 K and, therefore, the structure is considerably moreunstable than that of conventional polycrystalline cop-per, which requires �100 K for static recrystallization.
4. Shear bands with thickness of �60 lm were formed inhat-shaped ECAP specimen. The microstructure in theshear band and neighboring areas shows heavy recrys-tallization due to temperature rise during impact. Themorphology of these recrystallized regions is analogousto that in the cylindrical and Taylor specimens.
5. The thickness of the forced band in the UFG copper ismuch smaller than the predictions from the Bai andGrady equations, which are in reasonable agreementwith the shear bands for conventional polycrystallinecopper. It is proposed that the accelerated thermal soft-ening of UFG copper plays a significant role in decreas-ing the shear band thickness. This decrease in shearband thickness is also observed for bulk metallic glassesand was analyzed by Dai et al. [52] and Liu et al. [53],who attributed it partially to an accelerated softening.
Acknowledgements
This UCSD portion of this work was supported by theOffice of Naval Research MURI Award N00014-07–1-0740 and National Science Foundation under GrantCMS-0210173 (NIRT). The GIT component was fundedby ARO Grant No. E-48148-MS-000-05123-1. We thankProfs. R.J. Asaro, V.F. Nesterenko, and T.G. Langdonfor helping us with the ECAP unit and Prof. M.E. Kassnerfor fruitful discussions. The help of Mr. Hussam Jarmak-ani was especially valuable. Mr. F. Grignon was instru-mental in the development of the ECAP setup. Wegratefully acknowledge Prof. K. Vecchio and Dr. Jiangfor carrying out part of the high-strain-rate tests. Electronmicroscopy was conducted at the SHaRE User Facility,which is sponsored at Oak Ridge National Laboratory
Please cite this article in press as: Mishra A et al., High-strain-radoi:10.1016/j.actamat.2008.02.023
by the Division of Scientific User Facilities, US Depart-ment of Energy.
References
[1] Gleiter H. Prog Mater Sci 1989;33:223–315.[2] Weertman J. In: Koch, editor. Nanostructured materials. Norwich,
NY: Noyes; 2002. p. 393–417.[3] Meyers MA, Mishra A, Benson DJ. Prog Mater Sci 2006;51:427–556.[4] Meyers MA, Mishra A, Benson DJ. JOM 2006(April):41–8.[5] Koch CCI, Ovid’ko A, Seal S, Veprek S. Structural nanocrystalline
materials. Cambridge: Cambridge University Press; 2007.[6] Gray GT, Lowe TC, Cady CM, Valiev RZ, Aleksandrov IV.
Nanostruct Mater 1997;9:477.[7] Asaro RJ, Suresh S. Acta Mater 2005;53:3369.[8] Wei Q, Cheng S, Ramesh KT, Ma E. Mater Sci Eng A 2004;381:71.[9] May J, Hoppel HW, Goeken M. In: Horita Z, Langdon TG, editors.
Proceedings of the 3rd international conference on nanomaterials bysevere plastic deformation, Nanospd 3, Japan; 2005.
[10] Wei Q, Kecskes L, Jiao T, Hartwick KT, Ramesh KT, Ma E. ActaMat 2004;52:1859–69.
[11] Valiev RZ, Islamgaliev RK, Alexandrov IV. Prog Mater Sci2000;27:103–89.
[12] Furukawa M, Horita Z, Nemoto M, Langdon TG. J Mater Sci2001;36:2835.
[13] Furukawa M, Iwahashi Y, Horita Z, Nemoto M, Langdon TG.Mater Sci Eng 1998;A257:328.
[14] Langdon TG, Furukawa M, Nemoto M, Horita Z. JOM 2000;52:30.[15] Iwahashi Y, Horita Z, Nemoto M, Langdon TG. Acta Mater
1998;46:3317;Iwahashi Y, Horita Z, Nemoto M, Langdon TG. Mater Sci Eng1997;A229:23.
[16] Komura S, Horita Z, Furukawa M, Nemoto M, Langdon TG. MetallMater Trans A 2001;32:707.
[17] Pithan C, Hashimoto T, Kawazoe M, Nagahora J, Higashi K. MaterSci Eng A 2000;280:62.
[18] Yamashita A, Horita Z, Langdon TG. Mater Sci Eng A2001;300:142.
[19] Valiev R. Nature Mat 2004;3:511–6.[20] Mishra A, Kad BK, Gregori F, Meyers MA. Acta Mater
2007;55:13.[21] Meyer LW, Manwaring S. In: Metallurgical applications of shock-
wave and high-strain-rate phenomena. New York: Marcel Dekker;1986. p. 657.
[22] Beatty JH, Meyer LW, Meyers MA, Nemat-Nasser S. In: Metallur-gical applications of shock-wave and high-strain-rate phenom-ena. New York: Marcel Dekker; 1992.
[23] Lins JFC, Sandim HR, Kestenbach H-J, Raabe D, Vecchio KS.Mater Sci Eng A 2007;457:205–11.
[24] Chen Y-J, Meyers MA, Nesterenko VF. Mater Sci Eng 1999;A268:70.[25] Meyers MA, LaSalvia JC, Nesterenko VF, Chen YJ, Kad BK. In:
McNelley TR, editor. Rex ’96, Monterey; 1997. p. 27.[26] Andrade UR, Meyers MA, Vecchio KS, Chokshi AH. Acta Metall
Mater 1994;42:3183.[27] Meyers MA, Andrade U, Chokshi AH. Metall Mater Trans A
1995;26A:2881.[28] Xu YB, Zhong WL, Chen YJ, Shen LT, Liu Q, Bai YL, et al. Mater
Sci Eng 2001;A299:287.[29] Meyers MA, Perez-Prado MT, Xue Q, Xu Y, McNelley TR. Acta
Mater 2003;51:1307.[30] Xue Q, Cerreta EK, Gray GT. Acta Mat 2007;55:691.[31] Meyers MA, Subhash G, Kad BK, Prasad L. Mech Mater
1994;17:175.[32] Kad BK, Gebert J-M, Perez-Prado MT, Kassner ME, Meyers MA.
Acta Mater 2006;54:4111–27.[33] Taylor GI. Proc Royal Soc Lond A 1948;194:289.
te response of ultra-fine-grained copper, Acta Mater (2008),

14 A. Mishra et al. / Acta Materialia xxx (2008) xxx–xxx
ARTICLE IN PRESS
[34] Johnson GR, Cook WH. In: Proceedings of the 7th internationalsymposium on ballistics, The Netherlands; 1983.
[35] Eakins D, Thadhani NN. Int J Impact Eng 2007;34:1821.[36] Martin M, Mishra A, Meyers MA, Thadhani NN. Mater Sci Eng A
2007;464:202.[37] Lassila DH, Shen T, Cao BY, Meyers MA. Metall Mater Trans
2004;35A:2729.[38] Molodova X, Gottstein G, Winning M, Hellmig RJ. Mater Sci Eng A
2007;460–461:204.[39] Hebesberger T, Stuwe HP, Vorhauer A, Wetscher F, Pippan R. Acta
Mat 2005;53:393.[40] Estrin Y, Isaev NV, Lubenets SV, Malykhin SV, Pugachov AT,
Pustovalov VV, et al. Acta Mater 2006;54:5581.[41] Haouaoui M, Hartwig KT, Payzant EA. Acta Mater 2005;53:801.[42] Skrotzki W, Scheerbaum N, Oertel CG, Massion RA, Suwas S, Toth
LS. Acta Mater 2007;55:2211.
Please cite this article in press as: Mishra A et al., High-strain-radoi:10.1016/j.actamat.2008.02.023
[43] Murr LEE, Trillo A, Pappu S, Kennnedy C. J Mater Sci2002;37:3337.
[44] Murr LE, Esquivel EV. J Mater Sci 2004;39:1153–68. 15.[45] Esquivel EV, Murr LE. Mater Sci Tech 2006;22:438–52.[46] Murr LE, Pizana C. Met Mater Trans 2007;38A:2611–28.[47] Bai Y, Cheng C, Yu S. Acta Mech Sini 1986;2:1.[48] Grady DE. Mechanics of materials 1994;17:289.[49] Grady DE. In: TMS symposium on dynamic behavior of materials,
Warrendale, PA, TMS; 2007.[50] Wright TW. The physics and mathematics of adiabatic shear
bands. Cambridge: Cambridge University Press; 2002. p. 176,177.
[51] Wilbrandt PJ, Haasen P. Z Metall 1980;71:385.[52] Dai LH, Yan M, Liu LF, Bai YL. Appl Phys Lett 2005;87:14196.[53] Liu LF, Dai LH, Bai YL, Wei BC. J Non-Cryst Sol 2005;351:
3259.
te response of ultra-fine-grained copper, Acta Mater (2008),


![fzhuang356, yin.lig@wisc.edu arXiv:2005.10411v1 [cs.CV] 21 ... · fzhuang356, yin.lig@wisc.edu Abstract We present an interpretable deep model for fine-grained visual recognition.](https://static.fdocuments.in/doc/165x107/601d6d0ea2ce7f135c48f0d5/fzhuang356-yinligwiscedu-arxiv200510411v1-cscv-21-fzhuang356-yinligwiscedu.jpg)