High Speed Solder Ball Shear and Pull Tests vs. Board ...
10
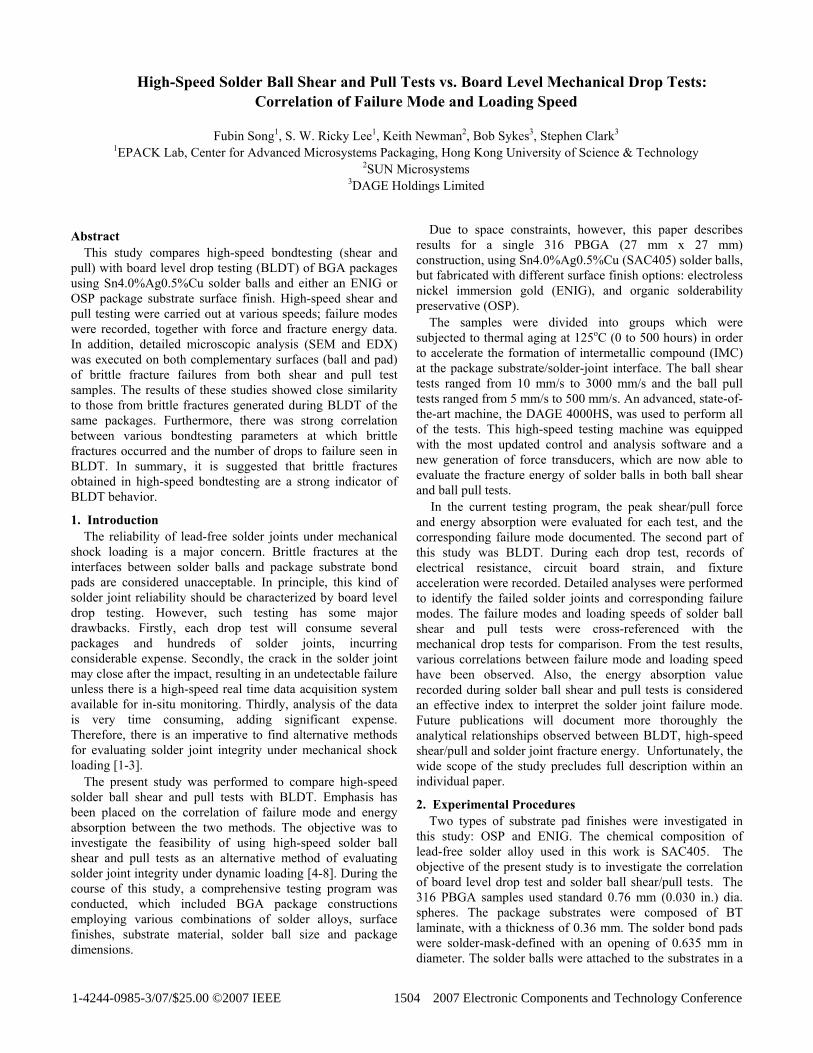
High-Speed Solder Ball Shear and Pull Tests vs. Board Level Mechanical Drop Tests: Correlation of Failure Mode and Loading Speed Fubin Song 1 , S. W. Ricky Lee 1 , Keith Newman 2 , Bob Sykes 3 , Stephen Clark 3 1 EPACK Lab, Center for Advanced Microsystems Packaging, Hong Kong University of Science & Technology 2 SUN Microsystems 3 DAGE Holdings Limited Abstract This study compares high-speed bondtesting (shear and pull) with board level drop testing (BLDT) of BGA packages using Sn4.0%Ag0.5%Cu solder balls and either an ENIG or OSP package substrate surface finish. High-speed shear and pull testing were carried out at various speeds; failure modes were recorded, together with force and fracture energy data. In addition, detailed microscopic analysis (SEM and EDX) was executed on both complementary surfaces (ball and pad) of brittle fracture failures from both shear and pull test samples. The results of these studies showed close similarity to those from brittle fractures generated during BLDT of the same packages. Furthermore, there was strong correlation between various bondtesting parameters at which brittle fractures occurred and the number of drops to failure seen in BLDT. In summary, it is suggested that brittle fractures obtained in high-speed bondtesting are a strong indicator of BLDT behavior. 1. Introduction The reliability of lead-free solder joints under mechanical shock loading is a major concern. Brittle fractures at the interfaces between solder balls and package substrate bond pads are considered unacceptable. In principle, this kind of solder joint reliability should be characterized by board level drop testing. However, such testing has some major drawbacks. Firstly, each drop test will consume several packages and hundreds of solder joints, incurring considerable expense. Secondly, the crack in the solder joint may close after the impact, resulting in an undetectable failure unless there is a high-speed real time data acquisition system available for in-situ monitoring. Thirdly, analysis of the data is very time consuming, adding significant expense. Therefore, there is an imperative to find alternative methods for evaluating solder joint integrity under mechanical shock loading [1-3]. The present study was performed to compare high-speed solder ball shear and pull tests with BLDT. Emphasis has been placed on the correlation of failure mode and energy absorption between the two methods. The objective was to investigate the feasibility of using high-speed solder ball shear and pull tests as an alternative method of evaluating solder joint integrity under dynamic loading [4-8]. During the course of this study, a comprehensive testing program was conducted, which included BGA package constructions employing various combinations of solder alloys, surface finishes, substrate material, solder ball size and package dimensions. Due to space constraints, however, this paper describes results for a single 316 PBGA (27 mm x 27 mm) construction, using Sn4.0%Ag0.5%Cu (SAC405) solder balls, but fabricated with different surface finish options: electroless nickel immersion gold (ENIG), and organic solderability preservative (OSP). The samples were divided into groups which were subjected to thermal aging at 125 o C (0 to 500 hours) in order to accelerate the formation of intermetallic compound (IMC) at the package substrate/solder-joint interface. The ball shear tests ranged from 10 mm/s to 3000 mm/s and the ball pull tests ranged from 5 mm/s to 500 mm/s. An advanced, state-of- the-art machine, the DAGE 4000HS, was used to perform all of the tests. This high-speed testing machine was equipped with the most updated control and analysis software and a new generation of force transducers, which are now able to evaluate the fracture energy of solder balls in both ball shear and ball pull tests. In the current testing program, the peak shear/pull force and energy absorption were evaluated for each test, and the corresponding failure mode documented. The second part of this study was BLDT. During each drop test, records of electrical resistance, circuit board strain, and fixture acceleration were recorded. Detailed analyses were performed to identify the failed solder joints and corresponding failure modes. The failure modes and loading speeds of solder ball shear and pull tests were cross-referenced with the mechanical drop tests for comparison. From the test results, various correlations between failure mode and loading speed have been observed. Also, the energy absorption value recorded during solder ball shear and pull tests is considered an effective index to interpret the solder joint failure mode. Future publications will document more thoroughly the analytical relationships observed between BLDT, high-speed shear/pull and solder joint fracture energy. Unfortunately, the wide scope of the study precludes full description within an individual paper. 2. Experimental Procedures Two types of substrate pad finishes were investigated in this study: OSP and ENIG. The chemical composition of lead-free solder alloy used in this work is SAC405. The objective of the present study is to investigate the correlation of board level drop test and solder ball shear/pull tests. The 316 PBGA samples used standard 0.76 mm (0.030 in.) dia. spheres. The package substrates were composed of BT laminate, with a thickness of 0.36 mm. The solder bond pads were solder-mask-defined with an opening of 0.635 mm in diameter. The solder balls were attached to the substrates in a 1-4244-0985-3/07/$25.00 ©2007 IEEE 1504 2007 Electronic Components and Technology Conference
Transcript of High Speed Solder Ball Shear and Pull Tests vs. Board ...
High-Speed Solder Ball Shear and Pull Tests vs. Board Level Mechanical Drop Tests: Correlation of Failure Mode and Loading Speed
Fubin Song1, S. W. Ricky Lee1, Keith Newman2, Bob Sykes3, Stephen Clark3
1EPACK Lab, Center for Advanced Microsystems Packaging, Hong Kong University of Science & Technology 2SUN Microsystems
3DAGE Holdings Limited
Abstract
This study compares high-speed bondtesting (shear and pull) with board level drop testing (BLDT) of BGA packages using Sn4.0%Ag0.5%Cu solder balls and either an ENIG or OSP package substrate surface finish. High-speed shear and pull testing were carried out at various speeds; failure modes were recorded, together with force and fracture energy data. In addition, detailed microscopic analysis (SEM and EDX) was executed on both complementary surfaces (ball and pad) of brittle fracture failures from both shear and pull test samples. The results of these studies showed close similarity to those from brittle fractures generated during BLDT of the same packages. Furthermore, there was strong correlation between various bondtesting parameters at which brittle fractures occurred and the number of drops to failure seen in BLDT. In summary, it is suggested that brittle fractures obtained in high-speed bondtesting are a strong indicator of BLDT behavior.
1. Introduction The reliability of lead-free solder joints under mechanical
shock loading is a major concern. Brittle fractures at the interfaces between solder balls and package substrate bond pads are considered unacceptable. In principle, this kind of solder joint reliability should be characterized by board level drop testing. However, such testing has some major drawbacks. Firstly, each drop test will consume several packages and hundreds of solder joints, incurring considerable expense. Secondly, the crack in the solder joint may close after the impact, resulting in an undetectable failure unless there is a high-speed real time data acquisition system available for in-situ monitoring. Thirdly, analysis of the data is very time consuming, adding significant expense. Therefore, there is an imperative to find alternative methods for evaluating solder joint integrity under mechanical shock loading [1-3].
The present study was performed to compare high-speed solder ball shear and pull tests with BLDT. Emphasis has been placed on the correlation of failure mode and energy absorption between the two methods. The objective was to investigate the feasibility of using high-speed solder ball shear and pull tests as an alternative method of evaluating solder joint integrity under dynamic loading [4-8]. During the course of this study, a comprehensive testing program was conducted, which included BGA package constructions employing various combinations of solder alloys, surface finishes, substrate material, solder ball size and package dimensions.
Due to space constraints, however, this paper describes results for a single 316 PBGA (27 mm x 27 mm) construction, using Sn4.0%Ag0.5%Cu (SAC405) solder balls, but fabricated with different surface finish options: electroless nickel immersion gold (ENIG), and organic solderability preservative (OSP).
The samples were divided into groups which were subjected to thermal aging at 125oC (0 to 500 hours) in order to accelerate the formation of intermetallic compound (IMC) at the package substrate/solder-joint interface. The ball shear tests ranged from 10 mm/s to 3000 mm/s and the ball pull tests ranged from 5 mm/s to 500 mm/s. An advanced, state-of-the-art machine, the DAGE 4000HS, was used to perform all of the tests. This high-speed testing machine was equipped with the most updated control and analysis software and a new generation of force transducers, which are now able to evaluate the fracture energy of solder balls in both ball shear and ball pull tests.
In the current testing program, the peak shear/pull force and energy absorption were evaluated for each test, and the corresponding failure mode documented. The second part of this study was BLDT. During each drop test, records of electrical resistance, circuit board strain, and fixture acceleration were recorded. Detailed analyses were performed to identify the failed solder joints and corresponding failure modes. The failure modes and loading speeds of solder ball shear and pull tests were cross-referenced with the mechanical drop tests for comparison. From the test results, various correlations between failure mode and loading speed have been observed. Also, the energy absorption value recorded during solder ball shear and pull tests is considered an effective index to interpret the solder joint failure mode. Future publications will document more thoroughly the analytical relationships observed between BLDT, high-speed shear/pull and solder joint fracture energy. Unfortunately, the wide scope of the study precludes full description within an individual paper. 2. Experimental Procedures
Two types of substrate pad finishes were investigated in this study: OSP and ENIG. The chemical composition of lead-free solder alloy used in this work is SAC405. The objective of the present study is to investigate the correlation of board level drop test and solder ball shear/pull tests. The 316 PBGA samples used standard 0.76 mm (0.030 in.) dia. spheres. The package substrates were composed of BT laminate, with a thickness of 0.36 mm. The solder bond pads were solder-mask-defined with an opening of 0.635 mm in diameter. The solder balls were attached to the substrates in a
1-4244-0985-3/07/$25.00 ©2007 IEEE 1504 2007 Electronic Components and Technology Conference
hot-air convective reflow oven. The Pb-free soldering profile had a 150 ±2 oC pre-heat, with a peak temperature of 260oC.
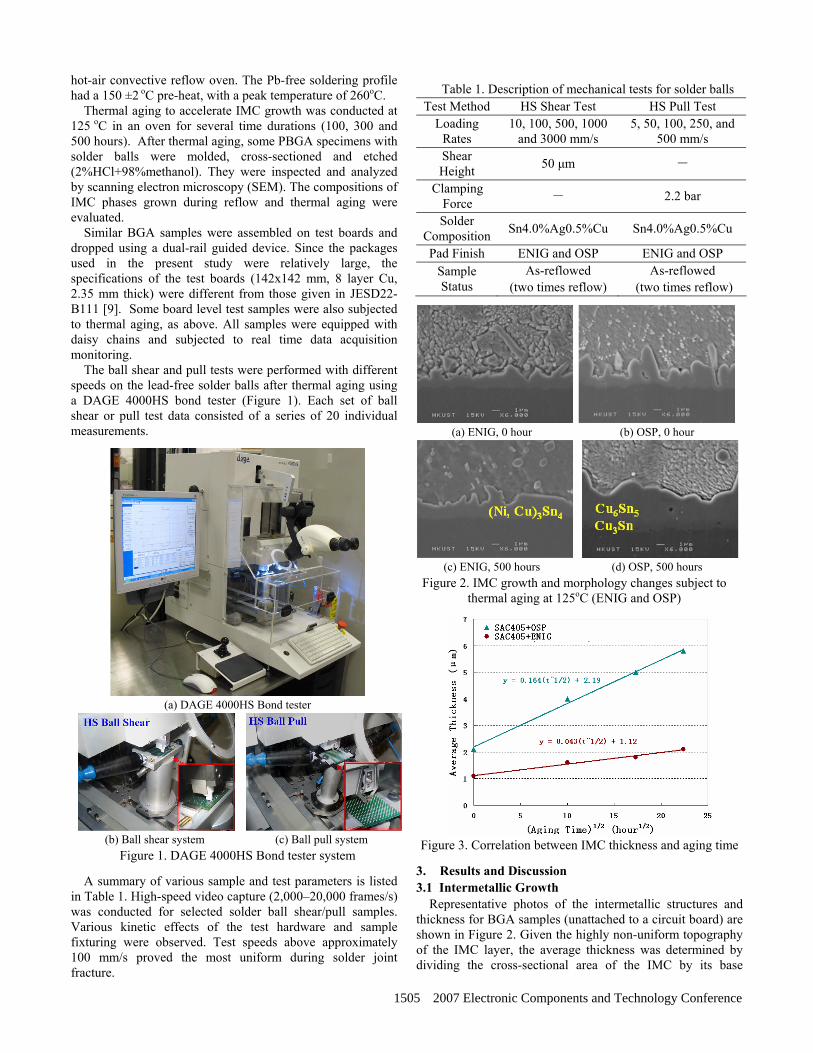
Thermal aging to accelerate IMC growth was conducted at 125 oC in an oven for several time durations (100, 300 and 500 hours). After thermal aging, some PBGA specimens with solder balls were molded, cross-sectioned and etched (2%HCl+98%methanol). They were inspected and analyzed by scanning electron microscopy (SEM). The compositions of IMC phases grown during reflow and thermal aging were evaluated.
Similar BGA samples were assembled on test boards and dropped using a dual-rail guided device. Since the packages used in the present study were relatively large, the specifications of the test boards (142x142 mm, 8 layer Cu, 2.35 mm thick) were different from those given in JESD22-B111 [9]. Some board level test samples were also subjected to thermal aging, as above. All samples were equipped with daisy chains and subjected to real time data acquisition monitoring.
The ball shear and pull tests were performed with different speeds on the lead-free solder balls after thermal aging using a DAGE 4000HS bond tester (Figure 1). Each set of ball shear or pull test data consisted of a series of 20 individual measurements.
(a) DAGE 4000HS Bond tester
(b) Ball shear system (c) Ball pull system
Figure 1. DAGE 4000HS Bond tester system
A summary of various sample and test parameters is listed in Table 1. High-speed video capture (2,000–20,000 frames/s) was conducted for selected solder ball shear/pull samples. Various kinetic effects of the test hardware and sample fixturing were observed. Test speeds above approximately 100 mm/s proved the most uniform during solder joint fracture.
Table 1. Description of mechanical tests for solder balls Test Method HS Shear Test HS Pull Test
Loading Rates
10, 100, 500, 1000 and 3000 mm/s
5, 50, 100, 250, and 500 mm/s
Shear Height 50 µm -
Clamping Force - 2.2 bar
Solder Composition Sn4.0%Ag0.5%Cu Sn4.0%Ag0.5%Cu
Pad Finish ENIG and OSP ENIG and OSP Sample Status
As-reflowed (two times reflow)
As-reflowed (two times reflow)
(a) ENIG, 0 hour (b) OSP, 0 hour
(c) ENIG, 500 hours (d) OSP, 500 hours
Figure 2. IMC growth and morphology changes subject to thermal aging at 125oC (ENIG and OSP)
Figure 3. Correlation between IMC thickness and aging time
3. Results and Discussion 3.1 Intermetallic Growth
Representative photos of the intermetallic structures and thickness for BGA samples (unattached to a circuit board) are shown in Figure 2. Given the highly non-uniform topography of the IMC layer, the average thickness was determined by dividing the cross-sectional area of the IMC by its base
1505 2007 Electronic Components and Technology Conference
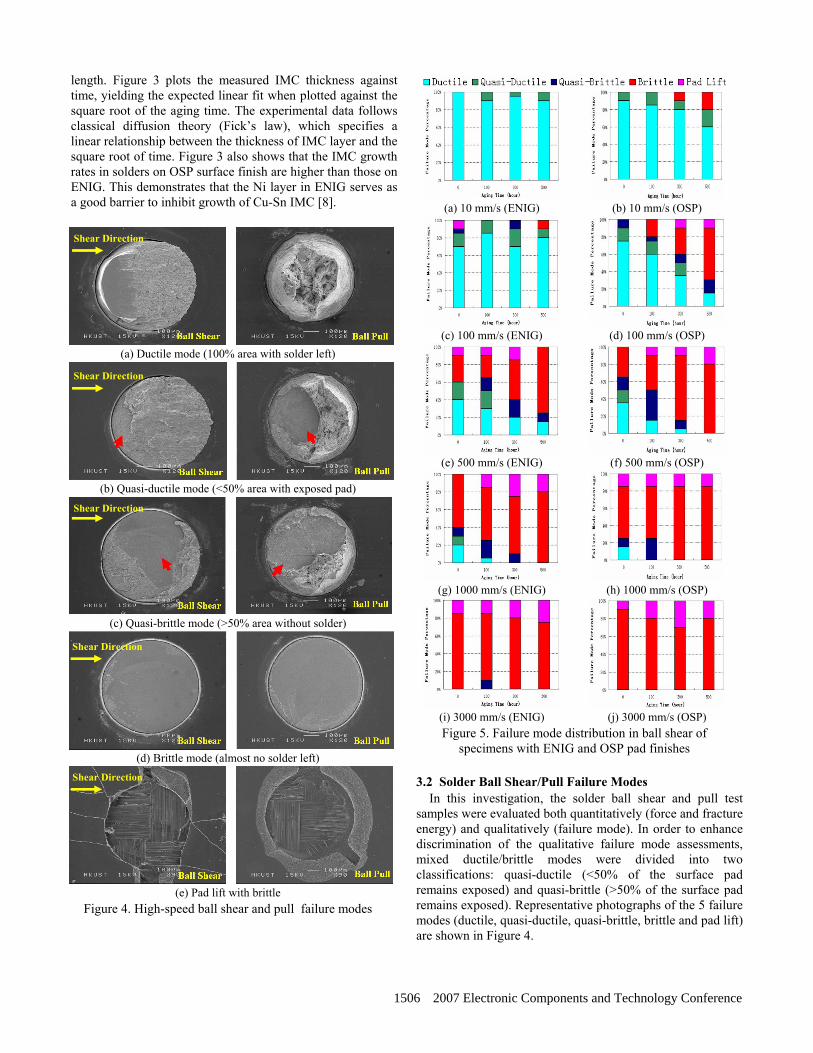
length. Figure 3 plots the measured IMC thickness against time, yielding the expected linear fit when plotted against the square root of the aging time. The experimental data follows classical diffusion theory (Fick’s law), which specifies a linear relationship between the thickness of IMC layer and the square root of time. Figure 3 also shows that the IMC growth rates in solders on OSP surface finish are higher than those on ENIG. This demonstrates that the Ni layer in ENIG serves as a good barrier to inhibit growth of Cu-Sn IMC [8].
(a) Ductile mode (100% area with solder left)
(b) Quasi-ductile mode (<50% area with exposed pad)
(c) Quasi-brittle mode (>50% area without solder)
(d) Brittle mode (almost no solder left)
(e) Pad lift with brittle
Figure 4. High-speed ball shear and pull failure modes
(a) 10 mm/s (ENIG) (b) 10 mm/s (OSP)
(c) 100 mm/s (ENIG) (d) 100 mm/s (OSP)
(e) 500 mm/s (ENIG) (f) 500 mm/s (OSP)
(g) 1000 mm/s (ENIG) (h) 1000 mm/s (OSP)
(i) 3000 mm/s (ENIG) (j) 3000 mm/s (OSP) Figure 5. Failure mode distribution in ball shear of
specimens with ENIG and OSP pad finishes 3.2 Solder Ball Shear/Pull Failure Modes
In this investigation, the solder ball shear and pull test samples were evaluated both quantitatively (force and fracture energy) and qualitatively (failure mode). In order to enhance discrimination of the qualitative failure mode assessments, mixed ductile/brittle modes were divided into two classifications: quasi-ductile (<50% of the surface pad remains exposed) and quasi-brittle (>50% of the surface pad remains exposed). Representative photographs of the 5 failure modes (ductile, quasi-ductile, quasi-brittle, brittle and pad lift) are shown in Figure 4.
Shear Direction
Shear Direction
Shear Direction
Shear Direction
Shear Direction
1506 2007 Electronic Components and Technology Conference

(a) 5 mm/s (ENIG) (b) 5 mm/s (OSP)
(c) 50 mm/s (ENIG) (d) 50 mm/s (OSP)
(e) 100 mm/s (ENIG) (f) 100 mm/s (OSP)
(g) 250 mm/s (ENIG) (h) 250 mm/s (OSP)
(i) 500 mm/s (ENIG) (j) 500 mm/s (OSP)
Figure 6. Failure mode distribution in ball pull of specimens with ENIG and OSP pad finishes
Graphical summaries of the solder ball shear and pull
failure mode results are shown in Figures 5 and 6, respectively. Similar to results of previous studies, a clear transition occurred between the ductile mode typical of low shear/pull speeds, and a brittle mode at higher test speeds [1, 2, 8]. Although the failure mode responses are remarkably similar between the shear and pull testing, the transition from ductile to brittle occurred at lower speeds in solder ball pull testing.
Figures 5 and 6 also demonstrate that the samples with an OSP finish showed an increased incidence of brittle failure with increased themal exposure. By contrast, the samples with ENIG plating yielded only a slight increase in brittle fracture
frequency even at the highest test speeds. The different brittle fracture response between ENIG and OSP may not be surprising given the comparative IMC growth rates shown in Figure 3.
Figures 7 and 8 plot the failure mode data in another format, showing the percentage of brittle failure mode for each test speed against aging time, excluding the non-solder related failure mode (pad lift). This transformation allows the rate of brittle fracture incidence as a function of time and aging temperature to be described by simple linear curve fitting. The curve fitting follows the relationship, y = ax + b, where y is the brittle failure percentage of ball shear and pull test after aging, x equals aging time, and a represents the change in brittle mode percentage with aging, and b is the brittle failure percentage for the zero time sample. It should be noted that the different slopes are a measure of the sensitivity of the test system for detecting changes in brittle fracture with time or test speed. Observe that the line with the highest slope in each graph represents the optimal test speed for each sample to detect changes in brittle fracture rate with time.
(a) Ball shear (ENIG) (b) Ball shear (OSP) Figure 7. Brittle failure percentage of ball shear tests at
various testing speeds and aging time
(a) Ball pull (ENIG) (b) Ball pull (OSP)
Figure 8. Brittle failure percentage of ball pull test at various testing speeds and aging time
Figure 9 transforms the linear curve fitting of Figures 7 & 8
into simplified brittle fracture rate response curves versus solder ball shear and pull test speeds. These graphs provide a technique to quantitatively define the optimal test speed (transition point) at which a solder joint fracture is most prone to shift from ductile to brittle failure mode. Additionally, Figure 9 can be used to define a recommended test speed for evaluating brittle solder joint fractures.
1507 2007 Electronic Components and Technology Conference
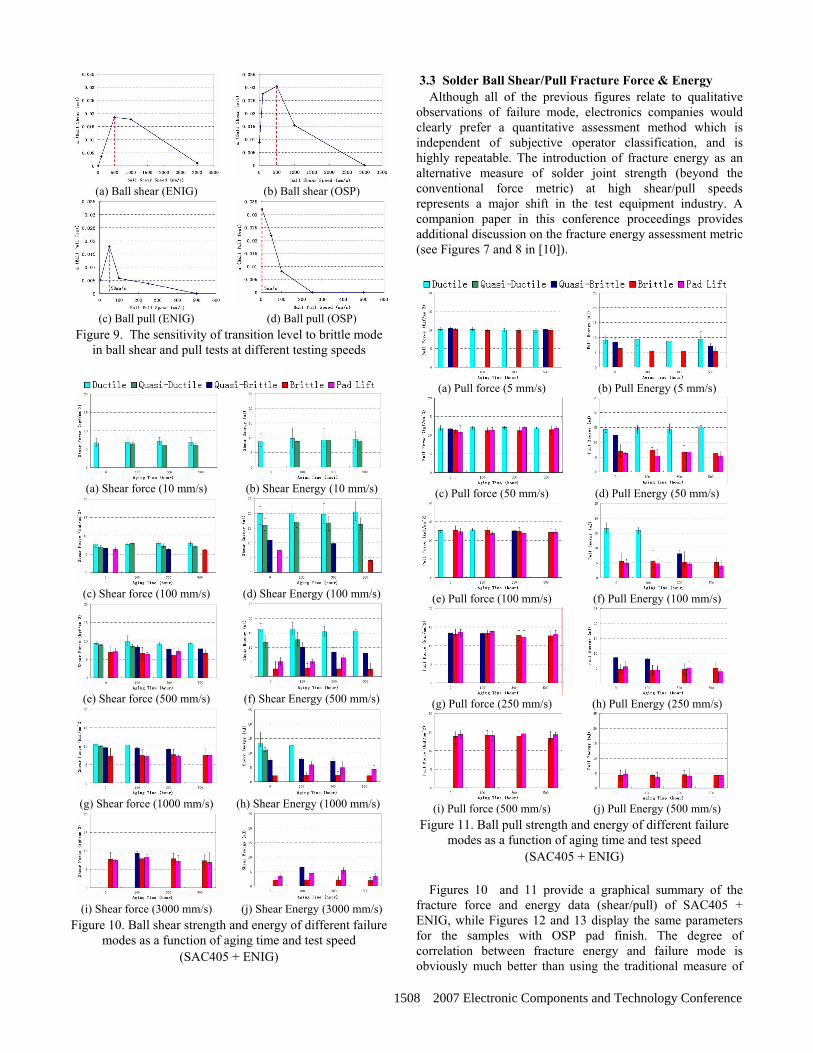
(a) Ball shear (ENIG) (b) Ball shear (OSP)
(c) Ball pull (ENIG) (d) Ball pull (OSP)
Figure 9. The sensitivity of transition level to brittle mode in ball shear and pull tests at different testing speeds
(a) Shear force (10 mm/s) (b) Shear Energy (10 mm/s)
(c) Shear force (100 mm/s) (d) Shear Energy (100 mm/s)
(e) Shear force (500 mm/s) (f) Shear Energy (500 mm/s)
(g) Shear force (1000 mm/s) (h) Shear Energy (1000 mm/s)
(i) Shear force (3000 mm/s) (j) Shear Energy (3000 mm/s)
Figure 10. Ball shear strength and energy of different failure modes as a function of aging time and test speed
(SAC405 + ENIG)
3.3 Solder Ball Shear/Pull Fracture Force & Energy Although all of the previous figures relate to qualitative
observations of failure mode, electronics companies would clearly prefer a quantitative assessment method which is independent of subjective operator classification, and is highly repeatable. The introduction of fracture energy as an alternative measure of solder joint strength (beyond the conventional force metric) at high shear/pull speeds represents a major shift in the test equipment industry. A companion paper in this conference proceedings provides additional discussion on the fracture energy assessment metric (see Figures 7 and 8 in [10]).
(a) Pull force (5 mm/s) (b) Pull Energy (5 mm/s)
(c) Pull force (50 mm/s) (d) Pull Energy (50 mm/s)
(e) Pull force (100 mm/s) (f) Pull Energy (100 mm/s)
(g) Pull force (250 mm/s) (h) Pull Energy (250 mm/s)
(i) Pull force (500 mm/s) (j) Pull Energy (500 mm/s)
Figure 11. Ball pull strength and energy of different failure modes as a function of aging time and test speed
(SAC405 + ENIG)
Figures 10 and 11 provide a graphical summary of the fracture force and energy data (shear/pull) of SAC405 + ENIG, while Figures 12 and 13 display the same parameters for the samples with OSP pad finish. The degree of correlation between fracture energy and failure mode is obviously much better than using the traditional measure of
1508 2007 Electronic Components and Technology Conference
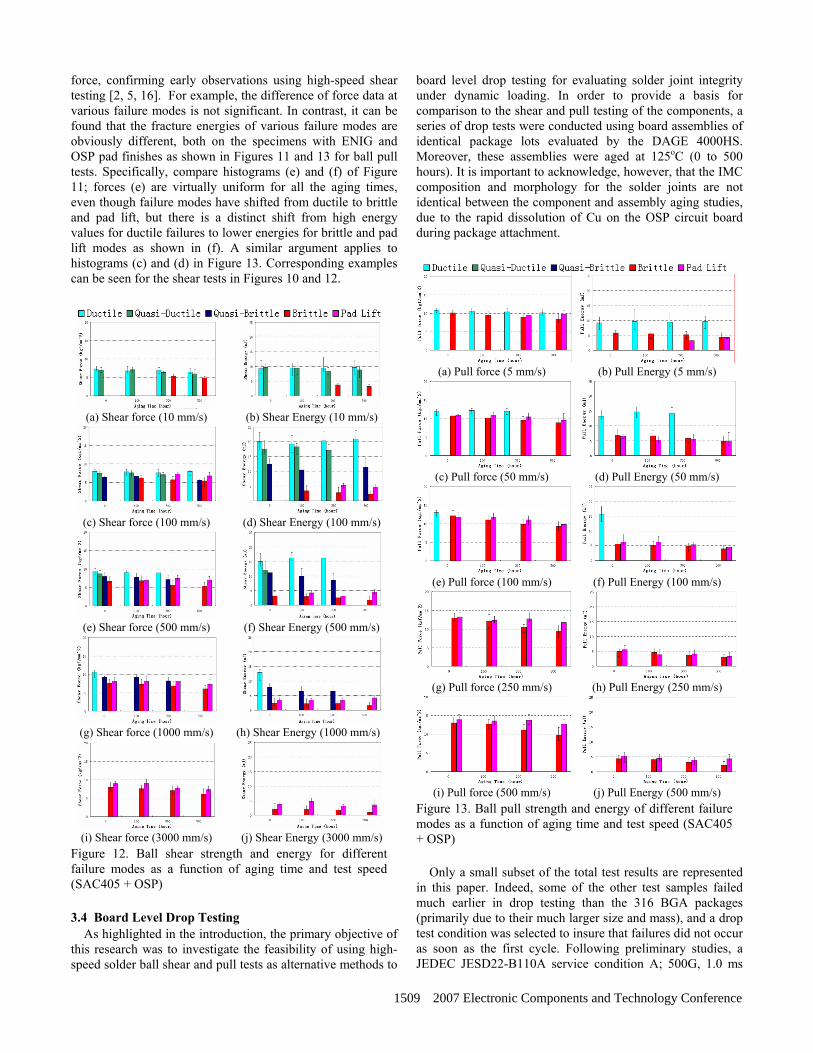
force, confirming early observations using high-speed shear testing [2, 5, 16]. For example, the difference of force data at various failure modes is not significant. In contrast, it can be found that the fracture energies of various failure modes are obviously different, both on the specimens with ENIG and OSP pad finishes as shown in Figures 11 and 13 for ball pull tests. Specifically, compare histograms (e) and (f) of Figure 11; forces (e) are virtually uniform for all the aging times, even though failure modes have shifted from ductile to brittle and pad lift, but there is a distinct shift from high energy values for ductile failures to lower energies for brittle and pad lift modes as shown in (f). A similar argument applies to histograms (c) and (d) in Figure 13. Corresponding examples can be seen for the shear tests in Figures 10 and 12.
(a) Shear force (10 mm/s) (b) Shear Energy (10 mm/s)
(c) Shear force (100 mm/s) (d) Shear Energy (100 mm/s)
(e) Shear force (500 mm/s) (f) Shear Energy (500 mm/s)
(g) Shear force (1000 mm/s) (h) Shear Energy (1000 mm/s)
(i) Shear force (3000 mm/s) (j) Shear Energy (3000 mm/s)
Figure 12. Ball shear strength and energy for different failure modes as a function of aging time and test speed (SAC405 + OSP) 3.4 Board Level Drop Testing
As highlighted in the introduction, the primary objective of this research was to investigate the feasibility of using high-speed solder ball shear and pull tests as alternative methods to
board level drop testing for evaluating solder joint integrity under dynamic loading. In order to provide a basis for comparison to the shear and pull testing of the components, a series of drop tests were conducted using board assemblies of identical package lots evaluated by the DAGE 4000HS. Moreover, these assemblies were aged at 125oC (0 to 500 hours). It is important to acknowledge, however, that the IMC composition and morphology for the solder joints are not identical between the component and assembly aging studies, due to the rapid dissolution of Cu on the OSP circuit board during package attachment.
(a) Pull force (5 mm/s) (b) Pull Energy (5 mm/s)
(c) Pull force (50 mm/s) (d) Pull Energy (50 mm/s)
(e) Pull force (100 mm/s) (f) Pull Energy (100 mm/s)
(g) Pull force (250 mm/s) (h) Pull Energy (250 mm/s)
(i) Pull force (500 mm/s) (j) Pull Energy (500 mm/s)
Figure 13. Ball pull strength and energy of different failure modes as a function of aging time and test speed (SAC405 + OSP)
Only a small subset of the total test results are represented in this paper. Indeed, some of the other test samples failed much earlier in drop testing than the 316 BGA packages (primarily due to their much larger size and mass), and a drop test condition was selected to insure that failures did not occur as soon as the first cycle. Following preliminary studies, a JEDEC JESD22-B110A service condition A; 500G, 1.0 ms
1509 2007 Electronic Components and Technology Conference
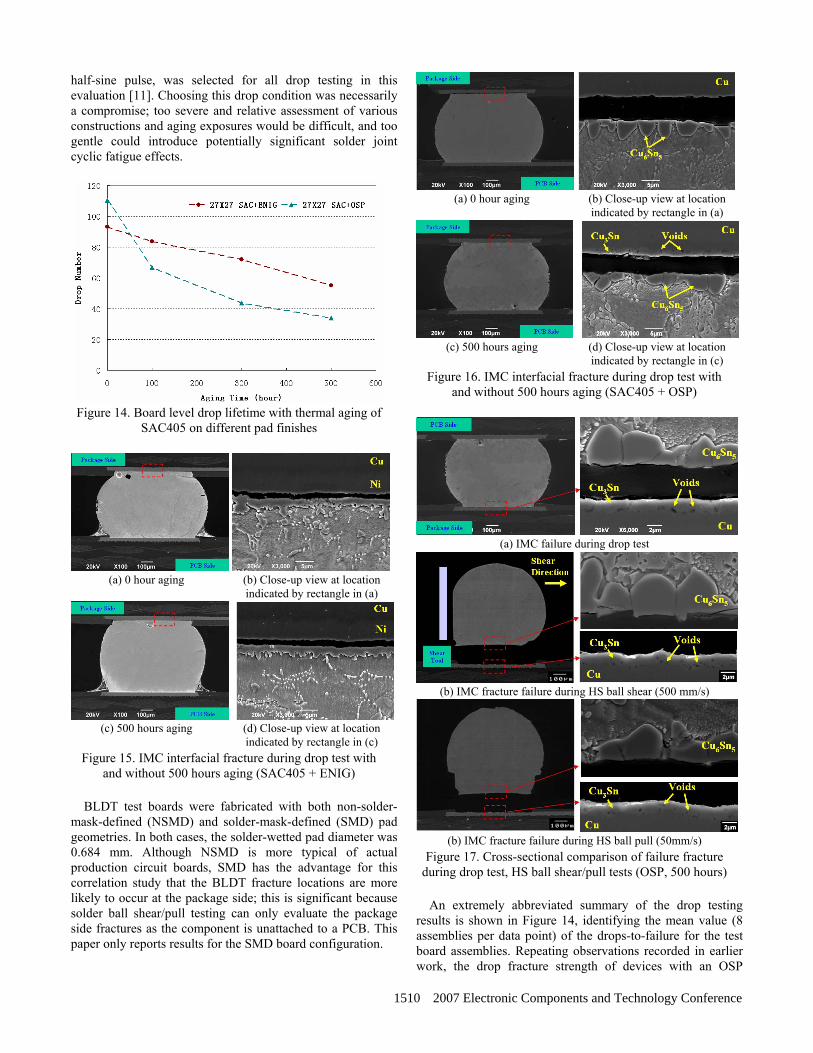
half-sine pulse, was selected for all drop testing in this evaluation [11]. Choosing this drop condition was necessarily a compromise; too severe and relative assessment of various constructions and aging exposures would be difficult, and too gentle could introduce potentially significant solder joint cyclic fatigue effects.
Figure 14. Board level drop lifetime with thermal aging of
SAC405 on different pad finishes
(a) 0 hour aging (b) Close-up view at location indicated by rectangle in (a)
(c) 500 hours aging (d) Close-up view at location indicated by rectangle in (c)
Figure 15. IMC interfacial fracture during drop test with and without 500 hours aging (SAC405 + ENIG)
BLDT test boards were fabricated with both non-solder-
mask-defined (NSMD) and solder-mask-defined (SMD) pad geometries. In both cases, the solder-wetted pad diameter was 0.684 mm. Although NSMD is more typical of actual production circuit boards, SMD has the advantage for this correlation study that the BLDT fracture locations are more likely to occur at the package side; this is significant because solder ball shear/pull testing can only evaluate the package side fractures as the component is unattached to a PCB. This paper only reports results for the SMD board configuration.
(a) 0 hour aging (b) Close-up view at location indicated by rectangle in (a)
(c) 500 hours aging (d) Close-up view at location
indicated by rectangle in (c) Figure 16. IMC interfacial fracture during drop test with
and without 500 hours aging (SAC405 + OSP)
(a) IMC failure during drop test
(b) IMC fracture failure during HS ball shear (500 mm/s)
(b) IMC fracture failure during HS ball pull (50mm/s) Figure 17. Cross-sectional comparison of failure fracture
during drop test, HS ball shear/pull tests (OSP, 500 hours) An extremely abbreviated summary of the drop testing
results is shown in Figure 14, identifying the mean value (8 assemblies per data point) of the drops-to-failure for the test board assemblies. Repeating observations recorded in earlier work, the drop fracture strength of devices with an OSP
1510 2007 Electronic Components and Technology Conference
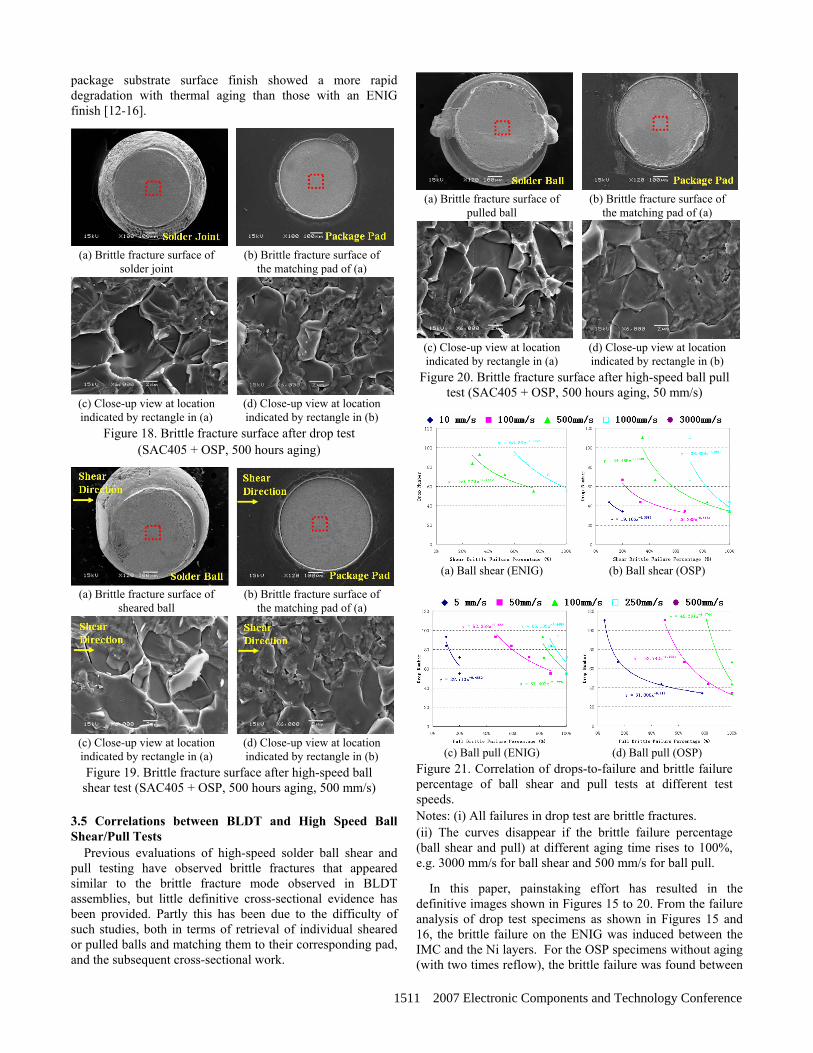
package substrate surface finish showed a more rapid degradation with thermal aging than those with an ENIG finish [12-16].
(a) Brittle fracture surface of
solder joint (b) Brittle fracture surface of
the matching pad of (a)
(c) Close-up view at location indicated by rectangle in (a)
(d) Close-up view at location indicated by rectangle in (b)
Figure 18. Brittle fracture surface after drop test (SAC405 + OSP, 500 hours aging)
(a) Brittle fracture surface of
sheared ball (b) Brittle fracture surface of
the matching pad of (a)
(c) Close-up view at location indicated by rectangle in (a)
(d) Close-up view at location indicated by rectangle in (b)
Figure 19. Brittle fracture surface after high-speed ball shear test (SAC405 + OSP, 500 hours aging, 500 mm/s)
3.5 Correlations between BLDT and High Speed Ball Shear/Pull Tests
Previous evaluations of high-speed solder ball shear and pull testing have observed brittle fractures that appeared similar to the brittle fracture mode observed in BLDT assemblies, but little definitive cross-sectional evidence has been provided. Partly this has been due to the difficulty of such studies, both in terms of retrieval of individual sheared or pulled balls and matching them to their corresponding pad, and the subsequent cross-sectional work.
(a) Brittle fracture surface of
pulled ball (b) Brittle fracture surface of
the matching pad of (a)
(c) Close-up view at location indicated by rectangle in (a)
(d) Close-up view at location indicated by rectangle in (b)
Figure 20. Brittle fracture surface after high-speed ball pull test (SAC405 + OSP, 500 hours aging, 50 mm/s)
(a) Ball shear (ENIG) (b) Ball shear (OSP)
(c) Ball pull (ENIG) (d) Ball pull (OSP)
Figure 21. Correlation of drops-to-failure and brittle failure percentage of ball shear and pull tests at different test speeds. Notes: (i) All failures in drop test are brittle fractures. (ii) The curves disappear if the brittle failure percentage (ball shear and pull) at different aging time rises to 100%, e.g. 3000 mm/s for ball shear and 500 mm/s for ball pull.
In this paper, painstaking effort has resulted in the definitive images shown in Figures 15 to 20. From the failure analysis of drop test specimens as shown in Figures 15 and 16, the brittle failure on the ENIG was induced between the IMC and the Ni layers. For the OSP specimens without aging (with two times reflow), the brittle failure was found between
1511 2007 Electronic Components and Technology Conference

Cu6Sn5 IMC and Cu layers. The brittle failure of the OSP specimens after thermal aging occurred between the Cu6Sn5 and Cu3Sn IMC phases.
From the comparison of Figures 15 to 17 (cross-section) and 18 to 20 (fracture surface), it is clear that brittle fracture interfaces from drop testing show a striking similarity with those from high-speed ball shear and pull tests. These figures provide clear evidence of a close resemblance between the brittle fracture modes of BLDT and high-speed solder ball shear and pull.
(a) Ball shear (ENIG) (b) Ball shear (OSP)
(c) Ball pull (ENIG) (d) Ball pull (OSP)
Figure 22. Correlation of drops-to-failure and normalized ball shear and pull force with the optimal testing speed
(a) Ball shear (ENIG) (b) Ball shear (OSP)
(c) Ball pull (ENIG) (d) Ball pull (OSP)
Figure 23. Correlation of drops-to-failure and normalized ball shear and pull energy with the optimal testing speed
Due to their complexity and requisite length of explanation,
it is not possible in this brief paper to elaborate on the various mathematical correlations relating the solder ball shear/pull
and drop test results. Nonetheless, an innovative approach is graphically summarized in Figures 21-23. Figure 21 relates the brittle fracture percentages from shear and pull solder ball testing to the drops-to-failure for the specific packages and drop test conditions used in this study. Briefly, this plot is achieved by plotting the drops-to-failure number for each time point against the equivalent data from shear or pull testing, followed by power law curve fitting. It should be noted that each curve in Figure 21 corresponds to one solder ball shear or pull test speed. These curves can be employed to estimate the “drops-to-failure” number from the brittle fracture percentage obtained in either the ball shear or pull test with a specific test speed. For demonstration purpose, the 5 mm/s ball pull test curve in Figure 21(d) is used as an example. If 60% of brittle fracture percentage is observed during this kind of test, then people can draw a vertical line at 60% on the horizontal axis and going upwards. When the vertical line hits the designated curve, people can turn left and find its corresponding vertical coordinate (or just plug 60% into the fitting function), which is 39. This value is the estimated “drops-to-failure” number for the same type of specimens subject to the mechanical drop test with the conditions used in the present study. In other words, the curves in Figure 21 may provide people with certain “prediction” capability to estimate the drop test results from the high-speed ball shear or pull test data.
Figure 22 details the exponential relationship between normalized solder ball shear/pull force and drops-to-failure for the brittle failure mode data points only. The shear and pull data come from the optimal speeds for each time point. Figure 23 shows similar graphical summaries for the solder ball shear/pull energy. These graphs highlight that a moderate shift in brittle fracture rate, fracture energy or force for high-speed solder ball shear/pull testing can have a significant impact on the predicted drop testing lifetime. It is suggested that a manufacturer might establish solder ball shear/pull failure mode, fracture energy or force acceptance criteria for a particular product based upon a similar analysis.
Future papers will further evaluate the various relationships between drops-to-failure, failure mode, force and fracture energy, drawing upon the much larger database generated in the full study (only a subset of the results are included in the Figures 21-23 correlations due to limitations on paper length). 4. Conclusions 1) Solder ball shear and ball pull tests produced a high
incidence of brittle fracture with increasing test speed, independent of pad finish or aging time.
2) The IMC on packages with an OSP pad grew faster than on devices with ENIG plating, and samples with OSP pads generated more brittle solder joint failures in ball shear/pull tests after thermal aging.
3) Solder ball pull testing (compared with shear) generated a higher percentage of brittle failures at all test speeds.
4) Compared to the specimens with ENIG pad finish, the ball shear/pull strength and fracture energy of specimens with OSP decreased more rapidly with aging time. This phenomenon most likely relates to the thicker Cu-Sn
1512 2007 Electronic Components and Technology Conference

phase IMC formed in OSP specimens compared to those with ENIG.
5) Thermal aging showed a significant effect on board level drop reliability in this study for both ENIG and OSP package substrate pad finishes. SAC + ENIG exhibits longer drop impact life after thermal aging than that of SAC + OSP. From SEM inspection, all drop test failures were brittle fracture at an IMC interface, regardless of pad finish or aging time.
6) From the failure analysis of drop test specimens, the brittle failure on the ENIG was induced between the IMC and the Ni layers. For the OSP specimens without aging (with two times reflow), the brittle failure was found between Cu6Sn5 IMC and Cu layers. The brittle failure of the OSP specimens after thermal aging occurred between the Cu6Sn5 and Cu3Sn IMC phases.
7) Detailed comparison of brittle fracture interfaces from drop testing with those from high-speed shear ball shear and pull tests showed a striking similarity. Therefore, based on these microstructural observations, high-speed ball shear and pull tests can be used as an indicator of board level drop test performance.
8) Power law relationships can be obtained at different shear/pull testing speeds using the combined results of drops-to-failure and brittle failure percentages of ball shear/pull tests with thermal aging time. Using this correlation, drop impact lifetime can be estimated according to the brittle failure percentages obtained in the high-speed ball shear and pull tests.
References 1. A. T. Valota, A. Losavio, et al “ High Speed Pull Test
Characterization of BGA Solder Joints,” Proc. 7th International Conference on Thermal, Mechanical and Multiphysics Simulation and Experiments in Micro-Electronics and Micro-Systems, 2006. EuroSime 2006. Milano, Italy, April 2006.
2. C. L. Yeh, Y. S. Lai, “Insights into Correlation Between Board-level Drop Reliability and Package-level Ball Impact Test,” Proc. 56th Electronic Components & Technology Conference, San Diego, CA, June 2006, pp. 455-461.
3. K. Newman, “BGA Brittle Fracture—Alternative Solder joint Integrity Test Methods,” Proc. 55th Electronic Components & Technology Conference, Orlando, FL, June 2005, pp. 1194-1200.
4. JEDEC Standard JESD22-B117A, “Solder Ball Shear,” October 2006.
5. Julian Yan Hon Chia, et al., “The mechanics of the solder ball shear test and the effect of shear rate,” Materials Science and Engineering A 417 2006, pp. 259–274.
6. X. Huang, S. W. R. Lee, C. C. Yan and S. Hui, “Characterization and Analysis on the Solder Ball Shear Testing Conditions,” Proc. 51st Electronic Components & Technology Conference, Orlando, FL, June 2001, pp. 1065-1071.
7. Raiser, G., et al., “Solder Joint Reliability Improvement Using the Cold Ball Pull Metrology,” Proc InterPACK
'05: Intl Electronic Packaging Technical Conf and Exhibition, San Francisco, CA, July 17-22, 2005.
8. F. B. Song and S. W. R. Lee, “Investigation of IMC Thickness Effect on the Lead-free Solder Ball Attachment Strength-Comparison between Ball Shear Test and Cold Bump Pull Test Results,” Proc. 56th Electronic Components & Technology Conference, San Diego, CA, June 2006, pp. 1196 - 1203.
9. JEDEC Standard JESD22-B111, “Board Level Drop Test Method of Components for Handheld Electronic Products,” July 2003.
10. F. B. Song, S. W. R. Lee, K. Newman, B. Sykes and S. Clark, “Brittle Failure Mechanism of SnAgCu and SnPb Solder Balls during High Speed Ball Shear and Cold Ball Pull Test,” Proc. 57th Electronic Components & Technology Conference, Reno, NV, June 2007.
11. JEDEC Standard JESD22-B110A, “Subassembly Mechanical Shock,” November 2004.
12. C. Brizer, et al “Drop Test Reliability Improvement of Lead-free Fine Pitch BGA Using Different Solder Ball Composition,” Proc. 55th Electronic Components & Technology Conference, Orlando, FL, June 2005, pp. 1194-1200.
13. Yueli, “High Temperature Aging Affects on Lead Free CSPs - Drop Test Reliability,” IPC/ JEDEC conf., August 2006, Santa Clara, CA.
14. T. C. Chiu, et al “Effect of Thermal Aging on Board Level Drop Reliability for Pb-free BGA Packages,” Proc. 54th Electronic Components & Technology Conference, Las Vegas, NV, June 2004, pp. 1256-1262.
15. L. Xu and J. H. L. Pang, “Effect of Imtermetallic and Kirkendall Voids Growth on Board Level Drop Reliability for SnAgCu Lead-free BGA Solder Joint,” Proc. 56th Electronic Components & Technology Conference, San Diego, CA, June 2006, pp. 275-282.
16. E. H. Wong, et al, “Drop Impact: Fundamentals and Impact Characterization of Solder Joints,” Proc. 55th Electr. Comp. Technol. Conf., Lake Buena Vista, FL, 2005, pp. 1202-1209.
1513 2007 Electronic Components and Technology Conference