ACN High Speed Internet & ACN High Speed Internet + Voice Rogers Territories: Ontario.

High-Speed Services for Internet Access: Status as of June 30, 2008
Industry Analysis and Technology Division Wireline Competition Bureau
July 2009
This report is available for reference in the FCC’s Reference Information Center, Courtyard Level, 445 12th Street, SW, Washington, DC. Copies may be purchased by contacting Best Copy and Printing, Inc., 445 12th Street, SW, Room CY-B402, Washington, DC 20554, telephone (800) 378-3160, or via their website at www.bcpiweb.com. The report can also be downloaded from the Wireline Competition Bureau Statistical Reports Internet site at www.fcc.gov/wcb/stats.
1
High-Speed Services for Internet Access: Status as of June 30, 2008 Congress directed the Commission and the states, in section 706 of the Telecommunications Act of 1996, to encourage deployment of advanced telecommunications capability in the United States on a reasonable and timely basis.1 To assist in its evaluation of such deployment, in 2000 the Commission instituted a formal data collection program (FCC Form 477) to gather standardized information about subscribership to high-speed services, including advanced services, from wireline telephone companies, cable system operators, terrestrial wireless service providers, satellite service providers, and any other facilities-based providers of advanced telecommunications capability.2 Filers were required to report the number of subscribers they had in each state, broken down by speed tier and technology, and to identify all Zip Codes in which they had at least one high-speed connection in service.3 The Commission and others have recognized these requirements as insufficiently granular or precise to inform necessary policymaking. In June 2008, the Commission released a Report and Order (FCC 08-89) and Order on Reconsideration (FCC 08-148), which together implemented significant improvements to the way in which the Commission collects data on these services.4 As part of these improvements, which were effective for the March 2009 collection of data as of year-end 2008, providers of wired broadband, fixed-wireless broadband, and satellite-based broadband connections report subscriber counts at the Census Tract level rather than the state level, and all filers report their connections in accordance with an increased number of upload and download transmission speed tiers. In conjunction with measures underway pursuant to the Broadband Data Improvement Act and the Recovery Act,5 the new Form 477 data will provide 1 See §706, Pub.L. 104-104, Title VII, Feb. 8, 1996, 110 Stat. 153, reproduced in the notes under 47 U.S.C. § 157. In this report, we use the term “high-speed” to describe services that provide the subscriber with transmissions at a speed in excess of 200 kilobits per second (kbps) in at least one direction. “Advanced services,” which provide the subscriber with transmission speeds in excess of 200 kbps in each direction, are a subset of high-speed services.
2 Local Competition and Broadband Reporting, CC Docket No. 99-301, Report and Order, 15 FCC Rcd 7717 (2000); Local Telephone Competition and Broadband Reporting, WC Docket No. 04-141, Report and Order, 19 FCC Rcd 22340 (2004). Qualifying entities file FCC Form 477 each year on March 1 (reporting data for the preceding December 31) and September 1 (reporting data for June 30 of the same year). The first data collected were as of December 31, 1999.
3 Because of the inherent mobility of their service, mobile wireless providers reported subscribers by state and the Zip Codes that best represented their broadband-network coverage area. In addition to reporting subscribers by state and Zip Codes with connections in service, incumbent telephone companies and cable system operators reported their DSL or cable modem service availability to the housing units in their service area in the state. 4 Development of Nationwide Broadband Data to Evaluate Reasonable and Timely Deployment of Advanced Services to All Americans, Improvement of Wireless Broadband Subscribership Data, and Development of Data on Interconnected Voice over Internet Protocol (VoIP) Subscribership, WC Docket No. 07-38, Report and Order, 23 FCC Rcd 9691 (2008); Order on Reconsideration, 23 FCC Rcd 9800 (2008). Effective with the filing of data as of December 31, 2008, Form 477 is a Web-based electronic filing system. Information about this system is available at http://www.fcc.gov/form477/.
5 See 47 U.S.C. § 1301 et seq. (Broadband Data Improvement Act); American Recovery and Reinvestment Act of 2008, Pub.L. 111-5, 123 Stat. 115 (2009) (Recovery Act).
2
the Commission and the public with a more valuable resource for evaluating the state of broadband in the country. Statistics reported here reflect data as of June 30, 2008, and are the last to be based on data collected under the previous Form 477 requirements.6 Readers can draw the following broad conclusions from the data summarized in this report: • High-speed lines connecting homes and businesses to the Internet at speeds exceeding 200
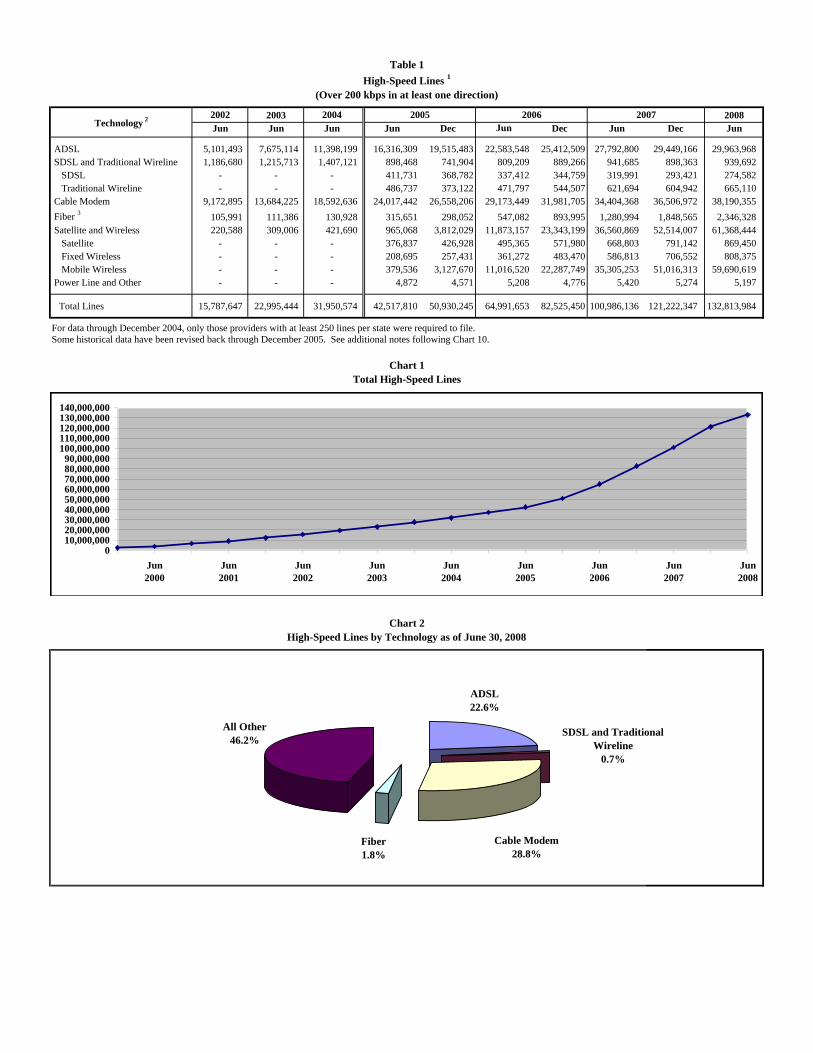
kbps in at least one direction increased by 10% during the first half of 2008, from 121.1 million lines to 132.8 million lines in service, following a 20% increase, from 101.0 million to 121.2 million lines, during the second half of 2007. For the full twelve-month period ending June 30, 2008, high-speed lines increased by 32% (or 31.8 million lines). See Table 1 and Chart 1.
• ADSL lines increased by 0.5 million lines during the first half of 2008, fiber connections
increased by 0.5 million lines, and cable modem service increased by 1.7 million lines. For the full twelve-month period ending June 30, 2008, ADSL increased by 2.2 million lines, fiber connections increased by 1.1 million lines, and cable modem service increased by 3.8 million lines. See Table 1.
6 The terms “high-speed connections” and “broadband connections” are synonyms in this report. The reported connections terminate at end user locations and enable the end user to receive information from and/or send information to the Internet at information transfer rates exceeding 200 kbps in at least one direction. “End users” are residential, business, institutional, or government entities who use services for their own purposes and who do not resell such services to other entities. The “facilities-based” provider of a broadband connection is the entity that owns the portion of the physical facility that terminates at the end user location, obtains an unbundled network element (UNE), special access line, or other leased facility that terminates at the end user location and provisions/equips it as broadband, or provisions/equips a broadband wireless channel to the end user location over licensed spectrum or over spectrum that the provider uses on an unlicensed basis. Facilities-based providers report information about connections they provide directly to their own end-user customers and also connections that they provide to Internet Service Providers for resale to end users.
Prior to June 2005, providers with fewer than 250 high-speed connections in service in a particular state were not required to report data for that state. Therefore, small providers, many of whom serve rural areas with relatively small populations, were underrepresented in the data. Including these providers resulted in a one-time increase – from 552 in December 2004 to 1,270 in June 2005 – in the number of holding companies and unaffiliated entities reporting information about high-speed connections. See Table 7. High-speed lines reported in voluntary submissions of data prior to June 2005 represented less than 0.05% of total reported high-speed lines. As of June 30, 2005, filers with fewer than 250 lines in a state (including some entities that previously made voluntary submissions) represented about 0.2% of total reported high-speed lines.
Statistical summaries of the earlier Form 477 data collections appeared in Deployment of Advanced Telecommunications Capability to All Americans in a Reasonable and Timely Fashion, CC Docket No. 98-146, Second Report, 15 FCC Rcd 20913 (2000) (Second 706 Report), available at www.fcc.gov/broadband/706.html, and in previous releases of the High-Speed Services for Internet Access report, available at www.fcc.gov/wcb/stats.
3
• Of the 132.8 million total high-speed lines, 28.8% were cable modem, 22.6% were ADSL, 0.7% were symmetric DSL (SDSL) or traditional wireline, 1.8% were fiber to the end user premises, and 46.2% used other technologies.7 See Chart 2.
• Lines connecting homes and businesses to the Internet at transmission speeds exceeding 200
kbps in both directions increased from 80.3 million lines to 88.4 million lines during the first half of 2008. For the full twelve-month period ending June 30, 2008, they increased by 18.8 million, from 69.6 million lines to 88.4 million lines. See Table 2 and Chart 3.
• Of the 88.4 million lines which were faster than 200 kbps in both directions, 42.8% were
cable modem, 29.6% were ADSL, 1.1% were SDSL or traditional wireline, 2.7% were fiber to the end user premises, and 23.9% used other technologies. See Chart 4.
• Of the 132.8 million total high-speed lines, 79.1 million were designed to serve primarily
residential end users. Cable modem represented 46.7% of these lines while 34.1% were ADSL, 0.1% were SDSL or traditional wireline connections, 2.7% were fiber to the end user premises, and 16.4% used other technologies. See Table 3 and Chart 6. For state-specific data, see Table 13.
• Of the 88.4 million lines that were faster than 200 kbps in both directions, 74.5 million lines
were designed to serve primarily residential end users. Of these, cable modem represented 49.2% while 31.3% were ADSL, 0.2% were SDSL or traditional wireline, 2.9% were fiber to the end user premises, and 16.5% used other technologies. See Table 4 and Chart 8.
• Of the 88.4 million reported high-speed lines that were faster than 200 kbps in both
directions as of June 30, 2008, 55.5% were at least 2.5 mbps in the faster direction and 44.5% were slower than 2.5 mbps in the faster direction. See Table 5.
• Incumbent LECs or their affiliates reported 97.3% of ADSL connections, 91.8% of fiber-to-
the-premises connections, 81.3% of the mobile service subscribers whose wireless device is capable of operating on a high-speed mobile wireless network, and 32.4% of traditional wireline connections. When all technologies are considered, incumbent LECs reported 60.4% of total high-speed connections. See Table 6.
• High-speed lines were reported in all 50 states, the District of Columbia, American Samoa,
Guam, Northern Mariana Islands, Puerto Rico, and the Virgin Islands. See Table 9 and, for historical data, Tables 10 - 12.
7 Providers are instructed to report a high-speed connection in the (mutually exclusive) technology category that characterizes the last few feet of distribution plant to the subscriber’s premises. In addition to cable modem, ADSL, SDSL, traditional wireline when used for Internet access, and optical carrier (fiber to the end user) connections, reporting entities specify satellite, terrestrial fixed wireless (licensed or unlicensed), terrestrial mobile wireless (licensed or unlicensed), electric power line, or “all other” technology. See additional notes following Chart 10.

4
• As a nationwide average, we estimate that high-speed DSL connections were available to 83% of the households to whom incumbent LECs could provide local telephone service, and that high-speed cable modem service was available to 96% of the households to whom cable system operators could provide cable TV service. See Table 14.
• Providers other than providers of terrestrial mobile wireless services listed the Zip Codes in
which they had at least one high-speed connection in service to an end user, while terrestrial mobile wireless service providers listed the Zip Codes that best represented their service territories. Combining these data, 100% of 5-digit geographical Zip Codes were represented in the lists filed for June 2008.8 The most widely reported technologies by this measure were high-speed mobile wireless (with at least some presence reported in 99% of Zip Codes), satellite (in 93% of Zip Codes), ADSL (in 87% of Zip Codes), and cable modem service (in 67% of Zip Codes). ADSL and/or cable modem connections were reported to be present in 91% of Zip Codes.9 See Tables 15 and 16, and the map that follows Table 16. For state-specific data, see Table 17.
• High population density and high median household income each have had a positive
association with reports that high-speed subscribers are present. See Tables 18 and 19. As other information from the Commission’s data collection program (FCC Form 477) becomes available, it will be included in future reports on the deployment of advanced telecommunications capability and in publications such as this one. We invite users of this information to provide suggestions for improved data collection and analysis by: • Using the attached customer response form, • E-mailing comments to [email protected] or [email protected], • Calling the Industry Analysis and Technology Division of the Wireline Competition Bureau
at (202) 418-0940, or • Participating in any formal proceedings undertaken by the Commission to solicit comments
for improvement of FCC Form 477.
8 Lists of Zip Codes with number of service providers as reported in the FCC Form 477 filings are made available at www.fcc.gov/wcb/stats in a format that honors requests for nondisclosure of information the reporting entities assert is competitively sensitive. Form 477 filings of data after June 30, 2008 will not include broadband provider Zip Code lists. The later filings will include broadband information based on census tracts.
9 The 91.4% figure includes Zip Codes with either ADSL subscribers reported, cable modem subscribers reported, or both. In 63.0% of Zip Codes, both ADSL and cable modem subscribers have been reported. In 24.2% of Zip Codes, there are ADSL subscribers reported but no cable modem subscribers, and in 4.2% of Zip Codes there are cable modem subscribers reported but no ADSL subscribers reported.
2003 2008Jun
ADSL 5,101,493 7,675,114 11,398,199 16,316,309 19,515,483 22,583,548 25,412,509 27,792,800 29,449,166 29,963,968 SDSL and Traditional Wireline 1,186,680 1,215,713 1,407,121 898,468 741,904 809,209 889,266 941,685 898,363 939,692 SDSL - - - 411,731 368,782 337,412 344,759 319,991 293,421 274,582 Traditional Wireline - - - 486,737 373,122 471,797 544,507 621,694 604,942 665,110 Cable Modem 9,172,895 13,684,225 18,592,636 24,017,442 26,558,206 29,173,449 31,981,705 34,404,368 36,506,972 38,190,355 Fiber 3 105,991 111,386 130,928 315,651 298,052 547,082 893,995 1,280,994 1,848,565 2,346,328 Satellite and Wireless 220,588 309,006 421,690 965,068 3,812,029 11,873,157 23,343,199 36,560,869 52,514,007 61,368,444 Satellite - - - 376,837 426,928 495,365 571,980 668,803 791,142 869,450 Fixed Wireless - - - 208,695 257,431 361,272 483,470 586,813 706,552 808,375 Mobile Wireless - - - 379,536 3,127,670 11,016,520 22,287,749 35,305,253 51,016,313 59,690,619 Power Line and Other - - - 4,872 4,571 5,208 4,776 5,420 5,274 5,197
Total Lines 15,787,647 22,995,444 31,950,574 42,517,810 50,930,245 64,991,653 82,525,450 100,986,136 121,222,347 132,813,984
Some historical data have been revised back through December 2005. See additional notes following Chart 10.
JunJun Jun
For data through December 2004, only those providers with at least 250 lines per state were required to file.
Jun2002 2005 2006 2007
DecTechnology 2
Chart 1Total High-Speed Lines
Chart 2High-Speed Lines by Technology as of June 30, 2008
Jun
Table 1High-Speed Lines 1
(Over 200 kbps in at least one direction)
Dec2004
Jun Dec
010,000,00020,000,00030,000,00040,000,00050,000,00060,000,00070,000,00080,000,00090,000,000
100,000,000110,000,000120,000,000130,000,000140,000,000
Jun2000
Jun2001
Jun2002
Jun2003
Jun2004
Jun2005
Jun2006
Jun2007
Jun2008
Cable Modem28.8%
SDSL and Traditional Wireline
0.7%
ADSL22.6%
Fiber1.8%
All Other46.2%

2003 2008
Jun Jun Jun Jun Dec Jun Dec Jun Dec Jun
ADSL 1,852,879 2,536,368 3,768,019 13,176,095 15,921,336 18,310,250 21,143,785 23,656,827 25,243,814 26,132,248 SDSL and Traditional Wireline 1,186,680 1,215,713 1,407,121 869,772 737,192 807,951 888,350 940,971 898,295 939,543 SDSL - - - 387,451 368,736 336,586 344,739 319,352 293,426 274,582 Traditional Wireline - - - 482,321 368,456 471,365 543,611 621,619 604,869 664,961 Cable Modem 6,819,395 11,935,866 17,567,468 22,745,012 26,293,596 28,892,961 31,594,111 33,935,733 36,165,251 37,848,833 Fiber 3 104,015 110,829 129,636 314,229 297,048 545,992 892,637 1,278,906 1,844,767 2,344,477 Satellite and Wireless 66,073 64,393 93,805 223,274 338,635 2,275,313 4,981,768 9,801,348 16,096,448 21,143,958 Satellite - - - 10,966 36,331 27,489 36,026 57,202 73,747 155,312 Fixed Wireless - - - 191,229 220,268 333,368 454,834 554,316 675,489 763,121 Mobile Wireless - - - 21,079 82,036 1,914,456 4,490,908 9,189,830 15,347,212 20,225,525 Power Line and Other - - - 4,174 4,501 5,209 4,776 5,420 5,274 5,197
Total Lines 10,029,042 15,863,169 22,966,048 37,332,557 43,592,308 50,837,676 59,505,427 69,619,205 80,253,849 88,414,256
Total High-Speed Lines
For data through December 2004, only those providers with at least 250 lines per state were required to file.
Advanced Services Lines
Some historical data have been revised back through December 2005. See additional notes following Chart 10.
20062004
Chart 4Advanced Services Lines by Technology as of June 30, 2008
Table 2Advanced Services Lines 1
(Over 200 kbps in both directions)
Chart 3
Technology 22002 2005 2007
010,000,00020,000,00030,000,00040,000,00050,000,00060,000,00070,000,00080,000,00090,000,000
100,000,000
Jun2000
Jun2001
Jun2002
Jun2003
Jun2004
Jun2005
Jun2006
Jun2007
Jun2008
Cable Modem42.8%
SDSL and Traditional Wireline
1.1%
ADSL29.6%
Fiber2.7%
All Other23.9%

2003 2008Jun Jun Jun Jun Dec Jun Dec Jun Dec Jun
ADSL 4,395,033 6,429,938 10,759,495 14,442,823 17,370,508 20,151,612 22,768,119 24,961,878 26,475,392 26,949,947 SDSL and Traditional Wireline 223,599 250,372 393,049 159,489 129,444 112,017 117,708 117,522 99,579 112,689 SDSL - - - 153,978 122,220 102,605 105,012 105,029 82,284 80,971 Traditional Wireline - - - 5,511 7,224 9,412 12,696 12,493 17,295 31,718 Cable Modem 9,157,285 13,660,541 18,525,265 23,578,060 25,714,461 28,387,732 31,118,079 33,336,493 35,341,445 36,900,880 Fiber 3 6,120 16,132 22,719 83,293 213,479 444,147 763,987 1,153,058 1,682,639 2,138,584 Satellite and Wireless 202,251 288,786 387,563 428,367 532,391 1,840,202 3,571,381 6,598,757 10,379,504 12,982,393 Satellite - - - 265,017 320,142 382,047 455,936 530,357 626,466 705,126 Fixed Wireless - - - 160,775 203,179 301,435 423,524 523,180 644,012 741,230 Mobile Wireless - - - 2,574 9,071 1,156,720 2,691,921 5,545,220 9,109,026 11,536,037 Power Line and Other - - - 4,447 4,550 5,093 4,711 5,347 5,159 5,082
Total Lines 13,984,287 20,645,769 30,088,091 38,696,480 43,964,834 50,940,803 58,343,985 66,173,055 73,983,718 79,089,575
Small business lines were included in totals through December 2004.
Residential High-Speed Lines
Chart 6
For data through December 2004, only those providers with at least 250 lines per state were required to file.
200720052004
Some historical data have been revised back through December 2005. See additional notes following Chart 10.
Residential High-Speed Lines by Technology as of June 30, 2008
Table 3Residential High-Speed Lines 1
(Over 200 kbps in at least one direction)
Chart 5
Technology 2 2002 2006
010,000,00020,000,00030,000,00040,000,00050,000,00060,000,00070,000,00080,000,00090,000,000
Jun2000
Jun2001
Jun2002
Jun2003
Jun2004
Jun2005
Jun2006
Jun2007
Jun2008
SDSL and Traditional Wireline
0.1%
ADSL34.1%
Fiber2.7%
Cable Modem46.7%
All Other16.4%

2003 2008
ADSL 1,580,575 2,071,779 3,174,022 11,731,303 14,242,291 16,415,844 18,878,492 21,106,148 22,555,534 23,315,454 SDSL and Traditional Wireline 223,599 250,372 393,049 151,979 125,116 111,935 117,652 116,966 99,551 112,667 SDSL - - - 149,862 122,220 102,580 105,002 104,517 82,284 80,971 Traditional Wireline - - - 2,118 2,895 9,355 12,650 12,449 17,267 31,696 Cable Modem 6,809,170 11,920,207 17,505,907 22,324,471 25,533,423 28,159,416 30,770,517 32,916,212 35,035,299 36,600,250 Fiber 3 5,118 15,751 21,866 82,831 212,862 443,248 762,676 1,151,109 1,680,118 2,136,994 Satellite and Wireless 47,787 46,407 72,485 150,893 204,703 1,449,441 3,114,137 6,074,862 9,772,245 12,288,019 Satellite - - - 2,244 25,117 15,055 23,334 35,319 47,743 62,913 Fixed Wireless - - - 146,074 170,515 277,666 398,882 494,341 616,643 700,354 Mobile Wireless - - - 2,574 9,071 1,156,720 2,691,921 5,545,202 9,107,859 11,524,752 Power Line and Other - - - 3,916 4,481 5,093 4,711 5,347 5,159 5,082
Total Lines 8,666,249 14,304,515 21,167,329 34,445,394 40,322,876 46,584,977 53,648,185 61,370,644 69,147,906 74,458,466
Small business lines were included in totals through December 2004. Some historical data have been revised back through December 2005. See additional notes following Chart 10.
Jun Dec2006
JunJun Dec2005
Jun Jun DecJunTechnology 220042002
Residential Advanced Services Lines by Technology as of June 30, 2008
Jun
Table 4Residential Advanced Services Lines 1
(Over 200 kbps in both directions)
For data through December 2004, only those providers with at least 250 lines per state were required to file.
Chart 7Residential Advanced Services Lines
Chart 8
2007
0
10,000,000
20,000,000
30,000,000
40,000,000
50,000,000
60,000,000
70,000,000
80,000,000
Jun2000
Jun2001
Jun2002
Jun2003
Jun2004
Jun2005
Jun2006
Jun2007
Jun2008
Fiber2.9%
All Other16.5%
SDSL and Traditional Wireline
0.2%
ADSL31.3%
Cable Modem49.2%

ADSL 3,831,720 13,438,371 12,621,752 72,125 0 0 SDSL 0 261,179 13,119 * * 0 Traditional Wireline 149 561,427 60,249 8,712 8,095 26,478 Cable Modem 341,522 3,880,514 29,302,547 4,559,560 * * Fiber 1,851 139,442 903,130 1,260,683 15,857 25,365 Satellite 714,138 * * 0 0 0 Fixed Wireless 45,254 713,691 48,429 736 * * Mobile Wireless 39,465,094 * * * 0 0 Power Line and Other 0 * * 0 * 0
Total Lines 44,399,728 39,371,371 42,958,483 5,902,037 129,569 52,796
* Data withheld to maintain firm confidentiality. See notes following Chart 10.
Greater than 200 kbps and less than 2.5 mbps in the
faster direction
Greater than or equal to 2.5 mbps and less than 10 mbps in the faster
direction
Chart 9Lines by Information Transfer Rates in the Faster Directions as of June 30, 2008
(Includes only lines exceeding 200 kbps in both directions)
Greater than or equal to
100 mbps in the faster direction
Greater than or equal to
10 mbps and less than 25 mbps in the
faster direction
Greater than or equal to
25 mbps and less than
100 mbps in the faster direction
Table 5High-Speed Lines by Information Transfer Rates 1
As of June 30, 2008
Exceeding 200 kbps in both directions, and:
Technology 2Exceeding 200 kbps in
only one direction
44.5%
6.9%
48.6%
> 200 kbps, < 2.5 mbps≥ 2.5 mbps, < 10 mbps≥ 10 mbps
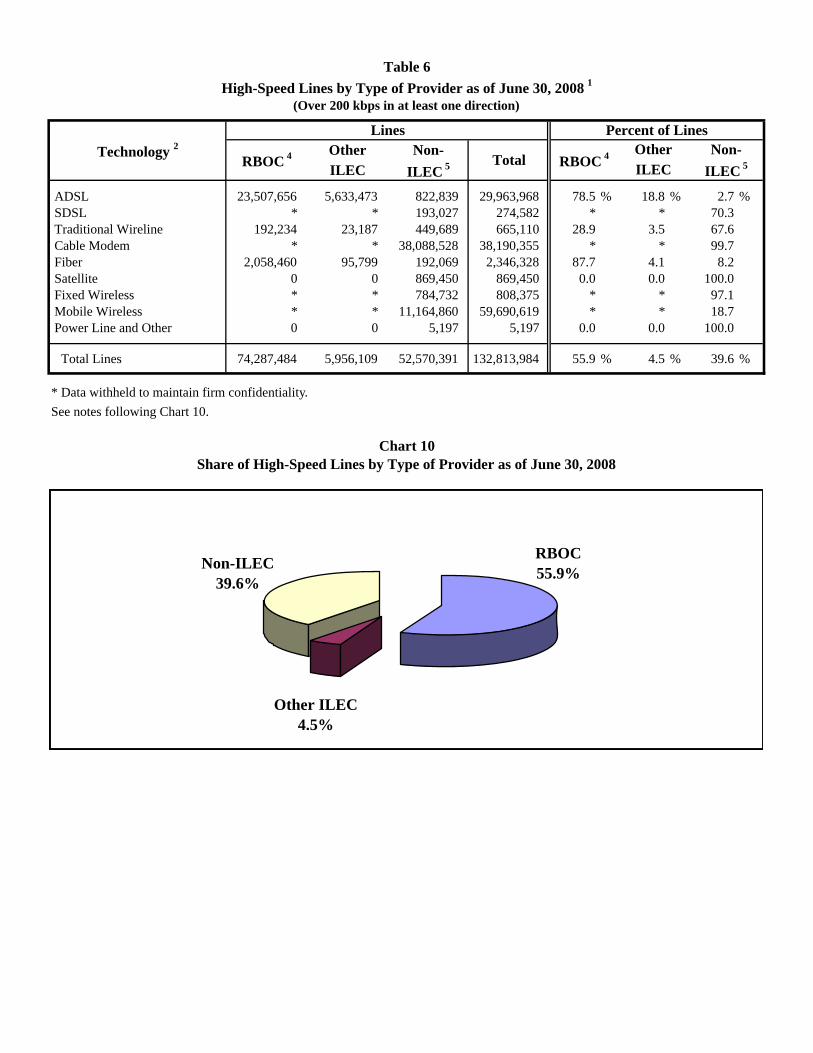
Other Non-ILEC ILEC 5
ADSL 23,507,656 5,633,473 822,839 29,963,968 78.5 % 18.8 % 2.7 % SDSL * * 193,027 274,582 * * 70.3 Traditional Wireline 192,234 23,187 449,689 665,110 28.9 3.5 67.6 Cable Modem * * 38,088,528 38,190,355 * * 99.7 Fiber 2,058,460 95,799 192,069 2,346,328 87.7 4.1 8.2 Satellite 0 0 869,450 869,450 0.0 0.0 100.0 Fixed Wireless * * 784,732 808,375 * * 97.1 Mobile Wireless * * 11,164,860 59,690,619 * * 18.7 Power Line and Other 0 0 5,197 5,197 0.0 0.0 100.0
Total Lines 74,287,484 5,956,109 52,570,391 132,813,984 55.9 % 4.5 % 39.6 %
* Data withheld to maintain firm confidentiality.See notes following Chart 10.
Chart 10Share of High-Speed Lines by Type of Provider as of June 30, 2008
RBOC 4 Total RBOC 4 OtherTechnology 2 Non-
Table 6High-Speed Lines by Type of Provider as of June 30, 2008 1
(Over 200 kbps in at least one direction)
ILEC ILEC 5
Lines Percent of Lines
Non-ILEC39.6%
RBOC55.9%
Other ILEC4.5%

4 RBOC lines include lines owned by AT&T, Qwest and Verizon, and their affiliates.5 High-speed lines reported by non-ILEC affiliates of RBOCs are reported in the column for RBOC lines and are excluded from the column for non-ILEC lines. Lines reported by non-ILEC affiliates of ILECs other than the RBOCs are reported in the column for non-ILEC lines.
Notes for Tables 1 - 6 and Charts 1 - 10.
Advanced services lines, residential high-speed lines, and residential advanced services lines are estimated based on data reported on FCC Form 477. Therefore, figures may not add to totals due to rounding.
1 In this report, high-speed lines are connections to end-user locations that deliver services at speeds exceeding 200 kbps in at least one direction. Advanced services lines, which are a subset of high-speed lines, are connections that deliver services at speeds exceeding 200 kbps in both directions. In Tables 2 and 4, we enumerate those reported high-speed lines that also qualify as advanced services lines. More detailed information about connection speeds is presented in Table 5. Line counts presented in this report are not adjusted for the number of persons at a single end-user location who have access to, or who use, the Internet-access services that are delivered over the high-speed connection to that location.
2 The mutually exclusive types of technology are, respectively: Asymmetric digital subscriber line (ADSL) technologies, which provide speeds in one direction greater than speeds in the other direction; symmetric digital subscriber line (SDSL) technologies; traditional wireline technologies when used to provide equivalent Internet access functionality, including Ethernet service if delivered to the subscriber's location over copper (as opposed to optical fiber) plant; cable modem, including the typical hybrid fiber-coax (HFC) architecture of upgraded cable TV systems; optical fiber to the subscriber's premises (e.g., Fiber-to-the-Home, or FTTH); satellite and fixed and mobile terrestrial wireless systems, which use radio spectrum to communicate with a radio transmitter; electric power line; and other. 3 Fiber lines included electric power line through December 2004.
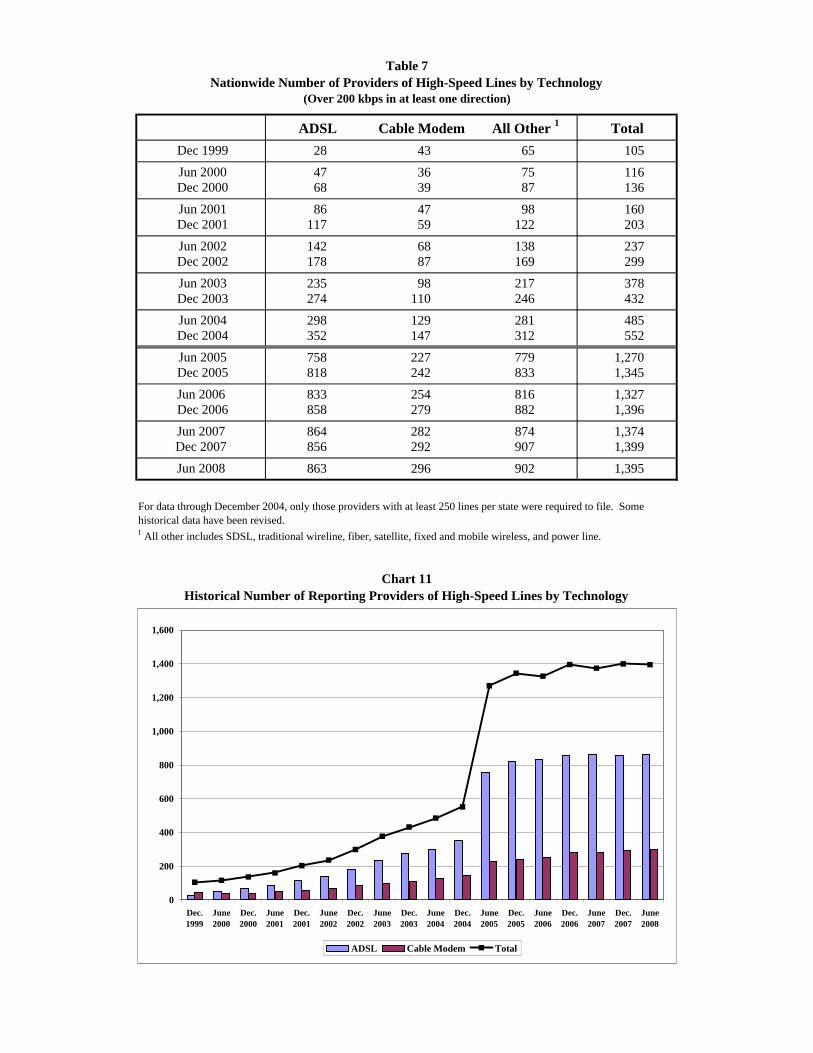
ADSL Cable Modem Total Dec 1999 28 43 65 105 Jun 2000 47 36 75 116 Dec 2000 68 39 87 136 Jun 2001 86 47 98 160 Dec 2001 117 59 122 203 Jun 2002 142 68 138 237 Dec 2002 178 87 169 299 Jun 2003 235 98 217 378 Dec 2003 274 110 246 432 Jun 2004 298 129 281 485 Dec 2004 352 147 312 552 Jun 2005 758 227 779 1,270 Dec 2005 818 242 833 1,345 Jun 2006 833 254 816 1,327 Dec 2006 858 279 882 1,396 Jun 2007 864 282 874 1,374 Dec 2007 856 292 907 1,399 Jun 2008 863 296 902 1,395
Table 7Nationwide Number of Providers of High-Speed Lines by Technology
(Over 200 kbps in at least one direction)
All Other 1
1 All other includes SDSL, traditional wireline, fiber, satellite, fixed and mobile wireless, and power line.
Chart 11Historical Number of Reporting Providers of High-Speed Lines by Technology
For data through December 2004, only those providers with at least 250 lines per state were required to file. Some historical data have been revised.
0
200
400
600
800
1,000
1,200
1,400
1,600
Dec.1999
June2000
Dec.2000
June2001
Dec.2001
June2002
Dec.2002
June2003
Dec.2003
June2004
Dec.2004
June2005
Dec.2005
June2006
Dec.2006
June2007
Dec.2007
June2008
ADSL Cable Modem Total

Traditional Cable Fixed Mobile Power Line TotalWireline Modem Wireless Wireless and Other (Unduplicated)
Alabama 32 9 21 19 11 * 5 5 0 73Alaska 9 6 5 * * * 6 * 0 18American Samoa * * 0 0 0 0 * 0 0 * Arizona 24 7 17 10 13 * 12 5 0 57Arkansas 22 8 12 11 6 * * 4 0 49California 26 16 36 16 16 * 23 4 0 84Colorado 30 12 21 13 13 * 22 8 0 73Connecticut 8 8 14 7 8 * 0 * 0 31Delaware 11 7 19 * * * 0 * 0 32District of Columbia 12 8 18 * 6 * * * 0 30Florida 28 17 42 16 22 * 13 5 * 82Georgia 40 14 29 27 29 * 7 4 0 89Guam * 0 * * 0 0 0 0 0 * Hawaii * * 6 * 5 * * * 0 14Idaho 24 9 14 7 14 * 16 5 0 53Illinois 58 20 38 17 15 * 37 5 * 121Indiana 41 13 29 13 21 * 27 * * 88Iowa 130 39 26 35 31 * 57 6 0 192Kansas 38 15 18 26 19 * 25 4 0 86Kentucky 31 10 17 19 11 * 12 5 0 75Louisiana 22 9 20 10 10 * 5 5 0 53Maine 14 10 11 5 8 * 0 * 0 30Maryland 16 10 18 12 8 * * * 0 44Massachusetts 16 10 22 6 7 * 4 * 0 43Michigan 42 13 27 12 15 * 17 5 * 78Minnesota 69 27 24 13 29 * 14 4 0 101Mississippi 20 6 19 11 8 * 4 5 0 53Missouri 44 19 21 18 13 * 26 5 * 92Montana 18 8 10 4 7 * 11 4 0 38Nebraska 34 14 11 16 6 * 22 4 0 68Nevada 17 10 16 4 7 * 7 5 0 41New Hampshire 15 8 15 6 7 * * * 0 37New Jersey 20 14 34 8 10 * * * 0 51New Mexico 23 7 11 7 6 * 8 5 0 44New York 43 17 32 14 15 * 9 5 0 80North Carolina 31 16 27 14 12 * 7 5 0 70North Dakota 23 13 10 7 10 * 12 * 0 40Northern Mariana Islands * 0 * * * 0 * 0 0 * Ohio 43 17 26 19 20 * 19 4 * 86Oklahoma 39 8 22 10 9 * 17 5 0 77Oregon 41 10 19 11 15 * 13 4 0 68Pennsylvania 43 18 37 20 20 * 11 4 0 85Puerto Rico * 0 7 * 4 * 4 * 0 15Rhode Island 10 7 13 * 5 * 0 * 0 25South Carolina 24 9 19 16 11 * * 5 0 47South Dakota 24 9 10 7 11 * 11 * 0 44Tennessee 29 13 21 13 12 * 7 6 0 72Texas 66 24 37 25 27 * 50 7 0 137Utah 16 11 14 4 8 * 10 6 0 44Vermont 11 4 11 * 4 * * * 0 27Virgin Islands * * * 0 0 * 0 * 0 5Virginia 27 12 30 13 15 * 12 4 * 68Washington 30 10 25 16 20 * 21 6 * 77West Virginia 13 4 11 7 * * * * 0 32Wisconsin 52 14 18 12 14 * 19 5 * 83Wyoming 13 7 8 * 6 * 7 4 0 32
Nationwide 863 238 259 296 308 4 505 24 6 1,395
Table 8Providers of High-Speed Lines by Technology as of June 30, 2008
(Over 200 kbps in at least one direction)
ADSL SDSL Fiber SatelliteState
* Indicates one to three providers.

Traditional Cable Fixed Mobile Power LineWireline Modem Wireless Wireless and Other
Alabama 430,874 6,108 6,173 417,330 3,187 * 907 * 0 1,524,605Alaska 72,032 * 493 * * * 10,638 * 0 182,545American Samoa * * 0 0 0 0 * 0 0 *Arizona 454,036 1,375 19,947 991,729 3,201 * 18,315 * 0 2,860,516Arkansas 266,923 281 2,353 235,655 1,405 * * * 0 772,093California 4,754,973 29,765 107,657 3,798,686 249,526 * 71,008 * 0 18,619,383Colorado 574,903 2,298 20,163 626,069 3,191 * 30,345 * 0 2,344,512Connecticut * 2,936 4,856 575,644 2,642 * 0 * 0 2,002,300Delaware * 197 3,080 * * * 0 * 0 481,371District of Columbia * 1,836 4,010 * 1,276 * * * 0 471,514Florida 2,045,146 7,156 53,096 2,631,022 217,217 * 41,033 * * 8,157,096Georgia 1,361,221 5,887 28,238 903,797 8,262 * 386 * 0 3,996,695Guam * 0 * * 0 0 0 0 0 *Hawaii * * 816 * 486 * * * 0 643,085Idaho 153,697 294 1,962 126,634 1,133 * 50,692 * 0 690,599Illinois 1,418,545 10,850 26,306 1,624,647 7,302 * 31,331 * * 5,537,923Indiana 651,097 3,535 9,741 455,929 48,639 * 12,475 * * 2,479,608Iowa 321,784 3,792 2,679 308,500 8,359 * 18,516 * 0 1,091,069Kansas 240,921 4,982 5,906 380,063 5,065 * 16,856 * 0 1,063,920Kentucky 384,920 4,974 4,873 481,916 3,421 * 3,371 * 0 1,298,038Louisiana 353,678 1,240 4,760 480,720 19,227 * 2,601 * 0 1,552,888Maine 120,357 4,038 4,334 196,848 3,368 * 0 * 0 428,904Maryland 495,132 8,024 17,209 871,044 * * * * 0 2,738,746Massachusetts * 5,445 16,700 1,158,976 * * 1,082 * 0 3,392,831Michigan 748,563 3,907 15,118 1,306,725 3,130 * 9,470 * * 3,844,955Minnesota 528,792 18,731 10,539 621,781 10,596 * 30,333 * 0 2,152,875Mississippi 219,564 224 2,611 188,062 834 * 168 * 0 584,044Missouri 712,189 3,978 11,638 517,207 4,154 * 8,835 * * 2,076,382Montana 108,083 3,276 931 90,467 701 * 10,107 * 0 476,845Nebraska 143,036 3,976 1,053 262,073 639 * 14,927 * 0 702,180Nevada 224,688 3,825 7,730 * 1,314 * 17,944 * 0 1,268,860New Hampshire 96,781 2,097 4,869 250,233 16,058 * * * 0 681,535New Jersey 699,670 4,250 24,169 1,586,469 * * * * 0 5,338,219New Mexico 217,072 278 2,402 137,463 1,104 * 3,360 * 0 719,761New York 1,168,816 18,900 35,880 3,548,486 * * 7,603 * 0 8,910,527North Carolina 870,296 2,814 21,060 1,266,151 5,432 * * * 0 3,832,927North Dakota 60,038 2,145 372 82,853 9,297 * 5,166 * 0 321,663Northern Mariana Isl. * 0 * * * 0 * 0 0 *Ohio 1,034,335 4,302 17,632 1,626,534 8,951 * 24,317 * * 5,066,325Oklahoma 334,105 886 3,748 381,910 3,235 * 5,080 * 0 1,077,215Oregon 360,993 9,889 5,656 554,284 * * 28,160 * 0 1,716,959Pennsylvania 1,208,597 15,479 23,147 1,491,572 * * 5,134 * 0 5,682,008Puerto Rico * 0 4,421 * 313 * 4,860 * 0 582,155Rhode Island * 942 1,667 * * * 0 * 0 527,728South Carolina 386,274 392 8,990 517,385 12,993 * * * 0 1,779,117South Dakota 53,343 3,993 261 115,048 7,332 * 6,199 * 0 362,263Tennessee 534,652 710 12,046 714,610 24,565 * 7,888 * 0 2,767,503Texas 2,475,277 12,482 48,548 2,214,161 230,859 * 98,670 * 0 9,110,055Utah 284,487 7,261 6,345 212,474 2,770 * 27,850 * 0 1,108,549Vermont 72,581 * 2,348 * 416 * * * 0 257,065Virgin Islands * * * 0 0 * 0 * 0 19,441Virginia 560,616 3,589 24,166 941,193 * * 15,539 * * 3,584,485Washington 600,239 9,179 12,555 943,846 33,542 * 86,546 * * 3,312,811West Virginia 146,964 * 3,347 167,237 * * * * 0 371,760Wisconsin 556,171 15,062 6,093 711,209 4,193 * 12,285 * * 1,931,916Wyoming 55,265 1,769 300 * 501 * 3,870 * 0 288,052
Nationwide 29,963,968 274,582 665,110 38,190,355 2,346,328 869,450 808,375 59,690,619 5,197 132,813,984
SDSLADSL Fiber Satellite TotalState
* Data withheld to maintain firm confidentiality.
Table 9High-Speed Lines by Technology as of June 30, 2008
(Over 200 kbps in at least one direction)
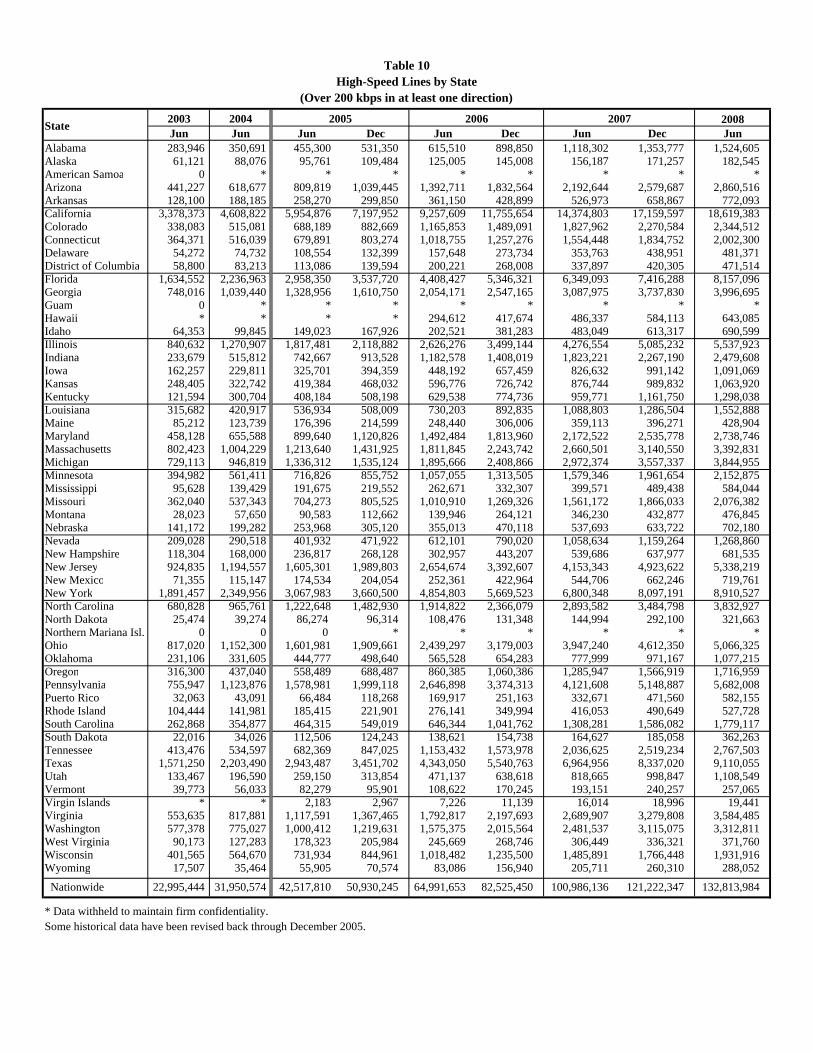
2008Jun Jun Jun Dec Jun Dec Jun Dec Jun
Alabama 283,946 350,691 455,300 531,350 615,510 898,850 1,118,302 1,353,777 1,524,605Alaska 61,121 88,076 95,761 109,484 125,005 145,008 156,187 171,257 182,545American Samoa 0 * * * * * * * *Arizona 441,227 618,677 809,819 1,039,445 1,392,711 1,832,564 2,192,644 2,579,687 2,860,516Arkansas 128,100 188,185 258,270 299,850 361,150 428,899 526,973 658,867 772,093California 3,378,373 4,608,822 5,954,876 7,197,952 9,257,609 11,755,654 14,374,803 17,159,597 18,619,383Colorado 338,083 515,081 688,189 882,669 1,165,853 1,489,091 1,827,962 2,270,584 2,344,512Connecticut 364,371 516,039 679,891 803,274 1,018,755 1,257,276 1,554,448 1,834,752 2,002,300Delaware 54,272 74,732 108,554 132,399 157,648 273,734 353,763 438,951 481,371District of Columbia 58,800 83,213 113,086 139,594 200,221 268,008 337,897 420,305 471,514Florida 1,634,552 2,236,963 2,958,350 3,537,720 4,408,427 5,346,321 6,349,093 7,416,288 8,157,096Georgia 748,016 1,039,440 1,328,956 1,610,750 2,054,171 2,547,165 3,087,975 3,737,830 3,996,695Guam 0 * * * * * * * *Hawaii * * * * 294,612 417,674 486,337 584,113 643,085Idaho 64,353 99,845 149,023 167,926 202,521 381,283 483,049 613,317 690,599Illinois 840,632 1,270,907 1,817,481 2,118,882 2,626,276 3,499,144 4,276,554 5,085,232 5,537,923Indiana 233,679 515,812 742,667 913,528 1,182,578 1,408,019 1,823,221 2,267,190 2,479,608Iowa 162,257 229,811 325,701 394,359 448,192 657,459 826,632 991,142 1,091,069Kansas 248,405 322,742 419,384 468,032 596,776 726,742 876,744 989,832 1,063,920Kentucky 121,594 300,704 408,184 508,198 629,538 774,736 959,771 1,161,750 1,298,038Louisiana 315,682 420,917 536,934 508,009 730,203 892,835 1,088,803 1,286,504 1,552,888Maine 85,212 123,739 176,396 214,599 248,440 306,006 359,113 396,271 428,904Maryland 458,128 655,588 899,640 1,120,826 1,492,484 1,813,960 2,172,522 2,535,778 2,738,746Massachusetts 802,423 1,004,229 1,213,640 1,431,925 1,811,845 2,243,742 2,660,501 3,140,550 3,392,831Michigan 729,113 946,819 1,336,312 1,535,124 1,895,666 2,408,866 2,972,374 3,557,337 3,844,955Minnesota 394,982 561,411 716,826 855,752 1,057,055 1,313,505 1,579,346 1,961,654 2,152,875Mississippi 95,628 139,429 191,675 219,552 262,671 332,307 399,571 489,438 584,044Missouri 362,040 537,343 704,273 805,525 1,010,910 1,269,326 1,561,172 1,866,033 2,076,382Montana 28,023 57,650 90,583 112,662 139,946 264,121 346,230 432,877 476,845Nebraska 141,172 199,282 253,968 305,120 355,013 470,118 537,693 633,722 702,180Nevada 209,028 290,518 401,932 471,922 612,101 790,020 1,058,634 1,159,264 1,268,860New Hampshire 118,304 168,000 236,817 268,128 302,957 443,207 539,686 637,977 681,535New Jersey 924,835 1,194,557 1,605,301 1,989,803 2,654,674 3,392,607 4,153,343 4,923,622 5,338,219New Mexico 71,355 115,147 174,534 204,054 252,361 422,964 544,706 662,246 719,761New York 1,891,457 2,349,956 3,067,983 3,660,500 4,854,803 5,669,523 6,800,348 8,097,191 8,910,527North Carolina 680,828 965,761 1,222,648 1,482,930 1,914,822 2,366,079 2,893,582 3,484,798 3,832,927North Dakota 25,474 39,274 86,274 96,314 108,476 131,348 144,994 292,100 321,663Northern Mariana Isl. 0 0 0 * * * * * *Ohio 817,020 1,152,300 1,601,981 1,909,661 2,439,297 3,179,003 3,947,240 4,612,350 5,066,325Oklahoma 231,106 331,605 444,777 498,640 565,528 654,283 777,999 971,167 1,077,215Oregon 316,300 437,040 558,489 688,487 860,385 1,060,386 1,285,947 1,566,919 1,716,959Pennsylvania 755,947 1,123,876 1,578,981 1,999,118 2,646,898 3,374,313 4,121,608 5,148,887 5,682,008Puerto Rico 32,063 43,091 66,484 118,268 169,917 251,163 332,671 471,560 582,155Rhode Island 104,444 141,981 185,415 221,901 276,141 349,994 416,053 490,649 527,728South Carolina 262,868 354,877 464,315 549,019 646,344 1,041,762 1,308,281 1,586,082 1,779,117South Dakota 22,016 34,026 112,506 124,243 138,621 154,738 164,627 185,058 362,263Tennessee 413,476 534,597 682,369 847,025 1,153,432 1,573,978 2,036,625 2,519,234 2,767,503Texas 1,571,250 2,203,490 2,943,487 3,451,702 4,343,050 5,540,763 6,964,956 8,337,020 9,110,055Utah 133,467 196,590 259,150 313,854 471,137 638,618 818,665 998,847 1,108,549Vermont 39,773 56,033 82,279 95,901 108,622 170,245 193,151 240,257 257,065Virgin Islands * * 2,183 2,967 7,226 11,139 16,014 18,996 19,441Virginia 553,635 817,881 1,117,591 1,367,465 1,792,817 2,197,693 2,689,907 3,279,808 3,584,485Washington 577,378 775,027 1,000,412 1,219,631 1,575,375 2,015,564 2,481,537 3,115,075 3,312,811West Virginia 90,173 127,283 178,323 205,984 245,669 268,746 306,449 336,321 371,760Wisconsin 401,565 564,670 731,934 844,961 1,018,482 1,235,500 1,485,891 1,766,448 1,931,916Wyoming 17,507 35,464 55,905 70,574 83,086 156,940 205,711 260,310 288,052
Nationwide 22,995,444 31,950,574 42,517,810 50,930,245 64,991,653 82,525,450 100,986,136 121,222,347 132,813,984
Some historical data have been revised back through December 2005.
2006 2007
Table 10High-Speed Lines by State
(Over 200 kbps in at least one direction)
* Data withheld to maintain firm confidentiality.
2003 2004State 2005

2008Jun Jun Jun Dec Jun Dec Jun Dec Jun
Alabama 70,639 112,059 177,196 220,657 268,970 314,640 356,830 402,603 430,874Alaska 14,013 20,686 38,530 43,249 53,687 60,055 63,708 67,938 72,032American Samoa 0 0 * * * * * * *Arizona 77,368 108,735 152,937 207,727 276,261 365,228 405,724 436,857 454,036Arkansas 44,801 80,981 127,445 149,878 180,883 200,129 226,842 248,908 266,923California 1,715,998 2,342,186 3,078,824 3,592,220 4,001,529 4,342,556 4,626,442 4,780,051 4,754,973Colorado 126,189 201,523 268,114 333,313 404,989 473,148 529,504 573,387 574,903Connecticut 124,742 204,034 * * * * * * *Delaware * 10,572 * * * * * * *District of Columbia 39,471 44,231 * * * * * * *Florida 644,621 928,402 1,284,507 1,509,104 1,722,888 1,873,271 1,960,025 2,046,084 2,045,146Georgia 368,372 535,088 757,720 890,128 1,008,705 1,126,082 1,218,885 1,307,237 1,361,221Guam 0 * * * * * * * *Hawaii * * * * * * * * *Idaho 19,382 35,166 62,691 81,520 97,662 113,001 129,188 142,440 153,697Illinois 363,733 588,906 847,522 979,709 1,094,088 1,211,763 1,300,003 1,382,195 1,418,545Indiana 85,968 179,942 304,800 379,465 443,473 515,054 583,797 635,507 651,097Iowa 39,386 65,580 118,777 150,890 189,178 233,396 270,637 298,322 321,784Kansas 50,839 88,246 136,402 159,996 179,430 202,751 224,843 235,919 240,921Kentucky 75,316 119,709 180,324 213,131 250,715 303,296 340,350 367,452 384,920Louisiana 100,919 136,406 190,603 207,488 235,750 270,811 306,283 333,076 353,678Maine 11,052 31,577 52,032 72,709 89,964 104,780 115,261 117,570 120,357Maryland 126,873 192,139 305,677 379,316 450,019 489,553 512,156 513,529 495,132Massachusetts 207,344 253,576 * * * * * * *Michigan 135,360 236,310 374,861 463,373 533,835 606,616 689,536 732,950 748,563Minnesota 115,244 159,137 227,988 276,439 330,736 394,686 449,452 496,317 528,792Mississippi 33,650 52,892 88,252 105,874 128,585 154,179 180,281 202,262 219,564Missouri 138,046 233,916 341,618 398,671 468,334 545,679 618,302 682,572 712,189Montana 13,119 28,238 46,786 57,300 70,471 82,876 95,790 102,231 108,083Nebraska 18,285 35,180 66,268 81,188 95,404 112,032 124,126 135,305 143,036Nevada 47,934 74,879 116,395 139,938 168,086 190,202 207,051 220,409 224,688New Hampshire 17,823 31,843 54,233 71,689 85,247 93,589 98,283 99,602 96,781New Jersey 211,540 301,789 443,808 540,382 638,293 703,950 734,700 734,903 699,670New Mexico 26,948 51,375 82,062 105,210 130,998 156,620 179,856 200,497 217,072New York 438,241 536,980 736,769 861,452 1,002,972 1,103,960 1,181,851 1,184,011 1,168,816North Carolina 161,642 264,248 412,991 488,533 561,102 648,001 724,936 820,334 870,296North Dakota 11,593 19,412 26,841 32,000 38,729 46,346 51,096 55,635 60,038Northern Mariana Isl. 0 0 0 * * * * * *Ohio 243,689 369,386 555,749 663,011 752,633 858,846 950,969 1,024,412 1,034,335Oklahoma 78,248 129,996 189,496 222,048 246,899 277,282 301,523 323,685 334,105Oregon 95,654 142,483 197,927 244,694 280,286 311,604 338,765 355,563 360,993Pennsylvania 230,322 346,720 541,274 692,079 871,164 1,012,845 1,125,794 1,191,348 1,208,597Puerto Rico * * * * * * * * *Rhode Island * * * * * * * * *South Carolina 52,667 98,583 154,666 205,529 242,548 284,892 322,858 359,439 386,274South Dakota 8,637 15,230 20,632 26,168 32,763 39,684 45,772 48,386 53,343Tennessee 92,777 147,922 237,180 293,915 348,344 396,928 446,551 499,164 534,652Texas 597,447 930,997 1,300,681 1,513,639 1,732,716 1,996,752 2,293,905 2,463,911 2,475,277Utah 65,648 95,656 129,607 160,313 189,240 222,307 249,683 269,785 284,487Vermont 15,072 22,519 35,281 43,934 51,382 61,441 68,041 72,006 72,581Virgin Islands * * * * * * * * *Virginia 114,797 196,568 308,947 384,243 446,448 505,285 547,941 568,284 560,616Washington 225,377 300,804 363,796 427,451 491,409 533,668 569,397 592,133 600,239West Virginia * * 53,292 69,390 86,507 104,637 123,645 137,948 146,964Wisconsin 84,100 159,167 243,370 298,111 359,530 417,510 483,750 528,196 556,171Wyoming 5,503 13,510 23,769 33,030 38,541 44,347 49,933 52,602 55,265
Nationwide 7,675,114 11,398,199 16,316,309 19,515,483 22,583,548 25,412,509 27,792,800 29,449,166 29,963,968
Some historical data have been revised back through June 2006.
2006 2007
Table 11ADSL High-Speed Lines by State
(Over 200 kbps in at least one direction)
* Data withheld to maintain firm confidentiality.
2003 2004State
2005

2008Jun Jun Jun Dec Jun Dec Jun Dec Jun
Alabama 181,338 206,208 257,225 285,177 310,548 342,340 374,029 398,840 417,330Alaska * * * * * * * * *American Samoa 0 0 0 0 0 0 0 0 0Arizona 319,272 457,869 583,897 679,284 761,419 838,455 850,307 896,746 991,729Arkansas * 95,528 117,953 137,105 148,940 183,503 205,349 214,028 235,655California 1,395,435 1,929,080 2,467,232 2,734,659 2,956,932 3,155,718 3,410,983 3,603,105 3,798,686Colorado 181,766 280,909 383,154 433,184 476,463 523,159 560,557 604,247 626,069Connecticut 227,658 299,176 372,346 403,723 441,092 454,348 513,211 550,019 575,644Delaware * * * * * * * * *District of Columbia * * * * * * * * *Florida 867,513 1,171,641 1,559,592 1,757,875 1,939,409 2,178,484 2,344,445 2,543,384 2,631,022Georgia 289,922 407,038 522,800 583,884 649,583 742,552 802,047 862,212 903,797Guam 0 0 0 0 0 0 0 * *Hawaii * * * * * * * * *Idaho * * 78,185 73,528 75,185 108,595 116,273 123,067 126,634Illinois 383,069 589,025 841,737 955,518 1,042,272 1,332,023 1,465,869 1,570,281 1,624,647Indiana 122,338 304,866 397,481 445,420 490,020 370,200 410,438 439,417 455,929Iowa 111,748 151,299 186,821 219,803 225,190 234,266 267,712 287,011 308,500Kansas 181,437 209,233 258,856 272,660 316,866 320,638 351,371 368,988 380,063Kentucky 23,672 154,567 217,302 269,274 306,487 333,339 383,593 434,900 481,916Louisiana 189,920 257,405 328,675 254,819 378,613 419,735 446,485 485,349 480,720Maine * * 116,203 132,075 145,831 152,291 169,458 179,398 196,848Maryland 306,442 433,754 546,576 592,283 637,405 781,120 829,473 864,763 871,044Massachusetts 564,961 704,956 826,351 885,578 954,812 1,044,333 1,088,170 1,135,807 1,158,976Michigan 543,336 656,263 891,842 953,786 1,019,338 1,103,040 1,197,105 1,265,384 1,306,725Minnesota 255,988 358,477 440,726 493,783 517,018 541,116 570,874 607,772 621,781Mississippi 50,234 72,271 95,805 104,363 114,140 135,965 151,539 166,092 188,062Missouri 191,658 266,493 323,270 353,331 400,808 444,118 473,449 497,878 517,207Montana * 22,856 35,625 45,442 54,056 65,238 74,246 83,006 90,467Nebraska 111,903 142,555 177,074 200,600 218,335 239,465 238,019 251,699 262,073Nevada * * * * * * * * *New Hampshire 95,612 129,024 176,033 188,212 201,873 209,781 229,855 239,605 250,233New Jersey 690,620 862,834 1,107,751 1,205,182 1,312,433 1,385,953 1,473,709 1,538,490 1,586,469New Mexico 38,004 56,369 78,035 89,003 100,157 108,906 117,336 126,692 137,463New York 1,401,322 1,752,189 2,216,153 2,444,565 2,765,476 2,967,028 3,164,178 3,341,913 3,548,486North Carolina 454,272 623,414 762,203 861,990 963,651 1,040,513 1,134,075 1,195,757 1,266,151North Dakota 10,066 14,428 50,781 54,772 57,722 70,878 76,353 79,755 82,853Northern Mariana Isl. 0 0 0 0 0 0 0 * *Ohio 508,458 709,145 961,119 1,064,948 1,184,924 1,303,470 1,405,899 1,498,317 1,626,534Oklahoma * * 233,993 261,585 284,184 312,500 347,813 372,867 381,910Oregon 197,794 262,513 335,847 375,351 407,195 452,517 489,902 531,258 554,284Pennsylvania 482,471 724,101 962,149 1,074,912 1,164,080 1,255,720 1,271,157 1,398,950 1,491,572Puerto Rico * * * * * * * * *Rhode Island * * * * * * * * *South Carolina 185,083 228,648 290,233 326,370 368,338 417,584 459,110 496,188 517,385South Dakota 9,156 12,114 83,667 88,812 92,860 100,155 100,903 111,009 115,048Tennessee 277,579 340,883 422,063 460,235 506,143 601,889 662,520 702,891 714,610Texas 888,595 1,162,797 1,467,804 1,617,513 1,692,433 1,944,069 2,081,963 2,183,062 2,214,161Utah * * * * * * * * 212,474 Vermont * * * * * * * * *Virgin Islands 0 0 0 0 0 0 0 0 0Virginia 404,616 579,580 748,694 817,100 892,955 877,235 906,252 921,438 941,193Washington 313,915 426,487 585,125 660,159 725,832 806,126 862,049 909,108 943,846West Virginia 73,263 97,463 117,538 128,133 145,450 144,569 155,867 158,921 167,237Wisconsin 287,519 371,106 446,840 497,262 542,881 591,981 636,675 675,737 711,209Wyoming * * * * * * * * *
Nationwide 13,684,225 18,592,636 24,017,442 26,558,206 29,173,449 31,981,705 34,404,368 36,506,972 38,190,355
Some historical data have been revised. * Data withheld to maintain firm confidentiality.
2006State 2003 20052004
Table 12Coaxial Cable High-Speed Lines by State(Over 200 kbps in at least one direction)
2007

State Residential Business Total
Alabama 909,945 614,660 1,524,605Alaska 156,793 25,752 182,545American Samoa * * *Arizona 1,575,252 1,285,264 2,860,516Arkansas 612,182 159,911 772,093California 10,406,479 8,212,904 18,619,383Colorado 1,315,361 1,029,151 2,344,512Connecticut 1,135,798 866,502 2,002,300Delaware 240,153 241,218 481,371District of Columbia 191,505 280,009 471,514Florida 5,425,497 2,731,599 8,157,096Georgia 2,402,283 1,594,412 3,996,695Guam * * *Hawaii 378,477 264,608 643,085Idaho 343,184 347,415 690,599Illinois 3,471,815 2,066,108 5,537,923Indiana 1,274,862 1,204,746 2,479,608Iowa 632,294 458,775 1,091,069Kansas 721,808 342,112 1,063,920Kentucky 932,158 365,880 1,298,038Louisiana 1,111,304 441,584 1,552,888Maine 309,458 119,446 428,904Maryland 1,767,213 971,533 2,738,746Massachusetts 1,946,046 1,446,785 3,392,831Michigan 2,262,822 1,582,133 3,844,955Minnesota 1,288,882 863,993 2,152,875Mississippi 435,193 148,851 584,044Missouri 1,496,075 580,307 2,076,382Montana 198,534 278,311 476,845Nebraska 431,124 271,056 702,180Nevada 780,141 488,719 1,268,860New Hampshire 363,328 318,207 681,535New Jersey 2,716,982 2,621,237 5,338,219New Mexico 374,043 345,718 719,761New York 5,470,914 3,439,613 8,910,527North Carolina 2,280,220 1,552,707 3,832,927North Dakota 145,593 176,070 321,663Northern Mariana Islands * * *Ohio 2,838,688 2,227,637 5,066,325Oklahoma 880,666 196,549 1,077,215Oregon 1,081,837 635,122 1,716,959Pennsylvania 3,097,119 2,584,889 5,682,008Puerto Rico 501,072 81,083 582,155Rhode Island 297,643 230,085 527,728South Carolina 942,688 836,429 1,779,117South Dakota 170,380 191,883 362,263Tennessee 1,346,820 1,420,683 2,767,503Texas 6,198,779 2,911,276 9,110,055Utah 552,567 555,982 1,108,549Vermont 136,780 120,285 257,065Virgin Islands 17,576 1,865 19,441Virginia 1,900,624 1,683,861 3,584,485Washington 1,783,539 1,529,272 3,312,811West Virginia 314,072 57,688 371,760Wisconsin 1,384,836 547,080 1,931,916Wyoming 116,661 171,391 288,052
Nationwide 79,089,575 53,724,409 132,813,984
* Data withheld to maintain firm confidentiality.
Table 13High-Speed Lines by Type of End User as of June 30, 2008
(Over 200 kbps in at least one direction)

xDSL Availability Where Cable Modem Availability WhereState ILECs Offer Local Telephone Service Cable Systems Offer Cable TV Service
Alabama 77% 93%Alaska 75% *American Samoa * 0%Arizona 84% 99%Arkansas 77% 74%California 89% 99%Colorado 89% 96%Connecticut * 100%Delaware * *District of Columbia * *Florida 89% 98%Georgia 93% 90%Guam * *Hawaii * *Idaho 80% 99%Illinois 85% 97%Indiana 81% 91%Iowa 86% 90%Kansas 83% 91%Kentucky 88% 89%Louisiana 83% 97%Maine 71% 93%Maryland 75% 98%Massachusetts * 100%Michigan 73% 99%Minnesota 86% 96%Mississippi 76% 92%Missouri 80% 97%Montana 78% 88%Nebraska 86% 93%Nevada 87% *New Hampshire 62% 99%New Jersey 86% 100%New Mexico 85% 79%New York 79% 99%North Carolina 85% 95%North Dakota 89% 82%Northern Mariana Isl. * *Ohio 85% 98%Oklahoma 80% 92%Oregon 83% 95%Pennsylvania 84% 94%Puerto Rico * *Rhode Island * *South Carolina 84% 93%South Dakota 80% 81%Tennessee 83% 96%Texas 80% 96%Utah 89% 88%Vermont 71% *Virgin Islands * 0%Virginia 65% 97%Washington 83% 98%West Virginia 69% 85%Wisconsin 82% 96%Wyoming 81% *
Nationwide 83% 96%
* Data withheld to maintain firm confidentiality.xDSL includes both asymmetric and symmetric DSL. Each state-specific estimate is a weighted average of the availability percentages that ILECs or cable system operators report for the areas they serve. Reported xDSL availability is weighted by ILEC end-user switched access lines. Reported cable modem availability is weighted by cable TV subscribers. The weighted averages include ILECs or cable system operators that report no availability.
Table 14Percentage of Residential End-User Premises with Access to High-Speed Services as of June 30, 2008

Number ofProviders
Zero 22.2 % 20.6 % 16.1 % 12.0 % 9.0 % 6.8 % 5.7 % 4.6 % 2.0 % 1.0 % 0.7 % 0.4 % 0.1 % 0.2 % 0.0 %One 20.3 19.3 18.4 17.3 16.4 14.9 13.8 12.5 9.3 5.6 3.7 2.4 0.9 1.3 0.3Two 16.7 15.7 16.2 16.8 16.9 17.1 16.8 16.3 14.1 11.9 8.2 5.7 3.6 3.8 1.5Three 13.2 13.1 13.3 14.4 14.0 14.9 14.9 15.1 15.0 14.8 11.3 8.9 7.0 6.7 3.7Four 8.2 9.1 9.6 10.3 10.6 11.2 11.6 12.2 12.6 13.5 12.9 11.4 11.1 10.3 7.2Five 4.9 6.1 6.9 7.3 7.7 7.8 8.4 8.9 9.7 10.3 12.2 12.5 13.6 12.8 10.8Six 3.6 4.2 4.6 5.0 5.3 5.8 6.1 6.3 6.8 7.8 10.4 11.7 13.0 13.4 13.4Seven 2.8 3.2 3.2 3.9 4.0 4.2 4.4 4.6 5.3 5.7 8.7 10.0 11.6 11.2 12.7Eight 2.2 2.5 2.8 2.7 3.1 3.3 3.6 3.6 4.0 4.6 7.1 8.3 9.1 9.0 9.9Nine 1.9 2.0 2.4 2.2 2.5 2.6 2.8 3.1 3.8 4.0 5.8 6.7 7.4 7.4 7.4Ten or More 3.9 4.0 6.4 8.0 10.5 11.4 11.8 12.8 17.5 20.7 19.1 22.0 22.7 23.8 33.2
For data through December 2004, only those providers with at least 250 lines per state were required to file. Figures may not add up to 100% due to rounding.
1
Chart 12Percent of Zip Codes with High-Speed Providers
2008JunJun Jun DecDec
Table 15Percentage of Zip Codes with High-Speed Lines in Service
20052003Jun DecJun
2004Jun Dec
2001 2002Dec
2007Dec JunDec
2006Jun
0%
10%
20%
30%
40%
50%
60%
70%
80%
90%
100%
Jun 20
00
Jun 20
01
Jun 20
02
Jun 20
03
Jun 20
04
Jun 20
05
Jun 20
06
Jun 20
07
Jun 20
08
One or More Providers Four or More Providers

Technology
Zero One Two Three Four Five Six Seven Eight Nine Ten or More
ADSL 12.8 38.0 20.8 10.9 6.8 5.0 2.7 1.7 0.8 0.3 0.2 SDSL 61.3 20.0 7.3 5.1 3.5 1.7 0.7 0.2 0.1 0.0 0.0
Cable Modem 32.8 57.1 9.1 0.9 0.0 0.0 0.0 0.0 0.0 0.0 0.0 Fiber 62.3 19.5 10.3 5.1 1.9 0.6 0.2 0.0 0.0 0.0 0.0 Satellite 6.5 20.8 53.6 19.0 0.0 0.0 0.0 0.0 0.0 0.0 0.0 Fixed Wireless 71.8 21.1 5.6 1.2 0.3 0.0 0.0 0.0 0.0 0.0 0.0 Mobile Wireless 0.6 6.0 34.1 47.3 11.4 0.5 0.0 0.0 0.0 0.0 0.0 Power Line and/or Other 1 43.2 17.6 9.4 6.3 5.0 4.3 3.7 2.9 2.7 1.8 3.2
ADSL and/or Cable Modem 8.6 23.3 22.3 16.2 10.4 7.2 5.2 3.4 1.9 1.0 0.7
All Technologies 0.0 0.3 1.5 3.7 7.2 10.8 13.4 12.7 9.9 7.4 33.2
Figures may not add up to 100% due to rounding.1 Other includes high-speed lines provided over traditional wireline facilities such as T-carrier and also lines provided over any technology that is not specified in the table.
Table 16Percentage of Zip Codes with High-Speed Lines in Service by Technology as of June 30, 2008
Number of Providers


Alabama 0 % 0 % 1 % 2 % 3 % 8 % 17 % 16 % 15 % 8 % 30 %Alaska 0 12 37 21 17 4 3 0 3 1 0Arizona 0 0 0 1 2 6 8 10 8 7 57Arkansas 0 0 2 7 11 15 27 16 8 5 9California 0 0 0 2 4 8 10 9 6 6 54Colorado 0 0 1 2 5 5 13 12 8 6 48Connecticut 0 0 0 0 7 10 15 14 12 11 30Delaware 0 0 0 5 2 5 16 5 10 3 53District of Columbia 0 0 0 4 4 0 0 4 0 0 88Florida 0 0 0 0 1 2 4 8 7 8 70Georgia 0 0 0 2 3 8 14 13 11 8 41Hawaii 0 0 0 3 6 14 18 16 8 14 21Idaho 0 0 3 9 7 12 14 17 12 5 22Illinois 0 0 2 3 8 13 16 11 9 6 32Indiana 0 0 1 4 8 12 14 13 13 8 27Iowa 0 0 2 5 10 12 16 14 12 8 22Kansas 0 0 2 5 10 13 12 12 10 9 26Kentucky 0 2 8 11 12 14 13 11 8 6 14Louisiana 0 0 0 2 3 7 16 21 12 9 31Maine 0 1 4 8 11 15 18 16 13 3 11Maryland 0 0 1 3 7 12 12 12 6 6 42Massachusetts 0 0 0 1 2 9 13 13 9 10 43Michigan 0 0 0 1 3 7 11 15 14 10 39Minnesota 0 0 2 5 12 14 13 13 10 6 26Mississippi 0 0 0 2 1 10 16 17 14 8 32Missouri 0 0 2 5 10 13 16 15 9 5 24Montana 0 0 0 7 19 25 17 10 6 4 11Nebraska 0 0 0 4 10 15 17 16 15 8 15Nevada 0 0 1 1 7 7 11 11 9 7 46New Hampshire 0 0 0 0 3 5 11 18 21 12 30New Jersey 0 0 0 0 1 4 3 6 6 8 73New Mexico 0 0 2 2 9 16 19 17 10 4 21New York 0 0 1 3 5 13 14 11 10 8 36North Carolina 0 0 0 1 2 4 10 16 17 11 38North Dakota 0 0 2 17 28 25 15 5 3 1 3Ohio 0 0 0 0 1 4 10 16 15 11 42Oklahoma 0 0 2 3 10 19 18 11 7 6 23Oregon 0 0 2 5 10 14 14 9 8 7 31Pennsylvania 0 1 3 6 11 13 13 12 6 5 31Puerto Rico 0 0 0 0 1 2 6 18 29 17 27Rhode Island 0 0 1 3 5 9 12 15 7 5 42South Carolina 0 0 0 1 3 5 13 15 9 9 45South Dakota 0 0 3 16 23 20 14 9 7 3 6Tennessee 0 0 1 2 5 11 16 14 9 7 35Texas 0 0 1 2 4 8 11 11 10 10 42Utah 0 0 0 4 6 8 18 10 10 6 38Vermont 0 0 0 1 6 12 13 20 11 13 23Virginia 0 0 1 2 8 11 16 15 10 7 29Washington 0 0 0 4 5 12 11 10 9 6 44West Virginia 0 1 6 12 22 22 16 8 3 3 7Wisconsin 0 0 1 1 4 10 21 19 12 9 22Wyoming 0 0 1 7 14 18 19 14 7 7 11
Nationwide 0 % 0 % 2 % 4 % 7 % 11 % 13 % 13 % 10 % 7 % 33 %
Zero One Two Three Ten orFour Five Six Seven Eight Nine More
Table 17Percentage of Zip Codes with High-Speed Lines in Service as of June 30, 2008
(Over 200 kbps in at least one direction)
Number of Providers

Jun 2006 Jun 2006
More than 3,190 99.3 % 99.5 % 99.7 % 99.9 % 100.0 % 100.0 % 100.0 % 100.0 % 100.0 % 100.0 % 100.0 % 100.0 % 100.0 % 100.0 %975 - 3,190 99.8 99.7 99.9 100.0 100.0 100.0 100.0 100.0 100.0 100.0 100.0 100.0 100.0 100.0278 - 975 99.4 99.7 99.7 99.9 99.9 100.0 100.0 100.0 100.0 100.0 100.0 100.0 100.0 100.0118 - 278 99.5 99.7 99.6 99.8 100.0 99.9 100.0 100.0 100.0 100.0 100.0 100.0 100.0 100.066 - 118 99.4 99.7 99.7 99.7 100.0 99.9 100.0 100.0 100.0 100.0 100.0 100.0 100.0 100.041 - 66 99.1 99.3 99.6 99.5 99.9 99.9 100.0 99.9 99.9 100.0 100.0 100.0 100.0 100.025 - 41 97.7 98.8 99.3 99.4 99.8 99.6 100.0 99.6 99.8 99.9 99.9 100.0 99.9 100.015 - 25 97.5 98.1 98.7 99.4 99.9 99.7 100.0 99.4 99.5 99.7 99.9 100.0 100.0 100.06 - 15 95.8 97.9 98.6 99.2 99.9 99.5 100.0 98.9 99.6 99.7 99.8 100.0 99.9 100.0
Fewer than 6 92.2 96.9 98.2 99.0 99.8 99.6 100.0 98.2 99.3 99.7 99.9 100.0 99.9 100.0
Jun 2006 Jun 2006
More than $61,200 99.6 % 99.8 % 100.0 % 100.0 % 100.0 % 100.0 % 100.0 % 100.0 % 100.0 % 100.0 % 100.0 % 100.0 % 100.0 % 100.0 %$50,331 - $61,200 99.7 99.6 99.9 99.9 100.0 100.0 100.0 100.0 100.0 100.0 100.0 100.0 100.0 100.0$44,439 - $50,331 99.3 99.4 99.7 99.8 100.0 100.0 100.0 100.0 100.0 100.0 100.0 100.0 100.0 100.0$40,334 - $44,439 98.8 99.2 99.6 99.8 100.0 100.0 100.0 100.0 100.0 100.0 100.0 100.0 100.0 100.0$37,281 - $40,334 98.2 99.1 99.3 99.6 100.0 99.8 100.0 99.9 100.0 100.0 100.0 100.0 100.0 100.0$34,633 - $37,281 98.4 99.2 99.5 99.7 99.9 99.9 100.0 99.9 100.0 100.0 100.0 100.0 100.0 100.0$32,125 - $34,633 97.4 98.9 99.3 99.6 99.9 99.9 100.0 99.9 99.9 100.0 100.0 100.0 100.0 100.0$29,616 - $32,125 97.1 98.6 98.9 99.2 99.9 99.7 100.0 99.7 99.8 99.8 99.8 100.0 99.9 100.0$26,113 - $29,616 96.4 98.2 98.8 99.5 99.9 99.7 100.0 99.8 99.9 99.9 100.0 100.0 100.0 100.0Less than $26,113 94.9 97.1 98.1 98.6 99.7 99.1 100.0 99.7 99.9 99.9 99.9 100.0 99.9 100.0
Dec 2006
Jun 2008
Dec 2005 Jun 2008
Dec 2006
Persons per Square Mile 1
Dec 2005
Percentage of Population that Resides in Zip Codes with High-Speed Service
Jun 2005Dec 2007Jun 2007Jun 2005 Jun 2008
Jun 2008
Jun 2007Dec 2006
Dec 2006 Jun 2007
1 Persons per square mile and median household income are presented in decile groups where each group contains 10% of the geographic Zip Codes. Because Zip Codes are being updated constantly, the decile break points vary slightly over time. The break points shown are typical. These data are created by geographically merging contemporaneous Tele Atlas ® Dynamap ® ZIP Code Boundary & Inventory Files with census block-level population and census block group-level income data from the 2000 Census of Population and Housing.
Table 18High-Speed Subscribership
Ranked by Population Density
Percentage of Population that Resides in Zip Codes with High-Speed Service
Table 19High-Speed Subscribership
Ranked by Household Income
Percentage of Zip Codes with at Least One High-Speed Subscriber
Median Household Income 1
Historical data have been revised back through June 2005.
Dec 2005 Dec 2007
Dec 2007 Dec 2007Dec 2005Jun 2005 Jun 2005
Percentage of Zip Codes with at Least One High-Speed Subscriber
Jun 2007

Customer Response Publication: High-Speed Services for Internet Access: Status as of June 30, 2008 You can help us provide the best possible information to the public by completing this form and returning it to the Industry Analysis and Technology Division of the FCC's Wireline Competition Bureau. 1. Please check the category that best describes you: ____ press ____ current telecommunications carrier ____ potential telecommunications carrier ____ business customer evaluating vendors/service options ____ consultant, law firm, lobbyist ____ other business customer ____ academic/student ____ residential customer ____ FCC employee ____ other federal government employee ____ state or local government employee ____ Other (please specify) 2. Please rate the report: Excellent Good Satisfactory Poor No opinion Data accuracy (_) (_) (_) (_) (_) Data presentation (_) (_) (_) (_) (_) Timeliness of data (_) (_) (_) (_) (_) Completeness of data (_) (_) (_) (_) (_) Text clarity (_) (_) (_) (_) (_) Completeness of text (_) (_) (_) (_) (_) 3. Overall, how do you Excellent Good Satisfactory Poor No opinion rate this report? (_) (_) (_) (_) (_) 4. How can this report be improved? 5. May we contact you to discuss possible improvements? Name: Telephone #:
To discuss the information in this report, contact: 202-418-0940 or for users of TTY equipment, call 202-418-0484
Fax this response to or Mail this response to
202-418-0520 FCC/WCB/IATD Mail Stop 1600 F
Washington, DC 20554