High Speed Rail's Effect on Population Distribution in ...
70
High Speed Rail's Effect on Population Distribution in Secondary Urban Areas An Analysis of the French Urban Areas and Implications for the California Central Valley A Planning Report Presented to The Faculty of the Department of Urban and Regional Planning San José State University In partial fulfillment of the requirements for the degree Master of Urban Planning by Brian Stanke June 2009
Transcript of High Speed Rail's Effect on Population Distribution in ...

High Speed Rail's Effect on Population Distribution in Secondary Urban Areas
An Analysis of the French Urban Areas and Implications for the California Central Valley
A Planning ReportPresented to
The Faculty of the Department ofUrban and Regional Planning
San José State University
In partial fulfillmentof the requirements for the
degree Master of Urban Planning
by
Brian StankeJune 2009


Table of ContentsTable of Contents............................................................................................................................. iList of Figures ............................................................................................................................... iiiList of Charts.................................................................................................................................. iiiIndex of Tables................................................................................................................................ vAcknowledgments......................................................................................................................... viChapter 1: Introduction.................................................................................................................. 1
BackgroundNational ContextIncremental vs. True High Speed Rail
Research QuestionRelevanceHypothesisMethodsReport Structure
Chapter 2: Existing Research on High Speed Rail's Effect on Population Distribution..........7OverviewMain Themes and Debates
Economic sectors most attracted to HSR station areasMarket size necessary to justify HSR serviceHSR's effect on economic development as a function of city size, network location, and distance from central citiesEffect on residential location and commutingFactors increasing attractiveness of city centersGreenfield HSR sitesHSR as a city regeneration toolAbility of HSR to create co-cities that act as one marketImpact of HSR on overall growth rates
ConclusionChapter 3: California High Speed Rail Proposal ....................................................................... 17
OverviewProposed Alignments Proposed Station Areas
SacramentoStocktonModesto MercedFresnoBakersfield
Projected Services, Travel Times, and Ridership Projected Service LevelsTravel TimesRidership Projections
ConclusionChapter 4: Empirical Analysis of Population Distribution in French Urban Areas.................33
OverviewMethodology
High Speed Rail and Population Distribution i

Case CitiesData and Methodology
Case City ResultsSummary Information on Selected Urban Areas LyonLe Mans NantesLille
FindingsComparing the Distribution Patterns of Urban AreasComparison with non-TGV cities
ConclusionChapter 5: Conclusions............................................................................................................... 57
Effect on Population DistributionLimitationsImplication for California Station LocationsPotential for Future Studies
Reference List.............................................................................................................................. 59
ii High Speed Rail and Population Distribution

List of Figures
Illustration 1-1: CA HSR network........................................................................................................... 1Illustration 2-1: TGV Sud-Est map....................................................................................................... 13Illustration 3-1: Northern Central Valley Alignments and Stations........................................................ 17Illustration 3-2: Southern Central Valley Alignments and Stations........................................................ 18Illustration 3-3: Sacramento station site and "Railyards" development zoning..................................... 20Illustration 3-4: Stockton Cabral station site......................................................................................... 21Illustration 3-5: Amtrak Briggsmore site............................................................................................... 22Illustration 3-6: Modesto Village One - Land Use Plan......................................................................... 23Illustration 3-7: Modesto Village One Circulation Diagram................................................................... 24Illustration 3-8: Downtown Modesto site.............................................................................................. 25Illustration 3-9: Merced downtown station site..................................................................................... 26Illustration 3-10: Downtown Fresno station site visualization............................................................... 27Illustration 3-11: Bakersfield station site............................................................................................... 28Illustration 4-1: TGV network map........................................................................................................ 36
List of ChartsChart 4-1 Rates of Population Growth over time - Lyon....................................................................... 37Chart 4-2 Distribution of Study Area Population Over Time – Lyon...................................................... 38Chart 4-3 Population Growth Distribution Per Interval – Lyon.............................................................. 38Chart 4-4 Weighted and Gross Densities over time – Lyon.................................................................. 39Chart 4-5 Growth Rates over time – Le Mans ..................................................................................... 41Chart 4-6 Distribution of Population over time – Le Mans.................................................................... 41Chart 4-7 Weighted and Gross Density over time – Le Mans.............................................................. 42Chart 4-8 Population Growth Distribution per interval – Le Mans......................................................... 42Chart 4-9 Population Rate over time – Nantes..................................................................................... 44Chart 4-10 Distribution of Population over time – Nantes.................................................................... 44Chart 4-11 Weighted and Gross Density over time – Nantes............................................................... 45Chart 4-12 Population Growth Distribution per interval – Nantes......................................................... 45Chart 4-13 Rates of Population Growth Over Time – Lille.................................................................... 47Chart 4-14 Distribution of Study Area Population over time – Lille....................................................... 47Chart 4-15 Weighted and Gross Density over time – Lille.................................................................... 48Chart 4-16 Population Growth Distribution per interval – Lille.............................................................. 48Chart 4-17 Population Share of Central Sub-area Pre-/Post-TGV....................................................... 49Chart 4-18 Weighted Densities of HSR Cities...................................................................................... 50Chart 4-19 Percentage of Urban Area Growth in Central Sub-Area by period..................................... 51Chart 4-20 Percentage of Urban Area Growth in Central Sub-Area over time..................................... 51Chart 4-21 Population Share of Central Sub-area all cities.................................................................. 53Chart 4-22 Weighted Densities of all Cities.......................................................................................... 53Chart 4-23 Percentage of Urban Area Growth in Central Sub-Area by period..................................... 54Chart 4-24 Percentage of Urban Area Growth in Central Sub-Area over time..................................... 55
High Speed Rail and Population Distribution iii

iv High Speed Rail and Population Distribution

Index of Tables
Table 1-1 HSR and semi-HSR systems planned or built in the U.S. 1980 – 2009................................. 2Table 1-2 Semi- (Incremental) versus True High Speed Rail................................................................ 4Table 2-1 California Metropolitan Area Populations.............................................................................. 9Table 2-2 HSR Express Train Travel Times........................................................................................ 11Table 3-1 Potential CA HSR Station Locations................................................................................... 19Table 3-2 Estimated Peak Condition Total Travel Times (Door-to-Door) between City Pairs by Auto, Air, Conventional Rail, and HSR......................................................................................................... 29Table 3-3 Sensitivity Tests for High-Speed Rail.................................................................................. 30Table 4-1 Characteristic of Selected Urban Areas.............................................................................. 35Table 4-2 Percentage of Urban Area Growth in Central Sub-Area HSR cities................................... 50Table 4-3 Characteristic of Selected Urban Areas.............................................................................. 52Table 4-4 Percentage of Urban Area Growth in Central Sub-Area all cities....................................... 55
High Speed Rail and Population Distribution v
Acknowledgments
I am grateful for the assistance of my faculty advisor, Dr. Shishir Mathur, Associate Professor atSan Jose State University. Dr. Mathur's support and feedback was invaluable over the course of this project. I would also like to thank Institut National de Statistique et des Etudes Economiques (INSEE) for their data and online tools, without which this project would not have been possible.
vi High Speed Rail and Population Distribution

Chapter 1: Introduction
Chapter 1: Introduction
BackgroundHigh speed rail (HSR) is a new mode of travel that has revived passenger rail service around the world in the past forty years and “become one of the basic technologies of the twenty-first century” (Givoni 2006 p. 594). Givoni defines high speed trains as, “high capacity and frequency railway services achieving an average speed of over 200 kph” (Givoni, 2006 p. 609).
Over ten systems have been developed and operated in other countries (Campos, Rus, and Barrón, 2006). The Japanese system was the first in the world, starting in 1964. Since then additional systems have been built in Asia in Korean, Taiwan, and China over the last ten years. In Europe, France has operated the TGV HSR service since 1981. Stating with the Sud-Est line to Lyon the TGV four lines with additional segments under construction. Germany and Italy also constructed HSR services in the early 1990s and a trans-European network is now being developed with lines in France, Germany, Italy, Spain, Belgium, Britain, and the Netherlands. These existing networks can provide important information to planners in the US about the performance and development effects of HSR service in the cities and regions they serve.
The proposed California HSR system stretches more than 700 miles from San Francisco, Oakland, and Sacramento in the north to Los Angeles and San Diego in the south (see Illustration 1-1). The proposed CAHSR system will have the capacity to carry approximately 116 million passengers annually (Authority and Administration 2005b, 1). The alignment will run through California’s Central Valley connecting the fast-growing cities of Bakersfield, Fresno, Merced, Modesto and Stockton, all of which are outside the metropolitan areas for California's central cities. With speeds in excess of 200 mph, the travel time from San Francisco to Los Angeles is estimated at approximately 2.5 hours and the system would carry between 32 million and 58 million intercity passengers annually by 2020 (Authority and Administration 2005a).1
National Context The California project is one of six high-speed and semi-high-speed projects in the United States that is in planning or was constructed in the last fifteen years.
1 The California HSR Authority has developed different ridership scenarios based on changes in factors such as fuel cost or increased travel time due to congestion on roads and at airports. The base case is 32 million passengers on HSR with ridership estimates as high as 58 million by 2020.
High Speed Rail and Population Distribution 1
Illustration 1-1: CA HSR network
Source: CAHSRA http://www.cahighspeedrail.ca.gov/
Chapter 1: Introduction
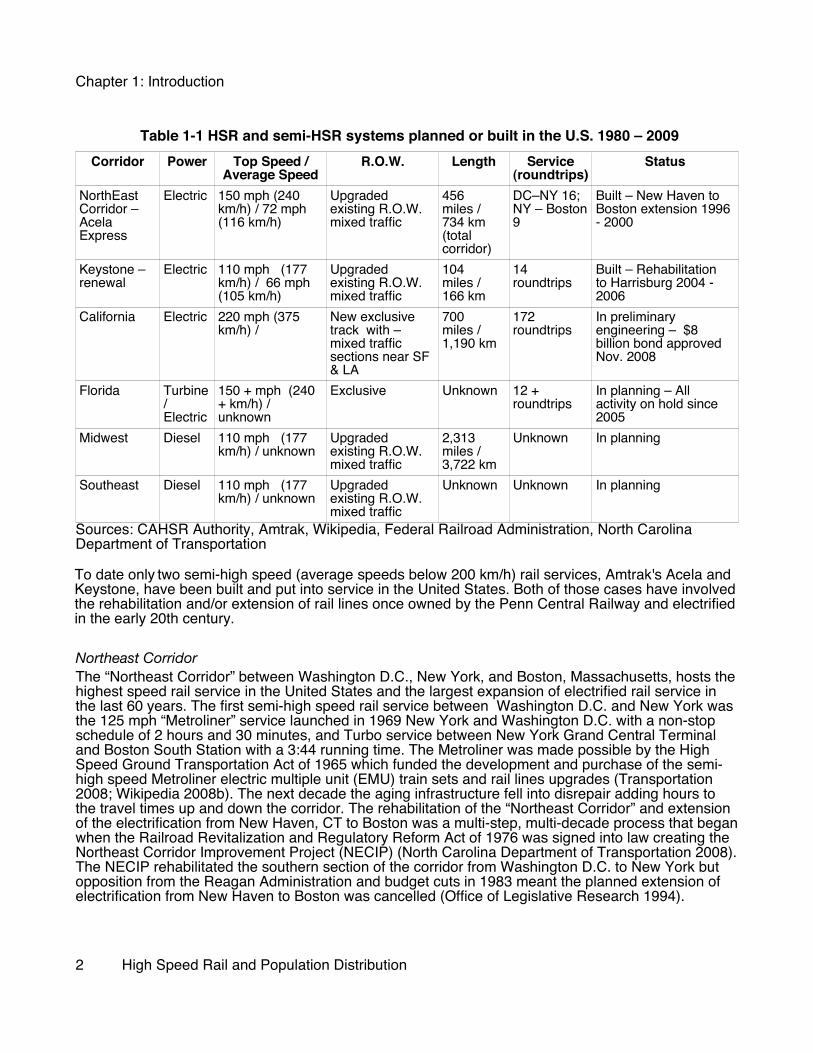
Table 1-1 HSR and semi-HSR systems planned or built in the U.S. 1980 – 2009Corridor Power Top Speed /
Average SpeedR.O.W. Length Service
(roundtrips)Status
NorthEast Corridor – Acela Express
Electric 150 mph (240 km/h) / 72 mph (116 km/h)
Upgraded existing R.O.W. mixed traffic
456 miles / 734 km (total corridor)
DC–NY 16; NY – Boston 9
Built – New Haven to Boston extension 1996 - 2000
Keystone – renewal
Electric 110 mph (177 km/h) / 66 mph (105 km/h)
Upgraded existing R.O.W. mixed traffic
104 miles /166 km
14 roundtrips
Built – Rehabilitation to Harrisburg 2004 - 2006
California Electric 220 mph (375 km/h) /
New exclusive track with – mixed traffic sections near SF & LA
700 miles /1,190 km
172 roundtrips
In preliminary engineering – $8 billion bond approved Nov. 2008
Florida Turbine / Electric
150 + mph (240 + km/h) / unknown
Exclusive Unknown 12 + roundtrips
In planning – All activity on hold since 2005
Midwest Diesel 110 mph (177 km/h) / unknown
Upgraded existing R.O.W. mixed traffic
2,313 miles / 3,722 km
Unknown In planning
Southeast Diesel 110 mph (177 km/h) / unknown
Upgraded existing R.O.W. mixed traffic
Unknown Unknown In planning
Sources: CAHSR Authority, Amtrak, Wikipedia, Federal Railroad Administration, North Carolina Department of Transportation
To date only two semi-high speed (average speeds below 200 km/h) rail services, Amtrak's Acela and Keystone, have been built and put into service in the United States. Both of those cases have involved the rehabilitation and/or extension of rail lines once owned by the Penn Central Railway and electrified in the early 20th century.
Northeast CorridorThe “Northeast Corridor” between Washington D.C., New York, and Boston, Massachusetts, hosts the highest speed rail service in the United States and the largest expansion of electrified rail service in the last 60 years. The first semi-high speed rail service between Washington D.C. and New York was the 125 mph “Metroliner” service launched in 1969 New York and Washington D.C. with a non-stop schedule of 2 hours and 30 minutes, and Turbo service between New York Grand Central Terminal and Boston South Station with a 3:44 running time. The Metroliner was made possible by the High Speed Ground Transportation Act of 1965 which funded the development and purchase of the semi-high speed Metroliner electric multiple unit (EMU) train sets and rail lines upgrades (Transportation 2008; Wikipedia 2008b). The next decade the aging infrastructure fell into disrepair adding hours to the travel times up and down the corridor. The rehabilitation of the “Northeast Corridor” and extension of the electrification from New Haven, CT to Boston was a multi-step, multi-decade process that began when the Railroad Revitalization and Regulatory Reform Act of 1976 was signed into law creating the Northeast Corridor Improvement Project (NECIP) (North Carolina Department of Transportation 2008). The NECIP rehabilitated the southern section of the corridor from Washington D.C. to New York but opposition from the Reagan Administration and budget cuts in 1983 meant the planned extension of electrification from New Haven to Boston was cancelled (Office of Legislative Research 1994).
2 High Speed Rail and Population Distribution

Chapter 1: Introduction
In 1994 the Federal Railroad Administration issued the Northeast High-Speed Rail Improvement Project for the extension of electrification to Boston and major renewals and upgrades to the tracks to reduce travel times to three hours between New York and Boston. The new semi-high-speed “Acela Express” train service began in late 2000. Despite the completion of the electrification, purchase of new high-speed trainsets and track upgrades to allow speeds of up to 150 mph in limited sections, the three hour goal was never met. As of 2003 the master plan goal of a three hour trip time was no longer being funded by the Federal Government, nor actively pursued by Amtrak (General Accounting Office 2004).
Despite the promise shown in the late 1960's, the Northeast Corridor has stalled over the last forty years. Despite over 20 years of effort, and the expenditure of $4.6 billion in federal funds the current Acela Express schedule of 2:35 min DC – New York and 3:42 minutes New York – Boston is five minutes slower and two minutes faster than the 1969 Metroliner and Turbo services respectively (Administration 2007; Amtrak 2008a, 2008b). While a dozen countries around the world have developed true high–speed networks and services the United States stagnated, only rebuilding existing semi-HSR services.
Keystone CorridorThe second semi-high speed service implemented in the United States is the “Keystone Service” between Harrisburg, Pennsylvania and New York via Philadelphia. The story of rail service on the Keystone corridor mirrors that of the north section of the Northeast corridor in many ways. The Keystone Corridor” between Harrisburg and Philadelphia was owned by the Pennsylvania Railroad and electrified in two stages in 1915 and the early 1930's. After the passage of the High Speed Ground Transportation Act of 1965 several attempts were made at creating high speed or semi-high speed service from the mid-60s to the mid-80s but all failed. A joint Amtrak-State of Pennsylvania project to restore the line and introduce 110 mph service was finally undertaken in 2004-2006.
According to Mathur and de Cerreño (2006), the first attempt at semi-high speed service was made in 1967, when a proposal by “Westinghouse Air Brake Company (WABCO) presented to the Pennsylvania Commerce Department a study on HSR. The study proposed implementing HSR service between Philadelphia and Ohio, with trains that could run up to 150 mph, on a right-of-way (ROW)” but the state rejected this for a proposal “to jointly fund the purchase of electric-powered “Capitaliner” coaches, identical to the “Metroliner” coaches being implemented on the NEC.” (Cerreño and Mathur 2006, 56). The bankruptcy of Penn Central in 1970 terminated the agreement before the coaches could be purchased. The corridor eventually received the original Metroliner coaches only after they were replaced by the second generation versions on the Northeast corridor.
In 1976 the line was transferred to Amtrak, which initially invested in restoring the line but let it deteriorate over the 1980's. In 1980 Pennsylvania joined the “Interstate High Speed Intercity Rail Passenger Network Compact” which included the states of Illinois, Indiana, Kentucky, Michigan, Missouri, New York, Tennessee, and West Virginia. The legislature unanimously passed, and Governor Dick Thornburgh (R) signed, legislation establishing the Pennsylvania High Speed Intercity Rail Passenger Commission (PHSIRPC). The Commission created reports in 1985, 1987 and 1989 but was effectively ended by Governor Robert Patrick Casey (D, 1987–1995) who cut the commission's staff in 1987 (Cerreño and Mathur 2006, 58-62). In this paper Mathur and de Cerreño state, “No reason was publicly stated; there was speculation that airline interests may have been involved, but this was always denied.” Ridership fell by two thirds over the course of the 1980's from 1,024,700 to 334,963 yearly passengers. By 1988 electric service was suspended and diesel locomotives were used instead (Cerreño and Mathur 2006, 57) (Dawson 1993). By 2004 “most of the track was limited to a maximum speed of 70 miles per hour (113 km/h), except for a few 90 mile per hour (145 km/h)) sections” and many curves and interlocking had even slower speed restrictions (Wikipedia 2008a).
A $145 million joint project between Amtrak, the national passenger railroad company, the Federal Transit Administration and the State of Pennsylvania rehabilitated tracks, electrification, and signaling.
High Speed Rail and Population Distribution 3
Chapter 1: Introduction
The work allows speeds of up to 110 mph and a 30 minute reduction in running times between Harrisburg and Pennsylvania from two hours to an hour and 35 minutes (Transportation 2006). Like the more famous and heavily used Northeast Corridor, the history of the Keystone Corridor has been one of long-term stagnation. Waves of investment and deterioration over the past forty years have left the line in somewhat better shape than the late 1960s. The difference has been only marginal and not the step-change in speed and frequency that true high speed rail services have brought to other countries.
Other SystemsThe history of high speed rail, or even semi-high speed outside of the old Penn Central system, in the United States has been one of disappointment and abject failure. Not one high-speed network proposal has been funded or constructed. All proposals for HSR in Florida and Texas have failed in the face of opposition, lack of federal support, and the withdrawal of support, or outright opposition, from state officials. The Chicago Hub network in the midwest has not been funded outside of the construction of two short semi-high speed demonstration lines in Michigan and Illinois (Administration 2008).
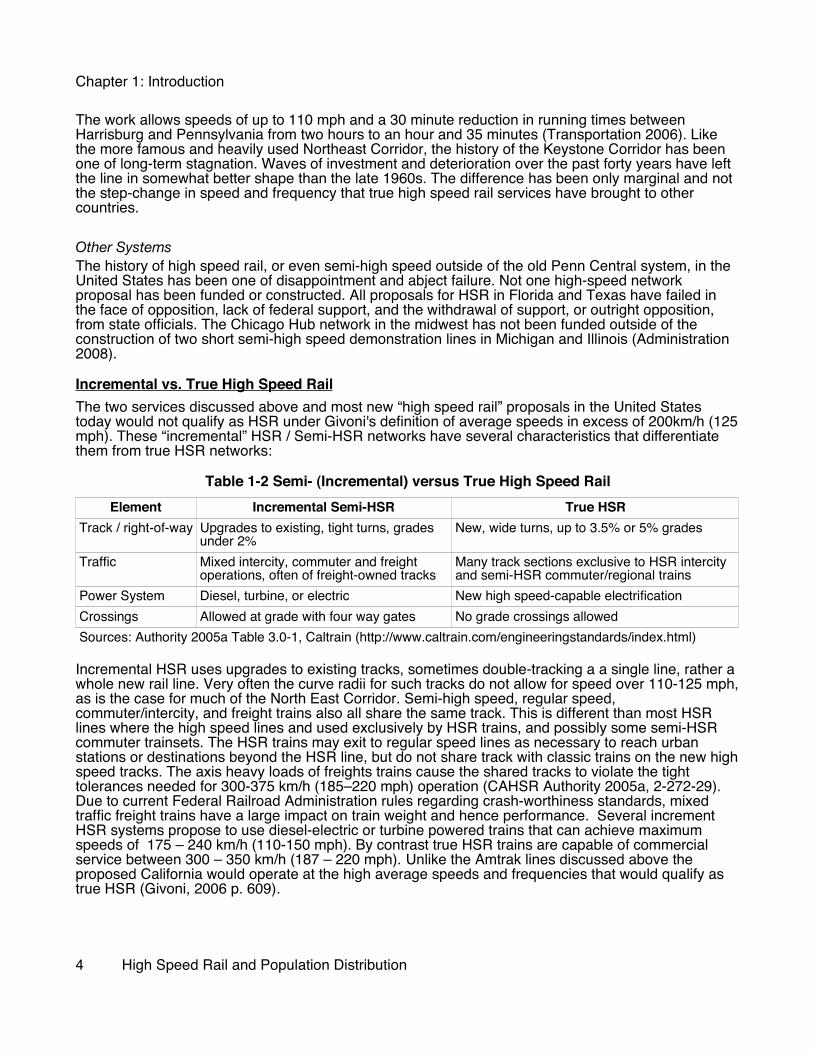
Incremental vs. True High Speed RailThe two services discussed above and most new “high speed rail” proposals in the United States today would not qualify as HSR under Givoni's definition of average speeds in excess of 200km/h (125 mph). These “incremental” HSR / Semi-HSR networks have several characteristics that differentiate them from true HSR networks:
Table 1-2 Semi- (Incremental) versus True High Speed RailElement Incremental Semi-HSR True HSR
Track / right-of-way Upgrades to existing, tight turns, grades under 2%
New, wide turns, up to 3.5% or 5% grades
Traffic Mixed intercity, commuter and freight operations, often of freight-owned tracks
Many track sections exclusive to HSR intercity and semi-HSR commuter/regional trains
Power System Diesel, turbine, or electric New high speed-capable electrificationCrossings Allowed at grade with four way gates No grade crossings allowedSources: Authority 2005a Table 3.0-1, Caltrain (http://www.caltrain.com/engineeringstandards/index.html)
Incremental HSR uses upgrades to existing tracks, sometimes double-tracking a a single line, rather a whole new rail line. Very often the curve radii for such tracks do not allow for speed over 110-125 mph, as is the case for much of the North East Corridor. Semi-high speed, regular speed, commuter/intercity, and freight trains also all share the same track. This is different than most HSR lines where the high speed lines and used exclusively by HSR trains, and possibly some semi-HSR commuter trainsets. The HSR trains may exit to regular speed lines as necessary to reach urban stations or destinations beyond the HSR line, but do not share track with classic trains on the new high speed tracks. The axis heavy loads of freights trains cause the shared tracks to violate the tight tolerances needed for 300-375 km/h (185–220 mph) operation (CAHSR Authority 2005a, 2-272-29). Due to current Federal Railroad Administration rules regarding crash-worthiness standards, mixed traffic freight trains have a large impact on train weight and hence performance. Several increment HSR systems propose to use diesel-electric or turbine powered trains that can achieve maximum speeds of 175 – 240 km/h (110-150 mph). By contrast true HSR trains are capable of commercial service between 300 – 350 km/h (187 – 220 mph). Unlike the Amtrak lines discussed above the proposed California would operate at the high average speeds and frequencies that would qualify as true HSR (Givoni, 2006 p. 609).
4 High Speed Rail and Population Distribution

Chapter 1: Introduction
At this time the California HSR network is the only proposal for true HSR service in the country that is being actively pursued and has a dedicated funding source available. In November of 2008 the voters of California passed proposition 1A which approved the sale of $10 billion dollars in general obligation bonds by the state to construct the proposed HSR network.
Research QuestionHSR are high investment long-term infrastructure projects meant to substantially change travel patterns. Beyond the travel mode change this paper seeks to evaluate if HSR station have an effect on the where growth is located within an urban area. Urban areas in France were selected for the analysis because of the age and extent of the French HSR system and similarities in population densities with California. Specifically:
1. Has HSR service caused the distribution of growth in French urban areas to shift towards the central urban area close to the HSR station? Which are the factors that may intensify such an effect?
2. How should California Central Valley cities best locate their stations in light of the above factors?
RelevanceThe metropolitan areas around the Central Valley host cities for the California high speed rail network (Bakersfield, Fresno, Merced, Modesto and Stockton) are all projected to absorb a substantial percentage of the states population growth between 2010 and 2050 (Finance 2004). All of these cities' transportation systems are currently very automobile-dominated with resultant low-density highway-oriented development (Burchell et al. 1998). The land-inefficiency, cost, danger, and pollution of such development poses a series of environmental, health, and economic challenges to the state (Cieslewicz 2002). Despite these problems the local leaders in all of these communities seek to attract growth in residents and business as a way to improve the economies of their areas, and see the HSR network as an alternative that would attract growth to their regions. At the same time environmental groups across the state are very concerned that the HSR network may in fact increase the rate of habitat and farmland loss if it results in the acceleration of the current HOD growth pattern of the Central Valley (Nelson 2006). Many local leaders and business interest are interested in attracting additional economic opportunities to their areas. Therefore an important question whether HSR service would accelerate current population dispersal trends or change those trends.
HypothesisThe effect of high speed rail services in other countries has been that economic and population growth in outlying metropolitan areas is redirected towards the central city in which the station is located (Harman 2006; Sands 1993; Vickerman 1997). The addition of a High Speed Rail station to secondary cities changes the location and urban form of growth by redirecting growth from the outer edges of the city and other parts of the metro region towards the area around the station (Rietveld et al. 2001; Willigers, Floor, and Wee 2005). The arrival of HSR service led to centralization of information economy, retail, and hotel activity around the city center and station area of the host city at the expense of outlying area within the same metropolitan area (Sands, 1993; Harman 2006). Similarly the introduction of HSR service to the California Central Valley will lead to the slowing of population dispersal and potential the re-concentration of population within the central cities of urban area that have HSR stations.
MethodsThe current study reviews the existing body of literature on HSR's effect on urban development and performs analysis on population data for select urban areas with HSR service. Existing literature is
High Speed Rail and Population Distribution 5

Chapter 1: Introduction
examined for what lessons can be learned from the experience of other countries regarding growth inducement by HSR and optimal HSR station location. The population and density trends and distribution from 1968 to 2006 are analyzed for four French urban areas that have had HSR in operation for over ten years.
To measure the effect of HSR service on the distribution of business and residential growth in host cities I will obtain population and density data for cities in selected urban areas in the years before and after the start of HSR service. Each urban area is divided into central, medium, and outer areas. Population indicators used include:
– Growth rates by sub-area;– Percentage of total area population increase/decrease accommodated by each sub-area;– Percentage of urban area in each sub-area;– Gross and weighted density and weighted/gross density ratio
These measurement are compared by sub-area over time to evaluate if the distribution of growth is changing. The weighted density and the gross/weighted density ratio also shows if the population of the urban area is dispersing more homogeneously across the landscape, or concentrating in ever denser clumps of high population areas (Bradford 2008). Population trends in the four urban areas with HSR are compared against each other and two urban areas with limited HSR service.
Report StructureFollowing portions of this paper are organized into four chapters. Chapter two reviews the available literature on HSR's effect on urban development and growth distribution, and potential implications of those studies for California. Chapter three evaluates whether the proposed alignments and stations and current planning around those location does or does not support attempts to accommodate and take advantage of HSR. Chapter four then analyzes the growth patterns of French cities since the introduction of HSR service to measure if HSR service correlates with changes in urban area growth distribution. Chapter five summarizes the findings of this paper, discusses study limitations, opportunities for further research, and the policy implications of this paper's findings.
6 High Speed Rail and Population Distribution

Chapter 2: Existing Research on High Speed Rail's Effect on Population Distribution
Chapter 2: Existing Research on High Speed Rail's Effect on Population Distribution
OverviewThe following literature review discusses main themes, debates, and findings related to HSR's impact on development and economic growth including: regional economic growth, the comparative effects on HSR and non-HSR cities based on size and location, long-distance commuting, business location, regional competitiveness, and the relative attractiveness of city centers.
The literature review first establishes the need for additional research regarding the development impacts of HSR. Next, main themes and debates regarding HSR services' development impacts are identified. Subsequently, the hypothesis of this paper is compared to existing research to evaluate if it is supported or contradicted by the current literature. Finally, the literature review draws conclusions about the current state of research regarding HSR services effect on spatial development.
Main Themes and DebatesResearch on the effects of HSR networks is still rather thinly developed. Because HSR lines serve both local and inter-regional traffic, and most often are located at the heart of large urban cities, the economic and urbanization effects of HSR are complex and multi-faceted. The main urbanization and economic foci and debates have been:
• Which economic sectors are most attracted to HSR (Sands 1993; Knox 2006; Blum et al. 1997; Bonnafous 1987)
• The market size necessary to justify HSR service (Vickerman 1997; Rus 2006)• How city size and location in relation to the HSR network affects development and economic
impacts (Bonnafous 1987; Harman 2006; Haynes 1997; Preston 2006; Rus 2006; Sasaki et al. 1997; Vickerman 1997; Willigers 2005)
• Creation of HSR commute suburbs (Preston 2006; Riley 2007; VEF 2007; Rietveld 2001)• HSR effect on the attractiveness of city centers (Knox 2006; Willigers 2003)• The development of greenfield HSR sites (Bertolini 1998, 167-8; Givoni 2006, 605; Haynes
1997, 70; Sands, 1993)• HSR as a city regeneration tool (Harman 2006, 12; Rietveld 2001, 11-12; Vickerman 1997, 36;
Willigers 2005, 5)• The ability of HSR to create “co-cities” (Knox 2006; Blum et al. 1997), and• HSR's effect on overall growth rates (Sands 1993; Knox 2006)
Economic sectors most attracted to HSR station areas The range of businesses that are attracted to areas with high levels of HSR services is still an area of debate. Researchers define a range of market segment from very narrowly to broad segments. Knox (2006) only looks at information economy firms. Sands (1993) includes information economy plus retail and hotels. They see these sectors as the only ones that would consider the HSR network as a criterion in selecting new locations. Blum, Haynes, and Karlsson (1997) view the market very broadly by including all specialized service producers who require face to face meetings and large markets to support specialization. The leisure and retail sectors are included as well, since those sectors would
High Speed Rail and Population Distribution 7

Chapter 2: Existing Research on High Speed Rail's Effect on Population Distribution
benefit from induced leisure travel. Blum et al. (1997) theorize that land consuming industries currently located in the central metropolitan area would relocate because of HSR to more peripheral areas of HSR network. Such industries would relocate to areas that use the HSR service to maintain travel times to existing clients and suppliers comparable to that of the old location, but with lower land cost (Blum et al. 1997). Bonnafous notes the special attraction of HSR station areas for satellite offices of firms, as evident in the decision of several national and international firms in Nantes and Lyons, France, to locate close to HSR stations (Bonnafous 1987; Sands 1993).
Implications for Central ValleyThe Central Valley currently lags the state in terms of the employment categories most attracted to HSR station areas. According to the California Employment Development Department, in 2006 Fresno County had only two third the proportion of employment in professional service, finance, and information sectors as Los Angeles County. Other smaller counties most likely have even smaller percentages of the their economies in such business sectors. Therefore, the economic impact of HSR may be lesser for Central Valley cities than in the Los Angeles and San Francisco Bay Area metropolitan areas because of their economic sector mix.
Market size necessary to justify HSR serviceThe economic business case for HSR is to connect large central cities to each other or to sufficiently large regional cities with few intermediate stops (Vickerman 1997; Rus and Nash 2006). This means that the end points of most high speed lines are large cities. Several researchers place the ridership threshold at approximately 12 – 15 million riders a year. Rus and Nash (2006) estimate that an isolated 500 km line would need approximately 12 million annual trips to justify the construction of the line solely on the travel and time savings benefits. Vickerman (1997; 31-33) places the minimum regional city size at 750,000 people in order to reach 12 – 15 million riders. Lower ridership lines would be viable if they are constructed to relieve over-capacity infrastructure instead of new or expanded highways or airports. Coto-Millán, Inglada, and Rey (2007) comparative economic evaluation of the net present benefit of two Spanish HSR lines illustrated the factors needed for an economically successful system. The line connecting Madrid (population 5.5 million) to Seville (pop. 1.1 million) results is a negative net present value under all sensitivity tests. The line connecting Madrid to Barcelona (pop. 4.9 million) would generate a positive net present value under all sensitivity tests. Therefore, in the Spanish case of an initial, isolated, unique gauge2 HSR line in a middle income country, a multi-million person regional city was needed to anchor the first stand alone line. Implications for Central ValleyThe proposed California system far exceeds the market necessary for HSR to be a justified on travel and time savings benefits. As shown in Table 2-1 main cities and metropolitan areas of Los Angeles and San Francisco connected in the first phase are far larger than the minimum necessary size to justify HSR service. Further two Central Valley cities and metro areas included in the first segment may be large enough to justify a HSR system connecting them to one of the major metropolitan areas in their own right. Finally the Sacramento metropolitan area and nearby Stockton also have large populations that justify extension of the network to include them.
Ridership for the CA HSR system is projected to be between 87 and 119 million by 2030 (Authority 2005a). Beyond the very high amount of benefits riders of the network would enjoy by connecting such high population areas, the system would also provide major congestion relief benefits. These would include reducing the number of short haul intrastate flights from Los Angeles, San Francisco, and Oakland airports which are all approaching or at capacity. Diversions from auto travel would release congestion on I-5 and Route 99. Goods movement would also be improved by the HSR network's ability to carry parcel service and night time medium-weight freight trains (Parsons Brinckerhoff Quade & Douglas 2004, 6).
2 The Spanish HSR lines are standard gauge, unlike the wider Iberian gauge used on all other rail lines throughout Spain and Portugal.
8 High Speed Rail and Population Distribution

Chapter 2: Existing Research on High Speed Rail's Effect on Population Distribution
Table 2-1 California Metropolitan Area PopulationsFirst Phase City Population Metro Area Population
Los Angeles 3,849,368 12,950,119San Francisco 744,041 7,236,391Fresno 481,035 1,002,284Bakersfield 323,213 780,711
Central Valley ExtensionSacramento 467,343 2,103,956 Stockton 325,308 625,892
Source: United States Census
HSR's effect on economic development as a function of city size, network location, and distance from central citiesOne of the most important themes in the research on the economic impacts of HSR is the differential impacts of HSR on large and small cities, and those on the network versus those off of it. A complicating factor in discussion of the topic is the differing objectives various researchers bring to the topic. Some researchers such as Kim (2000) in Korea explore the potential use of HSR as a tool for dispersion from the central areas to the periphery. Japanese researchers have modeled to determine if additional HSR will lead to dispersion in Japan (Sasaki, Ohashi, and Ando 1997). Many European commentators are concerned about how to lessen inequalities between the central areas of Europe and the periphery, or possible inequalities created between connected and bypassed cities (Rus 2006; Vickerman 1997). In the U.S. planning context a big focus of Smart Growth is to re-concentrate growth into existing urban areas and away from the periphery, reducing sprawl. What is a negative outcome from one perspective may be the desired outcome of another research.
Three criteria have been found to determine HSR service's potential impact on secondary cities: city size, network location, and distance from central cities. All three of these criteria interact to determine the development potential of a city.
The natural market for HSR services, and hence its effect on the development of a secondary metropolitan area, is greatly impacted by the travel time between a secondary city and the connected primary city (usually the capital city). According to Harman (2006) three travel time bands exist:
Primary Market: 1.5 – 2.5 hours Commuting Market: 1 hour or less Longer distance market: Over 2.5 hours
In the 1.5 to 2.5 hour travel market HSR very successfully competes for business and leisure travel against both autos and airplanes. Trip times of under 2.5 hours allow same day business travel between cities where it was not possible before, except by plane. The French and Spanish cities of Lyon, Nantes, and Seville are all regional cities that experienced high ridership growth after HSR brought them within the primary market time band of Paris or Madrid (Harman 2006, 6-8). At travel times of less than one and a half hour, HSR services’ travel time advantage begins to fade in comparison to auto travel, as the private auto’s low access time begins to outweigh its low speed. HSR services can induce long-distance commuting when they connect smaller cities to major employment centers with travel times of less than an hour. Le Mans, Tours, and Lille in France; Puertollano and Ciudad Real in Spain; and the Svealan line (Eskilstuna area) in Sweden are example of cities that became commuter feeders to larger cities connected by HSR. Finally, HSR trips of over 2.5 hours serve a significant market, though a smaller one than those under 2.5 hours. Trips of over 2.5 hours are focused on leisure travel, “weekend getaways” and the such, but also includes a considerable market share for business travel, including “business tourism” (conferences) (Harman
High Speed Rail and Population Distribution 9

Chapter 2: Existing Research on High Speed Rail's Effect on Population Distribution
2006, 7-9). HSR services' ability to provide high comfort levels, more productive travel time, and a longer continuous time en route are the keys to HSR's competitiveness in the longer travel time markets (Vickerman 1997, 33). In this case the longer percentage of the trip on-board is an advantage against the airline travel with its highly segmented trip where so much time is spent going to airport, then check in and boarding, a short flight, debarking, then travel from airport.
The size of a city and its metropolitan area has been identified as a critical factor in how HSR service affects the development of that city. As previously stated, Vickerman (1997) found that a city needed a population of at least 750,000 to justify the construction of a HSR line to serve that city. Large cities that act as regional centers seem to benefit far more from economic development related to HSR than smaller cities (Harman 2006; Givoni 2006, 606). One initial fear when HSR service started from Paris to Lyon, France was that regional firms would be drawn away to Paris. In the case of Lyon it was the reverse; regional firms used the TGV to penetrate the Paris market and grow while many international firms located national branches in Lyon (Bonnafous 1987). The contrast between the large-scale development of Lyon's Part-Dieu neighborhood and Vendome, France's relative lack of development shows how critical a factor city size is (Hayes 1997).
The Lyon Part-Dieu TGV station, developed as part of the Part-Dieu urban neighborhood area, has been a great transportation and economic development success. Land values in the neighborhood increased as office demand rose 5.2% per year between 1983 and 1990 for a total growth of 43% (Haynes 1997, 70). Lyon Part-Dieu was able to attract firms from competing cities in the same region such as Grenoble and Geneve, and from other parts of Lyon (Rietveld 2001, 9). In the case of TGV Sud Est the literature (Rietveld 2001, 11-12; Willigers 2005, 5) indicates that the HSR service strengthened Lyon at the expense of other cities in the region. Further it developed a strong new CBD around Lyon Part-Dieu at the expense of stagnating growth in the adjacent old center.
Preston et al. (2006) pointed out Ashford, England's small size (pop. 110,000) and role as, “a medium sized market town, not a regional centre on a par with Cologne, Lille, Lyon or Seville” as the reason it gained little new development by virtue of it being on the Eurostar line (Preston, Larbie, and Wall 2006, 8). The opening of the final phase of HS1 and the new Ebbsfleet station has resulted in the loss of direct HSR service from Ashford to Brussels and the 50% reduction in service to Paris. Ironically Ashford is projected to benefit far more from the launch of domestic train service on HS1 linking it with London. This is because Ashford's economic links to London and rest of Southeast England are far more important than its links to Paris and Brussels. The importance in city size is shown by the contrast between the nearly immeasurably small impact Eurostar service has had on Kent, the effect the HS1 project had on the new London terminal station. Bringing Eurostar service to the refurbished St. Pancras station in London is estimated to have brought £10bn ($20.64 billion) in private investment into the local station area (Milmo 2007).
Knox (2006) theorizes that the introduction of HSR services leads a regional city's economy to shift from being a generalized local center to a specialized producer in certain domains in the national or international economy. A city needs to have a sufficiently large service economy and number of specialized service providing firms to truly take advantage of this change in economic relations that increased integration brings.Implications for Central ValleyAs shown by Table 2-2, the completed High Speed Rail network would put all Central Valley stations within an hour of Los Angeles, San Francisco, Sacramento, and/or San Jose. The two primary job centers of California, Los Angeles and San Francisco, would be within an hour or every San Joaquin Valley stop except Fresno. Bakersfield and Palmdale would both be within travel time necessary for long-range commuter service to Los Angeles. Palmdale is pushing to grow as a commuter destination and boost its local airport. There is a question however if downtown Bakersfield would develop as a regional economic center or become a bedroom community of commuter condos for people working in LA. For the Northern San Joaquin Valley stations of Stockton, Modesto, and Merced travel times are highly dependent on the ultimate route chosen between the Bay Area and San Joaquin Valley. The Pacheco Pass alignment would put all three stations within an hour of San Jose, and the Altamont
10 High Speed Rail and Population Distribution

Chapter 2: Existing Research on High Speed Rail's Effect on Population Distribution
alignment within an hour of San Francisco as well (Authority 2005a).
Table 2-2 HSR Express Train Travel TimesTravel Times Fresno Bakersfield Sacramento Los
AngelesSan
FranciscoSan Jose
Fresno - 0:35 0:53 1:19 1:15 12:45:00 AM
Bakersfield 0:35 - 1:25 0:47 1:47 1:17Sacramento 0:53 1:25 - 2:09 1:40 1:10Los Angeles 1:19 0:47 2:09 - 2:30 2:00San Francisco 1:15 1:47 1:40 2:30 - 0:30San Jose 0:45 1:17 1:10 2:00 0:30 -
Source: California High Speed Rail Authority Final EIR 2005,Table 2.6-1 p. 2-24
The Central Valley cities fall into two categories. The small population sizes and/or nearness to the Bay Area and Sacramento metropolitan areas suggests than Stockton, Modesto, Merced, and Palmdale would all develop as components of and as commuter feeders to those metropolitan areas. The Altamont outing of the CAHSR network could lead to the integration of the Bay Area and Sacramento into one large metropolitan area. Fresno and Bakersfield have the size and distance from Los Angeles than they may develop as independent regional centers. Fresno as the largest city and only one beyond and hour travel time from San Francisco or Los Angeles is the most likely to develop.
For Fresno and/or Bakersfield to take advantage of HSR service several conditions must be met. The cities must pro-actively plan for the development of the HSR station area. A positive growth climate must exist at the time regeneration activities are undertaken. Secondly the cities must have or attract the economic sectors that would take advantage of HSR service. This maybe a large challenge as neither Fresno nor Bakersfield are known as attractive places for knowledge economy firms, high end services, or tourism. This will make any regeneration efforts especially dependent on coordinated government actions to transform the local economy, as were undertaken in Lille, France.
Effect on residential location and commuting As previously mentioned, HSR services that provide a travel time of less than an hour to a major employment center can attract long-range commuters. The effect of HSR services on a labor market are two fold. First the service allows current residents of the cities to commute to the other city, eventually leading many of them to move to the city they work in. Second, residents who live and work in the same city may move to a more distant location they find more desirable that is now HSR accessible (Blum et al. 1997). Blum et al. (1997) calculates the economic benefit of HSR commuting by looking at the equilibrium between the communing costs and existing wage differences between different regions. Theypoint to the network of German cities connected by HSR lines as an example but only describes a theoretical, mathematical model rather than providing any real world case studies.
Examples of HSR commuting can be found in Spain, France, and Sweden, and internationally along the Eurostar and Thalys lines connecting London, Paris, and Brussels. The Svealand line in Sweden between Ekilstuna and Stockholm led to increased ridership by a factor of seven, and increased rail’s market share, from 6 percent to 30 percent (Froidh 2005). Similarly, the Spanish HSR service (AVE) from Seville to Madrid has seen the growth of substantial commuter ridership from Ciudad Real and Puertollano to Madrid on the AVE. This has led to an increase in through trains from Ciudad Real to Madrid from 18 in 1992 to 47 in 2005 (Preston 2006, 4). The effect of French HSR (TGV) commuting on land prices in Vendôme is disputed in the literature with some studies showing no effect and others
High Speed Rail and Population Distribution 11

Chapter 2: Existing Research on High Speed Rail's Effect on Population Distribution
showing a 30 percent increase in prices. An increase in commuting one or more days a week from Lyon and Le Mans to Paris has also been observed. Lille has become a bedroom community for workers commuting to Paris, Brussels, and London (Rietveld 2001). According to press reports English prefer to buy properties in the old town or near the station (Riley 2007; VEF 2007).Implications for Central ValleyThe proposed California HSR network will open up the majority of Central Valley station cities to the possibility of long-range HSR commuting. As discussed in the previous section, the smaller cities within an hours travel distance of Los Angeles or San Jose are the most likely to develop as commuter bedroom communities.
Factors increasing attractiveness of city centersSeveral authors note numerous positive direct and indirect impacts of HSR on the attractiveness of city centers it serves. First, the centers benefit most from increased accessibility offered by direct city center–to–city center travel. The presence of a new or renovated HSR station can also add an image premium to an office address (Willigers 2003). Both factors help city centers compete with airport locations which have benefited from the above factors associated with air travel. Another important factor is that new HSR infrastructure frees up track space on the conventional network for increased commuter and regional rail service. Because of the speed mismatch between commuter and express service, the freed capacity is disproportionate to the number of trips converted. This allows cities to increase commuter and regional services and hence their labor market size (Knox 2006).
A second aspect of business location is that those businesses that have customers and employees who travel via rail service place a far higher premium on accessibility to rail services than one would expect, based on the percentage of customers or employees using rail service (Willigers 2003). For example a firm where only 25% of the customers or employees use rail service would value a location near a rail station far higher than one next to freeway access. Willigers (2003) believes this is because travelers arriving by rail experience greater obstacles traveling a long distance from a station, than customers arriving by auto experience traveling traveling a long distance from the nearest off-ramp. Therefore, firms that have a sizable minority of customers and/or employees using rail service will prioritize rail access in their locational decisions over auto access, even if most customers and/or employees use autos. This in turn, means that an increase in the percentage of customer contacts and/or employees that use rail service to access a business will have a disproportionate effect on increasing the attractiveness of a station area locations for that company.
A third important aspect of HSR services is the effect that they can have on the local transportation network. Harman notes that of the twenty tram/light-rail systems outside of Paris, most built in the last ten years, eighteen are in cities with regular TGV service. Likewise ICE station cities have a tramway, regional rail system (Schnellbahn), or both (Harman 2006, 19). The concentrated travel demand and inner city location of most HSR stations and the subsequent need for high quality and capacity transport connecting across the city are seen as a major impetus to the creation or expansion of local rail service. This in turn increases the accessibility and attractiveness of the city center.Implications for Central ValleyIncreasing the attractiveness of Central Valley city centers may be one of the most profound impacts the CA HSR will have on the Central Valley. The travel to work market of the Central Valley is currently dominated by drive alone to work (Bureau 2003). This auto dominated system means city centers are relatively disadvantaged as auto mobility creates a relatively flat accessibility gradient compared to the concentrated accessibility nodes created by transit or walking. This leaves city centers without an accessibility advantages over other locations and unable to create a sufficient density of employment destinations to create positive agglomeration effects without negatively impacting (auto) accessibility. CA HSR stations will create points of very high intercity accessibility that, if located in city centers, will create accessibility and image advantages for those centers (Willigers 2003). Additionally, if the concentrated travel demands created by the HSR stations and downtown development leads cities to
12 High Speed Rail and Population Distribution

Chapter 2: Existing Research on High Speed Rail's Effect on Population Distribution
reintroduce tram service, as has happened in France (Harman 2006, 19), it will have substantial impacts on the accessibility and development potential of city centers.
In the debate over the California HSR bond initiative it was argued that California is not ready for HSR because the local transit networks are not as developed as in western Europe or East Asia. However the experience of many smaller TGV cities in France was that TGV service preceded, and may have precipitated, local tramway service. The Central Valley cities of Fresno and Bakersfield had tram/service service in the past and have had official discussions regarding rebuilding a tram/streetcar or light rail network. It is likely that the construction of downtown HSR stations in both cities would increase local efforts to reintroduce local rail transit.
Greenfield HSR sitesThe history of greenfield HSR development in France is one of failure. The TGV Sud Est from Paris to Lyon, and the surrounding Rhone-Alps region, was the first European HSR project beginning service in 1981 (Illustration 2-1). It directly connects Paris and Lyon, the first and second largest metropolitan areas in France. HSR services also branch off the line to serve additional locations such as Dijon, Grenoble, and Geneva. The line included three new stations: Le-Creusot, Mâcon-Loché, and Lyon Part-Dieu. The first two stations are greenfield stations located outside of the respective towns. The third is the new main rail station for Lyon. The stations at Le-Creusot (population 26,283) and Mâcon-Loché (pop. 34,469) are what Bertolini refers to as an “exurban 'desert station', with nominal TGV frequencies and poor connections to both the local transportation networks and economic activity centres” (Bertolini 1998, 167-8). Both stations are basic platforms and park and ride lots, with a shuttle train connection to the regional rail system. Little to no development has occurred at these stations despite over 20 years of TGV service (Givoni 2006, 605; Haynes 1997, 70). Similarly, the TGV-Picardie station built as part of the TGV Nord line in 1993 has attracted no development around it, and its nickname of the “beet field” station still applies as it is still surrounded by agricultural fields 14 years later.3 Sands' review of greenfield Shinkasen stations in Japan showed that the station areas only developed into new urban centers after subway service was extended to the station (Sands 1993). This is a situation unlikely to ever occur in the United States as only a handful of the largest cities in the country have subway systems.
Implications for Central ValleyThe implications for the Central Valley are very important. If California's experience is like that of France, greenfield stations would not spur office or residential development but remain largely ignored. Greenfield stations outside of Central Valley cities would probably result in no development benefits for those cities and poor ridership from such stations. Stations would be much better placed in existing downtowns where city regeneration effect would be most effective (Harman 2006).
Upon further reflection the reasons for the failure of greenfield development are rather clear. The economic sectors most attracted to HSR (information economy, specialized services, hotels, and specialized retail) are all attracted to city center locations. A greenfield site offers none of the proximity
3 As verified by the author through Google Earth satellite imagery on 16 Dec. 2007.
High Speed Rail and Population Distribution 13
Illustration 2-1: TGV Sud-Est map
Source: TGVweb – http://www.trainweb.org/tgvpages/map.html
Chapter 2: Existing Research on High Speed Rail's Effect on Population Distribution
benefits or amenities such sectors look for. Ex-urban office parks and sprawl developments are based on complete automobile-dependence, hence there is little incentive for them to locate next to a rail station.
One crucial difference between the CAHSR proposal and the TGV is that a commuter service overlay is explicitly planned for the CA network whereas the TGV service has not had services designed for commuters. This does open up the possibility that greenfield stations could be used as park-and-ride stations. Therefore the sprawl inducing effect of HSR stations would be directly tied to the amount of subsidized parking provided at stations for commuters.
HSR as a city regeneration toolHSR services have been an integral part of several successful city regeneration efforts. As mentioned above, the Lyon Part-Dieu station area dominated the market for new office space and hotels in the decades after TGV service began extending the center. It further cemented Lyon's position as the dominant regional center of the Rhones-Alps region (shown in Illustration 2-1 above) (Rietveld 2001, 11-12). Grenoble and Dijon were able to develop their stations areas as well but were not able to attract development from the surrounding region or Paris (Willigers 2005, 5). Lille, France on the Paris – London branch of the TGV Nord line is another example of successful city regeneration created in part by the introduction of HSR service. The Lille-Europe station and adjacent business park, retail center (Eurolille), hotels, public housing, and conference center have successfully redeveloped a former military base and extended the city center (Harman 2006, 12). The regeneration of the region has also extended to the nearby towns of Roubaix (Euroteleport) and Tourcoing. Harman remarks on the importance of municipal and regional planning in these outcomes:
The selection of the location for the high-speed line station is critical. It must bedeveloped in line with a master plan, one that fits high-speed rail into the strategy for the city as a whole. The station location has to fit with the city strategy. The opportunity for regenerating rundown and disused areas may include railway land and redundant industrial areas (Harman 2006, 12).
Vickerman (1997, 36) concurs with the need for regional planning, but also hypothesizes that the European HSR network will increase the concentration of economic activity in Europe’s major metropolitan areas, rather than assist regional cities connected to the networks. Implications for Central ValleyThe placement of stations for the CA HSR network will be critical for Central Valley cities. The larger cities: Sacramento, Fresno, Bakersfield, and Stockton, have the most to gain economically. The cities and their county and regional planning agencies should engage with the California Authority in planning the placement of each station, as well as upgrades to, and planning for development in the surrounding area.
Ability of HSR to create co-cities that act as one marketBecause of its ability to provide for rapid intercity trips, several researchers theorize that in the right conditions HSR service can unify the labor markets of several close by cities to act as a single city. Blum et al. (1997) theorized that several medium-sized cities if connected to each other by HSR service at approximately 20 to 40 minutes travel time could gain the market agglomeration benefits of a single large city. A more concrete application of this idea was put forward by Knox (2006) in his evaluation of the potential economic impact of HSR service on cities north of London. He puts forward Manchester – Leeds and Glasgow – Edinburgh as potential co-cities that could integrate their economies through HSR connections.Implications for Central ValleyThe potential for development of co-cities in the Central Valley seems low. The two largest cities, Fresno and Bakersfield are approximately 105 miles apart, 35 minutes travel time. The city pairs of Stockton – Modesto and Modesto – Merced are the closest at approximately 27 and 37 miles apart,
14 High Speed Rail and Population Distribution

Chapter 2: Existing Research on High Speed Rail's Effect on Population Distribution
respectively. However, both pairs seem too small and close to the larger Bay Area metropolitan area to form a distinct co-city.
Impact of HSR on overall growth ratesThe existing research does not claim that HSR services affect the overall growth rates for an entire region. Reviewing the extensive history of the Japanese Shinkasen HSR networks Sands (1993) found a correlation between cities served by HSR and higher growth rates. This was true comparing both with and without access to new expressways, though the highest growth rates were for areas that received both HSR service and an expressway. The data was not able to show whether the relationship was causal, or HSR had been planned to run through high growth areas. Preston, Larbie, and Wall's case study on Ashford, Britain along the Eurostar line also showed higher growth rates than the overall region, but not high enough to be statistically significant (Preston 2006). Using economic modeling Knox showed that theoretically HSR systems should have a slight effect on growth rates, and reviewed cases showing similar results (Knox 2006). These included comparing station and non-station cities in the Tokaido core area (Tokyo – Nagoya – Osaka) in Japan and the location of Lyon, Nantes, and Le Man in France.
Implications for Central ValleyThe California Central Valley is predicted to have a higher population growth rate than California as a whole over the next thirty years. As such the biggest question being studied by regional metropolitan Planning organization and organizations such and the Great Valley Center is how to accommodate expected growth, not how to increase or decrease future growth rates. Concerns about HSR causing sprawl then should focus on how HSR service will affect growth patterns, not overall growth rates.
ConclusionA review of the existing literature tends to support the author's hypothesis that the effect of HSR services in other countries has been that new growth in outlying metropolitan areas is redirected towards the station area and those areas within easy access of the high speed rail station; and that the addition of a HSR stations to secondary cities changes the location and urban form of growth by redirecting growth from the outer edges of the city and other parts of the metro region towards the area around the station. A review of the existing literature also shows the need for additional research examining the effect of HSR on urban development patterns. Far more studies and data have been collected about the transportation effects of HSR than the urban development effects. Further the literature shows a large bias towards pre-construction modeling rather than post-facto evaluation of HSR’s development impacts. Most studies of post-facto development also provide little to no documentation of their data sets or sources. The available data however tends to point that HSR services benefit large and medium cities rather than small intermediate ones. Further, auto-dependent green field stations have been an absolute development failure in France and Japan (when a subway is extended to the station it becomes a TOD not a greenfield “Edge City”). The effect of HSR commuting on development patterns is still unclear. Whereas press reports suggest the trend is to boost prices in the centers and station area of commuter cities, no in-depth analysis of the effect of HSR on residential growth has been conducted.
High Speed Rail and Population Distribution 15

16 High Speed Rail and Population Distribution
Chapter 3: California High Speed Rail Proposal
Chapter 3: California High Speed Rail Proposal
OverviewThis chapter will examine the proposed California High System Rail (CAHSR) system focusing on the Central Valley portion of the network. It will place the California proposal in the context of HSR in the united States. Alignments and stations locations will be examined for their suitability and potential for development.
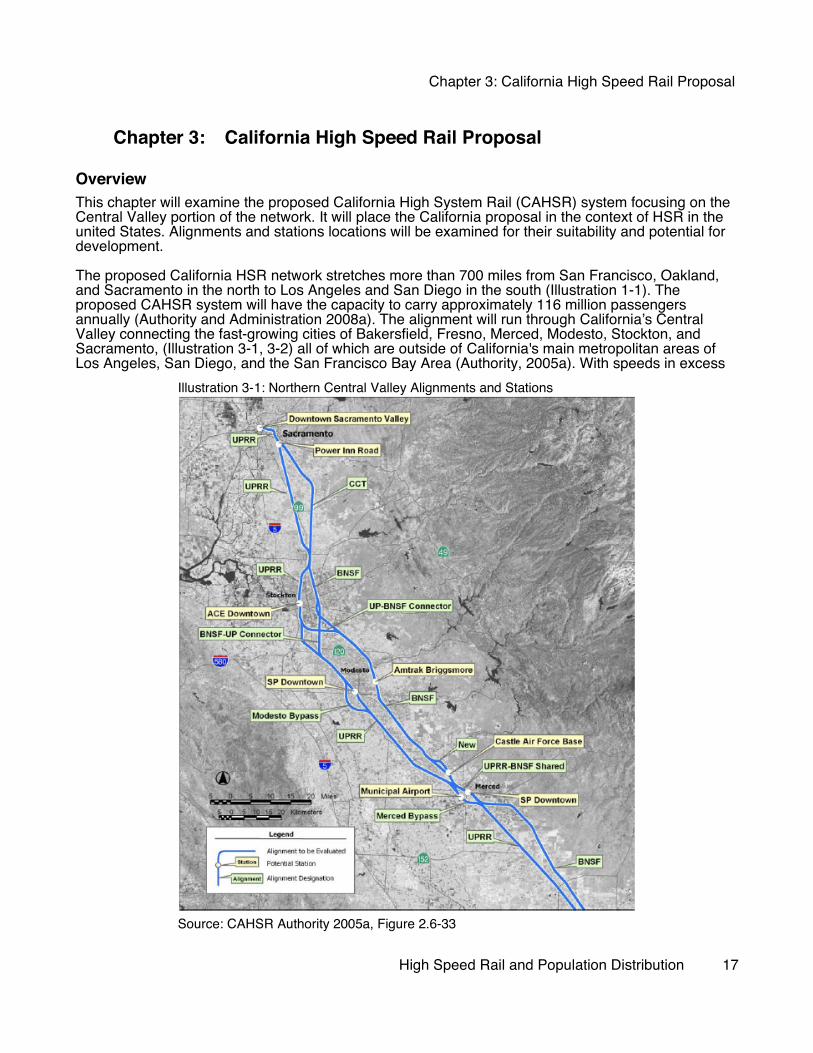
The proposed California HSR network stretches more than 700 miles from San Francisco, Oakland, and Sacramento in the north to Los Angeles and San Diego in the south (Illustration 1-1). The proposed CAHSR system will have the capacity to carry approximately 116 million passengers annually (Authority and Administration 2008a). The alignment will run through California’s Central Valley connecting the fast-growing cities of Bakersfield, Fresno, Merced, Modesto, Stockton, and Sacramento, (Illustration 3-1, 3-2) all of which are outside of California's main metropolitan areas of Los Angeles, San Diego, and the San Francisco Bay Area (Authority, 2005a). With speeds in excess
High Speed Rail and Population Distribution 17
Illustration 3-1: Northern Central Valley Alignments and Stations
Source: CAHSR Authority 2005a, Figure 2.6-33

Chapter 3: California High Speed Rail Proposal
of 200mph, the travel time from San Francisco to Los Angeles is estimated at approximately 2.5 hours and the network would carry between 87 million and 119 million intercity passengers annually by 2030 (Systematics et al. 2007).4 The HSR network, if considered as one project, would be the largest public works project in California's history.
Proposed Alignments There are two possible alignments for the CA HSR network in the Central Valley which would impact the location of stations. The track alignment and station locations for most of the system were decided in 2005 when the program-level environmental studies were completed. The alignment between the San Francisco Bay Area and the Central Valley will go from Merced to San Jose through the Pacheco Pass, although the litigation regarding that decision is still ongoing.
4 The California HSR Authority has developed different ridership scenarios based on changes in factors such as fuel cost or increased travel time due to congestion on roads and at airports. The base case is 87 million passengers on HSR with ridership estimates as high as 119 million by 2030.
18 High Speed Rail and Population Distribution
Illustration 3-2: Southern Central Valley Alignments and Stations
Source: CAHSR Authority 2005a, Figure 2.6-32

Chapter 3: California High Speed Rail Proposal
As seen in illustrations 3-1 and 3-2, the CA HSR network will be built along a combination of two existing freight rail alignments through the Central Valley (Authority and Administration 2005a). From Sacramento the line will parallel Union Pacific (UP) Railroad alignment to downtown Stockton. From there two alignments are possible depending on which route is taken into the San Francisco Bay Area. If the Altamont Pass route is taken the HSR line will continue to parallel the UP line to downtown Modesto. If the Pacheco Pass route into the Bay Area is chosen the line will switch south of Stockton to parallel the BNSF railroad line. While the route through the Central Valley is often referred to as the “route 99 corridor” the HSR route would generally not run parallel to in the right-of-way of state route 99. Route 99 follows the UP line through most of the Central Valley while the HSR would use the BNSF line right-of-way. North of Fresno the BNSF alignment runs east of route 99 and west of it between Fresno and Bakersfield. It is preferred over the UP alignment because it goes less through developed urban areas, would has less construction issues, and costs hundreds of millions less (CAHSR Authority 2005a, 6A-13-17).
Proposed Station AreasThe HSR network will have six stations in the Central Valley. Of these at least four of these will be located in city center locations: Sacramento, Stockton, Fresno, and Bakersfield. The other two locations, Modesto and Merced, may be located in city center locations or peripheral/green field locations depending on future studies and the selection of which alignment, UP or BNSF, to use in the Central Valley.
Table 3-1 Potential CA HSR Station LocationsCity Name of Station Center/ Periphery/ Greenfield Final Location?
Sacramento Sacramento Valley (Downtown) Center Yes, FinalSacramento Power Inn Road Periphery No, DroppedStockton ACE (Downtown) Center Yes, FinalModesto Southern Pacific (Downtown) Center No, PreferredModesto Amtrak Briggsmore Greenfield/Periphery No, PotentialMerced Southern Pacific/UPRR (Downtown) Center No, PreferredMerced Castle AFB Periphery No, PotentialMerced Municipal Airport Periphery/ Greenfield No, PotentialFresno Downtown Center Yes, FinalVisalia* Visalia Airport Greenfield No, PotentialHanford* Downtown Village No, PotentialBakersfield Truxton (Downtown) Center Yes, FinalBakersfield Golden State Periphery No, DroppedBakersfield Bakersfield Airport Greenfield No, Dropped
* The CA HSR Authority has not made a final determination if a stop will be constructed or not between Fresno and Bakersfield
High Speed Rail and Population Distribution 19

Chapter 3: California High Speed Rail Proposal
SacramentoThe Sacramento HSR station would be located at the current Amtrak station at the edge of the existing central business district (CAHSR Authority 2005a). Several factors were used in selecting downtown as the preferred location. The station location would maximize connectivity by tying in regional and local transit. It is the hub for regional and inter-state rail routes and already connected to the local light rail and bus networks. The station is also within walking distance of the existing downtown central business district. All of these elements maximize the ridership potential of the site. The downtown site was also the preferred site of both the City of Sacramento and the Sacramento Council of Governments. Alternate site at Power Inn Road several miles southeast of the city center was found feasible but dropped as inferior to the downtown site.
Since 2004 the wisdom of selecting the downtown site has been demonstrated by the creation of the “Railyards” redevelopment plan. The City of Sacramento has created a specific plan and signed a development agreement with a master developer to redevelop the adjacent rail shops and yards as a massive infill transit-oriented development, the “Railyards.” The rail lines will be realigned and the historic rail station moved to become part of an expanded rail station serving Amtrak, HSR, commuter rail, and light rail service. The master developer, Thomas Enterprises, calls the proposed development “an urban, mixed-use, transit oriented community on 240 acres; an area as large as the existing
20 High Speed Rail and Population Distribution
Illustration 3-3: Sacramento station site and "Railyards" development zoning
Source: Thomas Enterprises (http://retail.thomasent.com/railyards/downloads.html)
Chapter 3: California High Speed Rail Proposal
downtown central business district" (Enterprises 2008). It offers the possibility of adding enough residents, destinations, and access options to give Sacramento's downtown the critical mass it needs to regenerate and thrive. The 2006-2009 real estate crash that the Central Valley is currently experiencing may put some of the plans on hold. The addition of HSR service to the Sacramento station would provide an additional value add that would improve the viability of transit-oriented development at the “Railyards.”
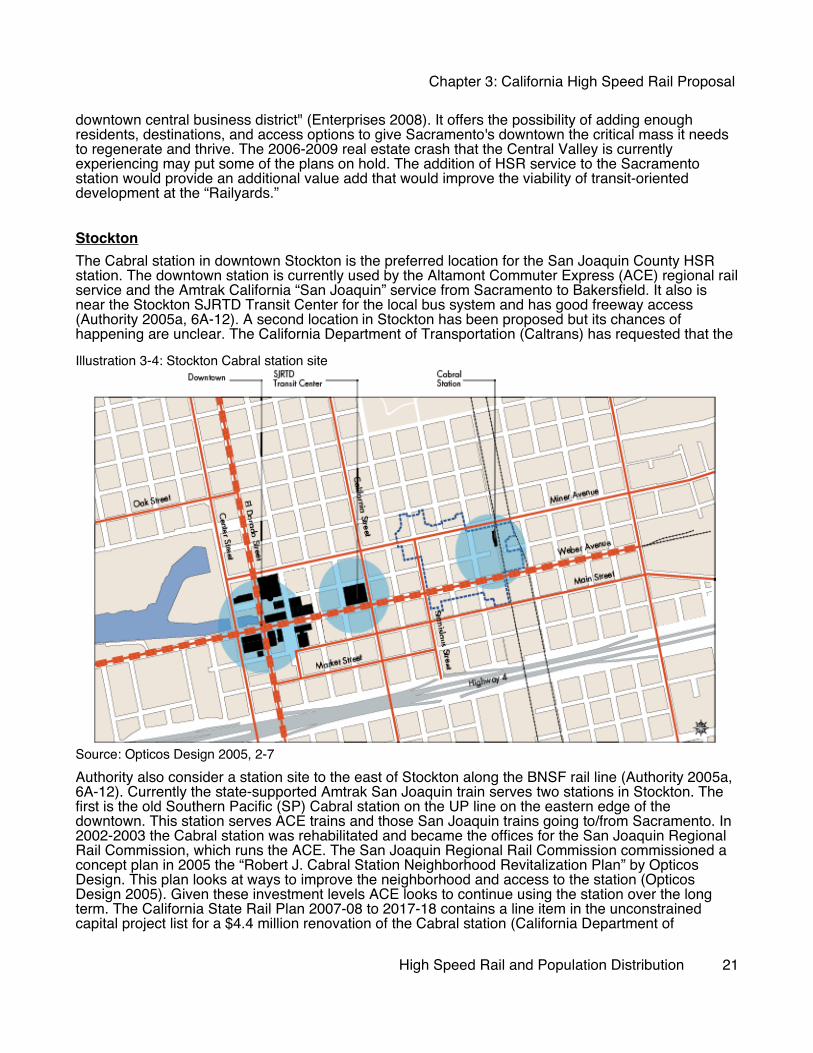
StocktonThe Cabral station in downtown Stockton is the preferred location for the San Joaquin County HSR station. The downtown station is currently used by the Altamont Commuter Express (ACE) regional rail service and the Amtrak California “San Joaquin” service from Sacramento to Bakersfield. It also is near the Stockton SJRTD Transit Center for the local bus system and has good freeway access (Authority 2005a, 6A-12). A second location in Stockton has been proposed but its chances of happening are unclear. The California Department of Transportation (Caltrans) has requested that the
Authority also consider a station site to the east of Stockton along the BNSF rail line (Authority 2005a, 6A-12). Currently the state-supported Amtrak San Joaquin train serves two stations in Stockton. The first is the old Southern Pacific (SP) Cabral station on the UP line on the eastern edge of the downtown. This station serves ACE trains and those San Joaquin trains going to/from Sacramento. In 2002-2003 the Cabral station was rehabilitated and became the offices for the San Joaquin Regional Rail Commission, which runs the ACE. The San Joaquin Regional Rail Commission commissioned a concept plan in 2005 the “Robert J. Cabral Station Neighborhood Revitalization Plan” by Opticos Design. This plan looks at ways to improve the neighborhood and access to the station (Opticos Design 2005). Given these investment levels ACE looks to continue using the station over the long term. The California State Rail Plan 2007-08 to 2017-18 contains a line item in the unconstrained capital project list for a $4.4 million renovation of the Cabral station (California Department of
High Speed Rail and Population Distribution 21
Illustration 3-4: Stockton Cabral station site
Source: Opticos Design 2005, 2-7

Chapter 3: California High Speed Rail Proposal
Transportation 2007, 22). The first phase of the revitalization project was undertaken in the 2007/8 budget year (California Department of Transportation 2007, 161).
The second Stockton train station is on the BNSF line south of the downtown and serves San Joaquin trains going to/from Oakland. Caltrans, the manager for the San Joaquin service, was investigating moving the all San Joaquin trains out of the current two stations to a new station on the BNSF line (Authority 2005a, 6A-12). The California State Rail Plan 2007-08 to 2017-18 contains a $7.5 million line items in the unconstrained capital project list for the design and construction of a new station.
Of the two potential stations the downtown ACE station is clearly the superior location for capturing the economic development benefits of a HSR service. It is located at the edge of the city center and within walking distance of many destinations. The surrounding area is also composed of 300 foot by 300 foot blocks ideal for creating a highly walkable urban district (Opticos Design 2005, 2-1 – 2-7). An edge of city center location was an important component of the success of HSR station placements in Lyon, Lille, and Nantes. A new San Joaquin station on the BNSF line east of the BNSF/UP line intersection would be at least a mile and a half from the downtown and separated from it by highway 4. Such as location would be a completely separate destination and would not gain and synergies from its integration into and interaction with the existing downtown. As of 2008, it appears that the CAHSR Authority is only considering the downtown Cabral/ACE station (Authority and Administration 2008a).
Modesto Two possible station locations are being considered for Modesto, one downtown on the UP line and one at the Amtrak Briggsmore station at the eastern edge of Modesto (Illustration 3-5). The 2005 Environmental Impact Report (EIR) selected the Briggsmore station as the preferred location but the subsequent process for selecting the preferred route into the San Francisco Bay Area reopened the question. If the Altamont alignment was chosen, the UP line would be used through the Central Valley. However if the Pacheco Pass route was chosen the BNSF right-of-way would be used. If a hybrid or dual route is chosen it is unclear which right-of-way would be used for the Merced to Stockton HSR line. The Final Bay Area to Central Valley High-Speed Train (HST) Program Environmental Impact Report/Environmental Impact Statement (EIR/EIS) identifies the downtown Modesto site as the preferred alternative using the Union Pacific RR alignment but did not completely rule out other alignments or sites (CAHSR Authority 2008a, S-22).
The Amtrak Briggsmore location is a peripheral and partially greenfield location on the eastern edge of Modesto. The land to the east of the station is undeveloped farmland. Many of the parcels to the west of the station are vacant with others containing low intensity
22 High Speed Rail and Population Distribution
Illustration 3-5: Amtrak Briggsmore site
Source: CAHSR Authority 2005a, Modesto Briggsmore Fact Sheet

Chapter 3: California High Speed Rail Proposal
development such as light industry. Single-family housing developments are to the south and southwest of the site.5 The small size of Modesto's existing city center and the over 4 mile distance between it and the Briggsmore station would probably would not gain synergies from its integration into and interaction with the existing downtown. A potential benefit of the Briggsmore location is that is would provide a transfer location between CA HSR and any San Joaquin train service that continues after HSR service is extended to Sacramento.
The undeveloped area to the west of the BNSF line and north of Briggsmore Avenue is covered by the Village One Specific Plan:
The Village One Specific Plan provides for the development of the City’s first Urban Village, a pedestrian-oriented, mixed-use planned community on approximately 1,784 net acres (1,840 gross acres) of land comprised of about 170 parcels in the northeastern portion of Modesto’s Urban Area. Village One will include 7,000-8,000 housing units, a 40-acre Village center, four joint school/park sites and a 220-acre Business Park (Modesto 2007, I-1).
5 Based on author's first hand observations in the 2001 confirmed with Google Earth satellite photo analysis in January 2008.
High Speed Rail and Population Distribution 23
Illustration 3-6: Modesto Village One - Land Use Plan
Source: Modesto 2007, II-50, Figure II-1
Station

Chapter 3: California High Speed Rail Proposal
The researcher finds that the plan, while embracing some neo-traditional development ideas, tends to completely ignore the potential of the Amtrak site as a transit-based node and anchor for new development. The first half mile area immediately west of the station is zoned as “Industrial/Business park” with a maximum floor Area ratio of 0.25 and an outright ban on residential (Modesto 2007, II-2). Such zoning destroys the value of the land by legally foreclosing any possibility of transit-oriented development. This ensures that exclusively auto-dependent uses that ignore the HSR station are the only allowed uses. Even if a central business district (CBD) style high density walkable office with retail were to become economically feasible, it would still be limited by the 0.25 FAR ratio, whereas a FAR of 4.0 or higher would be necessary for a CBD. Such a zoning is inappropriate for a TOD near an intercity rail, and future commuter rail, station. It would be wildly inappropriate for the area surrounding a HSR station.
The “Village Center” mixed use commercial district for Village One is both far too small and distant from the train station. Only 50 units are planned for mixed use buildings at Village Center. The “Multi-Family Residential” zones of the Village Center will be medium low density at only 26.25 dwelling units per gross acre. Such densities are one quarter of what is recommended to create a lively self-sustaining urban neighborhood (Jacobs 1961, 211). The specific plan's proposal of 8,000 units spread over 1,784 net acres comes out to approximately 4.48 units per acre. How anything mixed-use or pedestrian-oriented could be created at such an extremely low density is questionable. The center is located in the middle of the plan area, approximately a mile and a half from the Amtrak station. This distance is made even longer by the poor connections provided by the proposed street network.
24 High Speed Rail and Population Distribution
Illustration 3-7: Modesto Village One Circulation Diagram
Source: Modesto 2007, II-51, Figure II-2
Station

Chapter 3: California High Speed Rail Proposal
The Village One street network is not designed to provide a good, direct connection to the Amtrak station or to create a high-quality urban streetscape. The proposed street network provides no direct route between the station and the Village Center either (Modesto 2007, II-51). Rather than a direct boulevard running west northwest from the station to the center people coming from the station must travel south along an access road to an auto-only expressway running west, then use a combination of auto-only expressways and arterials to reach the center. The design of proposed expressways and arterial roadways is very auto-oriented and not conducive to walking, bicycling, or to creating quality streetscape. Instead of urban boulevards that would allow high traffic volume and quality streetscapes the expressways are designs based on an auto-only highway model (Modesto 2007, II-52-53).The profiles and designs of many minor arterial, collector, and residential street is better, in general conformance with current best practice (Modesto 2007, II-55-64). Finally the overall specific plan does not include any provision for the funding of local transit improvements or services. Other infrastructure
systems, such as sewer and roads, have specific capital plans for the construction and operation (Modesto 2007). Future transit service is expected to use space on the street network but no concrete funding source provide for transit. No development fees are planned to pay for the capital cost, nor is an improvement district or homeowners' fee planned to fund the operation of a local transit system for the neighborhoods in the plan area. Given the very low density of the development and the lack of dedicated funds, a travel of last resort system with low frequencies is the likeliest outcome. Overall the Village One plans might be appropriate for the periphery of an ex-urban commute town, but not at all for HSR station neighborhood.
The Modesto SP Downtown site is the location of the historic Southern Pacific station, now the Modesto Transport Center (Illustration 3-8 ). It is highly rated for potential ridership and connectivity and accessibility (Authority 2005a, 2-61). One downside of the site is that it would require an express loop around the site because of limited right-of-way. The loop would go to the west of the city. The loop would add to the construction cost of the station. The advantages of the down site include the ability to regenerate the existing downtown and location at the hub of the existing transit system.
MercedThe three potential station sites selected by the Authority in Merced include one in Downtown and two at the former Castle Air Force Base. The Downtown station would be on the site of the historic Southern Pacific station and current Merced bus transportation center. The quarter mile area north and east of the station contains the downtown commercial area and a number of now vacant parcels, providing opportunities for transit-oriented development. An eighth of a mile southwest of the proposed station site is Highway 99, a barrier cutting off opportunities for transit-oriented development further south of the station.
High Speed Rail and Population Distribution 25
Illustration 3-8: Downtown Modesto site
Source: CAHSR Authority 2005a, Modesto Downtown Fact Sheet

Chapter 3: California High Speed Rail Proposal
Like the downtown Modesto station, the proposed downtown location is the former Southern Pacific Depot and current transit center for the local bus system (Illustration 3-9). Several lots in the surrounding area are civil buildings and several are vacant. The area north of the station contains a mix of commercial, residential, office and governmental development. Industrial uses are prevalent southeast of the station. Highway 99 is located south of the station on a berm, isolating the area south of the highway from the station (Authority 2005c, 1).
The proposed Castle Airport station would be on a greenfield location that is currently farmland (Authority 2005a, figure S-6). Under the Atwater General Plan the station area is designated as Business Park (Atwater 2000, 2-15). The FAR for Business Park is 0.40 similar to, but slightly higher than, Modesto's Village One plan (Atwater 2000, 2-13). Like the greenfield Modesto Briggsmore location, the current and proposed zoning and street network at the Castle Airport is highly inappropriate for a successful HSR station. The authority is only planning platforms and a 200+ space parking surface lot. If the French experience is at all predictive the station will attract no HSR-oriented development around it.
FresnoThe Authority has selected the Downtown Fresno site as the only station location to be further studied. The City of Fresno has officially supported the HSR project and the proposed location of the HSR station since December 2001. The Fresno 2025 General Plan, adopted Feb. 1 2002, contains three policies regarding HSR (Fresno 2002, 74-78):
E-7-c. Policy Pursuant to Resolution of the City Council of December 18, 2001, support the planning and construction of a High Speed Rail Transit System in the San Joaquin Valley, utilizing the Union Pacific Railroad alignment, which would directly connect the major population centers within the valley and including a station stop in downtown Fresno.
E-7-d. Policy Support the development of a multimodal transportation terminal facility in, or close proximity to, the Central Area.
E-9-aa. Policy Support the proposed California High Speed Rail corridor in the vicinity of the Union Pacific Railroad corridor connecting Los Angeles and the San Francisco Bay Area.
Two important, and connected, aspects of HSR for Fresno are returning passenger rail service to the Central Business District and consolidation of the two rail lines through the city. Fresno is working with HSR to jointly fund and implement the rail consolidation project. The Authority has created several visualizations of grade separation alternatives and the downtown station site (Illustration 3-10).
26 High Speed Rail and Population Distribution
Illustration 3-9: Merced downtown station site
Source: CAHSR Authority 2005a, Merced Downtown Fact Sheet

Chapter 3: California High Speed Rail Proposal
Fresno offers one of the most promising sites for transit-oriented development in the Central Valley. The Fresno CBD contains a set of high rises from the height of downtown development in the 1920s. The district has struggled since the Great Depression and loss of the region's streetcar network in the 1930s. Fresno's size and optimum travel time to/from the state metro area may give it the highest HSR-related development potential of any San Joaquin Valley city. Fresno has over 400,000 residents and the surrounding metropolitan area has a population of over a million. The area is also within the 1+ to 2.5 hour optimum HSR travel time range from most of California's major metropolitan areas:
• Los Angeles (1:19)• San Francisco (1:15)• San Diego (2:17)
Two smaller urban center are just within an hour by rail: • San Jose (0:46)• Sacramento (0:53) (CAHSR Authority 2005a)
The smaller size San Jose's and Sacramento's central business districts and the over forty minute travel times make it unlikely that HSR will turn Fresno into a primary bedroom community of either. Instead Fresno's central business district (CBD) will become dramatically more connected to both Southern and Northern California business centers, markets, customers, and airports.
Planning and preparatory efforts for transit oriented development at the downtown train station has been complicated because Amtrak San Joaquin's train currently serves the old Santa Fe train station, located three quarters of a mile northeast of the location of the proposed HSR station. The Santa Fe station was only restored and reopened in 2005. Transit-oriented development around it has been hampered by uncertainty as to whether rail service would remain there or be relocated to the downtown station.
BakersfieldThe city of Bakersfield opened a new Amtrak station in 2000 in the downtown. It is within a half mile of significant downtown destinations such as the convention center, stadium, City Hall, and the vast
High Speed Rail and Population Distribution 27
Illustration 3-10: Downtown Fresno station site visualization
Source: Newlands & Company - http://www.nc3d.com/downloads/stills/37.html

Chapter 3: California High Speed Rail Proposal
majority of downtown Bakersfield. The city of Bakersfield and Kern (County) Council of Governments jointly decided to select the downtown Amtrak station as the preferred site for a new HSR station (Bakersfield 2006, 13). No alternate sites are under consideration any longer. The Authority in selecting the site determined that it had the greatest potential for transit-orient development:
The Truxtun station option in downtown Bakersfield is the preferred HST station option to serve Kern County (see Figure 6.3-4B). The Truxtun HST station would have the highest connectivity and would connect to the new Bakersfield Amtrak Station and has good access to SR-99. The Truxtun site is in the city center of Bakersfield and is within walking distance the convention center and City Hall. This multi-modal station site would have the greatest potential for promoting transit-oriented development around the HST station and infill development within downtown Bakersfield. The City of Bakersfield, Kern County, Kern County COG, and the Kern County Transportation Foundation for HST service for Kern County prefer this station option (CAHSR Authority 2005a).
Since the Amtrak station was opened in 2000 no specific plans have been developed for transit-oriented development in the station area. A review of the current Bakersfield General Plan shows only one policy regarding the HSR, that local agencies agree on the station location (Bakersfield 2002, III-21-22). The circulation element focuses on high-speed limited access arterials and high levels of service that preclude good TOD, although the downtown is somewhat exempted from some policies (Bakersfield 2002, III-13-17). The City of Bakerfield is currently undergoing a general plan update process holding a series of public outreach and comment events in 2008 (PMC 2008). This will give the city the chance to adopt new policies to reflect and take advantage of the selection of the HSR station site, and passage of the California HSR bond in November 2008.
Projected Services, Travel Times, and Ridership
Projected Service LevelsThe CAHSR conceptual service plan calls for 172 total round trips a day at network build out. Of those, 64 round trips a day would be between Northern California and Southern California and 22 roundtrips a day would connect the Central Valley to either Northern California or Southern California. Finally, 20 roundtrips would provide commuter service. Hours of operation would be between 6 am and 8pm. The daily number and types of trains operated would be:
• Express (20 trains per day): Trains running between Sacramento, San Jose, or San Francisco and Los Angeles or San Diego without intermediate stops.
• Semi-Express (12 trains per day): Trains running between Sacramento, San Jose, or San Francisco and Los Angeles and San Diego with intermediate stops at major Central Valley cities such as Modesto, Fresno, and Bakersfield.
• Suburban-Express (20 trains per day): Trains running between northern and southern California and locally within the major metropolitan areas (i.e., the San Francisco Bay Area and the Los Angeles area) at the beginning and end of the trip without intermediate stops in the Central Valley.
28 High Speed Rail and Population Distribution
Illustration 3-11: Bakersfield station site
Source: Results of search on term "Bakersfield CA" in www.google.com/maps (April 15, 2009)
Station
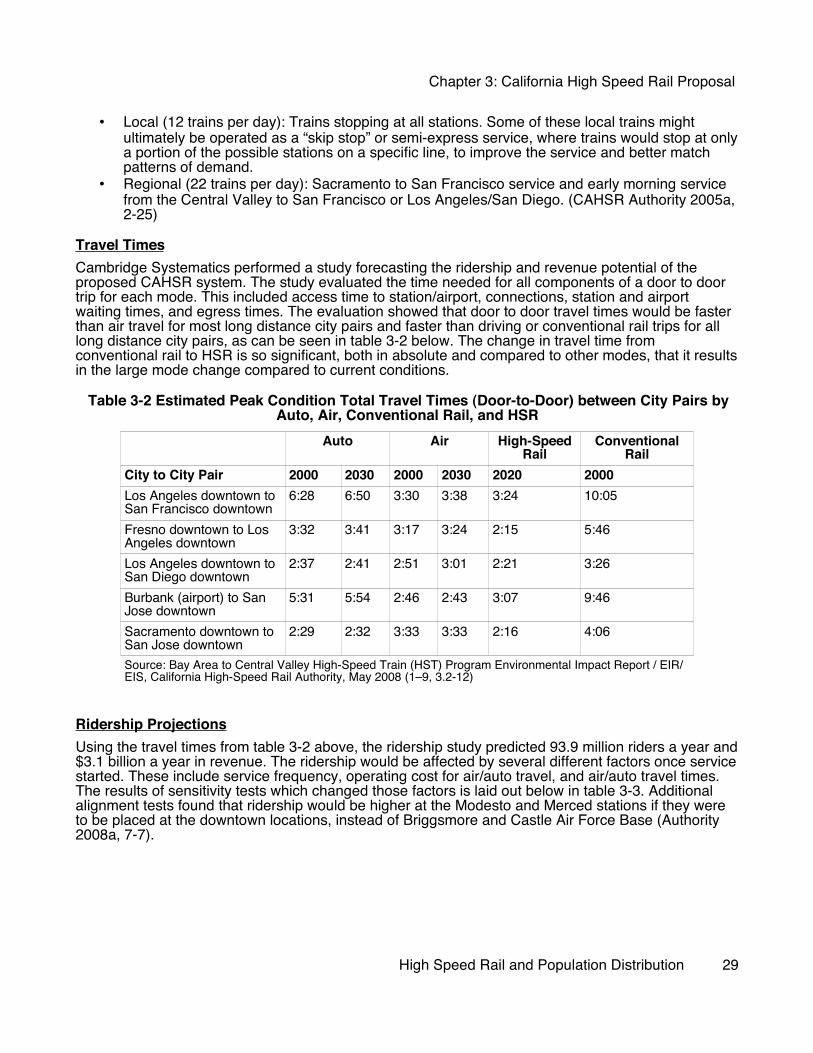
Chapter 3: California High Speed Rail Proposal
• Local (12 trains per day): Trains stopping at all stations. Some of these local trains might ultimately be operated as a “skip stop” or semi-express service, where trains would stop at only a portion of the possible stations on a specific line, to improve the service and better match patterns of demand.
• Regional (22 trains per day): Sacramento to San Francisco service and early morning service from the Central Valley to San Francisco or Los Angeles/San Diego. (CAHSR Authority 2005a, 2-25)
Travel TimesCambridge Systematics performed a study forecasting the ridership and revenue potential of the proposed CAHSR system. The study evaluated the time needed for all components of a door to door trip for each mode. This included access time to station/airport, connections, station and airport waiting times, and egress times. The evaluation showed that door to door travel times would be faster than air travel for most long distance city pairs and faster than driving or conventional rail trips for all long distance city pairs, as can be seen in table 3-2 below. The change in travel time from conventional rail to HSR is so significant, both in absolute and compared to other modes, that it results in the large mode change compared to current conditions.
Table 3-2 Estimated Peak Condition Total Travel Times (Door-to-Door) between City Pairs by Auto, Air, Conventional Rail, and HSR
Auto Air High-Speed Rail
Conventional Rail
City to City Pair 2000 2030 2000 2030 2020 2000Los Angeles downtown to San Francisco downtown
6:28 6:50 3:30 3:38 3:24 10:05
Fresno downtown to Los Angeles downtown
3:32 3:41 3:17 3:24 2:15 5:46
Los Angeles downtown to San Diego downtown
2:37 2:41 2:51 3:01 2:21 3:26
Burbank (airport) to San Jose downtown
5:31 5:54 2:46 2:43 3:07 9:46
Sacramento downtown to San Jose downtown
2:29 2:32 3:33 3:33 2:16 4:06
Source: Bay Area to Central Valley High-Speed Train (HST) Program Environmental Impact Report / EIR/EIS, California High-Speed Rail Authority, May 2008 (1–9, 3.2-12)
Ridership ProjectionsUsing the travel times from table 3-2 above, the ridership study predicted 93.9 million riders a year and $3.1 billion a year in revenue. The ridership would be affected by several different factors once service started. These include service frequency, operating cost for air/auto travel, and air/auto travel times. The results of sensitivity tests which changed those factors is laid out below in table 3-3. Additional alignment tests found that ridership would be higher at the Modesto and Merced stations if they were to be placed at the downtown locations, instead of Briggsmore and Castle Air Force Base (Authority 2008a, 7-7).
High Speed Rail and Population Distribution 29

Chapter 3: California High Speed Rail Proposal
Table 3-3 Sensitivity Tests for High-Speed RailPercent Change from
BaseSensitivity Test Change in Level of Service Boardings Revenues
High-speed rail level of service testsHigher high-speed rail fares 25% increase -13% 2%Average daily headways High-speed rail headways* -15% -14%Higher high-speed rail frequency 100% increase 15% 16%Express service SF/LA Double freq SF/LA to SJV, SD/SF to
SAC22% 24%
Air and auto level of service testsHigher air/auto times 6% increase** 6% 6%Higher air/auto costs 50% increase 46% 53%
Combined level of service testsHigher high-speed rail fares and higher air/auto costs
25% increase in fares, 50% increase in costs
13% 19%
Higher high-speed rail fares and higher air/auto costs
50% increase in both 31% 40%
Higher high-speed rail fares and higher air/auto costs
100% increase in fares, 50% increase in costs
-6% 1%
* Average daily headways assume that the headways in the peak and off-peak periods are equal. This effectively increases peak headways and decreases off-peak headways.
** The 6-percent increase in travel time was based on a 30-minute increase in travel time from San Francisco to Los Angeles by car.
Source: Systematics, Cambridge, Canapary & Galanis Corey, Mark Bradley Research & Consulting, Inc. HLB Decision Economics, Inc. SYSTRA Consulting, and Citilabs, Bay Area/California High-Speed Rail Ridership and Revenue Forecasting Study, 2007.
ConclusionThe failure of other high-speed rail proposals over the past four decades, and California's success in obtaining bond funding in 2008 means that California will almost certainly be the first HSR system built in the United States. As a first-mover it will not be able to look to other systems in the United States to learn from their successes and failures. The forty plus years of experience offered by HSR operations in other countries does offer lessons on the potential of HSR to serve as a catalyst for development and where to position stations to best maximize this potential. The CA HSR Authority's analysis and ridership studies tend to support the findings from the literature review that city center stations are far better locations for ridership and development, but the authority has not universally embraced this fact in station placement. The three main metropolitan areas in the Central Valley: Sacramento, Fresno, and Bakersfield are in downtown locations. All three cities are planning around the new stations to various degrees. Sacramento has the most highly developed plans and supportive infrastructure. The three secondary station locations are more mixed. The preferred location for the Stockton station is downtown, but the Authority is still considering a green field location as well. The Cabral station site would connect with the existing ACE service, take advantage of the previous planning efforts, and strengthen the historic downtown, but Caltrans appears not be considering such impacts in their planning. The Merced and Modesto stations may be in either downtown or green field locations. The local plans for the Castle Air Force site and Briggsmore site show no awareness of what zoning and infrastructure a successful TOD development
30 High Speed Rail and Population Distribution

Chapter 3: California High Speed Rail Proposal
would require. The latest documents from the Authority point to the selection of downtown sites as the Authority realizes that value capture from station area development must be part of its business plan (Authority 2008a, 6-7). Over the multi-year process of planning and environmental review for the project the CAHSR Authority's understanding of the issues regarding TOD and station placement seems to have evolved greatly. This makes it more likely that the CA HSR network's potential to spur TOD development in California's Central Valley will be realized.
High Speed Rail and Population Distribution 31

Chapter 3: California High Speed Rail Proposal
32 High Speed Rail and Population Distribution

Chapter 4: Empirical Analysis of Population Distribution in French Urban Areas
Chapter 4: Empirical Analysis of Population Distribution in French Urban Areas
OverviewThis chapter will examine the population growth and distribution of several French cities that have had high speed rail (HSR) services for over fifteen years. By analyzing how the distribution of population growth changed after the start of high speed rail service, the chapter will examine whether a strong correlation exists between HSR service and the distribution pattern of population growth that may indicate a causal relationship.
Methodology
Case CitiesThe cities in this chapter were selected for several factors that would make them as comparable as possible to California's Central Valley host cities/regions, and provide sufficient data to perform long-term evaluation of growth trends. All the case study cities have at least fifteen years of high speed service, allowing enough time to see longer-term development trends reflected in population numbers. Populations in the urban areas range from approximately 250,000 to over 1 million, matching the metropolitan areas of California's Central Valley cities. Finally, the selected cities are a combination of through stations on longer high speed lines and end point stations. Availability of census information was also important in selecting the cities.
The researcher choose to use only French cities for several reasons related to availability and comparability. The oldest and most extensive HSR network in Japan was not comparable to the California Central valley context due to the vastly different population densities and existing transportation systems. The French HSR network is the oldest and largest in Europe providing the most cities will HSR service for over ten years. The Spanish and German networks by contrast only had a couple of cities connected by HSR in the early 1990s, leading to sample sizes of one or two. The primary/secondary urban area distinction is easily identifiable in France, where Paris is the single primary urban area, whereas it is much more complicated in Germany. Finally data collection for France was greatly helped by the Institut National de Statistique et des Etudes Economiques (INSEE) online tools that allowed geographically based data collection.
Using the above criteria, the selected cities in France are: – Lyon,– Nantes, – Le Mans, and – Lille
Analysis is focuses on the distribution of growth between the central city and suburbs and the relative degree of concentration within a 15 km radius of the high speed rail station. Study area growth trends are analyzed before the arrival of HSR service and after, to capture how HSR has affected their subsequent development. The four TGV cities are analyzed individually and comparatively. Two other cities with low amounts of TGV service are also compared with the TGV cities. The comparison examines if the population distribution trends seen in TGV cities are shared by cities with little to no TGV service.
High Speed Rail and Population Distribution 33

Chapter 4: Empirical Analysis of Population Distribution in French Urban Areas
Data and MethodologyThe raw population numbers and densities used in this chapter are from the French National Statistics Institute, INSEE. All other measures were calculated from the raw numbers by the researcher. All graphs are likewise based on the calculations of the researcher.
To measure the effect of HSR service on the distribution of growth in host cities the researcher obtained census population data for selected cities in the years before and after the introduction of HSR service. The data is analyzed for each city and grouped into concentric ring sub-areas:
1. Within 4.2 kilometers (2.6 miles),2. Between 4.2 and 8 kilometers (2.6 and 5 miles), and3. Between 8 and 15 kilometers (5 and 8.5 miles) of the HSR station
The 15 kilometer radius and sub-area bands were chosen by the researcher to show the distribution of population within one smaller metropolitan area and the effect of that area's one station. A 15 kilometer radius captures most or all of the contiguous urbanized area (“unité urbaine”) for the selected cites, and would incorporate most of the contiguous urbanized area for the Central Valley cities in California. Further it is small enough to incorporate only one TGV destination on a route, simplifying analysis. Cities such as Lille and Lyon actually have two stations, a through and dead-end station, that splits TGV traffic between them, but both are within less than a kilometer of each other. For cities with two stations, the main station for HSR service was used. The inner ring size of 4.2 kilometers was driven mostly by data availability, as fine grain data for the station areas of each city were not available back to 1968. The large area of a 4.2 radius circle also allows a comparison of the central city as a whole to the urbanized region. If a smaller area like a 1.0 kilometer radius was used the resulting population would not be significant compared to the urbanized area as a whole.
The measures used to evaluate the data include:1. Growth rates, by sub-area;2. The distribution of total urbanized area population by sub-area;3. Percentage of total area population increase/decrease accommodated by each sub-area; and4. Gross density, weighted density, and ratio between the two for the entire urbanized area;
The various measures are charted and evaluated either over time or relative to other sub-areas within the same census interval. The distribution of population between sub-areas, and the density measures and ratios, are values over time. The percentage of total population increase/decrease accommodated by each sub-area is measured by census period. The rate of population growth is measure both as a trend over time and per time period.
Weighted density is an important measurement of urban morphology used in this analysis. Weighted density is an indicator of the average resident's experienced density. It is calculated by measuring what portion of the area's population lives at a certain density. For this chapter the researcher multiplied the density of each commune (city/town/village) by its percentage of the total population and them summed the results for each census period. The ratio between weighted density and the gross density also shows the level of stratification in population. A lowering ratio shows the population density homogenizing. A rising level shows that density is stratifying, as higher density ares are growing even higher in density while lower density areas and stagnate.
City/village level (commune) data is used for correlation-regression analysis. Each urbanized area contains between 20 and 100 city/town data points. Correlation-regression analysis is undertaken of growth rates, and percentage of total area population increase/decrease, versus distance from the high speed rail station. Both tests are by census period to see if a statistically significant correlation exists and if that relationship changes after HSR service commences.
Satellite imagery was used to create the measurements used for distance from high speed rail stations. Geographic Information System (GIS) data was not readily available. Therefore, the location
34 High Speed Rail and Population Distribution

Chapter 4: Empirical Analysis of Population Distribution in French Urban Areas
points for cities, towns, or villages was established by using the location points and measuring tool in Google Earth. Such a measurement is less exact than the use of mid-points from shape files, but that information was not available to the researcher.
Case City Results
Summary Information on Selected Urban Areas Table 4-1 below provides information on key characteristics of the four HSR urban areas evaluated.
Table 4-1 Characteristic of Selected Urban AreasCity Population
(initial year)Travel Time
to Paris
Station(s) (Year Built)
Pop. Distribution
Pre-TGVCentral (C)Medium (M)
Outer (O)
Annual Pop.
Growth Rate
Pre-TGV
Local Rail Transit, start year, length
Network Location
Lyon 1,049,488 (1982)
2h 10min
Part Dieu (1981)Perrache (1855) Saint-Exupéry (1994)
C: 50.41%M: 35.11%O: 14.48%
-0.35% Metro (1978) 30kmTram (2001) ?km
Endpoint (1981) In-line (1994)
Nantes 529,035 (1990)
2h 1min
Nantes (1965/1989)
C: 56.79%M: 18.31%O: 24.90%
0.83% Tram (1985) 41km Endpoint (off LGV mainline)
Le Mans 251,198 (1990)
54 min Le Mans (1854) C: 66.26%M: 11.76%O: 21.98%
0.35% Tram (2007) 15km In-line (end of LGV mainline)
Lille 1,059,268 (1990)
1h Lille Europe (1991)Lille Flandres (1882)
C: 33.15%M: 20.32%O: 46.53%
0.24% Metro (1983) 45kmTram (1909) ?km
Hub (London to Paris and Brussels)
Sources: INSEE, SNCF (Société Nationale des Chemins de fer français), Wikipedia, and researcher
High Speed Rail and Population Distribution 35

Chapter 4: Empirical Analysis of Population Distribution in French Urban Areas
LyonLyon was the end-point for the first French HSR line (Linee à Grande Vitesse/LGV) Sud-Est which opened in stages from 1981 to 1983 (Illustration 4-1). A new railway station Gare de Lyon Part Dieu was built along with the LGV line to handle the increased inter-city travel. The previous station, Gare Perrache, is technically the terminus station for the LGV line and TGV service, but most traffic uses Part Dieu. All measurements of distance are from the entrance to Part Dieu rather than Perrache. A third station, Saint-Exupéry TGV, was opened at the Saint-Exupéry airport, 20 km from Lyon, in 1994. The station has not attracted large ridership, nor any adjacent development.
36 High Speed Rail and Population Distribution
Illustration 4-1: TGV network map
Source: TGVweb – http://www.trainweb.org
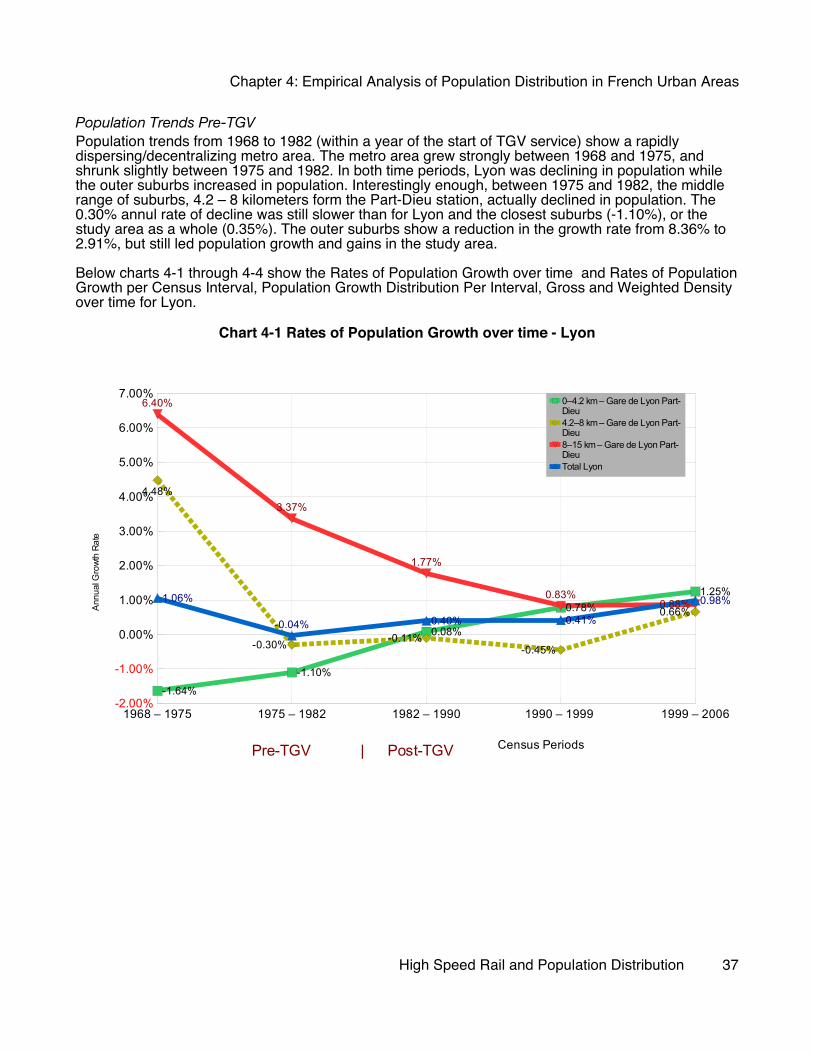
Chapter 4: Empirical Analysis of Population Distribution in French Urban Areas
Population Trends Pre-TGVPopulation trends from 1968 to 1982 (within a year of the start of TGV service) show a rapidly dispersing/decentralizing metro area. The metro area grew strongly between 1968 and 1975, and shrunk slightly between 1975 and 1982. In both time periods, Lyon was declining in population while the outer suburbs increased in population. Interestingly enough, between 1975 and 1982, the middle range of suburbs, 4.2 – 8 kilometers form the Part-Dieu station, actually declined in population. The 0.30% annul rate of decline was still slower than for Lyon and the closest suburbs (-1.10%), or the study area as a whole (0.35%). The outer suburbs show a reduction in the growth rate from 8.36% to 2.91%, but still led population growth and gains in the study area.
Below charts 4-1 through 4-4 show the Rates of Population Growth over time and Rates of Population Growth per Census Interval, Population Growth Distribution Per Interval, Gross and Weighted Density over time for Lyon.
Chart 4-1 Rates of Population Growth over time - Lyon
High Speed Rail and Population Distribution 37
1968 – 1975 1975 – 1982 1982 – 1990 1990 – 1999 1999 – 2006-2.00%
-1.00%
0.00%
1.00%
2.00%
3.00%
4.00%
5.00%
6.00%
7.00%
-1.64%
-1.10%
0.08%
0.78%1.25%
4.48%
-0.30% -0.11%-0.45%
0.66%
6.40%
3.37%
1.77%
0.83%0.88%1.06%
-0.04% 0.40% 0.41%
0.98%
0–4.2 km – Gare de Lyon Part-Dieu4.2–8 km – Gare de Lyon Part-Dieu8–15 km – Gare de Lyon Part-DieuTotal Lyon
Census Periods
Ann
ual G
rowt
h Ra
te
Pre-TGV | Post-TGV

Chapter 4: Empirical Analysis of Population Distribution in French Urban Areas
Chart 4-2 Distribution of Study Area Population Over Time – Lyon
Chart 4-3 Population Growth Distribution Per Interval – Lyon
38 High Speed Rail and Population Distribution
1968 – 1975 1975 – 1982 1982 – 1990 1990 – 1999 1999 – 2006-500.00%
-400.00%
-300.00%
-200.00%
-100.00%
0.00%
100.00%
200.00%
300.00%
400.00%
500.00%
-93.39%
-1427.52%
9.02%
84.07% 58.40%112.72%
-255.91%
-8.60% -33.42%18.89%80.67%
1583.43%
99.58%49.35% 22.71%100.00%
-100.00%
100.00% 100.00% 100.00%
0–4.2 km – Gare de Lyon Part-Dieu4.2–8 km – Gare de Lyon Part-Dieu8–15 km – Gare de Lyon Part-DieuTotal Lyon
Census Periods
Perc
enta
ge o
f Are
a's
Tota
l Gro
wth
1968 1975 1982 1990 1999 20060.00%
5.00%
10.00%
15.00%
20.00%
25.00%
30.00%
35.00%
40.00%
45.00%
50.00%
55.00%
60.00%
65.00%
60.09%
49.52%45.83% 44.70% 46.11% 46.90%
26.59%
32.52% 31.92% 30.67%28.37% 27.76%
13.32%
17.96%22.25%
24.63% 25.52% 25.34%
0–4.2 km – Gare de Lyon Part-Dieu4.2–8 km – Gare de Lyon Part-Dieu8–15 km – Gare de Lyon Part-Dieu
Pre-TGV | Post-TGV
Per
cent
of T
otal
Pop
ulat
ion

Chapter 4: Empirical Analysis of Population Distribution in French Urban Areas
Chart 4-4 Weighted and Gross Densities over time – Lyon
Population Trends Post-TGV – Lyon The three census periods (1982-1990, 1990-1999, 1999-2006) after the start of TGV service show a qualitative change in the growth pattern for the study area. As seen in Chart 4.1 “Rates of Population Growth Over Time”, by the 1999 to 2006 census period Lyon and the suburbs within 4.2 kilometers of Gare Part-Dieu where the fastest growing areas. The suburbs at the outer part of the study area were growing more slowly than the study area as a whole.
The first census after the start of TGV service showed important changes in the distribution of population but not transformative in nature. The inner sub-area reversed course and actually made a small population gain of 2,392 for an annual growth rate of 0.08%. This gain, while modest, stands in contrast to the losses of -74,428 and -44,196 in the pre-TGV periods. The end of such large population losses in the inner area restored positive population growth to the study area as a whole, and moved the inner sub-area ahead of the medium sub-area in growth. The outer sub-area retained its position as the fastest growing sub area, however. It was responsible for over ninety percent of the total study area's growth (Chart 4-3 Population Growth Distribution). The most dramatic changes in population distribution were to be seen the following two census periods.
The 1990 – 1999 census period, nine to eighteen years after the start of TGV service, a transformation is seen in the distribution of growth in the study-area, from dispersal to slight re-concentration. The three aspects of this transformation can be observed in the three charts: Chart 4-1 Pop. Rates over time, Chart 4-2 Distribution of Pop. over time, and Chart 4-3 Population Growth Distribution. First, the inner sub-area became the second fastest growing area with an annual rate of 0.78% compared to -0.45%, 0.83%, and 0.41% for the medium, outer sub-areas, and the study area as a whole. Second, the population gain of the inner sub-area was equal to over 84% of that of the region as a whole. Combined these two facts drove the third change, the inner sub-area began to grow as a percentage of the total population of the study-area. The formerly dispersing area around Lyon began to re-
High Speed Rail and Population Distribution 39
1968 1975 1982 1990 1999 20060
1,000
2,000
3,000
4,000
5,000
6,000
7,000
8,0007,171
5,851
5,137 5,0215,317
5,781
1,646 1,768 1,763 1,819 1,887 2,017
4.36 3.31 2.91 2.76 2.82 2.87
Weighted DensityAverage DensityWeighted/Average Ratio
Pre-TGV | Post-TGV
Den
sitie
s
Chapter 4: Empirical Analysis of Population Distribution in French Urban Areas
concentrate around the center.
The 1999-2006 period continued the slight re-concentration trend with the inner sub-area gaining an additional 0.79% of the region's population from both the medium and outer sub-areas. A 1.25% annual rate kept the inner sub-area the fastest growing section. The medium sub-area also resumed growth although slower than the outer sub-area, 0.66% to 0.88%. From Chart 4-2 the medium sub-area peaked as a percentage of the entire study-area in 1975 and has been declining since. The outer sub-area peaked in 1999, and has been declining since. The growth rate of the entire study-area grew progressively from 0.40% annually 1982-1990, to 0.41% 1990-1999, to 0.98% over 1999-2006.
The shift in the location of growth can best be seen in Chart 4-3 – Population Growth Distribution Per Interval. In the pre-TGV period the central sub-area deviated strongly from the urbanized area's growth, with values below -100%. After the start of TGV service, the central area contributed to the urbanized area growth with an over 100% share in the 1990-1999 time period.
FindingsThe period starting ten years after the beginning of TGV service shows a growing but re-concentrating Lyon urban area. The previous pattern of dispersal has changed. Since 1990 the majority of the new population has been moving to the central sub-area. This can be seen in the increase in weighted density (Chart 4-4), and the growing percentage of the overall population for the central sub-area (Chart 4-2). The increasing Weighted Density and ratio of weighed to gross density also demonstrates that the population is concentrating more in the denser areas, making the population more clumpy, rather than filling in the outer low-density areas.
Le Mans At 250,000 people Le Mans is the smallest the of the four case study urban areas. It also has is the only TGV city with no local rail transit system during the study period. The city's first tram line opened in 2007. Despite that fact it had the highest initial level of concentration with over 75% of the population in the central area (Chart 4-7), and the lowest weighted density at 1,974 people per square kilometer (Chart 4-6). Le Mans sits at the end of the western branch of the TGV Atlantique line (LGV Atlantique) that began service in stages in 1989 and 1990 (Illustration 4-1).
Population Trends Pre-TGVLe Mans experienced a long period of dispersal before the arrival of TGV service. Before 1982 the medium and outer sub-areas had growth rates of over three percent. The rates slowed to just under two percent between 1982 and 1990. The central sub-area by contrast lost population between 1975 and 1990. The percentage of population in the central area fell from over 75% to around 66%. Population growth slowed in the 1980s but was still entirely from the medium and outer rings.
Below you can find the following charts for Le Mans. Growth Rates per period, Growth Rates over time, Distribution of Population over time, Perceived Density over time.
40 High Speed Rail and Population Distribution

Chapter 4: Empirical Analysis of Population Distribution in French Urban Areas
Chart 4-5 Growth Rates over time – Le Mans
1968 – 1975 1975 – 1982 1982 – 1990 1990 – 1999 1999 – 2006-1.00%
0.00%
1.00%
2.00%
3.00%
4.00%
5.00%
1.53%
-0.40% -0.31%-0.03% 0.11%
3.85%3.97%
1.83%
1.43%1.21%
3.94%
3.54%
1.90%
0.79%
1.85%2.07%
0.62%0.35% 0.32%
0.65%
0–4.2 km from Gare du Mans4.2–8 km from Gare du Mans8–15 km from Gare du MansTotal Le Mans
Census Periods
Ann
ual G
row
th R
ate
Pre-TGV | Post-TGV
Chart 4-6 Distribution of Population over time – Le Mans
High Speed Rail and Population Distribution 41
1968 1975 1982 1990 1999 20060.00%
10.00%
20.00%
30.00%
40.00%
50.00%
60.00%
70.00%
80.00%
90.00%
77.51%74.98%
69.83%66.26% 64.22%
61.90%
7.77% 8.61% 10.55% 11.76% 12.90% 13.39%14.72% 16.41%19.62%
21.98% 22.88% 24.71%
0–4.2 km from Gare du Mans4.2–8 km from Gare du Mans8–15 km from Gare du Mans
Pre-TGV | Post-TGV
Per
cent
of T
otal
Pop
ulat
ion

Chapter 4: Empirical Analysis of Population Distribution in French Urban Areas
Chart 4-7 Weighted and Gross Density over time – Le Mans
Chart 4-8 Population Growth Distribution per interval – Le Mans
42 High Speed Rail and Population Distribution
1968 – 1975 1975 – 1982 1982 – 1990 1990 – 1999 1999 – 2006-80.00%
-60.00%
-40.00%
-20.00%
0.00%
20.00%
40.00%
60.00%
80.00%
100.00%
120.00%
57.48%
-48.64%-60.70%
-6.23%
11.01%14.46%
55.10% 54.83%
52.37% 24.02%28.05%
93.54%
105.87%
53.86%64.97%
100.00% 100.00% 100.00% 100.00% 100.00%
Distribution of Metro Area Growth Per Census Period
0–4.2 km from Gare du Mans4.2–8 km from Gare du Mans8–15 km from Gare du MansTotal Le Mans urban area
Census Periods
Perc
enta
ge o
f Are
a's T
otal
Gro
wth
Pre-TGV | Post-TGV
1968 1975 1982 1990 1999 20060
500
1,000
1,500
2,000
2,500
266 304 317 326 336 351
1,974 2,027
1,8481,751 1,719 1,695
7.43 6.66 5.82 5.36 5.12 4.83
Gross DensityWeighted DensityRatio
Pre-TGV | Post-TGV
Den
sitie
s

Chapter 4: Empirical Analysis of Population Distribution in French Urban Areas
Population Trends Post-TGVOf the four TGV cities examined Le Mans showed the smallest change in population trends pre- and post TGV. The 1999 census, the first census after the start of TGV service in 1990, showed important changes in the distribution of population but not transformative in nature. The city continued to loss population, although the rate slowed by 90% to only minus 0.03% a year (Chart 4-5). Between 1999 and 2006, central sub-area reversed course and actually made a small population gain of 185 for an annual growth rate of 0.11%. This growth only represented 11% of the total urban area, compared to over 60% of the urban area population (Chart 4-8). The Le Mans urban area was still dispersing.
The continued dispersion of the Le Mans area is evident in the continued decline in weighted density (Chart 4-7). From a height of 2,027 in 1975 it fell to 1,751 by 1990. After 1990 and the start of TGV service, the weighted density continued to decline, reaching 1,719 in 1999. The declining perceived density indicates that from 1975 through 1999 while the total population (therefore average density) was increasing the majority of growth was in lower density areas. This increased the portion of the population living in low densities.
FindingsLe Mans appears to be the city least affected by the initiation of TGV service. It is the only one to show a continued decline in weighted density (Chart 4-7). That reflects continued losses by the central area of over two percent of the urban area population each census period (Chart 4-6). Unlike other urban areas, the lines on Chart 4-7 and Chart 4-6 do not slow or turn around but continue to decline. This is consistent with the discussion in the literature of the importance of city size and travel time to the primary city (Harman 2006; Givino 2006, 606; Hayes 1997). As shown on Table 4-1, Le Mans is the smallest urban area studied at 250 thousand people in 1990 and less than an hour from Paris by TGV.
NantesAt approximately 530,000 people when TGV service started, Nantes is the second smallest urban area selected. It is closer in scale to the Stockton Metro area of 625,000. Nantes is also the only urban area not on a LGV line. Nevertheless Nantes is the main destination for TGV service using the western branch LGV Atlantique HSR line. TGV trains from Paris take the LGV Atlantique through Le Mans (the end of the west arm) and then continue using the “classic” line to reach Nantes (Illustration 4-1). French rail planners though it was not cost-effective to build the high speed line all the way to the city, when two hour travel times are achieved even with the high speed line ending at Le Mans.
While Nantes lacks a subway system, the city built the first new modern tram system in France in 1985. By the time TGV arrived in 1990 Nantes' system was well established and is now the highest ridership tram system in the country.
Population Trends Pre-TGVLike the other selected urban areas, Nantes showed a strong dispersal pattern between 1968 and 1982. Central area growth was very low or negative and between 95% and 190% of growth came from the medium and outer areas. This caused a decline in weighted density even as population and gross density increased. The dispersal trend slowed in the 1980s but continued. The central area only accommodated 26% of all population growth and weighted density continued to decline.
High Speed Rail and Population Distribution 43

Chapter 4: Empirical Analysis of Population Distribution in French Urban Areas
Chart 4-9 Population Rate over time – Nantes
Chart 4-10 Distribution of Population over time – Nantes
1968 1975 1982 1990 1999 20060.00%
10.00%
20.00%
30.00%
40.00%
50.00%
60.00%
70.00%
80.00%72.65%
65.00%58.82% 56.79% 56.64% 56.40%
11.20%16.27% 17.82% 18.31% 17.91% 17.66%
16.15% 18.73%23.36% 24.90% 25.45% 25.94%
0–4.2 km from Gare de Nantes4.2–8 km from Gare de Nantes8–15 km from Gare de Nantes
Pre-TGV | Post-TGV
Per
cent
of T
otal
Pop
ulat
ion
44 High Speed Rail and Population Distribution
1968 – 1975 1975 – 1982 1982 – 1990 1990 – 1999 1999 – 2006-1.00%
0.00%
1.00%
2.00%
3.00%
4.00%
5.00%
6.00%
7.00%
8.00%
9.00%
0.09%-0.82%
0.37%
1.13% 1.03%
9.04%
2.01%1.19%
0.89% 0.88%
4.34% 4.27%
1.71%1.43% 1.39%1.78%
0.59%0.83%
1.16% 1.09%
0–4.2 km from Gare de Nantes4.2–8 km from Gare de Nantes8–15 km from Gare de NantesTotal
Census Periods
Ann
ual G
row
th R
ate
Pre-TGV | Post-TGV

Chapter 4: Empirical Analysis of Population Distribution in French Urban Areas
Chart 4-11 Weighted and Gross Density over time – Nantes
Chart 4-12 Population Growth Distribution per interval – Nantes
High Speed Rail and Population Distribution 45
1968 1975 1982 1990 1999 20060
500
1,000
1,500
2,000
2,500
3,000
627705 734 782
864 930
2,787
2,586
2,273 2,255
2,4622,631
4.45 3.67 3.10 2.88 2.85 2.83
Gross DensityWeighted DensityRatio
Pre-TGV | Post-TGV
Den
sitie
s
1968 – 1975 1975 – 1982 1982 – 1990 1990 – 1999 1999 – 2006-150.00%
-100.00%
-50.00%
0.00%
50.00%
100.00%
150.00%
3.49%
-90.29%
26.04%
55.18% 53.30%57.04% 55.23%
25.66%14.08% 14.43%
39.48%
135.07%
48.30%30.75% 32.27%
0–4.2 km from Gare de Nantes4.2–8 km from Gare de Nantes8–15 km from Gare de NantesTotal
Census Periods
Per
cent
age
of A
rea'
s To
tal G
row
th
Pre-TGV | Post-TGV

Chapter 4: Empirical Analysis of Population Distribution in French Urban Areas
Population Trends Post-TGVThe two census periods after the opening of TGV services showed immediate changes to the distribution of growth in Nantes. The percentage of population growth accommodated by the Central area more than doubled to approximately 55% (Chart 4-12). This very closely approximated the center's existing percentage urban area population (Chart 4-10). The result was that the distribution of population over the urban area has reached something of a steady state.
The start of TGV service also coincides with the beginning of an increase in weighted density and the flattened out of the weighted density / gross density ratio as well (4-11). This indicates that new growth is not flowing mostly to lower density communes, which would lower the weighted density ratio. Nor is there a strong re-concentration trend that would increase the ratio. Instead the overall ratio of higher density to lower areas is somewhat static as the entire urban area gains population and densifies proportionately.
Lille
Population Trends Pre-TGVPopulation trends from 1968 to 1982 show a rapidly dispersing/decentralizing metro area. The metro area shrunk slightly between 1968 and 1975 and more strongly between 1975 and 1982. In both time periods Lille was declining in population while the inner sub-area increased rapidly in population and the outer sub-area tracked the total average growth rate. From 1982 to 1990 the overall growth rates converged. The middle sub-area showed a reduction in the growth rate from 2.96% and 1.99% to 0.72%, but still led population growth and gains in the study area. Both the inner sub-area and the outer sub-area grew less than, but within 0.10% of the study area average.
Growth throughout the period was focused on the middle sub-area. The population of Lille stopped falling by 1990 but growth was minimal. As a result the average weighted density (Bradford 2008) of Lille dropped all throughout the Pre-TGV time periods.
Population Trends Post-TGVThe two census periods after the start of TGV service show a qualitative change in the growth pattern for the study area. As seen in Chart 4-13, by the 1999 to 2006 census period Lille and the suburbs within 4.2 kilometers of Gare Lille-Europe were the fastest growing areas. It grew over four and a half times faster that the middle and outer sub-areas.
The 1990 – 1999 census period, during which TGV service started in 1993, witnesses a transformation as seen in the distribution of growth in the study-area, from dispersal to slight re-concentration. The three aspects of this transformation can be observed in the two charts: 4-13 and chart 4-14, showing the growth rates and distribution of population over time. First, the inner sub-area became by far the fastest growing area with an annual rate of 0.46% compared to 0.12%, 0.22%, and 0.25% for the medium, outer sub-areas, and the urban area as a whole. This drove the third change, the inner sub-area began to grow as a percentage of the total population of the study-area. The formerly dispersing area around Lille began to slightly re-concentrate around the Lille and the nearest suburbs.
46 High Speed Rail and Population Distribution
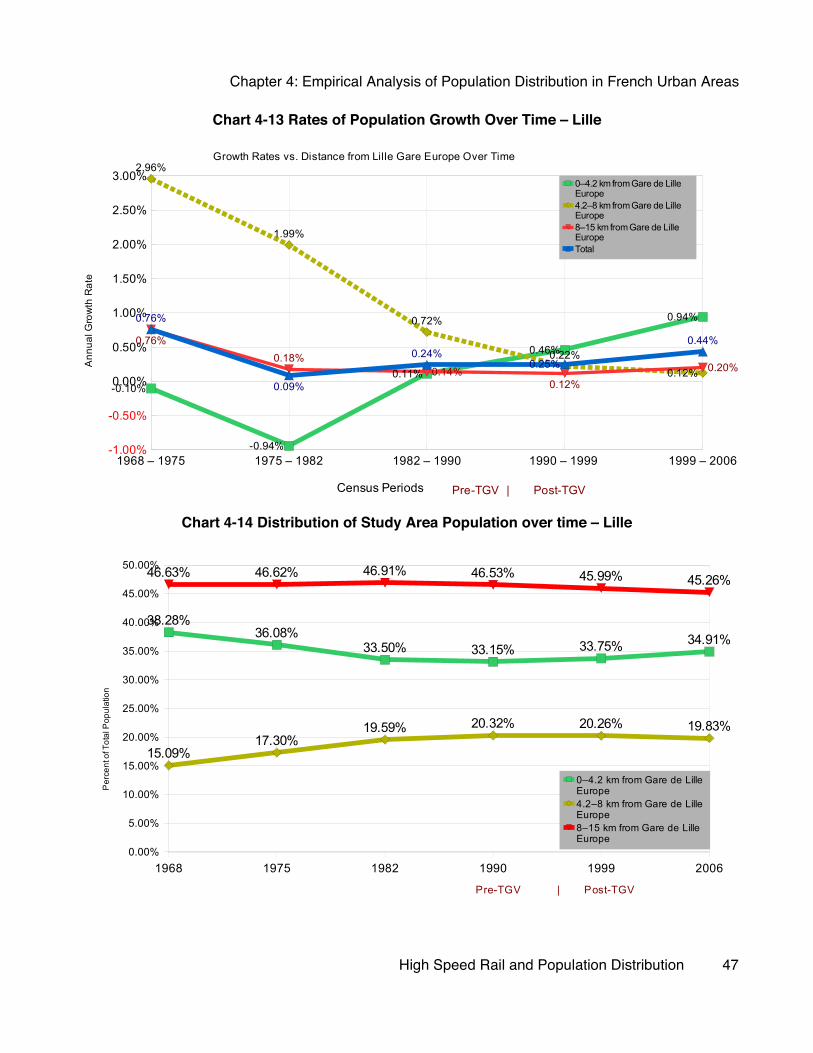
Chapter 4: Empirical Analysis of Population Distribution in French Urban Areas
Chart 4-13 Rates of Population Growth Over Time – Lille
Chart 4-14 Distribution of Study Area Population over time – Lille
High Speed Rail and Population Distribution 47
1968 1975 1982 1990 1999 20060.00%
5.00%
10.00%
15.00%
20.00%
25.00%
30.00%
35.00%
40.00%
45.00%
50.00%
38.28%36.08%
33.50% 33.15% 33.75% 34.91%
15.09%17.30%
19.59% 20.32% 20.26% 19.83%
46.63% 46.62% 46.91% 46.53% 45.99% 45.26%
0–4.2 km from Gare de Lille Europe4.2–8 km from Gare de Lille Europe8–15 km from Gare de Lille Europe
Pre-TGV | Post-TGV
Per
cent
of T
otal
Pop
ulat
ion
1968 – 1975 1975 – 1982 1982 – 1990 1990 – 1999 1999 – 2006-1.00%
-0.50%
0.00%
0.50%
1.00%
1.50%
2.00%
2.50%
3.00%
-0.10%
-0.94%
0.11%
0.46%
0.94%
2.96%
1.99%
0.72%
0.22%
0.12%
0.76%0.18%
0.14%0.12%
0.20%
0.76%
0.09%
0.24%0.25%
0.44%
Growth Rates vs. Distance from Lille Gare Europe Over Time
0–4.2 km from Gare de Lille Europe4.2–8 km from Gare de Lille Europe8–15 km from Gare de Lille EuropeTotal
Census Periods
Ann
ual G
row
th R
ate
Pre-TGV | Post-TGV

Chapter 4: Empirical Analysis of Population Distribution in French Urban Areas
Chart 4-15 Weighted and Gross Density over time – Lille
Chart 4-16 Population Growth Distribution per interval – Lille
48 High Speed Rail and Population Distribution
1968 1975 1982 1990 1999 20060
500
1,000
1,500
2,000
2,500
3,000
3,500
4,000
4,500
5,0004,491
4,356
3,977 3,857 3,9154,053
1,508 1,589 1,598 1,630 1,667 1,717
2.98 2.74 2.49 2.37 2.35 2.36
Weighted DensityAverage DensityRatio
Pre-TGV | Post-TGV
Den
sitie
s
1968 – 1975 1975 – 1982 1982 – 1990 1990 – 1999 1999 – 2006-200.00%
-150.00%
-100.00%
-50.00%
0.00%
50.00%
100.00%
150.00%
200.00%
-5.16%
-385.19%
15.11%
60.18%73.05%
58.64%
390.98%
58.00%
17.79%5.72%
46.52%
94.21%
26.90% 22.03% 21.23%
100.00% 100.00% 100.00% 100.00% 100.00%
0–4.2 km from Gare de Lille Europe4.2–8 km from Gare de Lille Europe8–15 km from Gare de Lille EuropeTotal
Census Periods
Per
cent
age
of A
rea'
s To
tal G
row
th
Pre-TGV | Post-TGV

Chapter 4: Empirical Analysis of Population Distribution in French Urban Areas
The 1999-2006 period saw an acceleration of the re-concentration trend with the inner sub-area gaining an additional 1.16% of the region's population from both the medium and outer sub-areas. A 0.98% annual rate kept the inner sub-area the fastest growing section. The outer sub-area's share of the total population fell below to it lowest level below the 1968 share. The growth rate of the entire study-area continued to grow from 0.11% annually 1982-1990, to 0.46% 1990-1999, to 0.94% over 1999-2006.
The re-concentration of the Lille area is also evident in the increase in weighted density. From 1968 to 1990 the area's weighted density dropped from 4,491 to 3,857. After 1990, it increased back from 3915 to 4,053. The declining weighted density indicates that before 1990, while the total population (average density) was increasing, the majority of growth was in lower density areas. This increased the portion of the population living in low densities. After 1990, the majority of the new population growth moved to higher density areas.
Findings
Comparing the Distribution Patterns of Urban AreasThe growth patterns of the four cities study cities varied in important ways. Chart 4-17 shows the percentage of each urban area within the central sub-area. For Lyon and Lille the central area begins to regain a larger percentage of the population. For the smaller urban areas of Nantes the percentage stagnates while in Le Mans the trend line continues downward. Le Mans and Nantes also have a higher starting percentage, while Lille started with the lowest percentage in the central area. This is consistent with the literature stating that larger cities, that are regional centers, benefit more than smaller cities. A second explanation could be that some of the movement may be closing in on a mean.
Chart 4-17 Population Share of Central Sub-area Pre-/Post-TGV
High Speed Rail and Population Distribution 49
Pre-TGV 3 Pre-TGV 2 Pre-TGV 1 TGV start Post-TGV 1 Post-TGV 2 Post-TGV 320%
30%
40%
50%
60%
70%
80%
38.3%36.1%
33.5% 33.1% 33.7% 34.9%
72.6%
65.0%
58.8%56.8% 56.6% 56.4%
77.5%75.0%
69.8%66.3%
64.2%61.9%
60.1%
49.5%45.8% 44.7% 46.1% 46.9% Lyon
LilleNantesLe Mans
Census Period Before/After TGV Service
Perc
enta
ge o
f Met
ro A
rea
Popu
latio
n

Chapter 4: Empirical Analysis of Population Distribution in French Urban Areas
Chart 4-18 Weighted Densities of HSR Cities
The trends for weighted densities, graph 4-18, reflect a slightly different pattern. The weighted densities of Lyon, Lille, and Nantes all climb after 1990. Le Mans' weighted density continues to decline. According to the weighted density measure Nantes actually grew faster, in absolute and percentage terms, than Lille in the 1999-2006 period. The difference in weighted density growth vs. geographic concentration stagnation may be an artifact of the fact that Nantes had a much initial higher geographic concentration and lower initial density than Lille.
Table 4-2 Percentage of Urban Area Growth in Central Sub-Area HSR cities1968 – 1975 1975 – 1982 1982 – 1990 1990 – 1999 1999 – 2006
Lyon -93.39% -1427.52% 9.02% 84.07% 8.40%Lille -5.16% -385.19% 15.11% 60.18% 73.05%Nantes 3.49% -90.29% 26.04% 55.18% 53.30%Le Mans 57.48% -48.64% -60.70% -6.23% 11.01%
The percentage of each urban area's growth that went into the central sub-area varied widely over time and between cities. Chart 4-19 shows a line for each time period to better visualize the differences between different cities for each time period. Chart 4-20 shows the more traditional line for each city over time. The most apparent trend in each graph is the off the charts population losses of Lyon and Lille before 1982. The smaller cities of Nantes and Le Mans had much lower losses. After 1982 the three larger cities gain population in the central sub-areas every period while Le Mans continues to lose population until after 1999. After 1990, the central areas of Lyon and Lille both accommodated larger percentages of each urban area's growth than Nantes, despite that fact that both cities' had a smaller percentage of their urban area population in the inner sub-area than Nantes.
50 High Speed Rail and Population Distribution
1975 1982 1990 1999 20060
1,000
2,000
3,000
4,000
5,000
6,000
5,851
5,137 5,0215,317
5,781
4,356
3,977 3,857 3,9154,053
2,5862,273 2,255
2,4622,631
2,0271,848 1,751 1,719 1,695
LyonLilleNantesLe Mans
Census Years
Wei
ghte
d De
nsity

Chapter 4: Empirical Analysis of Population Distribution in French Urban Areas
Chart 4-19 Percentage of Urban Area Growth in Central Sub-Area by period
Chart 4-20 Percentage of Urban Area Growth in Central Sub-Area over time
High Speed Rail and Population Distribution 51
1975 – 1982 1982 – 1990 1990 – 1999 1999 – 2006-100.00%
-80.00%
-60.00%
-40.00%
-20.00%
0.00%
20.00%
40.00%
60.00%
80.00%
100.00%
LyonLilleNantesLe Mans
Census Period
Per
cent
age
of T
otal
Urb
an A
rea
Gro
wth
Lyon Lille Nantes Le Mans-150%
-100%
-50%
0%
50%
100%
9%15%
26%
-61%
84%
60% 55%
-6%
58%
73%
53%
11%
-90%
-49%
1975 – 19821982 – 19901990 – 1999 1999 – 2006
Urban Area
Perc
enta
ge o
f Tot
al M
etro
Are
a G
rowt
h

Chapter 4: Empirical Analysis of Population Distribution in French Urban Areas
Overall the growth distribution changes in Lyon and Lille were the more dramatic. The changes observed in Nantes falls between the minimal changes in Le Mans and the more pronounced results in Lyon and Lille. As shown in Table 4-1 the Nantes urban area has a population roughly half that of Lyon or Lille and double that of Le Mans. The travel times from Paris to Lyon and Nantes are similar as are the times for Lille and Le Mans. The disparity in growth distribution changes, if HSR-related, appear to correlate far more with population size than with travel time bands.
Comparison with non-TGV citiesIn addition to the four TGV cities examined above, two cities with limited or no TGV service, Orleans and Toulouse, were examined to check if the observed changes in population distribution were also occurring in cities were TGV service was very limited. If such changes were also occurring in cities without TGV service other factors may be more important to the change in growth distribution than HSR service. A true “control group” of large french cities is not really possible because of the service structure of the TGV network. As shown in Illustration 4-1 TGV trains run far beyond the LGV lines providing service to all major cities in the country. Toulouse is the largest city not near an existing LGV line but, according to the latest SNCF timetable it is still served by several direct TGV trains a day to Paris and additional TGV connections to other parts of the country.
Summary Information on Selected Urban Areas Table 4-3 below provides information on key characteristics of the four HSR urban areas and two non-TGv cities evaluated.
Table 4-3 Characteristic of Selected Urban AreasCity Population
(initial year)
Travel Time to Paris
Station(s) (Year Built)
Pop. Distribution
Pre-TGV:CentralMedium
Outer
Annual Pop.
Growth Rate
Pre-TGV
Local Rail Transit, start year, length
Network Location
Lyon 1,049,488 (1982)
2h 10min
Part Dieu (1981)Perrache (1855) Saint-Exupéry (1994)
C: 50.41%M: 35.11%O: 14.48%
-0.35% Metro (1978) 30kmTram (2001) ?km
Endpoint (1981) In-line (1994)
Nantes 529,035 (1990)
2h 1min Nantes (1965/1989)
C: 56.79%M: 18.31%O: 24.90%
0.83% Tram (1985) 41km Endpoint (off LGV mainline)
Le Mans 251,198 (1990)
54 min Le Mans (1854) C: 66.26%M: 11.76%O: 21.98%
0.35% Tram (2007) 15km In-line (end of LGV mainline)
Lille 1,059,268 (1990)
1h Lille Europe (1991)Flandres (1882)
C: 33.15%M: 20.32%O: 46.53%
0.24% Metro (1983) 45kmTram (1909) ?km
Hub (London to Paris and Brussels)
Toulouse 450,832 (2008)
5h 12 min
Toulouse Matabiau (1905)
C: 56.22%M: 12.73%O: 31.05%
1.89% Metro (1993) 12.5km
N/A
Orleans 113,130 (2006)
59 min Aubrais-Orléans (1961)
C: 58.64%M: 25.67%O: 15.69%
0.76% Tram (2000) 20 km N/A
Sources: INSEE, SNCF (Société Nationale des Chemins de fer français), Wikipedia, and researcher
52 High Speed Rail and Population Distribution

Chapter 4: Empirical Analysis of Population Distribution in French Urban Areas
Chart 4-21 Population Share of Central Sub-area all cities
Chart 4-22 Weighted Densities of all Cities
High Speed Rail and Population Distribution 53
1975 1982 1990 1999 20060
1,000
2,000
3,000
4,000
5,000
6,000
5,851
5,137 5,0215,317
5,781
4,356
3,977 3,857 3,915 4,053
2,5862,273 2,255
2,4622,631
2,0271,848 1,751 1,719 1,695
2,2692,095 2,054 2,173 2,208
2,3812,092 2,078 2,210
2,504
LyonLilleNantesLe MansOrleansToulouse
Census Years
Wei
ghte
d D
ensi
ty
1968 1975 1982 1990 1999 200620%
30%
40%
50%
60%
70%
80%
63.88%
53.28%50.41% 49.84%
52.05% 53.02%
38%36%
33% 33% 34% 35%
73%
65%
59%
57%57% 56%
78% 75%
70%66%
64%62%
72%68%
64%60% 60% 59%
81%
71%
64%58%
56% 56%LyonLilleNantesLe MansOrleansToulouse
Census Year
Perc
enta
ge o
f Met
ro A
rea
Popu
latio
n

Chapter 4: Empirical Analysis of Population Distribution in French Urban Areas
The geographic concentration and weighted density trends for Orleans are similar to those of Nantes and Le Mans. The population trend for the Orleans is very close to Nantes, although it had a shallower down slope before the 1990s. The weighted density trend for the city stagnates around 1990 and has very minor growth thereafter. This approximately splits the difference between the trends for Nantes and Le Mans. The size of Orleans is only half of that of Le Mans and a quarter of Nantes.
Toulouse is similar in size to Nantes and exhibits a similar trend in geographic concentration but not in weighted density. The percentage of population in the Toulouse central sub-area dropped more precipitously than in Nantes but leveled out after 1990 at 56%, the same level as Nantes. Weighted density stopped declining in 1990 and began to grow afterwards. In the 1999-2006 period Toulouse's weight density was the second fastest growing on an absolute basis and the fastest on a percentage basis.
It is interesting that the population density trend reversed after 1990, the same year that LGV Atlantique began service. It is doubtful that a handful of five hour trains to and from Paris would impact the urban area development, but timing shows the impossibility of having a true “control” city.
Chart 4-23 Percentage of Urban Area Growth in Central Sub-Area by period
54 High Speed Rail and Population Distribution
Lyon Lille Nantes Le Mans Toulouse Orleans-200%
-150%
-100%
-50%
0%
50%
100%
9%15%
26%
-61%
17%28%
84%
60% 55%
-6%
39%
54%
58%
73%
53%
11%
58%
35%
-90%
-49%
-104%
6%
1975 – 19821982 – 19901990 – 1999 1999 – 2006
Urban Area
Per
cent
age
of T
otal
Met
ro A
rea
Gro
wth
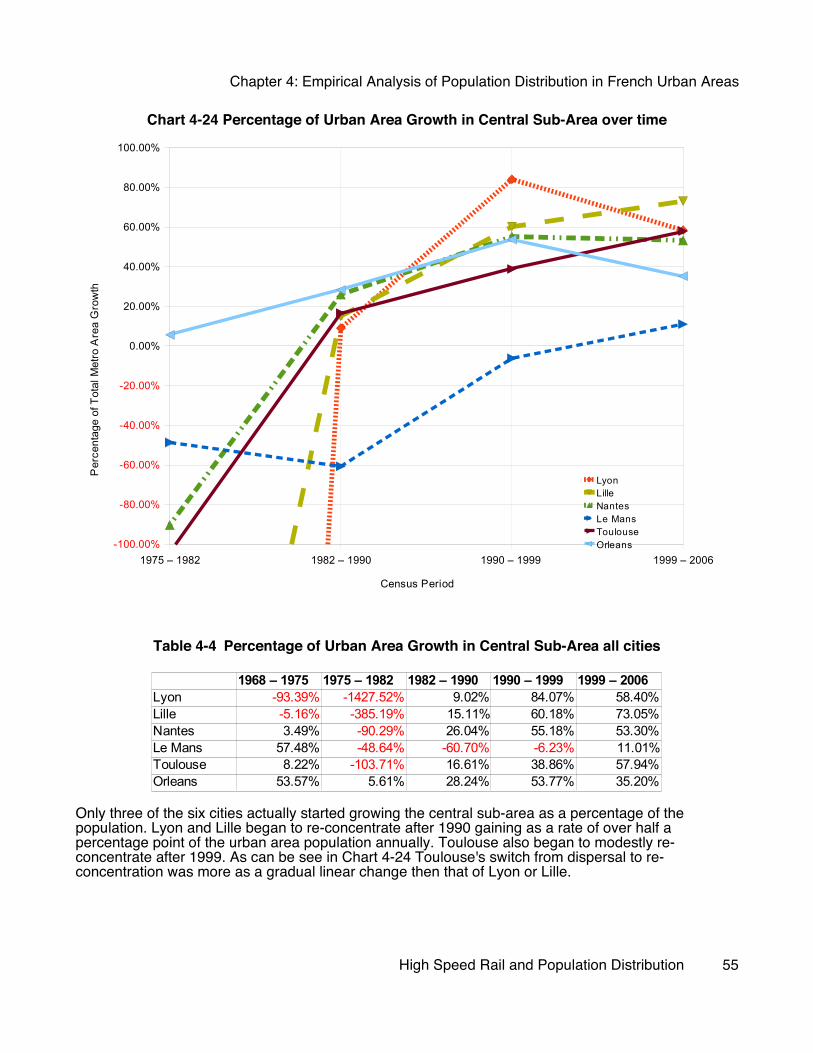
Chapter 4: Empirical Analysis of Population Distribution in French Urban Areas
Chart 4-24 Percentage of Urban Area Growth in Central Sub-Area over time
Table 4-4 Percentage of Urban Area Growth in Central Sub-Area all cities
Only three of the six cities actually started growing the central sub-area as a percentage of the population. Lyon and Lille began to re-concentrate after 1990 gaining as a rate of over half a percentage point of the urban area population annually. Toulouse also began to modestly re-concentrate after 1999. As can be see in Chart 4-24 Toulouse's switch from dispersal to re-concentration was more as a gradual linear change then that of Lyon or Lille.
High Speed Rail and Population Distribution 55
1968 – 1975 1975 – 1982 1982 – 1990 1990 – 1999 1999 – 2006Lyon -93.39% -1427.52% 9.02% 84.07% 58.40%Lille -5.16% -385.19% 15.11% 60.18% 73.05%Nantes 3.49% -90.29% 26.04% 55.18% 53.30%Le Mans 57.48% -48.64% -60.70% -6.23% 11.01%Toulouse 8.22% -103.71% 16.61% 38.86% 57.94%Orleans 53.57% 5.61% 28.24% 53.77% 35.20%
1975 – 1982 1982 – 1990 1990 – 1999 1999 – 2006-100.00%
-80.00%
-60.00%
-40.00%
-20.00%
0.00%
20.00%
40.00%
60.00%
80.00%
100.00%
LyonLilleNantesLe MansToulouseOrleans
Census Period
Per
cent
age
of T
otal
Met
ro A
rea
Gro
wth

Chapter 4: Empirical Analysis of Population Distribution in French Urban Areas
ConclusionAn analysis of the population data shows a transformative and statistically significant change in the distribution of population growth within the both the Lyon and Lille, and to a lesser extent Nantes, urban areas. The three urban areas had a strong dispersal pattern before TGV service started. During the same 1982 – 1990 time period the center cities stopped losing population and began to slowly increase. After 1990 the central sub-areas of Lyon and Lille began to outgrow the urbanized areas as a whole. The centers actually started growing as a percentage of the study-area populations after the start of TGV service, compared to absolute and relative population losses before the introduction of the TGV. In the case of Nantes the central area started to grow in line with the rest of the total urban area leading to a stasis. An analysis of the weighted density shows a re-concentrating trend, as more of the population moves to higher density central areas in all three cases. All of these results are consistent with the predictions that HSR service acts as a central force attracting regional growth towards the station area but do not demonstrate causality.
The Le Mans urban area is the exception in that the dispersal pattern slowed but continued for two census periods after the start of TGV service. The central area only began to gain population in the 1999 – 2006 period, nine years after the start of TGV service. Even then the central area only accounted for 11% of new growth in the urban area (4.10). This result may be the result of the smaller population size and density of the Le Mans urban area. Its population is about one half the size of the Nantes area and a quarter than of the Lille and Lyon areas. The lack of a local rail transit system may be another factor.
The end of dispersion in both the Lyon and Lille urbanized areas and re-concentration of populations after the introduction of TGV supports the hypothesis that high speed rail service would shift the distribution of growth. Accelerating re-concentration in Lille and increasing center focused growth in both areas (Lille and Lyon) from 1999 to 2006, bolsters the case that the effects of high speed rail grows over time. The lesser effect on Nantes, turning dispersion into stasis rather than re-concentration, and Le Mans, slowing but not stopping dispersion, points to the importance of urban area size discussed by Harman and others in the literature (Harman 2006; Givoni 2006, 606; Haynes 1997; Preston 2006). Without a large impact on the economic development on Le Man's urban area, HSR service could have a more limited impact on the area's dispersal pattern. An analysis of the two control cites, Toulouse and Orleans, shows both the effect of city size on the distribution of growth and an overall pattern of slowing dispersal throughout France. As such not all of the changes in TGV cities' growth patterns can be linked to the introduction of HSR service. Rather it is the researchers conclusion that HSR appears to be correlated with, but not the sole cause of the re-concentration.
From an American smart growth perspective, the data shows that France is doing something right. Most french cities are re-concentrating their population in the central part of the urban area and gaining in weighted density. The years from 1981 to 2006 included on only the role out of the TGV network across most of the country but also the reintroduction of local rail transit in most of the selected cities. Further in depth investigation is needed to untangle the causality of these and other factors that have ended dispersal and started re-concentration.
56 High Speed Rail and Population Distribution

Chapter 5: Conclusions
Chapter 5: Conclusions
Effect on Population DistributionSeveral conclusions about HSR's impact on population distribution appear to be supported by the French case studies and existing literature on HSR. The potential effect of HSR on cities appears to be determined in large part by urban area size. The size of an urban area is more important than travel time in determining HSR potential effect. The re-concentration of large French urban areas is occurring, but it has more causes behind it than just the introduction of HSR service. Local rail transit may be an important factor in HSR affected development, as it was re-introduced across the country in the last thirty years. In all the French cities analyzed, the introduction of HSR service coincided with a shift in distribution of growth towards central area. Likewise introduction of HSR coincided with increase in weighted density of all urban areas, except Le Mans. Both literature and observation show greenfield sites do not attract development to them like central city stations do.
LimitationsDetermining HSR's effect on the growth distribution is hampered by two fundamental challenges. First the number of cities that have had HSR for over a decade is limited. Further breaking cities down by size, density, and location on HSR network very quickly reduces the sample size further. Sample sizes of one or two can lead to small sample bias. A more fundamental problem is the complexity of the urban areas themselves. Of the thousands of factors affecting location decisions of urban area residents it is very difficult the tease out turn causal relationships. This is especially true given the limited sample set discussed earlier.The researcher took several steps to mitigate these challenges. By focusing exclusively on French systems no countries were represented by a sample size of one of two cities. Two, low-HSR service or no-HSR service, cities were included to check if larger non-HSR trends were potentially driving the observed changes in growth distribution. The largest “non-HSR” city however still receives a handful of direct TGV trains a day meaning it is not an absolute control for HSR service.
Implication for California Station LocationsTwo important lessons from the analysis of French cities and the literature review are the relationship between city size and HSR impact, and the importance of a highly accessible location. In the French census data the two largest urban areas, Lyon and Lille, showed the greater change in growth distribution and gain in weighted density and geographic re-concentration, respectively. The Literature backed out the importance of city size with regional centers, such as Lyon, receiving greater benefits than smaller “market towns” such as Ashford. In the California Central Valley the most important HSR stations would be in Sacramento, Fresno, and Bakersfield. These cities are already centers for their respective metropolitan areas and will receive great accessibility increases from the HSR network. The economic impact to smaller cities such as Merced, Modesto, and potentially Hanford/Visalia would be much smaller.
The second lesson from the French experience is the importance of placing stations within easy access to existing city centers, especially for smaller cities. The experience of TGV-Picardie, Le-Creusot, and Mâcon-Loché show than businesses that are attracted to HSR do not want to locate in exurban stations far from existing centers and urban amenities. Even the TGV Saint-Exupéry outside of Lyon has not attracted development. Therefore placing CA HSR stations in greenfield sites outside of Central Valley cities would be a mistake.
Potential for Future StudiesThis paper was not able to cover all French cities with HSR service before or around 1999. Further because of limitations on its scope and the data available to the researcher in it did not examine
High Speed Rail and Population Distribution 57

Chapter 5: Conclusions
Spanish or German data. Opportunity exists to extend the same or similar analysis of residential and potentially commercial census data to other european HSR cities. As systems mature and additional census data becomes available many more cities can become subjects for study. Another aspect that could yield valuable information is analysis of the changing development policies of individual HSR cities. Future studies could examine whether strong municipal and/or regional action to develop land around the HSR station, change development regulations, and build transit connections to/from station had a measurable impact compared to cities that took a more passive or limited approach. Finally, the effect of reintroduction of local rail transit service versus HSR service, or the connection and synergies between the two, is an important topic and timely one as Central Valley cities begin planning how to accommodate and take advantage of future HSR stations.
58 High Speed Rail and Population Distribution

Reference List
Reference ListAdministration, Federal Railroad. Northeast corridor. http://www.fra.dot.gov/us/content/643 (accessed
19 April, 2008.
________. Chicago hub network. http://www.fra.dot.gov/us/content/648 (accessed April 11, 2009. Amtrak. 2008a. Northeast corridor new york to washington, dc. Washington, DC: National Railroad
Passenger Corporation.
________. 2008b. Northeast corridor boston to virginia beach. Washington, DC: National Railroad Passenger Corporation.
2000. General plan, by Atwater, City of. Atwater.
California High Speed Rail Authority. 2005a. Final program environmental impact report/environmental impact statement (eir/eis) for the proposed california high-speed train system, by Authority, California High Speed Rail and USDOT Federal Railroad Administration. Sacramento, CA and Washington, D.C.
California High Speed Rail Authority. 2005c. Downtown merced station fact sheet, by ________. Sacramento, CA and Washington, D.C.
Authority, California High-Speed Rail and Federal Railroad Administration. 2005b. Highlights of the final program california high-speed train program eir/eis. Sacramento.
California High-Speed Rail Authority and USDOT Federal Railroad Administration. 2008a. Final bay area to central valley high-speed train (hst) program environmental impact report/ environmental impact statement (eir/eis), by Authority, California High-Speed Rail and USDOT Federal Railroad Administration. Sacramento.
2002. General plan, by Bakersfield, City of. Bakersfield.________. 2006. Greater bakersfield vision 2020first quarter update report.
Bertolini, Luca. 1998. Station area redevelopment in five european countries: An international perspective on a complex planning challenge. International Planning Studies 3, no. 2: 21.
Blum, U., K.E. Haynes, and C. Karlsson. 1997. The regional and urban effects of high-speed trains. Annals of Regional Science, no. 31: 1-20.
Bonnafous, A. 1987. The regional impact of the tgv (original in french). Transportation 14: 127-137.
Bradford, Chris. Perceived density. http://austinzoning.typepad.com/austincontrarian/2008/03/perceived-densi.html (accessed March 1, 2009.
Burchell, Robert w., Naveed a. Shad, David Listokin, and Hilary Phillips. 1998. The costs of sprawl—revisited. Transportation Research Board National Research Council
Bureau, United States Census. Travel to work statistics. http://www.census.gov/acs/www/Products/Profiles/Single/2003/ACS/Narrative/380/NP38000US2840.htmhttp://www.census.gov/acs/www/Products/Profiles/Single/2003/ACS/Narrative/380/NP38000US0680.htm
High Speed Rail and Population Distribution 59
Reference List
http://www.census.gov/acs/www/Products/Profiles/Single/2003/ACS/Narrative/380/NP38000US5170.htmhttp://www.census.gov/acs/www/Products/Profiles/Single/2003/ACS/Narrative/380/NP38000US8120.htmhttp://www.fhwa.dot.gov/ctpp/jtw/jtw4.htm.
Campos, Javier, Ginés de Rus, and Ignacio Barrón. 2006. Some stylized facts about high speed rail
around the world: An empirical approach. Paper presented at 4th Annual Conference on Railroad Industry Structure, Competition and Investment, Universidad Carlos III de Madrid, October 19-21, 2006.
Cerreño, Allison L. C. de and Shishir Mathur. 2006. High-speed rail projects in the united states:
Identifying the elements of success part 2. San Jose: Mineta Transportation Institute.
Cieslewicz, D. J. 2002. The environmental impacts of sprawl. In Urban sprawl: Causes, consequences and policy response, ed. G. D. Squires:23-33: Urban Institute Press.
Coto-Millán, Pablo, Vicente Inglada, and Belén Rey. 2007. Effects of network economies in high-speed rail: The spanish case. Annals of Regional Science 31.
Transportation Research Board. 1993. Rail ridership, service, and markets in the keystone corridor, by Dawson, J A, Transportation Research Record. Washington, DC: Transportation Research Board.
Enterprises, Thomas. The railyards - project description. http://retail.thomasent.com/railyards/project-description.html.
Demographic Research Unit. 2004. Population projections for the san joaquin valley by county (2000-2050), by Finance, California Department of. Sacramento.
Fresno, City of. 2002. 2025 Fresno general plan.
Froidh, O. . 2005. Market effects of regional high-speed trains on the svealand line. Journal of Transport Geography 13: 352-361.
Givoni, Moshe. 2006. Development and impact of the modern high-speed train: A review. Transport Reviews 26, no. 5: 593–611.
Harman, R. 2006. High speed trains and the development and regeneration of cities. London: Greengauge 21.
Hayes, Thomas C. 1991. Texas fast-train franchise given to french-u.S. Group. New York Times, May 29, 1991.
Haynes, Kingsley E. 1997. Labor markets and regional transportation improvements: The case of high-speed trains an introduction and review. Annals of Regional Science 31, no. 1: 19.
INSEE, Institut National de Statistique et des Etudes Economiques. http://www.insee.fr/.
Jacobs, Jane. 1961. The death and life of great american cities.
Kim, Kwang Sik. 2000. High-speed rail developments and spatial restructuring. Cities 17, no. 4: 251–262.
Knox, Stephen. 2006. Can a high speed rail line in the uk help to close the productivity gap between
london & the south east and the regions, and boost economic growth? : Transportation Planning Society.
60 High Speed Rail and Population Distribution

Reference List
Milmo, Dan. 2007. Channel tunnel high-speed rail link set for £5.7bn state sell-off. Guardian Unlimited, 21 Nov 2007.
City of Modesto. 2007. Village one specific plan, by Modesto, City of. Modesto: City of Modesto.
Nelson, E. N. . 2006. More debt? Not so fast. High-speed rail on slow track to reality. Contra Costa Times, November 19.
Office, General Accounting. 2004. Gao-04-94, intercity passenger rail: Amtrak's management of northeast corridor improvements demonstrates need for applying best practices. Washington, DC: General Accounting Office.
Opticos Design, Inc. 2005. Robert j. Cabral station neighborhood: A plan for revitalizing east downtown stockton. Berkeley: San Joaquin Regional Rail Commission.
California High-Speed Rail Authority, U.S. Department of Transportation and Federal Railroad Administration. 2004. Engineering criteria, by Parsons Brinckerhoff Quade & Douglas, Inc., Inc. Kaku Associates, and SYSTRA Consulting Inc., California High-speed Train
Program Environmental Impact Report/Environmental Impact Statement. California High-Speed Rail Authority.
PMC. 2008. Metropolitan bakersfield general plan update public outreach issues report.
Preston, John, Adam Larbie, and Graham Wall. 2006. The impact of high speed trains on socio-economic activity: The case of ashford (kent). Paper presented at 4th Annual Conference on Railroad Industry Structure, Competition and Investment, Universidad Carlos III de Madrid. 2006.
Connecticut General Assembly. 1994. Amtrak new haven-to-boston electrification project, by Research, Office of Legislative. Doc. 94-R-0805, pt. Hartford, CT Office of Legislative Research.
Rietveld, P., F.R. Bruinsma, H.T. van Delft, and B. Ubbels. 2001. Economic impacts of high speed trains experiences in japan and france: Expectations in the netherlands. Amsterdam: Vrije Universiteit Amsterdam.
Riley, Andrew. 2007. France for commuters. The Times, 16 Nov 2007.
Rus, Ginés de and Chris Nash. 2006. In what circumstances is investment in hsr worthwhile? Paper presented at 4th Annual Conference on “Railroad Industry Structure, Competition and Investment”, Universidad Carlos III de Madrid, Spain, October 19th-21st, 2006.
Sands, Brian D. 1993. The development effects of high-speed rail stations and implications for california. Berkeley, CA: Institute of Urban and Regional Development University of California at Berkeley.
Sasaki, Komei, Tadahiro Ohashi, and Asao Ando. 1997. High-speed rail transit impact on regional systems: Does the shinkansen contribute to dispersion? Annals of Regional Science 31, no. 1: 22.
Metropolitan Transportation Commission and the California High-Speed Rail Authority. 2007. Bay area/california high-speed rail ridership and revenue forecasting study, by Systematics, Cambridge, Canapary & Galanis Corey, Mark Bradley Research & Consulting, Inc. HLB Decision Economics, Inc. SYSTRA Consulting, and Citilabs. Sacramento.
High Speed Rail and Population Distribution 61

Reference List
Tillier, Clem. High speed lines. http://www.trainweb.org/tgvpages/map.html (accessed April 10, 2009.
California Department of Transportation. 2007. California state rail plan 2007-08 to 2017-18, by Transportation, California Department of. Sacramento.
Transportation, North Carolina Department of. The northeast: Twenty years of high speed rail. http://www.sehsr.org/reports/time2act/actchapter5.html (accessed 12 April, 2008.
Pennsylvannia Department of Transportation. 2006. Governor rendell, amtrak announce $145 million upgrade of keystone passenger rail service, by Transportation, Pennsylvannia Department of.
VEF. First time buyers look to france... http://www.vefuk.com/sections_fs.aspx?currentsection=7&subsection=newsarticle&intNewsArticleID=5015 (accessed 21 Nov 2007, 2007.
Vickerman, Roger. 1997. High-speed rail in europe: Experience and issues for future development. Annals of Regional Science 31: 17.
Wikipedia. Keystone corridor http://en.wikipedia.org/wiki/Keystone_Corridor (accessed April 11, 2008.
________. Metroliner. http://en.wikipedia.org/wiki/Metroliner (accessed 12 April, 2008.
Willigers, Jasper. 2003. High-speed railway developments and corporate location decisions the role of accessibility. Paper presented at 43rd ERSA Congress, Jyväskylä, August 27-30, 2003.
Willigers, Jasper, Han Floor, and Bert van Wee. 2005. High-speed rail’s impact on the location of office employment within the dutch randstad area. Paper presented at 45th Congress of the European Regional Science Association, Amsterdam, August 23-27, 2005.
62 High Speed Rail and Population Distribution