
High-speed imaging of transient metabolic dynamics using ...
7
High-speed imaging of transient metabolic dynamics using two-photon fluorescence lifetime imaging microscopy ANDREW J. BOWER, 1,2 JOANNE LI, 1,3 ERIC J. CHANEY , 1 MARINA MARJANOVIC, 1,3,4 DAROLD R. SPILLMAN,JR., 1 AND STEPHEN A. BOPPART 1,2,3,4, * 1 Beckman Institute for Advanced Science and Technology, University of Illinois at Urbana-Champaign, 405 N. Mathews Ave, Urbana, Illinois 61801, USA 2 Department of Electrical and Computer Engineering, University of Illinois at Urbana-Champaign, Urbana, Illinois 61801, USA 3 Department of Bioengineering, University of Illinois at Urbana-Champaign, Urbana, Illinois 61801, USA 4 Carle-Illinois College of Medicine, University of Illinois at Urbana-Champaign, Urbana, Illinois 61801, USA *Corresponding author: [email protected] Received 10 July 2018; revised 31 August 2018; accepted 1 September 2018 (Doc. ID 338417); published 16 October 2018 Two-photon fluorescence lifetime imaging microscopy (2P-FLIM) of autofluorescent metabolic coenzymes has been widely used to investigate energetic perturbations in living cells and tissues in a label-free manner with subcellular resolution. While the currently used state-of-the-art instruments are highly sensitive to local molecular changes as- sociated with these metabolic processes, they are inherently slow and limit the study of dynamic metabolic environ- ments. Here, a sustained video-rate 2P-FLIM imaging system is demonstrated for time-lapse lifetime imaging of reduced nicotinamide adenine dinucleotide, an autofluorescent metabolic coenzyme involved in both aerobic and anaerobic processes. This system is sufficiently sensitive to differences in metabolic activity between aggressive and nonaggressive cancer cell lines and is demonstrated for both wide field-of-view autofluorescence imaging as well as sustained video-rate image acquisition of metabolic dynamics following induction of apoptosis. The unique capa- bilities of this imaging platform provide a powerful technological advance to further explore rapid metabolic dynamics in living cells. © 2018 Optical Society of America under the terms of the OSA Open Access Publishing Agreement https://doi.org/10.1364/OPTICA.5.001290 1. INTRODUCTION Label-free optical metabolic imaging techniques capable of prob- ing the energetic pathways within cells and tissues have had an important impact on understanding the role of metabolism in complex tissue microenvironments and in elucidating metabolic disorders associated with many diseases [1]. These techniques, based on the endogenous fluorescence of metabolic coenzymes, have shown great promise, for example, in investigating the tumor microenvironment [2] as well as in determining the efficacy of antitumor drugs at the cellular level [3]. In particular, two-photon fluorescence lifetime imaging microscopy (2P-FLIM), has been shown to be highly sensitive to the chemical and molecular envi- ronment of the fluorophore of interest [4]. When used to image nicotinamide adenine dinucleotide (NADH), an intrinsically fluorescent metabolic coenzyme, relative shifts in aerobic and anaerobic metabolism can be detected with high sensitivity based on the different fluorescence decay rates of unbound and mito- chondrial-bound NADH [5]. This approach has been successfully used in several studies, such as identification of cell death proc- esses both in vivo [6] and in vitro [7], and in a longitudinal in- vestigation of the adverse effects following topical corticosteroid treatment in an in vivo mouse model [8]. Despite the wealth of information provided by 2P-FLIM for metabolic imaging, conventional methods for high-sensitivity imaging are burdened by slow acquisition rates. In modern 2P-FLIM, the most widely used detection method is known as time-correlated single-photon counting (TCSPC) [9]. With this method, the arrival times of single photons are individually re- corded in reference to the excitation laser pulse to construct a histogram estimating the fluorescence decay profile. Due to the photon counting approach as well as the need for relatively low fluorescent photon count rates required for the detection elec- tronics and a high number of collected photons for NADH im- aging, TCSPC for NADH metabolic imaging has a speed restriction currently requiring pixel dwell times potentially on the order of 100 μs, limiting the study of dynamic metabolic mi- croenvironments in point-scanning imaging approaches [1]. This approach has found broad adoption in two-photon fluorescence microscopy, where photon counting detection is commonly per- formed, and low count rates may be typical or acceptable due to the relatively weak two-photon absorption cross sections com- pared to single-photon fluorescence processes [10]. Recently, several strategies have been implemented to increase the throughput of 2P-FLIM systems by using analog measure- ments [11,12]. In particular, recent methods building upon direct 2334-2536/18/101290-07 Journal © 2018 Optical Society of America Research Article Vol. 5, No. 10 / October 2018 / Optica 1290
Transcript of High-speed imaging of transient metabolic dynamics using ...

High-speed imaging of transient metabolicdynamics using two-photon fluorescencelifetime imaging microscopyANDREW J. BOWER,1,2 JOANNE LI,1,3 ERIC J. CHANEY,1 MARINA MARJANOVIC,1,3,4
DAROLD R. SPILLMAN, JR.,1 AND STEPHEN A. BOPPART1,2,3,4,*1Beckman Institute for Advanced Science and Technology, University of Illinois at Urbana-Champaign, 405 N. Mathews Ave, Urbana, Illinois 61801, USA2Department of Electrical and Computer Engineering, University of Illinois at Urbana-Champaign, Urbana, Illinois 61801, USA3Department of Bioengineering, University of Illinois at Urbana-Champaign, Urbana, Illinois 61801, USA4Carle-Illinois College of Medicine, University of Illinois at Urbana-Champaign, Urbana, Illinois 61801, USA*Corresponding author: [email protected]
Received 10 July 2018; revised 31 August 2018; accepted 1 September 2018 (Doc. ID 338417); published 16 October 2018
Two-photon fluorescence lifetime imaging microscopy (2P-FLIM) of autofluorescent metabolic coenzymes has beenwidely used to investigate energetic perturbations in living cells and tissues in a label-free manner with subcellularresolution. While the currently used state-of-the-art instruments are highly sensitive to local molecular changes as-sociated with these metabolic processes, they are inherently slow and limit the study of dynamic metabolic environ-ments. Here, a sustained video-rate 2P-FLIM imaging system is demonstrated for time-lapse lifetime imaging ofreduced nicotinamide adenine dinucleotide, an autofluorescent metabolic coenzyme involved in both aerobic andanaerobic processes. This system is sufficiently sensitive to differences in metabolic activity between aggressiveand nonaggressive cancer cell lines and is demonstrated for both wide field-of-view autofluorescence imaging as wellas sustained video-rate image acquisition of metabolic dynamics following induction of apoptosis. The unique capa-bilities of this imaging platform provide a powerful technological advance to further explore rapid metabolic dynamicsin living cells. © 2018 Optical Society of America under the terms of the OSA Open Access Publishing Agreement
https://doi.org/10.1364/OPTICA.5.001290
1. INTRODUCTION
Label-free optical metabolic imaging techniques capable of prob-ing the energetic pathways within cells and tissues have had animportant impact on understanding the role of metabolism incomplex tissue microenvironments and in elucidating metabolicdisorders associated with many diseases [1]. These techniques,based on the endogenous fluorescence of metabolic coenzymes,have shown great promise, for example, in investigating the tumormicroenvironment [2] as well as in determining the efficacy ofantitumor drugs at the cellular level [3]. In particular, two-photonfluorescence lifetime imaging microscopy (2P-FLIM), has beenshown to be highly sensitive to the chemical and molecular envi-ronment of the fluorophore of interest [4]. When used to imagenicotinamide adenine dinucleotide (NADH), an intrinsicallyfluorescent metabolic coenzyme, relative shifts in aerobic andanaerobic metabolism can be detected with high sensitivity basedon the different fluorescence decay rates of unbound and mito-chondrial-bound NADH [5]. This approach has been successfullyused in several studies, such as identification of cell death proc-esses both in vivo [6] and in vitro [7], and in a longitudinal in-vestigation of the adverse effects following topical corticosteroidtreatment in an in vivo mouse model [8].
Despite the wealth of information provided by 2P-FLIM formetabolic imaging, conventional methods for high-sensitivityimaging are burdened by slow acquisition rates. In modern2P-FLIM, the most widely used detection method is known astime-correlated single-photon counting (TCSPC) [9]. With thismethod, the arrival times of single photons are individually re-corded in reference to the excitation laser pulse to construct ahistogram estimating the fluorescence decay profile. Due to thephoton counting approach as well as the need for relatively lowfluorescent photon count rates required for the detection elec-tronics and a high number of collected photons for NADH im-aging, TCSPC for NADH metabolic imaging has a speedrestriction currently requiring pixel dwell times potentially onthe order of 100 μs, limiting the study of dynamic metabolic mi-croenvironments in point-scanning imaging approaches [1]. Thisapproach has found broad adoption in two-photon fluorescencemicroscopy, where photon counting detection is commonly per-formed, and low count rates may be typical or acceptable due tothe relatively weak two-photon absorption cross sections com-pared to single-photon fluorescence processes [10].
Recently, several strategies have been implemented to increasethe throughput of 2P-FLIM systems by using analog measure-ments [11,12]. In particular, recent methods building upon direct
2334-2536/18/101290-07 Journal © 2018 Optical Society of America
Research Article Vol. 5, No. 10 / October 2018 / Optica 1290
waveform recording techniques have been developed [12–14],which have previously seen use in single-photon fluorescencelifetime imaging [15]. These techniques have shown great prom-ise in increasing the acquisition rate of 2P-FLIM at the cost ofdecreased lifetime sensitivity and signal-to-noise ratio (SNR)compared to TCSPC. However, this imaging approach has notbeen extended to NADH metabolic imaging of cells and tissues,which remains challenging compared to fluorescent tags or dyesdue to the low fluorescence efficiency of NADH and the need forsensitive and accurate lifetime extraction to obtain metabolic con-trast. In this study, a high acquisition-speed, label-free 2P-FLIMsystem is developed specifically to meet these challenges forNADH metabolic imaging and is used to investigate rapidchanges in metabolic pathways in living cells and tissue, overcom-ing traditional speed limitations in high-resolution metabolic im-aging and providing a unique tool to study transient metabolicdynamics with subcellular resolution.
2. MATERIALS AND METHODS
A. System Design
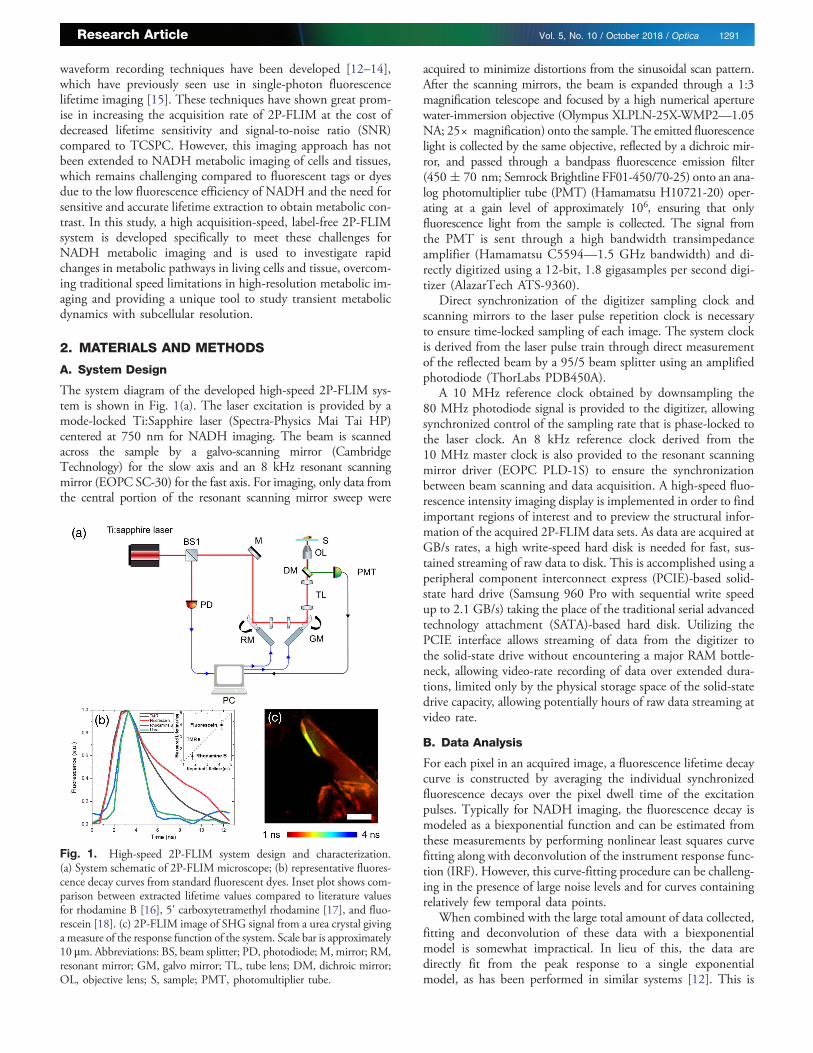
The system diagram of the developed high-speed 2P-FLIM sys-tem is shown in Fig. 1(a). The laser excitation is provided by amode-locked Ti:Sapphire laser (Spectra-Physics Mai Tai HP)centered at 750 nm for NADH imaging. The beam is scannedacross the sample by a galvo-scanning mirror (CambridgeTechnology) for the slow axis and an 8 kHz resonant scanningmirror (EOPC SC-30) for the fast axis. For imaging, only data fromthe central portion of the resonant scanning mirror sweep were
acquired to minimize distortions from the sinusoidal scan pattern.After the scanning mirrors, the beam is expanded through a 1:3magnification telescope and focused by a high numerical aperturewater-immersion objective (Olympus XLPLN-25X-WMP2—1.05NA; 25× magnification) onto the sample. The emitted fluorescencelight is collected by the same objective, reflected by a dichroic mir-ror, and passed through a bandpass fluorescence emission filter(450� 70 nm; Semrock Brightline FF01-450/70-25) onto an ana-log photomultiplier tube (PMT) (Hamamatsu H10721-20) oper-ating at a gain level of approximately 106, ensuring that onlyfluorescence light from the sample is collected. The signal fromthe PMT is sent through a high bandwidth transimpedanceamplifier (Hamamatsu C5594—1.5 GHz bandwidth) and di-rectly digitized using a 12-bit, 1.8 gigasamples per second digi-tizer (AlazarTech ATS-9360).
Direct synchronization of the digitizer sampling clock andscanning mirrors to the laser pulse repetition clock is necessaryto ensure time-locked sampling of each image. The system clockis derived from the laser pulse train through direct measurementof the reflected beam by a 95/5 beam splitter using an amplifiedphotodiode (ThorLabs PDB450A).
A 10 MHz reference clock obtained by downsampling the80 MHz photodiode signal is provided to the digitizer, allowingsynchronized control of the sampling rate that is phase-locked tothe laser clock. An 8 kHz reference clock derived from the10 MHz master clock is also provided to the resonant scanningmirror driver (EOPC PLD-1S) to ensure the synchronizationbetween beam scanning and data acquisition. A high-speed fluo-rescence intensity imaging display is implemented in order to findimportant regions of interest and to preview the structural infor-mation of the acquired 2P-FLIM data sets. As data are acquired atGB/s rates, a high write-speed hard disk is needed for fast, sus-tained streaming of raw data to disk. This is accomplished using aperipheral component interconnect express (PCIE)-based solid-state hard drive (Samsung 960 Pro with sequential write speedup to 2.1 GB/s) taking the place of the traditional serial advancedtechnology attachment (SATA)-based hard disk. Utilizing thePCIE interface allows streaming of data from the digitizer tothe solid-state drive without encountering a major RAM bottle-neck, allowing video-rate recording of data over extended dura-tions, limited only by the physical storage space of the solid-statedrive capacity, allowing potentially hours of raw data streaming atvideo rate.
B. Data Analysis
For each pixel in an acquired image, a fluorescence lifetime decaycurve is constructed by averaging the individual synchronizedfluorescence decays over the pixel dwell time of the excitationpulses. Typically for NADH imaging, the fluorescence decay ismodeled as a biexponential function and can be estimated fromthese measurements by performing nonlinear least squares curvefitting along with deconvolution of the instrument response func-tion (IRF). However, this curve-fitting procedure can be challeng-ing in the presence of large noise levels and for curves containingrelatively few temporal data points.
When combined with the large total amount of data collected,fitting and deconvolution of these data with a biexponentialmodel is somewhat impractical. In lieu of this, the data aredirectly fit from the peak response to a single exponentialmodel, as has been performed in similar systems [12]. This is
Fig. 1. High-speed 2P-FLIM system design and characterization.(a) System schematic of 2P-FLIM microscope; (b) representative fluores-cence decay curves from standard fluorescent dyes. Inset plot shows com-parison between extracted lifetime values compared to literature valuesfor rhodamine B [16], 5' carboxytetramethyl rhodamine [17], and fluo-rescein [18]. (c) 2P-FLIM image of SHG signal from a urea crystal givinga measure of the response function of the system. Scale bar is approximately10 μm. Abbreviations: BS, beam splitter; PD, photodiode; M,mirror; RM,resonant mirror; GM, galvo mirror; TL, tube lens; DM, dichroic mirror;OL, objective lens; S, sample; PMT, photomultiplier tube.
Research Article Vol. 5, No. 10 / October 2018 / Optica 1291

subsequently cast as a linear least squares problem, taking theform of a large linear system of equations to solve for the fluo-rescence lifetime. When analyzed in this manner, a 2-min longacquisition at 20 fps (2400 data sets total) can be processedand analyzed in under 15 min using MATLAB, with much ofthis processing time spent on reading large data sets into memory.All data, excluding lifetime fitting from standard fluorescentdyes where deconvolution was performed, were processed in thismanner. Finally, color-coding of the 2P-FLIM data was overlaidon the gray-scale fluorescence intensity images to coregister thisstructural and functional information.
C. Cell Culture
MCF-7 and MDA-MB-231 cells were plated in glass bottom im-aging dishes (MatTek P35GC-0-14-C) in phenol red-free media(MEM alpha for MCF-7, Leibovitz’s L-15 for MDA-MB-231)supplemented with 10% fetal bovine serum and antibiotics.Cells were imaged within 72 hours of plating based on conflu-ency. All imaging was performed in ambient conditions at roomtemperature as all imaging in these studies was completedwithin 30 min.
To first assess the fluorescence lifetime contrast capabilities ofthe high-speed 2P-FLIM system, fluorescence decay curves wereobtained from several standard fluorescent dyes including rhod-amine B, 5’ carboxytetramethyl rhodamine (TMR), and fluores-cein [Fig. 1(b)]. Plots of these measured decays along with the IRFobtained through detecting second-harmonic generation (SHG)radiation from urea crystals show clear differences between thevarious fluorophores. To assess the accuracy of these measure-ments, the decays were deconvolved and fit to a single exponentialmodel using the empirical IRF to obtain a lifetime measurementfor each dye. The inset of Fig. 1(b) shows a direct comparisonof the extracted lifetime values to previously reported values.The correlation between measured lifetime with this high-speed2P-FLIM system and previously reported values indicates that theimaging system is capable of reliable lifetime contrast.
To demonstrate the imaging capabilities of this system,256 pixel × 256 pixel 2P-FLIM images were acquired at 20frames per second (fps) of urea crystals, which are known to pro-duce SHG [Fig. 1(c)]. The crystal structure with short lifetimevalues corresponding to the near-instantaneous decay of the SHGprocess can be clearly visualized, confirming the high-resolutionperformance of this system.
3. RESULTS AND DISCUSSION
A. Large Field-of-View Imaging
To demonstrate the potential of this imaging platform forNADH metabolic imaging, Fig. 2 shows results of autofluores-cence imaging of cells and tissue. A large field-of-view (FOV)2P-FLIM mosaic was obtained from a 10 μm thick section offixed rat testis tissue [Fig. 2(a)]. The acquisition was performedby acquiring a 10 × 10mosaic of 250 μm × 250 μm FOV images,with approximately 30 averages per stage position recorded at20 fps. These images were then merged together using MosaicJ,a stitching and blending plugin for ImageJ [19]. Previously in ourlab, a similar mosaicking procedure was performed utilizing aTCSPC-based approach requiring approximately 3 h to acquirea 10 × 10 image mosaic [20]. Here, the full mosaic, spanningapproximately 2 mm × 2 mm, was acquired in under 5 min,
representing an approximately 36-fold increase in throughput for2P-FLIM autofluorescence imaging.
It has been reported previously that the dominant autofluor-escent components of this tissue are intracellular NADH andshorter lifetime elastin, present in the fibrous capsules surround-ing the seminiferous tubules [21]. The shorter lifetime from elas-tin [Fig. 2(b), white arrows] can be clearly observed, compared tothe longer lifetime of NADH. By constructing a histogram of life-time values from the pixels in this mosaic, the presence of thesetwo fluorophores can be clearly identified as a large, longer life-time peak, belonging to NADH and a shorter lifetime shoulderdue to elastin [Fig. 2(c), blue arrow]. The speed of this imagingprocedure can be potentially increased even further, by extendingthe FOV of a single frame (using wider scan parameters) as well asaveraging over a smaller number of images, trading off SNR forimaging speed.
B. In Vitro Metabolic Imaging
To determine the metabolic sensitivity of this system, in vitro cel-lular imaging was performed with two well-established breastcancer cell lines with distinct metabolic profiles, MDA-MB-231 [Fig. 2(d)] and MCF-7 [Fig. 2(e)]. Specifically, MCF-7 isa noninvasive, less aggressive cell line known to rely more on ox-idative phosphorylation than the highly aggressive MDA-MB-231 cell line, which shows increased levels of aerobic glycolysis[22]. Imaging results using the high-speed 2P-FLIM microscopereveal a statistically significant increase in cytoplasmic NADHfluorescence lifetime in MCF-7 compared to MDA-MB-231 cells[Fig. 2(f )], showing clear sensitivity to the increased glycolyticactivity in MDA-MB-231 cell line that has been reportedpreviously [3]. Functional mapping of individual cells with thishigh-throughput imaging system can provide new insight intometabolic pathways in cells, and can be used to identify metabolicheterogeneity within complex cellular environments with the abil-ity to sample a much larger number of cells than traditionalTCSPC-based 2P-FLIM systems.
C. High-speed Metabolic Imaging of Cell DeathDynamics
To further demonstrate the capability of this system for trackingtransient metabolic activity, the complex and dynamic process ofapoptosis was investigated. Apoptosis, or programmed cell death,is an essential process in development and homeostasis in livingorganisms, and disruptions in metabolic pathways can lead to avariety of pathologies, including tumor development [23]. On theother hand, this form of cell death is often the desired outcome fora variety of commonly used anticancer therapeutic compounds,including doxorubicin and paclitaxel [24–26]. In vitro and in vivostudies of apoptosis suggest a strong early NADH lifetime re-sponse to apoptotic stimuli within minutes of treatment, butcould not be further studied due to imaging speed limitations[6,7,27,28].
To further investigate this early response, the high-speed 2P-FLIM system was optimized for fast longitudinal imaging of livingcells in vitro. Apoptosis was induced in MCF-7 cells with the ad-dition of 5 μM staurosproine (STS) approximately 10 s followingthe start of 2P-FLIM imaging at 20 fps for a total duration of ap-proximately 2 min (Fig. 3 and Visualization 1). Treatment withmicromolar level doses of STS is well documented to efficiently
Research Article Vol. 5, No. 10 / October 2018 / Optica 1292

induce apoptosis in a large majority of the MCF-7 cell population[29,30]. Resulting images are displayed as averages over 20 frames.
Snapshots of both fluorescence intensity [Figs. 3(a)–3(c)]and lifetime [Figs. 3(d)–3(f )] at 0 s [Figs. 3(a) and 3(d)], 20 s[Figs. 3(b) and 3(e)], and 70 s [Figs. 3(c) and 3(f )] followingthe start of imaging show a statistically significant increase in boththe fluorescence intensity [Fig. 3(i)] and lifetime [Fig. 3(j)] inanalyzed single cells at 20 s that occurs on the order of secondsand persists for minutes following addition of STS. To reducethe effect of the background and nuclear regions during image
analysis, the cell cytoplasm regions from each cell were extractedand used for quantification of fluorescence dynamics. Segmentationwas performed using the software package CellProfiler [31] to isolatecell cytoplasm regions.
Immediately following the sharp increase after addition ofSTS, a decrease in NADH lifetime is observed, recovering to anelevated level compared to baseline [Fig. 3(h)]. Segmentationof NADH signals from the cell cytoplasm [segmentation mapin Fig. 3(c)] shows statistically significant increases in both fluo-rescence intensity and lifetime comparing at 0 and 20 s using a
Fig. 2. High-throughput NADH 2P-FLIM imaging. (a) Wide FOV mosaic of a rat testis specimen acquired in under 5 min; (b) zoomed region from(a) corresponding to red box. White arrows correspond to elastin fluorescence from the fibrous cap of the seminiferous tubules. (c) Lifetime histogram ofthe acquired mosaic. The large peak corresponds to the NADH fluorescence, while the lower lifetime shoulder (blue arrow) corresponds to the elastinfluorescence. (d), (e) High-speed NADH 2P-FLIM images of (d) MDA-MB-231 and (e) MCF-7 cells; (f ) statistical analysis comparing cytoplasmiclifetime from the two cell lines. Bar chart values represent mean ± s.e.m. (N � 17 for each group). Scale bar in (a) is 250 μm. Scale bar in (d), (e) isapproximately 50 μm. �p < 0.01.
Research Article Vol. 5, No. 10 / October 2018 / Optica 1293
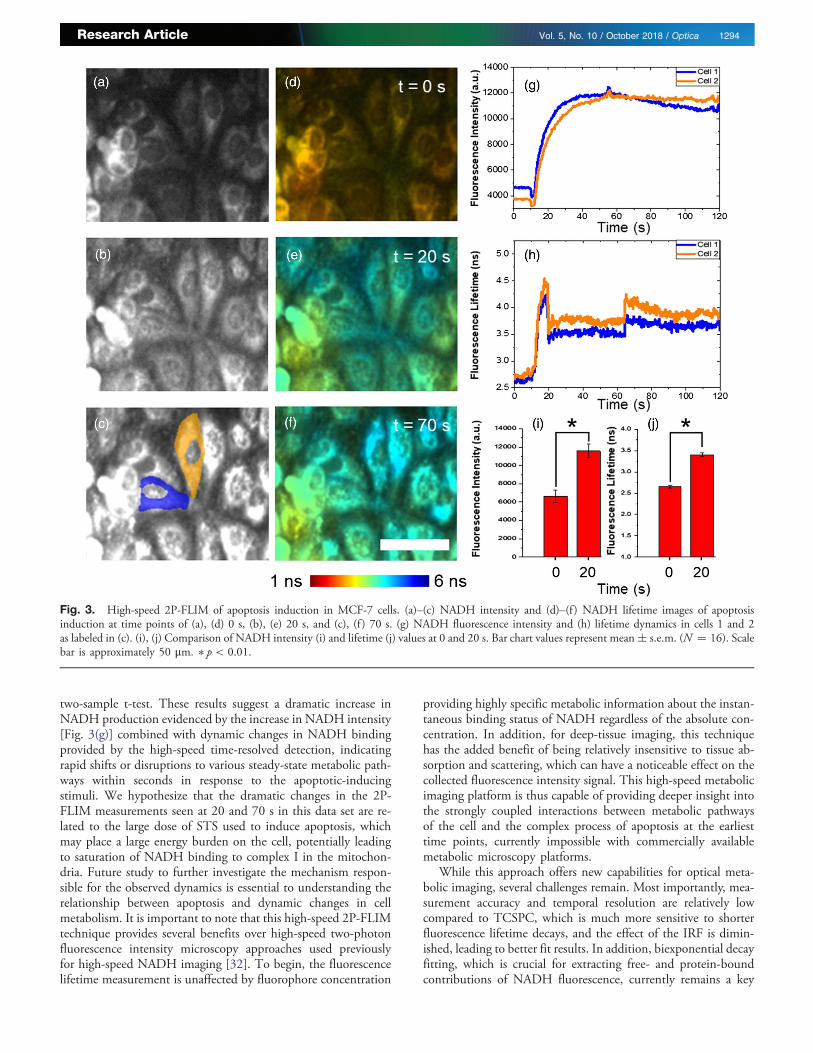
two-sample t-test. These results suggest a dramatic increase inNADH production evidenced by the increase in NADH intensity[Fig. 3(g)] combined with dynamic changes in NADH bindingprovided by the high-speed time-resolved detection, indicatingrapid shifts or disruptions to various steady-state metabolic path-ways within seconds in response to the apoptotic-inducingstimuli. We hypothesize that the dramatic changes in the 2P-FLIM measurements seen at 20 and 70 s in this data set are re-lated to the large dose of STS used to induce apoptosis, whichmay place a large energy burden on the cell, potentially leadingto saturation of NADH binding to complex I in the mitochon-dria. Future study to further investigate the mechanism respon-sible for the observed dynamics is essential to understanding therelationship between apoptosis and dynamic changes in cellmetabolism. It is important to note that this high-speed 2P-FLIMtechnique provides several benefits over high-speed two-photonfluorescence intensity microscopy approaches used previouslyfor high-speed NADH imaging [32]. To begin, the fluorescencelifetime measurement is unaffected by fluorophore concentration
providing highly specific metabolic information about the instan-taneous binding status of NADH regardless of the absolute con-centration. In addition, for deep-tissue imaging, this techniquehas the added benefit of being relatively insensitive to tissue ab-sorption and scattering, which can have a noticeable effect on thecollected fluorescence intensity signal. This high-speed metabolicimaging platform is thus capable of providing deeper insight intothe strongly coupled interactions between metabolic pathwaysof the cell and the complex process of apoptosis at the earliesttime points, currently impossible with commercially availablemetabolic microscopy platforms.
While this approach offers new capabilities for optical meta-bolic imaging, several challenges remain. Most importantly, mea-surement accuracy and temporal resolution are relatively lowcompared to TCSPC, which is much more sensitive to shorterfluorescence lifetime decays, and the effect of the IRF is dimin-ished, leading to better fit results. In addition, biexponential decayfitting, which is crucial for extracting free- and protein-boundcontributions of NADH fluorescence, currently remains a key
Fig. 3. High-speed 2P-FLIM of apoptosis induction in MCF-7 cells. (a)–(c) NADH intensity and (d)–(f ) NADH lifetime images of apoptosisinduction at time points of (a), (d) 0 s, (b), (e) 20 s, and (c), (f ) 70 s. (g) NADH fluorescence intensity and (h) lifetime dynamics in cells 1 and 2as labeled in (c). (i), (j) Comparison of NADH intensity (i) and lifetime (j) values at 0 and 20 s. Bar chart values represent mean� s.e.m. (N � 16). Scalebar is approximately 50 μm. � p < 0.01.
Research Article Vol. 5, No. 10 / October 2018 / Optica 1294
challenge with the high-speed 2P-FLIM system due to the lowtemporal resolution constrained by the speed of the digitizer.The fast imaging performed here, in addition with the weakfluorescence from NADH, increases the potential risk of photo-damage. While no apparent photodamage was observed in theanalyzed regions of the data sets shown here, laser parameters suchas central wavelength, repetition rate, and pulse energy must beoptimized and studied in the context of cell viability to know theeffects of this imaging. Finally, while the acquisition speed of thissystem is increased compared to traditional TCSPC, the currentprocessing techniques utilized prevent real-time display of 2P-FLIM images. This can be potentially overcome through theuse of fast, parallel algorithms utilizing the graphics processingunit of the PC or the field-programmable gate array of a fast digi-tizer, potentially allowing high-speed biexponential fitting of fluo-rescence decay curves [11]. With increasing speeds of PC-baseddigitizers, as well as the incorporation of clever digitizationschemes combined with utilization of fast, sensitive detectors suchas multichannel plate PMTs, these issues can be resolved, increas-ing the sensitivity of the system while still permitting video-rateacquisition.
4. CONCLUSIONS
The high-speed 2P-FLIM system presented here has the potentialto enable a variety of biological and clinical studies. This new ap-proach provides an important tool for investigating a wide varietyof highly dynamic metabolic processes and disorders in livingcells. Further development of this technology could furtherenable important, but currently challenging tasks, such as high-throughput label-free metabolic cell screening, paving the way fora deeper understanding of the metabolic processes underlyingcomplex cellular activity, which is important for both basicbiological research and clinical translation of these discoveries.
Funding. National Institute of Biomedical Imaging andBioengineering (NIBIB) (R01 EB023232); National CancerInstitute (NCI) (R01 CA213149); Air Force Office of ScientificResearch (AFOSR) (FA9550-17-1-0387); National ScienceFoundation (NSF) (DGE-1144245); National Institutes ofHealth (NIH) (T32 EB019944).
Acknowledgment. A. J. B. was supported in part by a NSFGraduate Research Fellowship and by a Beckman GraduateStudent Fellowship. J. L. was supported in part by an NIHT32 Tissue Microenvironment training grant. Schematic com-ponents in Fig. 1 were created using ComponentLibrary byAlexander Franzen (http://www.gwoptics.org/ComponentLibrary).Additional information can be found at http://biophotonics.illinois.edu. Ninety percent of the total project costs was financedwith federal money and ten percent was financed by nongovern-mental sources. The content is solely the responsibility of theauthors and does not necessarily represent the official views ofthe National Institutes of Health.
REFERENCES
1. Z. Liu, D. Pouli, C. A. Alonzo, A. Varone, S. Karaliota, K. P. Quinn, K.Münger, K. P. Karalis, and I. Georgakoudi, “Mapping metabolic changesby noninvasive, multiparametric, high-resolution imaging using endog-enous contrast,” Sci. Adv. 4, eaap9302 (2018).
2. M. C. Skala, K. M. Riching, A. Gendron-Fitzpatrick, J. Eickhoff, K. W.Eliceiri, J. G. White, and N. Ramanujam, “In vivo multiphoton microscopyof NADH and FAD redox states, fluorescence lifetimes, and cellularmorphology in precancerous epithelia,” Proc. Natl. Acad. Sci. USA104, 19494–19499 (2007).
3. A. J. Walsh, R. S. Cook, H. C. Manning, D. J. Hicks, A. Lafontant, C. L.Arteaga, and M. C. Skala, “Optical metabolic imaging identifies glycolyticlevels, subtypes, and early-treatment response in breast cancer,”CancerRes. 73, 6164–6174 (2013).
4. H. C. Gerritsen, M. A. H. Asselbergs, A. V. Agronskaia, and W. G. J. H.M. Van Sark, “Fluorescence lifetime imaging in scanning microscopes:acquisition speed, photon economy and lifetime resolution,” J. Microsc.206, 218–224 (2002).
5. J. R. Lakowicz, H. Szmacinski, K. Nowaczyk, and M. L. Johnson,“Fluorescence lifetime imaging of free and protein-bound NADH,”Proc. Natl. Acad. Sci. USA 89, 1271–1275 (1992).
6. A. J. Bower, M. Marjanovic, Y. Zhao, J. Li, E. J. Chaney, and S. A.Boppart, “Label‐free in vivo cellular‐level detection and imaging ofapoptosis,” J. Biophoton. 10, 143–150 (2017).
7. Y. Zhao, M. Marjanovic, E. J. Chaney, B. W. Graf, Z. Mahmassani, M. D.Boppart, and S. A. Boppart, “Longitudinal label-free tracking of cell deathdynamics in living engineered human skin tissue with a multimodalmicroscope,” Biomed. Opt. Express 5, 3699–3716 (2014).
8. A. J. Bower, Z. Arp, Y. Zhao, J. Li, E. J. Chaney, M. Marjanovic, A.Hughes‐Earle, and S. A. Boppart, “Longitudinal in vivo tracking ofadverse effects following topical steroid treatment,” Exp. Dermatol. 25,362–367 (2016).
9. W. Becker, A. Bergmann, M. A. Hink, K. König, K. Benndorf, and C.Biskup, “Fluorescence lifetime imaging by time‐correlated single‐photoncounting,” Microsc. Res. Tech. 63, 58–66 (2004).
10. G. J. Brakenhoff, M. Müller, and R. I. Ghauharali, “Analysis of efficiencyof two‐photon versus single‐photon absorption for fluorescence gener-ation in biological objects,” J. Microsc. 183, 140–144 (1996).
11. J. Ryu, U. Kang, J. Kim, H. Kim, J. H. Kang, H. Kim, D. K. Sohn, J.-H.Jeong, H. Yoo, and B. Gweon, “Real-time visualization of two-photonfluorescence lifetime imaging microscopy using a wavelength-tunablefemtosecond pulsed laser,” Biomed. Opt. Express 9, 3449–3663 (2018).
12. X. Y. Dow, S. Z. Sullivan, R. D. Muir, and G. J. Simpson, “Video-rate two-photon excited fluorescence lifetime imaging system with interleaveddigitization,” Opt. Lett. 40, 3296–3299 (2015).
13. M. Eibl, S. Karpf, D. Weng, H. Hakert, T. Pfeiffer, J. P. Kolb, and R.Huber, “Single pulse two photon fluorescence lifetime imaging (SP-FLIM) with MHz pixel rate,” Biomed. Opt. Express 8, 3132–3142 (2017).
14. M. G. Giacomelli, Y. Sheikine, H. Vardeh, J. L. Connolly, and J. G.Fujimoto, “Rapid imaging of surgical breast excisions using direct tem-poral sampling two photon fluorescent lifetime imaging,” Biomed. Opt.Express 6, 4317–4325 (2015).
15. L. Marcu, “Fluorescence lifetime techniques in medical applications,”Ann. Biomed. Eng. 40, 304–331 (2012).
16. N. Boens, W. Qin, N. Basarić, J. Hofkens, M. Ameloot, J. Pouget,J.-P. Lefèvre, B. Valeur, E. Gratton, M. vandeVen, N. D. Silva, Y.Engelborghs, K. Willaert, A. Sillen, G. Rumbles, D. Phillips,A. J. W. G. Visser, A. van Hoek, J. R. Lakowicz, H. Malak, I.Gryczynski, A. G. Szabo, D. T. Krajcarski, N. Tamai, and A. Miura,“Fluorescence lifetime standards for time and frequency domain fluores-cence spectroscopy,” Anal. Chem. 79, 2137–2149 (2007).
17. J. R. Unruh, G. Gokulrangan, G. S. Wilson, and C. K. Johnson,“Fluorescence properties of fluorescein, tetramethylrhodamine andTexas Red linked to a DNA aptamer,” Photochem. Photobiol. 81,682–690 (2005).
18. D. Magde, G. E. Rojas, and P. G. Seybold, “Solvent dependence of thefluorescence lifetimes of xanthene dyes,” Photochem. Photobiol. 70,737–744 (1999).
19. T. Philippe and U. Michael, “User‐friendly semiautomated assemblyof accurate image mosaics in microscopy,” Microsc. Res. Tech. 70,135–146 (2007).
20. A. J. Bower, B. Chidester, J. Li, Y. Zhao, M. Marjanovic, E. J. Chaney,M. N. Do, and S. A. Boppart, “A quantitative framework for the analysis ofmultimodal optical microscopy images,” Quant. Imaging Med. Surg. 7,24–37 (2017).
21. S. Vesuna, R. Torres, and M. J. Levene, “Multiphoton fluorescence,second harmonic generation, and fluorescence lifetime imaging of wholecleared mouse organs,” J. Biomed. Opt. 16, 106009 (2011).
Research Article Vol. 5, No. 10 / October 2018 / Optica 1295

22. R. A. Gatenby and R. J. Gillies, “Why do cancers have high aerobicglycolysis?” Nat. Rev. Cancer 4, 891–899 (2004).
23. C. Thompson, “Apoptosis in the pathogenesis and treatment of disease,”Science 267, 1456–1462 (1995).
24. R. Gerl and D. L. Vaux, “Apoptosis in the development and treatment ofcancer,” Carcinogenesis 26, 263–270 (2005).
25. A. V. Miller, M. A. Hicks, W. Nakajima, A. C. Richardson, J. J. Windle,and H. Harada, “Paclitaxel-induced apoptosis Is BAK-dependent, butBAX and BIM-independent in breast tumor,” PLoS ONE 8, e60685(2013).
26. S. Wang, E. A. Konorev, S. Kotamraju, J. Joseph, S. Kalivendi, andB. Kalyanaraman, “Doxorubicin induces apoptosis in normal andtumor cells via distinctly different mechanisms,” J. Biol. Chem. 279,25535–25543 (2004).
27. H.-W. Wang, V. Ghukasyan, C.-T. Chen, Y.-H. Wei, H.-W. Guo, J.-S. Yu,and F.-J. Kao, “Differentiation of apoptosis from necrosis by dynamicchanges of reduced nicotinamide adenine dinucleotide fluorescencelifetime in live cells,” J. Biomed. Opt. 13, 054011 (2008).
28. J.-S. Yu, H.-W. Guo, H.-W. Wang, C.-H. Wang, and Y.-H. Wei,“Increase of reduced nicotinamide adenine dinucleotide fluorescencelifetime precedes mitochondrial dysfunction in staurosporine-inducedapoptosis of HeLa cells,” J. Biomed. Opt. 16, 036008 (2011).
29. L. M. Mooney, K. A. Al-Sakkaf, B. L. Brown, and P. R. M. Dobson,“Apoptotic mechanisms in T47D and MCF-7 human breast cancer cells,”Br. J. Cancer 87, 909–917 (2002).
30. L.-Y. Xue, S.-M. Chiu, and N. L. Oleinick, “Staurosporine-induced deathof MCF-7 human breast cancer cells: a distinction between caspase-3-dependent steps of apoptosis and the critical lethal lesions,” Exp.Cell Res. 283, 135–145 (2003).
31. A. E. Carpenter, T. R. Jones, M. R. Lamprecht, C. Clarke, I. H. Kang, O.Friman, D. A. Guertin, J. H. Chang, R. A. Lindquist, J. Moffat, P. Golland,and D. M. Sabatini, “CellProfiler: image analysis software for identifyingand quantifying cell phenotypes,” Genome Biol. 7, R100 (2006).
32. A. M. D. Lee, H. Wang, Y. Yu, S. Tang, J. Zhao, H. Lui, D. McLean, andH. Zeng, “In vivo video rate multiphoton microscopy imaging of humanskin,” Opt. Lett. 36, 2865–2867 (2011).
Research Article Vol. 5, No. 10 / October 2018 / Optica 1296


![Quantitative Metabolomics and Instationary 13C-Metabolic Flux Analysis ... · Recently, Jordà and co-workers [25] applied transient 13C metabolic flux analysis to analyze P. pastoris](https://static.fdocuments.in/doc/165x107/5eba3c5ae3b2371ce01c915b/quantitative-metabolomics-and-instationary-13c-metabolic-flux-analysis-recently.jpg)


