High School Reform in Florida How do we ensure success for each student?
50
1 High School Reform in Florida How do we ensure success for each student?
-
Upload
tyrone-montoya -
Category
Documents
-
view
23 -
download
0
description
High School Reform in Florida How do we ensure success for each student?. Luke Levesque. The Cost of Failure. More than two-thirds of inmates in America’s prisons are high school dropouts. High school dropouts are 25 times more likely to be on Medicaid than college graduates. - PowerPoint PPT Presentation
Transcript of High School Reform in Florida How do we ensure success for each student?

1
High School Reform in Florida
How do we ensure success for each student?

2
Luke Levesque

3
The Cost of Failure
More than two-thirds of inmates in America’s prisons are high school dropouts.
High school dropouts are 25 times more likely to be on Medicaid than college graduates.
High school dropouts earn about $260,000 less over a lifetime than a high school graduate and pays about $60,000 in taxes.
If all high school dropouts who are single mothers earned a high school degree, welfare costs would be reduced $1.5 to 3.5 billion annually.
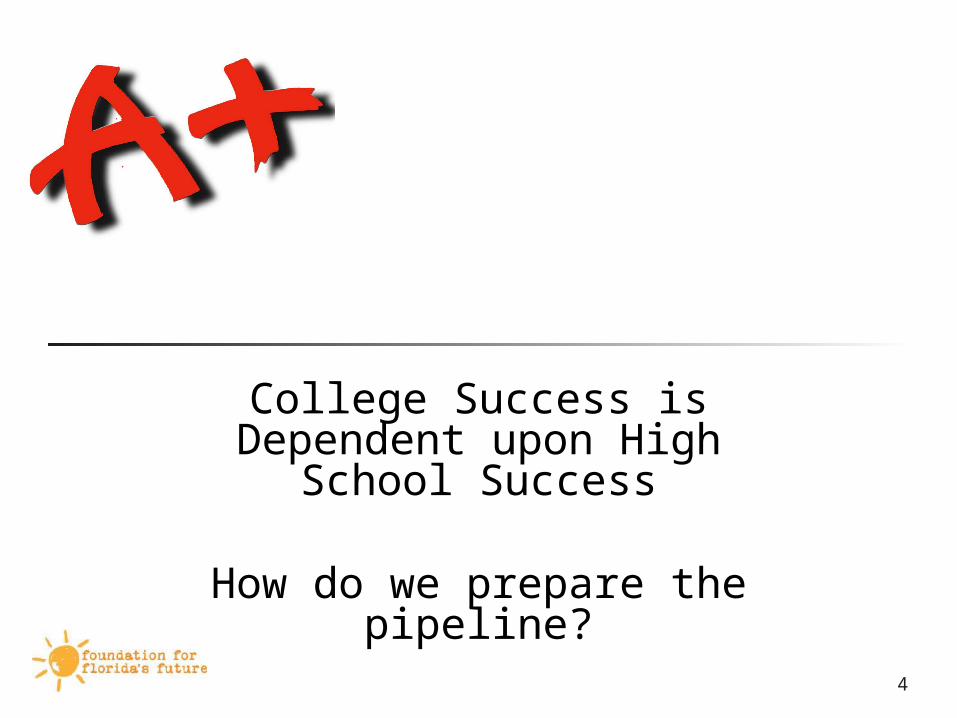
4
College Success is Dependent upon High School Success
How do we prepare the pipeline?
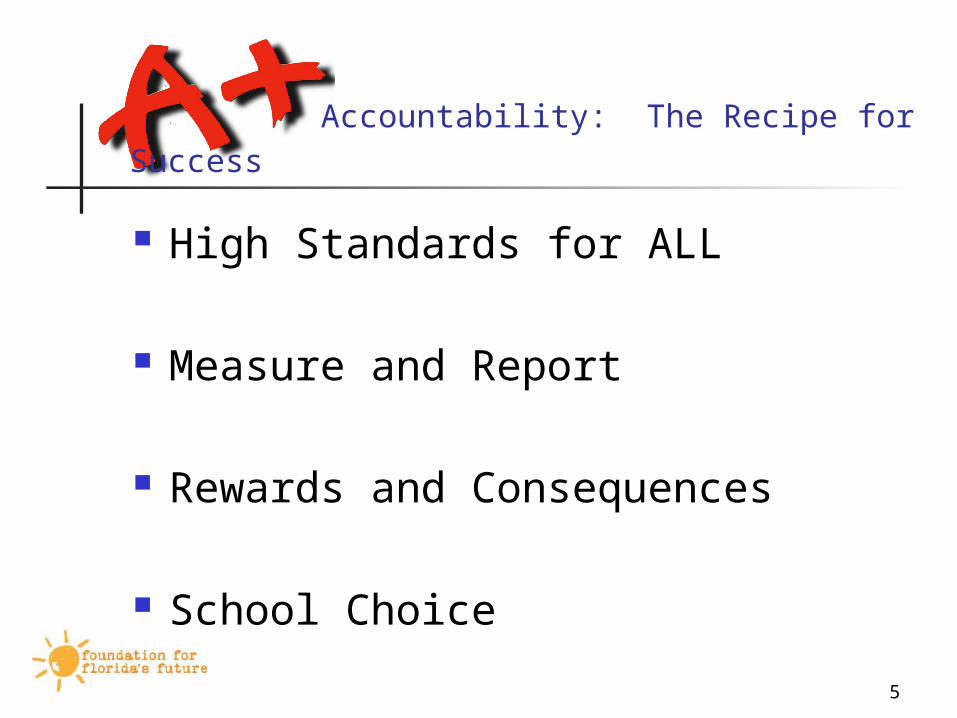
5
Accountability: The Recipe for Success
High Standards for ALL
Measure and Report
Rewards and Consequences
School Choice

6
Graduation Rates
1990 – 1998
Graduation rate declined by nearly 7%
1999 – 2007
Graduation rate increased by more than 12%
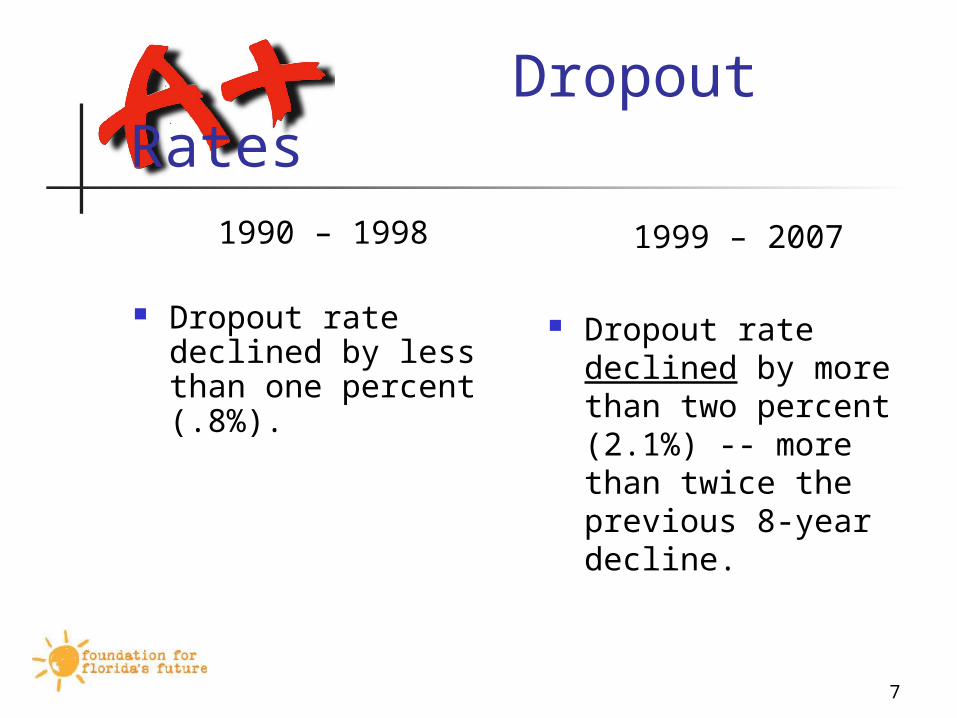
7
Dropout Rates
1990 – 1998
Dropout rate declined by less than one percent (.8%).
1999 – 2007
Dropout rate declined by more than two percent (2.1%) -- more than twice the previous 8-year decline.

8
High Standards for ALL
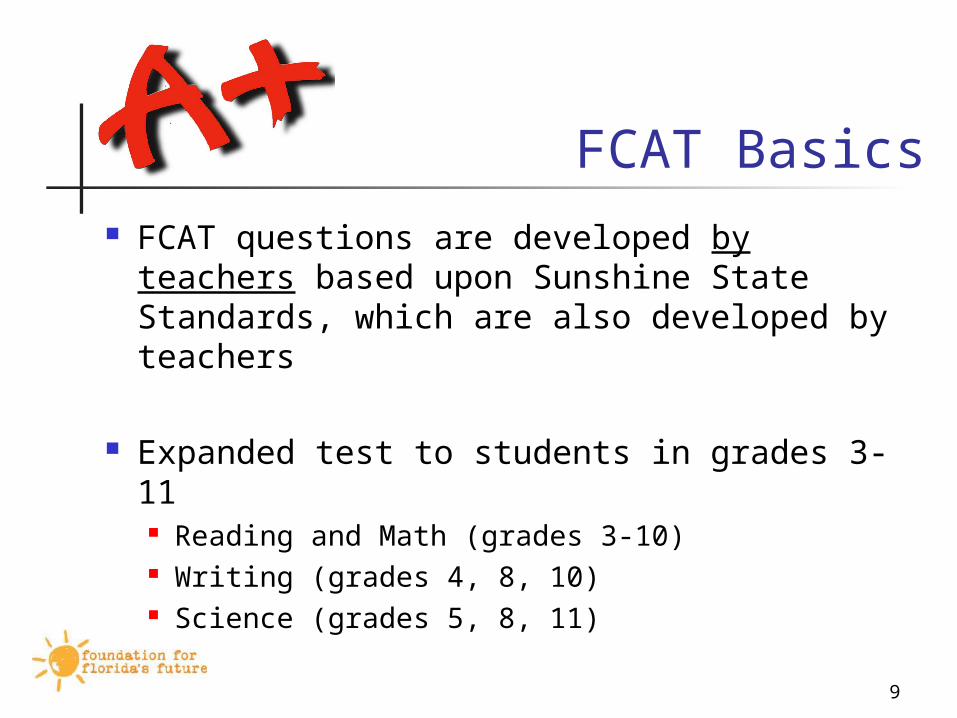
FCAT
9
FCAT Basics FCAT questions are developed by
teachers based upon Sunshine State Standards, which are also developed by teachers
Expanded test to students in grades 3-11 Reading and Math (grades 3-10) Writing (grades 4, 8, 10) Science (grades 5, 8, 11)

10
FCAT Basics
More than 700 teachers, principals, and parents review every FCAT question before it is put on the test
Any one person can veto a potential question

11
Student Performance Levels
Level 5 Above grade level
Level 4
Level 3 – GRADE LEVEL
Level 2Below
grade level Level 1

12
Measure and Report
School Grades

13
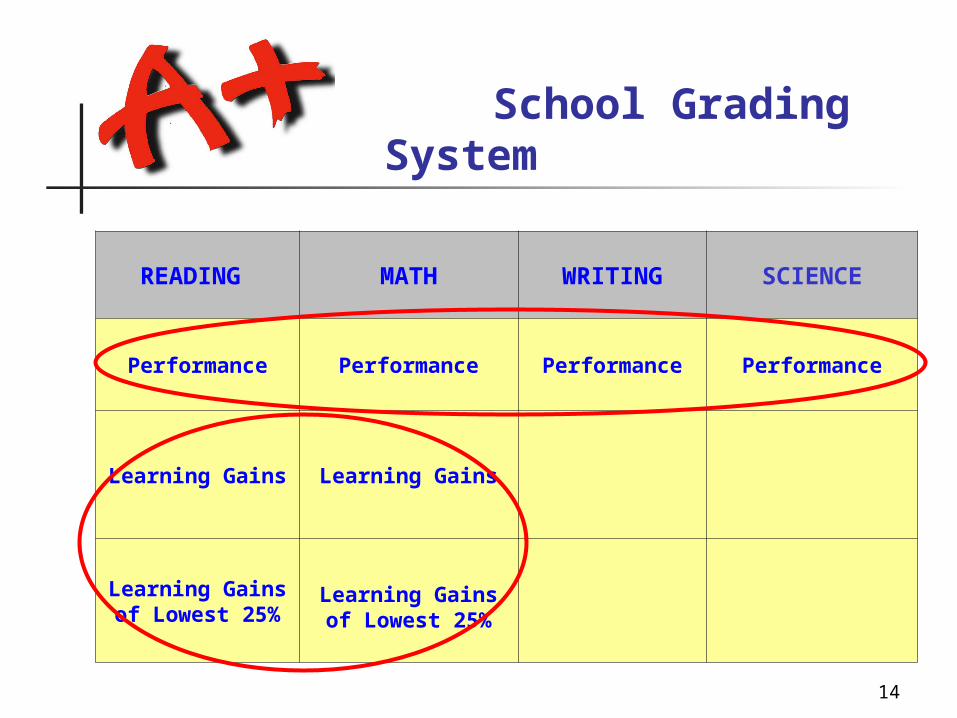
School Grading System
Performance – percent of students on grade level
Learning Gains – percent of students making a year’s worth of progress, regardless of whether they are on grade level
Learning Gains of lowest 25% -- percent of lowest performing students making learning gains*
(*KEY MEASURE FOR MINORITY & UNDERREPRESENTED STUDENTS)
14
School Grading System
READING MATH WRITING SCIENCE
Performance Performance Performance Performance
Learning Gains Learning Gains
Learning Gains of Lowest 25%
Learning Gains of Lowest 25%

15
Sunshine Middle School
READING MATH WRITING SCIENCE
Performance
63%
Performance
69%
Performance
75%
Performance
56%
Learning Gains
66%
Learning Gains
68%
Learning Gains of Lowest 25%
57%
Learning Gains of Lowest 25%
54%
508 points = B

16
School Grading System
A B C D F# points
525 pointsor more
495 - 524 points
435 - 494 points
395 - 434 points
Fewer than395
points

17
School Grade Changes
In 2009-2010 school year, high school grades will include other factors: Graduation Rate At-risk Graduation Rate Acceleration Rates College Readiness Rates
18
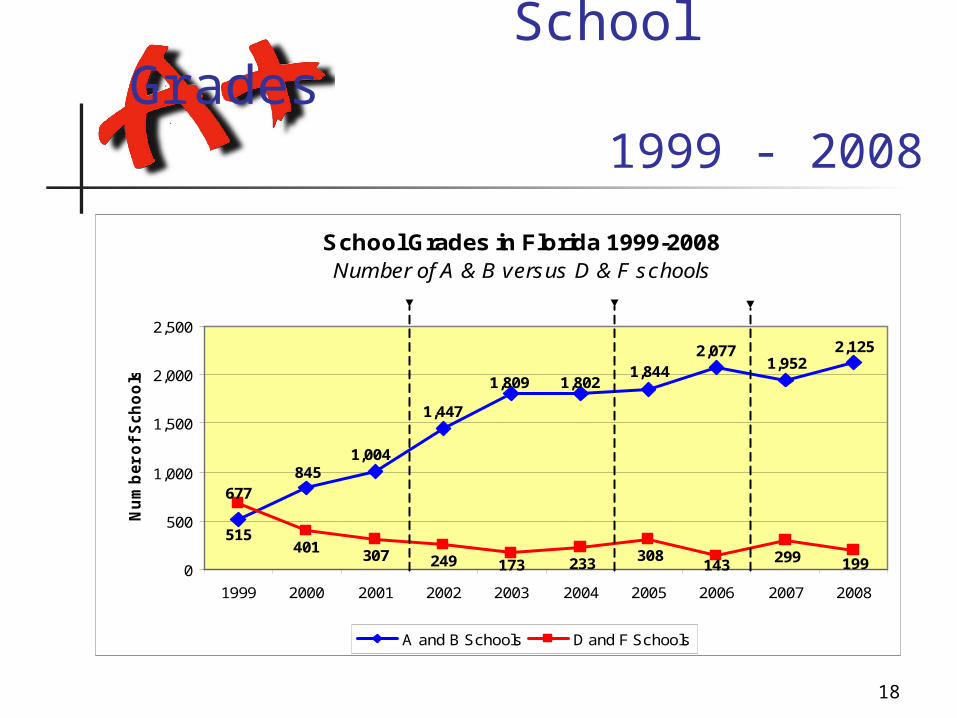
School Grades1999 - 2008
School Grades in Florida 1999-2008 Number of A & B versus D & F schools
1,004
515
845
1,447
1,809 1,8021,844
2,0771,952
2,125
677
401 307 249 173 233 308143 299 1990
500
1,000
1,500
2,000
2,500
1999 2000 2001 2002 2003 2004 2005 2006 2007 2008
Nu
mb
er
of
Sch
oo
ls
A and B Schools D and F Schools

19
Rewards & Consequences
School Recognition
College Board Partnership
High School Graduation Requirements
20
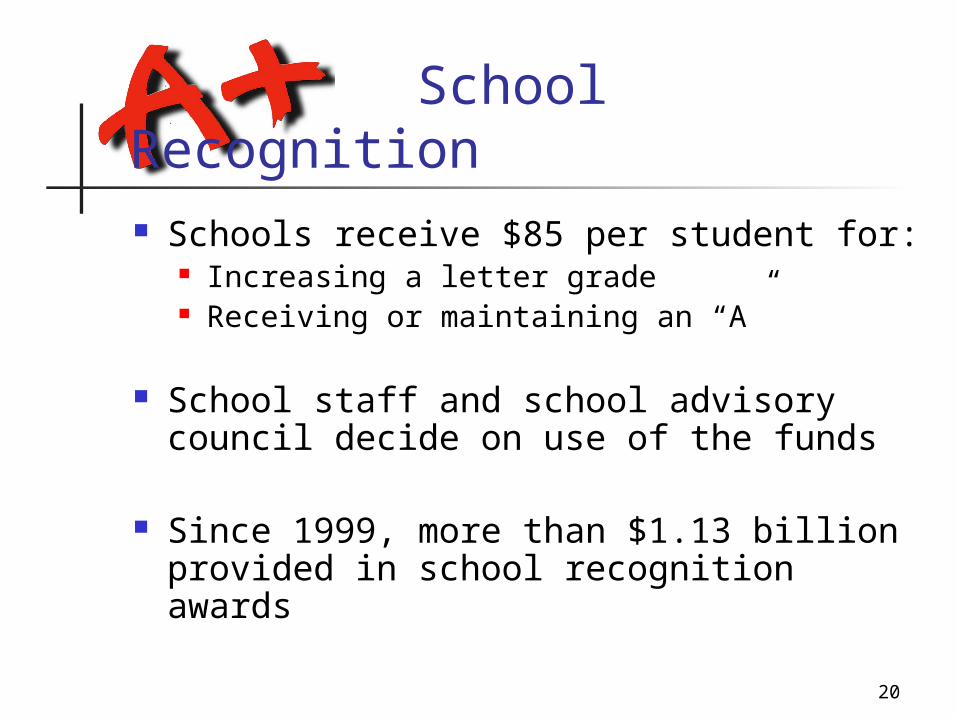
School Recognition Schools receive $85 per student for:
Increasing a letter grade Receiving or maintaining an “A”
School staff and school advisory council decide on use of the funds
Since 1999, more than $1.13 billion provided in school recognition awards

21
College Board Partnership
School Bonus for AP passage -- $700
AP Teacher Bonus – $50 for every passing score, up to $2,000
AP Teacher Bonus -- $500 for first passing score in D or F school, up to $2000

22
AP Exams Taken
0
25,000
50,000
75,000
100,000
125,000
150,000
175,000
200,000
225,00019
91
1992
1993
1994
1995
1996
1997
1998
1999
2000
2001
2002
2003
2004
2005
2006
2007
2008
by All of Florida's Students
First year of the College Board
Partnership
Florida’s College Board Partnership(including the AP Teacher Bonus Program)

23
AP Exams Taken
0
25,000
50,000
75,000
100,000
125,000
150,000
175,000
200,000
225,00019
91
1992
1993
1994
1995
1996
1997
1998
1999
2000
2001
2002
2003
2004
2005
2006
2007
2008
by All of Florida's Students
210,321
32,137
59,811
1991-1999:86% increase
1999-2008:252% increase
Florida’s College Board Partnership(including the AP Teacher Bonus Program)

24
AP Exam Takers
0
25,000
50,000
75,000
100,000
125,00019
91
1992
1993
1994
1995
1996
1997
1998
1999
2000
2001
2002
2003
2004
2005
2006
2007
2008
All Students
117,698
20,521
34,607
1991-1999:69% increase
1999-2008:240% increase
Florida’s College Board Partnership(including the AP Teacher Bonus Program)
25
AP Exam Takers
0
5,000
10,000
15,000
20,000
25,000
30,000
1999 2000 2001 2002 2003 2004 2005 2006 2007 2008
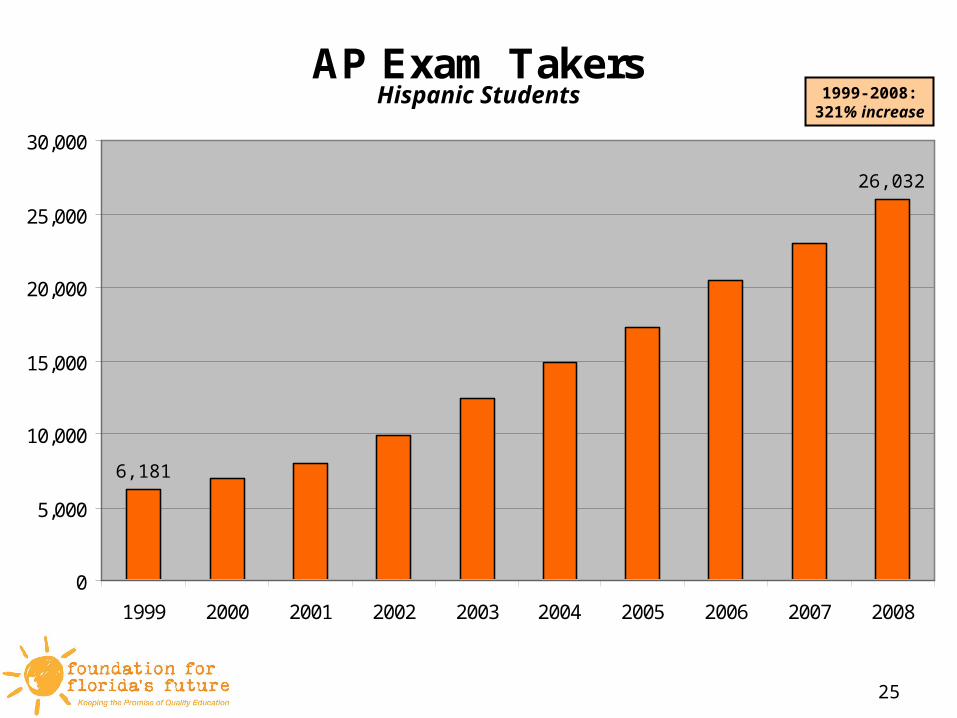
Hispanic Students
6,181
26,032
1999-2008:321% increase

26
AP Exam Takers
0
2,000
4,000
6,000
8,000
10,000
12,000
14,000
16,000
1999 2000 2001 2002 2003 2004 2005 2006 2007 2008
African-American Students
2,595
14,777
1999-2008:469% increase
27
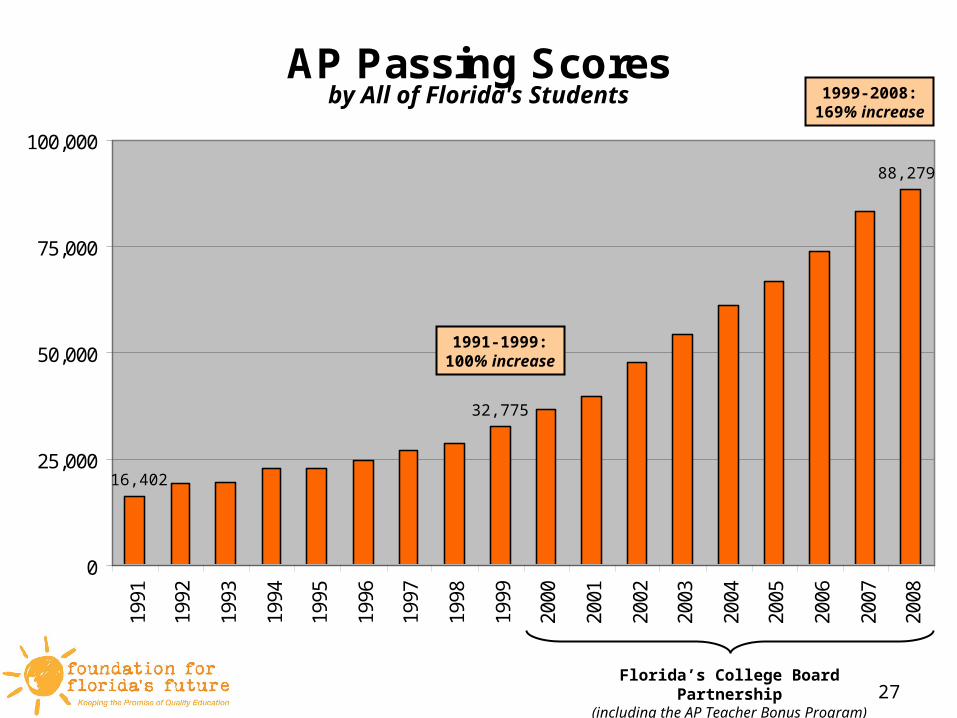
AP Passing Scores
0
25,000
50,000
75,000
100,00019
91
1992
1993
1994
1995
1996
1997
1998
1999
2000
2001
2002
2003
2004
2005
2006
2007
2008
by All of Florida's Students
88,279
16,402
32,775
1991-1999:100% increase
1999-2008:169% increase
Florida’s College Board Partnership(including the AP Teacher Bonus Program)
28
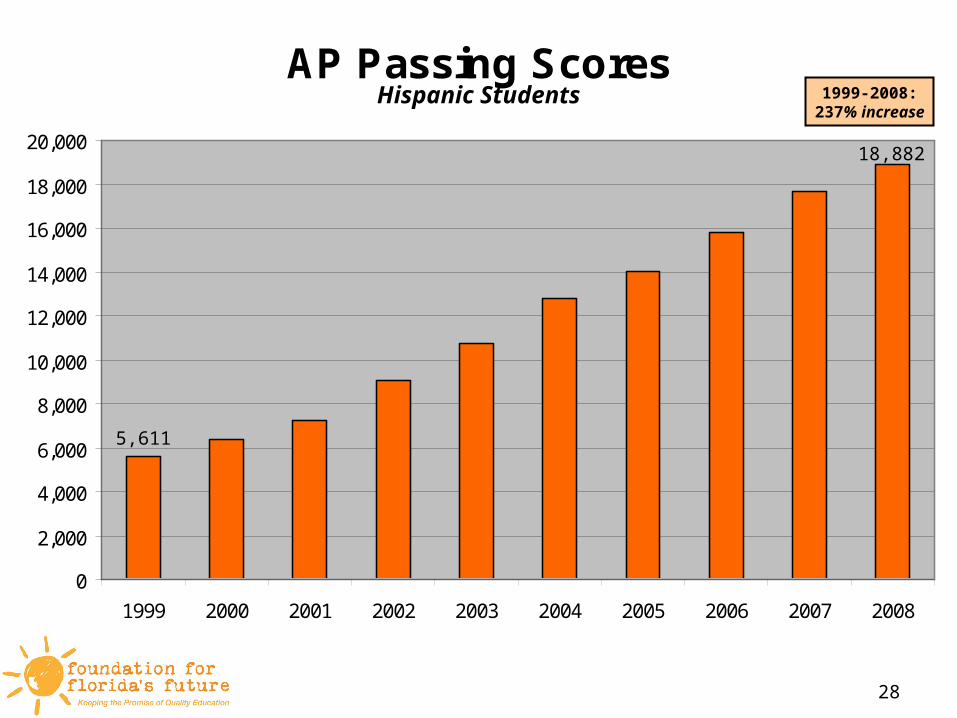
AP Passing Scores
0
2,000
4,000
6,000
8,000
10,000
12,000
14,000
16,000
18,000
20,000
1999 2000 2001 2002 2003 2004 2005 2006 2007 2008
Hispanic Students
5,611
18,882
1999-2008:237% increase
29
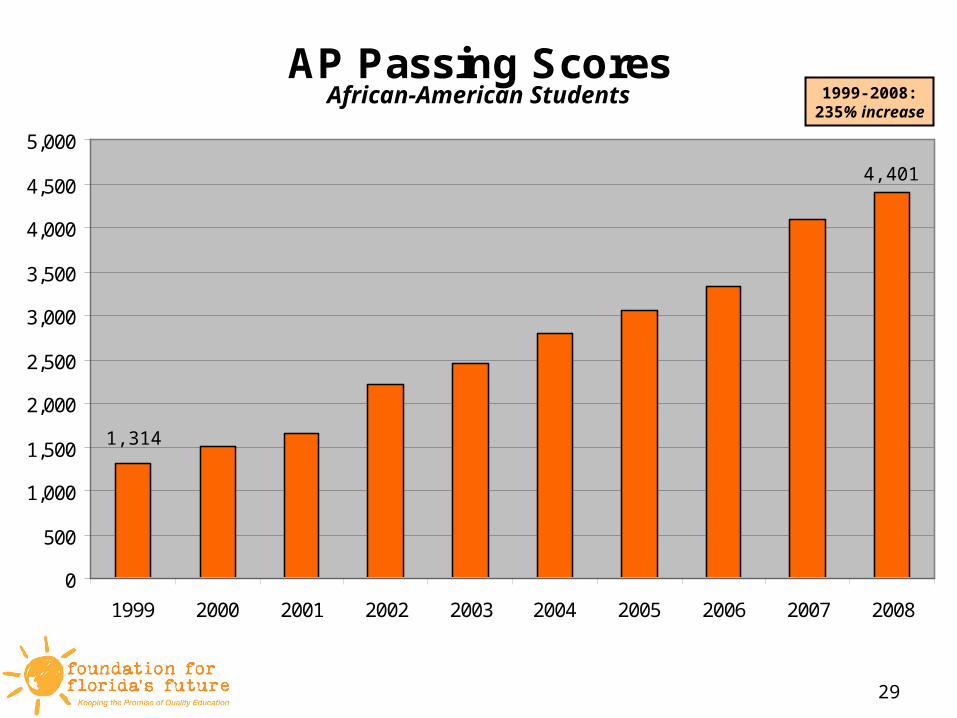
AP Passing Scores
0
500
1,000
1,500
2,000
2,500
3,000
3,500
4,000
4,500
5,000
1999 2000 2001 2002 2003 2004 2005 2006 2007 2008
African-American Students
1,314
4,401
1999-2008:235% increase
30
2008 AP Results AP Participation:
For the third year in a row, Florida had the greatest single-year increase in the number of exam takers when compared to all other states.
The number of Florida students taking an AP exam increased by 13%, as compared to approximately 9% for the nation.
For the third year in a row, Florida had at least the third-greatest increase in the nation in the number of Hispanic exam takers (14%).
Florida had the largest single-year increase in the nation in the number of Hispanic exam takers and the number of exams taken by Hispanic students among the four most populous states.
For the third year in a row, Florida had the largest single-year increase in the nation in the number of African-American exam takers (30%).
AP Performance: Florida had the third-greatest increase in the number of students passing AP exams
when compared to all other states. Florida ranks 4th in the nation in the number of graduating seniors passing an AP
exam. Florida had the third-greatest increase in the number of passing scores earned by
Hispanic students when compared to all other states.
Florida continues to have more African-American students take an AP course, more take an AP exam, and more pass an AP exam than any other state.
31
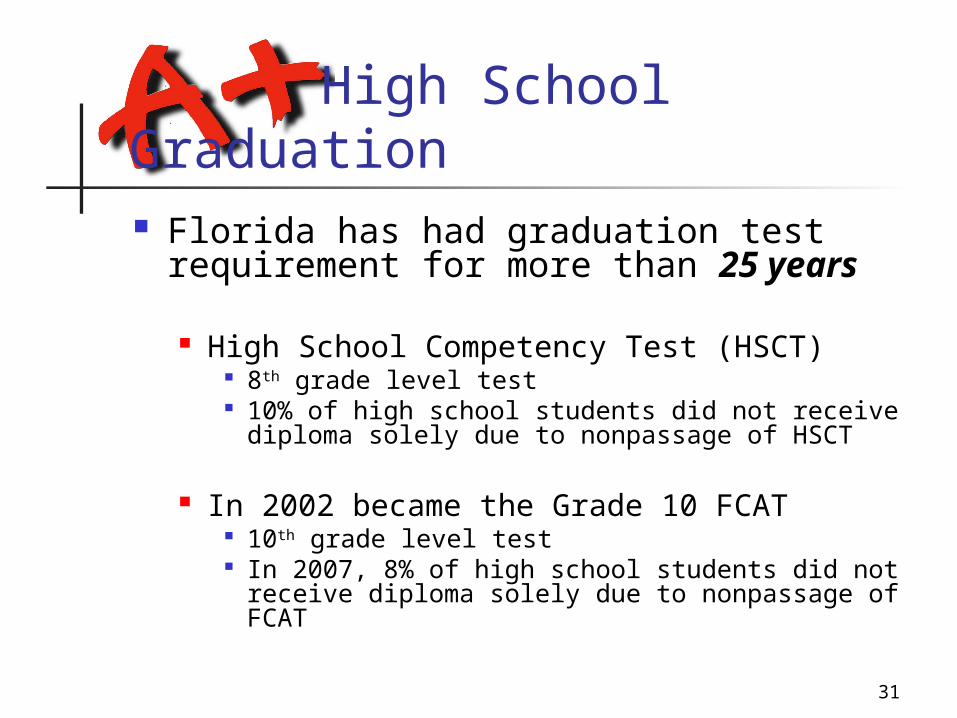
High School Graduation Florida has had graduation test
requirement for more than 25 years
High School Competency Test (HSCT) 8th grade level test 10% of high school students did not receive
diploma solely due to nonpassage of HSCT
In 2002 became the Grade 10 FCAT 10th grade level test In 2007, 8% of high school students did not
receive diploma solely due to nonpassage of FCAT
32
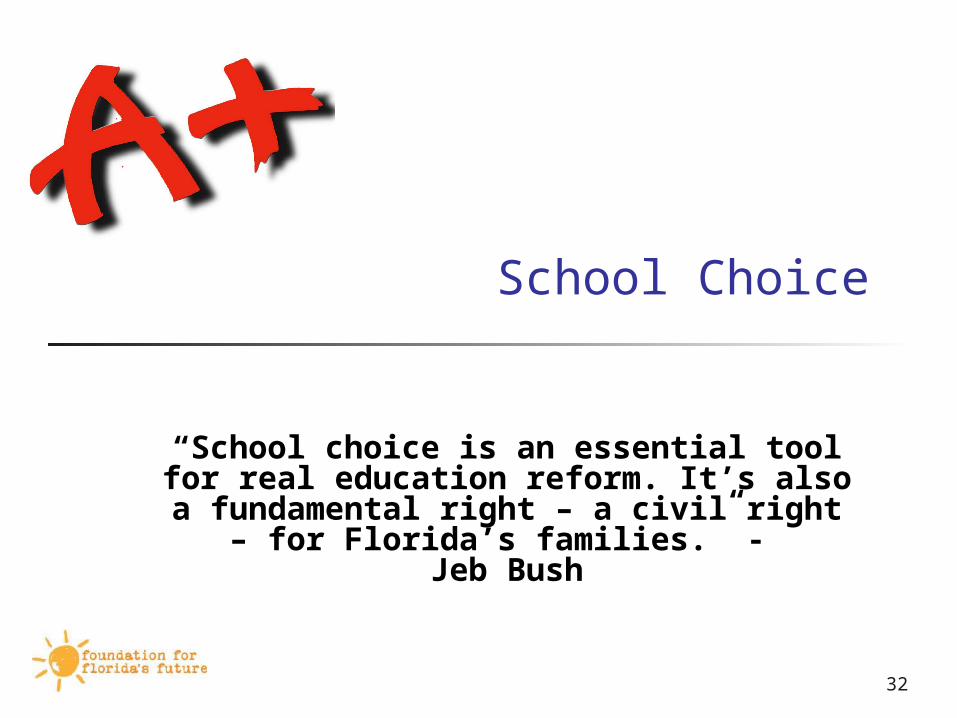
School Choice
“School choice is an essential tool for real education reform. It’s also a
fundamental right – a civil right – for Florida’s families.” -
Jeb Bush
33
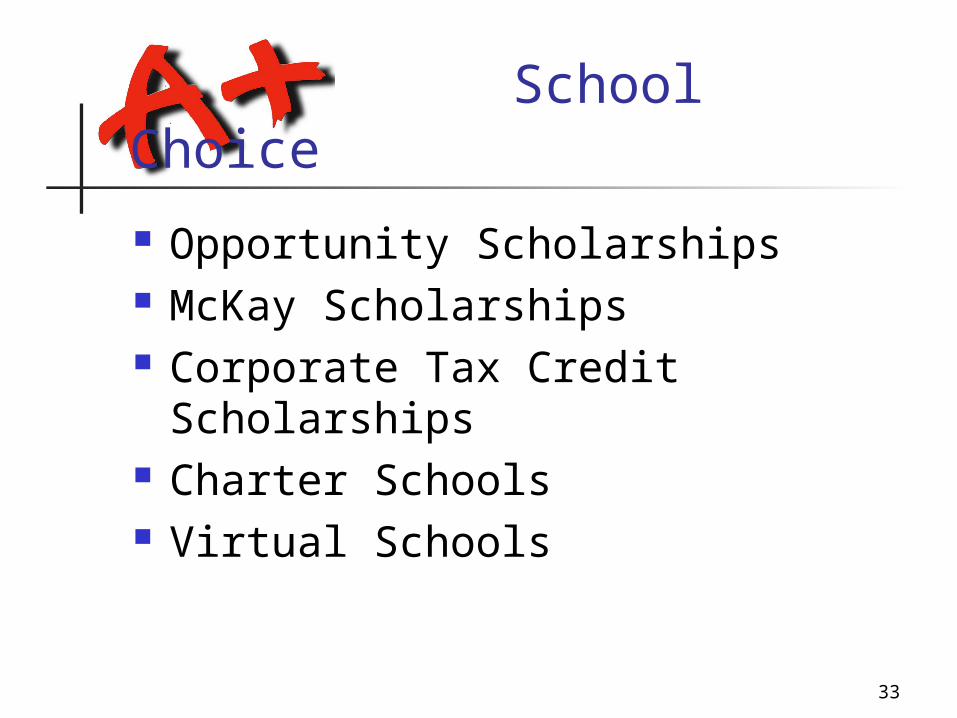
School Choice
Opportunity Scholarships McKay Scholarships Corporate Tax Credit Scholarships Charter Schools Virtual Schools

34
School Choice
Minority and Underrepresented students comprise the majority of students participating in school choice programs
School choice empowers lower income families with ability to become an empowered “consumer” of education.

35
School Choice Manhattan Institute: Threat of vouchers
improved student performance http://www.manhattan-institute.org/html/ewp_02.htm
Cornell University: Threat of vouchers improved student performance
http://repec.org/esNASM04/up.2034.1075271881.pdf
Harvard University: Choice provisions of A+ Plan are leveraging student achievement gains
http://www.ksg.harvard.edu/pepg/PDF/Papers/West_Peterson_ChoiceThreats.pdf

36
School Choice Friedman Foundation: Empirical Evidence on private
schools and school choice http://www.friedmanfoundation.org/friedman/researc
h/ShowResearchItem.do;jsessionid=E74F8098352A6F05ACC3EA7A5FCAA975?id=10082
Collins Center: Corporate Tax Credit Scholarship saves state money
http://www.collinscenter.org/publications/publications_show.htm?doc_id=465138
Manhattan Institute: Choice provisions provide greater parental satisfaction
http://www.manhattan-institute.org/html/cr_38.htm

37
Choice Improves Learning
Impact of the A+ Program on Voucher Threatened Schools
13
15
10
0 0
9
0
5
10
15
20
2002 2003 2004 2005 2006 2007
Imp
rovem
en
t in
Develo
pm
en
tal
Scale
Po
ints

38
Results
Accountability is Working for All Students

39
A+ Plan is Working
Elementary School FCAT ReadingGrades 3, 4 and 5
54 5660
6568 69 70 70
30 2824
20 18 16 16 16
0
10
20
30
40
50
60
70
80
2001 2002 2003 2004 2005 2006 2007 2008
Perc
en
t
Level 3 and Above (On Grade Level and Above) Level 1
40
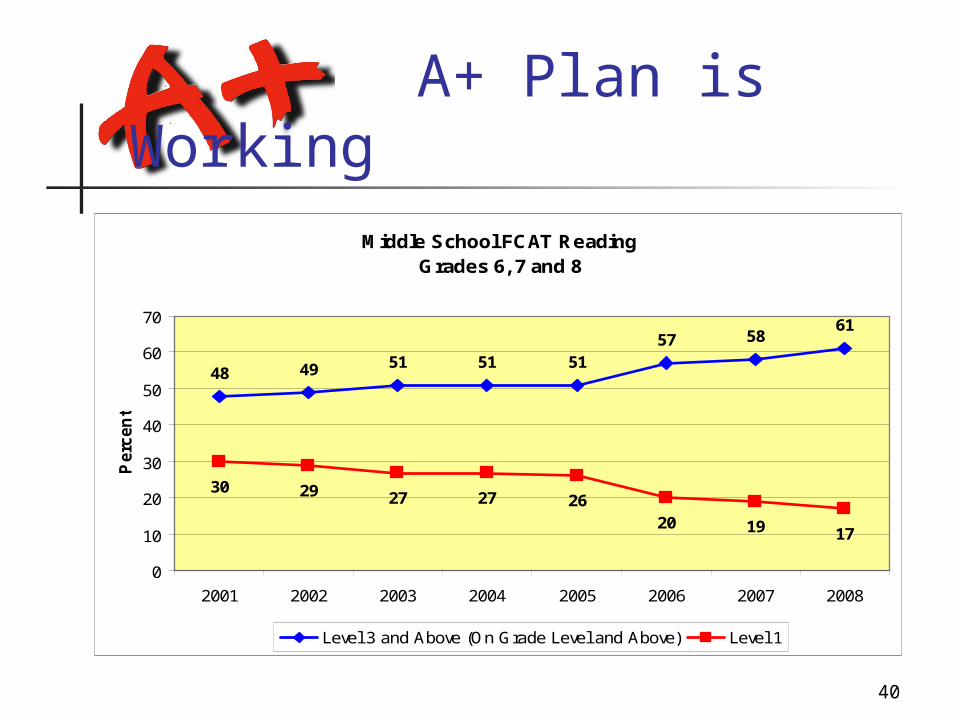
A+ Plan is Working
Middle School FCAT ReadingGrades 6, 7 and 8
48 49 51 51 5157 58
61
30 29 27 27 2620 19 17
0
10
20
30
40
50
60
70
2001 2002 2003 2004 2005 2006 2007 2008
Perc
en
t
Level 3 and Above (On Grade Level and Above) Level 1
41
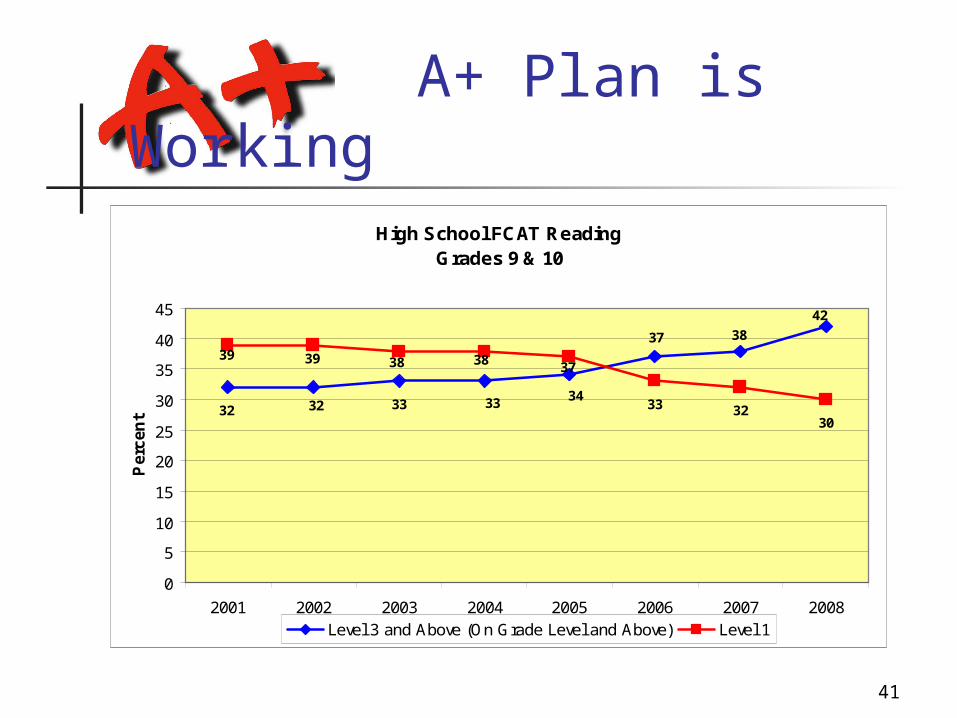
A+ Plan is Working
High School FCAT ReadingGrades 9 & 10
33 3230
32 32 33 33 34
37 38
42
39 39 38 38 37
0
5
10
15
20
25
30
35
40
45
2001 2002 2003 2004 2005 2006 2007 2008
Per
cen
t
Level 3 and Above (On Grade Level and Above) Level 1
42
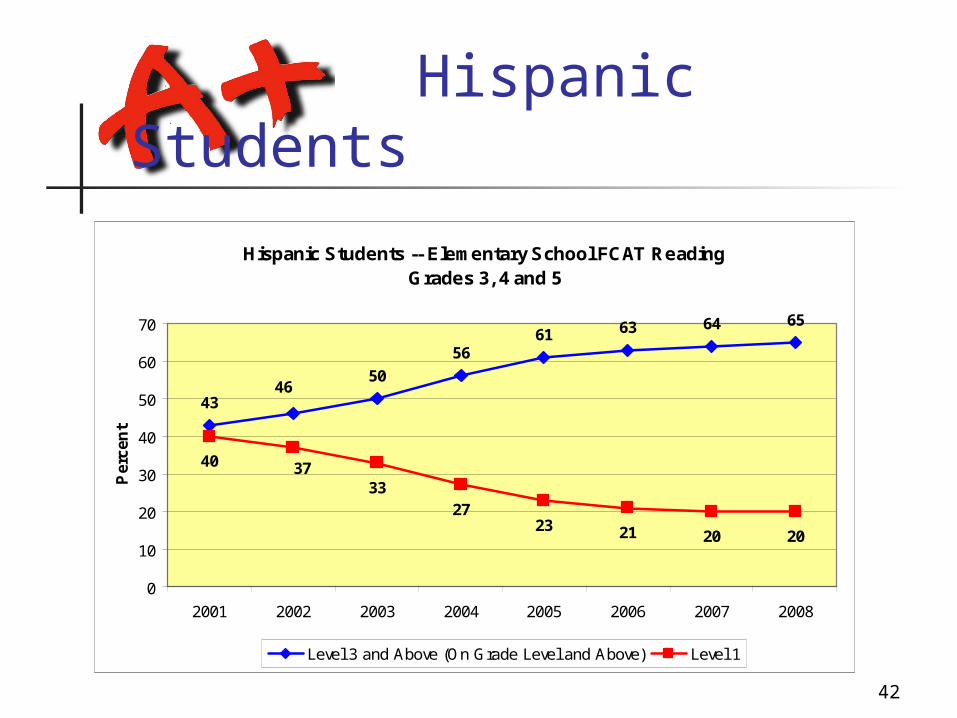
Hispanic Students
Hispanic Students -- Elementary School FCAT ReadingGrades 3, 4 and 5
43
50
5661 63 64 65
40
3327
23 21 20 20
46
37
0
10
20
30
40
50
60
70
2001 2002 2003 2004 2005 2006 2007 2008
Per
cen
t
Level 3 and Above (On Grade Level and Above) Level 1
43
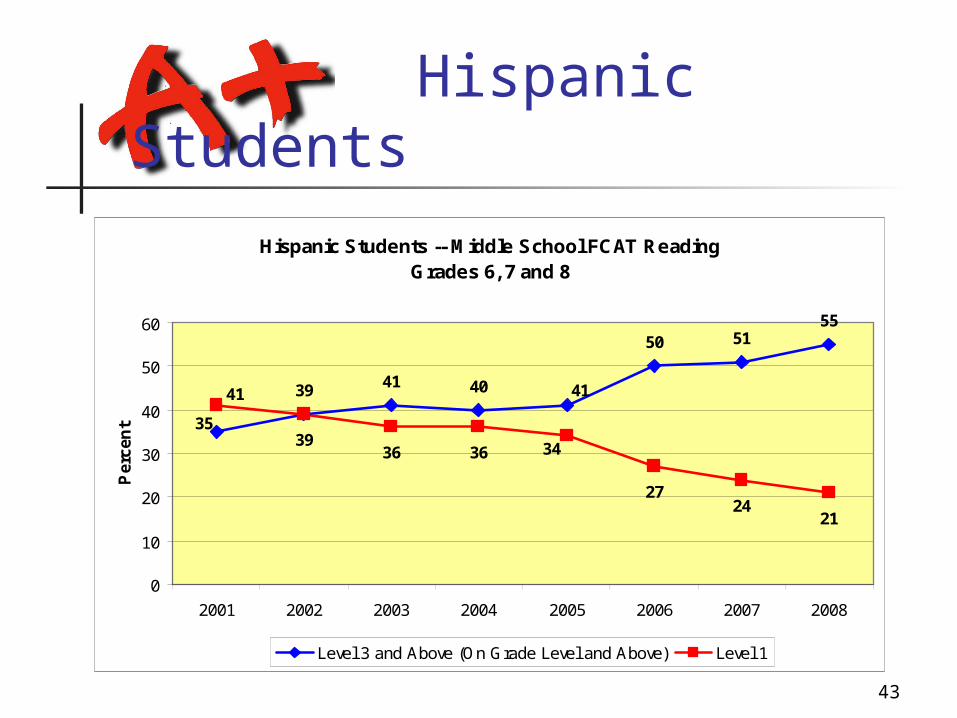
Hispanic Students
Hispanic Students -- Middle School FCAT ReadingGrades 6, 7 and 8
39 41 40
50 5155
3936 36
2724
21
41
35
34
41
0
10
20
30
40
50
60
2001 2002 2003 2004 2005 2006 2007 2008
Per
cen
t
Level 3 and Above (On Grade Level and Above) Level 1

44
Hispanic Students
Hispanic Students -- High School FCAT ReadingGrades 9 & 10
42
21 2123 23
2529 31 35
52 5149 48
4640 36
0
10
20
30
40
50
60
2001 2002 2003 2004 2005 2006 2007 2008
Per
cen
t
Level 3 and Above (On Grade Level and Above) Level 1
45
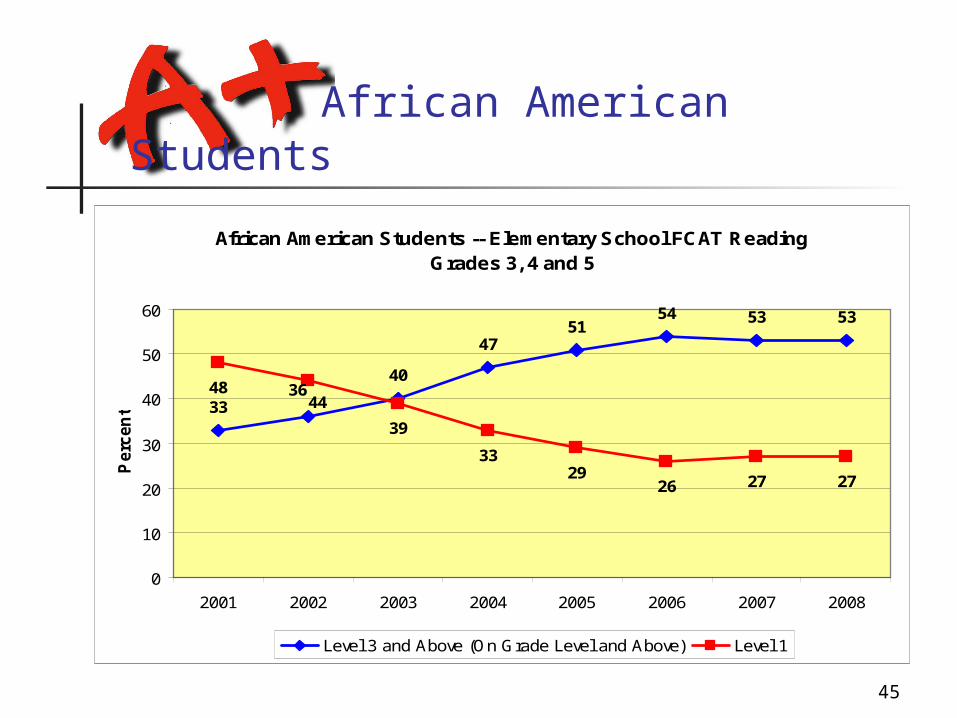
African American Students
African American Students -- Elementary School FCAT ReadingGrades 3, 4 and 5
33
40
4751
54 53 53
48
39
3329
26 27 27
3644
0
10
20
30
40
50
60
2001 2002 2003 2004 2005 2006 2007 2008
Perc
en
t
Level 3 and Above (On Grade Level and Above) Level 1

46
African American Students
African American Students -- Middle School FCAT ReadingGrades 6, 7 and 8
2528 30 30
39 3943
50 4844 44
32 3128
3141
0
10
20
30
40
50
60
2001 2002 2003 2004 2005 2006 2007 2008
Perc
en
t
Level 3 and Above (On Grade Level and Above) Level 1
47
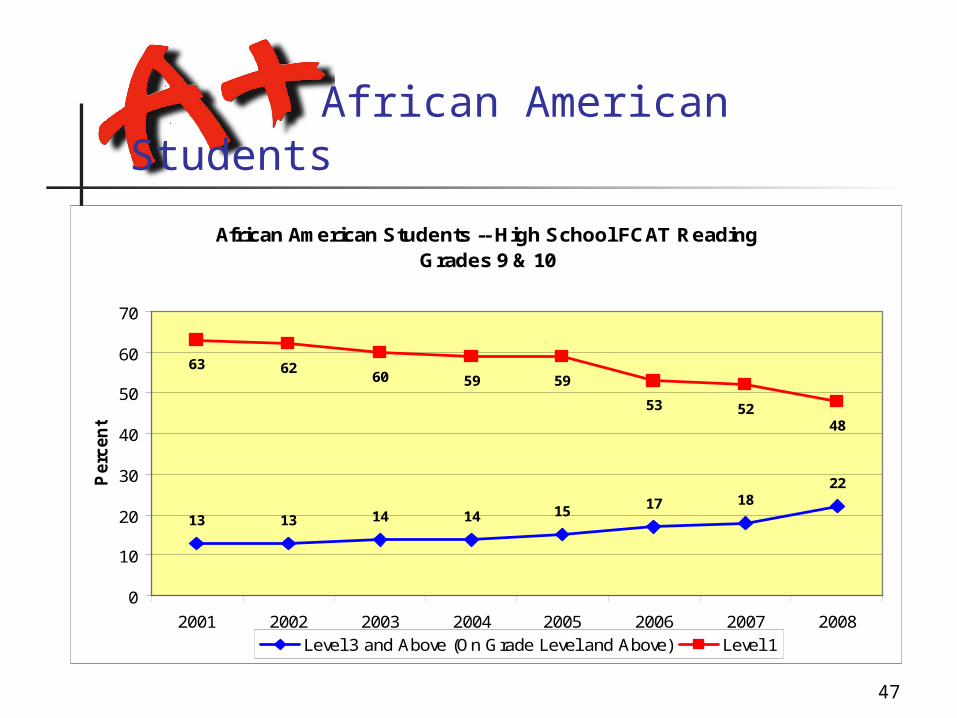
African American Students
African American Students -- High School FCAT ReadingGrades 9 & 10
1822
53 5248
13 13 14 14 15 17
63 6260 59 59
0
10
20
30
40
50
60
70
2001 2002 2003 2004 2005 2006 2007 2008
Perc
en
t
Level 3 and Above (On Grade Level and Above) Level 1
48
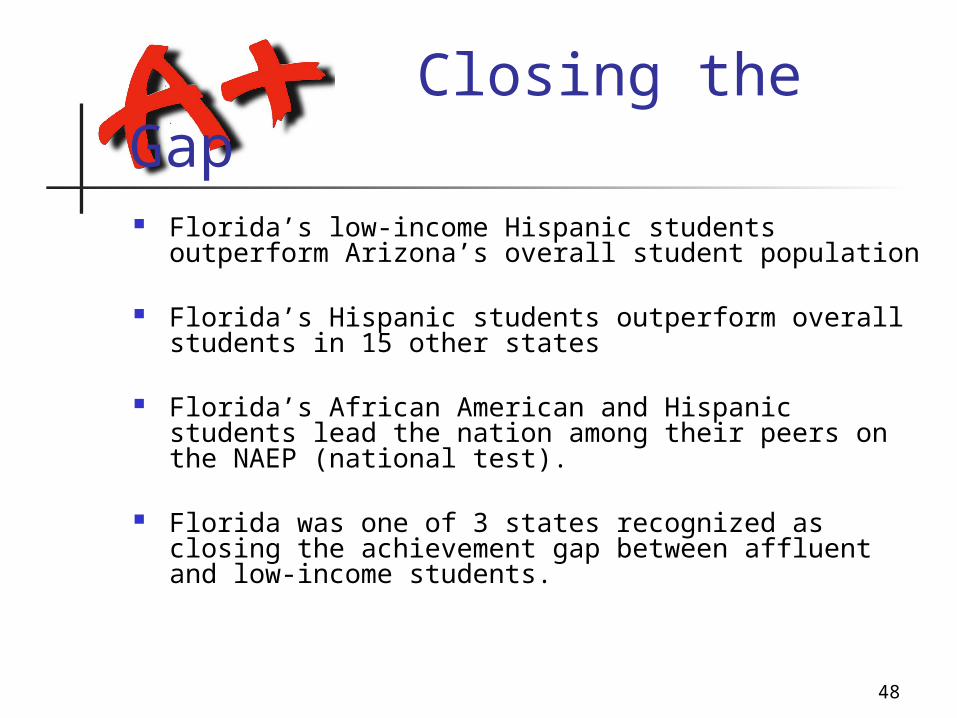
Closing the Gap Florida’s low-income Hispanic students outperform
Arizona’s overall student population
Florida’s Hispanic students outperform overall students in 15 other states
Florida’s African American and Hispanic students lead the nation among their peers on the NAEP (national test).
Florida was one of 3 states recognized as closing the achievement gap between affluent and low-income students.

49
Where do we go from here?
Continue Reform Incremental Progress will Create Long-term
Success
Build upon Reform Success in High School prepares students
for Readiness in College AP expansion High School Majors Expand Choice

50
High School Reform in Florida
Contact Information:
Patricia W. LevesqueExecutive Director
Foundation for Florida’s FutureP.O. Box 10691
Tallahassee, FL 32302-2691850-391-3070