HIGH SCHOOL ACHIEVEMENT IN AMERICA: What Do We Know? Louisiana High School Commission The Education...
115
HIGH SCHOOL ACHIEVEMENT IN AMERICA: What Do We Know? Louisiana High School Commission The Education Trust December, 2004
-
Upload
marlon-harkcom -
Category
Documents
-
view
213 -
download
0
Transcript of HIGH SCHOOL ACHIEVEMENT IN AMERICA: What Do We Know? Louisiana High School Commission The Education...

HIGH SCHOOL ACHIEVEMENT IN AMERICA:What Do We Know?
Louisiana High School CommissionThe Education Trust
December, 2004

What Do We Know About Student Achievement?

12th Grade Achievement In Math and Science is Up
Somewhat

High School Achievement: Math and Science: NAEP Long-Term
Trends
280
285
290
295
300
305
310
315
1986 1990 1992 1994 1996 1999
MathScience
Source: NAEP 1999 Trends in Academic Progress.

In Reading, 12th Grade Achievement is Headed
Downward

HIGH SCHOOL ACHIEVEMENT: READING AND WRITINGNAEP Long-Term Trends
250255260265270275280285290295300
1984 1988 1990 1992 1994 1996
READINGWRITING
What about different groups of students?

Gaps Narrow 1970-88NAEP Reading 17 Year-Olds
200
300
1971 1975 1980 1984 1988 1990 1992 1994 1996
Ave
rage
Rea
ding
NA
EP
Sco
re
African American Latino White
Source: US Department of Education, National Center for Education Statistics. NAEP 1999 Trends in Academic Progress (p. 107) Washington, DC: US Department of Education, August 2000

Gaps Narrow 1973-86NAEP Math Scores, 13 Year-Olds
200
220
240
260
280
300
1973 1978 1982 1986 1990 1992 1994 1996 1999
Av
era
ge
Sc
ale
S
co
re
African American Latino White
Source: US Department of Education, National Center for Education Statistics. NAEP 1999 Trends in Academic Progress (p. 108) Washington, DC: US Department of Education, August 2000

Between 1988-90, that progress came to a halt…and
gaps began to widen once again.

Gaps Narrow Then Mostly Widen Reading, 17 Year-Olds
NAEP Long-Term Trends
200
300
1971
1975
1980
1984
1988
1990
1992
1994
1996
1999
Avera
ge R
ead
ing
NA
EP
S
co
re
African American Latino White
Source: US Department of Education, National Center for Education Statistics. NAEP 1999 Trends in Academic Progress (p. 107) Washington, DC: US Department of Education, August 2000
21 31

Source: US Department of Education, National Center for Education Statistics. NAEP 1999 Trends in Academic Progress (p. 108) Washington, DC: US Department of Education, August 2000
Gaps Narrow, Then Hold Steady or Widen: Math, 17 Year-Olds
NAEP Long-Term Trends
250
350
Avera
ge R
ead
ing
NA
EP
S
co
re
African American Latino White
20 32

How much learning takes place at each level?
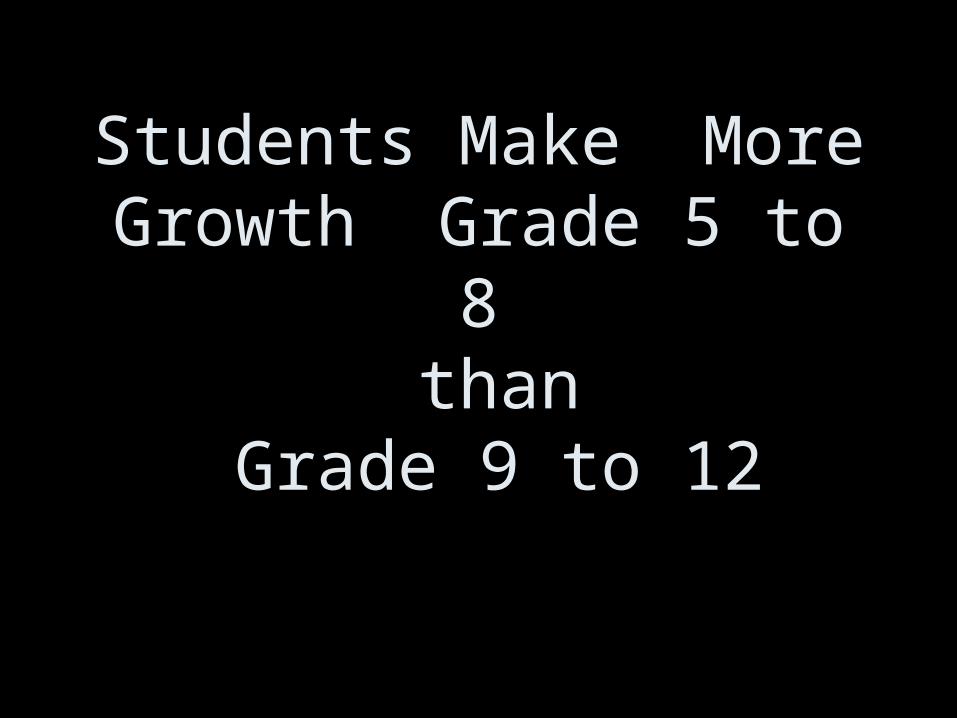
Students Make More Growth Grade 5 to 8
than Grade 9 to 12

Academic GrowthGrades 5-8, 9-12
48
58
44
2527
9
3438
0
10
20
30
40
50
60
70
Reading Writing Math Science
Grade 5-8Grade 9-12

Value Added in High School Declined During
the Nineties

Value Added Declining in High School Math...
36 3634
2022242628303234363840
Math
Class of '90 Class of '94 Class of '96
Age 13-17 Growth
Source: NAEP 1999 Trends in Academic Progress

…Still
33
29
2022242628303234363840
Math
Class of 96 Class of 00
Age 13-17 Growth
Source: Main NAEP 1996, 2000

Reading: Students Entering Better Prepared, But Leaving
Worse
Source: NAEP 1996 Trends in Academic Progress
Total=290 Total=288
211 212
46 48
33 28
0%
100%
1984-1992 1988-1996
NA
EP
sco
re a
nd
ga
ins
to a
ge
17
Ages 13-17 growthAges 9-13 growthAge 9 score

Hormones?

Students in Other Countries Gain far More in
Middle and High School

TIMSS
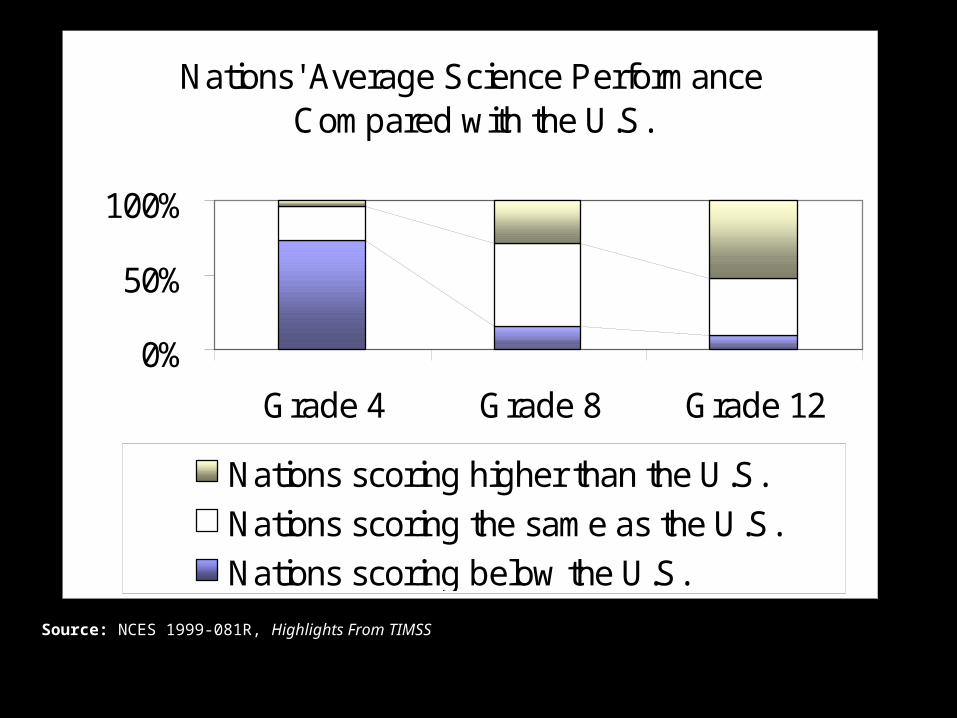
Source: NCES 1999-081R, Highlights From TIMSS
Nations' Average Science Performance Compared with the U.S.
0%
50%
100%
Grade 4 Grade 8 Grade 12
Nations scoring higher than the U.S.
Nations scoring the same as the U.S.
Nations scoring below the U.S.

Source: NCES 1999-081R, Highlights From TIMSS
Nations' Average Mathematics Performance Compared with the U.S.
0%
50%
100%
Grade 4 Grade 8 Grade 12
Nations' scoring higher than the U.S.
Nations scoring the same as the U.S.
Nations scoring below the U.S.

PISA

US 15 Year-Olds Rank Near Middle Of The Pack Among 32
Participating Countries
U.S. RANKREADING 15TH
MATH 19TH
SCIENCE 14TH

One measure on which we rank high?
Inequality!

Source: OECD, Knowledge and Skills for Life: First Results From PISA 2000, 2001.
*Of 27 OECD countries
Performance Of U.S.15 Year-Olds Highly Variable
PISA 5th – 95th
Gap Rank*Reading (interpreting text) 3
Mathematical Literacy 6 (tie)
Science Literacy 7
Of course, these gaps evident when children arrive at school.

By Race, Ethnicity NAEP 4th Grade Reading 2003
61 57 53
26 31
27 29 31
35 32
12 14 16
39 37
0%10%20%30%40%50%60%70%80%90%
100%
Black Latino Native White Asian
Prof/ Adv
Basic
Below Basic
Source: USDOE, NCES, National Assessment of Educational Progress (NAEP)

But they grow wider the longer students remain in school.
By end of high school?

African American and Latino 17 Year Olds Do Math at Same Levels As White 13 Year Olds
0%
100%
200 250 300 350
White 8th GradersAfrican American 12th GradersLatino 12th Graders
Source: NAEP 1999 Long Term Trends Summary Tables (online)

African American and Latino 17 Year Olds Read at Same Levels
as White 13 Year Olds
Source: Source: NAEP 1999 Long Term Trends Summary Tables (online)
0%
100%
150 200 250 300 350
White 8th Graders African American 12th Graders
Latino 12th Graders

And these are the students who remain in school.

Students Graduate From High School At Different Rates, 2001
Source: Jay P. Greene and Greg Forster, “Public High School Graduation and College Readiness Rates in the United States,” Manhattan Institute for Policy Research, September 2003.
54%51%
79%
52%
72%
0%
100%
African American Asian Latino Native American White

Louisiana?

Over Past Decade, State Among the Biggest Gainers in Student
Achievement in Elementary, Middle Grades

NAEP 4th Grade Math: LA (1992-2003)
160
170
180
190
200
210
220
230
240
1992 1996 2000 2003
BlackWhite
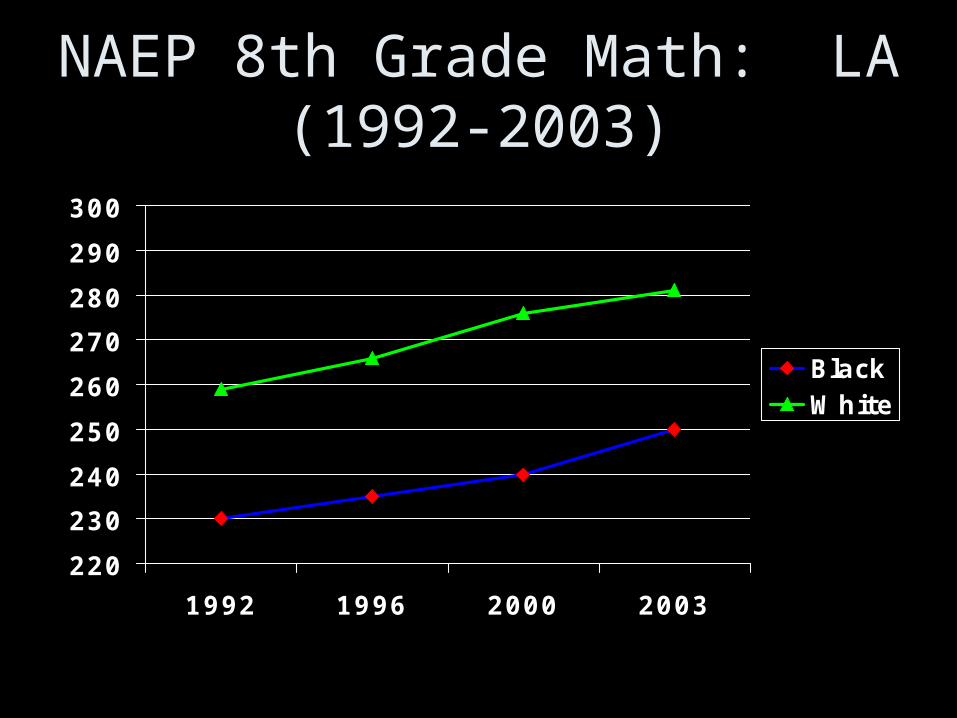
NAEP 8th Grade Math: LA (1992-2003)
220
230
240
250
260
270
280
290
300
1992 1996 2000 2003
BlackWhite
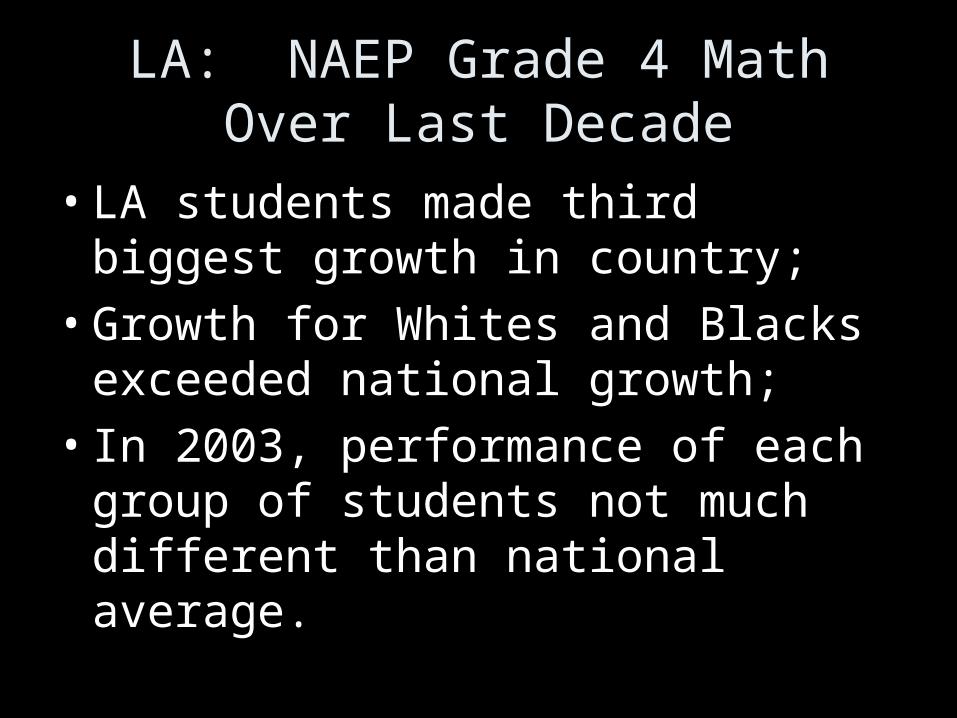
LA: NAEP Grade 4 Math Over Last Decade
• LA students made third biggest growth in country;
• Growth for Whites and Blacks exceeded national growth;
• In 2003, performance of each group of students not much different than national average.

LA: NAEP Grade 8 Math Over Last Decade
• Second in growth overall;
• Fourth in growth for black students;
• Second in growth for white students;

NAEP READING OVER DECADE: LA 4th Graders
• Growth for white students tied for ninth nationally;
• Achievement for black students flat.

2000-2003States with Biggest Gains for African American 8th Graders
(NAEP 2003 Math*)United States +6
Louisiana and Virginia +10
South Carolina +9
Mississippi, Texas and District of Columbia
+8
Source: USDOE, NCES, National Assessment of Educational Progress (NAEP)
* Gains Between 2000 and 2003

2000-3States with Biggest Gains for
Poor 8th Graders(NAEP Math*)
United States +3
South Carolina +11
Louisiana and Mississippi +10
Connecticut and California
+9
Source: USDOE, NCES, National Assessment of Educational Progress (NAEP)
* Gains Between 2000 and 2003

Yet Big Challenges Remain

LA By Race, Ethnicity NAEP 4th Grade Reading 2003
70
30
22
37
8
33
0%10%20%30%40%50%60%70%80%90%
100%
Black White
Prof/ Adv
Basic
Below Basic
Source: USDOE, NCES, National Assessment of Educational Progress (NAEP)

LA By Race, Ethnicity NAEP 8th Grade Math 2003
64
25
31
47
5
28
0%10%20%30%40%50%60%70%80%90%
100%
Black White
Prof/ Adv
Basic
Below Basic
Source: USDOE, NCES, National Assessment of Educational Progress (NAEP)

High School and Beyond?

Upper Level Course Taking: LA vs. Top States
LA TOP States
8th Graders Taking Algebra
4% 35%
9-12th Graders Taking at Least One Upper Level Math Course
49% 59%
9-12th Graders Taking at Least One Upper Level Science Course
24% 41%

LA: Enrollment in AP
K-12 Enrollment
AP Calculus
AP English
AP Biology
Black 48% 13% 17% 12%
White 49% 73% 65% 68%
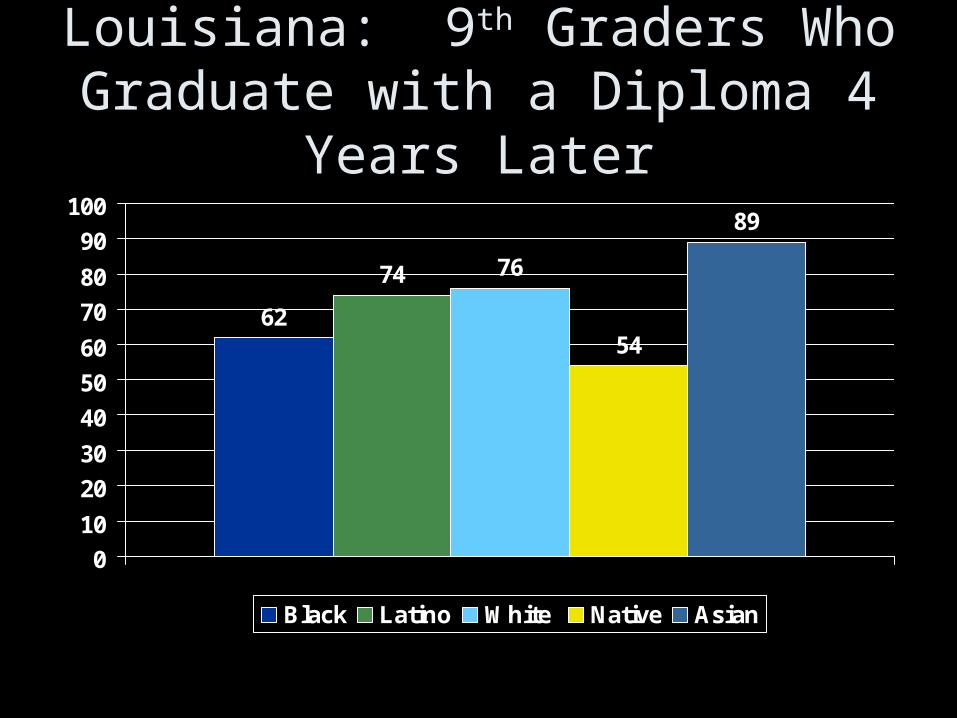
Louisiana: 9th Graders Who Graduate with a Diploma 4 Years
Later
62
74 76
54
89
0
10
20
30
40
50
60
70
80
90
100
Black Latino White Native Asian

Education Pipeline in LA
K-12 2-Year
Colleges
4-Year Colleges
Black 48% 34% 27%
White 49% 57% 61%

Inevitable?

What Most Educators Say:
• They’re poor;
• Their parents don’t care;
• They come to schools without breakfast;
• Not enough books
• Not enough parents . . .

Hambrick Middle School,Aldine, TX
• 94% African American and Latino (state = 56%)
• 85% low-income (state = 50%)
• Has performed in the top fifth of all Texas middle schools in both reading and math in both 7th and 8th grades over a 3-year period.

Prince Edward County High, Farmville VA
12%
44%
74%
92%
71% 78%
40%
0%
25%
50%
75%
100%
1998 1999 2000 2001 2002
Pas
sin
g s
tate
Alg
ebra
I t
est
Prince Edward High State Average
Sources: Virginia Department of Education Web site, http://www.pen.k12.va.us/VDOE/Assessment/2002SOLpassrates.html.
(715 students – 55% African American and Latino)

Norview High School
Norfolk, VA

Norview High School• 67% African American
• 28% White
• 2% Latino
• 45% Low-Income
• Outperformed the state and district in math and reading in 2003

High Achievement at NorviewHigh School Math, 2003
80%
90%
75%
0%
25%
50%
75%
100%
% P
rofi
cie
nt
an
d A
bo
ve
State District School
Source: The Department of Education, http://www.schoolresults.org/

High Achievement at Norview
86%93%
88% 91%96% 93%
0%
25%
50%
75%
100%
Math 2004 Reading 2004
% P
rofi
cie
nt
an
d A
bo
ve
African American White Low-Income
Source: The Department of Education, http://www.schoolresults.org/

MA: Passing HS Competency Exam
29%37%
77%
0%
25%
50%
75%
100%
10thGrade
2ndAttempt
3rdAttempt
4thAttempt
Final PassRate%
Cla
ss
of
2003
pas
sin
g M
CA
S h
igh
sc
ho
ol
exi
t exa
m
Latino African American White
Source: Massachusetts Department of Education Web site.

MA: Narrowing the High School Competency Gap
29%
83%86%
37%
77%
97%
0%
25%
50%
75%
100%
10thGrade
2ndAttempt
3rdAttempt
4thAttempt
Final PassRate%
Cla
ss
of
2003
pas
sin
g M
CA
S h
igh
sc
ho
ol
exi
t exa
m
Latino African American White
Source: Massachusetts Department of Education Web site.

MA: Narrowing the High School Competency Gap
7%
30%
77%
0%
25%
50%
75%
100%
10thGrade
2ndAttempt
3rdAttempt
4thAttempt
Final PassRate%
Cla
ss
of
2003
pas
sin
g M
CA
S h
igh
sc
ho
ol
exi
t exa
m
LEP Students with Disabilities Regular Education
Source: Massachusetts Department of Education Web site.

MA: Narrowing the High School Competency Gap
7%
82%80%
30%
77%
97%
0%
25%
50%
75%
100%
10thGrade
2ndAttempt
3rdAttempt
4thAttempt
Final PassRate%
Cla
ss
of
2003
pas
sin
g M
CA
S h
igh
sc
ho
ol
exi
t exa
m
LEP Students with Disabilities Regular Education
Source: Massachusetts Department of Education Web site.

SO, WHAT CAN WE DO?
Five questions to help frame improvement efforts.
#1. Can we agree on a single, overarching goal for high
school that will give clearer purpose, focus to our reform
efforts?
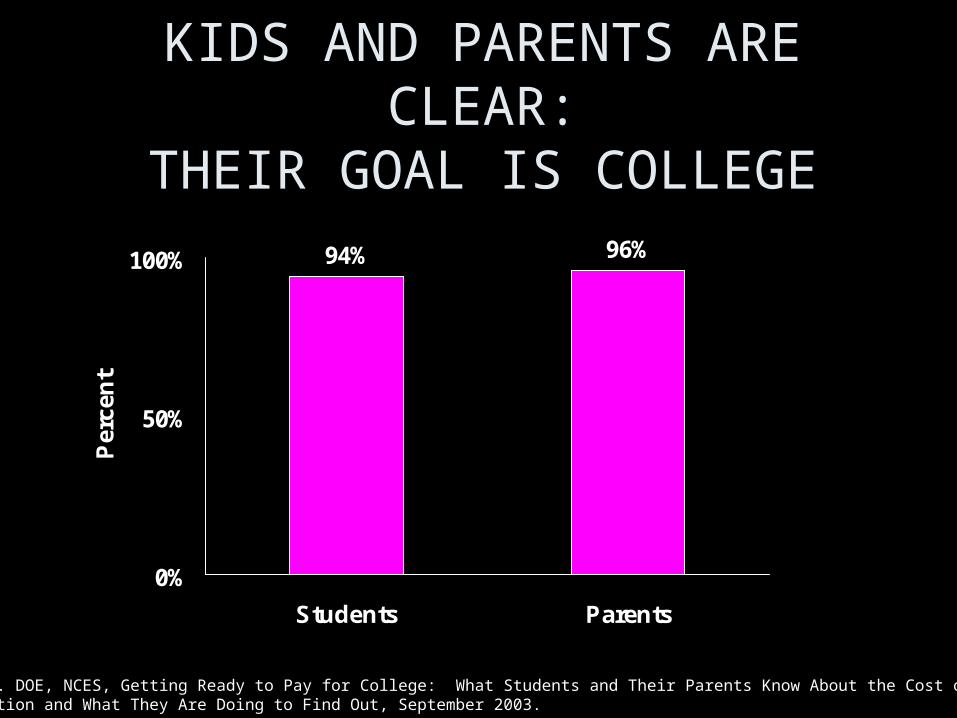
KIDS AND PARENTS ARE CLEAR:
THEIR GOAL IS COLLEGE96%94%
0%
50%
100%
Students Parents
Per
cen
t
Source: U.S. DOE, NCES, Getting Ready to Pay for College: What Students and Their Parents Know About the Cost of College Tuition and What They Are Doing to Find Out, September 2003.

Indeed, Most High School Grads Do Go On To Postsecondary
Within 2 YearsEntered Public 2-Year Colleges
26%
Entered 4-Year Colleges 45%
Other Postsecondary 4%
Total 75%
Source: NELS: 88, Second (1992) and Third (1994) Follow up; in, USDOE, NCES, “Access to Postsecondary Education for the 1992 High School Graduates”, 1998, Table 2.

Source: US bureau of Labor Statistics and Bureau of the Census, Current Population Survey, March 2002
That’s Good, Because Education Pays:Annual Earnings of 25-34
yr-olds by Attainment, 2001
27831 2966334259 36135
49011
$10,000
$20,000
$30,000
$40,000
$50,000
$60,000
$70,000
HS, nodiploma
HS diploma Some coll,no deg
Assoc deg BA/BA
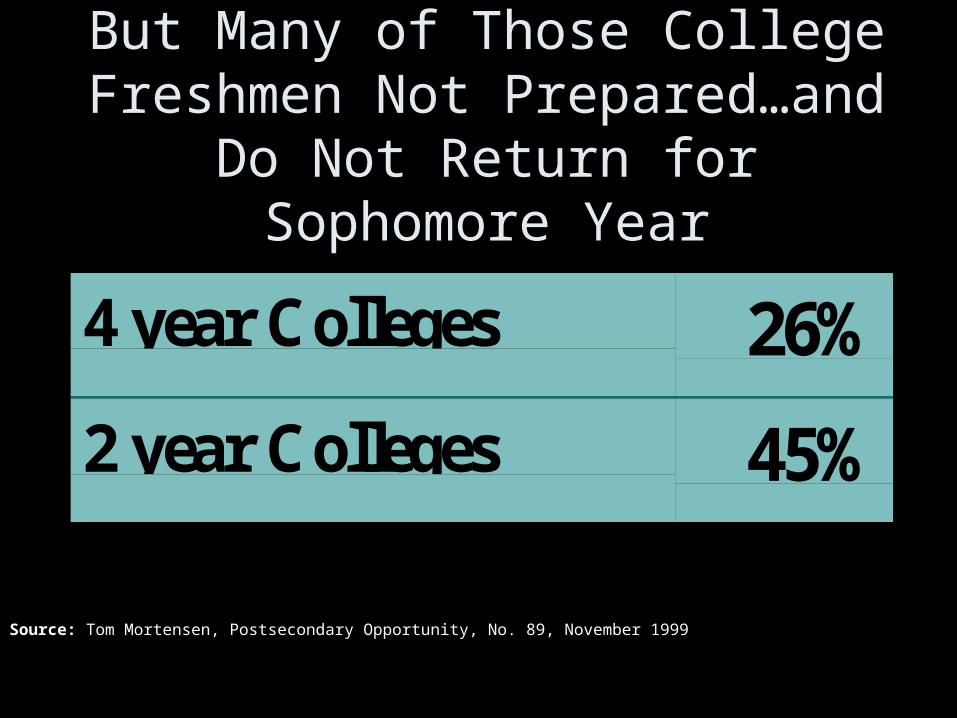
But Many of Those College Freshmen Not Prepared…and Do Not Return for Sophomore Year
4 year Colleges 26%
2 year Colleges 45%
Source: Tom Mortensen, Postsecondary Opportunity, No. 89, November 1999

Why? At Least In Part Because Their Teachers Had Other Ideas
About Their Plans51
28
0
10
20
30
40
50
60
TeachersExpectations ofTheir Students
2 or 4 yr collegework

To break through these old attitudes, cannot equivocate.
ALL students must graduate from high school ready for
postsecondary education.
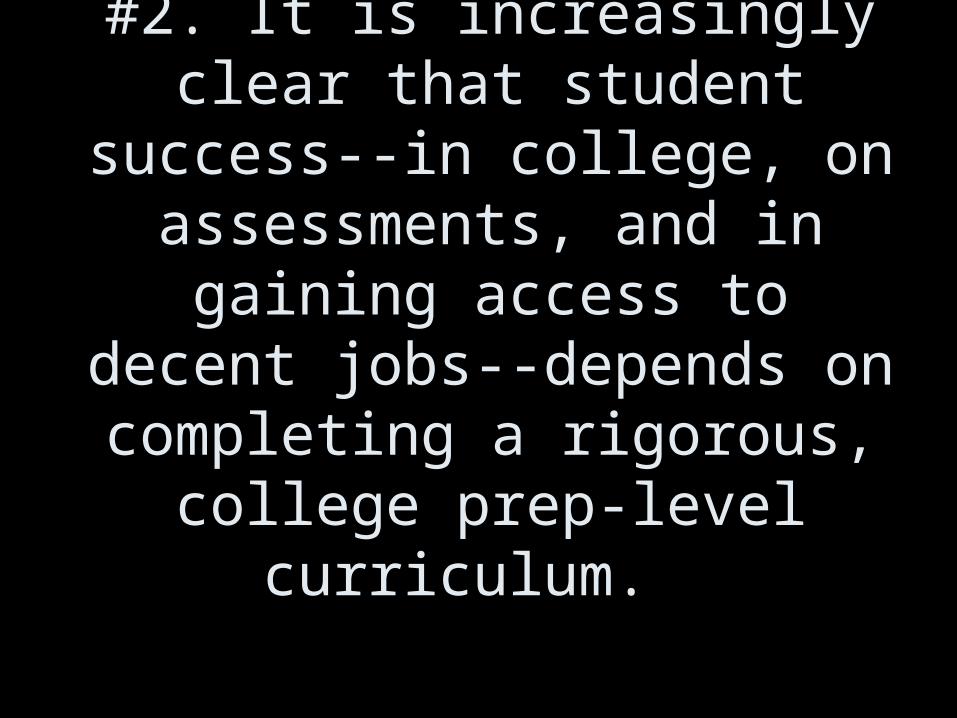
#2. It is increasingly clear that student success--in college, on
assessments, and in gaining access to decent jobs--
depends on completing a rigorous, college prep-level
curriculum.

Transcript Study: single biggest
predictor of college success is
QUALITY AND INTENSITY OF
HIGH SCHOOL CURRICULUM
Cliff Adelman, Answers in the Tool Box, U.S. Department of Education.

But college prep curriculum has benefits far beyond
college.

Students of all sorts will learn more...
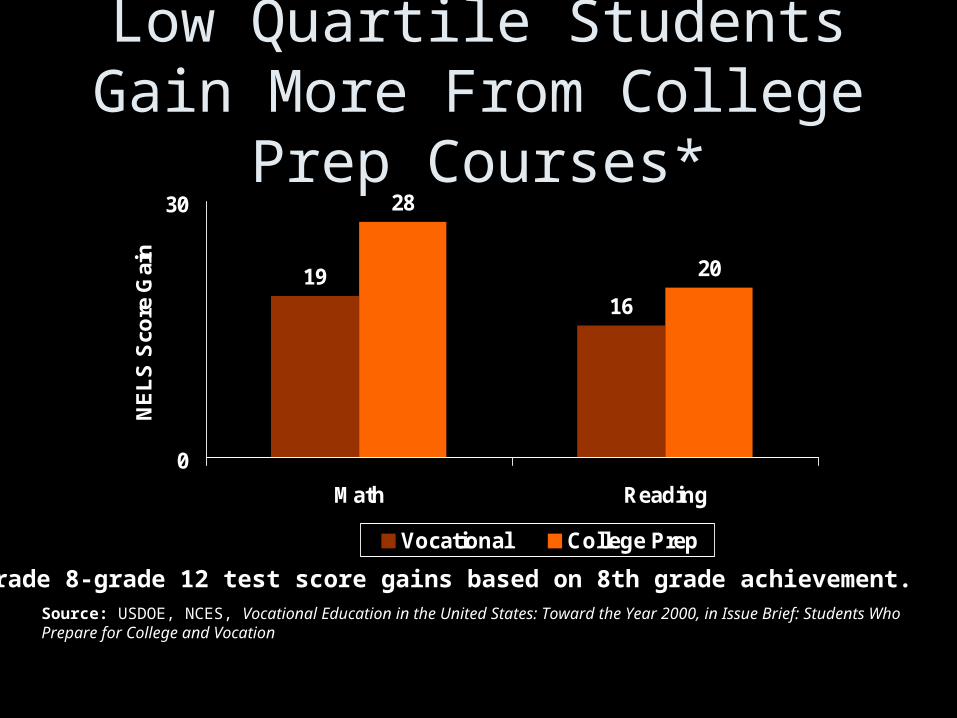
Source: USDOE, NCES, Vocational Education in the United States: Toward the Year 2000, in Issue Brief: Students Who Prepare for College and Vocation
*Grade 8-grade 12 test score gains based on 8th grade achievement.
Low Quartile Students Gain More From College Prep
Courses*
1916
28
20
0
30
Math Reading
NE
LS
Sco
re G
ain
Vocational College Prep

MATH ACHIEVEMENT LEVELS BY GRADE 8 PERFORMANCE
0
20
40
60
80
100
In Very Basic
Course
In Regular
Course
In advanced
Course
Low
Medium
High
Source: Maureen Hallinan, “Ability Grouping and Student Learning,” May, 2002

They will also fail less often...

Challenging Curriculum Results in Lower Failure Rates, Even for Lowest Achievers
16
23
47
31
0
50
Quartile I (Lowest) Quartile 2
Per
cen
t E
arn
ing
"D
" o
r "F
"
College Prep Low Level
Source: SREB, “Middle Grades to High School: Mending a Weak Link”. Unpublished Draft, 2002.
Ninth-grade English performance, by high/low level course, and eighth-grade reading achievement quartiles

And they’ll be better prepared for the workplace.

Requirements forTool and Die Makers
• Four or five years of apprenticeship and/or postsecondary training;
• Algebra, geometry, trigonometry and statistics;
• Average earnings: $40,000 per year.

Requirements forSheet Metal Workers
• Four or five years of apprenticeship;
• Algebra, geometry, trigonometry and technical reading;

Time for a Default Curriculum?
Texas
Indiana

#3. Shouldn’t we stop leaving teachers on their own to
decide what and how to teach in “college prep” courses?

Students can do no better than
the assignments they are given...

Grade 10 Writing Assignment
A frequent theme in literature is the conflict between the individual and society. From literature you have read, select a character who struggled with society. In a well-developed essay, identify the character and explain why this character’s conflict with society is important.
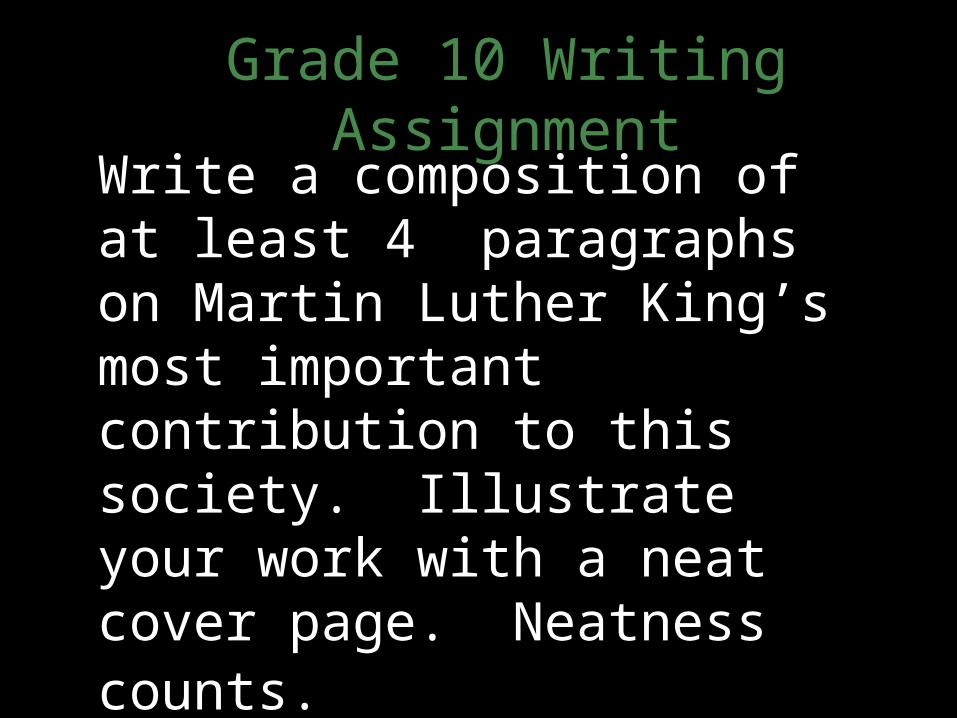
Grade 10 Writing AssignmentWrite a composition of at least 4 paragraphs on Martin Luther King’s most important contribution to this society. Illustrate your work with a neat cover page. Neatness counts.

High Performing Schools and Districts
• Have clear and specific goals for what students should learn in every grade, including the order in which they should learn it;
• Provide teachers with common curriculum, assignments;
• Assess students every 4-8 weeks to measure progress;
• ACT immediately on the results of those assessments.

#4. How can we provide extra instruction for students who
arrive behind?

When Kids Are Behind, Schools Must Provide More Instruction
and Support:• Kentucky provides extra time for struggling
students in high-poverty schools• Maryland offers extra dollars for 7th and 8th
graders who need more support• Massachusetts and Ohio provide extra tutoring,
instruction for students not perform

Most of us think of semester- or year-long
increments to teach kids what they need to learn,
but...

The Full Year Calendar

Less Summer Vacation

Less Weekends, Holidays, & Summer Vacation

Less Professional Development Days & Early Dismissal/Parent Conferences

Less Class Picnic, Class Trip, Thanksgiving Feast, Christmas, Kwanzaa, Hannukkah, Awards, Assembles, & Concerts

Less State and District Testing

Bottom Line:
Roughly 13-15 Eight-Hour Days
Per Subject Per Year

#5. How Can We Organize Schools in Pursuit of Different
Outcomes

It’s easy to fall into a pattern of blaming poor results on problems
“beyond our control.” For example, high 9th grade failure
rates generally blamed on poor preparation, difficult transitions.
But…

One Colorado High School: Student/Teacher Ratio by Grade
Grade 9th 10th 11th 12th
Average number of students per teacher
30.3 16.7 11.6 12.1
Source: Jovenes Unidos & Padres Unidos; March, 2004.
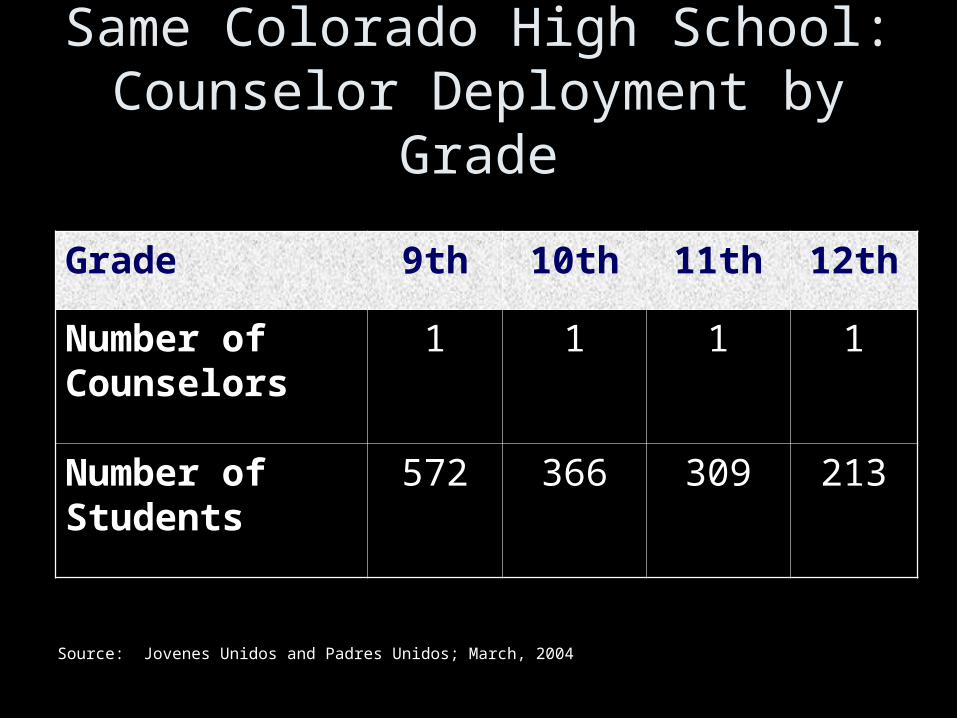
Same Colorado High School:Counselor Deployment by Grade
Grade 9th 10th 11th 12th
Number of Counselors
1 1 1 1
Number of Students
572 366 309 213
Source: Jovenes Unidos and Padres Unidos; March, 2004

Likewise, large achievement gaps at exit…typically blamed on large achievement gaps at entry.
But…

Poor kids and kids of color get less than their fair share of
experienced and well educated teachers.

Classes in High Poverty High Schools More Often Taught by Misassigned*
Teachers
28%
14%19%
16%
40%
20%
31%
18%
0%
50%
Math Science English Social Studies
less than 20% Free Lunch greater than 49% Free Lunch
*Teachers who lack a major or minor in the fieldSource: National Commission on Teaching and America’s Future, What Matters Most: Teaching for America’s Future (p.16) 1996.

Math and Science Classes of Mostly Minority Students Are More Often Taught
by Misassigned Teachers
54%
86%
42%
69%
0%
100%
90-100% Non-White 90-100% White
Certified in Field BA or BS in Field
Source: Jeannie Oakes. Multiplying Inequalities: The Effects of Race, Social Class, and Tracking on Opportunities to Learn Mathematics and Science (Rand: 1990)
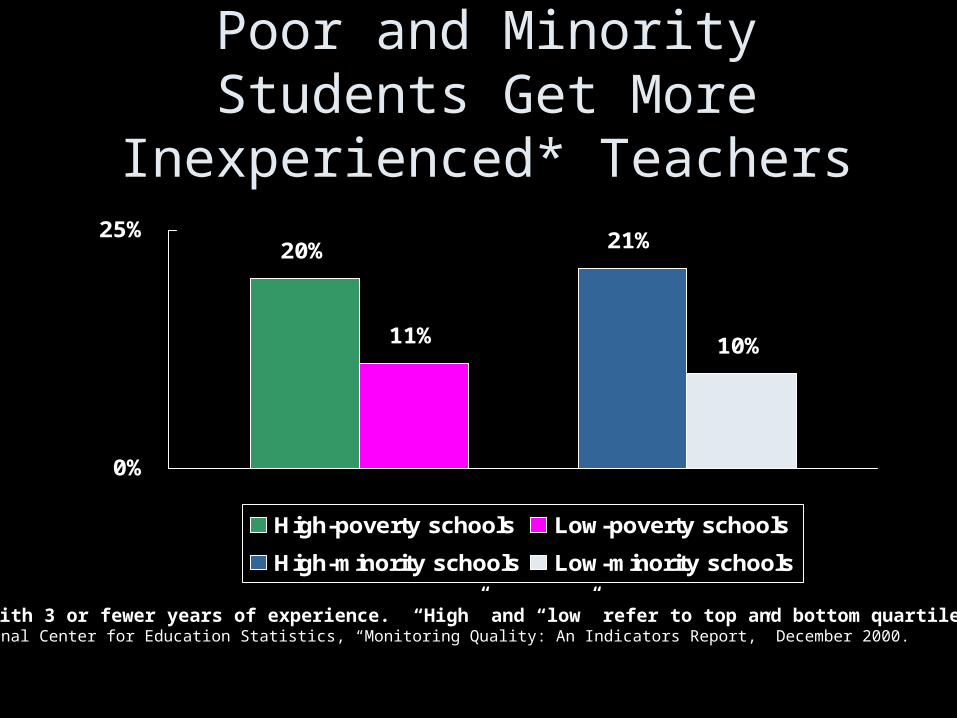
Poor and Minority Students Get More Inexperienced* Teachers
20%
11%
21%
10%
0%
25%
High-poverty schools Low-poverty schools
High-minority schools Low-minority schools
*Teachers with 3 or fewer years of experience. “High” and “low” refer to top and bottom quartiles.Source: National Center for Education Statistics, “Monitoring Quality: An Indicators Report,” December 2000.

Even Within Schools, Often Big Differences

One PA High School
• Joint analysis conducted by teachers and Ed Trust staff showed how best educated and most experienced teachers were teaching high end students, with mostly brand new and undereducated teachers teaching struggling students.
• Moreover, school created master schedule that made that imbalance even worse.

PA HS Master Schedule: Regular Team Sample

PA HS Master Schedule: Pre-IB Team Sample

PA HS Master Schedule: 11-12 IB/AP Teacher Sample

In other words, the choices we make either exacerbate—or
ameliorate—achievement gaps.

The Education Trust
Download this Presentation At
www.edtrust.org
Washington, DC: 202-293-1217
Oakland, CA: 510-465-6444